Journal of Graph Algorithms and Applications http://jgaa.info/ vol. 11, no. 1, pp. 277–307 (2007) Specific Selection of FFT Amplitudes from Audio Sports and News Broadcasting for Classification Purposes Marios Poulos George Bokos Nikolaos Kanellopoulos Sozon Papavlasopoulos Department of Archives and Library Sciences Ionian University http://www.ionio.gr/ [email protected] [email protected] [email protected] [email protected] Markos Avlonitis Department of Informatics Ionian University http://www.ionio.gr/ [email protected] Abstract In this paper we investigate the problem of classification between sports and news broadcasting. We detect and classify files that consist of speech and music or background noise (news broadcasting), and speech and a noisy background (sports broadcasting). More specifically, this study investigates feature extraction and training and classification proce- dures. We compare the Average Magnitude Difference Function (AMDF) method, which we consider more robust to background noise, with a novel proposed method. This method uses several spectral audio features which may be considered as specific semantic information. We base the extrac- tion of these features on the theory of computational geometry using an Onion Algorithm (OA). We tested the classification procedure as well as the learning ability of the two methods using a Learning Vector Quantizer One (LVQ1) neural network. The results of the experiment showed that the OA method has a faster learning procedure, which we characterise as an accurate feature extraction method for several audio cases. Article Type Communicated by Submitted Revised Regular paper G. Liotta December 2006 May 2007

Welcome message from author
This document is posted to help you gain knowledge. Please leave a comment to let me know what you think about it! Share it to your friends and learn new things together.
Transcript
Journal of Graph Algorithms and Applicationshttp://jgaa.info/ vol. 11, no. 1, pp. 277–307 (2007)
Specific Selection of FFT Amplitudes from
Audio Sports and News Broadcasting for
Classification Purposes
Marios Poulos George Bokos
Nikolaos Kanellopoulos Sozon Papavlasopoulos
Department of Archives and Library SciencesIonian University
http://www.ionio.gr/[email protected] [email protected] [email protected] [email protected]
Markos Avlonitis
Department of InformaticsIonian University
http://www.ionio.gr/[email protected]
Abstract
In this paper we investigate the problem of classification betweensports and news broadcasting. We detect and classify files that consist ofspeech and music or background noise (news broadcasting), and speechand a noisy background (sports broadcasting). More specifically, thisstudy investigates feature extraction and training and classification proce-dures. We compare the Average Magnitude Difference Function (AMDF)method, which we consider more robust to background noise, with a novelproposed method. This method uses several spectral audio features whichmay be considered as specific semantic information. We base the extrac-tion of these features on the theory of computational geometry using anOnion Algorithm (OA). We tested the classification procedure as well asthe learning ability of the two methods using a Learning Vector QuantizerOne (LVQ1) neural network. The results of the experiment showed thatthe OA method has a faster learning procedure, which we characterise asan accurate feature extraction method for several audio cases.
Article Type Communicated by Submitted Revised
Regular paper G. Liotta December 2006 May 2007

M. Poulos et al., Broadcasting classification, JGAA, 11(1) 277–307 (2007) 278
1 Introduction
1.1 Specific Objectives
This study investigates the problem of classifying two different files with highlysimilar audio overlapping regions, these being a sports broadcast and a newsbroadcast. The classification problem focuses on the development of a numberof features extracted in order to bring out the differences of these two examples,and simultaneously to downgrade the similarity of the audio features. We in-troduced a new method to do this which is based on an onion algorithm (OA)of computational geometry; this reduces the number of fast Fourier transform(FFT) amplitudes of an audio signal, holding the smallest layer, which, accord-ing to latest studies [5, 24, 23, 22, 29, 27, 26, 25], encloses a dominant partof the semantic information of the signal. Thus, the objective of this studyis to verify the above claim with a well-conducted experiment corroboratingthis technique. To implement this experiment we selected the best feature ex-traction, which is used for the same classification purposes [35] as the AverageMagnitude Difference Function (AMDF) method, and we compared this withthe proposed algorithm using as an unbiased criterion the well-fitted artificialLearning Vector Quantize (LVQ) neural network.
1.2 General Background
Video is a rich source of information, with visual, audio, and textual content.Many applications, such as information indexing and retrieval in multimediadatabases, video editing, and so forth, require video scene analysis and clas-sification. Research in this area in the past several years has focused on theuse of speech and image information [34, 16, 17, 33, 32]. A large number ofuseful features, based on video and audio, have been proposed for video clas-sification. Specifically, the foundation of any type of audio analysis algorithmis the extraction of numerical feature vectors that characterise the audio con-tent. Until now, feature extraction has been based on a variety of feature sets.These are Time Domain features, such as ZeroCrossings, Root-Mean-SquaredEnergy (RMS) and Ramp Time, the Spectral Domain features Centroid, Rolloff,and Flux, Mel-Frequency Cepstral Coefficients (MFCC), and linear PredictiveCoefficients (LPC). More details about the definitions of these features can befound in Hauptmann and Witbrock (1997) and Tzanetakis and Cook (2002)[8, 36]. The latest studies performed the pitch calculation using the AMDFmethod [10], which proved to be more robust to background noise and musicin comparison with the above methods. In addition, according to Tzanetakisand Chen’s (2004) recent findings [35], the MFCC and LPC features did notperform as well as the pitch calculation using the AMDF method, probably be-cause these features are designed for speech modelling and recognition and don’twork as well for modelling more general audio textures [35]. The Problems: In

M. Poulos et al., Broadcasting classification, JGAA, 11(1) 277–307 (2007) 279
this study we investigated the classification problem of two multimedia types ofaudio broadcasting programs. These were recordings of football and basketballmatches and an audio news broadcasting file. The proposed algorithm attemptsto improve the feature extraction technique in a novel way in order to elimi-nate the classification problems that are present in the literature. To implementthis, we studied the problems as sourced from the calculation of the coefficients,which we extracted using the AMDF method, the most robust of the featureextraction techniques. In the literature these problems are the overlapping ofsimilar backgrounds sounds, the criterion of the audio signal segmentation, andthe criterion of the estimation of the interval frame which is needed for pitchcalculation. More details of these problems are presented below.
1.3 The Problems
In this study we investigated the classification problem of two multimedia typesof audio broadcasting programs. These were recordings of football and bas-ketball matches and an audio news broadcasting file. The proposed algorithmattempts to improve the feature extraction technique in a novel way in orderto eliminate the classification problems that are present in the literature. Toimplement this, we studied the problems as sourced from the calculation ofthe coefficients, which we extracted using the AMDF method, the most robustof the feature extraction techniques. In the literature these problems are theoverlapping of similar backgrounds sounds, the criterion of the audio signalsegmentation, and the criterion of the estimation of the interval frame whichis needed for pitch calculation. More details of these problems are presentedbelow.
1.4 The Problem of Overlapping Background Sounds
Sound recordists know that the audio in a sport-broadcasting video is differentfrom that in a news report. However, the main problem becomes focused whenthe two categories (sport audio and news audio) overlap heavily in the sameregion, such as when the background sounds are similar. This can be due toincorrect or noisy training labels. These problems of the inconsistency and in-completeness of human annotations are so prevalent that any video classificationsystems must cope with them [35]. It will be difficult for discriminative clas-sifiers to make these distinctions, because there is no clear, decisive boundaryseparating the two sets of data. A solution to the above problems is select-ing a suitable length for each shot, in particular by obtaining the decision forthe whole shot by the majority of classified windows within it and using thepercentage of this majority of windows as a confidence measure for classifica-tion. This approach has the advantage of dealing elegantly with the problem ofshots that contain two different audio textures [6], which, although uncommon,occurs sometimes in the data. On the other hand, this solution increases thecomplexity dramatically, which is quite ineffective for Moving Picture ExpertsGroup Seven (MPEG7) [1].
M. Poulos et al., Broadcasting classification, JGAA, 11(1) 277–307 (2007) 280
1.5 The Problem of Audio Time Segmentation
The foundation of any type of audio analysis algorithm which is based on theextraction of numerical features needs the determination of the audio time seg-mentation. However, all the techniques (including the AMDF) of audio featuresextraction based on the variable duration shot [35, 16, 3] usually range betweenone and six seconds. The determination of this time segmentation and its partic-ular sub-segmentation are highly significant, as they take place using a specificoverlapping window called an interval frame.
1.6 The Estimation of the Interval Frame
The other problem, which derives from the previous procedure, is the determi-nation of the interval frame. This problem depends on the voice’s features . Forexample, a speaking voice requires a variable interval frame ranging between2.3 ms and 15.9 ms. However, in the non-speech intervals within speech, orbreathing pauses, we need a variable segmentation ranging between 100-300 ms[20, 31]. In our example, this problem is serious for the existing methods, asthe dominant feature of the classification is most often the background activ-ity, which is a non-speech signal. Thus, we selected an interval time for theAMDF coefficients greater than 50 ms in order to include all the examples inour experiment (see section 3.1).
1.7 The Proposed Method
The primary idea is to extract an audio feature that attempts to avoid noiseeffects by not using the vulnerable parts of speech spectra and without losingimportant discriminative information. This approach differs from noise removalmethods, such as the AMDF, because it does not require an estimate of thenoise and does not assume a stationary or slowly changing noise. The solutionto this problem is the reduction of the spectral resolution of the original FFTamplitudes using the OA, according to our latest studies [26, 25]. The basis ofthe method depicts the centre of the multi-layers of a set of arithmetic pointson the Cartesian plane that represent the values of the application used. Forexample, in the case of fingerprint verification [26], these values represent thevalues of the FFT amplitudes, which are produced by the pixels’ values. Inour example, these values represent the FFT amplitudes of the original audiosignal. Similarly, this algorithm can be applied in a text categorization pro-cedure [25]. In this technique, however, we replaced the FFT method with anumerical conversion of the text characters, thus testing the proposed methodfor the first time in the audio signals area in order to ascertain its ability toclassify the two different audio categories. Finally, the present work focuses inprinciple on sports broadcasting as opposed to audio news broadcasts and aimsto establish a one-to-one correspondence between the specific information andcertain appropriate features of each audio signal category. A neural networkclassifier, Learning Vector Quantizer (LVQ), is employed to classify unknown

M. Poulos et al., Broadcasting classification, JGAA, 11(1) 277–307 (2007) 281
features of each example from the AMDF method in comparison with the OAmethod in order to show the OA method’s classification superiority over theclassic AMDF-one Neural network-based classification, which has received con-siderable attention recently in a wide variety of research fields and experimentalsetups. The specific type of neural network employed here, namely the LVQ,offers the advantage of classifying input vectors of high dimensionality, which isdesirable for our tests. A more detailed description of its architecture and op-eration is provided in Section 2.3. Spectral values obtained from both methods(OA and AMDF) are used as features to form the input vectors. Furthermore,we test the validation of the feature vector of each method in the training pro-cedure by investigating the training error of convergence of each. This approachis called the hold out method [30].
2 Method
2.1 Overview
The present study is divided into a feature extraction stage and a training andclassification stage. In the feature extraction stage, the OA method is based ona novel statistical estimation in which the smallest layer of an onion convex poly-gon encloses the geometric median value of a feature vector [10]. Furthermore,this statistical approximation has been verified empirically in several patternrecognition problems [24, 23, 22, 29, 27, 26, 25]. In our example, the featurevector is composed by the FFT amplitudes of a particular shot of audio file ofeither sport or news video. Specifically, we will use the Matlab function fft(x)to do a Fourier Analysis of the data. This is the discrete Fourier transform(DFT) of vector x, computed with an FFT algorithm. If X is a matrix, fft(x)is the FFT of each column of the matrix. In Matlab, all variables are matrices;vectors are simply row or column matrices. The fft function employs a radix-2Fourier transform if the length of the sequence is a power of two, and a slowermixed-radix algorithm if it is not. The function implements the transformationgiven by the following equation (1):
X(k + 1) =N−1∑
n=0
x(n + 1)e−ik 2πn
N (1)
where N = length(x). Note that the series is written in an unorthodox way,running over n + 1 and k + 1 instead of the usual n and k, because Matlabvectors run from 1 to N instead of from 0 to N − 1.
In our example, in the Cartesian plane (see Figure 1) the absolute values ofX are in the y axis and in the x axis are the order of each element of matrix X.Thus, we constructed a vector matrix S of size (N × 1)

M. Poulos et al., Broadcasting classification, JGAA, 11(1) 277–307 (2007) 282
S =
|X1|.
.
.
|XN |
The OA method is described as follows:1. We put the elements of the S vector in the Cartesian plane according to
f(N, |XN |) function. For example see Figure 2.2. We determine the finite set of points S = S0. Let S1 be the set
S0\∂H(S0) : S minus all the points on the boundary of the hull of S. (seefigure 3)
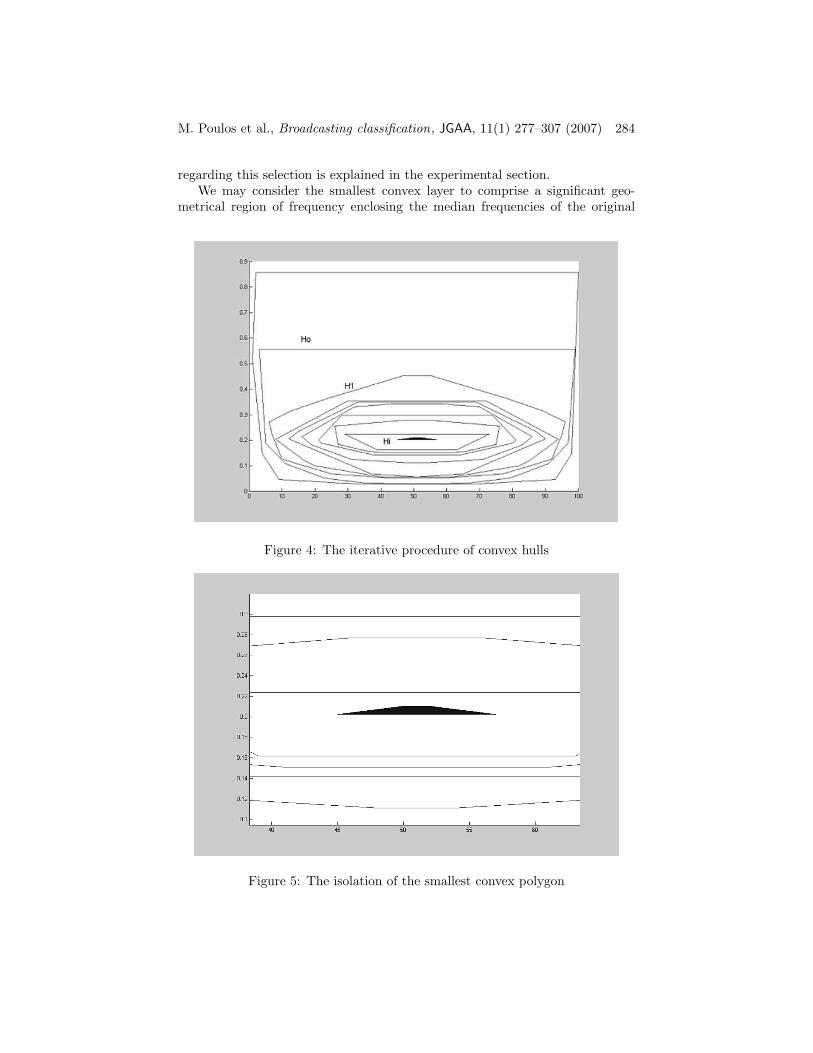
3. The process continues until reaching a set with three points or less.Similarly, define Si+1 = Si\∂H(Si) . The hulls Hi = ∂H(Si) are called thelayers of the set and the process of peeling away the layers is called onionpeeling [19, 7]. (see figure 4)
This position may be determined by using a combination of computationalgeometry algorithms, which is known as Onion Peeling Algorithms [4], withoverall complexity O(d · n log n) times, where d is the depth of the smallestconvex layer and n is the number of characters in the numerical representation(in accordance with section 2.1).
Thus, the smallest convex layer Si of the original set S of vector carries spe-cific information. In particular, vector Si may be characterized as a common
Figure 1: The placement of vector S in Cartesian plane.

M. Poulos et al., Broadcasting classification, JGAA, 11(1) 277–307 (2007) 283
geometrical area of all the elements of vector S. In our example, this consider-ation is valuable because this subset may be characterized as representing thesignificant semantics of the selected audio signal (see figure 5). The decision
Figure 2: The placement of coordinates f(N, |XN |).
Figure 3: The external hull S0
M. Poulos et al., Broadcasting classification, JGAA, 11(1) 277–307 (2007) 284
regarding this selection is explained in the experimental section.We may consider the smallest convex layer to comprise a significant geo-
metrical region of frequency enclosing the median frequencies of the original
Figure 4: The iterative procedure of convex hulls
Figure 5: The isolation of the smallest convex polygon

M. Poulos et al., Broadcasting classification, JGAA, 11(1) 277–307 (2007) 285
audio shot file. The advantage of this method over the AMDF method is thatthe problems of length selection (shot and pitch period) are eliminated, as thismethod avoids the problem of specific frequency segmentation and creates coef-ficients from the original FFT amplitudes. These, in turn, have the additionaladvantage of being appropriate for application to an inverse Fourier transformin order to a particular signal from the original audio file to be retrieved. Themain advantage of the proposed algorithm is that it is possible to be used in areal time scenario. For the justification of this claim we constructed a scenario,which is presented in Section 6. Furthermore, we processed the same shots ofaudio sport or news files by the AMDF method. These extracted features co-efficients consist of the AMDF features vector, which is to be used in the nextstage. The training and classification procedure was determined taking intoaccount the following criteria:
1. The selection of the appropriate neural network, which is best fitted for theclassification procedure of the above examples (OA, AMDF). The justificationof this selection is presented in section 2.3.
2. The selection of the optimum size of the feature vector for the well-functionality which is used in the selected neural network. More details arepresented in sections 2.2.2 and 3.2.
3. The selection of the suitable number of feature vectors needed for trainingand testing procedures for the selected neural network in order to yield accurateresults. The selection took place using bibliographic research. More details ofthis selection are presented in section 3.3
4. The determination of the training group of feature vectors per categorythat yielded the minimum error training convergence. More details of this arepresented in section 3.3.
Thus, an equal number of feature vectors from both of the OA and AMDFmethods respectively are trained using an independent LVQ1 neural network.The LVQ1 neural network is adopted according to the bibliographic research[15]. Specifically, in the comparison among the SVM , K-NN classifier and LVQneural network showed that LVQ is more sensitive to the feature audio (speechdata) data than the any other classifiers in the test. Furthermore LVQ yieldssatisfactory results for well discriminating features [15].
The remaining feature vectors of both examples are submitted to the testingprocedure. The justification of this selection centres on the ability of this neuralnetwork to classify the above features better than other neural networks, becausean LVQ1 codebook contains highly structured lattice points that effectivelyspan the signal space [18]. Furthermore, we tested the learning ability of thetwo categories in a statistical learning error convergence procedure which weexplain in the experimental section.
2.2 Feature Extraction Using the OA and AMFD Meth-
ods
In this stage we isolated the original audio of a sport video file in Mpeg-2 formatusing a suitable multiplexes program. Thereinafter, we segmented the audio
M. Poulos et al., Broadcasting classification, JGAA, 11(1) 277–307 (2007) 286
signal into shots and extracted the features in two feature vector categories:AMDF and OA. At this point, it must be noted that the configuration of thespecific segmentation of all the audio files took place in order for the AMDFprocessing to yield the maximum classification results according to the reportsin the literature. Thus, we used the same settings in the OA algorithm in orderto carry out an honest comparison between our method and the most robustAMDF method. In this setting, we therefore determined the particular shots,which are ranged between one to six seconds, for the calculation of the AMDFcoefficients. This selection was calculated taking into account two parameters.The features extraction should not exceed the number of 20 coefficients (seesection 3.2), and the interval frame must be range between 50-300 ms (seeintroduction part). Thus, we obtained AMDF coefficients, which were extractedfrom 20 ·50 ms = 1000 ms = 1 sec, 20 ·100 ms = 2000 ms = 2 sec, 20 ·150 ms =3000 ms = 3 sec, 20 ·200 ms = 4000 ms = 4 sec, 20 ·250 = 5000 ms = 5 sec and20·300 = 6000 ms = 6 sec shot duration segments. Moreover, this segmentationcame into agreement with the literature [24, 35, 17].
2.2.1 AMDF Feature Vector
The AMDF method is based on the following property: Suppose that a digitalspeech signal x(n) is periodic with period T . Then the difference between twosamples is determined as:
Diff(m) = x(n) − x(n + m)
Thus, the difference signal Diff(m), is calculated by delaying the input speechvarious amounts, subtracting the delayed waveform from the original, and sum-ming the magnitude of the differences between sample values, using the followingequation (3):
AMDF (m) =1
t
t−1∑
n=0
|x(n) − x(n + m)| (2)
0 ≤ m ≤ t − 1
Where n is the sequence number of the speech wave and t is the samplenumber. For reasons of brevity the m elements which are extracted accordingto Equation 2 are named AMDF coefficients or AMDF feature vector.
2.2.2 OA Feature Vector
The OA feature vector is extracted in the following steps. First, the spectraldensity is calculated from the original audio signal x(n) (N samples) via theFourier transform as described previously in Equation 1. Next, the absoluteFFT amplitudes (dBV) of values are put on the Cartesian plane and submittedto the onion peeling procedure. The idea is to use the convex hull [7] subroutine

M. Poulos et al., Broadcasting classification, JGAA, 11(1) 277–307 (2007) 287
recursively to extract the outmost convex hull (H1) of the given points and toapply the same subroutine to extract the convex hull of the remaining innerpoints (H2), and so forth. The program stops when the innermost convex hullcontains no more than three points. The sequence of nested convex hulls iscalled the onion-peeling of a given set of points. This structure can be obtainedin O(H1)+O(H2)+...+O(Hr) times by using the convex hull subroutine, whereH1, H2, Hr denotes the elements of each convex layer of the onion peeling:
H1 = (|f11| , |f12| , ..., |f1x|), ...,Hr = (|fr1| , |fr2| , ..., |frw|) (3)
and where H1 is the external layer and Hr is the internal or smallest layer.Thus, the
∣
∣
∣
−→fm
∣
∣
∣
values are re-arranged in a new vector H of dimensionality (1 × m)
H = [H1, ...,Hr] = [|f11| , |f12| , ..., |f1x| , ..., |f2u| , ..., |fr1| , |fr2| , ..., |frw|] (4)
It must be noted that each layer may be of a different size, which justifiesthe computation of layer size (convex polygon) being unpredictable and beingimplemented in a non-linear manner. Finally, the feature vector is selected fromthe t last absolute amplitudes t of vector H which are found in the region of thesmallest layer Hr. The value t, for both cases, is determined in the experimentalpart (3.2).
2.3 The Feature of the Proposed Neural Network
In our work we selected and employed a neural network called LVQ1, which wasproposed by Kohonen [9] as a supervised extension of the more general familyof unsupervised classifiers named Self-Organizing Maps (SOMs). The trainingof LVQ1 is a two-step procedure. In the first step, initial positions of the classrepresentatives (or codebook vectors) are determined in the r-dimensional spaceusing standard clustering algorithms such as the k-Means clustering algorithmor the Linde-Buzo-Gray (LBG) algorithm, with a given number of classes. In thesecond step, class representative positions are iteratively updated to minimisethe total classification error of the training set of vectors. To this end, codebookvectors are directed towards the data vectors of the same class and distancedfrom the data vectors of different classes. A Euclidean distance measure is usedfor calculating distances. More specifically, every time a member of the trainingset, feature vector ti, is incorrectly classified, the two codebook vectors involved,correct rc(i − 1) and incorrect rw(i − 1), are updated as follows:
rc(i) = rc(i − 1) + a(i)[ti − rc(i − 1)],
rw(i) = rw(i − 1) − a(i)[ti − rw(i − 1)].

M. Poulos et al., Broadcasting classification, JGAA, 11(1) 277–307 (2007) 288
The rate of the update, or learning rate, a, controls the speed of convergenceand is a descending function of time for iteration index (i). The class-separatingsurfaces obtained in this way are nearly optimal in the bayesian sense. Differentrules applied when moving (updating) class representatives during the trainingiteration produce different versions of the LVQ1 training algorithm. The versionemployed here, namely LVQ1, is chosen for its properties of quick convergenceand robustness of the class representatives’ positions over extended learningperiods.
In our example, the architecture the LVQ1 network used to classify the OA orAMDF feature vectors is shown in Fig. 6. Input vectors of dimensionality 20×1are weighted and fed to the first layer of neurons, known as the competitive layer(the selection of the dimensionality 20 is explained in the experimental section).These neurons compete for inputs in what we call a greedy way; hence the layername. Four such neurons form the competitive layer in our example. The outputof the competitive layer, which is a grouping of the inputs into subclasses, isfed to the second linear layer, which groups subclasses into target classes. Theweights connecting the two layers take on binary values of zero or one, whichmerely indicate class membership and not actual weighting.
Figure 6: Architecture of the LVQ1 neural network employed for the classifica-tion for OA or AMDF input vectors of dimensionality 20.
3 Experimental Section
3.1 Experimental Data
We evaluated the proposed audio classification and segmentation algorithms byusing our database, which is audio clips from TV programs (CNN, Eurosport) ofnews reports and football and basketball sports broadcasts. Each file contained

M. Poulos et al., Broadcasting classification, JGAA, 11(1) 277–307 (2007) 289
combinations of speech and either music or background noise (in the case ofnews broadcasting), and speech and noisy backgrounds (in the case of sportsbroadcasting). In the news reports clip, the ratio between the amount of purespeech, music, and noisy speech is about 8:1:1. In the sports clip, the ratiobetween the amount of pure speech and noisy speech is about 7:3. In ourexperiments, we set one second as a test unit, as in a similar study [17].
We obtained 70 different clips in each category (sport or news) for a total of140 audio clips, each greater than six seconds long and sampled at 22 KHz. Weused 20 for each category in training the classifier, while using the remaining 100for testing. The 70 audio news clips were recorded from different broadcast TVprograms using a monophonic audio sound configuration system. In additionto these originally selected segments we further selected segments greater thansix seconds which all satisfied the aforementioned audio ratio settings. We thuscreated a database which contained 6×70 = 420 audio clips for each category, ora total of 840 audio clips. In the segmentation procedure we created six specificsegments of one, two, three, four, five and six seconds in segmentation for eachaudio clip, based on bibliographic research [2, 6], in which the length of theaudio clips could vary from one to six seconds. Furthermore, the data collectionneeded for the experimental training and testing stages was compared with asimilar set on which most current research is based [16]. The proposed databaseof 420 audio segments proved to be a sufficient sample for our classificationpurposes in the statistical evaluation, which is presented in section 5.
The music content in this data set is composed mainly of environmentalsound. All data are 22 kHz sample rate, mono channel and 16 bit per sample,from which we selected about 420 seconds (1 sec · 20 + 2 sec · 20 + 3 sec · 20 +4 sec · 20 + 5sec · 20 + 6 sec · 20 = 420 sec) for each category (sport or news),totalling 840 seconds, as training data, and (1 sec · 50 + 2 sec · 50 + 3 sec · 50 +4 sec · 50 + 5 sec · 50 + 6 sec · 50 = 1050 sec) for each category (sport or news),totalling 2100 seconds for testing.
3.2 Feature Vector Extraction
Using the 420 audio clips, the OA (figures 7, 8, and 9) and AMDF featurevectors were extracted from Equations 1, 2, and 3. Specifically, in Figures 7, 8,and 9 we can see the snapshots of the zoom of the OA analysis. In particular, inFigure 9 we can see the specific red area selection, which satisfies the criterionof 20 elements selection around the latest layer.
The value t (see section 2.2.2) is determined according to bibliographic re-search [16, 12, 13, 11], in which the optimal dimension size depends on theexperimental part in combination with the LVQ algorithms. These algorithmstypically operate to preserve neighbourhoods on a network of nodes which en-code the feature vector. In the scientific practice the ideal size of learning featurevector of an artificial neural network it has been determined after experimenta-tion and concretely from the minimization of training error procedure. Thus asize of 24 elements has been showed as an optimal size [13].
Thus, we decided after experimentation that 20 elements is the optimal size

M. Poulos et al., Broadcasting classification, JGAA, 11(1) 277–307 (2007) 290
Table 1: Two examples of the calculation of the OA and AMDF feature vectors.OA feature vector AMDF feature vector9.7306 0.00009.9551 0.067710.0127 0.11209.7790 0.15099.5094 0.181810.2665 0.20909.9895 0.22768.9618 0.23848.9007 0.24248.9036 0.23959.0546 0.22988.7992 0.21629.3747 0.20249.4351 0.19169.0578 0.18419.4087 0.17959.3630 0.17768.9171 0.17829.1252 0.18139.3524 0.1854

M. Poulos et al., Broadcasting classification, JGAA, 11(1) 277–307 (2007) 291
in our example. For better comprehension, we used an audio sports broadcastingsegment of one second, which has 1 · 22000 = 22000 arithmetic samples. Usingthe FFT transform we submitted these values in OA processing and we received20 central absolute values (table 1), which are contained in the region aroundthe latest convex layer, as shown in figure 7.
Figure 7: The visual procedure of the extraction of the Onion Algorithm.
Figure 8: A visual zoom of the construction of the Onion Layer. The smallestonion layer in the centre of the figure is shown.

M. Poulos et al., Broadcasting classification, JGAA, 11(1) 277–307 (2007) 292
3.3 Neural Network Training and Classification Proce-
dure
Another fundamental problem in the construction of the LVQ1 neural networkis the estimation of a certain number of needed feature vectors per categoryin order to be able to estimate the densities accurately enough [11, 14]. Theseprecise calculations require a large number of feature vectors, which, in prac-tice, is not always possible. Nevertheless, pattern recognition algorithms haveproven to be highly useful in this kind of small sample size problem, in whichgeneralisation plays an important role. Much research has been done in thisarea [14, 21]. Considering this, we adopted 20 training feature vectors for eachcategory (sports or news).
The next problem of the classification procedure was the selection of the 20vectors of the original group from the original sample of feature vectors whichwe used for the training procedure, using the impartial hold-out method. Inthis method we tested each case separately (OA and AMDF methods), and allthe combinations of equal numbers of vectors - in our example this numberof training vectors per group was 10 (see above) - are selected as optimumselections from the group, due to yielding the minimum amount of trainingerror quickly. In this way, we ensured that the group of each category gave themost common characteristics. In other words, we created different groups of 20feature vectors for each category (sport and news), and repeated this procedurefor all the vectors, segmented by duration (one, two, three, four, five, and sixseconds). More details of this are presented in section 3.4.
Thus, we trained the two feature vectors (AMDF, OA) after experimenta-
Figure 9: Feature extraction. The red area shows were the absolute FFT am-plitudes were found.
M. Poulos et al., Broadcasting classification, JGAA, 11(1) 277–307 (2007) 293
tion, minimizing the data set to 40 feature vectors (20 for each category), andtaking into account the convergence criterion of error epoch training (Fig.10).These feature vectors were then fed into an LVQ1 classifier [30], first for train-ing in order to be directed towards the feature vectors of the same class anddistanced from those feature vectors of a different class, and then for the actualclassification of unknown input feature vectors.
3.4 Training the LVQ1 using AMDF and OA features
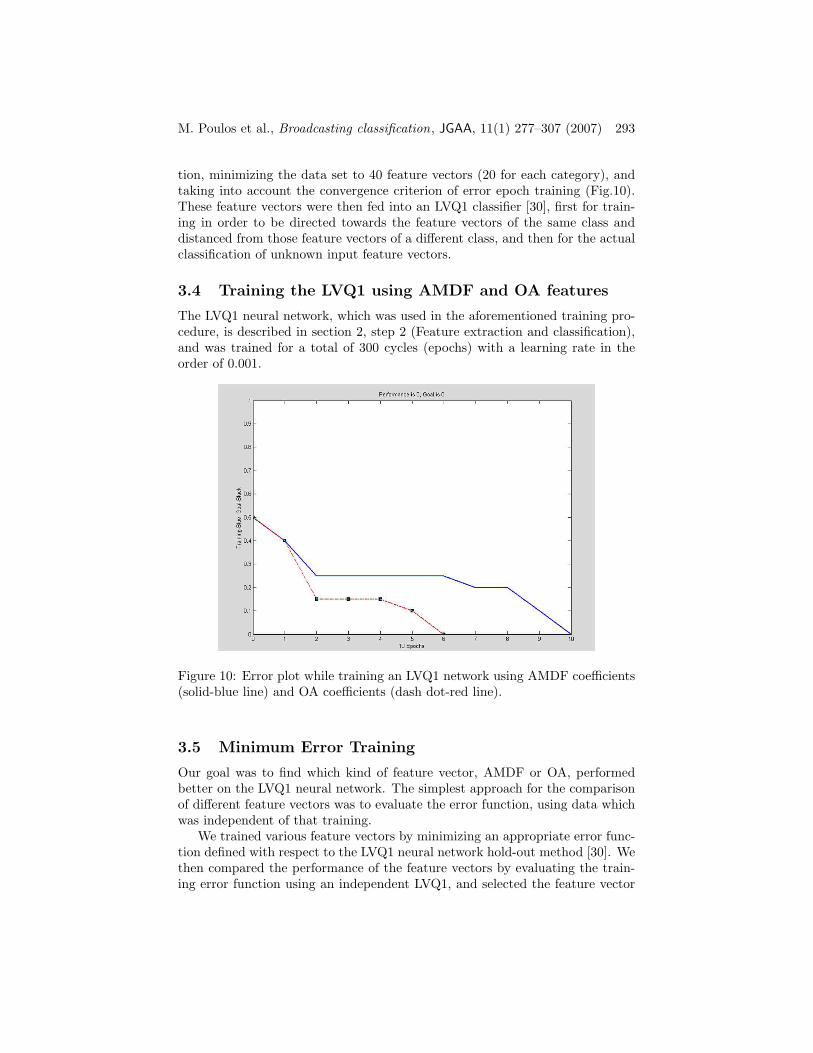
The LVQ1 neural network, which was used in the aforementioned training pro-cedure, is described in section 2, step 2 (Feature extraction and classification),and was trained for a total of 300 cycles (epochs) with a learning rate in theorder of 0.001.
Figure 10: Error plot while training an LVQ1 network using AMDF coefficients(solid-blue line) and OA coefficients (dash dot-red line).
3.5 Minimum Error Training
Our goal was to find which kind of feature vector, AMDF or OA, performedbetter on the LVQ1 neural network. The simplest approach for the comparisonof different feature vectors was to evaluate the error function, using data whichwas independent of that training.
We trained various feature vectors by minimizing an appropriate error func-tion defined with respect to the LVQ1 neural network hold-out method [30]. Wethen compared the performance of the feature vectors by evaluating the train-ing error function using an independent LVQ1, and selected the feature vector

M. Poulos et al., Broadcasting classification, JGAA, 11(1) 277–307 (2007) 294
having the smallest error function with respect to the LVQ1. We implementedthis procedure experimentally in section 5.2.
4 Results
4.1 Classification Results
The classification results for the six tested LVQ1 neural networks are presentedin tables 2, 3.
Table 2: Classification Results of LVQ1 Neural networks in time 1-3 secs.
Time length 1 sec 2sec 3 secFeatureExtractionMethod
Classes Sports News Sports News Sports News
AMDF Sports 42 8 44 6 45 5AMDF News 5 45 6 44 6 44Sensitivity 0,89 0.88 0.88Specificity 0.85 0.88 0.90OA Sports 45 5 47 3 49 1OA News 4 46 2 48 2 48Sensitivity 0.91 0.94 0.96Specificity 0.90 0.94 0.96
Table 3: Classification Results of LVQ1 Neural networks in time 4-6 secs.Time length 4 sec 5 sec 6 secFeatureExtractionMethod
Classes Sports News Sports News Sports News
AMDF Sports 47 3 49 1 50 0AMDF News 4 46 2 48 1 49Sensitivity 0.94 0.96 0.98Specificity 0.94 0.98 1OA Sports 49 1 50 0 50 0OA News 1 49 1 49 0 50Sensitivity 0.98 0.98 1Specificity 0.98 1 1
As can be seen in Table 2, the AMDF method shows a weakness in correctlyclassifying all the cases in the first three seconds duration, while in Table 3,

M. Poulos et al., Broadcasting classification, JGAA, 11(1) 277–307 (2007) 295
in time greater than four seconds duration, the results for both methods aresimilar. This conclusion is reinforced by the interpretation of the extractedindices of sensitivity and specificity, which ranged between 0.85-0.90, while theOA method showed better and more successful results, specifically in that OA’sindices ranged between 0.90-0.96.
According to these results, we concluded that between four and six secondsis the optimal segmentation time for both methods, but that between one andthree seconds the superiority of the OA method compared to the AMDF methodis obvious. More details about the data of table 4 are presented in the statisticalevaluation in section 5.
4.2 Minimum Error Training Results
We tested the classification ability of each feature vector method in the trainingprocedure, and investigated the error training vector set, defined as 40 featurevectors (20 for each category). Twelve (12) different LVQ1 neural networksfrom different vector sets (six (6) per time-duration category) were trained.The vector set was extracted from original audio files of six seconds duration.The classification results of minimum error training are presented in Table 4.
Table 4: Error training convergence in epochs while training an LVQ1 networkusing AMDF and OA feature vectors of 6 sec in length.
OA Method AMDF MethodNumber of convergence epochs Number of convergence epochs6 127 109 145 118 1410 13
5 Statistical Evaluation
The statistical evaluation of the classification results showed that the proposedOA method is more accurate in all cases, especially in the smallest time segments(one, two, and three seconds). In all six tests (sports versus news) we consideredeither the true positive result or the true negative result of an input vector tobe a correct classification result.
For example, as can be seen the AMDF method has a true positive recog-nition score for a one-second time length for the sports group of 42/50, or 84percent, the number of true recognition cases being a=42. The true negativerecognition score for the news group is 45/50 or 90 percent, the number of true

M. Poulos et al., Broadcasting classification, JGAA, 11(1) 277–307 (2007) 296
recognition cases being d=45. In the same table, for a one-second time length,it can be seen that the false positive recognition score for the sports group is8/50 or 16 percent, the number of false recognition cases being b=8, while thefalse negative recognition score for the news group is 5/50 or 10 percent, thenumber of false recognition cases being c=5.
Consequently, we can calculate the sensitivity and specificity values of theresults in table 3, which are statistical indices usually utilised in similar classi-fication problems [28]. For example, for the AMDF method with a time lengthof one second, the values are calculated as follows:
Sensitivity =a
a + c= 0.89
Specificity =d
b + d= 0.85
In the same way, all the correct negative or positive classification scores areshown for both methods, along with the calculated values of sensitivity andspecificity. Furthermore, the superiority of the OA method over the AMDFmethod is evident from the results of the minimum error training procedure.
More specifically, for all LVQ1-trained OA sets of feature vectors, the meanvalue of epochs of training error convergence was approximately seven, with avariance of 2.44, while in the case of AMDF this value was 12, with a varianceof 2.70.
However, for further statistical processing, in order to evaluate the statisticalsignificance of the classification scores we obtained in the experimental section,we applied the chi-square test to the results. We also compared the two featureextraction methods presented in terms of their Cramer coefficient of mean squarecontingency, 1. As we can see, the results are statistically significant at the a =99.5% level of significance, and can be placed into a two-way contingency tablewhich is structured on the basis of two criteria along its two dimensions.
Here we use ‘subject belongs to class i’ as the first criterion (vertical dimen-sion) and ‘subject is classified into class j’ as the second criterion (horizontaldimension). An ideal classification method should produce a diagonal matrixof classification scores (‘subject belongs to class i’ and ‘subject is classified intoclass i’) corresponding to full dependency between the two above criteria, whilepractical methods would tend toward this behaviour.
Evaluation of the statistical significance of the classification results is thustransformed into a hypothesis-testing problem. The null hypothesis of the in-dependence of the two criteria is tested against the alternative hypothesis ofdependence. The test statistic used for this purpose is the χ2. Statisticallysignificant classification results correspond to rejection of the null hypothesis ata satisfactory level of significance.
Let the contingency matrix S be of dimensions (r×c), meaning r rows and c
columns, and let the (i, j)-th entry of S, S(i, j) = fij ; i = 1, . . . , r; j = 1, 2, . . . , c
denote observed frequency of occurrence of the event (i, j) (‘subject belongs to

M. Poulos et al., Broadcasting classification, JGAA, 11(1) 277–307 (2007) 297
class i’ and ‘is classified into class j’) and eij ; i = 1, . . . , r; j = 1, 2, . . . , c denotethe expected frequency of occurrence of the event (i, j). Then the test statisticis given by
χ2 =
r∑
i=1
c∑
j=1
(fij − eij)2
eij
(5)
which asymptotically follows the distribution with (r − 1)(c − 1) degrees offreedom. When unknown, expected frequencies can be estimated from S using
eij =RiCj
N(6)
where N is the total number of events in S, Ri is the sum across the i-throw of S and Cj is the sum across the j-th column of S.
The degree of dependence between the two criteria can also be measured bythe Cramer coefficient [37] of mean square contingency,
φ1 =
√
χ2
N min(r − 1, c − 1)(7)
Coefficient φ1 takes on values between 0 (independence) and 1 (full de-pendence). Two classification methods can be compared as to the statisticalsignificance of their results in terms of their Cramer coefficient. Note that for2 × 2 contingency tables, 7 becomes
φ1 =
√
χ2
N(8)
In our example we tested the results using the above statistical criteria in sixcases (one second to six seconds). In all tests, the results form 2×2 contingencytables are presented on Tables (5-10).
Table 5: Test case, subject sport versus group news classification scores basedon AMDF and OA feature vectors from one-second duration.
ClassesAMDF Method OA MethodSports News Sports News
Sports
4250 = (84%) 8
50 = (16%) 4550 = (90%) 5
50 = (10%)
[23, 5] [26, 5] [24, 5] [25, 5]
News
550 = (10%) 45
50 = (90%) 450 = (8%) 46
50 = (92%)
[23, 5] [26, 5] [24, 5] [25, 5]
M. Poulos et al., Broadcasting classification, JGAA, 11(1) 277–307 (2007) 298
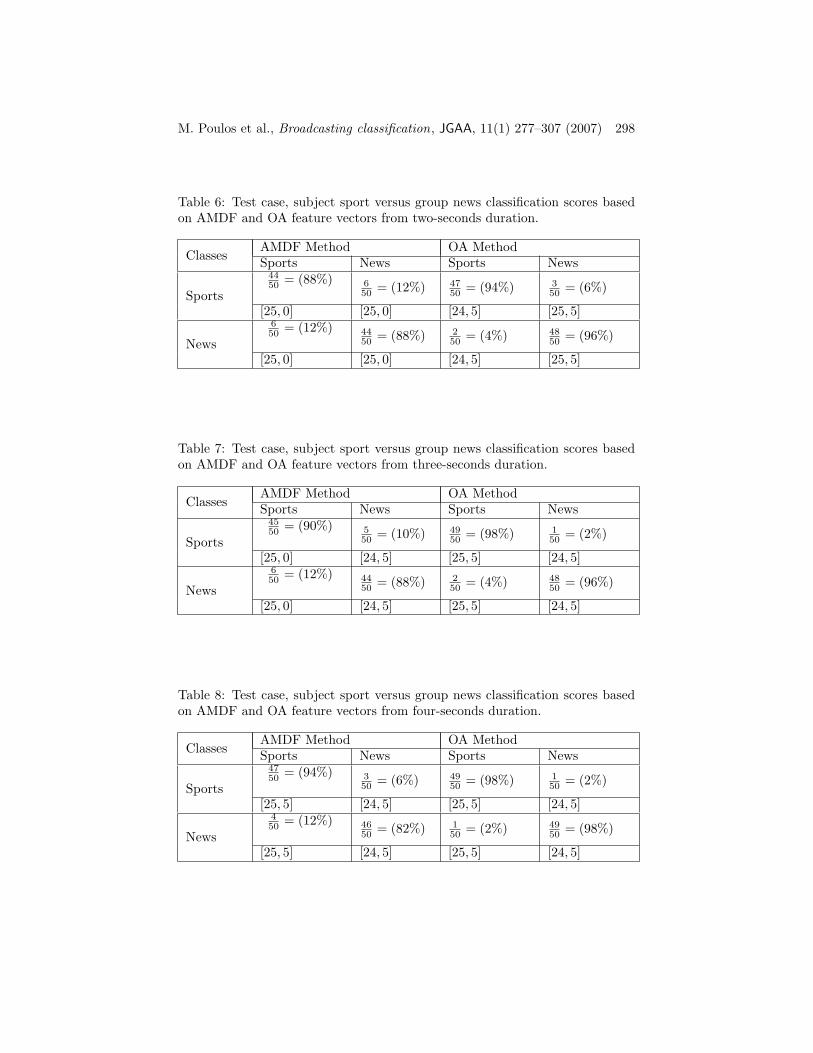
Table 6: Test case, subject sport versus group news classification scores basedon AMDF and OA feature vectors from two-seconds duration.
ClassesAMDF Method OA MethodSports News Sports News
Sports
4450 = (88%) 6
50 = (12%) 4750 = (94%) 3
50 = (6%)
[25, 0] [25, 0] [24, 5] [25, 5]
News
650 = (12%) 44
50 = (88%) 250 = (4%) 48
50 = (96%)
[25, 0] [25, 0] [24, 5] [25, 5]
Table 7: Test case, subject sport versus group news classification scores basedon AMDF and OA feature vectors from three-seconds duration.
ClassesAMDF Method OA MethodSports News Sports News
Sports
4550 = (90%) 5
50 = (10%) 4950 = (98%) 1
50 = (2%)
[25, 0] [24, 5] [25, 5] [24, 5]
News
650 = (12%) 44
50 = (88%) 250 = (4%) 48
50 = (96%)
[25, 0] [24, 5] [25, 5] [24, 5]
Table 8: Test case, subject sport versus group news classification scores basedon AMDF and OA feature vectors from four-seconds duration.
ClassesAMDF Method OA MethodSports News Sports News
Sports
4750 = (94%) 3
50 = (6%) 4950 = (98%) 1
50 = (2%)
[25, 5] [24, 5] [25, 5] [24, 5]
News
450 = (12%) 46
50 = (82%) 150 = (2%) 49
50 = (98%)
[25, 5] [24, 5] [25, 5] [24, 5]
M. Poulos et al., Broadcasting classification, JGAA, 11(1) 277–307 (2007) 299
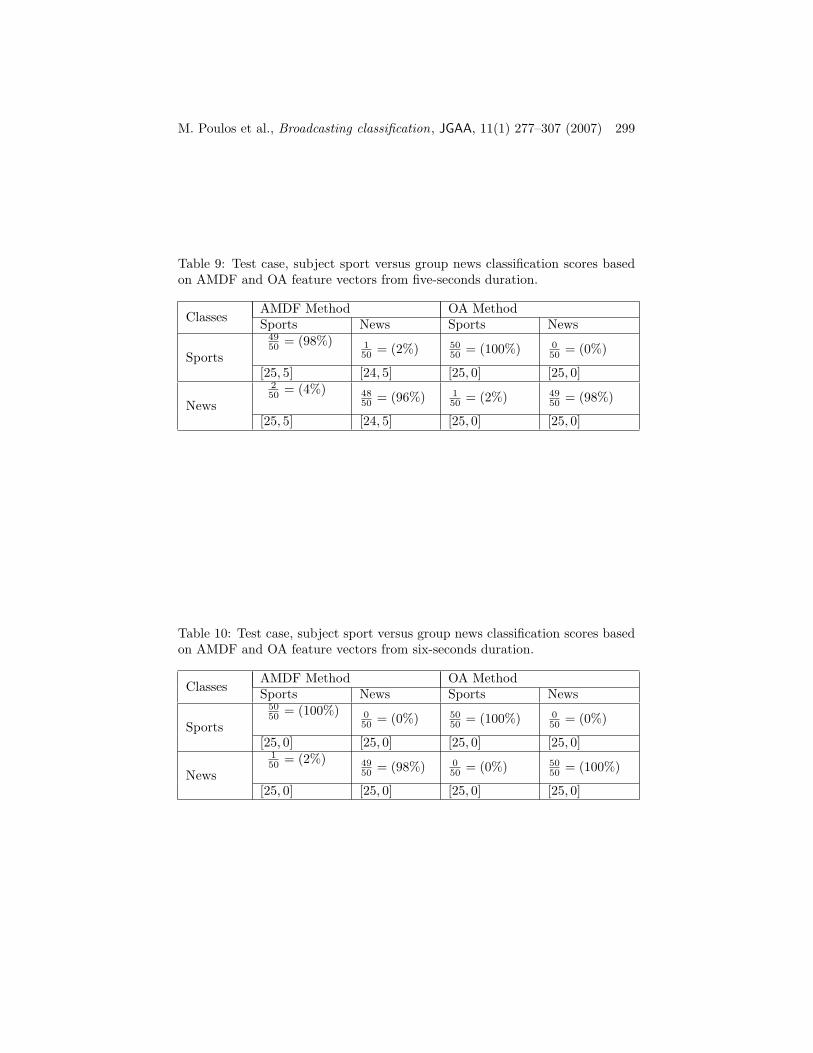
Table 9: Test case, subject sport versus group news classification scores basedon AMDF and OA feature vectors from five-seconds duration.
ClassesAMDF Method OA MethodSports News Sports News
Sports
4950 = (98%) 1
50 = (2%) 5050 = (100%) 0
50 = (0%)
[25, 5] [24, 5] [25, 0] [25, 0]
News
250 = (4%) 48
50 = (96%) 150 = (2%) 49
50 = (98%)
[25, 5] [24, 5] [25, 0] [25, 0]
Table 10: Test case, subject sport versus group news classification scores basedon AMDF and OA feature vectors from six-seconds duration.
ClassesAMDF Method OA MethodSports News Sports News
Sports
5050 = (100%) 0
50 = (0%) 5050 = (100%) 0
50 = (0%)
[25, 0] [25, 0] [25, 0] [25, 0]
News
150 = (2%) 49
50 = (98%) 050 = (0%) 50
50 = (100%)
[25, 0] [25, 0] [25, 0] [25, 0]

M. Poulos et al., Broadcasting classification, JGAA, 11(1) 277–307 (2007) 300
These tables also present the expected frequencies accompanied by observedfrequencies. Moreover, we constructed six additional tables, 11-16, which in-dicated the chi-square test value according to the Cramer coefficient of meansquare contingency, φ1 in a 99.5 % level of significance.
Table 11: Chi-square test evaluation of the results in Table 5. Critical χ2 valuesfrom χ2 tables (a = 0.995 level of significance) in brackets, along with theCramer coefficient φ1 from one-second’s duration.
Test cases:
AMDF OAχ2statistic χ2statistic[χ2
(1,0.995)] [χ2(1,0.995)]
φ1 value φ1 valueSports-News
54,96[7.879]0.27
67,3[7.879]0.34
Table 12: Chi-square test evaluation of the results in Table 6. Critical χ2 valuesfrom χ2 tables (a = 0.995 level of significance) in brackets, along with theCramer coefficient φ1 from one-second’s duration.
Test cases:
AMDF OAχ2statistic χ2statistic[χ2
(1,0.995)] [χ2(1,0.995)]
φ1 value φ1 valueSports-News
57,76[7.879]0.29
81,03[7.879]0.41
For example, in Table 11, for one second the χ2 values of the test statistic,as computed from the results in Table 4, are [23.5, 26.5, 23.5, 26.5], respectively,for the AMDF vectors and [24.5, 25.5, 24.5, 25.5] for the OA vectors. As anexample, for the correct positive classification cell (1,1) of Table 4 (OA vectors),χ2 test value is computed as
χ2 = (42−23.5)2
23.5 + (8−26.5)2
26.5 + (5−23.5)2
23.5 + (45−26.5)2
26.5 = 54.96From the tables of the χ2 distribution with one degree of freedom, and at
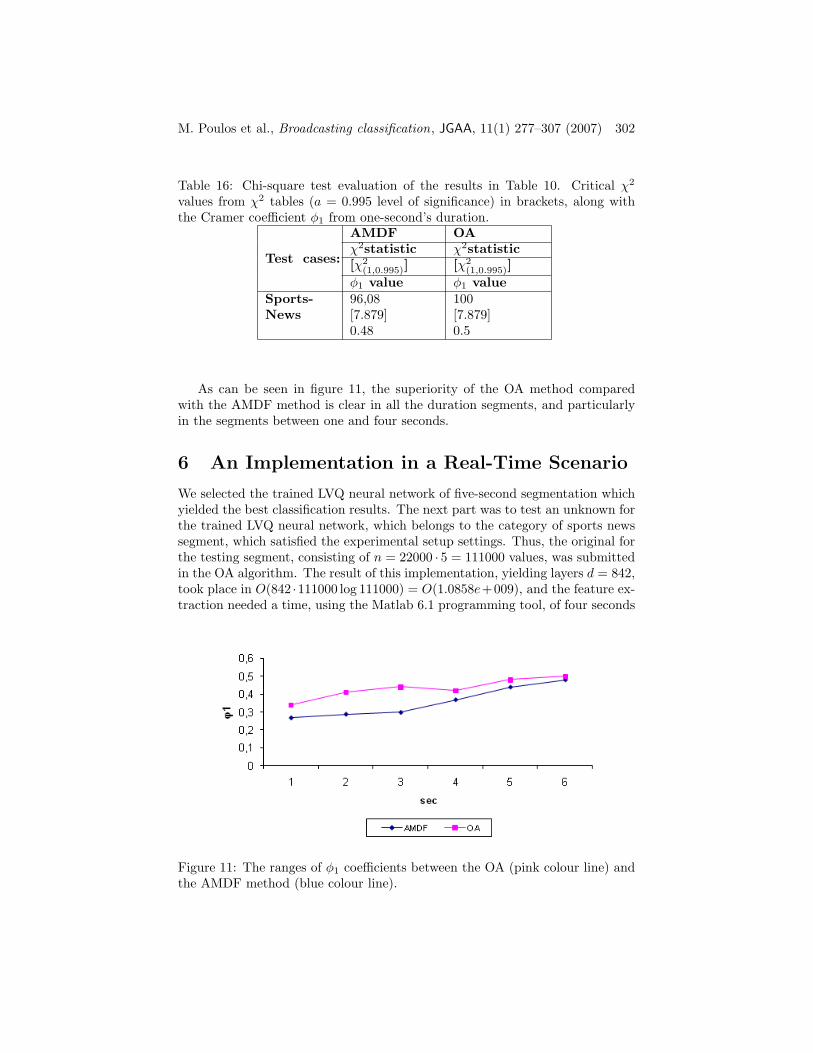
the 99.5 level of significance, we obtained the critical value 7.879, which is lowerthan all test statistic values. The null hypothesis of independence is thereforerejected for all six cases and for both types of feature vectors. Furthermore,the φ1 coefficient takes on values [0.27, 0.29, 0.30, 0.37, 0.44, 0.48] for thefour experiments based on AMDF feature vectors and [0.34, 0.41, 0.44, 0.42,0.48, 0.50] for the OA feature vectors. Taking into account these results weconstructed figure 11.

M. Poulos et al., Broadcasting classification, JGAA, 11(1) 277–307 (2007) 301
Table 13: Chi-square test evaluation of the results in Table 7. Critical χ2 valuesfrom χ2 tables (a = 0.995 level of significance) in brackets, along with theCramer coefficient φ1 from one-second’s duration.
Test cases:
AMDF OAχ2statistic χ2statistic[χ2
(1,0.995)] [χ2(1,0.995)]
φ1 value φ1 valueSports-News
60,86[7.879]0.30
88,40[7.879]0.44
Table 14: Chi-square test evaluation of the results in Table 8. Critical χ2 valuesfrom χ2 tables (a = 0.995 level of significance) in brackets, along with theCramer coefficient φ1 from one-second’s duration.
Test cases:
AMDF OAχ2statistic χ2statistic[χ2
(1,0.995)] [χ2(1,0.995)]
φ1 value φ1 valueSports-News
73,99[7.879]0.37
84,80[7.879]0.42
Table 15: Chi-square test evaluation of the results in Table 9. Critical χ2 valuesfrom χ2 tables (a = 0.995 level of significance) in brackets, along with theCramer coefficient φ1 from one-second’s duration.
Test cases:
AMDF OAχ2statistic χ2statistic[χ2
(1,0.995)] [χ2(1,0.995)]
φ1 value φ1 valueSports-News
88,83[7.879]0.44
96,08[7.879]0.48
M. Poulos et al., Broadcasting classification, JGAA, 11(1) 277–307 (2007) 302
Table 16: Chi-square test evaluation of the results in Table 10. Critical χ2
values from χ2 tables (a = 0.995 level of significance) in brackets, along withthe Cramer coefficient φ1 from one-second’s duration.
Test cases:
AMDF OAχ2statistic χ2statistic[χ2
(1,0.995)] [χ2(1,0.995)]
φ1 value φ1 valueSports-News
96,08[7.879]0.48
100[7.879]0.5
As can be seen in figure 11, the superiority of the OA method comparedwith the AMDF method is clear in all the duration segments, and particularlyin the segments between one and four seconds.
6 An Implementation in a Real-Time Scenario
We selected the trained LVQ neural network of five-second segmentation whichyielded the best classification results. The next part was to test an unknown forthe trained LVQ neural network, which belongs to the category of sports newssegment, which satisfied the experimental setup settings. Thus, the original forthe testing segment, consisting of n = 22000 · 5 = 111000 values, was submittedin the OA algorithm. The result of this implementation, yielding layers d = 842,took place in O(842 ·111000 log 111000) = O(1.0858e+009), and the feature ex-traction needed a time, using the Matlab 6.1 programming tool, of four seconds
Figure 11: The ranges of φ1 coefficients between the OA (pink colour line) andthe AMDF method (blue colour line).

M. Poulos et al., Broadcasting classification, JGAA, 11(1) 277–307 (2007) 303
for implementation. The testing procedure using a trained LVQ neural networkneeded about one millisecond. However, it must be noted that the real time issignificantly lower because Matlab belongs in the interpreted languages, whichare extremely slow in practice. For example, for the same algorithm the unit ofmeasurement in Matlab is seconds, while in C it is milliseconds [2].
7 Discussion
The main aim of this paper has been to apply a statistical method, which wehave first introduced as a pattern recognition method, to several of our ownclassification problems [32, 8, 6, 1, 3, 20, 31], as well as in the field of au-dio signal classification. This study is a consequence of our study of patternrecognition problems using computational geometric algorithms [30]. For theachievement of this aim we selected the traditional problem of audio classifica-tion files (sports and news broadcasting). More classification problems such asthese are presented in the introduction. This study then showed the superiorityof the OA method of feature extraction over the AMDF method by compar-ing their results in respect to an independent LVQ1 neural network. It thentested the ability of our proposed method using two methodological procedures:first the classification procedure and then the time learning of the input featurevectors of the LVQ1 neural network, found by measuring the minimum timeerror convergence which was taken as the optimal selected criterion. Moreover,as the six-seconds time segmentation for the AMDF method showed itself tobe optimal in our example, this agreed with the findings of previous studies[24, 25], and thus proved the validity of our experiment. Thus, taking into ac-count the experimental and statistical results, we may conclude that our methodproduces specific feature extraction coefficients which may be classified betterand trained easier, with less error, than the AMDF coefficients using the LVQ1neural network. Furthermore, we concluded that the processing time length ofan audio file may be statistically accurate to greater than three seconds. In gen-eral, in future we could classify the weather report, or the political and studionews of a broadcast by adopting different philosophies of shot segmentation.Furthermore, the testing of reliability of the proposed method in relation toother philosophy neural networks such as the RBF and Recurrent classifiers isone of our upcoming objectives. The fast-learning ability of the OA coefficientsof an independent neural network may be used as a feature extraction tool inmore difficult audio classification problems, such as for the discrimination ofa subclass of a main category of audio file, such as weather reports, politicalnews, studio news, and so forth. The minimization of the accurate classificationtime length to fewer than four seconds shows that the application of our methodpromises to reduce the complexity significantly and to improve storage problemsin pattern-recognition databases.
The results of our research show that the computational geometric algorithmis a pattern-recognition method which may be applied accurately for multimediaclassification purposes. The greatest advantage of this method is that it may

M. Poulos et al., Broadcasting classification, JGAA, 11(1) 277–307 (2007) 304
be used in real time experimentation, as the feature extraction doesn’t needsuch complex settings as the determination of interval frame, which is neededfor pitch calculation. However, the achievement of this target needs furtherresearch, specifically in the reduction of its complexity, as our understandingof computational geometry improves dramatically every day. We intend thenext step in our experimentation program to be in the area of larger data setsby applying this method to hierarchical classification problems involving theseparation of many more categories of audio signals than the current sports andnews broadcasts.
Finally, we believe that this method is the first attempt to implement theproblem of the semantic classification of audio broadcasting files by using aphilosophically different technique, producing a significant statistical evaluationscore using Cramer criterion (see section 5). This evaluation yields a usefulconclusion about the accuracy of the proposed method, giving promise thatcontinuing research will prove useful.
Acknowledgments
The authors wish to thank the referees for several useful suggestions.
M. Poulos et al., Broadcasting classification, JGAA, 11(1) 277–307 (2007) 305
References
[1] http://www.chiariglione.org/mpeg/standards/mpeg-7/mpeg-7.htm.
[2] http://www.mines.utah.edu/geo/facilities/computing/tutorials/unix/node4.html.
[3] B. Arons. SpeechSkimmer: a system for interactively skimming recordedspeech. In ACM trans on computer-human interaction, volume 4, pages3–38, 1997.
[4] P. Bose and G. Toussaint. No quadrangulation is extremely odd. In Sixthinternational symposium on algorithms and computation (formerly SIGALInternational Symposium on Algorithms), pages 340–358, 1995.
[5] K. Dalal. Counting the onion. Random Struct Algorithms, 24:155–165,2001.
[6] J. Deller, M. Ayer, and S. Odeh. Least square identification with errorbounds for real-time signal processing and control. In Proc IEEE 93, vol-ume 81, pages 813–849, 1993.
[7] R. Graham. An efficient algorithm for determining the convex hull of afinite planar set. Information process, Lett, 1:132–133, 1972.
[8] A. Hauptmann and M. Witbrock. Informedia: news-on-demand multimediainformation acquisition and retrieval. In Intelligent multimedia informationretrieval, pages 215–240. MIT Press, Cambridge, 1997.
[9] S. Haykin. Neural Networks. MacMillan, New York, 1994.
[10] W. Hess. Pitch Determination of Speech Signals. Springer Verlag, Heidel-berg, 1983.
[11] A. Hoekstra and R. Duin. Exploring the capacity of simple neural net-works. In J. Katwijk, J. Gerbrands, van M. Steen, and J. Tonino, editors,Proceedings of the first annual conference of the ASCI, pages 56–62, 1995.
[12] A. Jain and W. Waller. On the optimal number of features in the clas-sification of multivariate gaussian data. Pattern recognition, 10:365–374,1978.
[13] N. Kanal and B. Chandrasekaran. On dimensionality and sample size instatistical pattern recognition. Pattern recognition, 3:225–234, 1971.
[14] J. Kangas, T. Kohonen, and J. Laakson. Variants of self-organizing maps.IEEE trans neural networks, 1:93–99, 1990.
[15] K.Torkkola, J.Kangas, P. Utela, S. Kaski, M. Kokkonen, M. Kurimo, andT. Kohonen. Status report of the finnish phonetic typewriter project.ICANN91, 1991.

M. Poulos et al., Broadcasting classification, JGAA, 11(1) 277–307 (2007) 306
[16] Z. Liu, J. Huang, Y. Wang, and T. Chen. Audio feature extraction andanalysis for scene classification. In Workshop on Multimedia Signal Pro-cessing, volume 20, pages 1–2. IEEE 97 Signal Processing Society, 1997.
[17] L. Lu, H. Jiang, and J. Zhang. A robust audio classification and segmen-tation method. In Proc. of the 9th ACM int conf on multimedia, pages203–211, 2001.
[18] H. Man and et. al. Three-dimensional sub-band coding techniques for wire-less video communications. In IEEE trans on circuits and systems for videotech, volume 12, pages 386–397, 2002.
[19] J. O’ Rourke. Computational Geometry in C. Spencer T. Cambridge Uni-versity Press, New York, 1993.
[20] M. Orlandi, A. Santarelli, and D. Falavigna. Maximum likelihood endpointdetection with time-domain features. In Proc of eurospeech, pages 1757–1760, 2003.
[21] A. Orlitsky. Supervised dimensionality reduction using mixture models. InTwenty-second int conf on machine learning, pages 768–775, 2005.
[22] M. Poulos, N. Alexandris, V. Belessioti, and E. Magkos. Comparison be-tween computational geometry and coherence methods applied to the EEGfor medical diagnostic purposes. In Recent Advances in intelligent Systemsand Signal Processing, ICAISC, 2003.
[23] M. Poulos, N. Alexandris, V. Belessioti, and E. Magkos. Computationalgeometry algorithms in an educational intelligent scenario managementsystem. In N. Mastorakis, N. Manikopoulos, C. Antonioy, and V. Malade-nov, editors, Recent Advances in Intelligent Systems and Signal Processing,ICAISC, pages 242–246, 2003.
[24] M. Poulos, N. Korfiatis, and S. Papavlasopoulos. Anti-spam filtering usingcomputational geometry. WSEAS transactions on information science &applications, pages 747–751, 2004.
[25] M. Poulos, S. Papavlasopoulos, and V. Chrissicopoulos. A text categoriza-tion technique based on a numerical conversion of a symbolic expressionand an onion layers algorithm. Journ of Digital Inf (JoDI), 6(1):176, 2004.
[26] M. Poulos, S. Papavlasopoulos, V. Chrissicopoulos, and E. Magkos. Finger-print verification based on image processing segmentation using an onionalgorithm of computational geometry. In In Sixth Int Conf on MathematicsMethods in Scattering Theory and Biomedical Technology, pages 550–559.BIOTECH 03, Word Scientific, Tsepelovo-Ioannina, 2003.
[27] M. Poulos, M. Rangous, and E. Kafetzopoulos. Person identification via theEEG using computational geometry algorithms. In S. Theodoridis, A. P. N.Stouraitis, and N. Kalouptsidis, editors, Proceedings of the Ninth EuropeanSignal Processing, volume 4, pages 2125–2212. EUSIPCO 98, Rhodes, 1998.

M. Poulos et al., Broadcasting classification, JGAA, 11(1) 277–307 (2007) 307
[28] M. Poulos, M. Rangousi, N. Alexandris, and A. Evangelou. Person identifi-cation from the EEG using nonlinear signal classification. Methods of infoin medicine, 41:64–74, 2001.
[29] M. Poulos, M. Rangoussi, V. Chrissicopoulos, and A. Evangelou. Paramet-ric person identification from the EEG using computational geometry. InIEEE proceedings of the 6th Int conf on electronics circuits and systems,volume 2, pages 1005–1012. ICECS 99, inst of electrical and electronicsengineers, 1999.
[30] B. Ripley. Pattern Recognition and Neural Networks. Cambridge UniversityPress, Cambridge, 1996.
[31] M. J. Ross, H. L. Shaffer, A. Cohen, R. Freudberg, and H. J. Manley.Average magnitude difference function pitch extractor. In IEEE trans onacoustics, speech, and signal processing, volume 22, pages 353–362, 1974.
[32] J. Saunders. Real-time discrimination of broadcast speech/music. InICASSP96, volume 2, pages 993–996, 1996.
[33] E. Scheirer and M. Slaney. Construction and evaluation of a robust mul-tifeature music/speech discriminator. In Proc of ICASSP 97, volume 2,pages 1331–1334, 1997.
[34] S. Smoliar and H. Zhang. Content-based video indexing and retrieval. IEEEmultimedia mag,, 1:62–72, 1994.
[35] G. Tzanetakis and M. Chen. Building audio classifiers for broadcast newsretrieval. In Proc. of WIAMIS 04, Portugal. WIAMIS 04, Portugal, 2004.
[36] G. Tzanetakis and P. Cook. Musical genre classification of audio signals.In IEEE 02 Trans on speech and audio proc, volume 10, pages 293–302,2002.
[37] J. Zar. Biostatistical Analysis (4th Edition). Prentice-Hall, London, 1999.
Related Documents