MARINE ECOLOGY PROGRESS SERIES Mar Ecol Prog Ser Vol. 298: 41–57, 2005 Published August 15 INTRODUCTION The California Current ecosystem is recognized to be highly variable on seasonal, interannual, and decadal time scales (Brodeur et al. 1996, McGowan et al. 1998, Chavez et al. 2003). In addition to large-scale decadal processes that affect the entire North Pacific (e.g. Pacific Decadal Oscillation; Mantua et al. 1997, Miller et al. 2004), the northern region of the California Current off Oregon and Washington, USA, lies at the intersection of Subarctic and Transition Zone water masses. It is thus affected by oceanographic processes occurring both north and south of the region, and is further mediated by oceanic and continental influ- ences (Hickey 1998, Hickey & Banas 2003). Anomalous events, such as El Niños or La Niñas, affect the compo- © Inter-Research 2005 · www.int-res.com *Email: [email protected] Species composition and community structure of pelagic nekton off Oregon and Washington under variable oceanographic conditions Richard D. Brodeur 1, *, Joseph P. Fisher 2 , Robert L. Emmett 1 , Cheryl A. Morgan 3 , Ed Casillas 4 1 Northwest Fisheries Science Center, NOAA Fisheries, 2030 S. Marine Science Drive, Newport, Oregon 97365, USA 2 College of Ocean and Atmospheric Sciences, Oregon State University, 104 COAS Admin. Building, Corvallis, Oregon 97331, USA 3 Cooperative Institute for Marine Resources Studies, Oregon State University, 2030 S. Marine Science Drive, Newport, Oregon 97365, USA 4 Northwest Fisheries Science Center, NOAA Fisheries, 2725 Montlake Blvd. E., Seattle, Washington 98112, USA ABSTRACT: Dramatic changes in the physical and biological conditions off Washington and Oregon, USA, have occurred since 1998, including extreme El Niño (warm) and La Niña (cool) years, high and low Columbia River flow years, a major intrusion of subarctic water, and a low oxygen event on the shelf. The occurrence of contrasting environmental conditions provided an excellent opportunity to examine pelagic nekton distributions and their abiotic and biotic associations. Pelagic surface trawl surveys conducted during June and September from 1998 to 2002 off northern Washington to central Oregon revealed a nekton community dominated by Pacific herring (33.5% of total catch), Pacific sardines (29.9%), and northern anchovy (12.3%). Between 1998 and 2002, species composition shifted from a community dominated by southern species (mackerels and hake) to one dominated by northern species (squid, smelts, and salmon), but the transition was gradual, and small pelagic spe- cies (sardines, herring, and anchovy) showed no consistent trends in abundance over time. Species diversity/evenness was highest in September 2002. Cluster analysis identified 7 species and 6 station clusters. Subyearling Chinook salmon, market squid, Pacific sardine, yearling coho salmon, and Pacific saury were the strongest indicator species for 5 of these cluster groups. Cluster group distrib- utions differed between both inshore/offshore and north/south. A 3-dimensional ordination ex- plained 55% of the total variance with bottom depth, distance from shore, and sea-surface tempera- ture correlated with the first axis, latitude with the second axis, and surface salinity, surface density and stability with the third axis. Our results suggest that the habitats occupied by pelagic nekton species expand and contract in relation to the dynamic nature of the California Current and are affected by changing ocean conditions at both seasonal and interannual periodicities. KEY WORDS: Pelagic nekton · Assemblages · Habitat · Coastal upwelling · Multivariate analyses · North Pacific Ocean · Juvenile salmon Resale or republication not permitted without written consent of the publisher

Welcome message from author
This document is posted to help you gain knowledge. Please leave a comment to let me know what you think about it! Share it to your friends and learn new things together.
Transcript

MARINE ECOLOGY PROGRESS SERIESMar Ecol Prog Ser
Vol. 298: 41–57, 2005 Published August 15
INTRODUCTION
The California Current ecosystem is recognized tobe highly variable on seasonal, interannual, anddecadal time scales (Brodeur et al. 1996, McGowan etal. 1998, Chavez et al. 2003). In addition to large-scaledecadal processes that affect the entire North Pacific(e.g. Pacific Decadal Oscillation; Mantua et al. 1997,
Miller et al. 2004), the northern region of the CaliforniaCurrent off Oregon and Washington, USA, lies at theintersection of Subarctic and Transition Zone watermasses. It is thus affected by oceanographic processesoccurring both north and south of the region, and isfurther mediated by oceanic and continental influ-ences (Hickey 1998, Hickey & Banas 2003). Anomalousevents, such as El Niños or La Niñas, affect the compo-
© Inter-Research 2005 · www.int-res.com*Email: [email protected]
Species composition and community structure ofpelagic nekton off Oregon and Washington under
variable oceanographic conditions
Richard D. Brodeur1,*, Joseph P. Fisher2, Robert L. Emmett1, Cheryl A. Morgan3,Ed Casillas4
1Northwest Fisheries Science Center, NOAA Fisheries, 2030 S. Marine Science Drive, Newport, Oregon 97365, USA2College of Ocean and Atmospheric Sciences, Oregon State University, 104 COAS Admin. Building, Corvallis, Oregon 97331, USA
3Cooperative Institute for Marine Resources Studies, Oregon State University, 2030 S. Marine Science Drive, Newport, Oregon 97365, USA
4Northwest Fisheries Science Center, NOAA Fisheries, 2725 Montlake Blvd. E., Seattle, Washington 98112, USA
ABSTRACT: Dramatic changes in the physical and biological conditions off Washington and Oregon,USA, have occurred since 1998, including extreme El Niño (warm) and La Niña (cool) years, high andlow Columbia River flow years, a major intrusion of subarctic water, and a low oxygen event on theshelf. The occurrence of contrasting environmental conditions provided an excellent opportunity toexamine pelagic nekton distributions and their abiotic and biotic associations. Pelagic surface trawlsurveys conducted during June and September from 1998 to 2002 off northern Washington to centralOregon revealed a nekton community dominated by Pacific herring (33.5% of total catch), Pacificsardines (29.9%), and northern anchovy (12.3%). Between 1998 and 2002, species compositionshifted from a community dominated by southern species (mackerels and hake) to one dominated bynorthern species (squid, smelts, and salmon), but the transition was gradual, and small pelagic spe-cies (sardines, herring, and anchovy) showed no consistent trends in abundance over time. Speciesdiversity/evenness was highest in September 2002. Cluster analysis identified 7 species and 6 stationclusters. Subyearling Chinook salmon, market squid, Pacific sardine, yearling coho salmon, andPacific saury were the strongest indicator species for 5 of these cluster groups. Cluster group distrib-utions differed between both inshore/offshore and north/south. A 3-dimensional ordination ex-plained 55% of the total variance with bottom depth, distance from shore, and sea-surface tempera-ture correlated with the first axis, latitude with the second axis, and surface salinity, surface densityand stability with the third axis. Our results suggest that the habitats occupied by pelagic nektonspecies expand and contract in relation to the dynamic nature of the California Current and areaffected by changing ocean conditions at both seasonal and interannual periodicities.
KEY WORDS: Pelagic nekton · Assemblages · Habitat · Coastal upwelling · Multivariate analyses ·North Pacific Ocean · Juvenile salmon
Resale or republication not permitted without written consent of the publisher
Mar Ecol Prog Ser 298: 41–57, 2005
sition and production of all trophic levels in this region(Pearcy et al. 1985, Pearcy & Schoener 1987, Chavez etal. 2002, Pearcy 2002, Peterson et al. 2002, Peterson &Schwing 2003) as well as the structure of the pelagicfood web (Brodeur & Pearcy 1992).
In particular, the last half-decade (1998 to 2002) haswitnessed extreme variability in oceanographic condi-tions off Oregon on a magnitude that has not beenrecorded previously (Peterson & Schwing 2003). Forexample, one of the strongest El Niño events everrecorded occurred in late 1997 and 1998 and was fol-lowed by an extremely strong La Niña in 1999 (Chavezet al. 2002, Schwing et al. 2002). It has now been sug-gested that a major regime shift also occurred in 1999associated with the La Niña that returned the easternNorth Pacific to a cool state not observed since themid-1970s (Peterson & Schwing 2003). Other recentanomalies in this region included a major drought in2001, which decreased freshwater input into thecoastal zone to record low levels, and an intrusion ofnutrient-rich subarctic water and subsequent highphytoplankton production which led to anoxic condi-tions off Oregon by late summer 2002 (Freeland et al.2003, Wheeler et al. 2003, Grantham et al. 2004).
Pelagic nekton may be useful indicators and integra-tors of changing oceanographic conditions becausethey are able to migrate quickly into preferred habi-tats, and, in the case of smaller pelagic species,respond by pronounced fluctuations in recruitmentover relatively short time intervals. Annual variationsin the ocean environment may be reflected in changesin both the distributions of adult pelagic fishes and thetiming and location of spawning. Previous studies(Brodeur & Pearcy 1986, 1992, Emmett & Brodeur2000, Brodeur et al. 2003a) have shown substantialseasonal and interannual changes in abundance anddistribution of many pelagic nekton species. However,changes in the community structure of nekton havebeen documented only for individual years (Brodeur etal. 2003b, 2004) but not within years or between yearsof contrasting oceanographic conditions.
In this study, we use a combination of descriptiveand multivariate techniques (Field et al. 1982, Clarke &Warwick 2001) including diversity indices, clusteranalysis, indicator species analysis, and nonmetricmultidimensional scaling (NMS), an ordination tech-nique, to study near-surface nekton communities offnorthern Oregon and Washington. In particular, weare interested in the associations of juvenile salmonwith other nekton. These species may be predators onsalmon, competitors with salmon, or alternate prey forpredators that might otherwise eat salmon. This timeperiod exhibited large fluctuations in salmon survivalreflected in both low and record high salmon survivalalong the West Coast that appeared to be linked to
oceanographic changes (Logerwell et al. 2003, Scheu-erell & Williams 2005). We are also interested in hownektonic communities respond to abrupt changes intheir physical and biological environment with a viewtoward understanding how future environmentalchanges will affect the pelagic ecosystem in thenorthern California Current.
MATERIALS AND METHODS
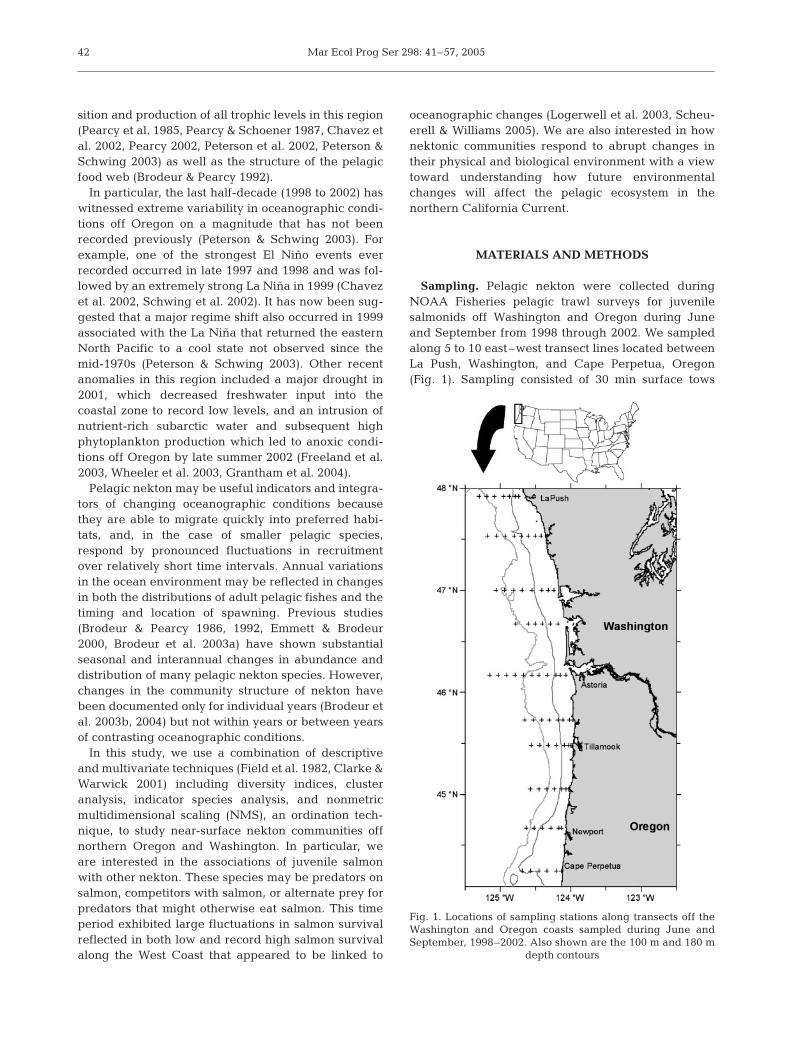
Sampling. Pelagic nekton were collected duringNOAA Fisheries pelagic trawl surveys for juvenilesalmonids off Washington and Oregon during Juneand September from 1998 through 2002. We sampledalong 5 to 10 east–west transect lines located betweenLa Push, Washington, and Cape Perpetua, Oregon(Fig. 1). Sampling consisted of 30 min surface tows
42
Fig. 1. Locations of sampling stations along transects off theWashington and Oregon coasts sampled during June andSeptember, 1998–2002. Also shown are the 100 m and 180 m
depth contours
Brodeur et al.: Oceanographic effects on pelagic nekton
with a pelagic rope trawl at a speed over ground ofapproximately 6 km h–1. The 108 m long rope trawlcontained variable mesh sizes (162.6 cm at mouth to8.9 cm at cod end) and had a mouth opening of 30 mwide by 20 m deep, with the head rope at about 1 m. Toretain catches of small nekton, a 6.1 m long, 0.8 cmknotless liner was sewn into the cod end. Charteredcommercial fishing vessels and a fisheries researchvessel (RV ‘W. E. Ricker’) were used to conduct thesampling. Trawls were conducted at 6 to 8 stations oneach transect from the shallowest bottom depth possi-ble (~30 m depth) out to approximately 50 km fromshore, often extending beyond the continental shelf.
From the available collections, we excluded samplesfrom some stations over concerns of potential bias.First, only ‘regular’ station hauls at predeterminedlocations were included, and several opportunistic orspecial studies hauls were excluded. Due to potentialdiel differences in vertical distribution and catchabilityof many nekton (e.g. Emmett et al. 2004, Krutzikowsky& Emmett 2005), we restricted our analyses to daytimehauls. Any haul occurring completely (or almost com-pletely) between the beginning of morning civil twi-light and the end of evening civil twilight was consid-ered a ‘day’ haul. Hauls outside of this time windowwere eliminated, leaving 430 samples for analyses.
The total number of each nekton species caught ineach haul was either determined directly or estimatedfrom the total weight of the species in a catch and theweight and number of individuals in a subsample ofthat catch. In addition, length data were collected forall salmonids and for subsamples of all other speciescaught. Most nekton were identified to species, butsmall juvenile specimens were sometimes classified athigher taxonomic levels (genus or family). Althoughsome larval forms were collected, we analyzed onlythose taxa that were likely to be true nekton (late juve-nile and adult stages) and quantitatively retained bythe mesh size we used. Temperature, salinity, and den-sity to within 5 m of the bottom or a depth of 100 mwere measured with a CTD at each station. Watertransparency was measured using a Secchi disc.Chlorophyll a and nutrient samples were collectedfrom 3 m depth using a Niskin bottle. In the laboratory,chlorophyll was calculated from fluorescence mea-surements. Phosphate (PO4), silicate (Si(OH)4), nitrate(NO3), nitrite (NO2), and ammonium (NH4) concentra-tions were determined in the nutrient samples by theUniversity of Washington (Seattle) Marine ChemistryLab using standard methods adapted for an autoana-lyzer.
Species diversity and dominance indices. For theseanalyses, we used the full data set of species (n = 72) tocalculate species composition and diversity. We used 3indices to assess differences between cruises. As a
diversity measurement we used both the Shannon-Weiner index (H’) and Simpson index (1–λ), whichmeasures both species number (richness) and equi-tability (evenness). Both indices increase with increas-ing diversity. We used Pielou’s index (E) to measureevenness; this index ranges from 0 to 1.0 with the max-imum value occurring when all taxa are equally abun-dant (Magurran 1988).
Multivariate analysis. The categories in each sam-pling unit were different species of fishes and squidsand different age groups of salmonid fishes. We distin-guished the juvenile age classes (subyearling andyearling) of salmon from the adults, because migratorypatterns and habitat preferences can be quite distinctfor the different life history stages. We grouped salmoninto different age-classes based on fork length andpredetermined fork-length ranges for the differentage-classes during different months. This method wasvery accurate for coho salmon, but was less accurate,although still useful, for Chinook salmon since sub-yearling and yearling individuals overlap slightly intheir size distributions (J. Fisher unpubl. data). In orderto reduce the distorting effects on the analyses of verylarge catches of any species, abundances in sampleunits (no. km–1 towed + 1) were log10-transformed.Species that occurred in less than 2.5% of sample unitswere also excluded, as were hauls with no commonspecies, leaving a matrix of 387 hauls by 27 species forthe 10 cruises. The software PC-ORD (McCune & Mef-ford 1999) was used for all multivariate methods.
In order to define months and years for which spe-cies composition was similar, an initial cluster analysisof species abundance was done across the 10 cruisespooled together. In this initial cluster analysis, speciesabundance was expressed as the average across allhauls of a cruise of log10 (no. ind. km–1 towed + 1),resulting in a matrix of 10 sample units (cruises) by 27species. All subsequent multivariate analyses usedindividual hauls as the sampling units and the fullmatrix (387 hauls by 27 species), which included datafrom all 10 cruises.
Cluster analyses of both sampling units (hauls) andof species (on the transposed matrix) used a hierarchi-cal agglomerative clustering strategy, Sørensen (Bray-Curtis) distances, and the Flexible-Beta (β = –0.25)linkage method. Cluster dendrograms were cut wherethe resulting cluster groups were ecologically inter-pretable, at the level where 13% of informationremained for the sample clusters and at 30% of infor-mation remaining for the species clusters.
Species that were representative of the differentsample clusters were identified using Indicator SpeciesAnalysis (Dufrene & Legendre 1997). Indicator values(IV) were calculated for each species (j) and clustergroup (k):
43
Mar Ecol Prog Ser 298: 41–57, 2005
IV = 100(RAkj × RFkj)
where RAkj = the average abundance of species j ingroup k relative to its average abundance in the othergroups, and RFkj = the relative frequency of occurrenceof species j in group k. For each species, the clustergroup for which its IV was strongest (IVmax) was identi-fied. The statistical significance of each IVmax wastested by Monte Carlo randomization, in which sampleunits were randomly reassigned to cluster groups 1000times and IVmax was recalculated for each species andeach randomization. The probability that a species hadno statistical value as an indicator for a cluster groupwas equal to the proportion of its IVmax from the ran-domizations that was larger than the IVmax resultingfrom the cluster analysis.
The matrix was transposed and a clustering of spe-cies was performed to examine which species had sim-ilar distributions among the hauls. When clusteringspecies, it is recommended that the species abundancedata be relativized (McCune & Grace 2002). For thiscluster analysis we expressed the abundance of eachspecies in each haul as a proportion of the total catch ofthat species in all hauls during all cruises of the study(relativizing by species totals). Species that are similarto each other in their distributions among the samplingunits should tend to cluster together. Species clusterswere then compared with the indicator species for thedifferent sample clusters to see if they were similar.
We used NMS, an ordination technique (Clarke &Warwick 2001), to examine structure of sample units(fish hauls) in species space (Kruskal 1964). Distancesbetween samples in species space were measuredusing the Sørensen (Bray-Curtis) distance measure(McCune & Grace 2002). A single ordination was per-formed on the hauls by species matrix (387 hauls × 27species) that included data from all June and Septem-ber cruises. Based on the decrease in stress (lack of fit)with the addition of each ordination axis, a 3-dimen-sional solution was most effective for explaining varia-tion in the original multi-dimensional species space.
In order to describe the environmental gradientsassociated with the NMS ordination axes, the temper-ature (°C), salinity (psu), and density (σT) at 1 m depth,stability [(density(20 m) – density(1 m))/19 m], station bot-tom depth (m), distance from shore (nautical miles, nmiles), latitude (decimal degrees), chlorophyll (µg l–1),nutrient concentrations (µM), and transparency (Sec-chi depth in m) during the different hauls were corre-lated with the ordination scores along each axis. Ordi-nation axes were rotated to maximize the correlation ofdistance from shore with one of the axes. Due to thelarge sample size, many relatively small correlationcoefficients were found to be statistically significant atthe p = 0.05 level (see McCune & Grace 2002). Thus,
we used a more conservative p-value of 0.01, whichcorresponds to an r-value of 0.20 being significant.
RESULTS
Environmental conditions
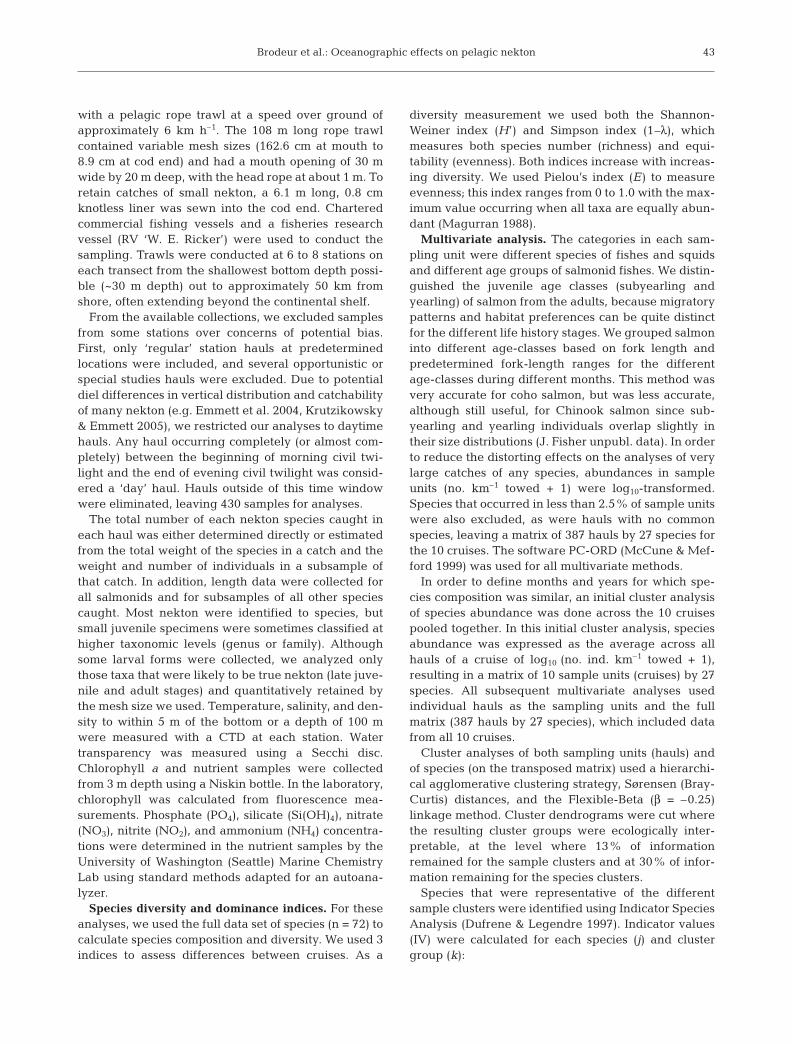
Spring (April and May) upwelling was near orslightly below the long-term (1946–1997) average dur-ing most years, but upwelling was anomalously high inJune, August, and September 1998, September 1999,July 2001 and July and August 2002. Averaged overthe entire spring and summer, upwelling was strongestin 1998 and weakest in 2000 (Fig. 2A). Columbia Riverflows showed more consistent patterns by year, with1998 (except April) and 1999 above the 1992 to 2002mean flow and with the drought year of 2001 persis-tently below average flows (Fig. 2B).
44
Fig. 2. (A) Monthly upwelling anomalies at 45° N from Aprilthrough September of 1998 through 2002 relative to the long-term monthly average calculated from 1946–1997 (data fromwww.pfeg.noaa.gov). (B) Monthly Columbia River flowanomalies taken at the United States Geological Surveystation at Quincy, Oregon, from April through September of1998 through 2002 relative to the 1991–2002 monthly average
(http://waterdata.usgs.gov/nwis/)

Brodeur et al.: Oceanographic effects on pelagic nekton
June sea-surface temperatures were relatively warmin 1999 and 2002, with areas of cooler temperaturegenerally near the coast during all years (Fig. 3A). InSeptember, temperatures were generally warmer off-shore and cooler on the coast, although 2000 showed adistinct latitudinal gradient, with cooler water foundonly off Central Oregon (Fig. 3B). The Columbia Riverplume, distinguished by the presence of low-salinitysurface water, was moderately well developed in June1999, 2000, and 2002 but almost completely absent inJune 2001 (Fig. 3A). In September, the Columbia Riverplume was apparent during 1998, 2000, and 2001 butwas absent or very weak in 1999 and 2002 (Fig. 3B).
Catch composition
The pelagic nekton community off Oregon andWashington was numerically dominated by relativelyfew species. The top 12 species comprised 80.5% ofthe total nekton abundance. Several pelagic schoolingspecies such as Pacific herring (33.5% of total), Pacificsardines (29.9%), and northern anchovy (12.3%) werethe most dominant overall (Fig. 4A). Other species,such as market squid, coho and Chinook salmon,whitebait smelt, and Pacific saury, were of secondaryimportance during some cruises (Fig. 4B). Total abun-dances varied seasonally and interannually with high-
45
Fig. 3. Surface (1 m) temperatures and salinities measured during (A) June and (B) September of each year (continued on next page)

Mar Ecol Prog Ser 298: 41–57, 2005
est catches in September 1999, June 2000, and June2002 (Fig. 4). The September 1999 cruise had the high-est abundance of the dominant species, mainly due tohigh catches of Pacific sardine and Pacific herring,whereas the September 2002 survey had the lowestoverall abundance and was dominated by Chinooksalmon, herring, and Pacific saury. The June 2000cruise showed a particular dominance of northernanchovy. Although the average catch per unit effort ofPacific herring, Pacific sardine, and northern anchovywas often high (Fig. 4A), the frequency of occurrenceof these species in the hauls was relatively low(Table 1), reflecting the schooling behavior of thesespecies and their patchy distributions. The high aver-
age abundance of these species was often the result ofvery large catches in a few hauls.
Coho and Chinook salmon were caught during allcruises in relatively low numbers (Fig. 4B), but oftenoccurred in a relatively high percentage of hauls(Table 1). Pacific hake was only abundant in June1998, and chub mackerel in June 1998 and September1999 (Fig. 4B). Pacific saury was more abundant inSeptember than in June and first occurred in Septem-ber 2000 (Fig. 4B).
Some species near the northern end of their distribu-tion in our sampling area (Pacific sardine, chub mack-erel, Pacific hake, and whitebait smelt) occurred morefrequently in hauls in June 1998 during a strong El
46
Fig. 3 (continued)

Brodeur et al.: Oceanographic effects on pelagic nekton
Niño than during any subsequent cruise (Table 1).Although chub mackerel, Pacific hake, and whitebaitsmelt were numerically most abundant in June 1998,Pacific sardine was actually more abundant in 2 latercruises and showed no consistent pattern during these5 years (Fig. 4A). Furthermore, frequency of occur-rence of species that reproduce in the region or tend tohave more northern affinities (market squid, surfsmelt, Pacific herring, northern anchovy, and salmon)was not unusually low in June 1998 and showed noconsistent trends among years (Table 1). Diversity andevenness were high in June 1998 but low in Septemberof that year. September measures tended to increase insucceeding years except for 1999 (Table 2).
Multivariate analysis
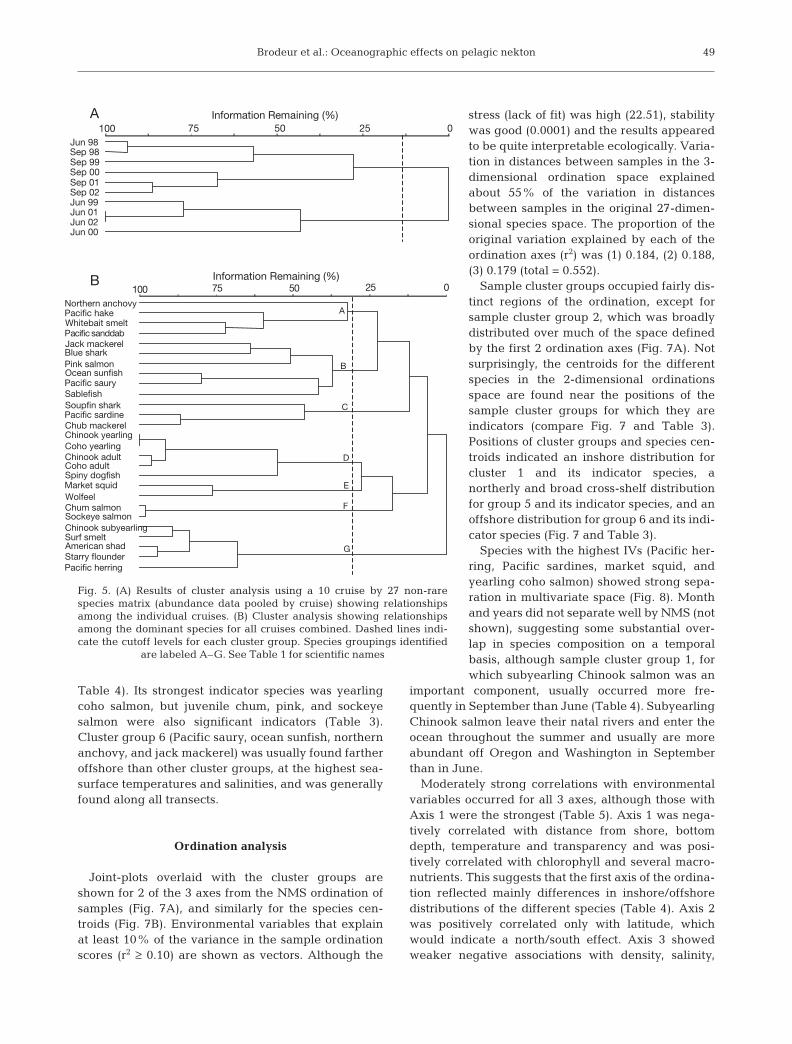
The cluster dendrogram of cruises (a 10 cruise by 27species matrix) revealed strong seasonal effects. AllJune cruises (except 1998) clustered together, withJune 2001 and 2002 showing very similar species com-position (Fig. 5A). The June 1998 nekton communitywas most similar to the September communities, espe-cially September 1998, possibly due to the effects ofthe strong El Niño that year. A similar analysis usingthe original matrix, which included all rare species,yielded similar results (not shown). In that analysis,September 2002 formed its own group owing to theoccurrence of several rare taxa captured only duringthat cruise.
Cutting the species cluster dendrogram for the trans-posed full matrix (27 species by 387 hauls) with about30% information remaining resulted in 7 speciescluster groups (A to G, Fig. 5B). The cluster analysis ofspecies showed a high degree of association for somesalmon species with each other and with other taxa(Fig. 5B). In particular, subyearling Chinook salmonwere associated with surf smelt, American shad, starryflounder and Pacific herring (cluster G). YearlingChinook and coho salmon and adult Chinook and cohosalmon also clustered together (cluster D) as did juve-nile chum and sockeye salmon (cluster F). Other no-table associations included northern anchovy, Pacifichake, whitebait smelt, and Pacific sanddab (cluster A),Pacific sardine and chub mackerel (cluster C), and jackmackerel, blue shark, ocean sunfish, Pacific saury, andjuvenile sablefish (cluster B) (Fig. 5B).
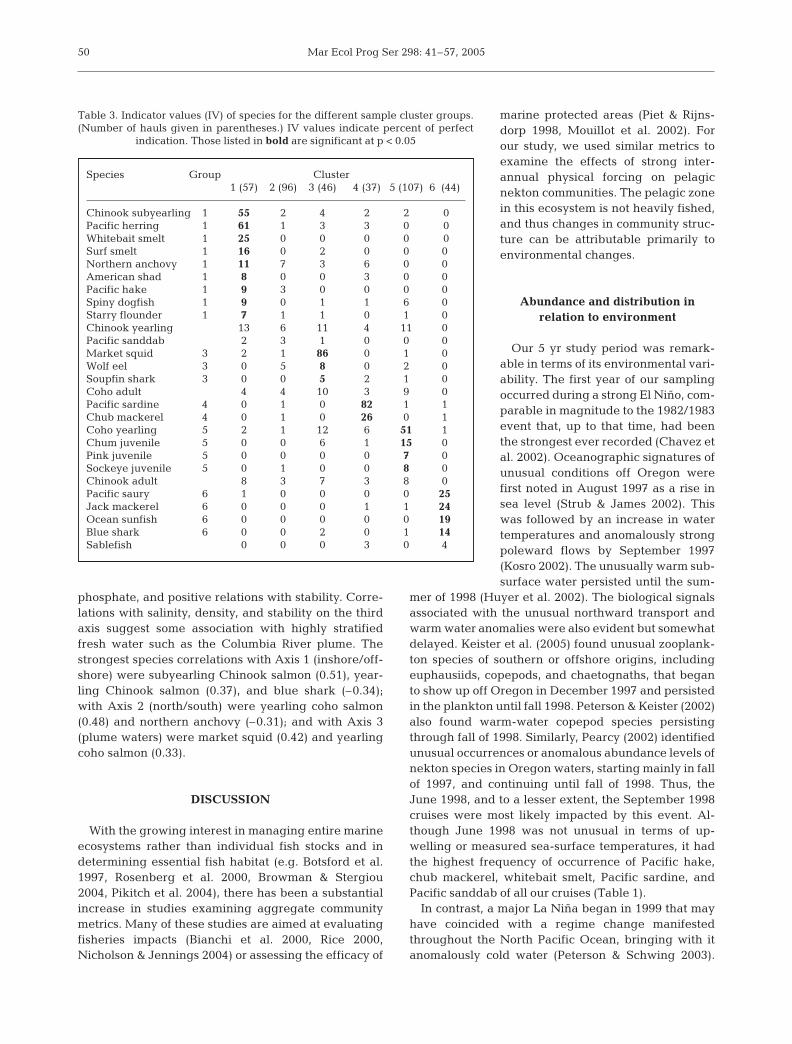
Cutting the sample cluster dendrogram for the fulldata set (387 hauls by 27 species) with 13% informa-tion remaining resulted in 6 sample groups. Indicatorvalues of the different species for the different clustergroups (p < 0.05 in bold) are shown in Table 3. Of the27 taxa, 22 were significant indicators of at least 1group, and all but cluster group 2 had at least 1 signif-icant indicator species. Some species, notably yearlingand adult Chinook salmon and adult coho salmonshowed similar affinities to all the cluster groups(except 6) and were not determined to be an indicatorspecies of any 1 cluster (Table 3). These indicator spe-cies groups were similar to the cluster species groupsfor the different sample clusters (Table 3, Fig. 5B). Spe-cies clusters A and G comprised mainly species thatwere significant indicators for sample cluster 1, andspecies clusters B, C, and E comprised mainly speciesthat were significant indicators for sample clusters 6, 4,and 3, respectively. Species clusters D and F comprisedmainly salmon, some of which were significant indica-tors for sample cluster 5 (Fig. 5B).
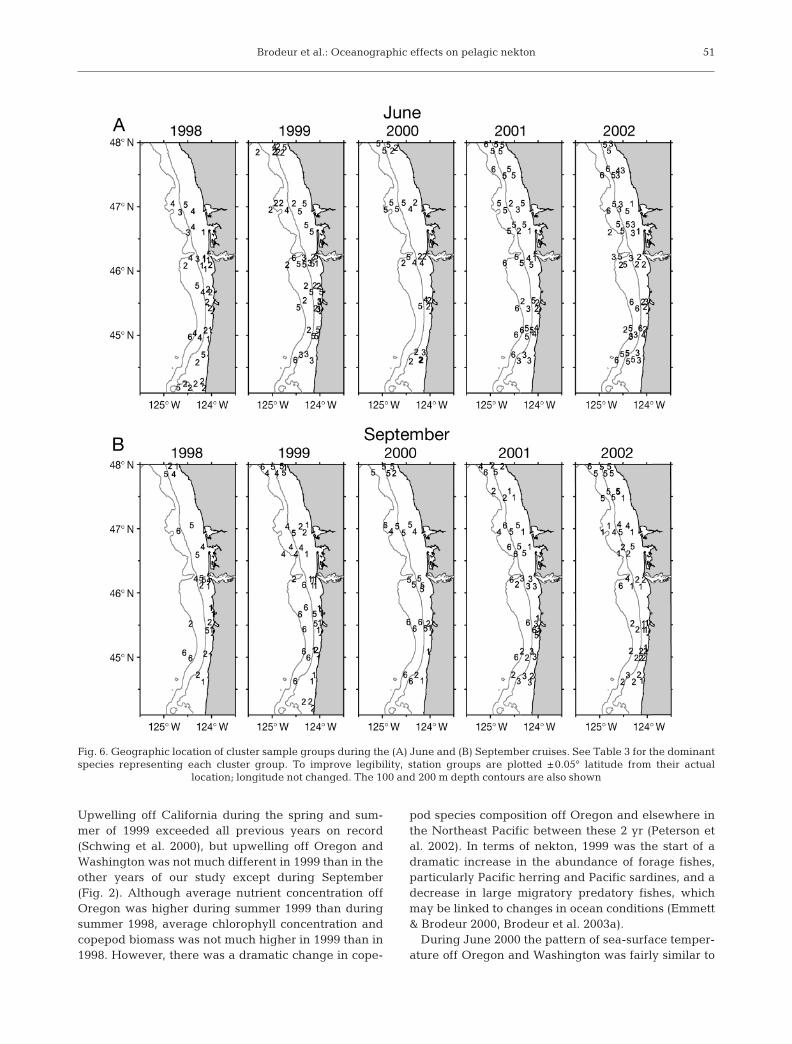
Maps showing the geographic distributions of thesample cluster groups in each cruise are shown in
47
Fig. 4. Mean abundance km–1 towed of the dominant 12nekton species by cruise for (A) species which were re-presented by catches >5 fish km–1 towed and (B) species re-presented by ≤5 fish km–1 towed. All age classes of Chinookand coho salmon are combined for this figure. No specieswere caught at densities >5 fish km–1 in September 2002
Mar Ecol Prog Ser 298: 41–57, 2005
Fig. 6 and the percent occurrence of each cluster bycruise along with some mean environmental variablesare given in Table 4. Cluster group 1 occurred mainlyinshore at low surface temperatures (Table 4). It wasabsent in June 2000 and occurred more frequently inSeptember (44 occurrences) than June (14 occur-rences). The strongest indicator species for cluster
group 1 were subyearling Chinook salmon and Pacificherring, although both smelt species, American shad,Pacific hake, spiny dogfish, and starry flounder werealso significant indicators of this group (Table 3). Clus-ter group 2 was a large, heterogeneous grouping withno significant indicator species and showed relativelylittle cohesion in its distribution pattern, since itoccurred in all cruises and areas. Cluster group 3 wasgenerally found inshore to mid-shelf, occurred muchmore during June than September, with the exceptionof 2001, and was represented most strongly by marketsquid (Table 3). It was associated with the lowest meansalinity (Table 4). Although it included species such asjuvenile and adult coho salmon which may be associ-ated with the plume at relatively high, but insignificantIVs, the species that were significant indicators are notgenerally known to be associated with the plume.Cluster group 4 was usually found from the middle toouter shelf, most frequently off Washington, and itsindicator species were Pacific sardine and chub mack-erel, species that migrate northward seasonally fromoff California. Cluster group 5 was found across muchof the shelf, occurred most frequently off Washington,and had the northernmost mean latitude (Fig. 6,
48
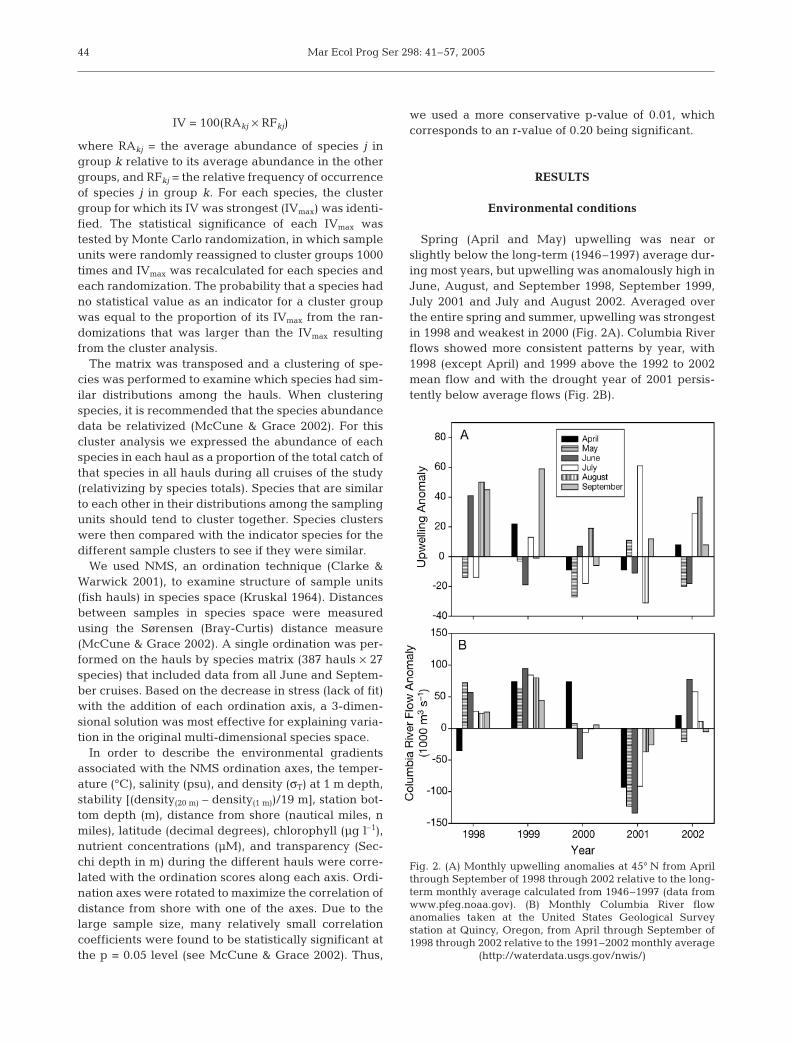
Common name Scientific name Jun 98 Sep 98 Jun 99 Sep 99 Jun 00 Sep 00 Jun 01 Sep 01 Jun 02 Sep 02
Market squid Loligo opalescens 40 10 34 6 21 0 21 36 47 17Spiny dogfish Squalus acanthias 20 10 14 12 7 0 8 11 13 13Soupfin shark Galeorhinus zyopterus 10 0 0 4 11 0 0 0 11 2Blue shark Prionace glauca 5 2 0 2 0 0 31 9 2 9American shad Alosa sapidissima 8 5 0 4 4 0 6 2 4 0Pacific herring Clupea pallasi 43 19 16 34 18 14 17 34 17 43Pacific sardine Sardinops sagax 40 19 10 30 21 18 19 18 23 19Northern anchovy Engraulis mordax 25 17 8 10 21 4 13 21 13 38Chinook salmon (s) Oncorhynchus tshawytscha 25 24 8 50 29 29 13 32 38 51Chinook salmon (y) Oncorhynchus tshawytscha 33 14 60 24 50 32 27 18 53 36Chinook salmon (a) Oncorhynchus tshawytscha 33 12 20 8 36 11 29 16 38 26Coho salmon (y) Oncorhynchus kisutch 25 19 62 30 46 68 67 39 62 34Coho salmon (a) Oncorhynchus kisutch 15 5 10 8 36 18 35 46 40 28Chum salmon Oncorhynchus keta 0 2 8 10 4 11 40 5 34 9Pink salmon Oncorhynchus nerka 0 0 0 0 0 7 0 0 0 19Sockeye salmon Oncorhynchus gorbuscha 0 0 4 0 4 4 17 0 8 0Surf smelt Hypomesus pretiosus 8 0 0 16 11 0 4 5 11 2Whitebait smelt Allosmerus elongatus 20 19 0 2 0 0 2 7 0 2Pacific hake Merluccius productus 33 10 4 0 0 0 0 0 2 0Pacific saury Cololabis saira 0 0 0 0 0 7 13 7 9 15Sablefish Anoplopoma fimbria 0 0 0 8 0 18 4 0 0 9Wolf eel Anarrhichthys ocellatus 5 0 48 0 7 4 10 5 8 0Jack mackerel Trachurus symetricus 8 7 14 14 11 4 2 11 11 6Chub mackerel Scomber japonicus 28 2 4 8 0 11 8 7 2 2Starry flounder Platichthys stellatus 3 2 6 10 7 4 6 2 6 0Pacific sanddab Citharichthys sordidus 13 2 8 0 0 4 2 5 2 4Ocean sunfish Mola mola 0 2 0 4 0 11 4 18 0 4
Number of collections 40 42 50 50 28 28 48 44 53 47
Table 1. Percent frequency of occurrence of the 27 most frequent species/life history stages by cruise used in the multivariate analyses. Chinook and coho salmon are separated by life history stage. s: subyearling; y: yearling; a: subadult or adult
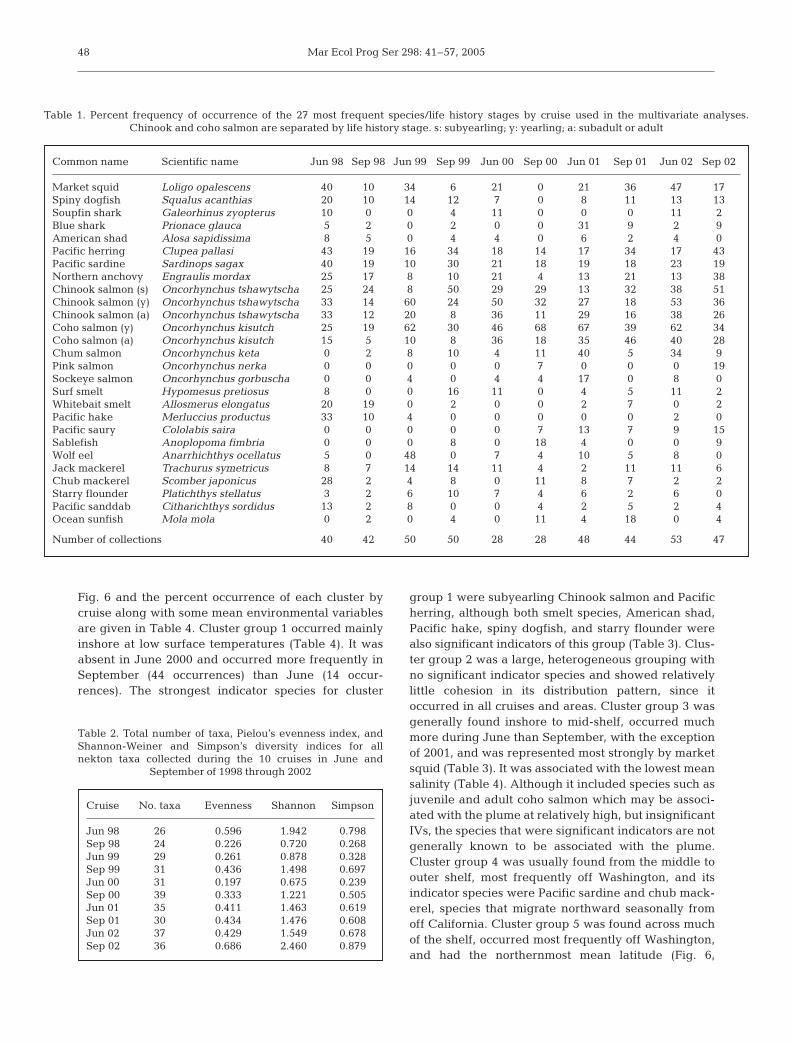
Cruise No. taxa Evenness Shannon Simpson
Jun 98 26 0.596 1.942 0.798Sep 98 24 0.226 0.720 0.268Jun 99 29 0.261 0.878 0.328Sep 99 31 0.436 1.498 0.697Jun 00 31 0.197 0.675 0.239Sep 00 39 0.333 1.221 0.505Jun 01 35 0.411 1.463 0.619Sep 01 30 0.434 1.476 0.608Jun 02 37 0.429 1.549 0.678Sep 02 36 0.686 2.460 0.879
Table 2. Total number of taxa, Pielou’s evenness index, andShannon-Weiner and Simpson’s diversity indices for allnekton taxa collected during the 10 cruises in June and
September of 1998 through 2002
Brodeur et al.: Oceanographic effects on pelagic nekton
Table 4). Its strongest indicator species was yearlingcoho salmon, but juvenile chum, pink, and sockeyesalmon were also significant indicators (Table 3).Cluster group 6 (Pacific saury, ocean sunfish, northernanchovy, and jack mackerel) was usually found fartheroffshore than other cluster groups, at the highest sea-surface temperatures and salinities, and was generallyfound along all transects.
Ordination analysis
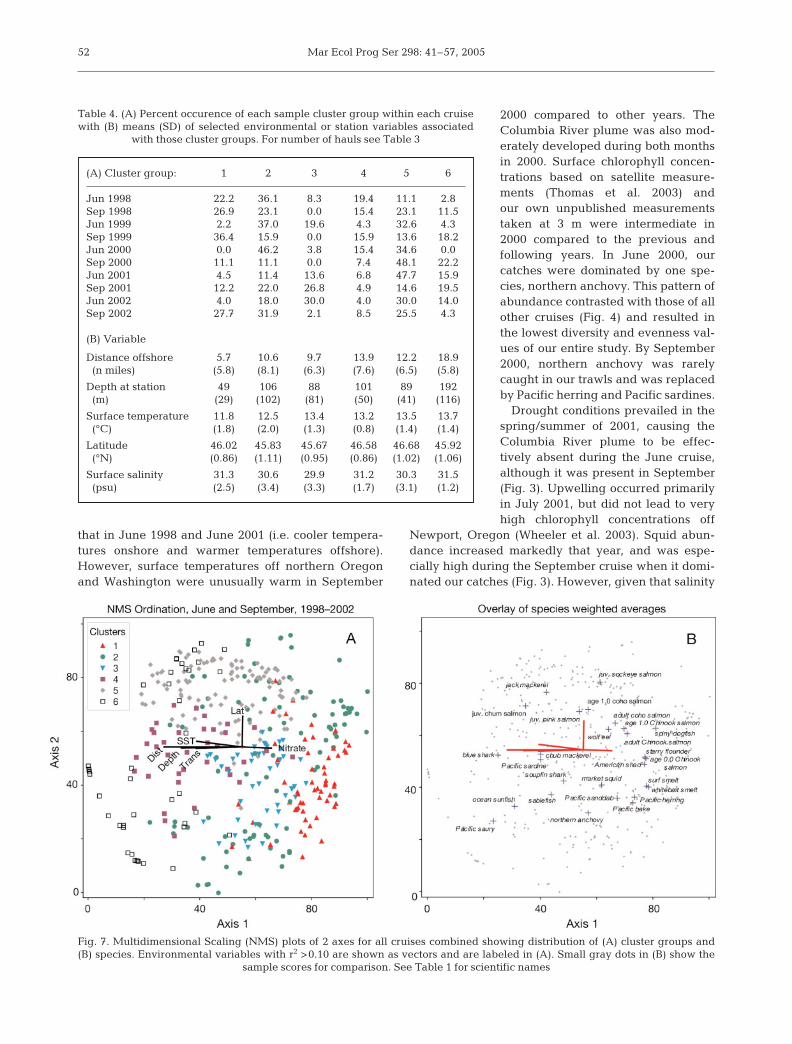
Joint-plots overlaid with the cluster groups areshown for 2 of the 3 axes from the NMS ordination ofsamples (Fig. 7A), and similarly for the species cen-troids (Fig. 7B). Environmental variables that explainat least 10% of the variance in the sample ordinationscores (r2 ≥ 0.10) are shown as vectors. Although the
stress (lack of fit) was high (22.51), stabilitywas good (0.0001) and the results appearedto be quite interpretable ecologically. Varia-tion in distances between samples in the 3-dimensional ordination space explainedabout 55% of the variation in distancesbetween samples in the original 27-dimen-sional species space. The proportion of theoriginal variation explained by each of theordination axes (r2) was (1) 0.184, (2) 0.188,(3) 0.179 (total = 0.552).
Sample cluster groups occupied fairly dis-tinct regions of the ordination, except forsample cluster group 2, which was broadlydistributed over much of the space definedby the first 2 ordination axes (Fig. 7A). Notsurprisingly, the centroids for the differentspecies in the 2-dimensional ordinationsspace are found near the positions of thesample cluster groups for which they areindicators (compare Fig. 7 and Table 3).Positions of cluster groups and species cen-troids indicated an inshore distribution forcluster 1 and its indicator species, anortherly and broad cross-shelf distributionfor group 5 and its indicator species, and anoffshore distribution for group 6 and its indi-cator species (Fig. 7 and Table 3).
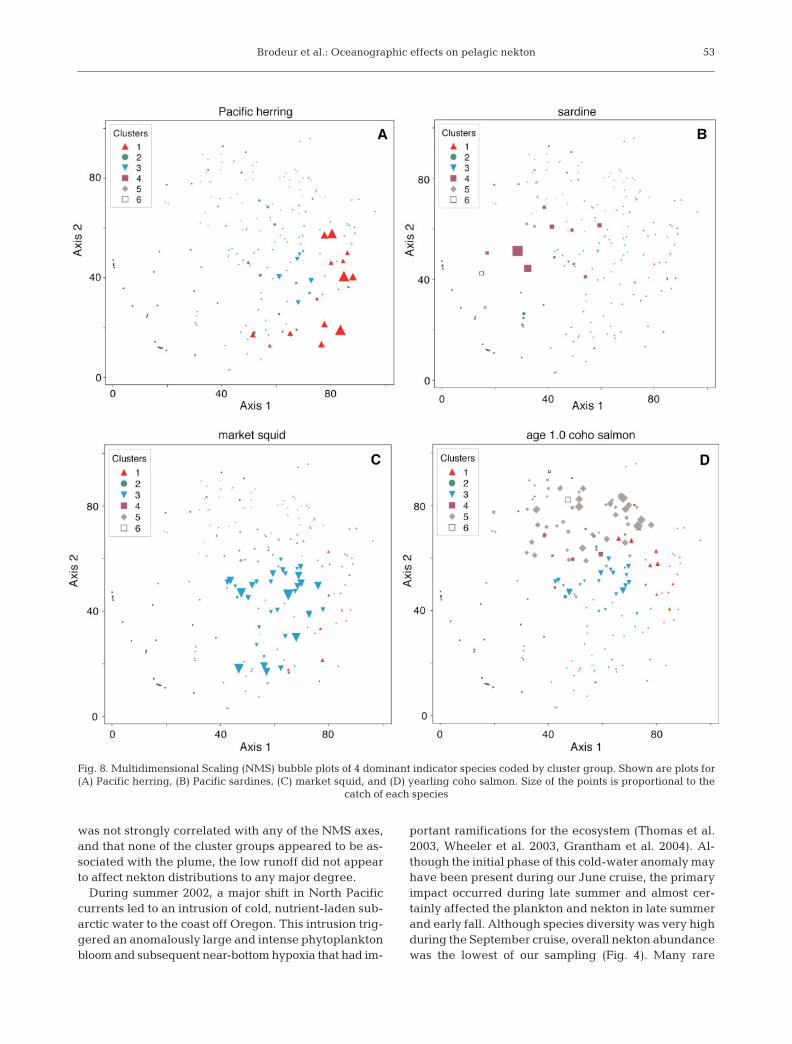
Species with the highest IVs (Pacific her-ring, Pacific sardines, market squid, andyearling coho salmon) showed strong sepa-ration in multivariate space (Fig. 8). Monthand years did not separate well by NMS (notshown), suggesting some substantial over-lap in species composition on a temporalbasis, although sample cluster group 1, forwhich subyearling Chinook salmon was an
important component, usually occurred more fre-quently in September than June (Table 4). SubyearlingChinook salmon leave their natal rivers and enter theocean throughout the summer and usually are moreabundant off Oregon and Washington in Septemberthan in June.
Moderately strong correlations with environmentalvariables occurred for all 3 axes, although those withAxis 1 were the strongest (Table 5). Axis 1 was nega-tively correlated with distance from shore, bottomdepth, temperature and transparency and was posi-tively correlated with chlorophyll and several macro-nutrients. This suggests that the first axis of the ordina-tion reflected mainly differences in inshore/offshoredistributions of the different species (Table 4). Axis 2was positively correlated only with latitude, whichwould indicate a north/south effect. Axis 3 showedweaker negative associations with density, salinity,
49
Information Remaining (%) 100 75 50 25 0
Northern anchovy Pacific hake Whitebait smelt Pacific sanddab Jack mackerel Blue shark Pink salmonOcean sunfishPacific saury Sablefish Soupfin shark Pacific sardine Chub mackerelChinook yearling Coho yearlingChinook adult Coho adult Spiny dogfish Market squid WolfeelChum salmonSockeye salmon Chinook subyearling Surf smelt American shadStarry flounderPacific herring
Information Remaining (%) 100 75 50 25 0
Jun 98 Sep 98Sep 99 Sep 00Sep 01Sep 02Jun 99Jun 01 Jun 02 Jun 00
A
B
A
B
C
D
E
F
G
Fig. 5. (A) Results of cluster analysis using a 10 cruise by 27 non-rarespecies matrix (abundance data pooled by cruise) showing relationshipsamong the individual cruises. (B) Cluster analysis showing relationshipsamong the dominant species for all cruises combined. Dashed lines indi-cate the cutoff levels for each cluster group. Species groupings identified
are labeled A–G. See Table 1 for scientific names
Mar Ecol Prog Ser 298: 41–57, 2005
phosphate, and positive relations with stability. Corre-lations with salinity, density, and stability on the thirdaxis suggest some association with highly stratifiedfresh water such as the Columbia River plume. Thestrongest species correlations with Axis 1 (inshore/off-shore) were subyearling Chinook salmon (0.51), year-ling Chinook salmon (0.37), and blue shark (–0.34);with Axis 2 (north/south) were yearling coho salmon(0.48) and northern anchovy (–0.31); and with Axis 3(plume waters) were market squid (0.42) and yearlingcoho salmon (0.33).
DISCUSSION
With the growing interest in managing entire marineecosystems rather than individual fish stocks and indetermining essential fish habitat (e.g. Botsford et al.1997, Rosenberg et al. 2000, Browman & Stergiou2004, Pikitch et al. 2004), there has been a substantialincrease in studies examining aggregate communitymetrics. Many of these studies are aimed at evaluatingfisheries impacts (Bianchi et al. 2000, Rice 2000,Nicholson & Jennings 2004) or assessing the efficacy of
marine protected areas (Piet & Rijns-dorp 1998, Mouillot et al. 2002). Forour study, we used similar metrics toexamine the effects of strong inter-annual physical forcing on pelagicnekton communities. The pelagic zonein this ecosystem is not heavily fished,and thus changes in community struc-ture can be attributable primarily toenvironmental changes.
Abundance and distribution inrelation to environment
Our 5 yr study period was remark-able in terms of its environmental vari-ability. The first year of our samplingoccurred during a strong El Niño, com-parable in magnitude to the 1982/1983event that, up to that time, had beenthe strongest ever recorded (Chavez etal. 2002). Oceanographic signatures ofunusual conditions off Oregon werefirst noted in August 1997 as a rise insea level (Strub & James 2002). Thiswas followed by an increase in watertemperatures and anomalously strongpoleward flows by September 1997(Kosro 2002). The unusually warm sub-surface water persisted until the sum-
mer of 1998 (Huyer et al. 2002). The biological signalsassociated with the unusual northward transport andwarm water anomalies were also evident but somewhatdelayed. Keister et al. (2005) found unusual zooplank-ton species of southern or offshore origins, includingeuphausiids, copepods, and chaetognaths, that beganto show up off Oregon in December 1997 and persistedin the plankton until fall 1998. Peterson & Keister (2002)also found warm-water copepod species persistingthrough fall of 1998. Similarly, Pearcy (2002) identifiedunusual occurrences or anomalous abundance levels ofnekton species in Oregon waters, starting mainly in fallof 1997, and continuing until fall of 1998. Thus, theJune 1998, and to a lesser extent, the September 1998cruises were most likely impacted by this event. Al-though June 1998 was not unusual in terms of up-welling or measured sea-surface temperatures, it hadthe highest frequency of occurrence of Pacific hake,chub mackerel, whitebait smelt, Pacific sardine, andPacific sanddab of all our cruises (Table 1).
In contrast, a major La Niña began in 1999 that mayhave coincided with a regime change manifestedthroughout the North Pacific Ocean, bringing with itanomalously cold water (Peterson & Schwing 2003).
50
Species Group Cluster1 (57) 2 (96) 3 (46) 4 (37) 5 (107) 6 (44)
Chinook subyearling 1 55 2 4 2 2 0Pacific herring 1 61 1 3 3 0 0Whitebait smelt 1 25 0 0 0 0 0Surf smelt 1 16 0 2 0 0 0Northern anchovy 1 11 7 3 6 0 0American shad 1 8 0 0 3 0 0Pacific hake 1 9 3 0 0 0 0Spiny dogfish 1 9 0 1 1 6 0Starry flounder 1 7 1 1 0 1 0Chinook yearling 13 6 11 4 11 0Pacific sanddab 2 3 1 0 0 0Market squid 3 2 1 86 0 1 0Wolf eel 3 0 5 8 0 2 0Soupfin shark 3 0 0 5 2 1 0Coho adult 4 4 10 3 9 0Pacific sardine 4 0 1 0 82 1 1Chub mackerel 4 0 1 0 26 0 1Coho yearling 5 2 1 12 6 51 1Chum juvenile 5 0 0 6 1 15 0Pink juvenile 5 0 0 0 0 7 0Sockeye juvenile 5 0 1 0 0 8 0Chinook adult 8 3 7 3 8 0Pacific saury 6 1 0 0 0 0 25Jack mackerel 6 0 0 0 1 1 24Ocean sunfish 6 0 0 0 0 0 19Blue shark 6 0 0 2 0 1 14Sablefish 0 0 0 3 0 4
Table 3. Indicator values (IV) of species for the different sample cluster groups.(Number of hauls given in parentheses.) IV values indicate percent of perfect
indication. Those listed in bold are significant at p < 0.05
Brodeur et al.: Oceanographic effects on pelagic nekton
Upwelling off California during the spring and sum-mer of 1999 exceeded all previous years on record(Schwing et al. 2000), but upwelling off Oregon andWashington was not much different in 1999 than in theother years of our study except during September(Fig. 2). Although average nutrient concentration offOregon was higher during summer 1999 than duringsummer 1998, average chlorophyll concentration andcopepod biomass was not much higher in 1999 than in1998. However, there was a dramatic change in cope-
pod species composition off Oregon and elsewhere inthe Northeast Pacific between these 2 yr (Peterson etal. 2002). In terms of nekton, 1999 was the start of adramatic increase in the abundance of forage fishes,particularly Pacific herring and Pacific sardines, and adecrease in large migratory predatory fishes, whichmay be linked to changes in ocean conditions (Emmett& Brodeur 2000, Brodeur et al. 2003a).
During June 2000 the pattern of sea-surface temper-ature off Oregon and Washington was fairly similar to
51
Fig. 6. Geographic location of cluster sample groups during the (A) June and (B) September cruises. See Table 3 for the dominantspecies representing each cluster group. To improve legibility, station groups are plotted ±0.05° latitude from their actual
location; longitude not changed. The 100 and 200 m depth contours are also shown
Mar Ecol Prog Ser 298: 41–57, 2005
that in June 1998 and June 2001 (i.e. cooler tempera-tures onshore and warmer temperatures offshore).However, surface temperatures off northern Oregonand Washington were unusually warm in September
2000 compared to other years. TheColumbia River plume was also mod-erately developed during both monthsin 2000. Surface chlorophyll concen-trations based on satellite measure-ments (Thomas et al. 2003) andour own unpublished measurementstaken at 3 m were intermediate in2000 compared to the previous andfollowing years. In June 2000, ourcatches were dominated by one spe-cies, northern anchovy. This pattern ofabundance contrasted with those of allother cruises (Fig. 4) and resulted inthe lowest diversity and evenness val-ues of our entire study. By September2000, northern anchovy was rarelycaught in our trawls and was replacedby Pacific herring and Pacific sardines.
Drought conditions prevailed in thespring/summer of 2001, causing theColumbia River plume to be effec-tively absent during the June cruise,although it was present in September(Fig. 3). Upwelling occurred primarilyin July 2001, but did not lead to veryhigh chlorophyll concentrations off
Newport, Oregon (Wheeler et al. 2003). Squid abun-dance increased markedly that year, and was espe-cially high during the September cruise when it domi-nated our catches (Fig. 3). However, given that salinity
52
(A) Cluster group: 1 2 3 4 5 6
Jun 1998 22.2 36.1 8.3 19.4 11.1 2.8Sep 1998 26.9 23.1 0.0 15.4 23.1 11.5Jun 1999 2.2 37.0 19.6 4.3 32.6 4.3Sep 1999 36.4 15.9 0.0 15.9 13.6 18.2Jun 2000 0.0 46.2 3.8 15.4 34.6 0.0Sep 2000 11.1 11.1 0.0 7.4 48.1 22.2Jun 2001 4.5 11.4 13.6 6.8 47.7 15.9Sep 2001 12.2 22.0 26.8 4.9 14.6 19.5Jun 2002 4.0 18.0 30.0 4.0 30.0 14.0Sep 2002 27.7 31.9 2.1 8.5 25.5 4.3
(B) Variable
Distance offshore 5.7 10.6 9.7 13.9 12.2 18.9(n miles) (5.8) (8.1) (6.3) (7.6) (6.5) (5.8)
Depth at station 49 106 88 101 89 192(m) (29) (102) (81) (50) (41) (116)
Surface temperature 11.8 12.5 13.4 13.2 13.5 13.7(°C) (1.8) (2.0) (1.3) (0.8) (1.4) (1.4)
Latitude 46.02 45.83 45.67 46.58 46.68 45.92(°N) (0.86) (1.11) (0.95) (0.86) (1.02) (1.06)
Surface salinity 31.3 30.6 29.9 31.2 30.3 31.5(psu) (2.5) (3.4) (3.3) (1.7) (3.1) (1.2)
Table 4. (A) Percent occurence of each sample cluster group within each cruisewith (B) means (SD) of selected environmental or station variables associated
with those cluster groups. For number of hauls see Table 3
Fig. 7. Multidimensional Scaling (NMS) plots of 2 axes for all cruises combined showing distribution of (A) cluster groups and(B) species. Environmental variables with r2 >0.10 are shown as vectors and are labeled in (A). Small gray dots in (B) show the
sample scores for comparison. See Table 1 for scientific names
Brodeur et al.: Oceanographic effects on pelagic nekton
was not strongly correlated with any of the NMS axes,and that none of the cluster groups appeared to be as-sociated with the plume, the low runoff did not appearto affect nekton distributions to any major degree.
During summer 2002, a major shift in North Pacificcurrents led to an intrusion of cold, nutrient-laden sub-arctic water to the coast off Oregon. This intrusion trig-gered an anomalously large and intense phytoplanktonbloom and subsequent near-bottom hypoxia that had im-
portant ramifications for the ecosystem (Thomas et al.2003, Wheeler et al. 2003, Grantham et al. 2004). Al-though the initial phase of this cold-water anomaly mayhave been present during our June cruise, the primaryimpact occurred during late summer and almost cer-tainly affected the plankton and nekton in late summerand early fall. Although species diversity was very highduring the September cruise, overall nekton abundancewas the lowest of our sampling (Fig. 4). Many rare
53
Fig. 8. Multidimensional Scaling (NMS) bubble plots of 4 dominant indicator species coded by cluster group. Shown are plots for(A) Pacific herring, (B) Pacific sardines, (C) market squid, and (D) yearling coho salmon. Size of the points is proportional to the
catch of each species
Mar Ecol Prog Ser 298: 41–57, 2005
species occurred only during this cruise (e.g. rock soleLepidopsetta bilineata, butterfish Peprilus similis, andking-of-the-salmon Trachipterus altivelis). However,many of the common schooling pelagic forage fishessuch as Pacific herring, Pacific sardine, smelts, andnorthern anchovy were absent or in low abundance.
Nekton habitat and community structure
Our community analyses suggested that there aregroups of species that occur in similar water types, andthese types are present in summer and fall during mostyears, although notable exceptions occurred. Seasonalshifts occur as migratory species enter the area from thesouth (Pacific hake, Pacific sardines, jack and chubmackerels), from offshore (Pacific saury and sharks), orfrom freshwater habitats (juvenile coho and Chinooksalmon) that may dramatically alter the pelagic nektonspecies mix over the course of a summer. In a similarfashion, interannual differences in the strength of theCalifornia Current may affect the occurrence patterns offish that inhabit more northern or southern latitudes(Brodeur et al. 2003a). Temperature appears to be an im-portant variable regulating habitat suitability for speciessuch as Pacific sardines (Emmett et al. in press) as muchof the newly upwelled water in this region is below theirthermal preferendum. Conversely, juvenile salmon areoften restricted to the nearshore habitats where the tem-peratures are appreciably cooler (Brodeur et al. 2004).
The strongest gradients in sea-surface temperatureusually occur across the shelf in this region (Fig. 3).The width of the upwelling band of cold temperatures
and generally high productivity varies from year toyear and seasonally. Comparing our results with otherstudies of the community structure of plankton andnekton, we conclude that in this upwelling region,inshore/offshore gradients tend to dominate overnorth/south gradients. Based on 3 yr of zooplanktonsampling off Oregon, Morgan et al. (2003) foundsignificant differences between inshore and offshorecopepod communities during each year. Similar pat-terns were observed for neuston and total water col-umn zooplankton communities off southern Oregonand northern California (Peterson & Keister 2002,Reese et al. 2005). In addition, ichthyoplankton com-munities show strong inshore/offshore structure thatmay reflect the habitats of the spawning adults (Doyleet al. 2002 and references therein).
The situation for pelagic nekton is not as clear. In ananalysis of purse seine collections off Oregon andWashington in 1985, Brodeur et al. (2003b), observeddifferent results using 2 different classification tech-niques, a cluster analysis, similar to that used in thispaper, and Two-way Indicator Species Analysis orTWINSPAN. Sample groups based on the TWINSPANanalysis indicated pronounced inshore/offshore pat-terns, whereas those based on cluster analysis pro-duced more north/south groupings. Latitude (r = –0.65)and longitude (r = 0.36) were most highly correlatedwith Detrended Correspondence Analysis (DCA) ordi-nation axes 1 and 2, respectively (Brodeur et al.2003b). In sampling similar to the present study but insouthern Oregon and northern California, Brodeur etal. (2004) found both inshore/offshore and north/southgroupings, the latter affected by strong differences intopography and a coastal cape that affected shelfcirculation. Depth/temperature and salinity in thismore southern region were strongly correlated withordination axes.
Although there is some indication that the ColumbiaRiver plume may affect the distributions of some spe-cies of nekton, the results are equivocal overall.Although surface temperature and chlorophyll aregenerally higher in the plume than in adjacentupwelled waters, they are not a strong indicator ofplume waters. In addition to salinity, the best signa-tures of plume waters are macronutrients such as sili-cate and nitrate (Hill & Wheeler 2002, Morgan et al. inpress), but since the nutrients are affected by biologi-cal activity and can be taken up by the biota withincreased ocean residence time, they are not usefulmeasures of the plume as it spreads along the coast.
Our approach in this paper was to analyze all samplesfrom all cruises together in a single multivariate analy-sis. Hence, a particular cluster group would be consis-tent in its membership among the different cruises, andthe occurrence and distribution of different cluster
54
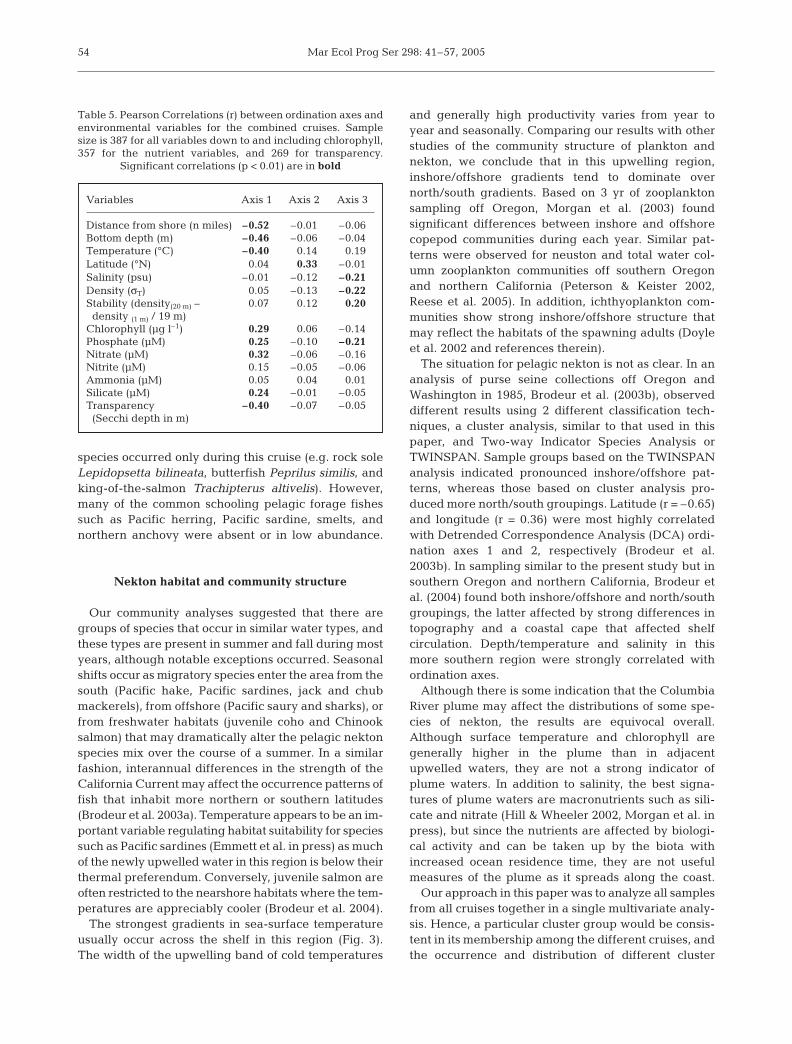
Variables Axis 1 Axis 2 Axis 3
Distance from shore (n miles) –0.52 –0.01 –0.06Bottom depth (m) –0.46 –0.06 –0.04Temperature (°C) –0.40 0.14 0.19Latitude (°N) 0.04 0.33 –0.01Salinity (psu) –0.01 –0.12 –0.21Density (σT) 0.05 –0.13 –0.22Stability (density(20 m) – 0.07 0.12 0.20density (1 m) / 19 m)
Chlorophyll (µg l–1) 0.29 0.06 –0.14Phosphate (µM) 0.25 –0.10 –0.21Nitrate (µM) 0.32 –0.06 –0.16Nitrite (µM) 0.15 –0.05 –0.06Ammonia (µM) 0.05 0.04 0.01Silicate (µM) 0.24 –0.01 –0.05Transparency –0.40 –0.07 –0.05(Secchi depth in m)
Table 5. Pearson Correlations (r) between ordination axes andenvironmental variables for the combined cruises. Samplesize is 387 for all variables down to and including chlorophyll,357 for the nutrient variables, and 269 for transparency.
Significant correlations (p < 0.01) are in bold
Brodeur et al.: Oceanographic effects on pelagic nekton
groups could be examined in relation to environmentalconditions during each cruise. A drawback to this ap-proach was the substantial variability in catches be-tween years and months, which led to high multivariatestress (lack of fit) levels. We initially tried other ways ofgrouping the data by individual cruises (10 differentanalyses) and grouping by month (2 different analyses).The amount of variance explained was greater (range0.669 to 0.806) and the stress was smaller (13.48 to16.88) for analyses of individual cruises than for theanalyses of data pooled across the years (0.560 to 0.605and 21.43 to 21.50, respectively). We also tried a datatransformation called Beals smoothing, which reducesthe noise and enhances the dominant trends (McCune& Grace, 2002). For NMS on the entire data set(387 samples by 27 species), Beals smoothing greatlydecreased the stress (10.73) and increased the varianceexplained (93.6%). However, almost all of the variance(>86%) was explained by the first axis, which washighly correlated with distance offshore and tempera-ture. Since Beals smoothing tends to highlight ‘habitatfavorability’ for the different species, it can distortor mask temporal changes in community structurecaused, for example, by fish migration (e.g. the entry ofjuvenile salmon into the ocean or their migrations in theocean). Thus, we concluded that NMS of the pooleddata without Beals smoothing was the most reasonableand ecologically interpretable method despite theinherently high variability.
Implications for continued studies and management
The pelagic environment off Oregon is extremelydynamic, and faster-swimming nekton are probablyable to compensate for prevailing currents and remainin their preferred habitats. The exception may beyoung juvenile salmon, which are relatively weakswimmers and may have to traverse unfavorablenearshore habitats once they leave their natal streamsto get to regions of optimal marine conditions (Brodeuret al. 2004). The relationships between the distribu-tions of our species groups and environmental vari-ables suggest nekton have habitat preferences. How-ever, nekton species may actually have beenresponding to other biotic variables (type and quantityof prey available) that were not included in our analy-ses, but that may be correlated to some degree with thevariables we used. Future examination of the relation-ship between these nekton and their food resources isclearly warranted. Moreover, we used surface mea-surements in many cases, although the nekton caughtcould have been anywhere in the top 20 m of the watercolumn. While we assumed that our surface trawls arerepresentative of the nekton community, we under-
stand that some species occupy deeper layers duringthe day and only come up to the upper 15 m at night(Emmett et al. 2004). Also, large, fast-swimming nek-ton such as albacore tuna Thunnus alalunga are abun-dant in our sampling region during the warmer timeperiods but are able to avoid capture in our trawls.
An important corollary to these findings is that thepreferred habitat of pelagic nekton species off Oregonand Washington appears to expand and contract inrelation to the dynamic nature of the California Cur-rent and is driven by changing ocean conditions atboth seasonal and interannual periodicities. For exam-ple, the proportional occurrence of sample clustergroup 1, dominated by subyearling Chinook salmonand Pacific herring, varied from a low of 11 and 12.2%in September 2000 and 2001, respectively, to a high of36% in September 1999. Contrastingly, the propor-tional occurrence for sample cluster group 3, domi-nated by market squid, varied from a high of 27% inSeptember 2001 to a low of 0% in the same month dur-ing 1998, 1999, and 2000. For each pelagic clustergroup identified, significant variation in occurrenceoccurred between seasons and years, implying thattheir preferred habitat expands and contracts underdiffering environmental conditions.
The distribution of different pelagic fish groupings in3-dimensional quantitative space is explained largelyby north/south and onshore/offshore gradients.Although these metrics are not in themselves dynamic,they likely embody habitat features for each pelagicgroup that responded to the changing environmentalconditions encountered in the California Current dur-ing 1998 to 2002. Pelagic nekton species that respondto onshore/offshore or latitudinal gradients are likelyresponding to habitat characteristics that expand orcontract on seasonal and interannual time frames.Although sea-surface temperature, density, and salin-ity are physical variables that are included as mean-ingful determinants of habitat for pelagic species in theCalifornia Current, it is likely that other unmeasuredphysical and biological metrics are represented in thecross- and along-shelf gradients. The suite of physicaland biological metrics that define habitat features forpelagic species could be better described by devising acombined metric of ‘ocean conditions’ that capturesthe availability of suitable habitat for pelagic species.
Our study has provided a more complete under-standing of the habitats occupied by coastal pelagicfishes and may assist with management of these spe-cies. We have shown that many pelagic nekton overlapsubstantially in space and time, and this informationwill be useful in elucidating ecological (competitionand predation) and fishery (potential by-catch) interac-tions in this ecosystem and implementation of ecosys-tem-based management practices.
55
Mar Ecol Prog Ser 298: 41–57, 2005
Acknowledgements: We thank the captains and crew of thefishing and research vessels for their cooperation and assis-tance in the sampling. We acknowledge the assistance of themany NOAA Fisheries and OSU scientists in collecting andprocessing the data and in providing logistic support, includ-ing C. Bucher, S. Hinton, K. Jacobson, W. Peterson, T. Sandell,and R. Schabetsberger. We thank J. Keister, D. Reese, S. Pool,W. Pearcy, and an anonymous reviewer for critical reviews ofthe manuscript. Funding was provided by the BonnevillePower Administration and the Northeast Pacific GLOBECProgram and is contribution number 244 of the U.S. GLOBECProgram.
LITERATURE CITED
Bianchi G, Gislason H, Graham L, Hill L and 7 others (2000)Impact of fishing on size composition and diversity of dem-ersal fish communities. ICES J Mar Sci 57:558–571
Botsford LW, Castilla JC, Peterson CH (1997) The managementof fisheries and marine ecosystems. Science 277:509–515
Brodeur RD, Pearcy WG (1986) Distribution and relativeabundance of pelagic non-salmonid nekton off Oregonand Washington, 1979–1984. NOAA Tech Rep NMFS 46:1–85
Brodeur RD, Pearcy WG (1992) Effects of environmental vari-ability on trophic interactions and food web structure in apelagic upwelling ecosystem. Mar Ecol Prog Ser 84:101–119
Brodeur RD, Frost B, Hare SR, Francis RC, Ingraham WJ Jr(1996) Interannual variations in zooplankton biomass inthe Gulf of Alaska and covariations with California Cur-rent zooplankton biomass. Calif Coop Ocean Fish InvestigRep 37:81–99
Brodeur RD, Pearcy, WG, Ralston, S (2003a) Abundance anddistribution patterns of nekton and micronekton in theNorthern California Current Transition Zone. J Oceanogr59:415–434
Brodeur RD, Fisher JP, Ueno Y, Nagasawa K, Pearcy WG(2003b) An east-west comparison of the Transition Zonecoastal epipelagic nekton of the North Pacific Ocean. JOceanogr 59:515–535
Brodeur RD, Fisher, JP, Teel D, Emmett RL, Casillas E, MillerTW (2004) Distribution, growth, condition, origin andenvironmental and species associations of juvenile sal-monids in the Northern California Current. Fish Bull US102:25–46
Browman HI, Stergiou KI (2004) Perspectives on ecosystem-based approaches to the management of marineresources. Mar Ecol Prog Ser 274:269–303
Chavez FP, Collins CA, Huyer A, Mackas DL (eds) (2002)Observations of the 1997–1998 El Niño along the WestCoast of North America. Prog Oceanogr 54:1–511
Chavez FP, Ryan J, Lluch-Cota SE, Niquen M (2003) Fromanchovies to sardines and back: multidecadal change inthe Pacific Ocean. Science 299:217–221
Clarke KR, Warwick RM (2001) Change in marine communi-ties: an approach to statistical analysis and interpretation2nd edn. PRIMER-E Ltd, Plymouth
Doyle MJ, Mier KL, Busby MS, Brodeur, RD (2002) Regionalvariations in springtime ichthyoplankton assemblages inthe Northeast Pacific Ocean. Prog Oceanogr 53:247–281
Dufrene M, Legendre P (1997) Species assemblages andindicator species: the need for a flexible asymmetricalapproach. Ecol Monogr 67(3):345–366
Emmett RL, Brodeur RD (2000) The relationship betweenrecent changes in the pelagic nekton community off Ore-
gon and Washington and physical oceanographic condi-tions. Bull North Pac Anadr Fish Comm 2:11–20
Emmett RL, Brodeur RD, Orton P (2004) The vertical dis-tribution of juvenile salmon and associated fishes in theColumbia River Plume. Fish Oceanogr 13(5):392–402
Emmett RL, Brodeur RD, Miller TW, Pool SS, Bentley PJ,Krutzikowsky GK, McCrae J (in press) Pacific sardine(Sardinops sagax) abundance, distribution and ecologicalrelationships in the Pacific Northwest. Calif Coop OceanFish Investig Rep
Field JG, Clarke KR, Warwick RM (1982) A practical strategyfor analyzing multispecies distribution patterns. Mar EcolProg Ser 8:3752
Freeland HJ, Gatien G, Huyer A, Smith RL (2003) Cold halo-cline in the northern California Current: an invasion ofsubarctic water. Geophys Res Lett 30(3), 1141, doi:10.1029/2002GL016663
Grantham BA, Chan F, Nielsen KJ, Fox DS, Barth JA, HuyerJ, Lubchenco J, Menge BA (2004) Upwelling-drivennearshore hypoxia signals ecosystem and oceanographicchanges in the northeast Pacific. Nature 429:749–754
Hickey BM (1998) Coastal oceanography of western NorthAmerica from the tip of Baja California to VancouverIsland (coastal segment 8E). In: Robinson AR, Brink KH(eds) The sea, ideas and observations on progress in thestudy of the seas, Vol 11. The global coastal ocean:regional studies and syntheses. Interscience Publishers,New York, p 345–393
Hickey BM, Banas NS (2003) Oceanography of the U.S.Pacific Northwest coastal ocean and estuaries withapplication to coastal ecology. Estuaries 26(4B):1010–1031
Hill JK, Wheeler PA (2002) Organic carbon and nitrogen inthe northern California current system: comparison of off-shore, river plume, and coastally upwelled waters. ProgOceanogr 53:369–387
Huyer A, Smith RL, Fleischbein J (2002) The coastal ocean offOregon and Northern California during the 1997–8 ElNiño. Prog Oceanogr 54:311–341
Keister JE, Johnson TB, Morgan CA, Peterson WT (2005) Bio-logical indicators of the timing and direction of the warm-water advection during the 1997/98 El Niño off the centralOregon coast, USA. Mar Ecol Prog Ser 295:43–48
Kosro PM (2002) A poleward jet and an equatorward under-current observed off Oregon and northern California dur-ing the 1997–98 El Niño. Prog Oceanogr 54:343–360
Kruskal JB (1964) Nonmetric multidimensional scaling: anumerical method. Psychometrika 29:127
Krutzikowsky GK, Emmett RL (2005) Diel differences in sur-face trawl fish catches off Oregon and Washington. FishRes 71:365 – 371
Logerwell EA, Mantua N, Lawson PW, Francis RC, AgostiniVN (2003) Tracking environmental processes in the coastalzone for understanding and predicting Oregon coho(Oncorhynchus kisutch) marine survival. Fish Oceanogr12:554–568
Magurran, AE (1988) Ecological diversity and its measure-ment. Princeton University Press, Princeton, NJ
Mantua NJ, Hare SR, Zhang Y, Wallace JM, Francis RC(1997) A Pacific interdecadal climate oscillation withimpacts on salmon production. Bull Am Meteorol Soc 78:1069–1079
McCune B, Mefford MJ (1999) Multivariate analysis of eco-logical data, version 4.36 beta. MjM Software, GlenedenBeach, OR
McCune B, Grace JB (2002) Analysis of ecological communi-ties. MjM Software, Gleneden Beach, OR
McGowan JA, Cayan DR, Dorman LM (1998) Climate-ocean
56
Brodeur et al.: Oceanographic effects on pelagic nekton
variability and ecosystem response in the NortheastPacific. Science 281:210–217
Miller AJ, Chai F, Chiba S, Moisan JR, Neilson DJ (2004)Decadal-scale climate and ecosystem interactions in theNorth Pacific Ocean. J Oceanogr 60:163–188
Morgan CA, Peterson WT, Emmett RL (2003) Onshore-off-shore variations in copepod community structure off theOregon coast during the summer upwelling season. MarEcol Prog Ser 249:223–236
Morgan CA, DeRobertis A, Zabel RW (in press) ColumbiaRiver plume fronts: I. Hydrography, zooplankton distribu-tion, and community composition. Mar Ecol Prog Ser
Mouillot D, Culioli JM, Chi TD (2002) Indicator species analysisas a test of non-random distribution of species in the con-text of marine protected areas. Environ Cons 29:385–390
Nicholson MD, Jennings S (2004) Testing candidate indica-tors to support ecosystem-based management: the powerof monitoring surveys to detect temporal trends in fishcommunity metrics. ICES J Mar Sci 61:35–42
Pearcy WG (2002) Marine nekton off Oregon and the 1997–98El Niño. Progr Oceanogr 54: 399–403
Pearcy WG, Schoener A (1987) Changes in the marine biotacoincident with the 1982–1983 El Niño in the northeasternsubarctic Pacific Ocean. J Geophys Res 92 No. C13,14417–14428
Pearcy W, Fisher J, Brodeur R, Johnson S (1985) Effects of the1983 El Niño on coastal nekton off Oregon and Washing-ton. In: Wooster WS (ed) El Niño North: Niño effects in theEastern Subarctic Pacific Ocean, WSG-WO 85–3. Wash-ington Sea Grant Program, Seattle, WA, p 188–204
Peterson WT, Keister JE (2002) The effect of a large cape ondistribution patterns of coastal and oceanic copepods offOregon and northern California during the 1998–1999 ElNiño- La Niña. Progr Oceanogr 53:389–411
Peterson WT, Schwing FB (2003) A new climate regime innortheast Pacific ecosystems. Geophys Res Lett 30(17),1896, doi: 10.1029/2003GL017528
Peterson WT, Keister JE, Feinberg L (2002) The effects of the1997–1999 El Niño/La Niña events on hydrography and
zooplankton off the central Oregon coast. Progr Oceanogr54(1–4):381–398
Piet G, Rijnsdorp AD (1998) Changes in the demersal fishassemblage in the south-eastern North Sea following theestablishment of a protected area (‘plaice box’). ICES JMar Sci 55:420–429
Pikitch EK, Santora C, Babcock EA, Bakun A and 13 others(2004) Ecosystem-based fishery management. Science305:346–347
Reese DC, Miller TW, Brodeur RD (2005) Community struc-ture of near-surface zooplankton in the northern Califor-nia Current in relation to oceanographic conditions. Deep-Sea Res II 52:29–50
Rice JC (2000) Evaluating fishery impacts using metrics ofcommunity structure. ICES J Mar Sci 57:682–688
Rosenberg A, Bigford TE, Leathery S, Hill RL, Bickers K(2000) Ecosystem approaches to fishery managementthrough essential fish habitat. Bull Mar Sci 66:535–542
Scheuerell MD, Williams JG (2005) Forecasting climate-induced changes in the survival of Snake River spring/summer chinook salmon. Fish Oceanogr 14 (in press)
Schwing FB, Moore C, Ralston S, Sakuma KA (2000) Recordcoastal upwelling in the California Current in 1999. CalifCoop Ocean Fish Investig Rep 41:148–160
Schwing FB, Murphree T, de Witt L, Green P (2002) The evo-lution of oceanic and atmospheric anomalies in the North-east Pacific during the El Niño and La Niña events of1995–2001. Progr Oceanogr 54:459–491
Strub PT, James C (2002) Altimeter-derived surface circula-tion in the large-scale NE Pacific Gyres. Part 2:1997–1998El Niño anomalies. Prog Oceanogr 53:185–214
Thomas AC, Strub PT, Brickley P (2003) Anomalous satellite-measured chlorophyll concentrations in the northernCalifornia Current in 2001–2002. Geophys Res Lett 30(15),8022, doi: 10.1029/2003GL017409
Wheeler PA, Huyer A, Fleischbein J (2003) Cold halocline,increased nutrients and higher chlorophyll off Oregon in2002. Geophys Res Lett 30(15), 8021, doi: 10.1029/2003GL017395
57
Editorial responsibility: Kenneth Sherman (Contributing Editor), Narragansett, Rhode Island, USA
Submitted: October 7, 2004; Accepted: March 1, 2005 Proofs received from author(s): July 21, 2005
Related Documents