RESEARCH ARTICLE Speciation of atmospheric polycyclic aromatic hydrocarbons (PAHs) present during fog time collected submicron particles Dharmendra Kumar Singh 1 & Swati Sharma 2 & Gazala Habib 2 & Tarun Gupta 1 Received: 18 November 2014 /Accepted: 19 March 2015 # Springer-Verlag Berlin Heidelberg 2015 Abstract Airborne submicron particles (PM 1 ) were collected using PM 1 sampler during the fog-dominated days (December 2013–January 2014). PM 1 values varied between 58.12 μg/ m 3 and 198.75 μg/m 3 , and average mass concentration was 162.33±38.25 μg/m 3 while total average concentration of particle-associated polycyclic aromatic hydrocarbon (PAHs) determined was 616.31±30.31 ng/m 3 . This is a signal for an alarming high pollution level at this site situated in the Indo- Gangetic Plain (IGP). PAHs were extracted from filters using toluene and acetonitrile. Quantitative measurements of poly- cyclic aromatic hydrocarbons (PAHs) were carried out using the high performance liquid chromatography (HPLC) tech- nique. The extracts were analyzed for 16 target polycyclic aromatic hydrocarbons (PAHs) including carcinogenic com- pound benzo(a)pyrene (19.86±38.98 ng/m 3 ). Fluoranthene, benzo(a)anthracene, anthracene, and fluorene were the pre- dominant compounds found in the samples collected during foggy days. Based on number of rings, four-ring PAH com- pounds had maximum contribution (43 %) in this fog time collected submicron particles followed by three-ring (21 %), five-ring (20 %), six-ring (13 %), and two-ring (3 %), respec- tively. In winter and foggy days, wood and coal combustion and biomass burning also significantly contribute to the PAH levels. However, diagnostic ratio suggests diesel emissions as the prime source of PAHs at this sampling site. Keywords Polycyclic aromatic hydrocarbon . Foggy days . PM 1 . Benzo(a)pyrene . Fluoranthene . Diagnostic ratio Introduction Polycyclic aromatic hydrocarbons (PAHs) are a group of or- ganic compounds having two or more merged aromatic rings. The PAHs escape into the atmosphere mainly due to various anthropogenic activities with incomplete combustion of fuels being the most prominent one (Ravindra et al. 2008a, b). Unplanned increase in vehicular traffic, urban infrastructure, and rapid industrialization across the megacities of India, mainly over the Indo-Gangetic Plain (IGP) region has contrib- uted heavily towards very high loading of atmospheric partic- ulate matter (Prasad et al. 2013; Sharma et al. 2014). The chemical speciation of the ambient PM 2.5 and PM 10 has been carried out and reported by numerous researchers in the recent past (Pachauri et al. 2013). In addition, these studies have reported dominance of both natural (long distance transport of mineral dust) as well as anthropogenic aerosols (vehicular as well as industrial) within the Indian subcontinent for differ- ent seasons (Sharma et al. 2012; Ghosh et al. 2014). Some of PAHs are carcinogenic and mutagenic and some are related with chronic human health problems (Dallarosa et al. 2005; Fang et al. 2004a, b). Automobile exhaust is a major contributor to PAHs in urban areas (Velasco et al. 2004). Prime sources of atmospheric PAHs in urban air have been listed as motor vehicles (especially diesel engine vehi- cles), industrial-oil burning, home heating, and factories (Hayakawa et al. 1995; Mittal and Grieken 2001; Ho and Lee 2002; Park et al. 2002; Yang et al. 2002). Higher Responsible editor: Constantini Samara * Tarun Gupta [email protected] 1 Department of Civil Engineering & Atmospheric Particles Technology Laboratory at Center for Environmental Science and Engineering, Indian Institute of Technology Kanpur, Kanpur 208016, India 2 Department of Civil Engineering, Indian Institute of Technology Delhi, Hauz Khas, New Delhi 110016, India Environ Sci Pollut Res DOI 10.1007/s11356-015-4413-y

Welcome message from author
This document is posted to help you gain knowledge. Please leave a comment to let me know what you think about it! Share it to your friends and learn new things together.
Transcript

RESEARCH ARTICLE
Speciation of atmospheric polycyclic aromatic hydrocarbons(PAHs) present during fog time collected submicron particles
Dharmendra Kumar Singh1& Swati Sharma2 & Gazala Habib2
& Tarun Gupta1
Received: 18 November 2014 /Accepted: 19 March 2015# Springer-Verlag Berlin Heidelberg 2015
Abstract Airborne submicron particles (PM1) were collectedusing PM1 sampler during the fog-dominated days (December2013–January 2014). PM1 values varied between 58.12 μg/m3 and 198.75 μg/m3, and average mass concentration was162.33±38.25 μg/m3 while total average concentration ofparticle-associated polycyclic aromatic hydrocarbon (PAHs)determined was 616.31±30.31 ng/m3. This is a signal for analarming high pollution level at this site situated in the Indo-Gangetic Plain (IGP). PAHs were extracted from filters usingtoluene and acetonitrile. Quantitative measurements of poly-cyclic aromatic hydrocarbons (PAHs) were carried out usingthe high performance liquid chromatography (HPLC) tech-nique. The extracts were analyzed for 16 target polycyclicaromatic hydrocarbons (PAHs) including carcinogenic com-pound benzo(a)pyrene (19.86±38.98 ng/m3). Fluoranthene,benzo(a)anthracene, anthracene, and fluorene were the pre-dominant compounds found in the samples collected duringfoggy days. Based on number of rings, four-ring PAH com-pounds had maximum contribution (43 %) in this fog timecollected submicron particles followed by three-ring (21 %),five-ring (20 %), six-ring (13 %), and two-ring (3 %), respec-tively. In winter and foggy days, wood and coal combustionand biomass burning also significantly contribute to the PAH
levels. However, diagnostic ratio suggests diesel emissions asthe prime source of PAHs at this sampling site.
Keywords Polycyclic aromatic hydrocarbon . Foggy days .
PM1. Benzo(a)pyrene . Fluoranthene . Diagnostic ratio
Introduction
Polycyclic aromatic hydrocarbons (PAHs) are a group of or-ganic compounds having two or more merged aromatic rings.The PAHs escape into the atmosphere mainly due to variousanthropogenic activities with incomplete combustion of fuelsbeing the most prominent one (Ravindra et al. 2008a, b).Unplanned increase in vehicular traffic, urban infrastructure,and rapid industrialization across the megacities of India,mainly over the Indo-Gangetic Plain (IGP) region has contrib-uted heavily towards very high loading of atmospheric partic-ulate matter (Prasad et al. 2013; Sharma et al. 2014). Thechemical speciation of the ambient PM2.5 and PM10 has beencarried out and reported by numerous researchers in the recentpast (Pachauri et al. 2013). In addition, these studies havereported dominance of both natural (long distance transportof mineral dust) as well as anthropogenic aerosols (vehicularas well as industrial) within the Indian subcontinent for differ-ent seasons (Sharma et al. 2012; Ghosh et al. 2014).
Some of PAHs are carcinogenic and mutagenic and someare related with chronic human health problems (Dallarosaet al. 2005; Fang et al. 2004a, b). Automobile exhaust is amajor contributor to PAHs in urban areas (Velasco et al.2004). Prime sources of atmospheric PAHs in urban air havebeen listed as motor vehicles (especially diesel engine vehi-cles), industrial-oil burning, home heating, and factories(Hayakawa et al. 1995; Mittal and Grieken 2001; Ho andLee 2002; Park et al. 2002; Yang et al. 2002). Higher
Responsible editor: Constantini Samara
* Tarun [email protected]
1 Department of Civil Engineering & Atmospheric ParticlesTechnology Laboratory at Center for Environmental Science andEngineering, Indian Institute of Technology Kanpur, Kanpur 208016,India
2 Department of Civil Engineering, Indian Institute of TechnologyDelhi, Hauz Khas, New Delhi 110016, India
Environ Sci Pollut ResDOI 10.1007/s11356-015-4413-y

concentrations of polycyclic aromatic hydrocarbons in urbanenvironments cause a great risk of exposure to local popula-tion (Sienra et al. 2005). Depending upon the PAH molecularweight, atmospheric PAHs get partitioned between the partic-ulate phase and the gas phase. High molecular weight PAHsare often associated with particles while low molecular weightPAHs have higher concentrations in the vapor phase (Bi et al.2003). About 90–95 % of particulate PAHs are related toparticles with aerodynamic diameter <3.3 μm, and the peakdistributions are contained between 0.4 and 1.1 μm (Baeket al. 1991). Both nuclei mode particles with diameters<0.1 μm and coarse mode particles with aerodynamic diame-ters >3–5 μm have limited atmospheric residence time. Thenuclei mode particles are removedmainly by coagulation withother nuclei particles or with larger particles, followed by wetand dry deposition. On the contrary, coarser particles are re-moved from the atmosphere by mostly dry deposition. PAHsare predominantly associated with particles having an aerody-namic diameter range of 0.1–3.0 μm, and these stay airbornefor extended durations and thus result in their slow removalfrom the atmosphere (Baek et al. 1991).
A past study carried out in Delhi (about 400 km fromKanpur city) reported the principal sources of PAHs in winterseason as diesel vehicles, coal combustion, gasoline vehicles,and wood (Sharma et al. 2007). The increasing vehicular traf-fic and the infrequent dispersion of the atmospheric pollutantsin the urban environment are the main culprits for increasingconcentrations of atmospheric PAHs. The risk associated withthe human exposure to atmospheric PAHs concentration hasbeen observed highest in the metro cities presenting very highpopulation densities (Sharma et al. 2007). The diesel enginesare reported to be a key source of PAHs emissions from coun-tries like India and other South-East Asian countries(Mohanraj and Azeez 2003).
In a study carried out in Delhi (Ravindra et al. 2008a), theconcentrations of various criteria air pollutants (SPM, PM10,CO, SO2, and NOX) and organic pollutants such as benzene,toluene, xylene (BTX), and PAHs were measured both beforeand after the implementation of compressed natural gas(CNG) in mass public transport in Delhi as per orders of theSupreme Court of India replacing diesel from April 2001 on-wards. A few studies have investigated atmospheric PAH con-centrations in various cities across India, such as Delhi(Kannan and Kapoor 2004), Mumbai (Sahu et al. 2001), andAhmedabad (Raiyani et al. 1993a, b) having an average totalPAH concentrations of 24, 28, and 90 ng m−3, respectively.
It has been suggested that approximately 90 % of the totalemanating PAH emissions are stationary. However, this is notthe case in urban and suburban areas, where the mobilesources (mostly driven on diesel) are also prevailing (Baeket al. 1991).Many studies have been carried out onmonitoringof PAH levels in most of the parts of the world. A summary ofthe results is provided in Table 1. Although large amount of
data on concentration levels of SPM, NOx, SO2, and CO areavailable for prominent urban areas in India, studies on themeasurements of PAHs in the ambient air of major cities arerather limited in terms of sampling carried out in specificseason, for specific particle size or focused location (Sharmaet al. 2007).
In developing countries particularly in India, high levels ofambient atmospheric PAHs have been observed (Marr et al.2004; Sharma et al. 2007). Asian countries contributed about290 Gg year−1 PAH emissions annually, with India and Chinacontributing about 90 and 114 Gg year−1, respectively(Mohanraj et al. 2011). The proportion of high molecularweight PAHs emission from India (3.6 %) was significantlyhigher than the global average emission. Data on PAH contentin the PM10 are available for a few cities in India (Raiyaniet al. 1993a, b; Chattopadhyay et al. 1998; Kulkarni andVenkataraman 2000). However, the literature on fineparticulate-bound PAHs is limited especially during fog time.In that context, current study is carried out to assess the PAHin PM1 fraction of ambient aerosol collected during foggydays (2013–14). This is the first time investigation of individ-ual and average concentration of total PAH (TPAH) duringfog time collected submicron particles (PM1) in India.
Methodology
Description of sampling site
Sampling was carried out on the roof of an 8-m high buildingof Center for Environmental Science and Engineering,(CESE) within the IIT Kanpur campus shown in Fig. 1. IITKanpur (longitude 88° 22′ E and latitude 26° 26′ N) is aneducational institute spread over approximately 4.3 km2 andhaving a residential population of more than 8000. There is nocommercial or industrial activity prevalent inside the institute.The campus is situated about 15 km north of the city in theupwind direction. Within the campus, vehicular populationmainly comprises of two wheelers and cars. Several construc-tion activities were ongoing during the sampling period. Inaddition, there is a dense vehicular traffic on a national high-way situated about 1.5 km east of the sampling site.
Materials and sampling schedule
Sampling was carried out for 8 h per day starting at 6 amduring 16 days of fog period (15 December 2013–25January 2014) using a PM1 sampler previously developed inour lab (Gupta et al. 2010; 2011). This sampler has been val-idated with polydisperse artificial aerosol generated in the laband measured using an Aerodynamic Particle Sizer (model3021, TSI Inc., USA) following well-established methodsfor impactor characterization (Demokritou et al. 2002; Gupta
Environ Sci Pollut Res

et al. 2004). The flow rate of the sampler was 10 lpm (mea-sured by a rotameter, calibrated using a mass flow meter;Dakota Inc., USA). A total of 16 samples were collected dur-ing fog period. Ten percent of the total numbers of collected
filters in each month were kept as a blank and were subjectedto similar gravimetric and chemical analyses as the sampledfilters. Temperature and relative humidity were measured bytemperature sensor and relative humidity sensor, respectively.
Table 1 A summary of totalPAHs concentration (ng/m3) invarious cities of the world
Study area Number of PAHs ∑PAHs (ng/m3) Particle size References
Chennai, India 11 517.1 PM2.5 Mohanraj et al. 2011
Coimbatore, India 13 90.4 PM10 Mohanraj and Azeez 2003
Agra, India 18 97.9 PM10 Masih et al. 2010
Delhi, India 12 669.9 TSP Sharma et al. 2007
Taiyuan, China 8 1,504.7 TSP Peng et al. 2003
Shenzhen, South China 16 128 TSP Liu et al. 2010
Mexico City, Mexico 11 310 PM2.5 Marr et al. 2004
Tehran, Iran 16 44.2 PM10 Halek et al. 2010
Seoul, South Korea 15 89.3 TSP Park et al. 2002
Kanpur, India 16 616.31±30.31 PM1 Present study
Fig. 1 Academic area map of IIT Kanpur showing sampling site CESE (Environmental Science and Engineering building). Adapted from Geokno (P)limited. IIT Kanpur
Environ Sci Pollut Res
Identification of foggy day was carried out by using informa-tion available at IITKMplnet (Singh et al. 2014) http://mplnet.gsfc.nasa.gov/data.html
Collection and storage of samples
Whatman QM-A Quartz filter paper with 47-mm diameterwas used for PM1 collection. Before sampling, each quartzfilter substrate was pre-conditioned in a controlled environ-ment at 25 °C and 50 % RH for 24 h (Chakraborty andGupta 2010). Using a Mettler balance (APM 440, Mettler,least count 1 μg), each pre-conditioned filter was weighedthrice, and if for any filter the difference between two consec-utive weights was found to be higher than 3 μg, then the filterwas re-conditioned and re-weighed. Thereafter, the pre-conditioned filters were transferred into sealed plastic con-tainers and placed into the sampler using a clean set of forceps.Filter papers were immediately taken out of the sampler post-sampling using a clean set of forceps and transferred to thesealed plastic container. Collected filter papers were then post-conditioned for 24 h at 25 °C and 50%RH andweighed undera similar controlled environment to calculate the PM1 massdeposited on them. After weighing the filter papers, they weretransferred to the plastic container and kept in the refrigeratorat 5 °C till further analysis. Blank filters were subjected to thesame procedure.
Sample preparation for PAH analysis
Three-fourth part of the area of 47 mm of each quartz-filterwas cut into small pieces and carefully poured into 100-mlglass beaker. Samples and blanks were extracted with tol-uene using ultrasonic-assisted extraction. Initially, extrac-tion was carried out with 20 ml toluene and ultrasonicatedfor 30 min. Toluene was used rather than other solvents(dichloromethane (DCM), benzene/methanol etc.) due to itshigh recovery, mainly for higher boiling PAHs (Caricchiaet al. 1999). The toluene extracts were poured into centri-fuge tubes, and the filter papers were further extracted with10 mL of toluene, and then, the solution was ultrasonicatedfor 20 min. Finally, remaining filter papers were extractedwith 5 mL of toluene and ultrasonicated for 5 min.Toluene extracts were transferred into the centrifuge tubesand 0.2 ml of acetonitrile was added to each tube andsamples were filtered through 0.22 μm membrane filters(Millipore). Samples were then evaporated to near drynessusing rotavapor. An additional 2 ml of acetonitrile wasadded and samples were re-evaporated to near dryness.The final volume of each sample was adjusted to 1 mlwith acetonitrile, and samples were again filtered through0.22 μm filters into vials. The clarified extracts were storedin a refrigerator until their injection into the HPLC foranalysis (Sharma 2014). PAH standards obtained from
Sigma-Aldrich were used to generate standard chromato-gram for 16 PAHs compounds (Table 2). After requireddilution, a standard was injected in HPLC (make: Waters,USA) with PAH C18 column (5 μm 250 mm x 4.6 mm),and the compounds are determined in photodiode array(PDA) detector (model: Waters 2998). After standardiza-tion, the samples were injected for PAH analysis.Chromatographic peaks were identified by comparing re-tention times of samples with those of reference PAHcompounds.
The PAHs analyzed by HPLC/PDA detector were the fol-lowing: naphthalene (Nap), acenaphthene (Ace), acenaphthyl-ene (Ac), phenanthrene (Phen), anthracene (Anth), fluorene(Fluor), fluoranthene (Fanth), benz[a]anthracene (BaA),pyrene (Pyr), chrysene (Chrys), benzo[b]fluoranthene (BbF),benzo[k]fluoranthene (BkF), benzo[a]pyrene (BaP), dibenz[a,h]anthracene (DBA), benzo[g,h,i]perylene (BghiP), indeno[1,2,3-c,d]pyrene (IP). The list includes 14 out of the sixteenPAH demarcated by USEPA as priority pollutants (USEPA1987). Linear calibration graphs were obtained for everyPAH in the concentration ranges up to a maximum of1000 ng/ml.
Quality control and quality assurance for analyticalmethod
Field and laboratory blanks were carefully analyzed to ensurequality control. Blank level of individual analytes in mostcases (>90 %) were below detection levels. The final reportedconcentrations of PAHswere corrected using blank values andrecovery rates. Sample along with the eluent supplied at a flowrate of 1 ml/min was measured by an array of photo diodedetector at a specific wavelength of 254 nm (model: Waters2998). Mobile phase was carefully filtered through a 0.22-μmmembrane filter (Millipore) before use and degassed in anultrasonicator for 20 min. The HPLC instrument (make:Waters, USA) with PAH C18 column (5 μm, 250 mm×4.6 mm) was calibrated with external standards, before everybatch of sample analysis. After standardization, the sampleswere injected for PAH analysis. Chromatographic peaks wereidentified by comparing retention times of samples with thoseof reference PAH compounds (Table 3). The spiked recoveriesfor target PAHs were found to be >85 % using the matrix(mixture) of known PAHs standards (Sigma-Aldrich Inc.)(Table 3). Limit of detection (LOD), limit of quantization(LOQ), limit of linearity (LOL), relative standard deviation(RSD), and regression coefficient (R2) were determined byrepeated analysis of several different stock solutions preparedby systematic dilution of the standard PAH mixture (Table 4).Seven point calibration curve was plotted for each of the six-teen US EPA priority PAHs to determine the linearity of theresponse for the target compounds. The calibration curveswere linear up to 1000 ng/mL concentration range with
Environ Sci Pollut Res

excellent linear regression coefficients (R2>0.99) (Table 4).LOD was determined by using the signal to noise ratio of3:1. LOQ was determined by the signal to noise ratio of10:1, and LOL was determined from the plot of the concen-tration versus detector response (Table 4). The RSD for thesamples were determined via triplicate analysis, and it wasfound to be less than 8 % (Table 4).
Results and discussion
Variation in mass concentration of PM1
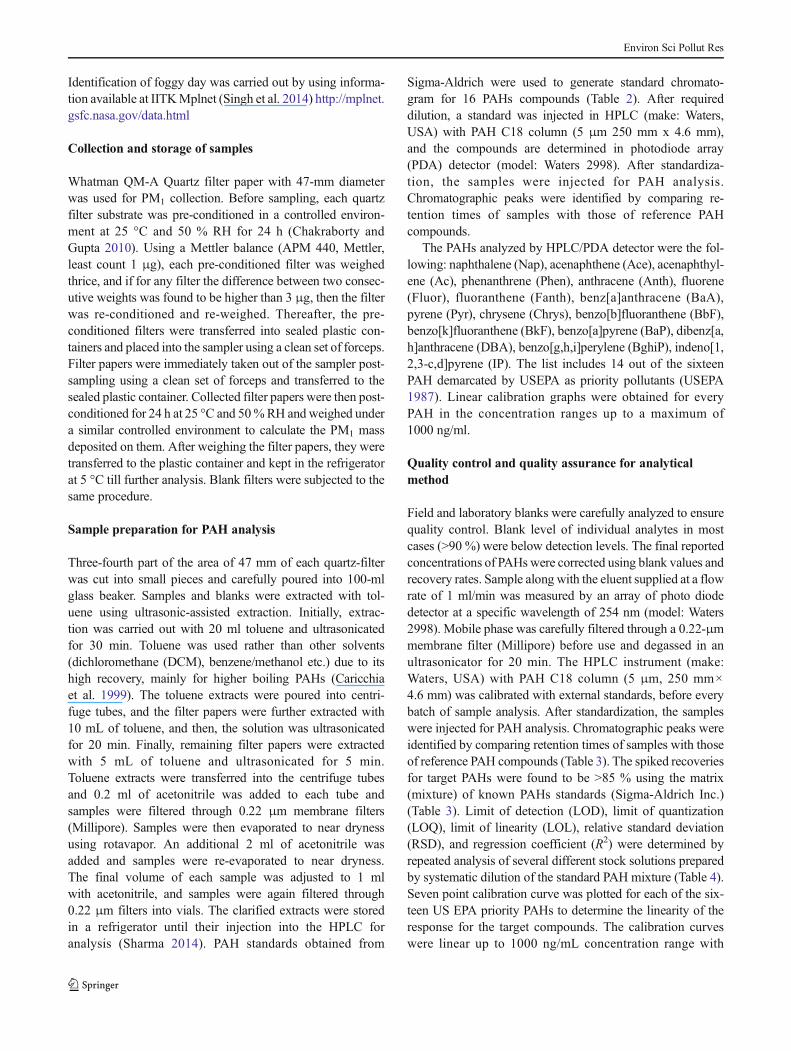
The daily mass concentration of PM1 is shown in Fig. 2 forfoggy days during the winter season 2013–2014. Fog
typically is formed when RH >80 %; in fact at times themeasured RH >90 %. The average mass of PM1 during foggydays sampled with the PM1 sampler was found to be 162.33±38.25 μg/m3. The maximum mass concentration was198.75 μg/m3 (08 January 2014) and minimum was58.12 μg/m3 (20 December 2013). The average PM1 massconcentration obtained in the present study was found to bein good agreement with the value of 165.95 μg/m3 reportedduring a study carried out in foggy days (2011–12) (Singhet al. 2014) at IIT Kanpur; 199 μg/m3 reported during a studyin winter 2008 carried out at IIT Kanpur (Chakraborty andGupta 2010); 114±80 μg/m3, reported during a winter studyin November 2009–February 2010 (Gupta and Mandariya2013); 203 μg/m3 (PM0.95), reported in a study duringDecember 2004 in IIT Kanpur (Tare et al. 2006).
Table 2 Diagnostic ratios (DR) of PAHs used as source indicator and comparison of diagnostic ratios with literature review by Ravindra et al. (2008)
Diagnostic ratio Value (present study) DR (sources)
Indeno[1,2,3 cd]pyrene/(indeno[1,2,3-cd)pyrene+benzo[ghi]perylene 0.58 0.56 (coal) and 0.35–0.70 (diesel)
Indeno[1,2,3 cd)pyrene/benzo[ghi]perylene 1.37 ∼1 (diesel)
Fluoranthene/(fluoranthene+pyrene) 0.73 >0.5 (diesel)
Benzo[b]fluoranthene/benzo[k]fluoranthene 0.62 >0.5 (diesel)
B[a]P/Benzo[ghi]perylene 1.17 0.5–0.6 (traffic emission)>1.25 (brown coal)a
B[a]P/(B[a]P+chrysene) 0.39 ∼0.5 (diesel)
Pyrene/B[a]P 2.22 ∼1 (petrol engine)∼10 (diesel engine)
Fluorene/(fluorene+pyrene) 0.55 >0.5 (diesel)
References Ravindra et al. (2008a, b); Grimmer et al. (1983); Kavouras et al. (2001); Rogge et al. (1993); Mandalakis et al. (2002); Fang et al. (2004);Khalili et al. (1995); Guo et al. (2003); Pandey et al. (1999); Park et al. (2002); Caricchia et al. (1999)a Lignite often referred to as brown coal, is a soft brown combustible sedimentary rock that is formed from naturally compressed peat. Used for residentialheating and industrial operation like brick kilns
Table 3 Retention time, minimum detection limit, and recovery percentage of individual PAHs
PAH Formula Molecular weight (g/mol) Retention time(min) Minimum detection limit (ng/m3) Recovery percentage (%)
Naphthalene C10H8 128 14.00 0.002 100
Acenaphthylene C12H8 152 15.32 0.004 100
Acenaphthene C12H10 154 17.51 0.001 73
Fluorene C13H10 166 17.57 0.002 50
Phenanthrene C14H10 178 18.83 0.005 100
Fluoranthene C14H10 178 20.19 0.05 65
Pyrene C16H10 202 22.98 0.01 77
Benzo[a]anthracene C16H10 202 24.22 0.005 100
Chrysene C18H12 228 24.80 0.005 100
Benzo[b]fluoranthene C20H12 252 36.17 0.01 73
Dibenz[a,h]anthracene C20H12 252 36.40 0.005 100
Benzo[ghi]perylene C20H12 252 37.77 0.005 93
Indeno[1,2,3-cd]pyrene C22H14 278 40.57 0.005 78
C22H12 276 43.11 0.005 70
C22H12 276 43.15 0.05 95
Environ Sci Pollut Res
It has also been noticed that almost 80 % of the vehicularemission was within the ultrafine to fine (0.1–2.8 μm) partic-ulate range (Junker et al. 2000). A study carried out by GuptaandMandariya (2013) using UNMIXmodel for source appor-tionment concluded that the major contributions to PM1 wasfrom crustal material, coal combustion, secondary aerosol,composite vehicle emission, and iron/steel production metal-lurgical industries. The secondary aerosol factor had thehighest contribution to PM1, with an annual average contribu-tion of approximately 57 %. The prime sources of PM1 con-centrations were found to be wind transported dust, secondaryaerosol originating from gas-to-particle conversion coupledwith the local meteorology playing a significant role (Guptaand Mandariya 2013). Biomass burning and coal combustionwere reported as prime sources for PM1 dominant during win-ter time and foggy days (Kaul et al. 2011; Shen et al. 2010).
PAHs in fog time collected PM1
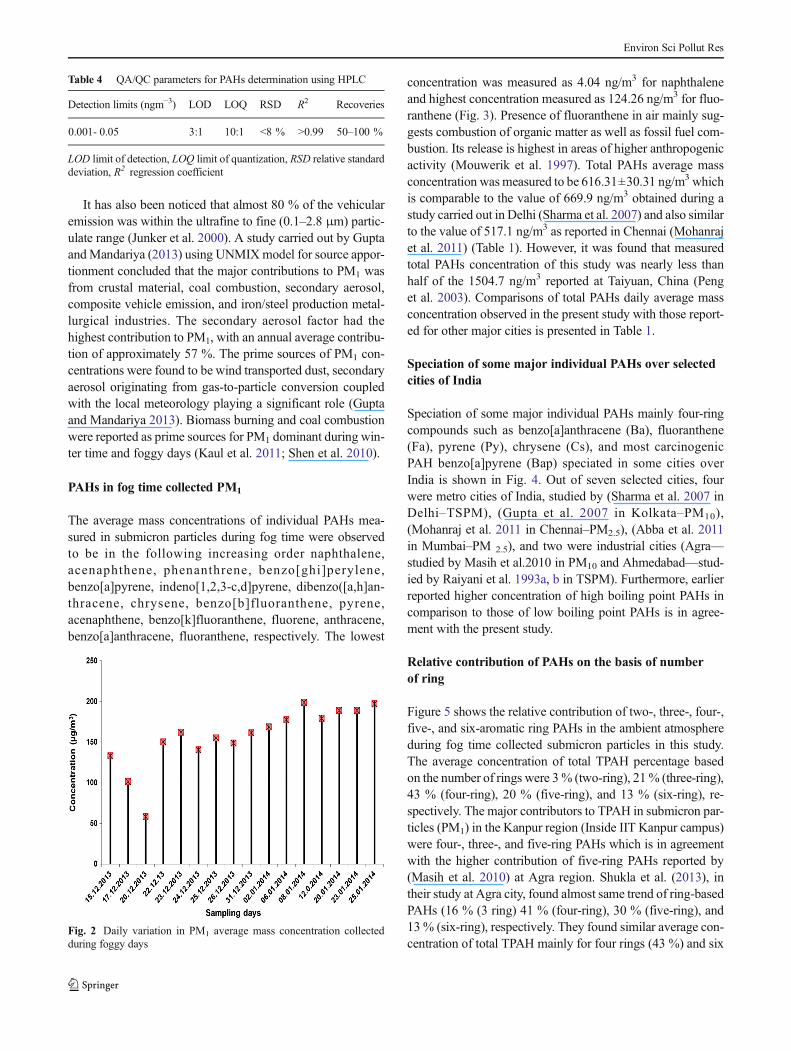
The average mass concentrations of individual PAHs mea-sured in submicron particles during fog time were observedto be in the following increasing order naphthalene,acenaphthene, phenanthrene, benzo[ghi]perylene,benzo[a]pyrene, indeno[1,2,3-c,d]pyrene, dibenzo([a,h]an-thracene, chrysene, benzo[b]fluoranthene, pyrene,acenaphthene, benzo[k]fluoranthene, fluorene, anthracene,benzo[a]anthracene, fluoranthene, respectively. The lowest
concentration was measured as 4.04 ng/m3 for naphthaleneand highest concentration measured as 124.26 ng/m3 for fluo-ranthene (Fig. 3). Presence of fluoranthene in air mainly sug-gests combustion of organic matter as well as fossil fuel com-bustion. Its release is highest in areas of higher anthropogenicactivity (Mouwerik et al. 1997). Total PAHs average massconcentration wasmeasured to be 616.31±30.31 ng/m3 whichis comparable to the value of 669.9 ng/m3 obtained during astudy carried out in Delhi (Sharma et al. 2007) and also similarto the value of 517.1 ng/m3 as reported in Chennai (Mohanrajet al. 2011) (Table 1). However, it was found that measuredtotal PAHs concentration of this study was nearly less thanhalf of the 1504.7 ng/m3 reported at Taiyuan, China (Penget al. 2003). Comparisons of total PAHs daily average massconcentration observed in the present study with those report-ed for other major cities is presented in Table 1.
Speciation of some major individual PAHs over selectedcities of India
Speciation of some major individual PAHs mainly four-ringcompounds such as benzo[a]anthracene (Ba), fluoranthene(Fa), pyrene (Py), chrysene (Cs), and most carcinogenicPAH benzo[a]pyrene (Bap) speciated in some cities overIndia is shown in Fig. 4. Out of seven selected cities, fourwere metro cities of India, studied by (Sharma et al. 2007 inDelhi–TSPM), (Gupta et al. 2007 in Kolkata–PM10),(Mohanraj et al. 2011 in Chennai–PM2.5), (Abba et al. 2011in Mumbai–PM 2.5), and two were industrial cities (Agra—studied by Masih et al.2010 in PM10 and Ahmedabad—stud-ied by Raiyani et al. 1993a, b in TSPM). Furthermore, earlierreported higher concentration of high boiling point PAHs incomparison to those of low boiling point PAHs is in agree-ment with the present study.
Relative contribution of PAHs on the basis of numberof ring
Figure 5 shows the relative contribution of two-, three-, four-,five-, and six-aromatic ring PAHs in the ambient atmosphereduring fog time collected submicron particles in this study.The average concentration of total TPAH percentage basedon the number of rings were 3% (two-ring), 21% (three-ring),43 % (four-ring), 20 % (five-ring), and 13 % (six-ring), re-spectively. The major contributors to TPAH in submicron par-ticles (PM1) in the Kanpur region (Inside IIT Kanpur campus)were four-, three-, and five-ring PAHs which is in agreementwith the higher contribution of five-ring PAHs reported by(Masih et al. 2010) at Agra region. Shukla et al. (2013), intheir study at Agra city, found almost same trend of ring-basedPAHs (16 % (3 ring) 41 % (four-ring), 30 % (five-ring), and13% (six-ring), respectively. They found similar average con-centration of total TPAH mainly for four rings (43 %) and six
Table 4 QA/QC parameters for PAHs determination using HPLC
Detection limits (ngm−3) LOD LOQ RSD R2 Recoveries
0.001- 0.05 3:1 10:1 <8 % >0.99 50–100 %
LOD limit of detection, LOQ limit of quantization, RSD relative standarddeviation, R2 regression coefficient
Fig. 2 Daily variation in PM1 average mass concentration collectedduring foggy days
Environ Sci Pollut Res
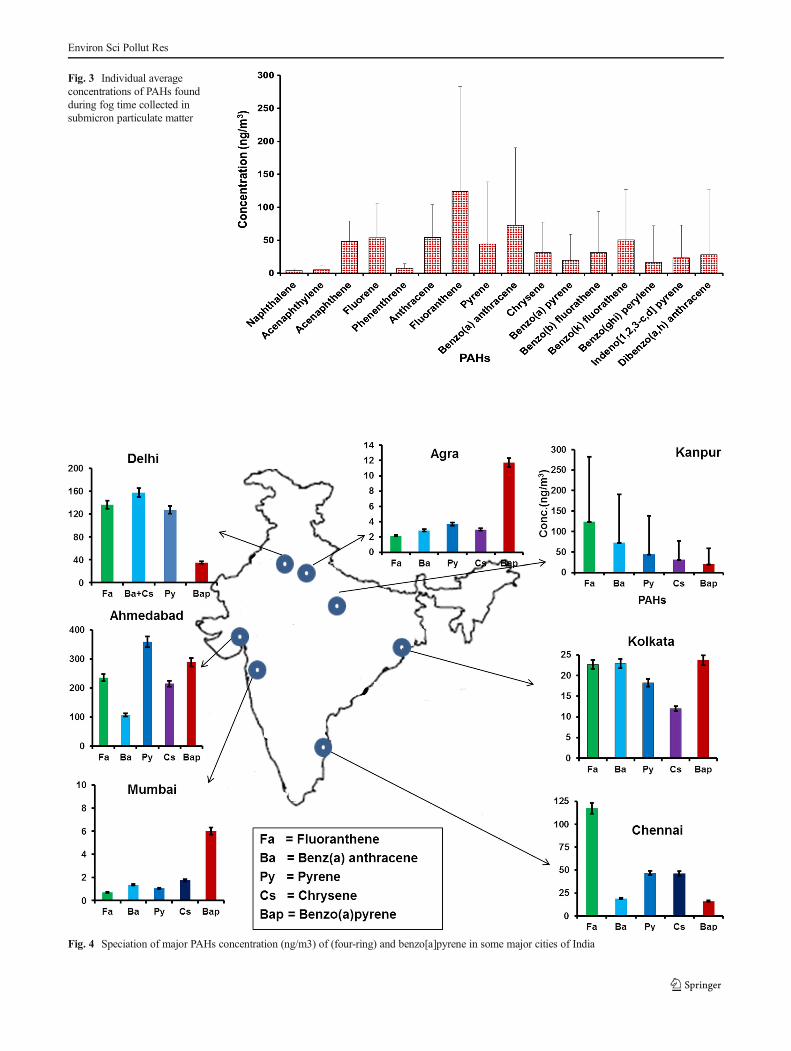
Fig. 3 Individual averageconcentrations of PAHs foundduring fog time collected insubmicron particulate matter
Fig. 4 Speciation of major PAHs concentration (ng/m3) of (four-ring) and benzo[a]pyrene in some major cities of India
Environ Sci Pollut Res
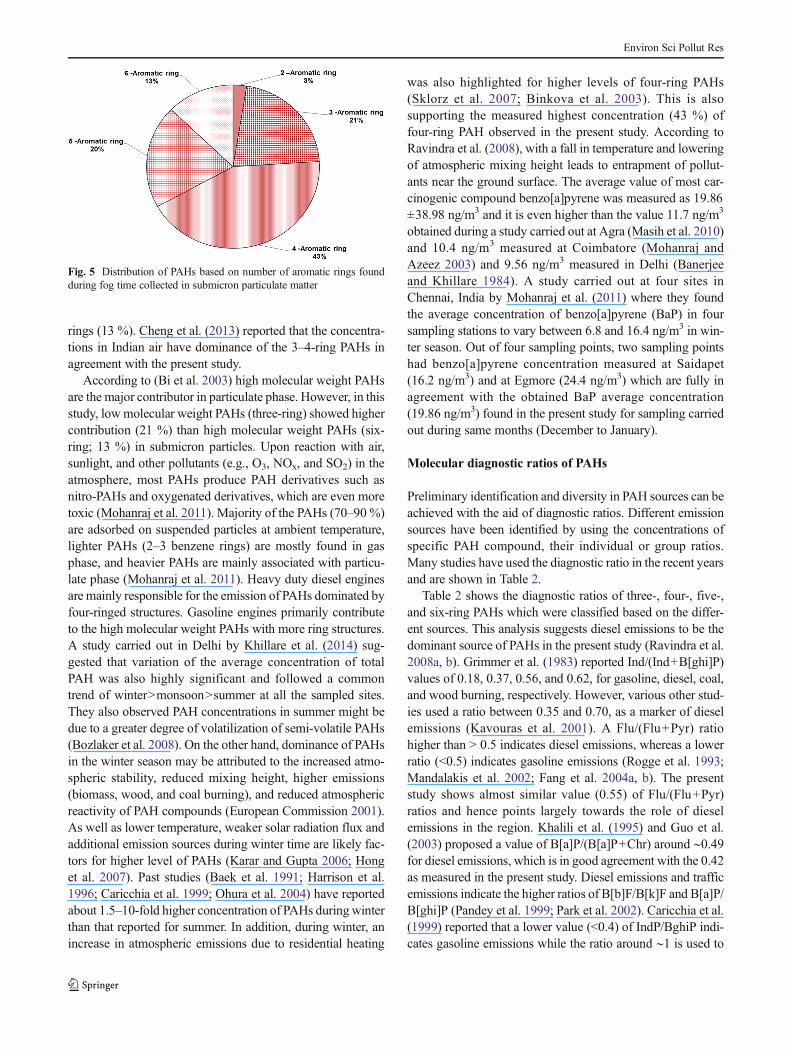
rings (13 %). Cheng et al. (2013) reported that the concentra-tions in Indian air have dominance of the 3–4-ring PAHs inagreement with the present study.
According to (Bi et al. 2003) high molecular weight PAHsare the major contributor in particulate phase. However, in thisstudy, lowmolecular weight PAHs (three-ring) showed highercontribution (21 %) than high molecular weight PAHs (six-ring; 13 %) in submicron particles. Upon reaction with air,sunlight, and other pollutants (e.g., O3, NOx, and SO2) in theatmosphere, most PAHs produce PAH derivatives such asnitro-PAHs and oxygenated derivatives, which are even moretoxic (Mohanraj et al. 2011). Majority of the PAHs (70–90 %)are adsorbed on suspended particles at ambient temperature,lighter PAHs (2–3 benzene rings) are mostly found in gasphase, and heavier PAHs are mainly associated with particu-late phase (Mohanraj et al. 2011). Heavy duty diesel enginesare mainly responsible for the emission of PAHs dominated byfour-ringed structures. Gasoline engines primarily contributeto the high molecular weight PAHs with more ring structures.A study carried out in Delhi by Khillare et al. (2014) sug-gested that variation of the average concentration of totalPAH was also highly significant and followed a commontrend of winter>monsoon>summer at all the sampled sites.They also observed PAH concentrations in summer might bedue to a greater degree of volatilization of semi-volatile PAHs(Bozlaker et al. 2008). On the other hand, dominance of PAHsin the winter season may be attributed to the increased atmo-spheric stability, reduced mixing height, higher emissions(biomass, wood, and coal burning), and reduced atmosphericreactivity of PAH compounds (European Commission 2001).As well as lower temperature, weaker solar radiation flux andadditional emission sources during winter time are likely fac-tors for higher level of PAHs (Karar and Gupta 2006; Honget al. 2007). Past studies (Baek et al. 1991; Harrison et al.1996; Caricchia et al. 1999; Ohura et al. 2004) have reportedabout 1.5–10-fold higher concentration of PAHs during winterthan that reported for summer. In addition, during winter, anincrease in atmospheric emissions due to residential heating
was also highlighted for higher levels of four-ring PAHs(Sklorz et al. 2007; Binkova et al. 2003). This is alsosupporting the measured highest concentration (43 %) offour-ring PAH observed in the present study. According toRavindra et al. (2008), with a fall in temperature and loweringof atmospheric mixing height leads to entrapment of pollut-ants near the ground surface. The average value of most car-cinogenic compound benzo[a]pyrene was measured as 19.86±38.98 ng/m3 and it is even higher than the value 11.7 ng/m3
obtained during a study carried out at Agra (Masih et al. 2010)and 10.4 ng/m3 measured at Coimbatore (Mohanraj andAzeez 2003) and 9.56 ng/m3 measured in Delhi (Banerjeeand Khillare 1984). A study carried out at four sites inChennai, India by Mohanraj et al. (2011) where they foundthe average concentration of benzo[a]pyrene (BaP) in foursampling stations to vary between 6.8 and 16.4 ng/m3 in win-ter season. Out of four sampling points, two sampling pointshad benzo[a]pyrene concentration measured at Saidapet(16.2 ng/m3) and at Egmore (24.4 ng/m3) which are fully inagreement with the obtained BaP average concentration(19.86 ng/m3) found in the present study for sampling carriedout during same months (December to January).
Molecular diagnostic ratios of PAHs
Preliminary identification and diversity in PAH sources can beachieved with the aid of diagnostic ratios. Different emissionsources have been identified by using the concentrations ofspecific PAH compound, their individual or group ratios.Many studies have used the diagnostic ratio in the recent yearsand are shown in Table 2.
Table 2 shows the diagnostic ratios of three-, four-, five-,and six-ring PAHs which were classified based on the differ-ent sources. This analysis suggests diesel emissions to be thedominant source of PAHs in the present study (Ravindra et al.2008a, b). Grimmer et al. (1983) reported Ind/(Ind+B[ghi]P)values of 0.18, 0.37, 0.56, and 0.62, for gasoline, diesel, coal,and wood burning, respectively. However, various other stud-ies used a ratio between 0.35 and 0.70, as a marker of dieselemissions (Kavouras et al. 2001). A Flu/(Flu+Pyr) ratiohigher than > 0.5 indicates diesel emissions, whereas a lowerratio (<0.5) indicates gasoline emissions (Rogge et al. 1993;Mandalakis et al. 2002; Fang et al. 2004a, b). The presentstudy shows almost similar value (0.55) of Flu/(Flu+Pyr)ratios and hence points largely towards the role of dieselemissions in the region. Khalili et al. (1995) and Guo et al.(2003) proposed a value of B[a]P/(B[a]P+Chr) around ∼0.49for diesel emissions, which is in good agreement with the 0.42as measured in the present study. Diesel emissions and trafficemissions indicate the higher ratios of B[b]F/B[k]F and B[a]P/B[ghi]P (Pandey et al. 1999; Park et al. 2002). Caricchia et al.(1999) reported that a lower value (<0.4) of IndP/BghiP indi-cates gasoline emissions while the ratio around ∼1 is used to
Fig. 5 Distribution of PAHs based on number of aromatic rings foundduring fog time collected in submicron particulate matter
Environ Sci Pollut Res

indicate dominance of diesel engines which is also in agree-ment with ∼1.37 obtained in the present study.
Dvorská et al. (2011) reported that if the ratio of Flua/Flua+Chr>0.6, it indicates the source of biomass burning which is invery good agreement with present study ∼0.73 and also it hasbeen observed that during foggy days biomass burning is prom-inent source for PM1 and it was found that fluoranthene(124.26 ng/m3) was prominent in this study. Pies et al. (2008)reported that the ratio of anthracene/(anthracene+phenanthrene)will be <0.1 (for petrogenic) and >0.1 (for pyrogenic), in thepresent study, it was observed ∼0.87 that indicates the pyrogenic(incomplete combustion) source and it also points towardsbiomass burning. Behlahcen et al. (1997) reported that thefluoranthene/pyrene less than one indicates petrogenic sourceof contamination while a ratio of more than one indicates pyro-genic sources which is also in agreement with the present studywhere fluoranthene/pyrene was found more than one (2.81).
Conclusion
A total of 16 PAH compounds and high concentration (19.86±38.98 ng/m3) of most carcinogenic compound (benzo[a]pyrene) were found during fog time collected submicron par-ticles within the IIT Kanpur campus. The total PAHs concen-tration was found to be (616.31±30.31 ng/m3). The varyingproportions of individual PAH compounds can be associatedwith uncontrolled use of fossil fuels, infrequent dispersion,biomass burning, maximum use of two wheelers inside IITKcampus and differences in human activities. The average per-centage of total PAHs was 3, 21, 43, 20, and 13 % for two-,three-, four-, five- and six-ring compounds, respectively.Major contribution of four-ring compounds (43 %) and minorcontribution of six-ring (13%) was found. Out of the 16 PAHsidentified by USEPA as priority pollutants list, 14 of thosewere found in this study. The concentration (19.86±38.98 ng/m3) measured for benzo[a] pyrene was on the higherside. Similar concentration of benzo[a]pyrene has also beenreported earlier. Fluoranthene (four-ring PAH) was the highestcontributor and naphthalene (two-ring PAH) had least concen-tration. Variation of PAHs observed in this study is also sug-gesting strong influence of meteorological conditions andaqueous atmospheric chemistry dominant during foggy days.Oxidation, reduction, hydration, fragmentation, and oligomer-ization are the main reactions which can alter the PAHs con-centration. Diagnostic analysis suggests diesel emissions to bethe dominant source of PAHs in the present study.
Compliance with ethical standards All the co-authors confirmthat there is no conflict of interest, and all the co-authors have read andapproved this submission. The source of funding for this study is frominternal funds of IIT Kanpur.
References
Abba EJ, Unnikrishnan S, Kumar R, Yeole B, Chowdhury Z (2011) Fineaerosol and PAH carcinogenicity estimation in outdoor environmentof Mumbai City. India. Int J Environ Health Res. 1–16
Baek SO, Goldstone ME, Kirk PWW, Lester JN, Perry R (1991) Phasedistribution and particle size dependency of polycyclic aromatichydrocarbons in the urban environment. Chemosphere 22:503–520
Banerjee DK, Khillare PS (1984) Polynuclear aromatic hydrocarbons inthe ambient air of Delhi. Int J Environ Stud. 22(2):121–129
Behlahcen KT, Chaoui A, Budzinski H, Bellocq J, Garrigues P (1997)Mar Pollut Bull 32:298
Bi G, Sheng X, Peng P, Chen Y, Zhang Z, Fu J (2003) Distribution ofparticulate- and vaporphase n-alkanes and polycyclic aromatic hy-drocarbons in urban atmosphere of Guangzhou, China. AtmosEnviron 37:289–298. doi:10.1016/ S1352-2310(02)00832-4
Binkova B, Cerna M, Pastorkova A, Jelinek R, Benes I, Novak J (2003)Biological activities of organic compounds adsorbed onto ambient airparticles: comparison between the cities of Teplice and Prague duringthe summer and winter seasons 2000–2001. Mutat Res 525:43–59
Bozlaker A, Muezzinoglu A, Odabasi M (2008) Atmospheric concentra-tions, dry deposition and air–soil exchange of polycyclic aromatichydrocarbons (PAHs) in an industrial region in Turkey. J HazardMater 153(3):1093–1102
Caricchia M, Chiavarini S, Pezza M (1999) Polycyclic aromatic hydro-carbons in the urban atmospheric particulate matter in the city ofNaples (Italy). Atmos Environ 33:3731–3738
Chakraborty A, Gupta T (2010) Chemical characterization and sourceapportionment of submicron PM1aerosol in Kanpur Region, India.Aerosol Air Qual Res 10(5):433–445
Chattopadhyay G, Samanta G, Chatterjee S, Chakraborti D (1998)Determination of particulate polycyclic aromatic hydrocarbons inambient air of Calcutta for three years during winter. EnvironTechnol 19:873–882
Cheng H, Deng Z, Chakraborty P, Liu D, Zhang R, Xu Y, Luo C, ZhangG, Li J (2013) A comparison study of atmospheric polycyclic aro-matic hydrocarbons in three Indian cities using PUF disk passive airsamplers. Atmos Environ 73:16–21
Dallarosa JB, Monego JG, Teixeira EC, Stefans JL, Weigand F (2005)Polycyclic aromatic hydrocarbons in atmosphere particles in metro-politan area of Porto. Alegre Brazil Environ 39:1609–1625
Demokritou P, Gupta T, Ferguson S, Koutrakis P (2002) Developmentand laboratory performance evaluation of a personal cascade impac-tor. J Air Waste Manag Assoc 52:1230–1237
Dvorská A, Lammel G, Klánová J (2011) Use of diagnostic ratios forstudying source apportionment and reactivity of ambient polycyclicaromatic hydrocarbons over Central Europe. Atmos Environ 45:420–427
European Commission (2001). Ambient Air Pollution by PAH. PositionPaper European Commission.http://ec.europa.eu/environment/air/pdf/pp_pah.pdf
Fang G, Wu YS, Fu PP, Yang LL, Chen MH (2004a) Polycyclic aromatichydrocarbons in the ambient air of suburban and industrial regionsof central Taiwan. Chemosphere 54:443–452. doi:10.1016/ S0045-6535(03)00706-9
Fang GC, Wu YS, Chen MH, Ho TT, Huang SH, Rau JY (2004b)Polycyclic aromatic hydrocarbons study in Taichung, Taiwan, dur-ing 2002–2003. Atmos Environ 38:3385–3391
Ghosh S, Gupta T, Rastogi N, Gaur A, Misra A, Tripathi SN, PaulD, Tare V, Prakash O, Bhattu D, Dwivedi AK, Kaul DS, DalaiR, Mishra SK (2014) Chemical characterization of summer timedust events at Kanpur: insight into the sources and level ofmixing with anthropogenic emissions. Aerosol Air Qual Res14:879–891
Environ Sci Pollut Res

Grimmer G, Jacob J, Naujack KW (1983) Profile of the polycyclic aro-matic compounds from crude oils-inventory byGCGC-MS. PAH inenvironmental materials, part 3. Fresenius J Anal Chem 316:29–36
Guo H, Lee SC, Ho KF, Wang XM, Zou SC (2003) Particle-associatedpolycyclic aromatic hydrocarbons in urban air of Hong Kong.Atmos Environ 37:5307–5317
Gupta T, Jaiprakash DS (2011) Field performance evaluation of a newlydeveloped PM2.5 sampler at IIT Kanpur. Sci Total Environ 409:3500–3507
Gupta T, Mandariya A (2013) Sources of submicron aerosol during fog-dominated wintertime at Kanpur. Environ Sci Pollut Res 20:5615–5629
Gupta T, Demokritou P, Koutrakis P (2004) Effects of physicochemicalproperties of ultrafine particles on the performance of an ultrafineparticle concentrator. Aerosol Sci Technol 38:37–45
Gupta AK, Karar K, Srivastava A (2007) Chemical mass balance sourceapportionment of PM10 and TSP in residential and industrial sites ofan urban region of Kolkata. India J Hazard Mater 142:279–287
Gupta T, Chakraborty A, Ujinwal KK (2010) Development and perfor-mance evaluation of an indigenously developed air sampler de-signed to collect submicron aerosol. Ann Indian Natl Acad Eng(INAE) 7:189–193
Halek F, Kianpour-Rad M, Kavousirahim A (2010) Seasonal variation inambient PM mass and number concentrations (case study: Tehran,Iran). Environ Monit Assess 169:501–507
Harrison RM, Smith DJT, Luhana L (1996) Source apportionme atmo-spheric polycyclic aromatic hydrocarbons collected from an urbanlocation in Birmingham, UK. Environ Sci Technol 30:825–832
HayakawaKT,MurahashiM, ButohM,MiyazakiM (1995) Determinationof 1, 3-, 1, 6-and 1, 8-dinitropyrenes and 1-nitropyrene in urban air byhigh-performance liquid chromatography using chemiluminescencedetection. Environ Sci Technol 29:928–932
Ho KF, Lee SC (2002) Identification of atmospheric volatile organiccompounds (VOCs), polycyclic aromatic hydrocarbons PAHs andcarbonyl compounds in Hong Kong. Sci Total Environ 289:145–158
Hong HS, Yin HLG, Wang XH, Ye CX (2007) Seasonal variation ofPM10-bound PAHs in the atmosphere of Xiamen, China. AtmosRes 85:429–441
Junker M, KasperM, Roosli M, CamenzindM, Kunzli N, Monn C, TheisG, Braun C (2000) Airborne particle number profiles, particle massdistribution and particle bound PAH concentrations within the cityenvironment of Basel: an assessment of the BRISKAProject. AtmosEnviron 43:3171–3181
Kannan GK, Kapoor SC (2004) Analysis of particles size fraction (PM10
and PM2.5) and PAH of urban ambient air. Delhi: DRDO, Ministryof Defense
Karar K, Gupta AK (2006) Seasonal variations and chemical characteri-zation of ambient PM10 at residential and industrial sites of an urbanregion of Kolkata (Calcutta), India. Atmos Res 81:36–53
Kaul DS, Gupta T, Tripathi SN, Tare V, Collett JL (2011) Secondaryorganic aerosol: a comparison between foggy and non-foggy days.Environ Sci Technol 45:7307–7313
Kavouras IG, Koutrakis P, Tsapakis M, Lagoudaki E, Stephanou EG, VonBaer D (2001) Source apportionment of urban particulate aliphaticand polynuclear aromatic hydrocarbons (PAHs) using multivariatemethods. Environ Sci Technol 35:2288–2294
Khalili NR, Scheff PA, Holsen TM (1995) PAH source fingerprints forcoke ovens, diesel and gasoline engines, highway tunnels, and woodcombustion emissions. Atmos Environ 29:533–542
Khillare PS, Amreen H, Sayantan S (2014) Accumulation and risks ofpolycyclic aromatic hydrocarbons and trace metals in tropical urbansoils. Environ Monit Assess 186:2907–2923
Kulkarni P, Venkataraman C (2000) Atmospheric polycyclic aromatichydrocarbons in Mumbai, India. Atmos Environ 34:2785–2790
Liu G, Tong Y, Luon JHT, Zhang H, Sun H (2010) A source study ofatmospheric polycyclic aromatic hydrocarbons in Shenzhen, SouthChina. Environ Monit Assess 163:599–606
Mandalakis M, Tsapakis M, Tsoga A, Stephanou EG (2002) Gas-particleconcentrations and distribution of aliphatic hydrocarbons, PAHs,PCBs and PCDD/Fs in the atmosphere of Athens (Greece). AtmosEnviron 36:4023–4035
Marr LC, Grogan HW, Molina LT, Molina MJ (2004) Vehicle traffic as asource of polycyclic aromatic hydrocarbons exposure in the MexicoCity Metropolitan Area. Environ Sci Technol 38:2584–2592
Masih A, Saini R, Singhvi R, Taneja A (2010) Concentrations, sources,and exposure profiles of polycyclic aromatic hydrocarbons (PAHs)in particulate matter (PM10) in the north central part of India.Environ Monit Assess 163:421–443
Mittal R, Grieken AKV (2001) Health risk suspended particulate matterwith special reference to PAHs: a review. Rev Environ Health 16:169–189
Mohanraj R, Azeez PA (2003) Polycyclic aromatic hydrocarbons in airand their toxic potency. Reson J Sci Educ 8:20–27
Mohanraj R, Solaraj G, Dhanakumar S (2011) Fine particulate phase PAHsin ambient atmosphere of Chennai metropolitan city, India. EnvironSci Pollut Res 18:764–771. doi:10.1007/s11356-010-0423-y
Mouwerik MV, Stevens L, Seese MD, BashamW (1997) Environmentalcontaminants encyclopaedia fluoranthene entry national park ser-vice, water resource divisions, water operations branch 1201Oakridge Drive, Suite 250 Fort Collins, Colorado 80525
Ohura T, Amagai T, Fusaya M, Matsushita H (2004) Polycyclic aromatichydrocarbons in indoor and outdoor environments and factors af-fecting their concentrations. Environ Sci Technol 38:77–83
Pachauri T, Satsangi A, Singla V, Lakhani A, Kumari KM (2013)Characteristics and sources of carbonaceous aerosols in PM2.5 dur-ing wintertime in Agra, India. Aerosol Air Qual Res 13(3):977–991
Pandey PK, Patel KS, Lenicek J (1999) Polycyclic aromatic hydrocar-bons: need for assessment of health risks in India? Study of anurban-industrial location in India. Environ Monit Assess 59:287–319
Park SS, Kim YJ, Kang CH (2002) Atmospheric polycyclic aromatichydrocarbons in Seoul, Korea. Atmos Environ 36:2917–2924
Peng L, Zeng FG, Chen M (2003) Distribution characteristics and sourceanalysis of n-alkanes and PAHs in total suspended particulates inurban area of Taiyuan city. Rock Miner Anal 22:206–210
Pies C, HoffmannB, Petrowsky J, Yang Y, Ternes TA, Hofmann T (2008)Characterization and source identification of polycyclic aromatichydrocarbons (PAHs) in river bank soils. Chemosphere 72:1594–1601
Prasad MVSN, Sharma C, Arya BC, Mandal TK, Singh S, KulshresthaMJ, Agnihotri R, Mishra SK, Sharma SK (2013) Experimental fa-cilities to monitor various types of atmospheric parameters in theRadio and Atmospheric Sciences Division (RASD) of CSIR-National Physical Laboratory. Mapan-J Metrol Soc India 28(3):193–203
Raiyani CV, Jani JP, Desai NM, Shah PG, Shah SH, Kashyap SK (1993a)Characterization and problems for indoor Pollution due to cookingstove smoke. Atmos Environ 27A:1643–1655
Raiyani CV, Jani JP, Desai NM, Shaha JA, Kashyap SK (1993b) Levelsof PAHs in ambient environment of Ahmedabad city. Indian JEnviron Prot 13:206–221
Ravindra K, Sokhi R, Van Grieken R (2008a) Atmospheric polycyclicaromatic hydrocarbons: source attribution, emission factors and reg-ulation. Atmos Environ 42:2895–2921
Ravindra K, Wauters E, Grieken RV (2008b) Variation in particulatePAHs levels and their relation with the transboundary movementof the air masses. Sci Total Environ 396:100–110
Rogge WF, Hil demann LM, Mazurek MA, Cass GR, Simoneit BRT(1993) Sources of fine organic aerosol: 2. no catalyst and catalyst-
Environ Sci Pollut Res
equipped d automobiles and heavy-duty diesel trucks. Environ SciTechnol 27:636–651
Sahu SK, Pandit GG, Sharma S (2001) Levels of PAHs in ambient air ofMumbai. In Proceedings of 10th NSE, EAD, BARC, Mumbai (pp.279–281).4–6 June
Sharma S (2014) Identification and quantification of polycyclic aromatichydrocarbons in fine aerosol of Delhi City. Master of TechnologyThesis, IIT Delhi
Sharma H, Jain VK, Khan ZH (2007) Characterization and source iden-tification of PAH in the urban environment of Delhi. Chemosphere66:302–310
Sharma SK, Singh AK, Saud T, Mandal TK, Saxena M, Singh S, GhoshSK, Raha S (2012) Study on water-soluble ionic composition ofPM10 and related trace gases over Bay of Bengal during WICARB campaign. Meteorol Atmos Phys 118(1–2):37–51
Sharma SK, Mandal TK, Rohtash M, Kumar NC, Gupta H, Pathak RC(2014) Measurement of ambient ammonia over the National CapitalRegion of Delhi, India. Mapan-J Metrol Soc India. doi:10.1007/s12647-014 0098–9
Shen Z, Cao J, Arimoto R, Han Y, Zhu C, Tian J, Liu S (2010) Chemicalcharacteristics of fine particles (PM1) from Xi’an, China. AerosolSci Technol 44:461–472
Shukla VK, Kumar K, Singh VK, Gautam D, Sushil KT, Kamyotra JS(2013) Indian J Air Pollut Contrl 8:34–42
Sienra MR, Rosazza NG, Prendez M (2005) Polycyclic aromatic hydro-carbons and their molecular diagnostic ratios in urban atmosphericrespirable particulate matter. Atmos Environ 75:267–281
Singh DK, Lakshay, Gupta T (2014) Field performance evaluation duringfog-dominated wintertime of a newly developed denuder-equippedPM1 sampler. Environ Sci Pollut Res. doi:10.1007/s11356-013-2371-9
Sklorz M, Schnelle-Kreis J, LiuY OJ, Zimmermann R (2007) Daytimeresolved analysis of polycyclic aromatic hydrocarbonsin urban aero-sol samples—impact of sources and meteorological conditions.Chemosphere 67:934–943
Tare V, Tripathi SN, Chinnam N, Srivastava AK, Dey S, Manar M,Kanawade VK, Agarwal A, Kishore S, Lal RB, Sharma M D2006]Measurement of atmospheric parameters during Indian space re-search organization geosphere biosphere program land campaignII at a typical location in Ganga Basin: 2. chemical properties. JGeophys Res 111:1–14. doi:10.1029/2006JD007279, D23210
USEPA, 1987. Quality criteria for water; EPA 440/5-86-001Velasco E, Siegmann P, Siegmann HC (2004) Exploratory study of
particle-bound polycyclic aromatic hydrocarbons in different envi-ronments of Mexico City. Atmos Environ 38:4957–4968. doi:10.1016/j.atmosenv.2004.05.020
Yang HH, Lai SO, Hsieh LT, Hsueh HJ, Chi TW (2002) Profiles of PAHemission from steel and iron industries. Chemosphere 48:1061–1074
Environ Sci Pollut Res
Related Documents