Specialty Review and Recertification Course: Research Design, Evidence‐Based Medicine and Statistical Analysis, Part 1 and 2 Krystal L. Moorman, Pharm.D., BCPS Clinical Assistant Professor and Experiential Program Director University of Utah College of Pharmacy Learning Objectives At the end of the presentation, the pharmacist should be able to 1. Interpret biomedical literature with regard to study design methodology, statistical analysis, and significance and applicability of reported data and conclusions. 2. Explain the use of evidence‐based treatment guidelines and protocols. Format: This session will present articles used as the case examples for reviewing common study design and statistical issues. The session will use audience response system and self‐reflection questions to engage the audience in the key concepts. Premise: Participants in this course are pharmacists who have clinical practices in health system care settings. Participants will have had some previous statistics and literature evaluation courses and experiences. This session will serve as a review and help to identify areas that merit further study in preparation for the board exam. __________________________________________________________________________________________________________ ©2017 American Society of Health-System Pharmacists, Inc. All rights reserved. 1

Welcome message from author
This document is posted to help you gain knowledge. Please leave a comment to let me know what you think about it! Share it to your friends and learn new things together.
Transcript

Specialty Review and Recertification Course: Research Design, Evidence‐Based Medicine and Statistical Analysis, Part 1 and 2
Krystal L. Moorman, Pharm.D., BCPS Clinical Assistant Professor and Experiential Program Director
University of Utah College of Pharmacy
Learning Objectives
At the end of the presentation, the pharmacist should be able to
1. Interpret biomedical literature with regard to study design methodology, statistical analysis, andsignificance and applicability of reported data and conclusions.
2. Explain the use of evidence‐based treatment guidelines and protocols.
Format: This session will present articles used as the case examples for reviewing common study design and statistical issues. The session will use audience response system and self‐reflection questions to engage the audience in the key concepts.
Premise: Participants in this course are pharmacists who have clinical practices in health system care settings. Participants will have had some previous statistics and literature evaluation courses and experiences. This session will serve as a review and help to identify areas that merit further study in preparation for the board exam.
__________________________________________________________________________________________________________ ©2017 American Society of Health-System Pharmacists, Inc. All rights reserved.
1
Practice Questions Question 1: You want to know if this study applies to your patients before reading it. You want to know if the study has:
A. Internal validity B. External validity C. Face validity D. Content validity
Question 2: In comparing parallel and crossover study designs, which of the following is a feature of only crossover studies?
A. Outcomes are assessed prospectively B. Patients are selected to participate C. Patients are randomized to therapy D. Patients have a washout period
Question 3: Which of the following sources of bias is most likely in this trial, given that it was open‐label, and background therapies were administered at the discretion of the attending physician?
A. Co‐intervention B. Placebo effect C. Measurement bias D. Performance bias
Question 4: Which of the following types of bias can be assessed by reviewing the characteristics of the patients in each study group?
A. Allocation B. Attrition C. Classification D. Compliance
Question 5: Which of the following types of data is the primary outcome used in this study?
A. Continuous B. Nominal C. Ordinal D. Variant
Question 6: Which of the following statistical tests is most appropriate to use to determine whether there is a difference in the percentage of patients who experienced an event?
A. Chi‐square B. Mann Whitney U C. McNemar D. Student’s t‐test
__________________________________________________________________________________________________________ ©2017 American Society of Health-System Pharmacists, Inc. All rights reserved.
2

Question 7: In concluding that there is no difference between the groups, the researchers are most like to make which hypothesis testing error?
A. Type I B. Type II C. Type III D. Type IV
Question 8: The absolute risk reduction for the primary outcome is approximately:
A. 0.002% B. 0.2% C. 1% D. 0.001%
Question 9: Which of the following is the absolute risk reduction in death at 90 days from the use of albumin instead of crystalloid in patients with septic shock at the time of enrollment?
A. 0.77% B. 3.1% C. 6.9% D. 9.9%
Question 10: Which of the following would indicate low heterogeneity in a meta‐analysis?
A. Cochran Q <0.05 B. Cochran Q < 0.01 C. I2 statistic > 50% D. I2 statistic < 25%
Question 11: Which of the following types of study designs best characterize the methodology used in this study?
A. Case control B. Cross‐sectional C. Experimental D. Follow‐up
Question 12: Which of the following types of bias might have been introduced by the lack of blinding in the warfarin arm in the RE‐LY study?
A. Compliance B. Measurement C. Observational D. Selection
__________________________________________________________________________________________________________ ©2017 American Society of Health-System Pharmacists, Inc. All rights reserved.
3

Questionnaire for Evaluating Primary Literature Linda S. Tyler, Pharm.D.
Introduction
Is the reason for conducting the study discussed?
Are the study objectives clearly defined?
Is the null hypothesis clear?
Methodology For each of the following questions, assess how this might influence the results or affect the validity of the study Selection bias
Have adequate measures been taken to prevent selection bias?
Is the study population adequately defined?
How were subjects selected? What are the inclusion criteria? Are the selection procedures clearly defined?
Case‐control:
How were cases selected?
How were controls selected?
Are the controls comparable to the cases?
Was bias introduced in the selection process? Follow‐up/cross‐sectional:
How was the study population selected?
Was bias introduced in the selection process? Experimental:
Were subjects randomly selected?
Did all qualified subjects have an equal chance of being admitted to the study?
Are the treatment groups comparable?
Are pertinent patient specific data provided? (i.e. healthy subjects vs patients, sex, age, concurrent disease states, concurrent therapy, race, weight or other pertinent information)
Have adequate measures been taken to prevent classification bias?
Does the study use specific definitions for the study parameters?
How were patients classified for entrance into the study? Do they have the disease of interest? (case‐control, experimental)
Observational Studies (other issues)
Is the severity of disease described?
How were the risk factors classified?
How were the outcomes classified?
Have adequate measures been taken to prevent confounding bias?
Have measures been taken to prevent competing interventions that may influence the results?
Are exclusion criteria clearly defined?
Have adequate measures been taken to prevent information bias?
Are data sources used appropriate and likely to have the appropriate information?
What is the quality of the data?
Have the issues related to recall bias been adequately addressed? (case‐control, or retrospective follow‐up study)
All study designs
Have adequate measures been taken to prevent measurement bias?
What measures were used to evaluate the outcomes of the study?
Are they adequately described?
Were the measures used appropriate?
Were objective measures used?
Are the measures reproducible?
Were subjects observed for a sufficient length of time?
Have adequate measures been taken to prevent observer bias?
Are the observers specified?
Have measures been taken to prevent inter‐observer variation?
Experimental studies (other issues)
Were subjects randomized?
Are randomization procedures appropriate and clearly defined? [Allocation bias]
Are the interventions well described?
Is the study blinded? Are blinding procedures appropriate?
Were specific data on drug regimens given including dose, dosage form, duration of administration, time of dose in relationship to meals?
Were all study drugs given in appropriate doses and regimens?
Are both groups comparable, and treated in the same manner, except for the intervention?
Were the measures adequate to insure or evaluate compliance?
Were there any competing therapies that would have influenced the results?
__________________________________________________________________________________________________________ ©2017 American Society of Health-System Pharmacists, Inc. All rights reserved.
4
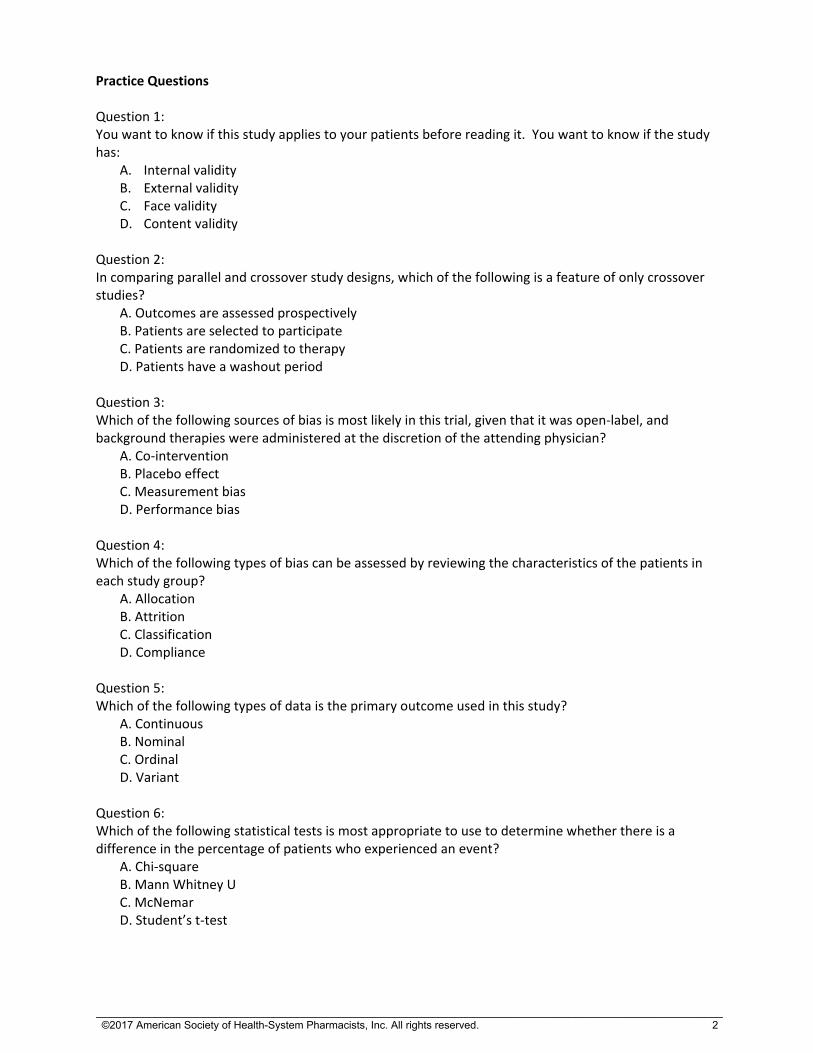
If the study is a crossover trial, was the washout period adequate between interventions?
Statistical Analyses
Have the authors described the statistical analyses to be used in the study?
Are the statistical tests appropriate for the type of data (nominal, ordinal, continuous)?
Is the sample size determination information included?
Have appropriate significance levels been established?
Is the power of the study described? Overall methodology
Based on the methodology, is the study likely to have external validity?
Is the study sample representative of the general population?
Were the interventions practical? (experimental)
Results Patients studied
Are the numbers of patients specified?
Can all patients be accounted for?
Are the numbers of dropouts given? Are the reasons for dropping out described? (experimental, follow‐up)
Were sufficient numbers of patients studied?
Were patient demographics presented?
Do the groups look similar based on demographics?
Data presentation
Are data presented for all measurements specified in the methodology?
Are data presented objectively?
Are data clear and understandable?
Statistical Analyses
Are appropriate descriptive statistics presented? [i.e. measure of central tendency (median, mean, mode), spread of the data (range), variation in the data (SD)]
Are p values and confidence intervals specified?
Are the inferential statistical tests applied appropriately?
Are statistical analyses meaningful?
Discussion/ Conclusions
Are the author’s conclusions appropriate based on the data presented?
Are the results statistically significant?
Are the results clinically significant?
Does the author discuss objectively the limitations to the study?
Are the conclusions consistent with the purpose of the study?
Can the conclusions be extrapolated to the population in general?
Overall
Do the title and abstract appropriately reflect the content of the study?
Does the author cite mostly primary literature? Is the article referenced appropriately?
Who sponsored the study?
What is the reputation of the journal? Is it peer reviewed?
Are there editorials available that discuss the article? (companion editorials or editorials that come out later)
In general, what are the study’s strengths and weaknesses?
Does the study have internal validity?
Does the study have external validity? Is it relevant to your problem/situation/practice?
©2015, Linda S. Tyler, Pharm.D., Salt Lake City, UT. Used with permission.
__________________________________________________________________________________________________________ ©2017 American Society of Health-System Pharmacists, Inc. All rights reserved.
5

Overview of Study Designs Linda S. Tyler, Pharm.D.
Study Design Features Examples / Applications Potential Problems
Descriptive Describes an observationNo comparison groups
Case study, case series, new service or program, educational intervention, some types of surveys
Often first information available
Ideas for future studies
Some areas this is the only type of information available: e.g. Toxicology/ poisonings, drugs in pregnancy
Not generalizable
“Anecdotal”
Case‐Control (Observational, comparison groups) Also called: retrospective
Identify cases with the disease of interest (outcome)
Identify controls without the outcome
Look back in time to assess the risk factors
Often first comparative study design applied to new diseases or outbreaks
Used to study “rare” diseases
Can evaluate multiple risk factors
In general, relatively easy and less expensive to conduct
Selection bias: How were cases identified? How were controls identified?
Classification bias: Were risk and outcomes appropriately classified?
Information bias: adequacy of information
Information bias: recall bias
Highly susceptible to confounding bias
Bonferroni effect: If you evaluate enough things, by chance, one of them is bound to be significant
Weakest cause and effect relationship
Follow‐up (Observational, comparison groups) Also called: cohort, longitudinal, prospective
Identify a study population
Exclude individuals with the outcome of interest
Classify according to risk factor
Follow over time and assess if they develop the outcome of interest.
Considered the strongest study design of the observational studies; comes the closest to ascertaining cause and effect relationships
Because data are collected as the study progresses and according to the study design, data are more consistent with decreased issues of adequacy of information
Have a denominator and time frame! More likely to predict incidence
In general, more difficult to do and more expensive
Selection bias: How was the study population selected?
Classification bias (as above)
Hawthorne effect: Would participants behave differently because they were watched more closely?
Surveillance bias: Is one group watched more closely than the other?
How does the group change over time?
Attrition bias: Who was lost to follow‐up?
If a retrospective follow‐up, then issues with information bias as above
__________________________________________________________________________________________________________ ©2017 American Society of Health-System Pharmacists, Inc. All rights reserved.
6
Study Design Features Examples / Applications Potential Problems
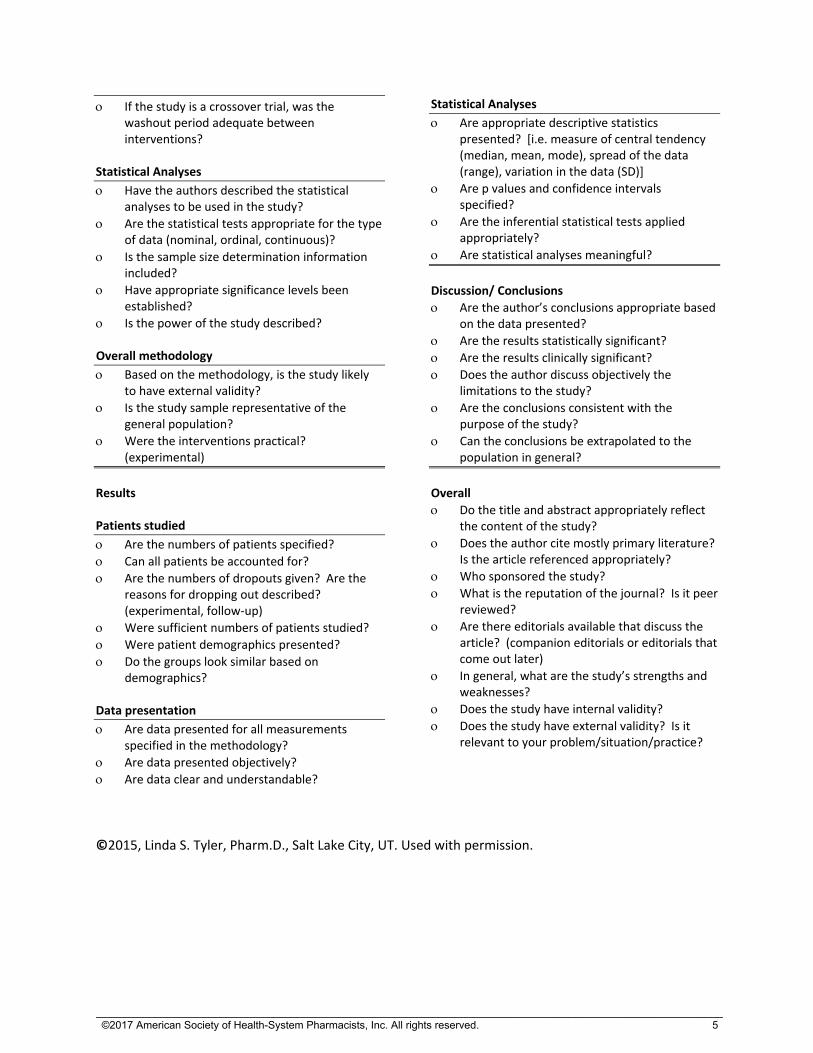
Cross‐sectional (Observational, comparison groups)
Identify a study population
Classify into groups based on outcome
Classify risk factors
“Slice of life”: study occurs in the present
Often an initial study design used to see how common an event is
Surveillance bias and Hawthorne effect unlikely problems
Attrition bias unlikely
In general, relatively easy and less expensive to conduct
Have a denominator! Can predict prevalence.
“Chicken and egg” problems: Hardest to demonstrate time/order relationships
Susceptible to confounding bias
Selection bias: How was the study population selected?
Classification bias (as above)
Experimental (Investigator intervention, comparison groups) Parallel Cross‐over/ sequential
Investigator decides how patients will be selected and assigned to groups
Patients must consent to participate
Once assigned to groups, individuals receive or participate in some sort of treatment or intervention
Investigator conducts measurements to assess outcome
Used to evaluate the efficacy of new drugs; compare the efficacy of two different treatment regimens
Considered the “Cadillac” of study designs
Able to “control” for more variables
Able to blind
Most likely to demonstrate cause and effect relationships
Considered the more difficult to conduct and most expensive
Selection bias: How were patients selected for the study?
Allocation bias: How were they allocated to the treatment/intervention groups?
Observer bias: Did the observers introduce bias to the study? Were the groups observed differently?
Measurement bias: Variation, reliability and validity
Compliance bias
Attrition bias
Crossover: Was the washout sufficient? Did the subjects change over time?
Evaluate generalizability
©2015, Linda S. Tyler, Pharm.D., Salt Lake City, UT. Used with permission.
__________________________________________________________________________________________________________ ©2017 American Society of Health-System Pharmacists, Inc. All rights reserved.
7

Statistical Tests Commonly Used in the Literature
Type of Data Two Independent Samples
Two related samples(Paired or Cross‐over)
Three or More Independent Samples
Nominal Data: Yes/no data, All or nothing Examples: Responded or not ADR or not Alive or Dead
Chi‐squared for 2 independent samples (1) Fishers exact
McNemar Test Chi‐Squared for k independent samples(2)
Ordinal Data: Ranked data; not mathematically equal intervalsExamples: Likert scales (1‐5: Strongly agree; agree, neutral, disagree, strongly disagree)
Mann‐Whitney U testWilcoxon rank sum test Kolmogorov‐ Smirnov
Sign testWilcoxon signed rank test
Kruskal Wallis one way analysis of variance (ANOVA)
Interval or continuous data: Data on a mathematical scaleExamples: Serum creatinine Blood Pressure Visual analog scale (VAS) Has descriptors for the ends, but not the points in the middle. Respondents can pick any value in between. (On a scale of 1‐10, 1 being no pain, 10 being the worst pain imaginable, what is your level of pain?)
Student’s t‐test (3) (for parametric data) Mann Whitney U test (for nonparametric data.)
Paired t‐test Analysis of variance (ANOVA) (4)
(1) Chi‐squared: The expected frequency of each cell must be at least 5. If n is less than 20, this test cannot be used. If n is between 20 and 40, you will need to calculate the expected frequency. If n is greater than 40, the expected frequency is this is usually greater than 5 but you may still want to calculate, especially if there are unequal numbers in the groups. Expected frequency is the value one would “expect” if the distribution was equal between the groups. It is calculated by the following equation. Expected frequency of a cell: = [(total of row) x (total of column)]/total n (2) For multiple comparisons, all cells must have an expected frequency of at least 1, and greater than 20% of the cells must have an expected frequency of 5. If these requirements are not met, the test cannot be used. However, there really are no alternative tests to use in this situation. (3) The Student’s t‐test requires that several assumptions be true: the variance of each groups should be similar, both groups must have normal distribution. The sample size must be “large”. The last one is a controversial point. If the n of the study is less than 20, then the t‐test should not be used. If the total n for the study is greater than 40, a t‐test could probably be used, especially if the two samples were fairly equal in size. For total sample sizes of 20 – 40, it is controversial—being conservative, the t‐test should probably not be used. (4) For groups of 3 or more, you will sometimes see in the literature, the application of multiple t‐tests (compare group A and B, then B and C, and finally A and C). This would be considered inappropriate. The ANOVA test works by seeing if a difference exists. If one exists, then other statistical tests are applied to detect between which groups the difference appears. These additional tests are called multiple comparison procedures or post hoc tests. Portions of the table adapted from: Elenbaas RM, Elenbaas JK, Cuddy PG: Evaluating the medical literature Part II: Statistical analysis, Ann Emerg Med 1983;12:610‐620. ©2015, Linda S. Tyler, Pharm.D., Salt Lake City, UT. Used with permission.
__________________________________________________________________________________________________________ ©2017 American Society of Health-System Pharmacists, Inc. All rights reserved.
8

Non‐inferiority trials pearls
In plain English (which for statistical reasons we can’t say out loud), we are trying to determine if Drug A is at least similar or better than Drug B. Just want to be sure Drug A is not much worse than Drug B. We must always state that we are trying to determine if Drug A is non‐inferior to Drug B. Uses a different null hypothesis: Drug A is not non‐inferior to Drug B. Can’t claim superiority right off from a non‐inferiority trial; but can do non‐inferiority then a superiority analysis in the same study on the same data, but it needs to be pre‐determined in the methods. You may see non‐inferiority testing for efficacy with superiority for safety events. Because both may be going on in the same study, or both on the same data, check methods carefully. Statistics are set up by defining an alpha, beta, and delta value. Expect the usual values for alpha and beta (0.05 and 0.1‐0.2 respectively). The delta value is the non‐inferiority margin, or also called largest clinically acceptable difference. To set up the comparisons, a confidence interval is calculated—to conclude they are non‐inferior, the CI must exclude the “lower end” of the delta (lower end—value “below” which Drug A would be considered inferior.) Note: Watch direction of data—depending how they are set up, the lower end may be an “upper” end. For instance, the direction will be different for cure rate vs adverse event rate—with cure rate the higher number would be better and with ADRs the lower number is better. Which side of the delta value indicates Drug A is worse? Does the confidence interval include that value? If so, then the drugs are not noninferior—Drug A is worse than Drug B. You may see a one sided test—You are only interested in one direction, though you can use a two sided test. Typically, you could see a 97.5% confidence interval for 1‐side test with p value less than 0.025. P values are the same, but different If P less than 0.05 (or the alpha value selected), you reject the null hypothesis (just like
hypothesis testing in superiority trials). You conclude that Drug A is non‐inferior to Drug B (or in plain English, Drug A is no worse than Drug B)
If P is 0.05 or greater, you accept the null hypothesis and conclude: Drug A is not non‐inferior to Drug B (eliminating the double negatives, in plain speak, would be: Drug A is inferior to Drug B)
Check for common pitfalls: Is the delta reasonable? Researchers may chose a larger than necessary delta making it easier
to show they are non‐inferior. Is dosing equipotent? If use lower doses of standard drug (Drug B), then easier to show they are
non‐inferior. What data did they include in their analysis? You are looking for per protocol. Intention to treat
(ITT) analysis easier to show non‐inferiority. Ideally, you want to see both per protocol and ITT. ©2015, Linda S. Tyler, Pharm.D., Salt Lake City, UT. Used with permission.
__________________________________________________________________________________________________________ ©2017 American Society of Health-System Pharmacists, Inc. All rights reserved.
9

Assessing Risk Prevalence vs. Incidence Prevalence = [Number of cases at a given point in time] / [number of persons in group at that time] Incidence = [Number of new cases occurring during a given time] / [number of persons in group during same time interval]
Set up a 2x 2 table to represent data.
Risk factor
Disease (Outcome)
Present
Absent
Present (exposed group) A B A+B
Absent (unexposed group) C D C+D
Odds Ratio = OR = AD / BC. Use OR for case control studies and cross‐sectional studies.
The OR represents an estimation of the risk based on two assumptions:
The control group is a representative sample of the general population in terms of the risk factors
Assumes that the values A and C are relatively uncommon. Odds ratio is based on prevalence. Relative risk cannot be used since the numbers from a case control trial do not represent the incidence in a population (there is no denominator or sample population; there is no rate of development of outcome over
time).
Relative risk = RR = [A / A+B] / [C/C+D] Use RR for follow‐up studies and experimental studies. In these studies, risk is presented as relative risk, RR. You don’t have to estimate the risk because you have a starting sample population and you can calculate the risk. You also don’t have to make assumptions. It is calculated by setting up the 2 x 2 table in the same way. Risk is a proportion of the incidences of the outcome in the two risk groups. You also know the time frame in which the outcome developed.
If OR was used instead of a RR (or vice versa), you can usually calculate it and see if the mistake makes a big difference. Typically, the OR is further away from 1 than the RR; so the RR will be closer to 1 and thus more conservative. OR and RR approach being the same value as A and C become are relatively small. (You can figure this out from the equations because A and C will have little to contribute to the denominator.) RR evaluates the proportion of the incidences—as such it doesn’t tell you how frequently the event occurs, only that it occurs so many times more or less often than in the other group.
Interpreting OR and RR Numbers greater than one indicate that the first line on the 2x2 table is the factor at greater risk compared to the second
line, for being associated with the outcome. For numbers less than 1, take the inverse and apply the same associations. This means that the first line in the 2x2 table has a decreased risk of causing the outcome, compared to the other factor.
1 = no difference
2 – 5 = mild association
5 – 10 = moderate association
10 = strong association
Relative Risk Reduction =RRR={[C/C+D] – [A/A+B]}/[C/C+D] Also = 1‐RR If relative risk =0.6, then the relative risk reduction is 0.4, but this is often reported as 40% reduction.
Attributable Risk or Absolute Risk Reduction = ARR = [A/A+B] ‐ [C/C+D] Represents the difference in incidences between the two groups vs the RR which is the two proportions divided. Used for follow‐up and experimental studies since these are the only study designs that capture incidence. Considers how frequently an event occurs (incidence) and the difference in this frequency. Distinguishes between 1 in a million, and 1 in ten. The other measures above (OR, RR, RRR) are looking at the difference in the proportions!
Number Needed to Treat = NNT = 1/ARR Tells you how many patients you would need to treat with the intervention in question in order to prevent an event which would otherwise occur. Some also use the concept as number needed to harm (NNH) if they are evaluating an adverse outcome: How many patients would you need to treat before observing the adverse outcome. NNT also considers frequency
but in terms of how many patients you would need to see to observe the benefit or harm being evaluated.
©2015, Linda S. Tyler, Pharm.D., Salt Lake City, UT. Used with permission.
__________________________________________________________________________________________________________ ©2017 American Society of Health-System Pharmacists, Inc. All rights reserved.
10

Sensitivity, Specificity, Predictive Value and Efficiency These parameters represent the vocabulary used to describe diagnostic tests, and compare them with other tests. Set up a table:
“New Test”
“Gold Standard” test (Reference Test)
Disease present(Positive)
Disease absent(Negative)
Disease present (Positive) A B
A+B
Disease absent (Negative) C D
C+D
A+C B+D A+B+C+D
Parameter Equation to calculate
Sensitivity Ability to identify those who have the disease (Addresses “false negatives” = 100% ‐ sensitivity )
A / A+C
Specificity Ability to correctly identify those who don’t have the disease (Addresses “false positives” = 100% ‐ specificity )
D / B+D
Positive Predictive Value (of the people who tested positive, how many had the disease)
A / A+B
Negative Predictive Value (of the people who tested negative, how many did not have the disease)
D / C+D
Efficiency (Ability to correctly classify patients; in this study this was called “observed accuracy”)
A+D / A+B+C+D
Memory aids: Each of these is the “correct” classification (both tests assess as positive or both assess as negative), divided by the denominator for the applicable column, row, or diagonal.
Sensitivity and specificity deals with the columns and are in alphabetical order from left to right.
Predictive value deals with the rows.
Efficiency evaluates everything so is the “diagonal” divided by the total.
©2015, Linda S. Tyler, Pharm.D., Salt Lake City, UT. Used with permission.
Internet statistical resources: **(All links may be accessed via RxWebLinks: http://pharmacyservices.utah.edu/rxweblinks/ under statistics section)** RxWebLinks is the University of Utah Drug Information Service meta‐website for most useful websites. General stats info: Wikipedia: http://en.wikipedia.org/wiki/Statistics plus search any stats term you are looking up. Under usual circumstances I would not recommend Wikipedia as a resource because of the open source nature of the reference. However, I have found it may be a good place to start for descriptions for many statistical terms and it provides good links to other resources. This link is specific to the statistics section which gives a brief primer; the resources at the end are good too. Please be sure to check other references as well. StatPages.net http://statpages.org Great general reference with lots of interactive pages. Links to online statistical pages. Worth browsing the intro page to see all the available resources. Reading statistics and Research: http://www.readingstats.com/ Companion website for the book: Huck SW. Reading Statistics and Research 6th edition. Boston: Pearsons, 2012: The website has lots of quizzes and resources
__________________________________________________________________________________________________________ ©2017 American Society of Health-System Pharmacists, Inc. All rights reserved.
11
to work through. It also lists some other articles that help illustrate key points (checkout e‐articles) Rice University Virtual Lab in Statistics: http://onlinestatbook.com/rvls.html Includes five sections: Hyperstat: statistics “book” with links to other statistics sites; Online Statistics: Interactive Multimedia Course of Study; Simulations and demonstrations: lots of visuals to explain concepts; Case studies: includes some medical examples to explain concepts, and Analysis Lab: demonstrates how to work with data. Simple Interactive Statistical Analysis: http://www.quantitativeskills.com/sisa/ Allows you to conduct statistical analysis directly in the program. Good to give you a feel for how the various statistical tests works. Internet resources especially good for sample size issues: See StatPages.Net above has good, relatively easy to use power calculators. See also: JavaStat: Post‐hoc power analysis. http://statpages.org/postpowr.html Good to use as a reader of the literature if authors fail to address power. Good description of controversy.
PS: Power and Sample Size calculations (Vanderbilt); http://biostat.mc.vanderbilt.edu/twiki/bin/view/Main/PowerSampleSize Software that can be downloaded to calculate sample size. Addresses several hard to find issues in sample size calculations such as for paired data.
Creative Research Systems: Sample size calculator: www.surveysystem.com/sscalc.htm Sample size calculator for survey research.
Effect Size: Curriculum, Evaluation, and Management Center, Durham University http://www.cem.org/evidence‐based‐education is the main site. The url for the effect size description is: http://www.cem.org/effect‐size‐resources This focuses on education research however is one of the clearest explanations of effect size and its application.
©2015, Linda S. Tyler, Pharm.D., Salt Lake City, UT. Used with permission.
__________________________________________________________________________________________________________ ©2017 American Society of Health-System Pharmacists, Inc. All rights reserved.
12

Evidence based medicine resources All links at http://pharmacyservices.utah.edu/rxweblinks/ under Evidence Based Medicine. (RxWebLinks lists the favorite websites of the Drug Information Service at University of Utah Health Care) Tools for evaluating meta‐analyses
1. CASP: Critical Appraisal Skills Program: http://www.caspinternational.org/?o=1012 Tools developed by the Public Health Resource Unit of the NHS in Great Britain. Offers worksheets for evaluating systematic reviews, RCT, cohort, case‐control, and economic studies plus diagnostic test studies and clinical prediction rule.
2. Bandolier, independent group based out of Oxford to promote evidence based medicine principles, has a guide for meta‐analysis to help assess http://www.medicine.ox.ac.uk/bandolier/
Evaluating Guidelines 1. AGREE Instrument: http://www.agreetrust.org/ Assesses: Scope and purpose, stakeholder
involvement, rigor of development, clarity and presentation, applicability, editorial independence, and overall assessment.
2. Bandolier— http://www.medicine.ox.ac.uk/bandolier/
Essay on what makes a good guideline with two page checklist Home>Extended Essays> Scroll down to What is series> Good Clinical Guideline
http://www.medicine.ox.ac.uk/bandolier/painres/download/whatis/WhatareClinGuide.pdf
Evidence Based Medicine (EBM) glossary—defines and explains lots of terms, including statistical terms, used in evidence based medicine
National Guidelines Clearinghouse http://www.guidelines.gov/ Agency for Healthcare Research and Quality (AHRQ)
1. Excellent tool for comparing guidelines: Search: select guidelines to compare >Add to my collection>Compare guidelines
2. Ability to view major recommendations 3. View full text guideline
Sources of clinical guidelines 1. PubMed 2. AHRQ Guidelines.gov 3. Cochrane Collaboration http://www.cochrane.org
Meta‐analysis on topics
Only abstracts are available without a subscription; may have a subscription through your library
4. National Institute for Clinical Excellence http://www.nice.org.uk British National Health Service website
Contains national guidelines related to various disease states and health issues.
©2015, Linda S. Tyler, Pharm.D., Salt Lake City, UT. Used with permission.
__________________________________________________________________________________________________________ ©2017 American Society of Health-System Pharmacists, Inc. All rights reserved.
13
Searching hints
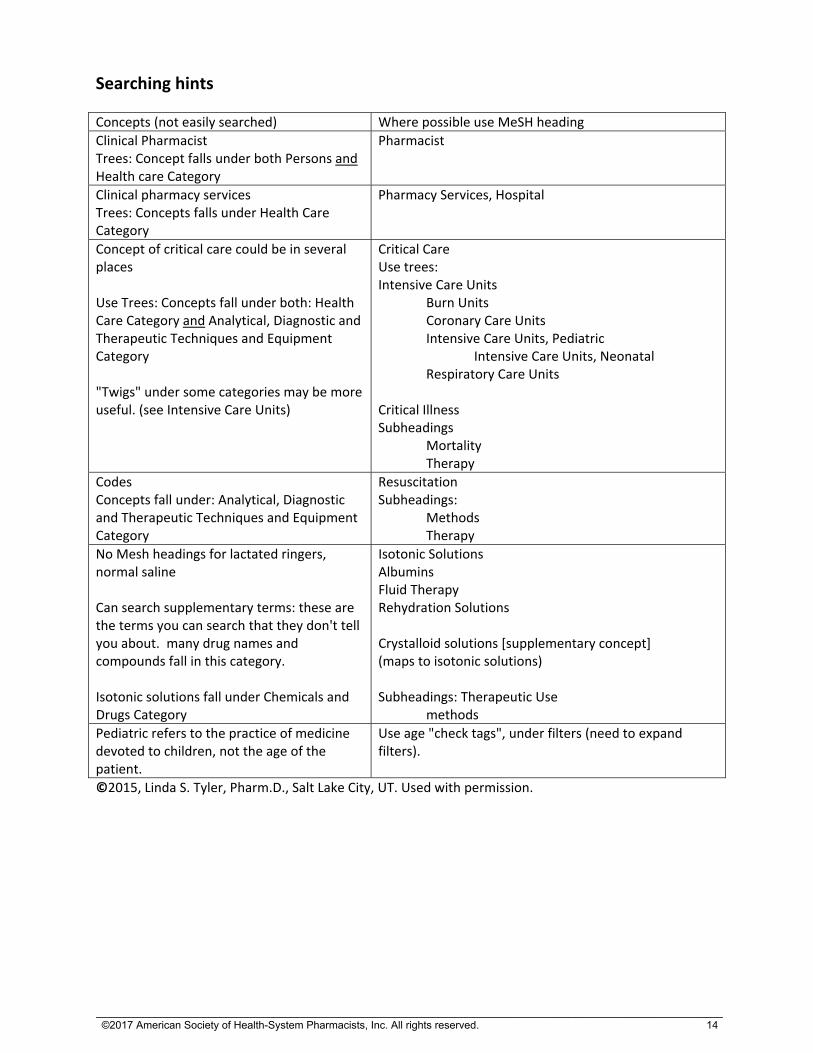
Concepts (not easily searched) Where possible use MeSH heading
Clinical Pharmacist Trees: Concept falls under both Persons and Health care Category
Pharmacist
Clinical pharmacy services Trees: Concepts falls under Health Care Category
Pharmacy Services, Hospital
Concept of critical care could be in several places Use Trees: Concepts fall under both: Health Care Category and Analytical, Diagnostic and Therapeutic Techniques and Equipment Category "Twigs" under some categories may be more useful. (see Intensive Care Units)
Critical Care Use trees: Intensive Care Units Burn Units Coronary Care Units Intensive Care Units, Pediatric Intensive Care Units, Neonatal Respiratory Care Units Critical Illness Subheadings Mortality Therapy
Codes Concepts fall under: Analytical, Diagnostic and Therapeutic Techniques and Equipment Category
Resuscitation Subheadings: Methods Therapy
No Mesh headings for lactated ringers, normal saline Can search supplementary terms: these are the terms you can search that they don't tell you about. many drug names and compounds fall in this category. Isotonic solutions fall under Chemicals and Drugs Category
Isotonic Solutions Albumins Fluid Therapy Rehydration Solutions Crystalloid solutions [supplementary concept] (maps to isotonic solutions) Subheadings: Therapeutic Use methods
Pediatric refers to the practice of medicine devoted to children, not the age of the patient.
Use age "check tags", under filters (need to expand filters).
©2015, Linda S. Tyler, Pharm.D., Salt Lake City, UT. Used with permission.
__________________________________________________________________________________________________________ ©2017 American Society of Health-System Pharmacists, Inc. All rights reserved.
14

PubMed Features to Refine Your Search Feature Location and Uses
Use MeSH to build search
Select MeSH instead of PubMed at opening page or under the heading "More Resources" at opening page. Allows to build search in MeSH.
MeSH Definition On MeSH entry—clarifies how term indexed and how long the term has been in use
MeSH Subheadings Use MeSH to add subheadings to terms—often only way to search some concepts well (e.g. surgical wound infections/pc (pc for prevention and control)
Restrict to MeSH heading
After subheadings on MeSH pages. One of choices allows you to only search that term and nothing below it (won't search the "twiggies")
MeSH Entry terms MeSH page. Provides synonyms for finding term
MeSH Trees (indexing hierarchy)
Lower on MeSH page—helps to clarify how the term is used and to identify more specific terms
Advanced PubMed Search page right below search bar. Provides opportunity to search specific to field. Also provides search history: you can go back to any step in your search if you want. You can compare number of results for each step in the search.
Filters Column on left of search page. Shows article types, text availability, publication dates, species, search fields.
Show additional filters PubMed search page: on left column at bottom. Can pick other categories such as languages, sex, ages, and search fields (an alternative way to search in specific fields—see also advanced search).
Display settings: Below search bar, top of white area. Different formats for citations. Can change display as far as items per page and how the search is displayed (date first, author first, journal first etc). This feature is also on the citation page.
Send to: Below search bar, top of white area. Can send to your clipboard, citation manager, or email citation. This feature is also on the citation page.
Clipboard: Below search bar, top of white area if you have sent articles to clipboard. It is a temporary area to park citations. From the Clipboard you can send all your articles (same send to locations as above).
Search details Describes how PubMed interpreted your search. For instance, if you enter surgical wound infection (not through MeSH) just directly into the search box, the search details tells you it searched it as surgical wound infection as a MeSH heading, then it tried to be helpful and added any articles with the term surgical in all fields (so in the title, abstract etc). As you can see, especially helpful if you enter multiple word searches.
Publication Types, MeSH Terms
Citation page below the citation. Provides MeSH headings used to index article. If you find the perfect article, and having difficult time finding other articles similar, see how the perfect article was indexed.
©2015, Linda S. Tyler, Pharm.D., Salt Lake City, UT. Used with permission.
__________________________________________________________________________________________________________ ©2017 American Society of Health-System Pharmacists, Inc. All rights reserved.
15

References
“Must read” Gelbach SH. Interpreting the medical literature. 5rd ed. New York: McGraw Hill, Inc. 2006. Still my favorite text on evaluating the medical literature. Examples are abundant. Very readable
(which is pretty remarkable for this topic). Some have said the exam started where this book left off. Use to reinforce the principles, then use other references to develop your sophistication in this area.
Gyatt G, Rennie D, Meade MO et al (ed). Users’ guides to the medical literature: essentials of evidence‐based clinical practice. Chicago: American Medical Association. 3rd edition, 2015. This is a compilation of the AMA users’ guides published between 1993‐2000. These are updated,
plus some additional sections. Lots of great tables and examples. Explanations are clear. This is the handbook pocket‐sized version.
Gyatt G, Rennie D, Meade MO et al (ed). Users’ guides to the medical literature: a manual for evidence‐based practice. Chicago: American Medical Association. 3rd edition 2015. This is the same information as above with expanded explanations in many areas—bigger manual
size. I prefer this larger edition. You probably want to get one or the other. Also very good . . . . Huck SW. Reading statistics and research 6th edition. Boston: Pearsons, 2012. Not specific to the biomedical sciences. Has a companion website for more info
http://www.readingstats.com . Book has had the answer to many of my statistical questions over the years. The website has lots of quizzes and resources to work through.
Hulley SB, Cummings SR, Browner WS et al. Designing clinical research. 4th edition Philadelphia:
Lippincott Williams and Wilkins. 2013 Especially good if you are going to do a research project. It walks you through the steps and all the
things you need to consider in planning a great project. I really like the tables in this book for planning sample size. It gives you a really good feel for if you vary parameters how it will change your sample size.
Two new free finds: Two books available for free from James Lind Library in pdf forms: www.jameslindlibrary.org.
Organizations dedicated to fair tests in health care and making the information public. (Click on Books to find the 3 books they offer for free—the following two related to statistical issues and study design.)
Evans I, Thorton H, Chalmers I et al. Testing treatments: better research for better healthcare, 2nd edition. London: Pinter & Martin Ltd, 2011. Available in pdf for free: www.testingtreatments.org
Woloshin S, Schwartz LM, Welch HG. Knowing your chances. Berkeley: University of California Press. 2008.
CMAJ Series on evidence based medicine including some statistic concepts:
__________________________________________________________________________________________________________ ©2017 American Society of Health-System Pharmacists, Inc. All rights reserved.
16

Wyer PCC, Keitz S, Hatala R et al. Tips for learning and teaching evidence‐based medicine: introduction to the series. CMAJ. 2004; 171:347‐8. Barratt A, Wyer PC, Hatala R et al. Tips for learners of evidence‐based medicine: 1. Relative risk reduction, absolute risk reduction and number needed to treat. CMAJ. 2004; 171:353‐8. Montoria VM, Kleinbart J, Newman TB et al. Tips for learners of evidence‐based medicine: 2. Measures of precision (confidence intervals). CMAJ. 2005; 171:611‐615. Correction. CMAJ. 2005; 172:162. McGinn T, Wyer PC, Newman TB et al. Tips for learners of evidence‐based medicine: 3. Measures of observer variability (kappa statistic). CMAJ. 2004; 171:1369‐73. Hatala R, Keitz S, Wyer P et al. Tips for learners of evidence‐based medicine: 4. Assessing heterogeneity of primary studies in systematic reviews and whether to combine their results. CMAJ. 2005; 172:661‐5. Montori VM, Wyer P, Newman TB et al. Tips for learners of evidence‐based medicine: 5. The effect of spectrum of disease on the performance of diagnostic tests. CMAJ. 2005; 173:385‐90. Annals of Emergency Medicine Series: This series is my favorite for summarizing statistical concepts. Gaddis ML, Gaddis GM. Introduction to biostatistics: Part 1, basic concepts. Ann Emerg Med. 1990; 19:86‐9. Gaddis GM, Gaddis ML. Introduction to biostatistics: Part 2, descriptive statistics. Ann Emerg Med. 1990; 19:309‐15. Gaddis GM, Gaddis ML. Introduction to biostatistics: Part 3, sensitivity, specificity, predictive value and hypothesis testing. Ann Emerg Med. 1990; 19:591‐7. Gaddis GM, Gaddis ML. Introduction to biostatistics: Part 4, statistical inference techniques in hypothesis testing. Ann Emerg Med. 1990; 19:820‐5. Gaddis GM, Gaddis ML. Introduction to biostatistics: Part 5, statistical inference techniques for hypothesis testing with non parametric data. Ann Emerg Med. 1990; 19:1054‐9. Gaddis ML, Gaddis GM. Introduction to biostatistics: Part 6, correlation and regression Ann Emerg Med. 1990; 19:1462‐8.
__________________________________________________________________________________________________________ ©2017 American Society of Health-System Pharmacists, Inc. All rights reserved.
17

Some articles from the current BMJ series on statistics with quiz questions. (Series starting in 2010 has been good to cover issues of statistics, methods, bias and study design issues.) Study design
Sedgwick P. Block randomisation. BMJ. 2011; 343:d7139. doi:10.1136/bmj.d7139. Sedgwick P. Explanatory trials versus pragmatic trials. BMJ. 2014; 349:g6694 doi:10.1136/bmj.g6694. Sedgwick P. Sample size: how many participants are needed in a cohort study? BMJ. 2014; 349:g6557doi:10.1136/bmj.g6557. Sedgwick P. Explanatory trials versus pragmatic trials. BMJ. 2014; 349:g6694 doi:10.1136/bmj.g6694. Sedgwick P. What is a factorial study design? BMJ. 2014; 349:g5455 doi:10.1136/bmj.g5455. Sedgwick P. What is crossover trial? BMJ. 2014; 349:g3191 doi:10.1136/bmj.g3191. Sedgwick P. Before and after study designs. BMJ. 2014; 349:g5074 doi:10.1136/bmj.g5074. Sedgwick P. Bias in observational study designs: prospective cohort studies. BMJ. 2014; 349:g77311 doi:10.1136/bmj.g7731 Sedgwick P. Randomised controlled trials: Balance in baseline characteristics. BMJ. 2014; 349:g5721 doi:10.1136/bmj.g5721.
Survival analysis
Sedgwick P. Survival (time to event) data I. BMJ. 2010; 341:c3537. doi:10.1136/bmj.c3537. Sedgwick P. Survival (time to event) data II. BMJ. 2010; 341:c3665. doi: 10.1136/bmj.c3665. Sedgwick P. Survival (time to event): Median survival times. BMJ. 2011; 343:d4890 doi:10.1136/bmj.d4890. Sedgwick P. Survival (time to event): Censored observations. BMJ. 2011; 343:d4816 doi:10.1136/bmj.d4816. Sedgwick P. How to read a Kaplan‐Meier survival plot. BMJ. 2014; 349:g5608 doi:10.1136/bmj.g5608.
Interpreting risk
Sedgwick P. Hazard ratios. BMJ. 2011; 343:d5918. doi:10.1136/bmj.d5918. Sedgwick P. Hazards and hazard ratios. BMJ. 2012; 345:e5980 doi: 10.1136/bmj.e5980.
Statistics
Sedgwick P. Understanding statistical hypothesis testing. BMJ.2014; 348:g3557 doi: 10.1136/bmj.g3557. Sedgwick P. Pitfalls of statistical hypothesis testing: Type I and Type II errors. BMJ. 2014; 349:g4287 doi:10.1136/bmj.g4287 Sedgwick P. The log rank test. BMJ. 2010; 341:c3773. doi:10.1136/bmj.c3773. Sedgwick P. Multiple significance tests: the Bonferroni correction. BMJ. 2012; 344:3509. doi:10.1136/bmj.e509. Sedgwick P. Multiple hypothesis testing and Bonferroni's correction. BMJ. 2014; 349:g6287 doi:10.1136/bmj.g6287. Sedgwick P. Confidence intervals and statistical significance. BMJ. 2012; 344:e2238 doi: 10.1136/bmj.e2238. Sedgwick P. Confidence intervals: predicting uncertainty. BMJ. 2012; 344:e3147 doi: 10.1136/bmj.e3147. Sedgwick P. Confidence intervals and statistical significance: rules of thumb. BMJ. 2012; 345:e4960 doi: 10.1136/bmj.e4960.
__________________________________________________________________________________________________________ ©2017 American Society of Health-System Pharmacists, Inc. All rights reserved.
18

Sedgwick P. Understanding confidence intervals. BMJ. 2014; 349:g6051 doi:10.1136/bmj.g6051. Sedgwick P .Spearman's rank correlation coefficient. BMJ. 2014; 349:g7327 doi:10.1136/bmj.g7327. Sedgwick P. Randomised controlled trials: tests of interaction. BMJ. 2014; 349:g6820 doi:10.1136/bmj.g6820. Sedgwick P. One way analysis of variance: post hoc testing. BMJ. 2014; 349:g7067 doi:10.1136/bmj.g7067. Sedgwick P. Pitfalls of statistical hypothesis testing: multiple testing. BMJ. 2014; 349:g5310 doi:10.1136/bmj.g5310. Sedgwick P. Understanding why "absence of evidence is not evidence of absence". BMJ. 2014; 349:g4751 doi:10.1136/bmj.g4751. Sedgwick P. Understanding P values. BMJ. 2014; 349:g4550 doi:10.1136/bmj.g4550. Sedgwick P. Randomised controlled trials: missing data. BMJ. 2014; 349:g4656 doi:10.1136/bmj.g4656.
Other
Sedgwick P. Non‐inferiority trials. BMJ. 2011; 342:d3253. doi:10.1136/bmj.d3253. Sedgwick P. How to read a forest plot. BMJ. 2012; 345:e8335 doi: 10.1136/bmj.e8335. Sedgwick P. Meta‐analysis: testing for reporting bias. BMJ. 2014; 350:g7857 doi:10.1136/bmj.g7857.
Clinical guidelines Jaeschke R, Guyatt GH, Schunemann H. The things you should consider before you believe a clinical practice guideline. Intensive Care Med; Dec 2014. DOI 10.1007/s00134‐014‐3609‐9.
Power and sample size Designing Clinical Research (see "Also very good section")
Websites (see resource guide). Sample size calculators can be daunting, usually because they use different vocabulary between the sites. If you know the key things they are asking for, you can usually figure it out.
Goodman SN, Berlin JA. The use of predicted confidence intervals when planning experiments and the misuse of power when interpreting results. Ann Intern Med. 1994; 121:200‐6. Lantos JD. Sample size: Profound implications of mundane calculations. Pediatrics 1993; 91:155‐7. Non‐inferiority Lesaffre E. Superiority, equivalence, and non‐inferiority trials. Bull NYU Hosp Joint Dis. 2008; 66:150‐4. Kaul S, Diamond GA. Good enough: A primer on the analysis and interpretation of noninferiority trials. Ann Intern Med. 2006; 145:62‐9. LeHenanff A, Giraudeau B, Baron G et al. Quality of reporting of noninferiority and equivalence randomized trials. JAMA. 2006; 295:1147‐51. Piaggio G, Elbourne DR, Altman DG et al. Reporting of noninferiority and equivalence randomized trials: An extension of the CONSORT statement. JAMA. 2006; 295:1152‐60. Gotzsche PC. Lessons from and cautions about noninferiority and equivalence randomized trials. JAMA. 2006; 295:1172‐4.
__________________________________________________________________________________________________________ ©2017 American Society of Health-System Pharmacists, Inc. All rights reserved.
19

Fueglistaler P, Adamina M, Guller U. Non‐inferiority trials in surgical oncology. Ann Surg Oncol. 2007; 14:1532‐9. Mulla SM, Scott IA, Jackevicius CA et al. How to use a noninferiority trial: Users' guides to the medical literature. JAMA. 2012; 308:2605‐11. Sub‐group analysis Wang R, Lagakos SW, Ware JH et al. Statistics in medicine—reporting of subgroup analyses in clinical trials. N Engl J Med. 2007; 357:2189‐94. The accompanying editorials to this article include:
Proestel S. Subgroup analyses in clinical trials—to the editor. N Engl J Med. 2008; 358:1199. Kent D, Hayward R. Subgroup analyses in clinical trials—to the editor. N Engl J Med. 2008; 358:1199. Wang R. Lagakos SW. Subgroup analyses in clinical trials—author reply. N Engl J Med. 2008; 358:1199‐1200. Pocock SJ, Lubsen. More on Subgroup Analyses in clinical trials—to the editor. N Engl J Med. 2008; 358:2076. Wang R, Lagakos. More on Subgroup analyses in clinical trials—author reply. N Engl J Med. 2008; 358‐2076‐7.
Lagakos SW. The challenge of subgroup analyses—reporting without distorting. N Engl J Med. 2006; 354:1667‐ 1669. Correction: N Engl J Med. 2006; 355;533b. The accompanying editorials to this article include:
Eisner MD. The challenge of subgroup analyses—to the editor. N Engl J Med. 2006; 355:211. Lagakos SW. The challenge of subgroup analyses—Dr. Lagakos replies. N Engl J Med. 2006; 355:211‐2
Sun X, Ioannidis JPA, Agoritsas T et al. How to use a subgroup analysis. Users' guides to the medical literature. JAMA. 2014; 311:405‐11. Meta‐analyses Mills EJ, Ioannidis JPA, Thorlund K. How to use an article reporting multiple treatment comparisons meta‐analysis. JAMA. 2012; 308:1246‐53. Shojania KG, Sampson M, Ansari M. et al. How quickly do systematic reviews go out of date: a survival analysis. Ann Intern Med 2007; 147:224‐33. Other articles of interest Higgins J, Altman DG, Gotzsche PC et al. The Cochrane Collaboration's tool for assessing risk of bias in randomized trials. BMJ. 2011; 343:d5928 doi: 10.1136/bmj.d5928.
__________________________________________________________________________________________________________ ©2017 American Society of Health-System Pharmacists, Inc. All rights reserved.
20

Research Design, Evidence-Based Medicine and Statistical Analysis
Krystal Moorman, Pharm.D., BCPSClinical Assistant Professor, PharmacotherapyUniversity of Utah College of PharmacyClinical PharmacistUniversity of Utah Hospitals and ClinicsSalt Lake City, Utah
Disclosure
• I have nothing to disclose related to the content of this presentation
What to Expect
• Review
• General overview of study designs and stats
• Practical and application based
Resources in Handout
• Questionnaire
• Overview of study designs
• Statistical tests
• Noninferiority pearls
• Assessing risk
• Sensitivity, specificity
• Internet resources
• References
Learning Objectives
• Interpret biomedical literature with regard to study design methodology, statistical analysis, and significance and applicability of reported data and conclusions.
• Explain the use of evidence‐based treatment guidelines and protocols.
Types of Study Designs
DescriptiveDescriptive
Case report, case series
Case report, case series
ExplanatoryExplanatory
Experimental: investigator allocates
intervention
Experimental: investigator allocates
intervention
Clinical trialsClinical trials
Observational: investigator makes
observations
Observational: investigator makes
observations
Case‐control, cohort, cross‐sectional
Case‐control, cohort, cross‐sectional
Gelbach SH. Interpreting the medical literature, 5th ed. New York: McGraw Hill Medical. 2006.
__________________________________________________________________________________________________________ ©2017 American Society of Health-System Pharmacists, Inc. All rights reserved.
21

Strengths of Study Design
• Meta‐analysis
• Randomized controlled trial
• Follow‐up study
• Case‐control, cross‐sectional study
• Case report or case series; studies with historical controls
• Opinion
http://archive.ahrq.gov/news/events/conference/2009/viswanathan2/index.html. (accessed 2017 April 20).
Randomized Controlled Trials
Randomized Controlled Trial Case Study
• Caroni P, Tognoni G, Masson S, et al. Albumin replacement in patients with severe sepsis or septic shock. N Engl J Med.2014;370(15):1412‐21.
• Albumin replacement in severe sepsis or septic shock. N Engl J Med 2014;371:83‐84. [letter and authors reply]
Question 1:You want to know if this study applies to your patients before reading it. You want to know if the study has:
A. Internal validity
B. External validity
C. Face validity
D. Content validity
A. B. C. D.
0% 0%0%0%
Internal Validity
• Study design issues
– Potential bias
– Statistical methods
Guyatt G et al. Users’ guides to the medical literature, 3rd ed. 2015.
External Validity
• Generalizability
• Can I apply this to my patient?
– Inclusion/exclusion criteria
– Population studied (demographics)
Guyatt G et al. Users’ guides to the medical literature, 3rd ed. 2015.
__________________________________________________________________________________________________________ ©2017 American Society of Health-System Pharmacists, Inc. All rights reserved.
22

Dissecting an Article
• Purpose
• Study design
• Population
• Risk factors or intervention
• Outcomes
• Methods
Considerations
• Is the outcome reasonable and attainable?
• What is the potential for bias?
• Are the patients representative of larger population?
• Who was excluded?
• How was efficacy measured?
• Are all data accounted for?
• Are statistical methods appropriate?
Malone PM et al. Drug information: a guide for pharmacists, 5th ed. McGraw Hill Education, 2014.
Study Design‐ Caroni et al
• Randomized
• Open‐label
• Active‐controlled
• Parallel group
Caroni P et al. N Engl J Med. 2014; 370:1412-21.
Randomization
• Each subject has an equal and independent chance of being in any of the treatment arms
• Types of Randomization Schemes
– Simple randomization
– Block randomization
• Stratification
Primer of Biostatistics, 5th ed. McGraw Hill, 2002.
Blinding
• Open label
• Single blind
• Double blind
• Double blind, double dummy
Malone PM et al. Drug information: a guide for pharmacists, 5th ed. McGraw Hill Education, 2014.
Controls
• Placebo
• Historical
• Standard treatment
• Crossover
http://www.fda.gov/downloads/drugs/guidancecomplianceregulatoryinformation/guidances/ucm073139.pdf (accessed 2017 April 20).
__________________________________________________________________________________________________________ ©2017 American Society of Health-System Pharmacists, Inc. All rights reserved.
23

Question 2:In comparing parallel and crossover study designs, which of the following is a feature of only crossover studies?
A. Outcomes are assessed prospectively
B. Patients are selected to participate
C. Patients are randomized to therapy
D. Patients have a washout period
A. B. C. D.
0% 0%0%0%
http://www.bandolier.org.uk/booth/glossary/cross.html (accessed 2017 April 19).
Parallel vs. Crossover
• Parallel
– Each patient receives one therapy
– Two or more concurrent groups
– Interpatient variability
http://www.medicine.ox.ac.uk/bandolier/booth/glossary/cross.html (accessed 2017 April 19).
• Crossover
– Each patient receives one therapy then another
– Randomized to sequence
– Washout
– Position effect
Experimental ‐ Parallel
http://www.medicine.ox.ac.uk/bandolier/booth/glossary/cross.html (accessed 2017 April 19).
Experimental – Crossover
http://www.medicine.ox.ac.uk/bandolier/booth/glossary/cross.html (accessed 2017 April 19).
Purpose Statements
• P= population
• I= intervention
• C= comparator or strategy of comparison
• O= outcome or measure of success
Inclusion Criteria
• Age 18 or older
• Met clinical criteria for severe sepsis within the previous 24 hours
• Proven or suspected infection in at least one site
Caroni P et al. N Engl J Med. 2014; 370:1412-21.
__________________________________________________________________________________________________________ ©2017 American Society of Health-System Pharmacists, Inc. All rights reserved.
24

Severe Sepsis/Septic Shock
• Proven or suspected infection in ≥ one site• Two or more of the following:
– Core temperature ≥ 38° or < 36° C– Heart rate ≥ 90 bpm– Respiratory Rate ≥20 breaths per min or PaCO2 < 32 mm Hg or mechanical ventilation
– WBC ≥12,000/mL or < 4,000/mL or immature neutrophils > 10%
– Presence of severe and acute sepsis‐related organ dysfunction using Sequential Organ Failure Assessment (SOFA) score
Caroni P et al. N Engl J Med. 2014; 370:1412-21.
Sequential Organ Failure Assessment Score
• Uses measurements of major organ function to calculate a severity score– Respiratory system –PaO2)/FiO2
– Cardiovascular system –amount of vasoactive medication needed
– Hepatic system – bilirubin concentration– Coagulation system – platelet count– Neurologic system – Glasgow coma score– Renal system – serum creatinine or urine output
• Each organ system is assigned a point value from 0 (normal) to 4 (high degree of dysfunction/failure)
• The score ranges from 0 to 24• Used to predict morbidity and mortality
SOFA calculator. http://clincalc.com/IcuMortality/SOFA.aspx (accessed 2017 April 20).
Exclusion Criteria
• Terminal condition
• Known adverse reaction to albumin
• Proven or suspected head injury
• Heart failure NYHA class 3 or 4
• Conditions that require albumin (eg, ascites)
• Religious objection
• Participating in other studies
Caroni P et al. N Engl J Med. 2014; 370:1412-21.
Table 1Characteristic Albumin (N = 903) Crystalloid (N = 907)
Age, y (median, IQR) 70 (57‐77) 69 (59‐77)
Reason for admission
Medical 511 (56.6%) 518 (57.1%)
Elective surgery 69 (7.6%) 58 (6.4%)
Emergency surgery 323 (35.8%) 331 (36.5%)
SAPS* II score (median, IQR) 48 (37‐59) 48 (37‐60)
SOFA score (median, IQR) 8 (6‐10) 8 (6‐10)
Organ dysfunction
1 organ 188 (20.8%) 208 (22.9%)
2 organs 361 (40%) 303 (33.4%)
3 organs 236 (26.1%) 248 (27.3%)
4 organs 89 (9.9%) 115 (12.7%)
5 organs 29 (3.2%) 33 (3.6%)
Caroni P et al. N Engl J Med. 2014; 370:1412-21.*Simplified Acute Physiology Score
Intervention‐ Caroni et al
• Albumin 20%
• Crystalloid
• Both administered based on early goal‐directed therapy in early phase
• Albumin titrated to maintain serum albumin concentration of 30 g/L or more
• Both received crystalloid as clinically necessary (driven by attending)
Caroni P et al. N Engl J Med. 2014; 370:1412-21.
Interventions
• Comparable
– Crystalloid administration not standardized
• Blinding
– Open label
• Competing interventions
– All other therapies at discretion of attending physician
__________________________________________________________________________________________________________ ©2017 American Society of Health-System Pharmacists, Inc. All rights reserved.
25
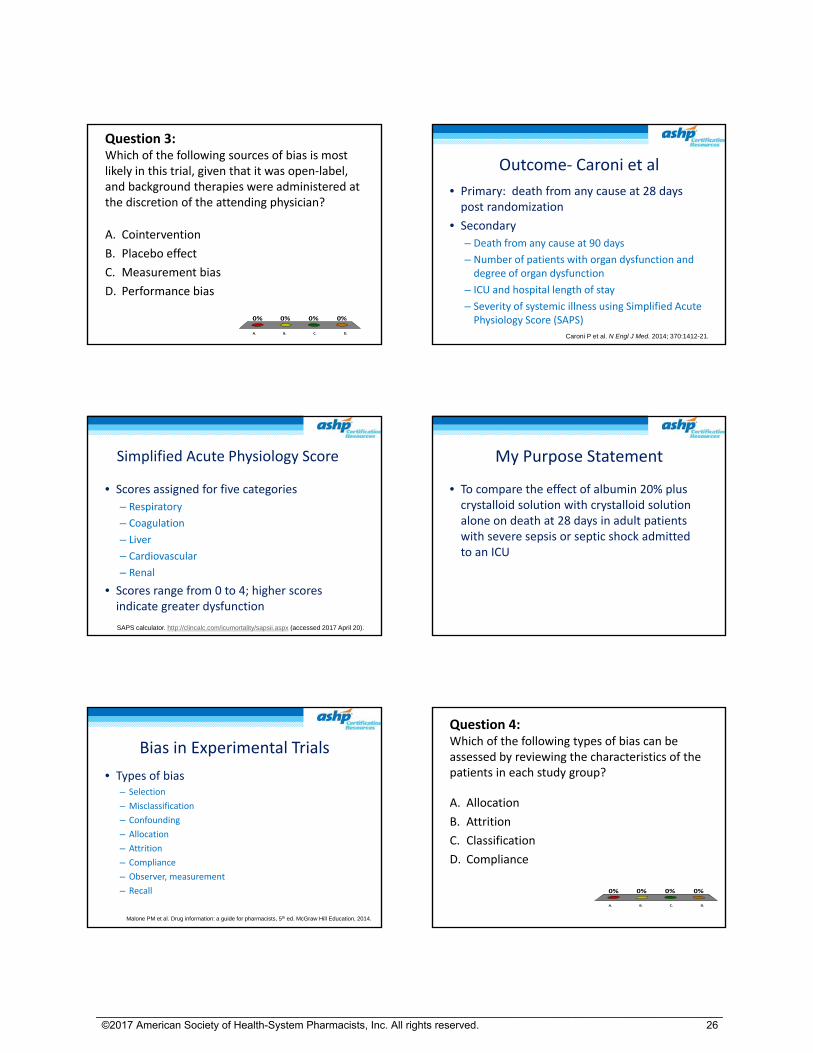
Question 3:Which of the following sources of bias is most likely in this trial, given that it was open‐label, and background therapies were administered at the discretion of the attending physician?
A. Cointervention
B. Placebo effect
C. Measurement bias
D. Performance bias
A. B. C. D.
0% 0%0%0%
Outcome‐ Caroni et al
• Primary: death from any cause at 28 days post randomization
• Secondary
– Death from any cause at 90 days
– Number of patients with organ dysfunction and degree of organ dysfunction
– ICU and hospital length of stay
– Severity of systemic illness using Simplified Acute Physiology Score (SAPS)
Caroni P et al. N Engl J Med. 2014; 370:1412-21.
Simplified Acute Physiology Score
• Scores assigned for five categories
– Respiratory
– Coagulation
– Liver
– Cardiovascular
– Renal
• Scores range from 0 to 4; higher scores indicate greater dysfunction
SAPS calculator. http://clincalc.com/icumortality/sapsii.aspx (accessed 2017 April 20).
My Purpose Statement
• To compare the effect of albumin 20% plus crystalloid solution with crystalloid solution alone on death at 28 days in adult patients with severe sepsis or septic shock admitted to an ICU
Bias in Experimental Trials
• Types of bias– Selection
– Misclassification
– Confounding
– Allocation
– Attrition
– Compliance
– Observer, measurement
– Recall
Malone PM et al. Drug information: a guide for pharmacists, 5th ed. McGraw Hill Education, 2014.
Question 4:Which of the following types of bias can be assessed by reviewing the characteristics of the patients in each study group?
A. Allocation
B. Attrition
C. Classification
D. Compliance
A. B. C. D.
0% 0%0%0%
__________________________________________________________________________________________________________ ©2017 American Society of Health-System Pharmacists, Inc. All rights reserved.
26
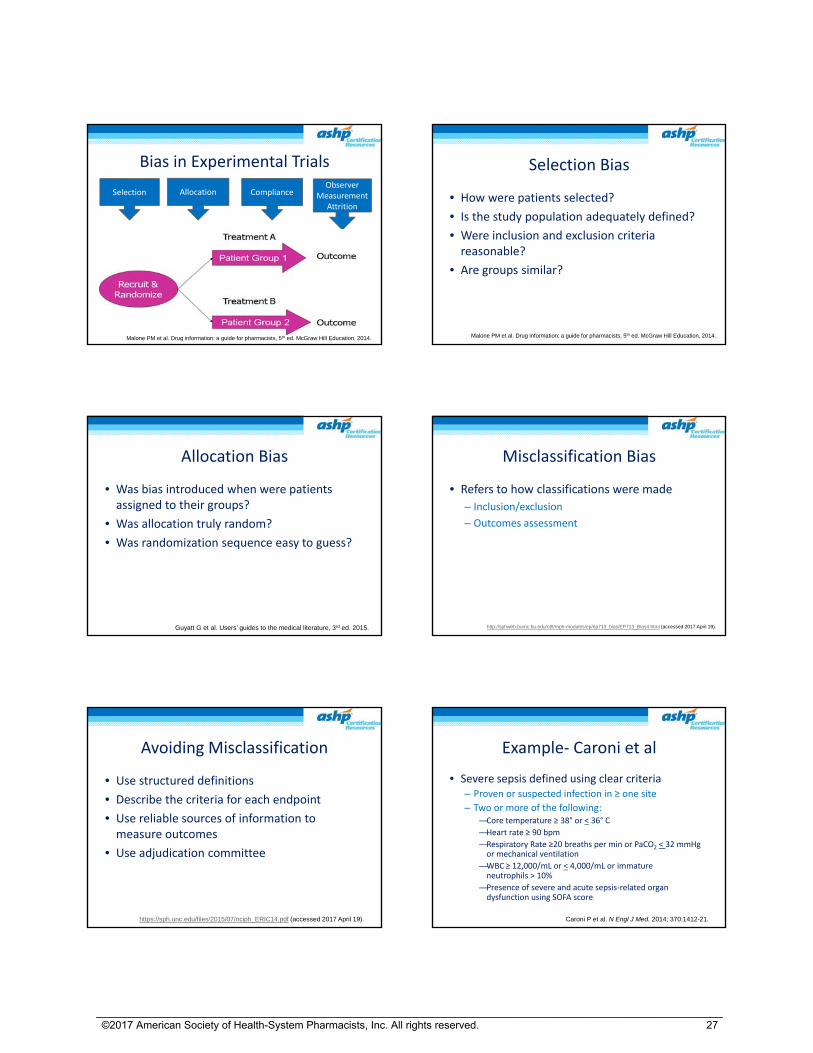
Bias in Experimental Trials
Malone PM et al. Drug information: a guide for pharmacists, 5th ed. McGraw Hill Education, 2014.
ComplianceSelection AllocationObserver
MeasurementAttrition
Selection Bias
• How were patients selected?
• Is the study population adequately defined?
• Were inclusion and exclusion criteria reasonable?
• Are groups similar?
Malone PM et al. Drug information: a guide for pharmacists, 5th ed. McGraw Hill Education, 2014.
Allocation Bias
• Was bias introduced when were patients assigned to their groups?
• Was allocation truly random?
• Was randomization sequence easy to guess?
Guyatt G et al. Users’ guides to the medical literature, 3rd ed. 2015.
Misclassification Bias
• Refers to how classifications were made
– Inclusion/exclusion
– Outcomes assessment
http://sphweb.bumc.bu.edu/otlt/mph-modules/ep/ep713_bias/EP713_Bias4.html (accessed 2017 April 19).
Avoiding Misclassification
• Use structured definitions
• Describe the criteria for each endpoint
• Use reliable sources of information to measure outcomes
• Use adjudication committee
https://sph.unc.edu/files/2015/07/nciph_ERIC14.pdf (accessed 2017 April 19).
Example‐ Caroni et al
• Severe sepsis defined using clear criteria– Proven or suspected infection in ≥ one site
– Two or more of the following:—Core temperature ≥ 38° or < 36° C
—Heart rate ≥ 90 bpm
—Respiratory Rate ≥20 breaths per min or PaCO2 < 32 mmHg or mechanical ventilation
—WBC ≥ 12,000/mL or < 4,000/mL or immature neutrophils > 10%
—Presence of severe and acute sepsis‐related organ dysfunction using SOFA score
Caroni P et al. N Engl J Med. 2014; 370:1412-21.
__________________________________________________________________________________________________________ ©2017 American Society of Health-System Pharmacists, Inc. All rights reserved.
27

Observer and Measurement Bias
• Were measurements standardized?
• Were all measurements done by the same lab/person?
• Were measurements performed at appropriate intervals?
• Were measurements appropriate to show the effect of the drug(s)?
• Were measurements sensitive enough to show changes caused by the drug(s)?
• Were there enough measurements?
• Were the measurements objective?
Interpreting the medical literature, 5th ed. New York: McGraw Hill Medical. 2006.
Attrition Bias
• Are all patients in the study accounted for?
• What were the reasons for dropping out?
Glantz SA. Interpreting the medical literature, 5th ed. New York: McGraw Hill Medical. 2006.
Compliance Bias
• Was compliance assessed?
• Are results presented?
• Can results be explained by differences in compliance?
Glantz SA. Interpreting the medical literature, 5th ed. New York: McGraw Hill Medical. 2006.
Follow the Patients
• Add numbers to flow chart
• Follow the numbers
• Consider attrition
• Present results for everything mentioned in methods
• Analyze statistics
Other Issues
• Was power defined?
• Was power met?
• Were statistical tests appropriate for the type of data and study design?
Analysis
• Intention‐to‐treat– All patients randomized analyzed according to intended therapy
• Modified intention‐to‐treat
• Per‐protocol– Only those patients who followed protocol
• As‐treated– All patients randomized according to therapy they actually received
Malone PM et al. Drug information: a guide for pharmacists, 5th ed. McGraw Hill Education, 2014.
__________________________________________________________________________________________________________ ©2017 American Society of Health-System Pharmacists, Inc. All rights reserved.
28
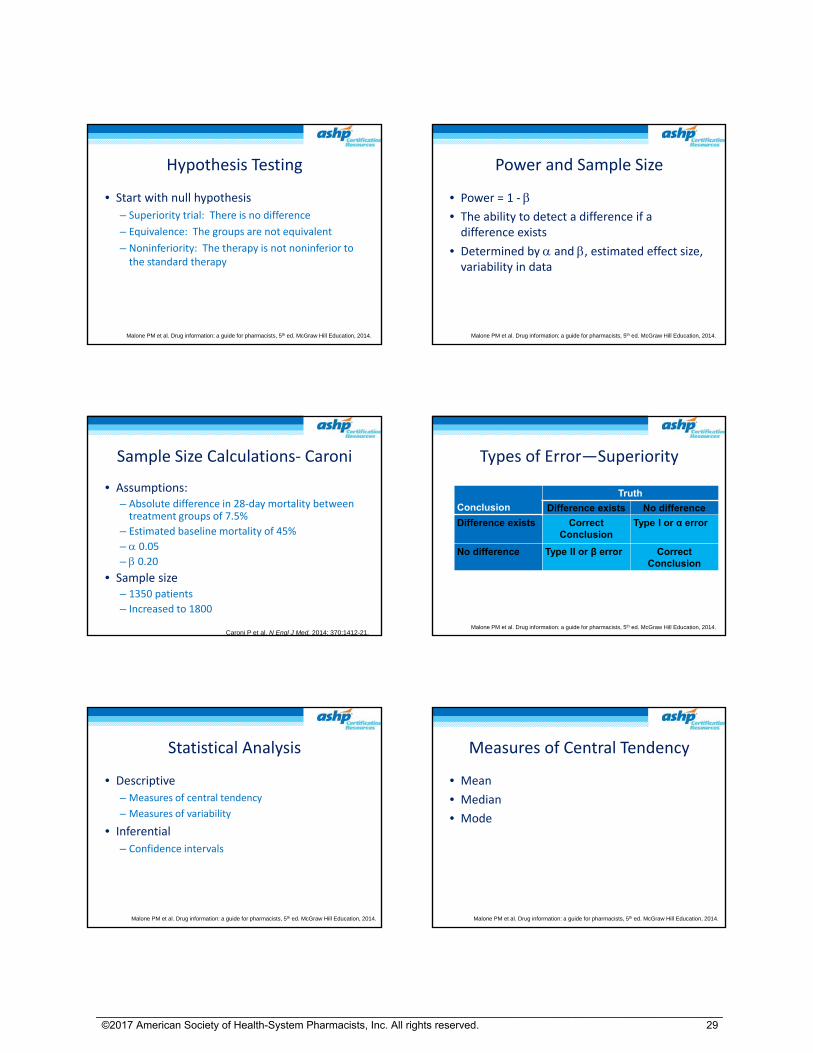
Hypothesis Testing
• Start with null hypothesis
– Superiority trial: There is no difference
– Equivalence: The groups are not equivalent
– Noninferiority: The therapy is not noninferior to the standard therapy
Malone PM et al. Drug information: a guide for pharmacists, 5th ed. McGraw Hill Education, 2014.
Power and Sample Size
• Power = 1 ‐ • The ability to detect a difference if a difference exists
• Determined by and , estimated effect size, variability in data
Malone PM et al. Drug information: a guide for pharmacists, 5th ed. McGraw Hill Education, 2014.
Sample Size Calculations‐ Caroni
• Assumptions: – Absolute difference in 28‐day mortality between treatment groups of 7.5%
– Estimated baseline mortality of 45%
– 0.05
– 0.20
• Sample size– 1350 patients
– Increased to 1800
Caroni P et al. N Engl J Med. 2014; 370:1412-21.
Types of Error—Superiority
Conclusion
Truth
Difference exists No difference
Difference exists Correct Conclusion
Type I or α error
No difference Type II or β error Correct Conclusion
Malone PM et al. Drug information: a guide for pharmacists, 5th ed. McGraw Hill Education, 2014.
Statistical Analysis
• Descriptive
– Measures of central tendency
– Measures of variability
• Inferential
– Confidence intervals
Malone PM et al. Drug information: a guide for pharmacists, 5th ed. McGraw Hill Education, 2014.
Measures of Central Tendency
• Mean
• Median
• Mode
Malone PM et al. Drug information: a guide for pharmacists, 5th ed. McGraw Hill Education, 2014.
__________________________________________________________________________________________________________ ©2017 American Society of Health-System Pharmacists, Inc. All rights reserved.
29
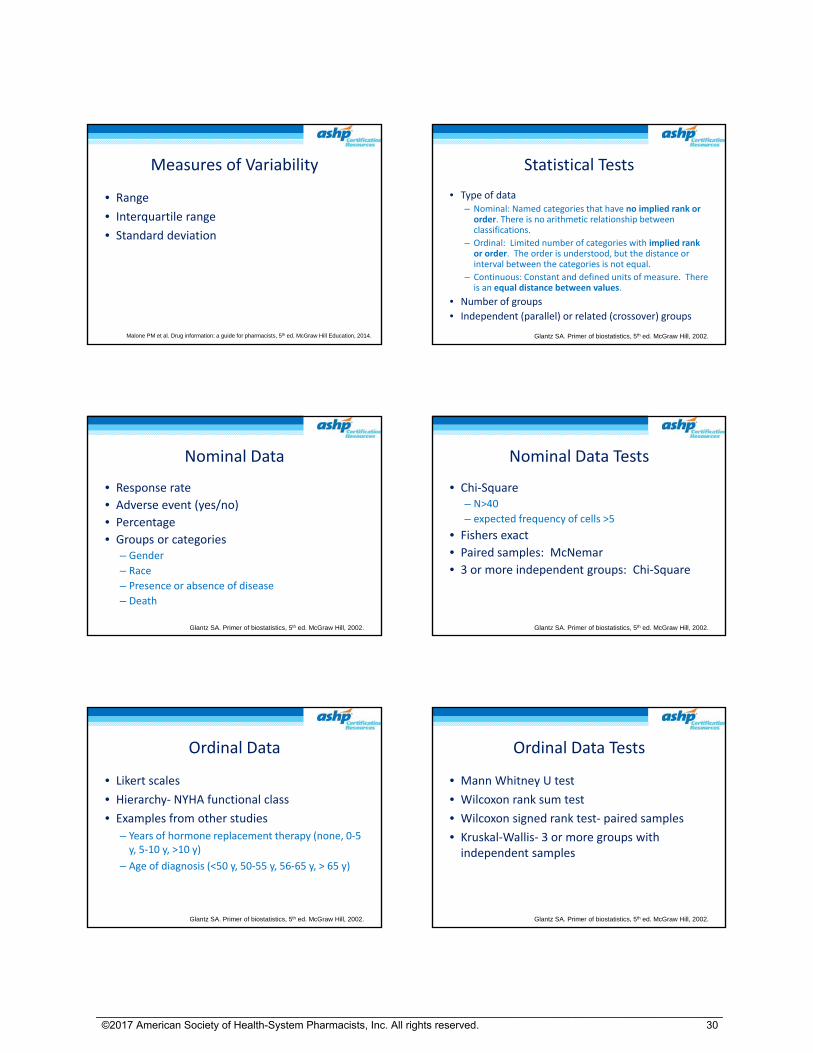
Measures of Variability
• Range
• Interquartile range
• Standard deviation
Malone PM et al. Drug information: a guide for pharmacists, 5th ed. McGraw Hill Education, 2014.
Statistical Tests
• Type of data– Nominal: Named categories that have no implied rank or order. There is no arithmetic relationship between classifications.
– Ordinal: Limited number of categories with implied rank or order. The order is understood, but the distance or interval between the categories is not equal.
– Continuous: Constant and defined units of measure. There is an equal distance between values.
• Number of groups
• Independent (parallel) or related (crossover) groups
Glantz SA. Primer of biostatistics, 5th ed. McGraw Hill, 2002.
Nominal Data
• Response rate
• Adverse event (yes/no)
• Percentage
• Groups or categories– Gender
– Race
– Presence or absence of disease
– Death
Glantz SA. Primer of biostatistics, 5th ed. McGraw Hill, 2002.
Nominal Data Tests
• Chi‐Square– N>40
– expected frequency of cells >5
• Fishers exact
• Paired samples: McNemar
• 3 or more independent groups: Chi‐Square
Glantz SA. Primer of biostatistics, 5th ed. McGraw Hill, 2002.
Ordinal Data
• Likert scales
• Hierarchy‐ NYHA functional class
• Examples from other studies
– Years of hormone replacement therapy (none, 0‐5 y, 5‐10 y, >10 y)
– Age of diagnosis (<50 y, 50‐55 y, 56‐65 y, > 65 y)
Glantz SA. Primer of biostatistics, 5th ed. McGraw Hill, 2002.
Ordinal Data Tests
• Mann Whitney U test
• Wilcoxon rank sum test
• Wilcoxon signed rank test‐ paired samples
• Kruskal‐Wallis‐ 3 or more groups with independent samples
Glantz SA. Primer of biostatistics, 5th ed. McGraw Hill, 2002.
__________________________________________________________________________________________________________ ©2017 American Society of Health-System Pharmacists, Inc. All rights reserved.
30

Continuous Data
• Most laboratory values
• Age
• Weight
• Time to event
Glantz SA. Primer of biostatistics, 5th ed. McGraw Hill, 2002.
Continuous Data Tests
• Parametric vs Non‐parametric
• Mann‐Whitney U (median)
• Student’s t‐test (2 groups) (mean)
– Normal distribution, equal variance
• Paired Data: paired t‐test
• ANOVA (3 or more groups)
Glantz SA. Primer of biostatistics, 5th ed. McGraw Hill, 2002.
Question 5:Which of the following types of data is the primary outcome used in this study?
A. Continuous
B. Nominal
C. Ordinal
D. Variant
A. B. C. D.
0% 0%0%0%
Glantz SA. Primer of biostatistics, 5th ed. McGraw Hill, 2002.
Types of Data‐ Caroni
Type of data Demographics ResultsNominal Gender
Reason for admissionPreexisting conditions
Death at 28 and 90 daysAcute kidney injuryRenal replacement therapy
Ordinal Organ dysfunction ---Continuous Age
BMISAPS II scoreSOFA scorePhysiologic variables
SAPS IISOFA scoreICU and hospital length of stay
Question 6:Which of the following statistical tests is most appropriate to use to determine whether there is a difference in the percentage of patients who experienced an event?
A. Chi‐square
B. Mann Whitney U
C. McNemar
D. Student’s t‐test
A. B. C. D.
0% 0%0%0%
Glantz SA. Primer of biostatistics, 5th ed. McGraw Hill, 2002.
Statistical Tests‐ Caroni
• Chi‐square for binary outcomes
• Wilcoxon rank‐sum for continuous
• 2 factor analysis of variance for repeated measures for fluid volumes and physiologic measures
• Kaplan‐Meier method and log‐rank test for survival estimates
Caroni P et al. N Engl J Med. 2014; 370:1412-21.
__________________________________________________________________________________________________________ ©2017 American Society of Health-System Pharmacists, Inc. All rights reserved.
31
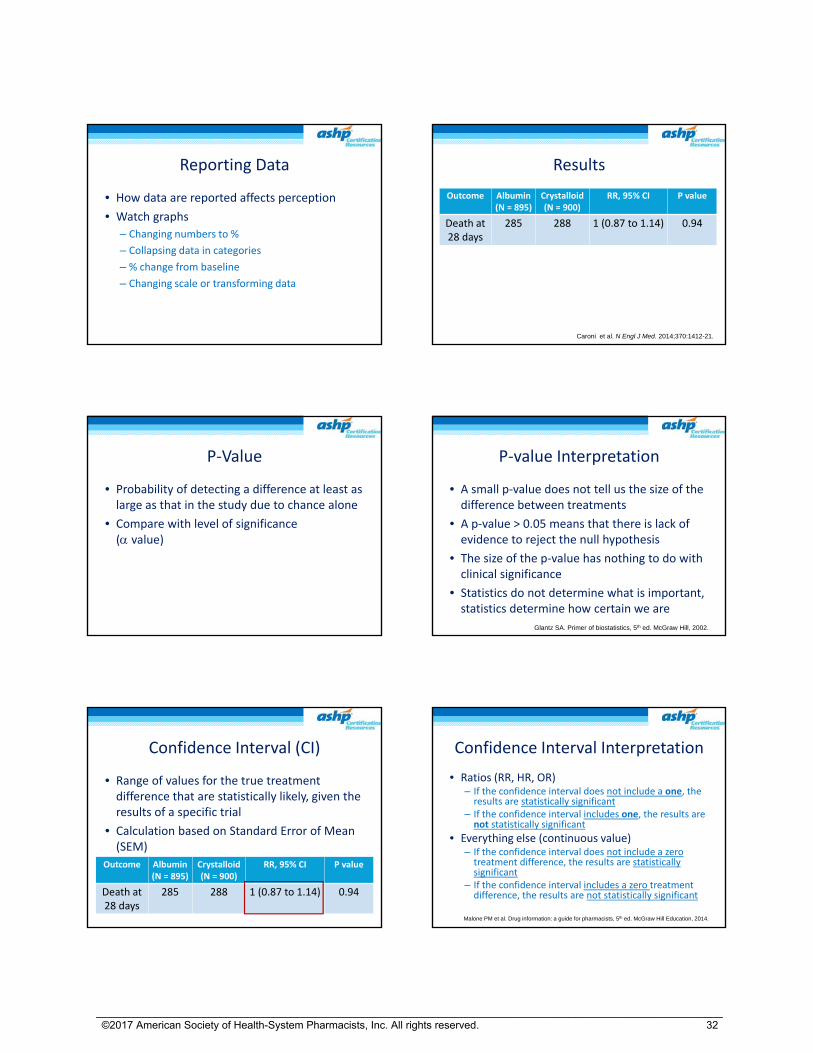
Reporting Data
• How data are reported affects perception
• Watch graphs
– Changing numbers to %
– Collapsing data in categories
– % change from baseline
– Changing scale or transforming data
Results
Outcome Albumin (N = 895)
Crystalloid (N = 900)
RR, 95% CI P value
Death at 28 days
285 288 1 (0.87 to 1.14) 0.94
Caroni et al. N Engl J Med. 2014;370:1412-21.
P‐Value
• Probability of detecting a difference at least as large as that in the study due to chance alone
• Compare with level of significance ( value)
P‐value Interpretation
• A small p‐value does not tell us the size of the difference between treatments
• A p‐value > 0.05 means that there is lack of evidence to reject the null hypothesis
• The size of the p‐value has nothing to do with clinical significance
• Statistics do not determine what is important, statistics determine how certain we are
Glantz SA. Primer of biostatistics, 5th ed. McGraw Hill, 2002.
Confidence Interval (CI)
• Range of values for the true treatment difference that are statistically likely, given the results of a specific trial
• Calculation based on Standard Error of Mean (SEM)
Outcome Albumin (N = 895)
Crystalloid (N = 900)
RR, 95% CI P value
Death at 28 days
285 288 1 (0.87 to 1.14) 0.94
Confidence Interval Interpretation
• Ratios (RR, HR, OR)– If the confidence interval does not include a one, the results are statistically significant
– If the confidence interval includes one, the results are not statistically significant
• Everything else (continuous value)– If the confidence interval does not include a zerotreatment difference, the results are statistically significant
– If the confidence interval includes a zero treatment difference, the results are not statistically significant
Malone PM et al. Drug information: a guide for pharmacists, 5th ed. McGraw Hill Education, 2014.
__________________________________________________________________________________________________________ ©2017 American Society of Health-System Pharmacists, Inc. All rights reserved.
32

Confidence Interval Interpretation
• If the study was repeated 100 times, and a CI is calculated each time, then 95 of the intervals will contain the true value for the larger population of interest, and 5 will not
Malone PM et al. Drug information: a guide for pharmacists, 5th ed. McGraw Hill Education, 2014.
Question 7: In concluding there is no difference between the groups, the researchers are most like to make which hypothesis testing error?
A. Type I
B. Type II
C. Type III
D. Type IV
A. B. C. D.
0% 0%0%0%
Estimates of Effect
• Used for dichotomous data
• Relative risk (RR), odds ratio (OR), or hazard ratio (HR)
• Relative risk reduction
• Absolute risk reduction
• Number needed to treat
Odds Ratio, Relative Risk, Hazard Ratio
Risk estimate Features Type of study Formula
Relative risk Based on incidence (denominator known)
ExperimentalFollow‐up
(a/a+b) / (c/c+d)
Odds ratio Based on prevalence (denominatorunknown)
Case control Cross sectional
ad/bc
Hazard ratio Weighted RR during the entire study period
Survival analysis
Calculusbased
Malone PM et al. Drug information: a guide for pharmacists, 5th ed. McGraw Hill Education, 2014.
Outcome Albumin (N = 895)
Crystalloid (N = 900)
RR, 95% CI P value
Death at 28 days
285 288 1 (0.87 to 1.14) 0.94
The 2x2 Table
Outcome No Outcome Total
Albumin 285A
610B
895A+B
Crystalloid 288C
612D
900C+D
Relative Risk
• RR = (a/a+b) / (c/c+d)
• (285/895)/(288/900) = 0.99
• Patients treated with albumin were 0.99 times as likely as crystalloid‐treated patients to experience death at 28 days
Guyatt G et al. Users’ guides to the medical literature, 3rd ed. 2015.
Outcome No Outcome Total
Albumin 285A
610B
895A+B
Crystalloid 288C
612D
900C+D
__________________________________________________________________________________________________________ ©2017 American Society of Health-System Pharmacists, Inc. All rights reserved.
33
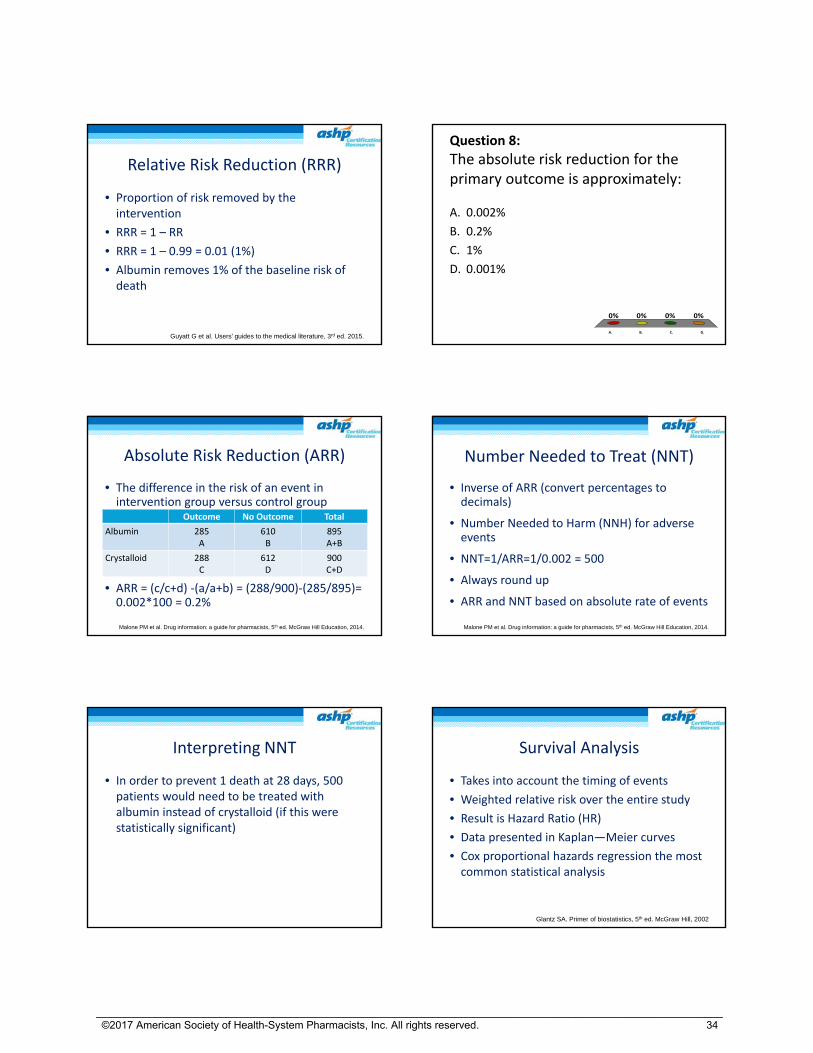
Relative Risk Reduction (RRR)
• Proportion of risk removed by the intervention
• RRR = 1 – RR
• RRR = 1 – 0.99 = 0.01 (1%)
• Albumin removes 1% of the baseline risk of death
Guyatt G et al. Users’ guides to the medical literature, 3rd ed. 2015.
Question 8:
The absolute risk reduction for the primary outcome is approximately:
A. 0.002%
B. 0.2%
C. 1%
D. 0.001%
A. B. C. D.
0% 0%0%0%
Absolute Risk Reduction (ARR)
• The difference in the risk of an event in intervention group versus control group
• ARR = (c/c+d) ‐(a/a+b) = (288/900)‐(285/895)= 0.002*100 = 0.2%
Malone PM et al. Drug information: a guide for pharmacists, 5th ed. McGraw Hill Education, 2014.
Outcome No Outcome Total
Albumin 285A
610B
895A+B
Crystalloid 288C
612D
900C+D
Number Needed to Treat (NNT)
• Inverse of ARR (convert percentages to decimals)
• Number Needed to Harm (NNH) for adverse events
• NNT=1/ARR=1/0.002 = 500
• Always round up
• ARR and NNT based on absolute rate of events
Malone PM et al. Drug information: a guide for pharmacists, 5th ed. McGraw Hill Education, 2014.
Interpreting NNT
• In order to prevent 1 death at 28 days, 500 patients would need to be treated with albumin instead of crystalloid (if this were statistically significant)
Survival Analysis
• Takes into account the timing of events
• Weighted relative risk over the entire study
• Result is Hazard Ratio (HR)
• Data presented in Kaplan—Meier curves
• Cox proportional hazards regression the most common statistical analysis
Glantz SA. Primer of biostatistics, 5th ed. McGraw Hill, 2002
__________________________________________________________________________________________________________ ©2017 American Society of Health-System Pharmacists, Inc. All rights reserved.
34

Relative Risk versus Hazard Ratio
• Relative risk can easily be calculated from numbers presented in the study
• Hazard ratio is the same concept but is the weighted relative risk over time
– Adjusts for change over time
– Adjusts for “repeated measures”
– Adjusts for different “slopes” of the line
Glantz SA. Primer of biostatistics, 5th ed. McGraw Hill, 2002.
Subgroup Analyses
• Allocation no longer applies
• Sample size calculations don’t hold
• As more subgroups evaluated, more opportunity for type 1 error
• Interpret carefully
Malone PM et al. Drug information: a guide for pharmacists, 5th ed. McGraw Hill Education, 2014.
Risk of Death at 90 Days: Septic Shock at Enrollment
Caroni P et al. N Engl J Med. 2014; 370:1412-21. (supplementary material)
• Post hoc analysis
– Included 1121 patients with septic shock and 660 without septic shock
– RR = 0.87 (95% CI, 0.77 to 0.99), p = 0.03
Risk of Death at 90 Days: Septic Shock at Enrollment
Died Survived TotalAlbumin 243
A320B
563A+B
CrystalloidN = 563
281C
277D
558C+D1121
RR = (243/563)/(281/558) = 0.432/0.503= 0.859Investigators report 0.87 (95% CI 0.77 to 0.99), p = 0.03
Caroni P et al. N Engl J Med. 2014; 370:1412-21. (supplementary material)
Question 9: Which of the following is the absolute risk reduction in death at 90 days from the use of albumin instead of crystalloid in patients with septic shock at the time of enrollment?
A. 0.77%
B. 3.1%
C. 6.9%
D. 9.9%
A. B. C. D.
0% 0%0%0%
Caroni P et al. N Engl J Med. 2014; 370:1412-21.(supplementary material)
Risk of Death at 90 Days: Septic Shock at Enrollment
Died Survived TotalAlbumin 243
A320B
563A+B
CrystalloidN = 563
281C
277D
558C+D1121
ARR = (281/558)‐(243/563)= 0.504‐0.432 =0.072*100 = 7.2%
Caroni P et al. N Engl J Med. 2014; 370:1412-21. (supplementary material)
__________________________________________________________________________________________________________ ©2017 American Society of Health-System Pharmacists, Inc. All rights reserved.
35
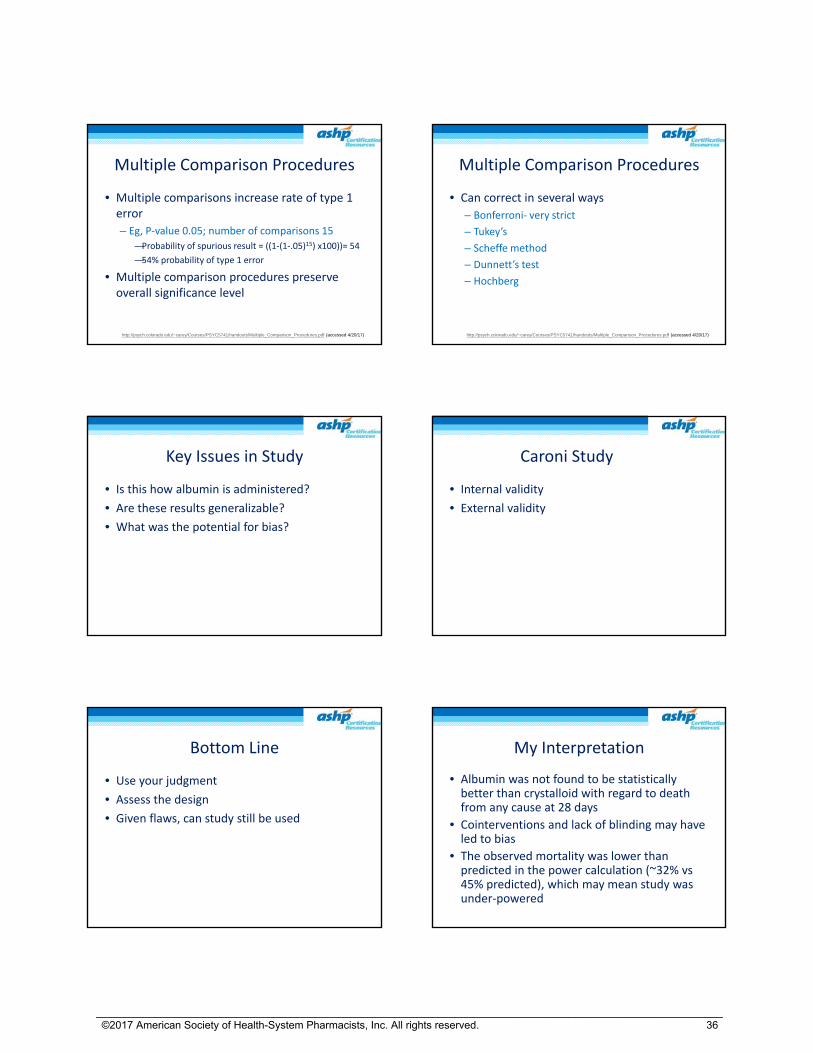
Multiple Comparison Procedures
• Multiple comparisons increase rate of type 1 error
– Eg, P‐value 0.05; number of comparisons 15
—Probability of spurious result = ((1‐(1‐.05)15) x100))= 54
—54% probability of type 1 error
• Multiple comparison procedures preserve overall significance level
http://psych.colorado.edu/~carey/Courses/PSYC5741/handouts/Multiple_Comparison_Procedures.pdf (accessed 4/20/17)
Multiple Comparison Procedures
• Can correct in several ways
– Bonferroni‐ very strict
– Tukey’s
– Scheffe method
– Dunnett’s test
– Hochberg
http://psych.colorado.edu/~carey/Courses/PSYC5741/handouts/Multiple_Comparison_Procedures.pdf (accessed 4/20/17)
Key Issues in Study
• Is this how albumin is administered?
• Are these results generalizable?
• What was the potential for bias?
Caroni Study
• Internal validity
• External validity
Bottom Line
• Use your judgment
• Assess the design
• Given flaws, can study still be used
My Interpretation
• Albumin was not found to be statistically better than crystalloid with regard to death from any cause at 28 days
• Cointerventions and lack of blinding may have led to bias
• The observed mortality was lower than predicted in the power calculation (~32% vs 45% predicted), which may mean study was under‐powered
__________________________________________________________________________________________________________ ©2017 American Society of Health-System Pharmacists, Inc. All rights reserved.
36
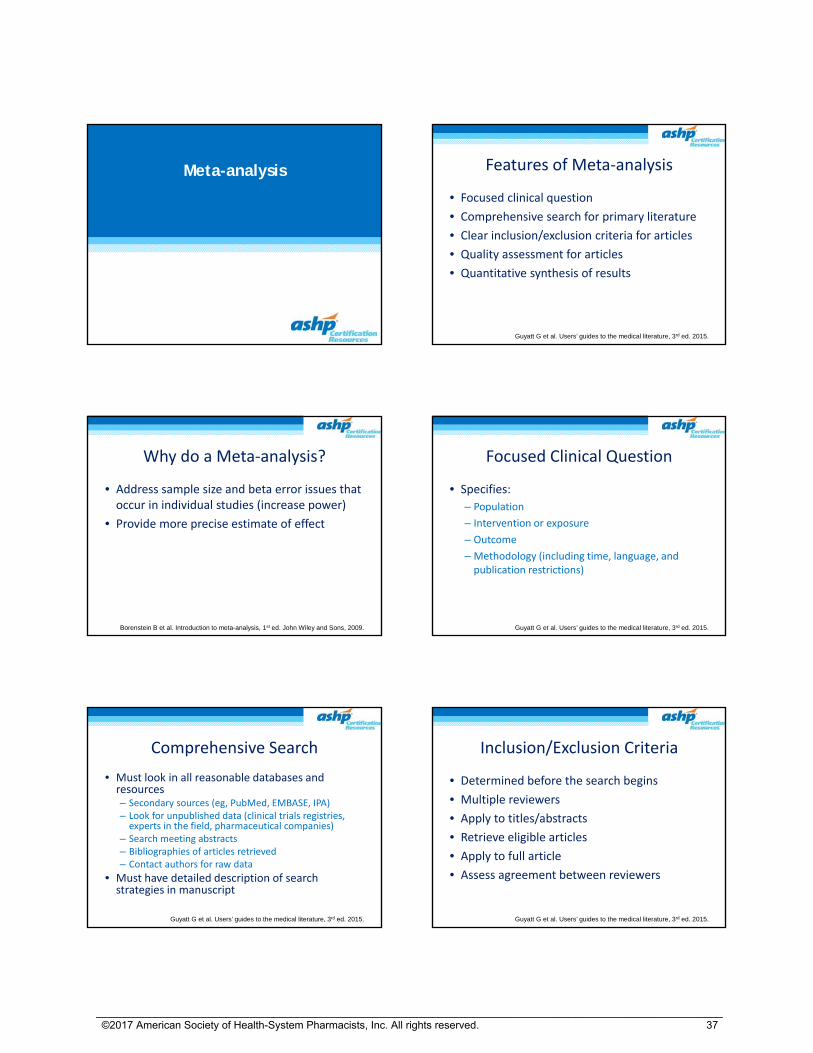
Meta-analysis Features of Meta‐analysis
• Focused clinical question
• Comprehensive search for primary literature
• Clear inclusion/exclusion criteria for articles
• Quality assessment for articles
• Quantitative synthesis of results
Guyatt G et al. Users’ guides to the medical literature, 3rd ed. 2015.
Why do a Meta‐analysis?
• Address sample size and beta error issues that occur in individual studies (increase power)
• Provide more precise estimate of effect
Borenstein B et al. Introduction to meta-analysis, 1st ed. John Wiley and Sons, 2009.
Focused Clinical Question
• Specifies:
– Population
– Intervention or exposure
– Outcome
– Methodology (including time, language, and publication restrictions)
Guyatt G et al. Users’ guides to the medical literature, 3rd ed. 2015.
Comprehensive Search
• Must look in all reasonable databases and resources– Secondary sources (eg, PubMed, EMBASE, IPA)– Look for unpublished data (clinical trials registries, experts in the field, pharmaceutical companies)
– Search meeting abstracts– Bibliographies of articles retrieved– Contact authors for raw data
• Must have detailed description of search strategies in manuscript
Guyatt G et al. Users’ guides to the medical literature, 3rd ed. 2015.
Inclusion/Exclusion Criteria
• Determined before the search begins
• Multiple reviewers
• Apply to titles/abstracts
• Retrieve eligible articles
• Apply to full article
• Assess agreement between reviewers
Guyatt G et al. Users’ guides to the medical literature, 3rd ed. 2015.
__________________________________________________________________________________________________________ ©2017 American Society of Health-System Pharmacists, Inc. All rights reserved.
37

Quality Assessment
• Looking for bias in individual studies
• In general, meta‐analyses of observational studies are problematic
• Tools
– Cochran Collaboration’s tool for assessing bias
– GRADE criteria
– Others Guyatt G et al. Users’ guides to the medical literature, 3rd ed. 2015.
http://www.bmj.com/content/343/bmj.d5928 (accessed 2017 April 19).
http://whyfiles.org/2011/trash-does-burning-beat-burying/ (accessed 2017 April 19).
Quantitative Synthesis of Results
• Study results pooled into new data set
– Estimating the overall treatment effect
• Testing for heterogeneity
• Performing regression analyses or subgroup analyses (to answer the question)
Guyatt G et al. Users’ guides to the medical literature, 3rd ed. 2015.
Heterogeneity
• Methodological
– Patients
– Interventions
– Outcomes
– Study design
• Statistical
– Measures variability in the actual results
– Does not indicate source of heterogeneity
Guyatt G et al. Users’ guides to the medical literature, 3rd ed. 2015.
http://www.evilenglish.net/wp-content/uploads/2014/06/apples_and_oranges_10_04_21_photo.jpg (accessed 2017 April 19).
Checking for Heterogeneity
• Statistical tests
– Cochran Q test
– Inconsistency Index (I2)
• Eyeball test
Guyatt G et al. Users’ guides to the medical literature, 3rd ed. 2015.
Question 10:Which of the following would indicate low heterogeneity in a meta‐analysis?
A. Cochran Q <0.05
B. Cochran Q < 0.01
C. I2 statistic > 50%
D. I2 statistic < 25%
A. B. C. D.
0% 0%0%0%
Borenstein B et al. Introduction to meta-analysis, 1st ed. John Wiley and Sons, 2009.
Cochran Q
• Based on Chi square statistic
• Null hypothesis: all variability between studies is due to chance
• Look at p‐value– P‐value < 0.05: significant heterogeneity (results may still be useful)
– P‐value < 0.01: results are very unlikely to be useful
• Limitations– Underpowered for studies with few patients
– Overpowered for large sample sizes
Borenstein B et al. Introduction to meta-analysis, 1st ed. John Wiley and Sons, 2009.
__________________________________________________________________________________________________________ ©2017 American Society of Health-System Pharmacists, Inc. All rights reserved.
38
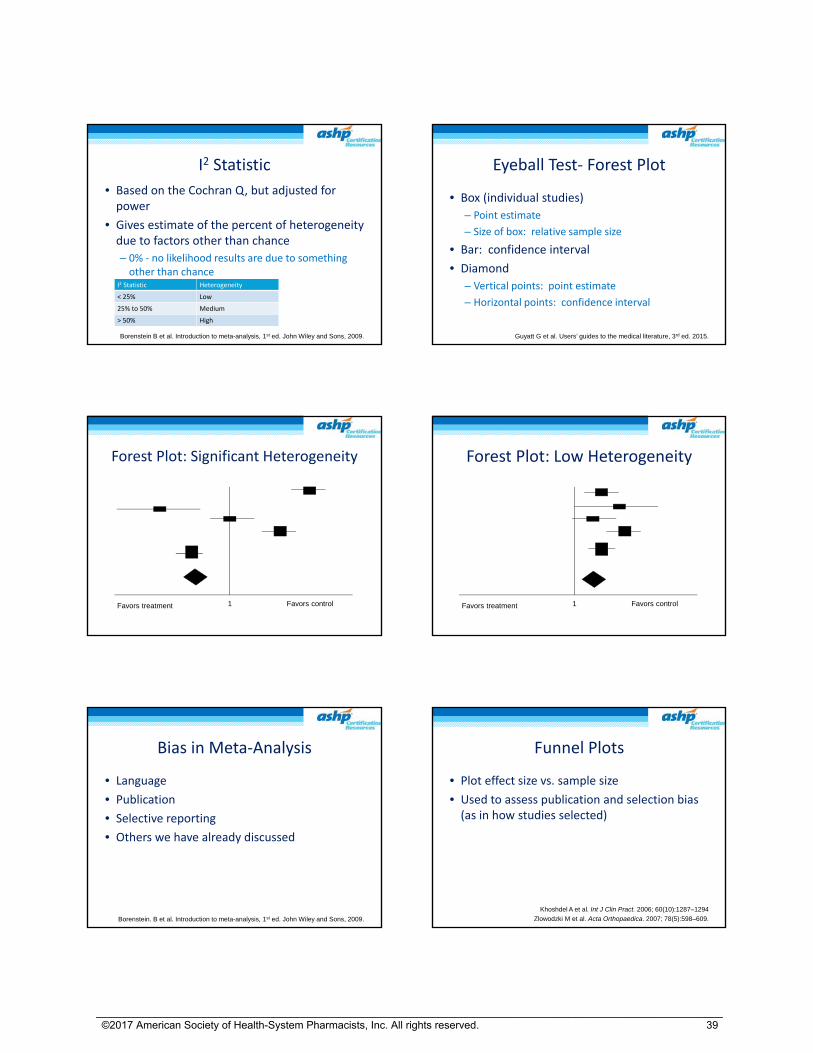
I2 Statistic
• Based on the Cochran Q, but adjusted for power
• Gives estimate of the percent of heterogeneity due to factors other than chance
– 0% ‐ no likelihood results are due to something other than chance
Borenstein B et al. Introduction to meta-analysis, 1st ed. John Wiley and Sons, 2009.
I2 Statistic Heterogeneity
< 25% Low
25% to 50% Medium
> 50% High
Eyeball Test‐ Forest Plot
• Box (individual studies)
– Point estimate
– Size of box: relative sample size
• Bar: confidence interval
• Diamond
– Vertical points: point estimate
– Horizontal points: confidence interval
Guyatt G et al. Users’ guides to the medical literature, 3rd ed. 2015.
1Favors treatment Favors control
Forest Plot: Significant Heterogeneity
1Favors treatment Favors control
Forest Plot: Low Heterogeneity
Bias in Meta‐Analysis
• Language
• Publication
• Selective reporting
• Others we have already discussed
Borenstein. B et al. Introduction to meta-analysis, 1st ed. John Wiley and Sons, 2009.
Funnel Plots
• Plot effect size vs. sample size
• Used to assess publication and selection bias (as in how studies selected)
Khoshdel A et al. Int J Clin Pract. 2006; 60(10):1287–1294
Zlowodzki M et al. Acta Orthopaedica. 2007; 78(5):598–609.
__________________________________________________________________________________________________________ ©2017 American Society of Health-System Pharmacists, Inc. All rights reserved.
39

Funnel Plot
.
OR
v
Funnel Plot
.
OR
Fixed vs Random Effect
• Fixed
– Assumes one true value
– Considers sample variation with studies
– Appropriate if the effect sizes are the same
• Random
– Assumes a range of effects
– Considers variation within study and between studies
– Usually the most appropriate approach
Zlowodzki M et al. Acta Orthopaedica. 2007; 78(5):598–609.
Sensitivity Analysis
• Evaluate the impact of different decisions made in the conduct of study
• Examples
– Different study designs
– Quality of studies
Zlowodzki M et al. Acta Orthopaedica. 2007; 78(5):598–609.
Observational Studies Practice Case‐ Observational Study
• Lee SJ, Ramar K, Park JG et al. Increased fluid administration in the first three hours of sepsis resuscitation is associated with reduced mortality: A retrospective cohort study. Chest2014; 146:908‐15.
__________________________________________________________________________________________________________ ©2017 American Society of Health-System Pharmacists, Inc. All rights reserved.
40
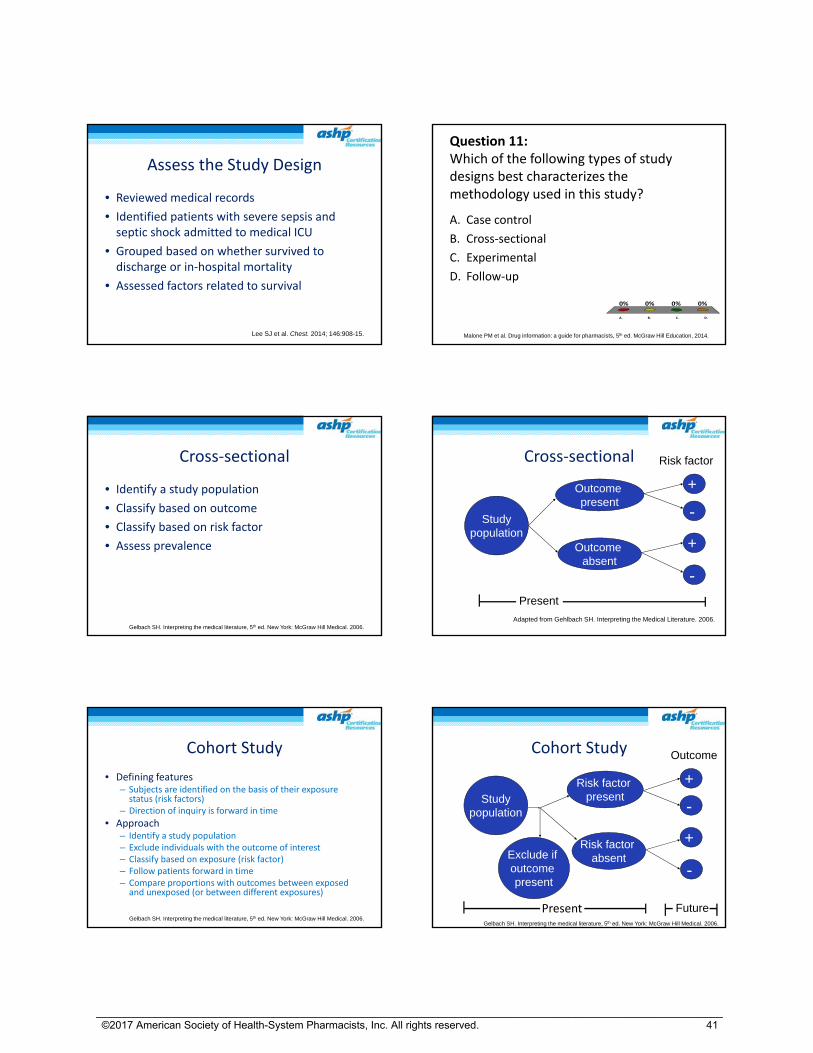
Assess the Study Design
• Reviewed medical records
• Identified patients with severe sepsis and septic shock admitted to medical ICU
• Grouped based on whether survived to discharge or in‐hospital mortality
• Assessed factors related to survival
Lee SJ et al. Chest. 2014; 146:908-15.
Question 11:Which of the following types of study designs best characterizes the methodology used in this study?
A. Case control
B. Cross‐sectional
C. Experimental
D. Follow‐up
A. B. C. D.
0% 0%0%0%
Malone PM et al. Drug information: a guide for pharmacists, 5th ed. McGraw Hill Education, 2014.
Cross‐sectional
• Identify a study population
• Classify based on outcome
• Classify based on risk factor
• Assess prevalence
Gelbach SH. Interpreting the medical literature, 5th ed. New York: McGraw Hill Medical. 2006.
Studypopulation
Outcome present
Outcome absent
+
+
-
-
Risk factor
Present
Adapted from Gehlbach SH. Interpreting the Medical Literature. 2006.
Cross‐sectional
Cohort Study
• Defining features– Subjects are identified on the basis of their exposure status (risk factors)
– Direction of inquiry is forward in time
• Approach– Identify a study population– Exclude individuals with the outcome of interest– Classify based on exposure (risk factor)– Follow patients forward in time– Compare proportions with outcomes between exposed and unexposed (or between different exposures)
Gelbach SH. Interpreting the medical literature, 5th ed. New York: McGraw Hill Medical. 2006.
Cohort Study
Studypopulation
Exclude if outcome present
Risk factor present
Risk factor absent
+
+
-
-
Outcome
FuturePresentGelbach SH. Interpreting the medical literature, 5th ed. New York: McGraw Hill Medical. 2006.
__________________________________________________________________________________________________________ ©2017 American Society of Health-System Pharmacists, Inc. All rights reserved.
41

Cohort Bias
Studypopulation
Exclude if outcome present
Risk factor present
Risk factor absent
+
+
-
-
Outcome
Future
Selection
Classification, Information
Attrition, SurveillanceHawthorne effect
Confounding
Case‐control Study
• Defining features– Subjects are identified on the basis of their disease status (outcome)
– Direction of inquiry is backward in time
• Approach– Identify cases who have the disease of interest (outcome)
– Identify controls who do not have the disease of interest
– Look back in time to assess exposures (risk factors)
– Compare proportions with and without exposures (risk factors) between cases and controls
Gelbach SH. Interpreting the medical literature, 5th ed. New York: McGraw Hill Medical. 2006.
Case‐control Study
Cases
Controls
Risk factor
No risk factor
Risk factor
No risk factor
Past PresentGelbach SH. Interpreting the medical literature, 5th ed. New York: McGraw Hill Medical. 2006.
Study Flowchart‐ Lee
Lee SJ et al. Chest. 2014; 146:908-15.
651 patients
57 excluded‐incomplete data
Survived to discharge
594 patients
Hours 3.1‐6
In‐hospital death
Hours 0‐3
Hours 0‐3
Hours 3.1‐6
Case‐control Study
Survived
Died
Early Fluids
Late Fluids
Early Fluids
Late Fluids
Past PresentGelbach SH. Interpreting the medical literature, 5th ed. New York: McGraw Hill Medical. 2006.
Case‐control Advantages
• Efficient‐ good for investigating hunches
• Can study “rare” diseases
• Evaluate multiple risk factors
• Relatively easy and inexpensive
Gelbach SH. Interpreting the medical literature, 5th ed. New York: McGraw Hill Medical. 2006.
__________________________________________________________________________________________________________ ©2017 American Society of Health-System Pharmacists, Inc. All rights reserved.
42
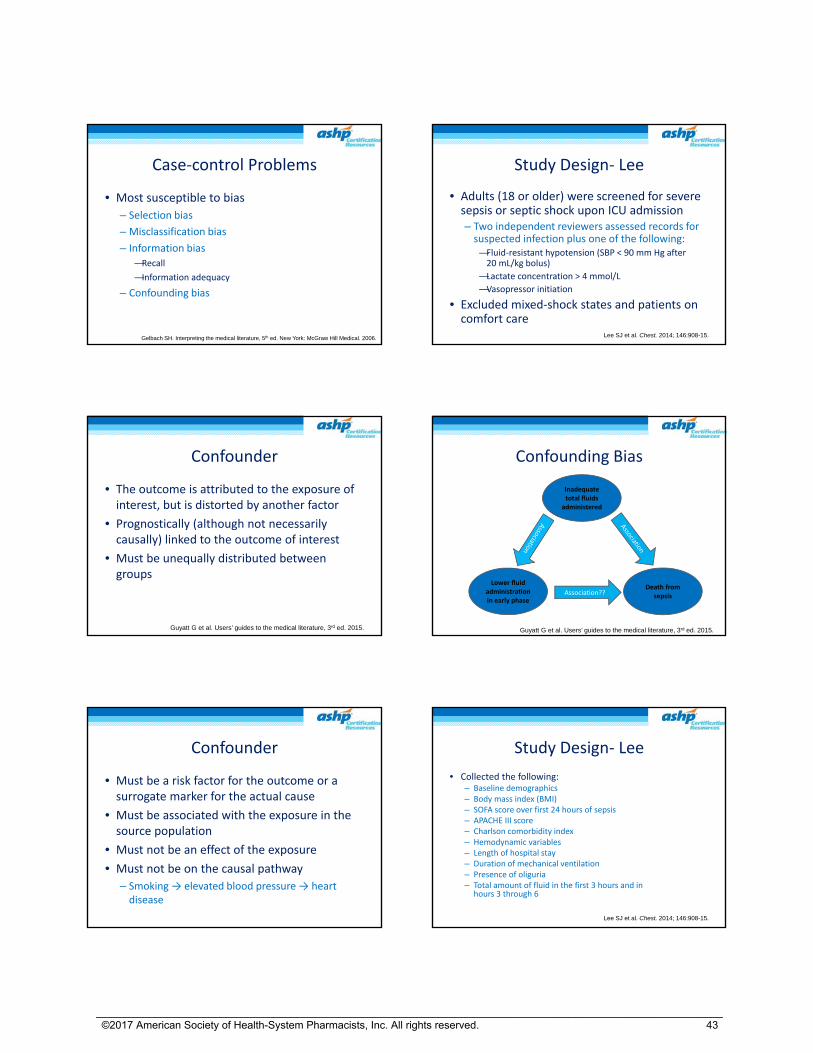
Case‐control Problems
• Most susceptible to bias
– Selection bias
– Misclassification bias
– Information bias
—Recall
—Information adequacy
– Confounding bias
Gelbach SH. Interpreting the medical literature, 5th ed. New York: McGraw Hill Medical. 2006.
Study Design‐ Lee
• Adults (18 or older) were screened for severe sepsis or septic shock upon ICU admission– Two independent reviewers assessed records for suspected infection plus one of the following:—Fluid‐resistant hypotension (SBP < 90 mm Hg after 20 mL/kg bolus)
—Lactate concentration > 4 mmol/L
—Vasopressor initiation
• Excluded mixed‐shock states and patients on comfort care
Lee SJ et al. Chest. 2014; 146:908-15.
Confounder
• The outcome is attributed to the exposure of interest, but is distorted by another factor
• Prognostically (although not necessarily causally) linked to the outcome of interest
• Must be unequally distributed between groups
Guyatt G et al. Users’ guides to the medical literature, 3rd ed. 2015.
Confounding Bias
Inadequate total fluids
administered
Lower fluid administration in early phase
Death from sepsisAssociation??
Guyatt G et al. Users’ guides to the medical literature, 3rd ed. 2015.
Confounder
• Must be a risk factor for the outcome or a surrogate marker for the actual cause
• Must be associated with the exposure in the source population
• Must not be an effect of the exposure
• Must not be on the causal pathway
– Smoking → elevated blood pressure → heart disease
Study Design‐ Lee
• Collected the following:– Baseline demographics– Body mass index (BMI)– SOFA score over first 24 hours of sepsis– APACHE III score– Charlson comorbidity index– Hemodynamic variables– Length of hospital stay– Duration of mechanical ventilation– Presence of oliguria– Total amount of fluid in the first 3 hours and in
hours 3 through 6
Lee SJ et al. Chest. 2014; 146:908-15.
__________________________________________________________________________________________________________ ©2017 American Society of Health-System Pharmacists, Inc. All rights reserved.
43
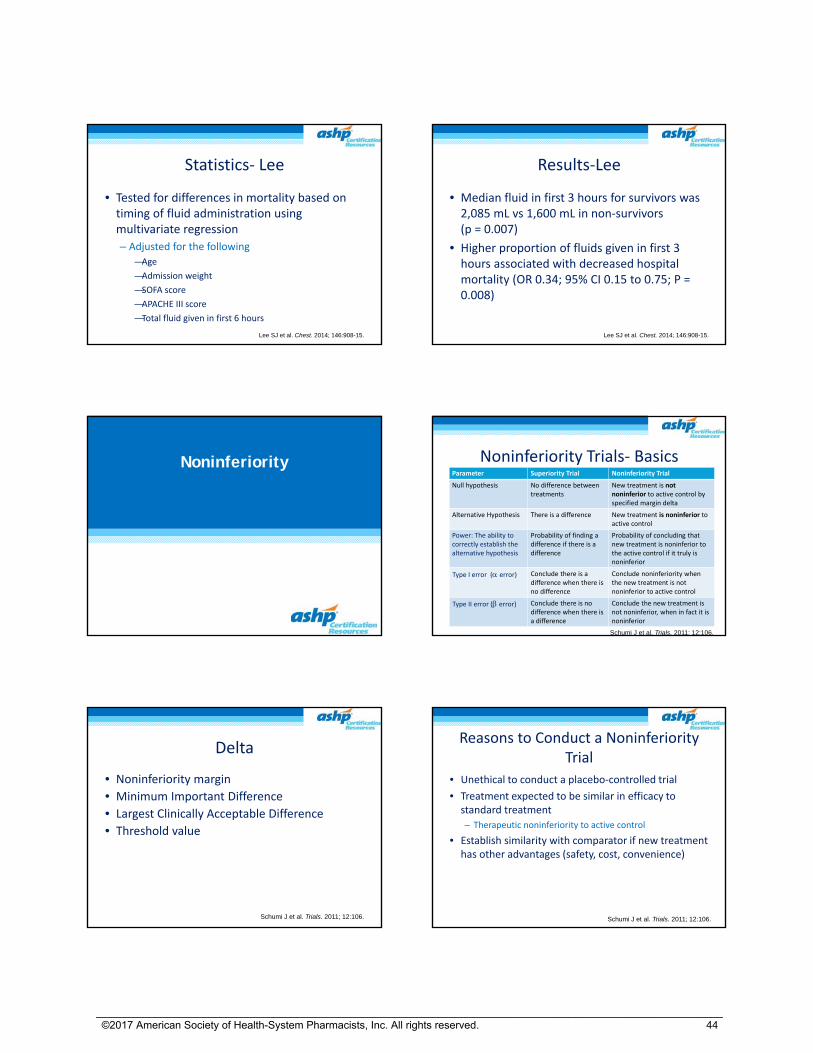
Statistics‐ Lee
• Tested for differences in mortality based on timing of fluid administration using multivariate regression
– Adjusted for the following
—Age
—Admission weight
—SOFA score
—APACHE III score
—Total fluid given in first 6 hours
Lee SJ et al. Chest. 2014; 146:908-15.
Results‐Lee
• Median fluid in first 3 hours for survivors was 2,085 mL vs 1,600 mL in non‐survivors (p = 0.007)
• Higher proportion of fluids given in first 3 hours associated with decreased hospital mortality (OR 0.34; 95% CI 0.15 to 0.75; P = 0.008)
Lee SJ et al. Chest. 2014; 146:908-15.
Noninferiority Noninferiority Trials‐ BasicsParameter Superiority Trial Noninferiority Trial
Null hypothesis No difference between treatments
New treatment is not noninferior to active control by specified margin delta
Alternative Hypothesis There is a difference New treatment is noninferior to active control
Power: The ability to correctly establish the alternative hypothesis
Probability of finding a difference if there is a difference
Probability of concluding that new treatment is noninferior to the active control if it truly is noninferior
Type I error ( error) Conclude there is a difference when there is no difference
Conclude noninferiority when the new treatment is not noninferior to active control
Type II error ( error) Conclude there is no difference when there is a difference
Conclude the new treatment is not noninferior, when in fact it is noninferior
Schumi J et al. Trials. 2011; 12:106.
Delta
• Noninferiority margin
• Minimum Important Difference
• Largest Clinically Acceptable Difference
• Threshold value
Schumi J et al. Trials. 2011; 12:106.
Reasons to Conduct a Noninferiority Trial
• Unethical to conduct a placebo‐controlled trial
• Treatment expected to be similar in efficacy to standard treatment
– Therapeutic noninferiority to active control
• Establish similarity with comparator if new treatment has other advantages (safety, cost, convenience)
Schumi J et al. Trials. 2011; 12:106.
__________________________________________________________________________________________________________ ©2017 American Society of Health-System Pharmacists, Inc. All rights reserved.
44

“Must Haves” in Noninferiority
• Well‐established standard treatment– Constancy of effect
• Current population similar or same as trials that established efficacy of active control over placebo
• Equipotent dosing, similar treatment duration
• Rigorous methodology
– Sloppiness rewards the noninferiority investigator
• Assay sensitivity
Schumi J et al. Trials. 2011; 12:106.
Beneficial Outcomes‐ Higher Better
Favors TreatmentFavors Control
NI Margin
Noninferior and superior
Noninferior
Not Noninferior
Noninferior and inferior
Inferior
Schumi J et al. Trials. 2011; 12:106.
Adverse Outcomes‐ Lower Better
Favors Active Control Favors Treatment
NI Margin
Noninferior and superior
Noninferior
Not Noninferior
Noninferior and inferior
Inferior
Schumi J et al. Trials. 2011; 12:106.
RE‐LY Trials
• Connolly SJ, Ezekowitz MD, Yusuf S et al. Dabigatran versus Warfarin in Patients with Atrial Fibrillation. N Engl J Med 2009; 361:1139‐51.
• Gage BF. Can We Rely on RE‐LY? N Eng J Med 2009; 261:1200‐2. [Editorial]
• Dabigatran versus Warfarin in Patients with Atrial Fibrillation. N Eng J Med 2009; 361:2671‐75. [letters and authors reply]
RE‐LY: Study Design Features
• Multicenter, randomized, parallel, active‐control trial
– 951 centers, 44 countries
• Noninferiority design
Connolly SJ et al. N Engl J Med. 2009; 361:1139-51.
Treatments
• Blinded dabigatran dose
• Unblinded warfarin dose adjusted to INR 2‐3
• Low‐dose aspirin or platelet inhibitor use permitted
• Quinidine permitted first 2 years then not allowed due to drug interactions
Connolly SJ et al. N Engl J Med. 2009; 361:1139-51.
__________________________________________________________________________________________________________ ©2017 American Society of Health-System Pharmacists, Inc. All rights reserved.
45
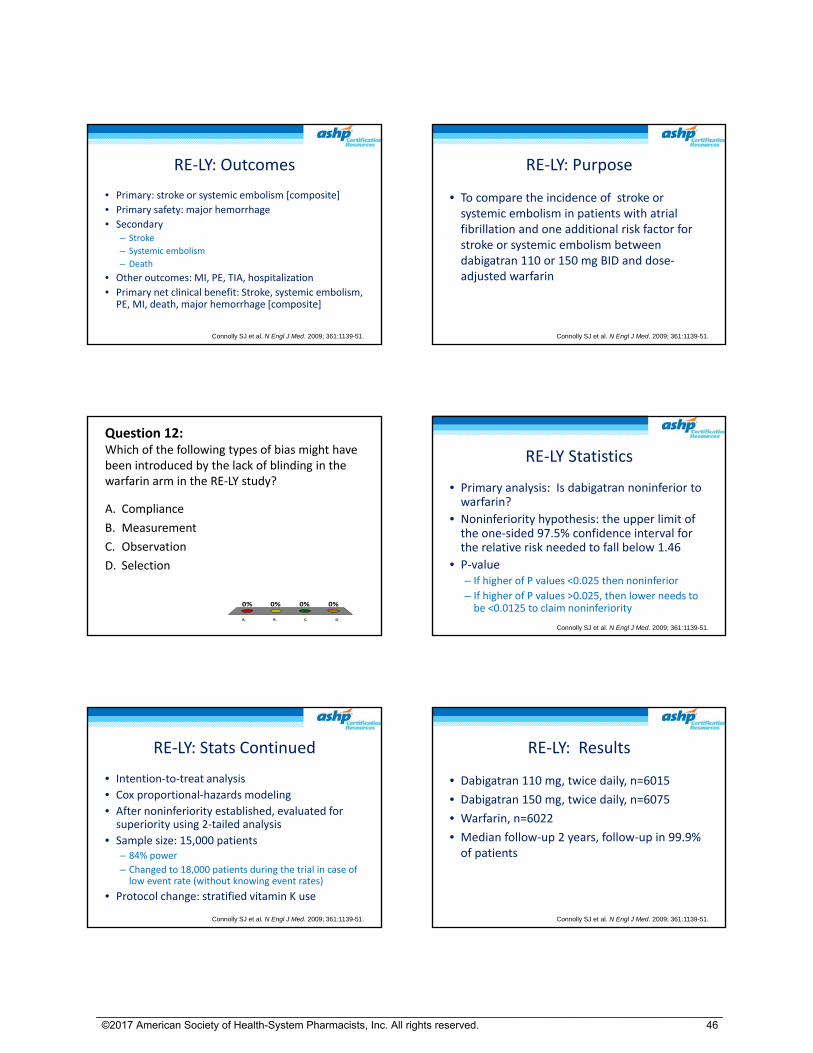
RE‐LY: Outcomes
• Primary: stroke or systemic embolism [composite]
• Primary safety: major hemorrhage
• Secondary– Stroke
– Systemic embolism
– Death
• Other outcomes: MI, PE, TIA, hospitalization
• Primary net clinical benefit: Stroke, systemic embolism, PE, MI, death, major hemorrhage [composite]
Connolly SJ et al. N Engl J Med. 2009; 361:1139-51.
RE‐LY: Purpose
• To compare the incidence of stroke or systemic embolism in patients with atrial fibrillation and one additional risk factor for stroke or systemic embolism between dabigatran 110 or 150 mg BID and dose‐adjusted warfarin
Connolly SJ et al. N Engl J Med. 2009; 361:1139-51.
Question 12: Which of the following types of bias might have been introduced by the lack of blinding in the warfarin arm in the RE‐LY study?
A. Compliance
B. Measurement
C. Observation
D. Selection
A. B. C. D.
0% 0%0%0%
RE‐LY Statistics
• Primary analysis: Is dabigatran noninferior to warfarin?
• Noninferiority hypothesis: the upper limit of the one‐sided 97.5% confidence interval for the relative risk needed to fall below 1.46
• P‐value– If higher of P values <0.025 then noninferior
– If higher of P values >0.025, then lower needs to be <0.0125 to claim noninferiority
Connolly SJ et al. N Engl J Med. 2009; 361:1139-51.
RE‐LY: Stats Continued
• Intention‐to‐treat analysis
• Cox proportional‐hazards modeling
• After noninferiority established, evaluated for superiority using 2‐tailed analysis
• Sample size: 15,000 patients– 84% power
– Changed to 18,000 patients during the trial in case of low event rate (without knowing event rates)
• Protocol change: stratified vitamin K use
Connolly SJ et al. N Engl J Med. 2009; 361:1139-51.
RE‐LY: Results
• Dabigatran 110 mg, twice daily, n=6015
• Dabigatran 150 mg, twice daily, n=6075
• Warfarin, n=6022
• Median follow‐up 2 years, follow‐up in 99.9% of patients
Connolly SJ et al. N Engl J Med. 2009; 361:1139-51.
__________________________________________________________________________________________________________ ©2017 American Society of Health-System Pharmacists, Inc. All rights reserved.
46

RE‐LY: Results‐Primary Outcome
• Stroke or systemic embolism– Dabigatran 110 mg, twice daily, 1.53% per year– Dabigatran 150 mg, twice daily,1.11% per year– Warfarin, 1.69% per year
• Both doses noninferior to warfarin: P< 0.001– Dabigatran 110 mg, twice daily, (RR=0.91; 95%CI=0.74‐1.11, P<0.001)– Dabigatran 150 mg, twice daily, (RR=0.66, 95%CI=0.53‐0.82, P<0.001)
• Superiority testing– Dabigatran 110 mg, twice daily, (RR=0.91, 95%CI=0.74‐1.11, P=0.34)– Dabigatran 150 mg , twice daily, (RR=0.66, 95%CI=0.53‐0.82, P<
0.001)
Connolly SJ et al. N Engl J Med. 2009; 361:1139-51.
RE‐LY Results
• Noninferior hypothesis: the upper limit of the one‐sided 97.5% confidence interval for the relative risk needed to fall below 1.46
• Both doses noninferior to warfarin: P<0.001– Dabigatran 110 mg, twice daily, (RR=0.91; 95%CI=0.74‐1.11, P<0.001)
– Dabigatran 150 mg, twice daily, (RR=0.66, 95%CI=0.53‐0.82, P<0.001)
• Note: CI including 1 will not help with determining significance
Connolly SJ et al. N Engl J Med. 2009; 361:1139-51.
RE‐LY: Results
Favors Warfarin Favors Dabigatran
1
110 mg RR 0.91 (CI 0.74 to 1.11, P < 0.001)
150 mg RR 0.66 (CI 0.53 to 0.82, P < 0.001)
1.46
“Noninferiority–showing a treatment
is good because it is not bad.”
‐‐WC Blackwelder
Guidelines
• Consensus‐based
– Based on expert opinion
• Evidence‐based
– Hierarchy of evidence
– Well done meta‐analysis
– Randomized controlled trials
– Epidemiology studies
Evidence‐based Resources
• Tools for evaluating meta‐analysis
– CASP: Critical Appraisal Skills Program
– Bandolier
• Evaluating Guidelines
– AGREE instrument
– Bandolier
– Guidelines.gov
• RxWebLinks
__________________________________________________________________________________________________________ ©2017 American Society of Health-System Pharmacists, Inc. All rights reserved.
47
Efficacy versus Effectiveness
• Efficacy
– Does the drug therapy work based on clinical trials?
– Limitations of randomized controlled trials
—Controlled environment
—Optimal compliance
Effectiveness
• Does the drug therapy work in the real world?
– Environment not controlled; reflects how people really prescribe and use the drug
– Is the therapy worth it in terms of outcomes achieved?
– Considers efficacy and safety, as well as cost
• Cost effectiveness = outcome/cost
• Does the therapy have value?
Common Issues
• Duration of therapy
• Duration of evaluation
• Dosing equivalents
• How results are presented
• Balancing cost of therapy and clinical outcomes
Reporting Data
• Watch graphs!!
• Changing numbers to %
• Collapsing data in categories
• % change from baseline
Review
• Common study designs
• Sources of bias
• Statistical tests
• Observational studies
• Strength of evidence
Follow‐up
• Identify what you know
• Develop a checklist of things you need to study
• Use resources to assist you
__________________________________________________________________________________________________________ ©2017 American Society of Health-System Pharmacists, Inc. All rights reserved.
48

Growing Your Skills
• Read one article per week
• Look for articles with editorials or perspectives plus letters to the editor
• Use resources in reference list
• Consult internet statistical references
Study Tips
• Flow chart articles
• Use 2x2 tables and make calculations
• Compare and contrast 2 articles on same topic
– Assess study design, selection criteria, similarity of interventions
• Read the accompanying published editorials and letters
__________________________________________________________________________________________________________ ©2017 American Society of Health-System Pharmacists, Inc. All rights reserved.
49
Related Documents