Debbie Stern, R.Ph. Vice President Rxperts Managed Care Consultants, Inc. Specialty Pharmaceuticals: Market Overview

Welcome message from author
This document is posted to help you gain knowledge. Please leave a comment to let me know what you think about it! Share it to your friends and learn new things together.
Transcript

Debbie Stern, R.Ph.Vice President
Rxperts Managed Care Consultants, Inc.
Specialty Pharmaceuticals:Market Overview

2
Presentation Overview
• Defining Specialty Pharmacy
• Current and Future Trends in Specialty Pharmacy
• Coverage and Management of Specialty Pharmaceuticals
• Future Challenges

3
Defining Specialty Pharmacy
4
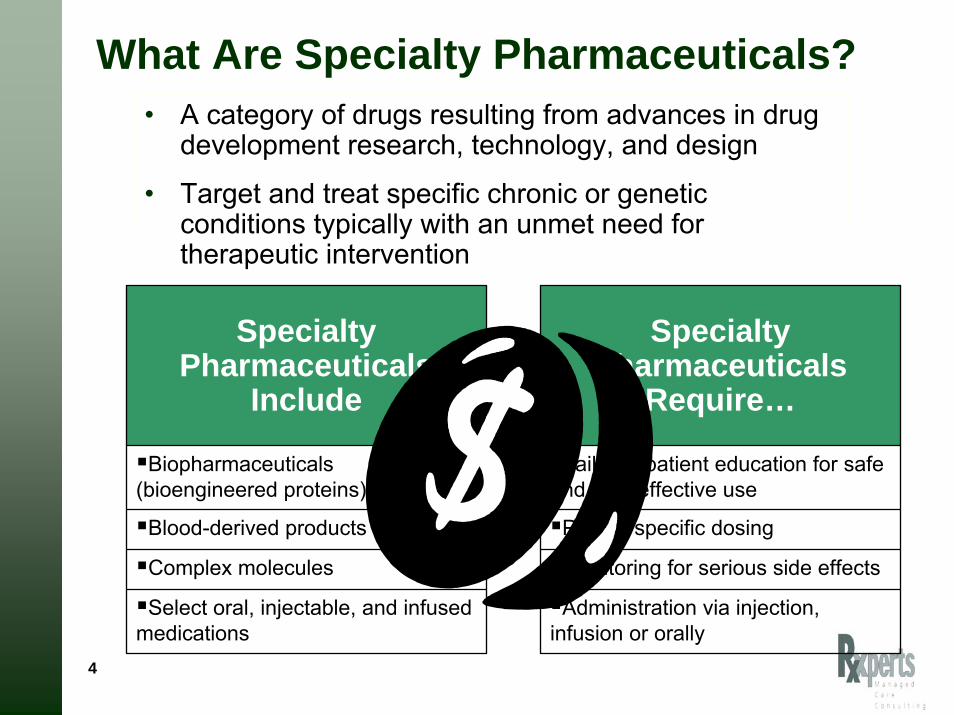
What Are Specialty Pharmaceuticals?
Specialty Pharmaceuticals
Include
Specialty Pharmaceuticals
Require…
Biopharmaceuticals (bioengineered proteins)
Tailored patient education for safe and cost-effective use
Blood-derived products Patient specific dosing
Complex molecules Monitoring for serious side effects
Select oral, injectable, and infused medications
Administration via injection, infusion or orally
• A category of drugs resulting from advances in drug development research, technology, and design
• Target and treat specific chronic or genetic conditions typically with an unmet need for therapeutic intervention

5
Current Biotech Diseases/Therapies and Related Drug Examples
Disease/Therapy Drug Name Disease/Therapy Drug Name
Asthma Xolair Multiple Sclerosis Avonex, BetaseronCopaxone, Rebif, Tysabri
Anemias(Hematopoietics)
Procrit, Epogen, Aranesp, Neupogen
Pulmonary HTN RemodulenFlolanTracleer
Crohn’s Disease Remicade, Humira Psoriasis AmeviveRaptiva
Gaucher’s Disease Cerezyme Oncology RituxanGleevecHerceptinAvastinTarceva
Hemophilia Recombinate,Benefix, other Factor products
Rheumatoid Arthritis
EnbrelHumiraRemicade
Hepatitis C PegasysPeg-Intron
Growth Hormone NutropinGenotropin
Infertility Gonal-F. Follistim RSV Synagis
6
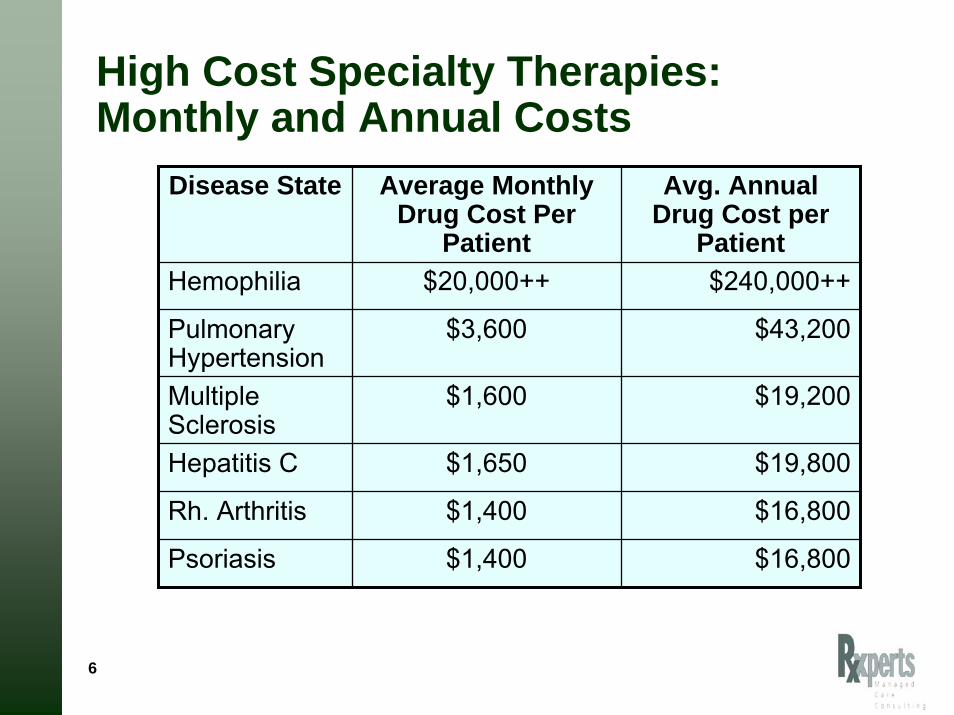
High Cost Specialty Therapies:Monthly and Annual Costs
Disease State Average Monthly Drug Cost Per
Patient
Avg. Annual Drug Cost per
PatientHemophilia $20,000++ $240,000++
Pulmonary Hypertension
$3,600 $43,200
Rh. Arthritis $1,400 $16,800
Multiple Sclerosis
$1,600 $19,200
Hepatitis C $1,650 $19,800
Psoriasis $1,400 $16,800
7
Specialty Pharmacy Trends

8
High cost per patient• Accounts for 15% of
pharmaceutical spending in the US
• Annual growth at 15-20%
• Annual drug cost ranges from $15,000 - $250,000+ per patient
• Manufacturer price increases for existing drugs
• No generics available as products mature
Increasing utilization• Flourishing pipeline
• Multiple indications for existing drugs
• Earlier use of biologics in treatment
• Move from rare diseases to more common chronic diseases
• Episodic vs. chronic treatment
Key Drivers of Specialty Trend
9
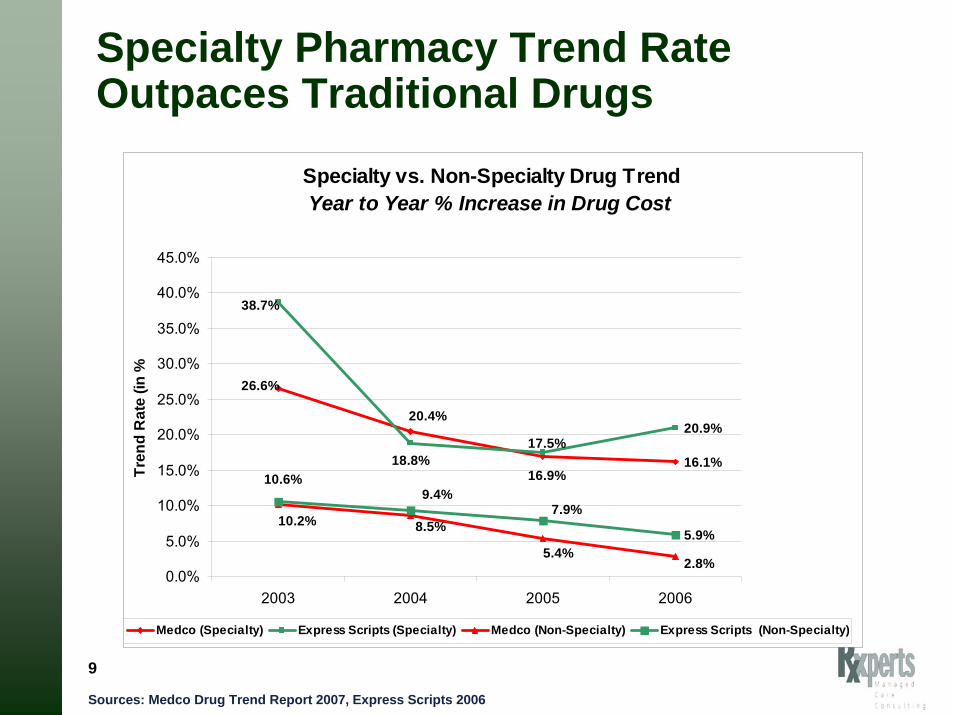
Specialty Pharmacy Trend Rate Outpaces Traditional Drugs
Specialty vs. Non-Specialty Drug TrendYear to Year % Increase in Drug Cost
16.1%
20.9%
5.9%
26.6%
20.4%
16.9%18.8%
38.7%
17.5%
8.5%
5.4%2.8%
10.2%7.9%
9.4%10.6%
0.0%
5.0%
10.0%
15.0%
20.0%
25.0%
30.0%
35.0%
40.0%
45.0%
2003 2004 2005 2006
Year
Tren
d R
ate
(in %
Medco (Specialty) Express Scripts (Specialty) Medco (Non-Specialty) Express Scripts (Non-Specialty)
Sources: Medco Drug Trend Report 2007, Express Scripts 2006

10
Pipeline View by Therapy Class
Source: PhRMA 2006 Report: Medicines in Development)
Biotech Drugs in Development
210
50
44
22
22
18
17
15
14
13
10
9
7
6
4
4
0 50 100 150 200 250
CancerInfectious Disease
AutoimmuneAIDS/HIV
CardiovascularOther
NeurologicDiabetes
GastrointestinalRespiratory
BloodGenetic
SkinEye
GrowthTransplant
418 in late stage development

11
Biotechnology PipelineNew Molecular Entities and Supplemental Indications
in Phase III Development
Caremark RxPipeline. September 2007 and March 2008
52%47%
40% 38%
48%53%
60% 62%
0%
10%
20%
30%
40%
50%
60%
70%
New MolecularEntitites (9/07)
New MolecularEntitites (3/08)
SupplementalIndications
(9/07)
SupplementalIndications
(3/08)
Traditional
Specialty

12
Projected Spend for Specialty Medications: 2005 vs. 2009
Express Scripts Analysis of CMS and IMS data
Does not include infused therapy and chemotherapy
125% increase
32% increase
2009-2011 projected trend = 20% annually
Express Scripts 2007 Drug Trend Report
13
Coverage and Management of Specialty Pharmaceuticals

14
Impact of Specialty Injectables• High cost biotechnology drugs are changing the managed
care “paradigm”– Traditional drug management strategies are not enough – “Siloed” drug management mentality not applicable
• Specialty drugs have been the fastest growing segment of drug spend
• SpRx represents significant challenges for private and public payers– Cost Management
• Network• Patient Cost Share
– Clinical Management
– Utilization Management
– Benefit Design • Is it Pharmacy or is it Medical?

15
Three Types of Specialty Drugs
Self-Administered Drugs
Home Infused Drugs
Office Administered Drugs
RA: Enbrel, Humira, KineretMS: Betaseron, Avonex, Copaxone, RebifGrowth HormonePsoriasis: Enbrel, RaptivaBlood Modifiers: Epogen, Neupogen, AranespCancer: Oral Oncolytics
Hemophilia: VariousGaucher’s Disease: CerezymeFabry’s Disease: FabrazymePAH: Flolan, RemodulenIVIG
RA: Remicade, Orencia, RituxanMS:, Avonex, Growth HormonePsoriasis: AmeviveBlood Modifiers: Epogen, Neupogen, Aranesp, ProcritAsthma: XolairCancer: Infused Oncolytics
Some Crossover Occurs Between Sites of Administration
Rx Benefit Med. Benefit Rx or Med Benefit
16
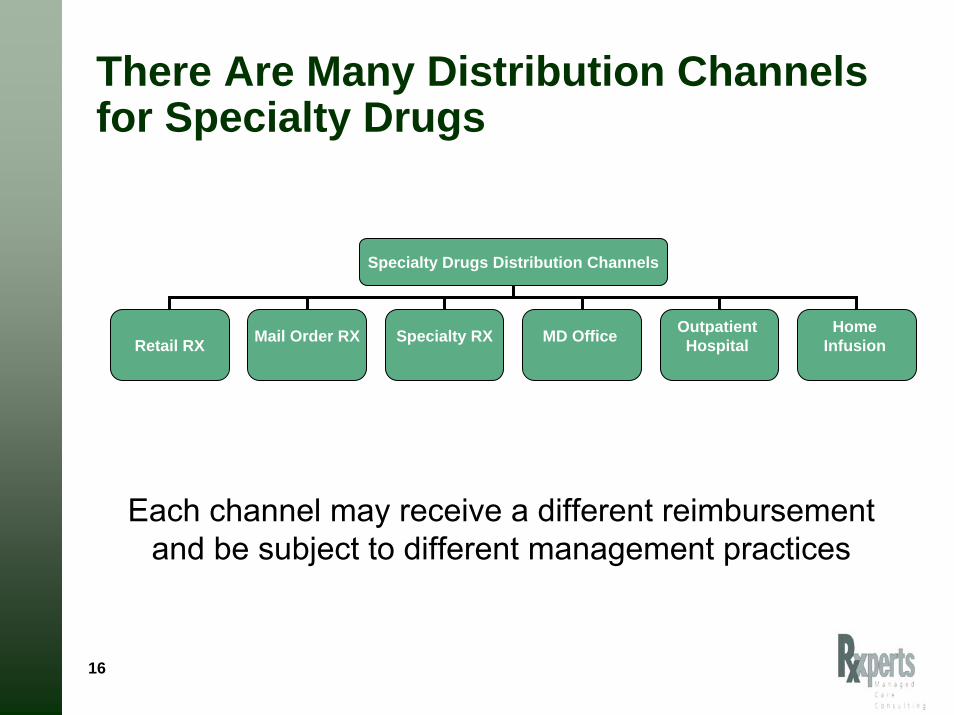
There Are Many Distribution Channels for Specialty Drugs
Specialty Drugs Distribution Channels
Retail RX Mail Order RX Specialty RX MD Office Outpatient Hospital
Home Infusion
Each channel may receive a different reimbursement and be subject to different management practices

17
Specialty Pharmacy Providers (SPP)
Owned by PBMs, health plan, drug chains, wholesalers, home infusion companies
Pharma trend to limit distribution of SpRX to select SPPs and restrict
access
Clinical Services
Distribution Reimbursement

18EMD Serono Injectables DigestTM 4th Edition
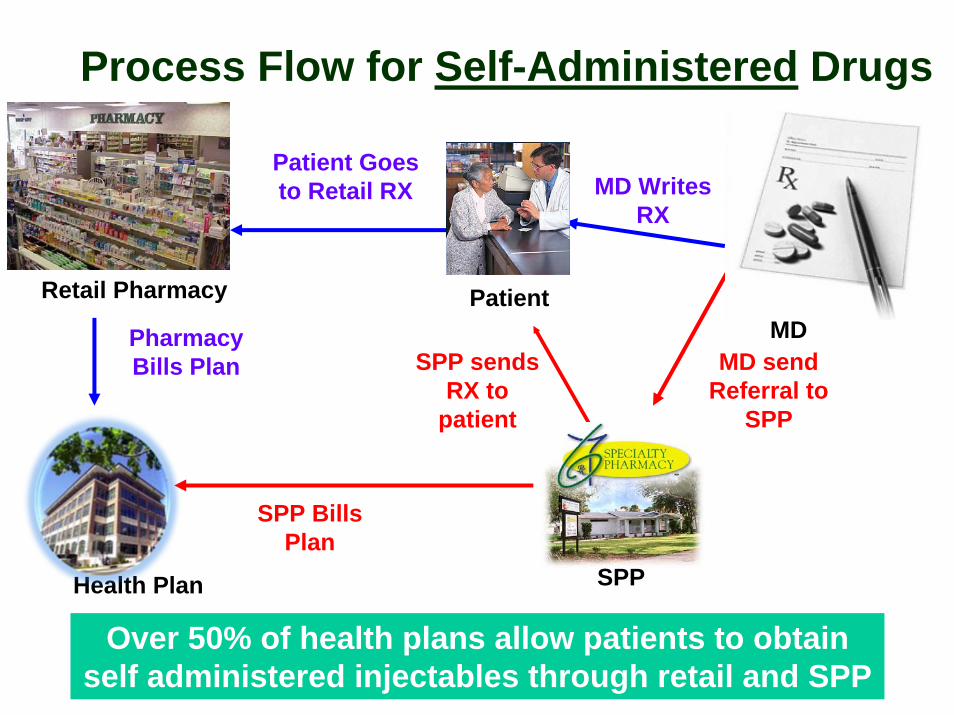
Process Flow for Self-Administered Drugs
SPP
Retail Pharmacy
Health Plan
MDPatient
Patient Goes to Retail RX
SPP Bills Plan
Pharmacy Bills Plan MD send
Referral to SPP
MD Writes RX
Over 50% of health plans allow patients to obtain self administered injectables through retail and SPP
SPP sends RX to
patient
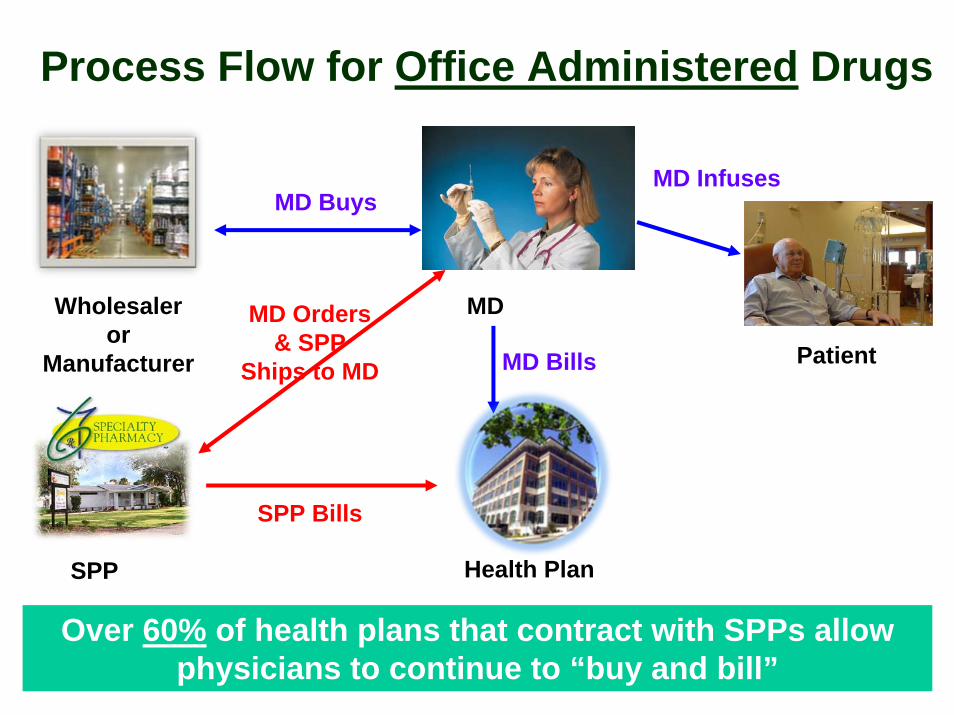
Process Flow for Office Administered Drugs
Over 60% of health plans that contract with SPPs allow physicians to continue to “buy and bill”
SPP
Wholesaler or
Manufacturer
Health Plan
MD Orders & SPP
Ships to MD
MD
PatientMD Bills
MD Buys
SPP Bills
MD Infuses

Outbound Pt Call –Enrollment and Education
Outbound Pt Call – Initiate Discussion Following First Dose:Discuss ADRs, Adherence, Response; Schedule Next Refill
Outbound Pt Calls – Discuss ADRs, Adherence, Response;Initiate Discussion and Schedule Next Refill
Outbound Pt Call –Follow up to Therapy,
Assess Outcomes
Patient Starter Packet Monitor Early Virologic Response
1 Week
3 Weeks
7 wee ks
11 Weeks
15 Weeks
19 Weeks
23 Weeks
27 Weeks
31 Weeks
35 Weeks
39 Weeks
43 Weeks
47 Weeks
Assess for Early Responder
0 Weeks
12 Weeks
24 weeks
Specialty Pharmacy Therapy Management of Hepatitis C

22
Clinical and Utilization Management

23
Payers Want to Ensure Appropriate Utilization
Right Drug
Right Time
Right Patient
Is this the correct dose?
Is this the right time in the regimen?
Does the pt. have enough meds? Too
many?
Should therapy be discontinued?
Have labs been performed at the
right time to measure results?
Is there another medication that
may be more appropriate?
Or may be less expensive yet
equally effective?

24
Payers Employ a Variety of Utilization Management Techniques
• Development of clinical guidelines and criteria
• Prior authorization to ensure appropriate use
• Step therapy guidelines
• Promote formulary with preferred products
• Reduce waste and over-use
25
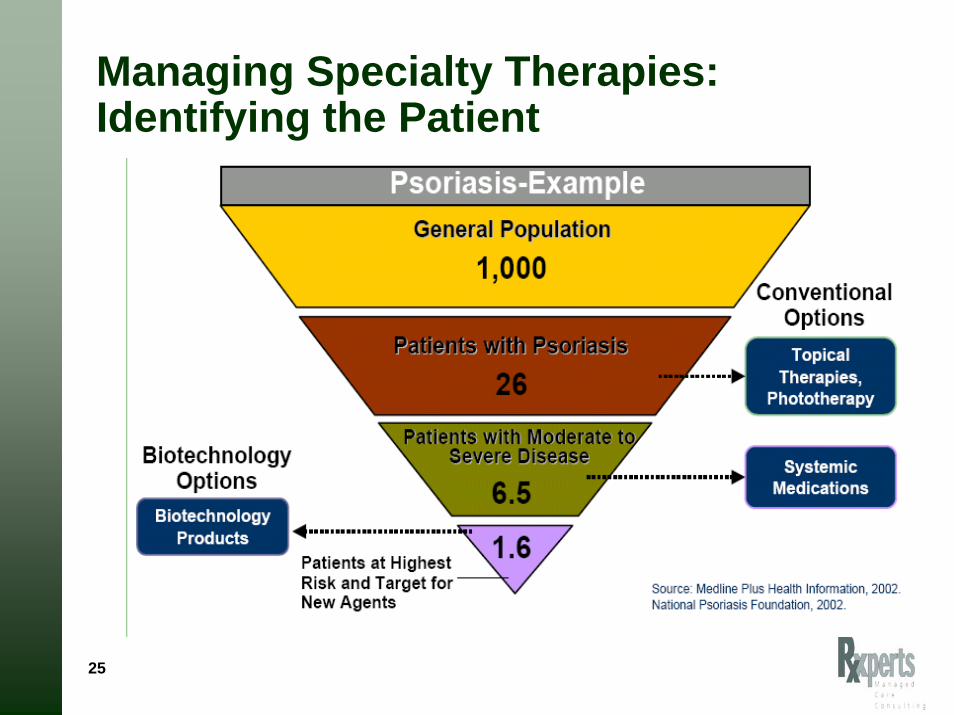
Managing Specialty Therapies: Identifying the Patient

26
Specialty Guideline Management Condition Specific Case Study – RSV
Source: Caremark Analytics and Outcomes analysis.
62% 55%67% 61% 59%
15%17%
5%3% 3%
23% 28% 28% 36% 38%
0%10%
20%30%
40%50%
60%70%
80%90%
100%
2002-2003 2003-2004 2004-2005 2005-2006 2006-2007
Met Guidelines and Treated Did Not Meet Guidelines and TreatedDid Not Meet Guidelines and Not Treated
N=1,271 N=1,029 N=739 N=961 N=976
791
191
289
566
177
286
497
35
207
584
27
350
578
30
368
Program Financial Results 2002-2003 2003-2004 2004-2005 2005-2006 2006-2007Did not meet AAP Guidelines 23% 28% 28% 36% 38%Number of Doses Avoided 1,300 1,287 941 1,278 1,391Cost Avoidance $ 1.9M $ 1.9M $ 1.5M $2.1M $2.5M

27
Benefit Design Issues

28
Misaligned Financial Incentives Among Stakeholders
Patient
Specialty Pharmacy
Doctor
I want the highest reimbursement
I want the lowest copay
I want to make a profit on the drug

29
Payers are Looking at New Benefit Strategies to Manage Specialty DrugsChanging Benefit Design
• Trend to move from Medical Benefit to RX Benefit
• New Specialty Benefit
• Results in equalizing cost sharing, deductibles, clinical review
Increased Pt. Cost Share
• Creation of 4th copaytier– % coinsurance/higher
flat copay
• Out-of-pocket maximums per RX
• Deductibles
• Annual or lifetime maximum benefit
Payers face an ethical dilemma – how much copay is too much?

Looking to the Future
31
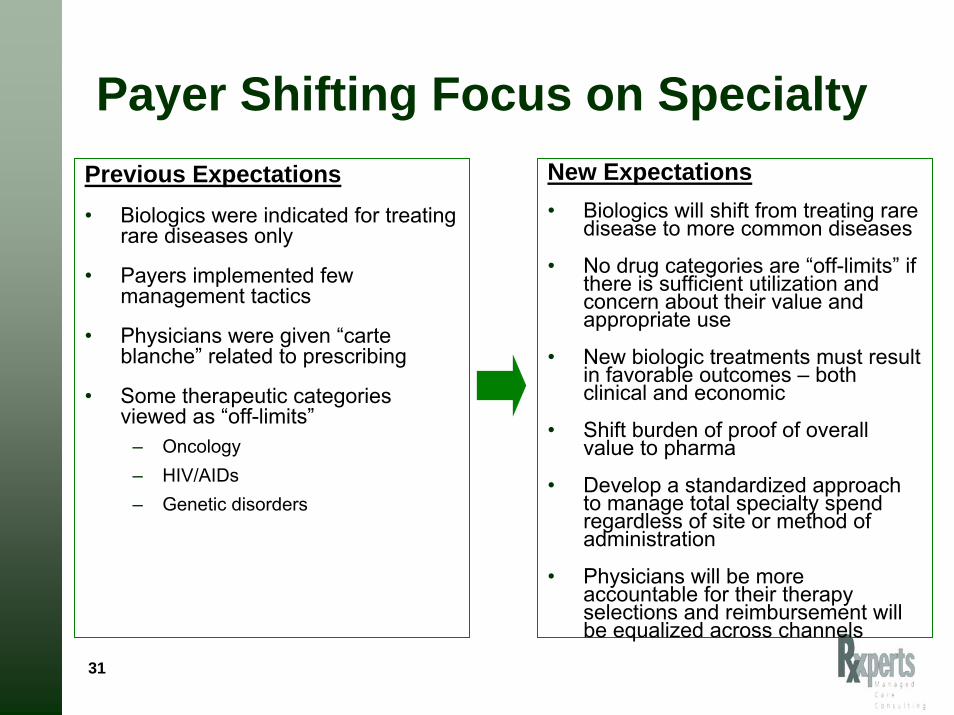
Payer Shifting Focus on SpecialtyPrevious Expectations• Biologics were indicated for treating
rare diseases only
• Payers implemented few management tactics
• Physicians were given “carte blanche” related to prescribing
• Some therapeutic categories viewed as “off-limits”
– Oncology – HIV/AIDs– Genetic disorders
New Expectations• Biologics will shift from treating rare
disease to more common diseases
• No drug categories are “off-limits” if there is sufficient utilization and concern about their value and appropriate use
• New biologic treatments must result in favorable outcomes – both clinical and economic
• Shift burden of proof of overall value to pharma
• Develop a standardized approach to manage total specialty spend regardless of site or method of administration
• Physicians will be more accountable for their therapy selections and reimbursement will be equalized across channels

32
Focus on Outcomes• Uncertainty Related to Outcomes
– Safety, efficacy and cost concerns• 75 new or revised black box warnings in 2007
– Outcomes data not available when a new drug comes to market– Efficacy varies across patient populations and indications– Payers demanding pharmacoeconomic value from new therapies– Many new therapies do not provide quantifiable outcomes – FDA accelerated approvals
• Product approval for life threatening diseases available on the market on the basis of preliminary evidence prior to formal demonstration of patient benefit.
– Pharma may be required to document outcomes via a Pay for Performance (P4P) model.
– P4P’s intent is to improve evidence base for safety, comparative effectiveness and value
• Move focus from EBM to outcome based medicine• Comparative effectiveness of competing agents• Improve value for money paid as well as quality of care

33
Global P4P Models: Will This Work in the US?
Type of Model Description Example
Price/Volume Payment is linked to predetermined utilization based on prevalence or sub-groups to limit budget impact and inappropriate use
55 agreements in Australia including anti-TNF and Spiriva.
Other agreements in France and Italy.
Performance or Risk-based
Different reimbursed price depending on patient outcomes
NICE/UK Multiple sclerosis DMDsManufacturers at risk for cost if defined outcomes are not achieved
Velcade (bortezomibe)Manufacturer refunds cost if target outcome not achieved

34
Selecting Optimal Therapy
NonResponders
Poor Metaboizers
Poor Responders
ExtendedMetabolizers
High Responders
HyperMetabolizers
No Effect Desired Effect Adverse Effects
40-60% of patients do not benefit from the drugs they are prescribed
Adapted from PWC Personalized Medicine 2005
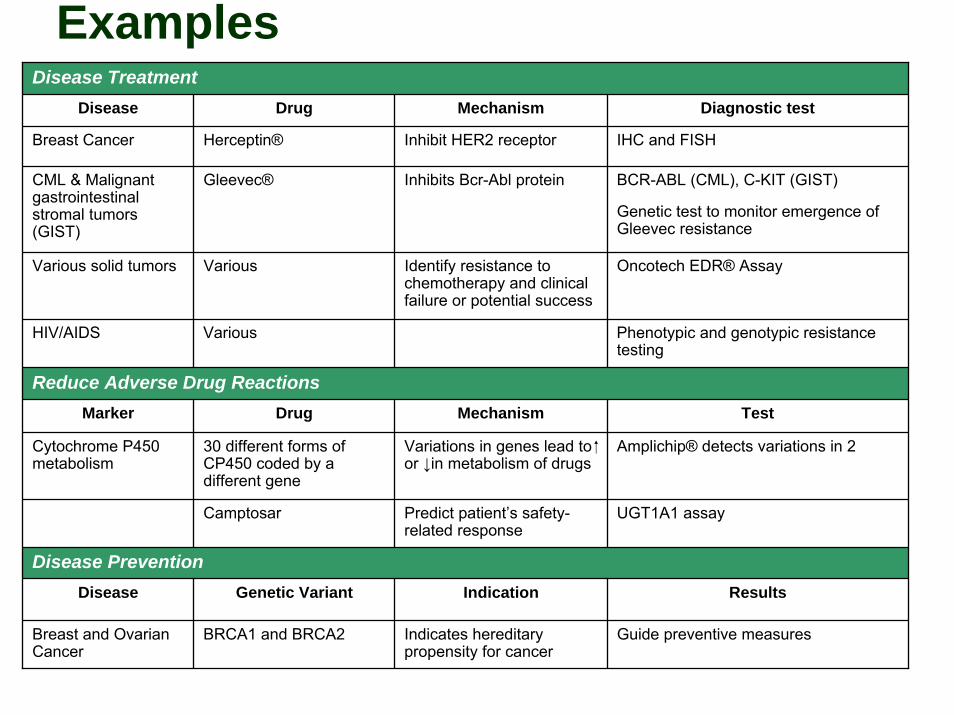
ExamplesDisease Treatment
Disease Drug Mechanism Diagnostic test
Various solid tumors Various Identify resistance to chemotherapy and clinical failure or potential success
Oncotech EDR® Assay
Marker Drug Mechanism Test
Camptosar Predict patient’s safety-related response
UGT1A1 assay
Disease PreventionDisease Genetic Variant Indication Results
Cytochrome P450 metabolism
30 different forms of CP450 coded by a different gene
Variations in genes lead to or ↓in metabolism of drugs
Amplichip® detects variations in 2
Breast Cancer Herceptin® Inhibit HER2 receptor IHC and FISH
CML & Malignant gastrointestinal stromal tumors (GIST)
Gleevec® Inhibits Bcr-Abl protein
Indicates hereditary propensity for cancer
BCR-ABL (CML), C-KIT (GIST)
Genetic test to monitor emergence of Gleevec resistance
HIV/AIDS Various Phenotypic and genotypic resistance testing
Reduce Adverse Drug Reactions
Breast and Ovarian Cancer
BRCA1 and BRCA2 Guide preventive measures

36
Public Perception of Specialty Pharmaceuticals

37
Specialty Drug Costs are Viewed as a “Side Effect”
• Current specialty drug spend is $60 billion
• Expected to reach $99 billion by 2010
• Annual trend rate is 15–20%
Side Effects2
The average cost of a monthly prescription is going up for many drug classes.
Drug Class Cost (2007) Change from 2006
Cancer $1816.38 15.8%
Multiple sclerosis $1647.00 12.1%
Blood-cell deficiency $1724.51 9.0%
Inflammatory conditions $1547.97 4.6%
Growth-hormone deficiency $2569.10 1.8%
Source: Express Scripts (prices are paid by the pharmacy-benefits manager
2. Table reported in the Wall Street Journal, 3/20/2008.
“Payers Aim to Rein in Specialty Drug Spending”Wall Street Journal 3/20/08

38
Specialty Pharmacies, Pharma and Health Plans Portrayed as “Pushing Prices Higher”
New York Times, 4/14/08
“Co-payments Soar for Drugs with High Prices”
Blames employers and plan sponsors for the high cost of biotech treatments.
New York Times, 4/19/08
“Paid to Control Drug Costs, Yet Pushing
Some Prices Higher”
Blames high cost of biotech drugs on those who dispense and manage biotech products.
Focus on drugs with limited or exclusive distribution.

39
Issues to Consider…• How private and public payers can continue to offer affordable
benefits to all enrollees with increased use of biologics
• How to equitable adjust cost share for persons who need to take expensive biologics
• How to remove administrative decisions about benefit design and reimbursement when selecting the appropriate drug for the patient
• The lack of a viable biosimilar pathway
• How to monitor therapy adherence and outcomes that show effectiveness of therapy
• How to overcome data management challenges within the legacy medical claims system

40
Discussion

Top specialty drug spend Pharmacy benefit and medical benefit – 2006
Pharmacy Medical
Source: Medco BOB Sample. Pharmacy data, 2006.
5.1%
4.6%
25.1%
15.5%
6.5%
25.2%
18.0%
Multiple sclerosis
Rheumatoidarthritis
Allother
Cancer
Growth hormone
Anemia
Hep C 14.5% 31.3%
16.6%
22.0%15.3%
RheumatoidarthritisAll
other
Cancer
Anemia
Neutropenia
Medco 2007 Drug Trend Report
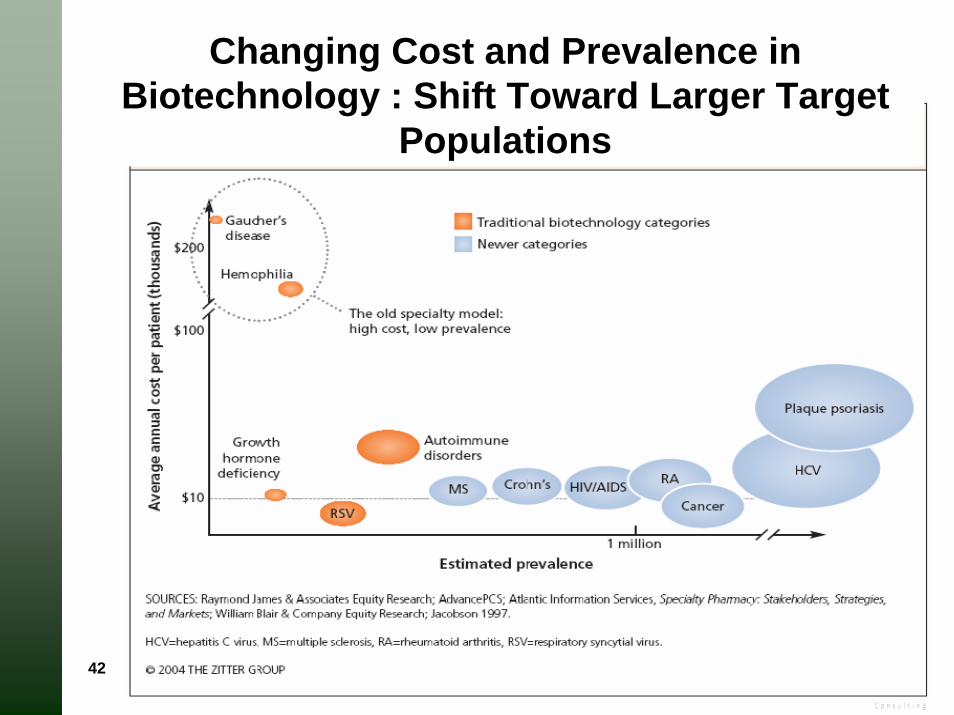
42
Changing Cost and Prevalence in Biotechnology : Shift Toward Larger Target
Populations

43
The Promise of Personalized MedicineBetter diagnoses and earlier interventions.
• Detect disease at earlier stage
• Reduce adverse drug reactions
• Shift emphasis from REACTION to PROACTION
More efficient drug development.
• Design targeted therapies based on molecular pathways
• Smaller defined patient population to reduce initial cost and duration of clinical trials
• Reduce time, cost and failure rate of clinical trials
More cost-effective therapies.
• Cost savings realized through proactive and preventive interventions
• More patients seeking care once identified
• Less patients requiring “shotgun” or ineffective therapy
• Select optimal therapy and reduce trial and error prescribing
Related Documents