Delft University of Technology FACULTY MECHANICAL, MARITIME AND MATERIALS ENGINEERING Department Maritime and Transport Technology Mekelweg 2 2628 CD Delft the Netherlands Phone +31 (0)15-2782889 Fax +31 (0)15-2781397 www.mtt.tudelft.nl This report consists of 87 pages and 11 appendices. It may only be reproduced literally and as a whole. For commercial purposes only with written authorization of Delft University of Technology. Requests for consult are only taken into consideration under the condition that the applicant denies all legal rights on liabilities concerning the contents of the advice. Specialization: Production Engineering and Logistics Report number: 2014.TEL.7909 Title: Eliminating the blind spot by enhancing situation awareness to increase straddle carrier safety. Author: R.F.H. van den Heuvel BSc. Title (in Dutch) Het elimineren van de dode hoek door het verbeteren van situatiebewustzijn om straddle carrier veiligheid te vergroten. Assignment: Masters thesis Confidential: no Initiator (university): Prof. Dr. Ir. G. Lodewijks Initiators (company): A. Muller Ir. B. Hiemstra Supervisor: Dr. W.W.A. Beelaerts van Blokland Date: January 28, 2015

Welcome message from author
This document is posted to help you gain knowledge. Please leave a comment to let me know what you think about it! Share it to your friends and learn new things together.
Transcript
Delft University of Technology
FACULTY MECHANICAL, MARITIME AND
MATERIALS ENGINEERING Department Maritime and Transport Technology
Mekelweg 2 2628 CD Delft
the Netherlands Phone +31 (0)15-2782889
Fax +31 (0)15-2781397 www.mtt.tudelft.nl
This report consists of 87 pages and 11 appendices. It may only be reproduced literally and as a whole. For commercial purposes only with written authorization of Delft University of Technology. Requests for consult are
only taken into consideration under the condition that the applicant denies all legal rights on liabilities concerning the contents of the advice.
Specialization: Production Engineering and Logistics Report number: 2014.TEL.7909 Title: Eliminating the blind spot by
enhancing situation awareness to increase straddle carrier safety.
Author: R.F.H. van den Heuvel BSc.
Title (in Dutch) Het elimineren van de dode hoek door het verbeteren van situatiebewustzijn
om straddle carrier veiligheid te vergroten.
Assignment: Masters thesis
Confidential: no
Initiator (university): Prof. Dr. Ir. G. Lodewijks Initiators (company): A. Muller Ir. B. Hiemstra Supervisor: Dr. W.W.A. Beelaerts van Blokland
Date: January 28, 2015

TU Delft Delft University ofTechnology
FACULTY OF IVIECHANICAL, MARITIME AND MATERIALS ENGINEERING Department of Marine and Transport Technology
Mekelweg 2 2628 CD Delft the Netherlands Phone +31 (0)15-2782889 Fax +31 (0)15-2781397 www.mtt.tudelft.nl
Student:
Supervisor (TUD):
Supervisor (APMTR)
R.F.H. van den Heuvel BSc. Dr. W.W.A. Beelaerts van Blokland A. Muller Ir. B. Hiemstra
Assignment type:
Creditpoints (EC):
Specialization:
Report number: Confidential:
Master thesis
35
PEL
2014.TEL7909 No
Subiect: Eliminating the blind spot of a straddle carrier to increase straddle carrier
safety.
To prevent losses in a transport process, adequate coordination of the individual components is
essential. Safety could prevent these losses and is one of the drivers of continuous improvement in
the industry. Within a safe environment injuries and disturbances are prevented. At APM Terminals
Rotterdam, a manned straddle carrier operated container terminal, straddle carrier collisions occur.
These collisions could be reduced with adequate control ofthe straddle carriers.
Prior research has shown that blind spots are a major contribution to such accidents. Straddle carrier
drivers indicate the impaired sight as the major cause of these accidents. It is suggested that the
straddle carrier should be adapted to increase sight and overview which should reduce straddle carrier
collisions.
Your assignment is to explore the options to increase straddle carrier safety from a driver perspective
and to provide a tool that increases sight and overview ofthe straddle carrier driver.
The report should comply with the guidelines of the section. Details can be found on the website.

iii 2014.TEL.7909
Preface
This thesis contains the findings of my study regarding safety improvement of straddle carrier traffic. In the past,
the blind spot of a straddle carrier has resulted in several accidents. So far, the industry has not been able to solve
this problem yet. Since such accidents are not very common, finding sufficient and objective data about these
accidents was difficult. Together with the fact that safety and risk is hard to quantify, this topic was quite a
challenge. The incorporation of the driver's cognitive process was found to be key in this problem.
This research was conducted at APM Terminals Rotterdam. This container terminal which is located at the
Maasvlakte is completely operated by manned straddle carriers. Due to the presence of people in the system,
unsafe situations occur. Since a few years safety is one of the top priorities within APM Terminals. Therefore
they provided me the opportunity to do my study on site to investigate whether traffic safety could be improved.
To eliminate the blind spot problem, this study shows that the straddle carrier driver should be provided with
continuous information about the other surrounding straddle carriers. It appeared that a blind spot camera was
the most suited option for APM Terminals Rotterdam. The camera increases the situation awareness of straddle
carrier driver in certain situations, which reduces the probability of driver errors. The camera also reduces the
perceived workload of the straddle carrier driver, leading to more attentional supply for other goals and tasks.
I would like to thank APM Terminals Rotterdam for providing this internship and the opportunity to increase
the safety of their drivers. It is a satisfactory idea that the camera, once deployed, could save someone’s life
someday. So thanks to all the straddle carrier drivers, the people in the office and people from technical services
that helped me out during this study. Special thanks to straddle carrier driver Joop Verlinde for helping me out
with filming for the experiment and providing me with a lot of advice. I also like to thank the safety managers of
Port of Tacoma, Port of Dammam, PSA Antwerp and APM Zeebrugge for providing their view on the blind spot
problem.
I want to thank Bart Hiemstra for guiding me through this study. He has been a great help on many levels,
especially on the scientific level. Thank you for your patience and your sharp comments. It meant a lot. I also
want to thank my supervisor Alex Muller for providing me with all the tools and people needed to execute this
study and for his advice during this research project.
I want to thank professor Gabriel Lodewijks for his sharp recommendations during the meetings. Also many
thanks to Wouter Beelaerts van Blokland for always providing me with new ideas, good advice and energy after
each meeting. Thank you very much for taking this time. Joost de Winter, thank you very much as well for
providing me with advice about the experiment during this study.

iv 2014.TEL.7909
And last but not least, I would like to thank my parents, friends and my girlfriend Renée for supporting me
throughout this research project. My parents for their help during my study and always supporting whatever
choice I made. My friends for understanding my occupation due to this research and by giving some advice now
and then. And off course Renée for all her help and incredible patience. It would have been a lot harder without
your support. Many thanks.
I wish you a nice read.
Roy van den Heuvel, January 2015
v 2014.TEL.7909
Abstract
In order to increase safety on a manned straddle carrier operated container terminal, the probability of a straddle
carrier collision should be reduced. The blind spot of the straddle carrier is a known cause of human error, which
has resulted in a straddle carrier collisions. To prevent those human errors, insight in the cognitive processes of a
straddle carrier driver is needed. The situation awareness (SA) model developed by Endsley (1995) is used to
model the straddle carrier driver’s decision making process in order to predict driver behaviour.
The straddle carrier is a relatively underrepresented subject in scientific literature. This is probably due to the
limited use of straddle carriers worldwide. Research regarding the straddle carrier engages in straddle carrier
routing and developing simulations in order to increase productivity, but no scientific literature on straddle
carrier driver sight is known. Therefore frameworks, methods and theories from related fields (such as road
traffic and aviation) are adapted to serve as a framework for this research. This literature review also provided
insight in best-practices, pitfalls and common used technology for blind spot problems.
Since the straddle carrier drivers are used to deal with the blind spots of a straddle carrier, it is necessary to
understand why the blind spots occasionally lead to a collision. The SA-oriented design method developed by
Endsley et al. (2012) was altered and was used to obtain a user-centered solution for the blind spot problem of
straddle carriers.
Using accident reports of APMTR of the past 10 years, situations are reconstructed to discover other factors
leading to a straddle carrier collision. The blind spot impedes quick detection of the other straddle carrier, which
sometimes leads to a missed detection due to one of the escalation factors. This accident analysis led to the
selection of collisions that occurred due to impaired vision towards the port side of the straddle carrier when
driving forward.
The SA requirements analysis provided the functional requirements for the problem of impaired vision due to
the blind spot. The SA requirements analysis showed that the driver should be informed continuously about the
locations of other straddle carriers at the forward port side of the straddle carrier. It appeared that a blind spot
camera system is the optimal solution for APMTR to provide this information.
The final step of the method was to measure the effect on the driver’s SA to be able to predict the effect of the
blind spot camera on the probability of straddle carrier collisions. This was done with an experiment using
hazard perception videos conducted with 31 straddle carrier drivers.
The results show that the blind spot camera increases driver’s SA in the situation of a straddle carrier leaving the
quay crane area and in the situation of a straddle carrier leaving the container stack with a top-lifted container.
vi 2014.TEL.7909
Since increased SA reduces the probability of human error, it is plausible that the probability of a straddle carrier
collision will be reduced by the blind spot camera.
The blind spot camera seems to be effective in increasing SA in situations where the straddle carrier trajectories
are perpendicular, although the results of one situation could not confirm this. This is probably due to the
backlight caused by the sun. Further research should investigate whether this indeed is the cause of the small
difference in driver SA and how to increase contrast in case of a backlit scene. Therefore it cannot be concluded
that for all situations where the driver leaves the container stack, SA will be increased by the blind spot camera.
The results also show that the blind spot camera decreases perceived workload, which shows that the blind spot
camera does not create a data overload problem. The decreased workload also leads to increased attentional
supply indicating that a straddle carrier driver could spend more attention to other goals and tasks.
By evaluating technology acceptance indicators and driver remarks it is expected that the blind spot camera will
be accepted -and thus used- by the younger straddle carrier drivers. It is however uncertain whether the older
and experienced straddle carrier drivers will use the blind spot camera. Some drivers indicated that the
acceptation is dependent on the familiarization with the blind spot camera. This indicates that the learning curve
plays a role in the acceptation of the blind spot camera. At least the drivers should be instructed how and when
the camera should be used to ensure that the camera will be correctly used.
These findings are applicable to straddle carriers with impaired sight towards the port side of the straddle carrier.
vii 2014.TEL.7909
Samenvatting (in Dutch)
Om de veiligheid op een door straddle carriers bediende container terminal te vergroten, moet de kans op
ongelukken tussen de straddle carriers worden gereduceerd. De dode hoek is een bekende oorzaak van
mensenlijke fouten, welke resulteren in straddle carrier ongelukken. Om deze menselijke fouten te voorkomen is
er inzicht benodigd in het cognitieve proces van de straddle carrier chauffeur. Het situation awareness (SA)
model ontwikkeld door Endsley (1995) wordt gebruikt om het denkproces van de straddle carrier chauffeur te
modeleren en daarmee het gedrag van de chauffeur te voorspellen.
De straddle carrier komt relatief weinig voor in de wetenschappelijke literatuur. Dit komt waarschijnlijk door het
het beperkte gebruik van straddle carriers wereldwijd. Er is onderzoek gedaan naar de straddle carrier routering
en het ontwikkelen van simulaties om de productiviteit te verhogen, maar er is geen wetenschappelijke literatuur
bekend waarbij het zicht van de straddle carrier chauffeur is onderzocht. Daarom worden er raamwerken,
methoden en theoriën vanuit gerelateerde gebieden (zoals het wegverkeer en de luchtvaart) overgenomen in dit
onderzoek. Het literatuuronderzoek heeft ook inzicht gegeven in de best practices, valkuilen en veelgebruikte
technologiën voor dode hoek problemen.
Omdat de straddle carrier chauffeurs gewend zijn om met het dode hoek probleem te werken is het nodig om te
begrijpen waarom de dode hoeken maar af en toe tot een ongeluk leiden. De SA-georienteerde ontwerpmethode
ontwikkeld door Endsley et al. (2012) is aangepast om door middel van het centraal stellen van de straddle carrier
chauffeur een oplossing voor de dode hoek te vinden.
Gebruik makend van ongeluksrapporten van APMTR van de afgelopen 10 jaar, zijn de ongelukssituaties
gereconstrueerd om zo de bijdragende factoren van een ongeluk te vinden. De dode hoek bemoeilijkt de snelle
detectie van de andere straddle carrier, wat soms leidt tot een gemiste detectie door een van de escalatiefactoren.
Deze ongeluksanalyse heeft geleid tot een selectie van ongelukken welke zijn ontstaan door verminderd zicht
richting de bakboord zijde van de straddle carrier wanneer men vooruit rijdt.
De SA behoeften analyse heeft de functionele eisen opgeleverd om het probleem van verminderd zicht door de
dode hoek te elimineren. De analyse heeft aangetoond dat de chauffeur continu geinformeerd moet worden over
de locaties van de andere straddle carriers aan de bakboord voorzijde van de straddle carrier. Het blijkt dat een
dode hoek camera in combinatie met een display in de cabine de meest geschikte oplossing is voor APMTR om
deze informatie naar de chauffeur te brengen.
De laatste stap van de methode was om het effect van dit systeem te meten op de SA van de chauffeur. Dit is
gedaan om te kunnen voorspellen wat het effect is van een dode hoek camera op de kans op een straddle carrier
viii 2014.TEL.7909
ongeluk. Dit is gementen met een experiment met 31 straddle carrier chauffeurs aan de hand van
gevaarherkenningsvideos.
De resultaten laten zien dat de dode hoek camera de SA van de chauffeur vergroot wanneer de straddle carrier
vooruit het kraangebied verlaat en wanneer de straddle carrier met een tot in de top getilde container vooruit het
container stack verlaat. Omdat een vergroot SA de kans op een menselijke fout verkleind, is het plausibel dat de
kans op een straddle carrier ongeluk wordt verkleind door de dode hoek camera.
De dode hoek camera lijkt effectief in het vergroten van SA in situaties waarbij de straddle carrier trajecten haaks
op elkaar staan, hoewel de resultaten van één scenario dit niet kunnen bevestigen. Dit komt waarschijnlijk door
het tegenlicht van de zon. Verder onderzoek zal moeten uitwijzen of dit inderdaad de oorzaak is van het geringe
verschil in SA en hoe het contrast kan worden vergroot in het geval van een situatie met tegenlicht. Er kan
daarom niet geconcludeerd worden dat voor alle situaties waarbij de chauffeur het container stack verlaat, SA
wodt vergroot door de dode hoek camera.
De resultaten laten verder zien dat de dode hoek camera de ervaren werklast verlaagd, wat aantoont dat de dode
hoek camera geen data-overbelasting creeërt. De verminderde werklast leidt ook tot een vergrote
aandachtsvoorziening wat aangeeft dat de straddle carrier chauffeur meer aandacht aan andere doelen en taken
kan schenken.
Door het evalueren van technologie acceptatie indicatoren en opmerkingen van chauffeurs wordt verwacht dat
de dode hoek camera zal worden geaccepteerd –en dus gebruikt- door de jongere straddle carrier chauffeurs. Het
is echter onzeker of de oudere en ervaren straddle carrier chauffeurs de dode hoek camera zullen gaan gebruiken.
Sommige chauffeurs gaven aan dat de acceptatie afhankelijk is van de gewenning met de dode hoek camera. Dit
toont aan dat de leercurve een rol speelt bij de acceptatie van het camera systeem. De chauffeurs moeten daarom
op zijn minst worden geïnstrueerd hoe en wanneer de camera gebruikt moet worden om te verzekeren dat de
camera correct zal worden gebruikt.
Deze bevindingen zijn toepasbaar voor straddle carriers met verminderd zicht richting de bakboord zijde van de
straddle carrier.

ix 2014.TEL.7909
Contents
Preface ...................................................................................................................................................................................... iii
Abstract..................................................................................................................................................................................... v
Samenvatting (in Dutch) ...................................................................................................................................................... vii
Contents .................................................................................................................................................................................. ix
List of figures........................................................................................................................................................................... xi
List of tables ........................................................................................................................................................................... xv
List of abbreviations ............................................................................................................................................................ xvii
1. Introduction: straddle carrier safety ............................................................................................................................ 1
2. Background ..................................................................................................................................................................... 5
2.1 Theory ........................................................................................................................................................................ 6
2.2 Blind spots solutions in other industries ............................................................................................................. 14
2.3 Field of research ...................................................................................................................................................... 20
2.4 Conclusion: research questions ............................................................................................................................ 29
3. Method & problem analysis ........................................................................................................................................ 31
3.1 Accident analysis .................................................................................................................................................... 32
3.2 SA requirements analysis ....................................................................................................................................... 43
3.3 SA-oriented design ................................................................................................................................................. 49
3.4 Experiment: SA measurement .............................................................................................................................. 57
4. Results ............................................................................................................................................................................ 65
4.1 Validity ..................................................................................................................................................................... 66
4.2 Situation awareness ................................................................................................................................................ 68
4.3 Braking response time ............................................................................................................................................ 73
4.4 Data overload .......................................................................................................................................................... 74
4.5 Technology acceptation ......................................................................................................................................... 76
5. Conclusions ................................................................................................................................................................... 79

x 2014.TEL.7909
6. Discussion ..................................................................................................................................................................... 81
References............................................................................................................................................................................... 84
Appendix A: Scientific Research Paper .............................................................................................................................. 89
Appendix B: Worldwide straddle carrier operated ports ................................................................................................ 97
Appendix C: Causes of SC-SC collisions at APMTR ....................................................................................................... 99
Appendix D: Collision situations ...................................................................................................................................... 103
Appendix E: Schematic map port-side blind spot .......................................................................................................... 111
Appendix F: Goal directed task analysis .......................................................................................................................... 113
Appendix G: Variables blind spot camera design .......................................................................................................... 115
Appendix H: Experiment videos ....................................................................................................................................... 117
Appendix I: Experiment question forms ......................................................................................................................... 127
Appendix J: Software code ................................................................................................................................................. 131
Appendix K: Experiment data ........................................................................................................................................... 137

xi 2014.TEL.7909
List of figures
Figure 1 - Increase SC traffic safety ...................................................................................................................................... 2
Figure 2 - Report structure .................................................................................................................................................... 5
Figure 3 - Model of dynamic decision making (adapted from (Endsley, 2000)) ......................................................... 10
Figure 4 - Technology acceptance model (adapted from Davis et al. (1989)) .............................................................. 13
Figure 5 – Volvo’s blind spot information system (BLIS) (source: Volvo Car Group) .............................................. 17
Figure 6 - Pure SC-system (adapted from (Böse, 2011)) ................................................................................................. 20
Figure 7 – Worldwide straddle carrier operated ports .................................................................................................... 21
Figure 8 - Terminal layout APMTR (background image: Google Maps) ..................................................................... 22
Figure 9 - Ancestor of the modern container straddle carrier (source: Kalmar ) ........................................................ 24
Figure 10 - A Noell straddle carrier (source: APMTR).................................................................................................... 25
Figure 11 – Top view straddle carrier driving directions and side indications ............................................................ 25
Figure 12 – Driver position and looking directions ......................................................................................................... 26
Figure 13 - Cabin controls (adapted from Noell Mobile Systems GmbH (2008)) ....................................................... 27
Figure 14 – Detail of report structure................................................................................................................................. 31
Figure 15 – Research method .............................................................................................................................................. 31
Figure 16 - Accident analysis ............................................................................................................................................... 32
Figure 17 - Fault tree top-event ........................................................................................................................................... 33
Figure 18 - Causes of SC-SC collisions at APMTR 2005 - August 2014 (left: number of collisions, right: cost) .... 33
Figure 19 - Causes of SC driver unaware of other SC at APMTR – Number of collisions (2005 - August 2014) ... 35
Figure 20 - Causes of SC driver unaware of other SC at APMTR – Cost (2005 - August 2014) ............................... 35
Figure 21 - Fault tree imminent causes of the SC driver being unaware of the other SC ........................................... 36
Figure 22 - Situation A: backside ........................................................................................................................................ 37
Figure 23 - Situation B: starboard side (no holes) ............................................................................................................ 37
Figure 24 - Situation C: starboard side ............................................................................................................................... 37
Figure 25 - Situation D: port side ........................................................................................................................................ 38
Figure 26 - Situation E: front port side............................................................................................................................... 38
Figure 27 - Situation F: right backside ............................................................................................................................... 38
Figure 28 - Hazard directions of 'unaware' collisions at APMTR between 2005 and August 2014 (left: % of total
number of SC-SC collisions, right: % of total SC-SC collision costs) ............................................................................ 39
Figure 29 – 180o panorama of forward driving sight of the straddle carrier driver ..................................................... 40
Figure 30 - 180o panorama of forward driving sight of straddle carrier driver with high spreader and container . 40
xii 2014.TEL.7909
Figure 31 - Closed structure of some straddle carriers at APMTR, looking towards starboard (source: APMTR) 41
Figure 32 - Collision situations in scope ............................................................................................................................ 42
Figure 33 - Research method: SA requirements analysis ................................................................................................ 43
Figure 34 - Improved sight with other cabin configuration (source left & middle: Liebherr Container Cranes Ltd.
source right: PSA Antwerp NV) ......................................................................................................................................... 44
Figure 35 - Research method: SA-oriented design ........................................................................................................... 49
Figure 36 - Concept 1: Augmented reality - left: drivers view, right: head mounted display (source: Vuzix)......... 53
Figure 37 - Concept 2: GPS map on display, left: drivers view, right: possible interface ............................................ 53
Figure 38 - Concept 3: Video glasses left: driver view, middle: camera direction, right: HMD (source: Vuzix) .... 54
Figure 39 - Concept 4: Video display - left: driver view (display not intended size), right: camera direction......... 54
Figure 40 - Research approach: SA measurement ............................................................................................................ 57
Figure 41 – Line of reasoning .............................................................................................................................................. 58
Figure 42 - Hazard perception test ..................................................................................................................................... 58
Figure 43 - Video images left and right view, top: control group view, bottom: treatment group view .................. 61
Figure 44 – Left: experimental setup, right: Experimental setup projected on straddle carrier (grey) ..................... 62
Figure 45 - Report structure ................................................................................................................................................ 65
Figure 46 - Validity of experimental setup, left: histogram, right: boxplot ................................................................... 66
Figure 47 - Hazard perception comparability, left: histogram, right: boxplot ............................................................. 67
Figure 48 - Camera view situation 6 ................................................................................................................................... 71
Figure 49 – Boxplots of perceived workload of control and treatment group ............................................................. 74
Figure 50 - Perceived usefulness of the blind spot camera .............................................................................................. 76
Figure 51 - Perceived ease of use of the blind spot camera ............................................................................................. 78
Figure 52 – Situation 1 and 7, left: current driver view, right: camera view ................................................................. 79
Figure 53 – Situation 4, left: current driver view, right: camera view ............................................................................ 79
Figure 54 - Total fault tree of SC-SC collision ................................................................................................................ 100
Figure 55 - Straddle carrier driver aware of other SC: Causes of SC-SC collisions at APMTR 2005 - August 2014
(% collisions per cause type) .............................................................................................................................................. 101
Figure 56 - Straddle carrier driver aware of other SC: Causes of SC-SC collisions at APMTR 2005 - August 2014
(% cost per cause type) ....................................................................................................................................................... 101
Figure 57 – Angular size estimates port-side blind spot seen from driver position .................................................. 111
Figure 58 - Schematic map port-side blind spot ............................................................................................................. 111
Figure 59 - Goal directed task analysis of SC driver (GDTA) ...................................................................................... 113
Figure 60 - GDTA subgoal 2.5: avoid conflicts ............................................................................................................... 114
Figure 61 - Blind spot test camera mounting location ................................................................................................... 117

xiii 2014.TEL.7909
Figure 62 - GoPro's mounted in SC cabin ....................................................................................................................... 118
Figure 63 - Screenshots situation 1 ................................................................................................................................... 119
Figure 64 - Screenshots situation 2 ................................................................................................................................... 120
Figure 65 - Screenshots situation 3 ................................................................................................................................... 121
Figure 66 - Screenshots situation 4 ................................................................................................................................... 122
Figure 67 - Screenshots situation 5 ................................................................................................................................... 123
Figure 68 - Screenshots situation 6 ................................................................................................................................... 124
Figure 69 - Screenshots situation 7 ................................................................................................................................... 125
Figure 70 - Screenshots situation 8 ................................................................................................................................... 126
Figure 71 - NASA-TLX & Validity for control group (in Dutch) ................................................................................ 127
Figure 72 - NASA-TLX & blind spot camera questions treatment group (in Dutch)............................................... 128
Figure 73 - SART questions (in Dutch) ........................................................................................................................... 129

xiv 2014.TEL.7909

xv 2014.TEL.7909
List of tables
Table 1 - Comparison between FTA and FMEA ................................................................................................................ 7
Table 2 - Signal detection outcomes (adapted from (Heeger, 1998)) ............................................................................ 11
Table 3 - Validity figures ...................................................................................................................................................... 66
Table 4 - Hazard perception comparability ....................................................................................................................... 67
Table 5 - Required sample sizes .......................................................................................................................................... 72
Table 6 - T-tests braking response time ............................................................................................................................. 73
Table 7 - Workload NASA-TLX ......................................................................................................................................... 74
Table 8 - Perceived usefulness ............................................................................................................................................. 76
Table 9 - Perceived ease of use ............................................................................................................................................ 77
Table 10 – Worldwide straddle carrier operated ports .................................................................................................... 97
Table 11 - Causes of SC-SC collisions at APMTR (2005 - August 2014) ...................................................................... 99
Table 12 - Escalation factors .............................................................................................................................................. 102
Table 13 - Hazard direction groups of 'driver unaware of other SC' collisions at APMTR between 2005 and
August 2014 ......................................................................................................................................................................... 103

xvi 2014.TEL.7909

xvii 2014.TEL.7909
List of abbreviations
ADAS = Advanced driver assistance systems
AGV = Automated guided vehicle
APMTR = APM Terminals Rotterdam
BLIS = Blind spot information system
FMEA = Failure mode effects analysis
FOV = Field of view
FTA = Fault tree analysis
GDTA = Goal directed task analysis
GPS = Global positioning system
HMD = Head mounted display
HUD = Heads up display
IMU = Inertial measurement unit
LIDAR = Light detection and ranging
MTS = Multi-trailer system
RFID = Radio frequency identification
SA = Situation awareness
SAGAT = Situation awareness global assessment technique
SART = Situation awareness rating technique
SC = Straddle carrier
STS = Ship-to-shore gantry crane
TEU = Twenty-foot equivalent unit

xviii 2014.TEL.7909
1 2014.TEL.7909
1. Introduction: straddle
carrier safety
Since the introduction of the standard intermodal container in the early nineteen-seventies the international
freight trade has started to increase exponentially. Due to the bulk handling of the goods when changing modes,
the transportation of freight became much more efficient leading to lower transportation costs. This resulted in
new possibilities for traders to couple international supply and demand on a large scale.
Due to the growing demand and profitability of the freight transport, vessel size has continued to grow since the
start of the containerization system. Currently, the largest container ships are 400 meters long and have a
capacity of 18.000 TEU. The containers on these ships are divided over 23 rows resulting in a width of 59 meters
(A.P. Moller - Maersk Group). To cope with the ever growing vessels sizes, container terminals are forced to keep
up with their equipment and production capacity in order to process increasing volumes.
However, due to increasing transport volumes -and thus moves- the likelihood of a safety incident is increasing.
Because safety incidents can have a major impact on the health of people and can cause major damage costs,
countermeasures are being taken to cope with hazards in order to work as safe as possible. Man-machine
separation, strict safety procedures and safety awareness programs are examples of countermeasures applied in
the industry today. The balance between productivity and safety is however a difficult matter since increased
safety often means lower productivity and vice versa. After all, when no work is performed no risk occurs and
safety will be 100%. Therefore the challenge is to increase safety and compromise productivity as little as possible.
1.1 Safety
However, not on every container terminal man-machine separation is possible. At least not without fully
changing the terminal system type. This is the case for a manned straddle carrier operated container terminal.
Due to the presence of people in the system –i.e. an inherent risk factor-, total safety is not possible. Therefore
the goal for these container terminals is not to reach 100% safety but to mitigate the risks to an as low as
reasonably practicable level.
2 2014.TEL.7909
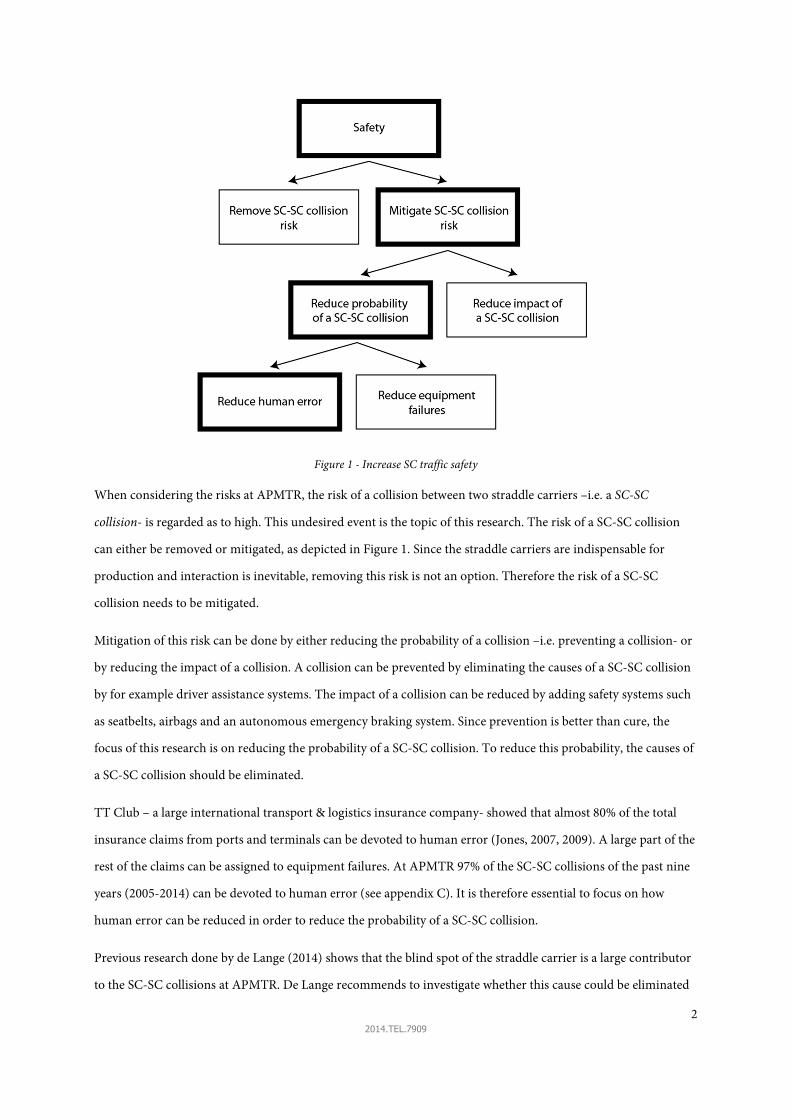
Figure 1 - Increase SC traffic safety
When considering the risks at APMTR, the risk of a collision between two straddle carriers –i.e. a SC-SC
collision- is regarded as to high. This undesired event is the topic of this research. The risk of a SC-SC collision
can either be removed or mitigated, as depicted in Figure 1. Since the straddle carriers are indispensable for
production and interaction is inevitable, removing this risk is not an option. Therefore the risk of a SC-SC
collision needs to be mitigated.
Mitigation of this risk can be done by either reducing the probability of a collision –i.e. preventing a collision- or
by reducing the impact of a collision. A collision can be prevented by eliminating the causes of a SC-SC collision
by for example driver assistance systems. The impact of a collision can be reduced by adding safety systems such
as seatbelts, airbags and an autonomous emergency braking system. Since prevention is better than cure, the
focus of this research is on reducing the probability of a SC-SC collision. To reduce this probability, the causes of
a SC-SC collision should be eliminated.
TT Club – a large international transport & logistics insurance company- showed that almost 80% of the total
insurance claims from ports and terminals can be devoted to human error (Jones, 2007, 2009). A large part of the
rest of the claims can be assigned to equipment failures. At APMTR 97% of the SC-SC collisions of the past nine
years (2005-2014) can be devoted to human error (see appendix C). It is therefore essential to focus on how
human error can be reduced in order to reduce the probability of a SC-SC collision.
Previous research done by de Lange (2014) shows that the blind spot of the straddle carrier is a large contributor
to the SC-SC collisions at APMTR. De Lange recommends to investigate whether this cause could be eliminated
3 2014.TEL.7909
by enhancing sight and overview of the straddle carrier driver which should reduce human error. By increasing
the detectability of a potential collision, the risk of a SC-SC collision will be reduced. Therefore this research will
focus on reducing SC-SC collision risk by focussing on the blind spot of the straddle carrier. The main research
questions is:
How to reduce the probability of a carrier-carrier collision caused by the blind spot?
When no intervention takes place, it can be assumed that human errors caused by the blind spot will result in
SC-SC collisions in the upcoming years. The effects range from only small material damage to injuries or in the
worst case: fatalities (Goossenaerts & de Lie, 2004). Insight and a solution to this problem is highly desirable in
order to provide safe interaction between the straddle carriers.
1.2 Human factor
To eliminate the human errors it is necessary to focus on why these errors are made and what the best solution is
to improve the decision making process. The driver should be supported with his or her tasks to accomplish their
goal in an optimal and safe manner. Jones (2007) emphasizes that the focus of terminal safety should be on the
human operator since human error is the major cause of incidents in terms of numbers and costs. Therefore this
research focusses on the interaction between the driver, the straddle carrier and the driving environment.
The first challenge in this research is to analyse the problem and its underlying causes. Since a SC-SC collision is
a rare event and happening in a short time, finding sufficient and reliable data is difficult.
The second challenge is what solution best fits the human operator. Techniques are now available to inform or
warn the driver, but the question is what information the driver really needs. Many systems are designed from a
technology perspective, neglecting human factors. This is called the ‘Procrustean approach’ where the operator is
adjusted to the technology instead of the other way around: design the system around the operator. The solution
should connect perfectly to the straddle carrier driver’s needs, otherwise the solution will not be accepted. This is
even more the case in a so-called brownfield project where the expert drivers already developed their own driving
habits, resulting in a critical attitude towards change.
4 2014.TEL.7909
1.3 Report
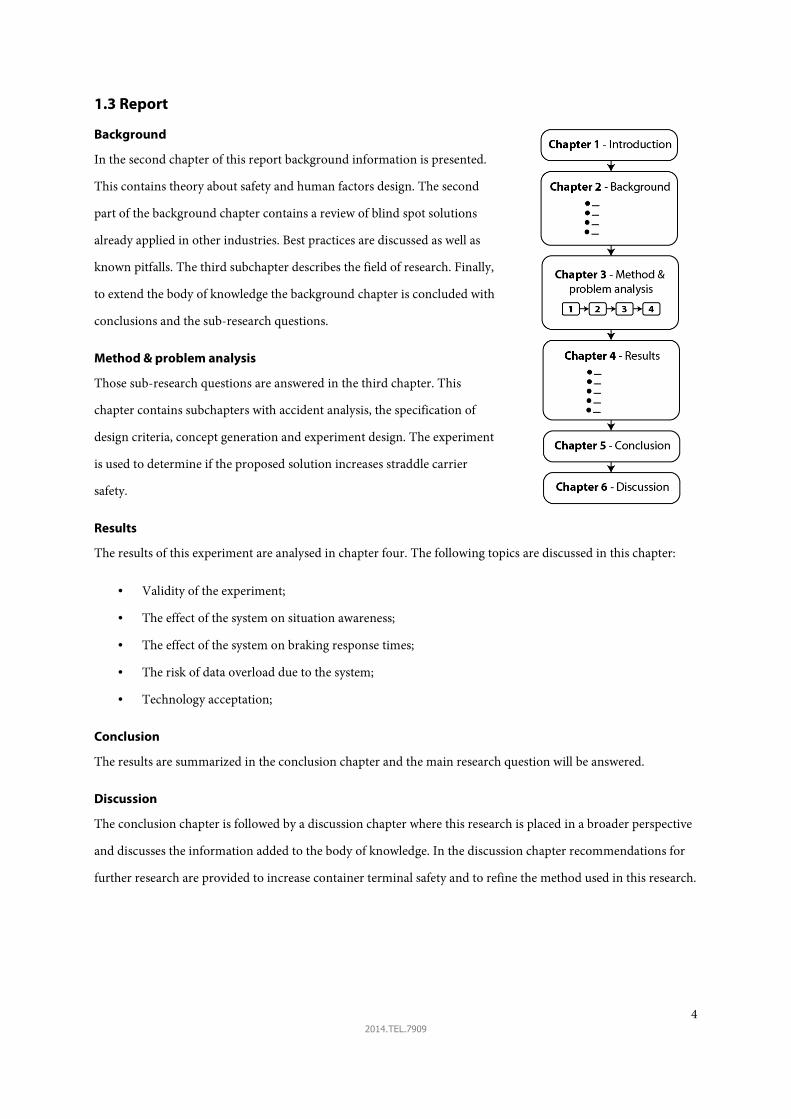
Background
In the second chapter of this report background information is presented.
This contains theory about safety and human factors design. The second
part of the background chapter contains a review of blind spot solutions
already applied in other industries. Best practices are discussed as well as
known pitfalls. The third subchapter describes the field of research. Finally,
to extend the body of knowledge the background chapter is concluded with
conclusions and the sub-research questions.
Method & problem analysis
Those sub-research questions are answered in the third chapter. This
chapter contains subchapters with accident analysis, the specification of
design criteria, concept generation and experiment design. The experiment
is used to determine if the proposed solution increases straddle carrier
safety.
Results
The results of this experiment are analysed in chapter four. The following topics are discussed in this chapter:
• Validity of the experiment;
• The effect of the system on situation awareness;
• The effect of the system on braking response times;
• The risk of data overload due to the system;
• Technology acceptation;
Conclusion
The results are summarized in the conclusion chapter and the main research question will be answered.
Discussion
The conclusion chapter is followed by a discussion chapter where this research is placed in a broader perspective
and discusses the information added to the body of knowledge. In the discussion chapter recommendations for
further research are provided to increase container terminal safety and to refine the method used in this research.

5 2014.TEL.7909
2. Background
This chapter elaborates on the theory and practical background for this
research. The theoretic part is meant to define safety, risk and a collision. It is
also important to have insight in the cognitive processes of a straddle carrier
driver to understand how errors can be prevented and how technology can
enhance their decision making.
The practical part of this chapter discusses the best practices and pitfalls of
blind spot solutions from other industries. It also discusses the field of research
including the container terminal, the straddle carrier and the straddle carrier
driver.
The straddle carrier is a topic that is an underrepresented subject in scientific
research. This underrepresentation is probably due to the limited use of
straddle carriers worldwide. Research regarding the straddle carrier engages in
straddle carrier routing and developing simulations in order to increase
productivity. No scientific research is known regarding straddle carrier safety
and straddle carrier visibility. Therefore frameworks, methods and theories
from other fields such as aviation and civil traffic are used to serve as a framework in this research.
Figure 2 - Report structure

6 2014.TEL.7909
2.1 Theory
2.1.1 Safety
Safety is defined as not exposed to risk. Unsafety is therefore the state of being exposed to risk. Thus to obtain
safety, the main goal is to reduce risk as much as possible. Risk can be reduced by either reducing the impact of
an event or by reducing the probability that a particular event will occur. Therefore risk of a particular event is
defined as:
���� = ������� ∙ ����� (2.1)
The total risk is the summation of all hazardous events a person is being exposed to, where e is an event and n is
the total number of events (Harms-Ringdahl, 2013):
�������� = ∑ �������� � ∙ ����������� (2.2)
One or both factors of an event should be reduced in order to reduce the total risk, also considering that the
intervention does not increase the probability or impact of other events. For example, the impact of a car
accident can be reduced by limiting the car speed or by installing airbags. The probability of a car accident can be
reduced by for example reducing traffic density, installing traffic lights or assist the driver during their driving
task. Reducing the impact or probability is done by adding barriers to the system or by complete removal of the
hazard causing the event. The latter is however not always possible which forces one to make use of barriers. A
barrier is added to the system to block a potential hazard, which can result in a redundant setup of one of the
system parts.
Two types of barriers are known:
• The first type is called a shaping barrier1. Its purpose is to prevent the hazard from causing the event. An
example is the traffic light. This barrier is intended to prevent the collision – the event – to happen.
Barriers of these type are regarded as active safety measures.
• The second type is the hedging barrier2. The function of this barrier is to prevent consecutive hazards of
the event. The seatbelt is an example of a hedging barrier. After the collision has occurred, it prevents
the driver from being injured or when injury cannot be averted it aims to minimize the damage as much
as possible. These barriers are referred as passive safety.
1 Also known as a threat barrier 2 Also known as a consequence barrier

7 2014.TEL.7909
Failure analysis
Before eliminating hazards to reduce risk it is essential to know what the hazards are. For this purpose two
techniques are commonly used in the field of safety research: Fault Tree Analysis (FTA) and Failure Mode Effects
Analysis (FMEA) (Glancey, 2006). The techniques are fundamentally different in their methods of reasoning.
Table 1 - Comparison between FTA and FMEA
Fault Tree
Analysis (FTA)
Failure Mode Effects
Analysis (FMEA)
Deductive Inductive
Top-down Bottom-up
FTA is a deductive method whereas FMEA uses inductive reasoning. FTA is therefore a top-down approach
where FMEA on the other hand is a bottom-up approach. FMEA is for example used during the development
phase of a new product to investigate what the failure modes of each component are.
To select the most suitable failure analysis method, characteristics of the research problem are compared to a
selection aid from Mahar and Wilbur (1990). All the characteristics that are applicable point towards using FTA:
• Safety of operating personnel;
• Clearly defined top event;
• High potential for "human error" contributions.
Therefore FTA will be used to expose the causes of a SC-SC collision.
Fault tree analysis
The fault tree analysis is used to get insight in the underlying causes of an undesired event. It uses a top-down
deductive reasoning strategy to expose all potential hazards. The method uses Boolean logic to connect the
causes and associated consequences.
To start the analysis one should carefully pick the right event to analyse. Is it the collision that should be the main
event, is it the miss of a potential hazard or should the event be a fatality? In the end every consequence is a new
cause for other consequences as well. One should pick the event which needs to be prevented. From that point
causes of every event are added to the diagram.
When the fault tree is constructed, the diagram provides insights in the threats that are able to cause the event.
By adding the existing barriers it becomes clear where barriers are missing or are insufficient. The fault tree is
used to group the SC-SC collisions that occurred at APMTR.
8 2014.TEL.7909
2.1.2 Collision phases
A collision is not an instant event but develops gradually over time which can be characterized by different
collision phases. In each phase different kinds of safety measures can be applied to obtain a layer of defence.
These layers can be grouped in two safety measure groups: active and passive safety. These layers are adapted
from the automotive industry (TNO, 2014):
Active safety
1. Driver assistance
2. Driver warning
3. Collision avoidance
4. Collision mitigation
Collision
Passive safety
5. Injury mitigation
6. Post-crash
Driver assistance is the first layer of defence that can be applied to avoid a collision. Examples of driver assistance
are adaptive cruise control and park assist. The next layer is used to warn a driver when dangerous situations
occur. Measures such as lane departure warning systems, blind spot warning systems and drowsiness detection
systems are used in this phase. Collision avoidance is the last frontier where a collision could be prevented.
Systems as the anti-lock braking system (ABS) and the electronic stability program (ESP) are examples of
systems that can avoid a collision at the very last moment. When a collision is unavoidable, collision mitigation
measures intervene to reduce the impact of a collision. Emergency braking assistance is an example of a collision
mitigation system.
After the crash, passive safety measures are applied to reduce the consequences of the collision. Injury mitigation
measures such as airbags and seatbelts are now widely applied in new vehicles. The eCall system (European
commision) is an example of a post-crash system. The system autonomously calls the emergency services to save
time when help is needed (TNO, 2014).
2.1.3 Human factors
Since the manually operated straddle carrier is a man-machine system, it is important to know the characteristics
of the controlling agent: the driver. In order to achieve desired performance of the system –i.e. correct decisions-,
proper control of this system is essential. In other words, the output of the driver has to fit the machine
characteristics. Therefore a model of the driver is needed in order to predict how the driver would behave given

9 2014.TEL.7909
certain input. Or what the input should be given a desired behaviour. Hence insight in the cognitive processes of
driver is required.
This insight is provided by the situation awareness model of Endsley (1995). Situation awareness (SA) originates
from World War I when SA was recognized as a crucial commodity for crews of military aircrafts (Endsley,
1995). Nowadays SA is applied in many areas of human endeavour: aviation, anaesthesiology, driving, military
command and control, air traffic control, energy distribution, sports, emergency services and process control
(Patrick & Morgan, 2010).
Definition of SA
Simply put, SA is about knowing what is going on around you (Endsley, 2000). When this is not the case, wrong
decisions can be made leading to undesirable system performance. A more comprehensive definition of SA given
by Endsley and used throughout this research is:
“The perception of elements in the environment within a volume of time and space, the
comprehension of their meaning, and the projection of their status in the near future.”
(Endsley, 1988)
Three pillars can be distilled from this definition and they are the three levels of SA:
1. Perception;
2. Comprehension;
3. Projection.
The degree of understanding each element in the driver’s environment determines his level of SA. Building SA
starts with the perception of each element. It is the first step in creating a mental picture of the environment.
However, to really understand their meaning it is essential to comprehend their status in the situation. An
analogy is a high level of reading comprehension as compared to just reading words (Endsley, 1995). Element
attributes are needed to comprehend the situation. To fully understand the situation it is necessary to project the
future status of the element. When all the elements in the driver’s environment are perceived, comprehended
and can be projected in the near future, driver SA is optimal. Optimal SA provides the best possible input for the
decision making process. The contrary is also true. When no element in the environment can be perceived,
comprehension and element projection are impossible and SA cannot exist. The decision making process is then
based on insufficient input leading to a high probability of wrong decisions possibly leading to collisions.
Thus, SA is needed to make the right decisions in a time-critical situation. It is a mental model of a changing
environment which is why the perception of elements has to be constantly executed. SA is therefore a dynamic
construct.
10 2014.TEL.7909
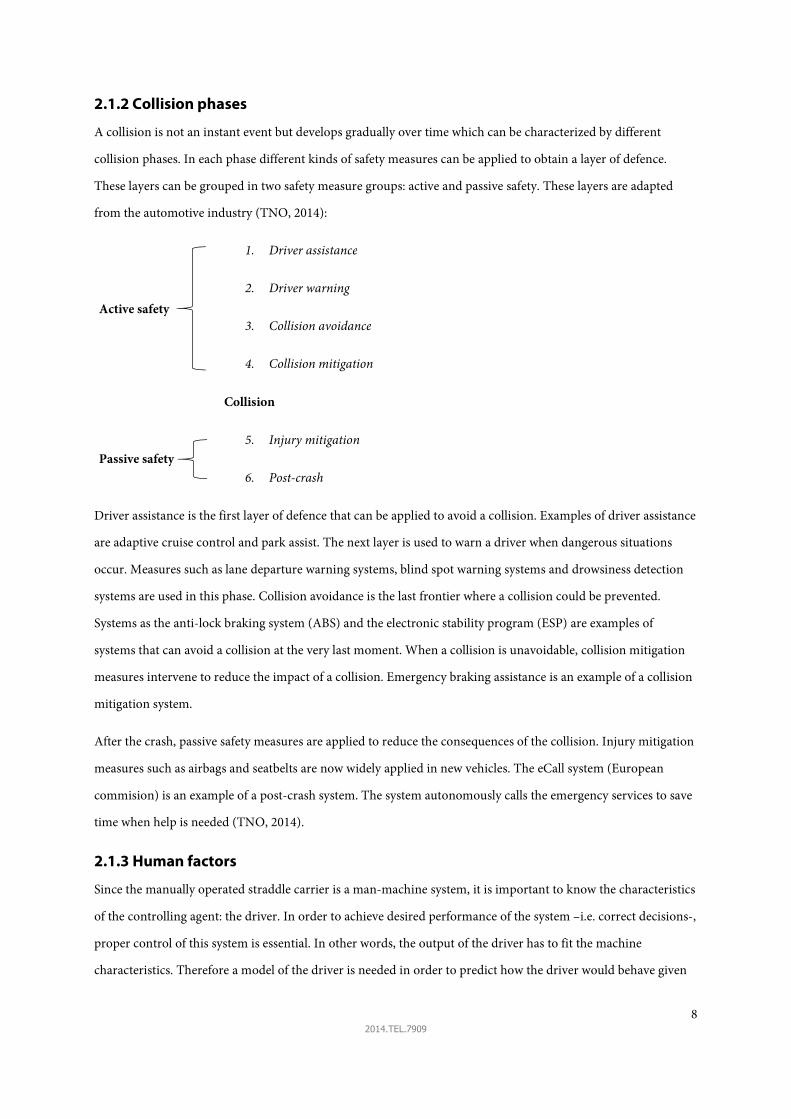
SA Model
Endsley (2000) developed a framework to model the overall decision-making process with SA. This model is
depicted in Figure 3. The correct performance of actions is the goal of the driver. Therefore correct decisions are
needed and for correct decisions a high level of SA is required. This starts with the perception of elements.
Figure 3 - Model of dynamic decision making (adapted from (Endsley, 2000))
In the model additional factors are added that influence SA, decision making and the performance of actions.
Endsley distinguishes two type of factors: task/system factors and individual factors. These factors can either
positively or negatively affect the stages of the overall decision making process. For example high workload
reduces the performance of this process.
Flach (1995) reflects on this model and concludes that SA should be used as a phenomenon description instead
of a causal agent. The latter would result in circular reasoning while the former may reveal important design
guidelines. Therefore lack of SA is not used as a SC-SC collision cause. Instead, SA is used to describe the
cognitive process and to use it as a variable to optimize.
11 2014.TEL.7909
SA Process
Patrick and James (2004) conclude “that any useful understanding of SA has to embrace not only a person’s
knowledge of a situation but also the processes responsible for producing such knowledge, which will depend on
the situation and its context.” This process of obtaining information from the environment is called situation
assessment which leads to the product of SA (Endsley, 2000).
Attention
According to Endsley, Bolté, and Jones (2012) situation assessment is directed by either goals or cues. Searching
for a collision free pathway is for example goal directed situation assessment whereas responding to a ringing
phone is cue directed situation assessment. Attention is the mechanism responsible for switching between
different goals and cues. When this mechanism stops, this is called attentional tunnelling (Endsley et al., 2012).
This could be dangerous when performing a driving task. To perceive elements in the environment, it is
important that these ‘signals’ can be discriminated from the environment.
Signal detection
The signal detection theory states that to perceive any element in the environment the signal-to-noise ratio
should be higher than the criterion in order to detect the signal (Heeger, 1998). A signal is defined as meaningful
information. Noise is defined as unwanted information. Seen from a driver’s perspective all potential hazardous
elements are regarded as signals whereas the rest of the visual and auditory data is regarded as noise. Increasing
the signal/noise ratio leads to a more discriminable signal resulting in faster detection of a potential hazard. The
detection of hazards is called hazard perception. Vlakveld (2014) defines hazard perception as SA for dangerous
situation in the traffic environment which indicates that SA plays an important role in traffic environments.
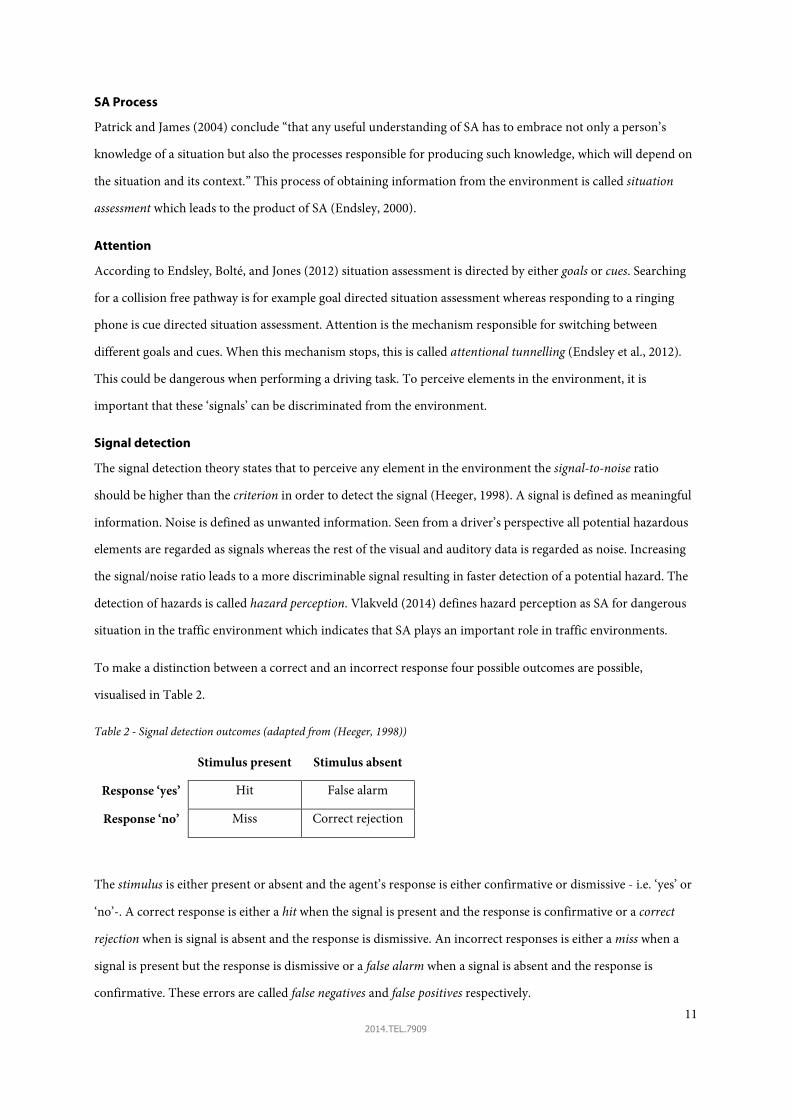
To make a distinction between a correct and an incorrect response four possible outcomes are possible,
visualised in Table 2.
Table 2 - Signal detection outcomes (adapted from (Heeger, 1998))
Stimulus present Stimulus absent
Response ‘yes’ Hit False alarm
Response ‘no’ Miss Correct rejection
The stimulus is either present or absent and the agent’s response is either confirmative or dismissive - i.e. ‘yes’ or
‘no’-. A correct response is either a hit when the signal is present and the response is confirmative or a correct
rejection when is signal is absent and the response is dismissive. An incorrect responses is either a miss when a
signal is present but the response is dismissive or a false alarm when a signal is absent and the response is
confirmative. These errors are called false negatives and false positives respectively.

12 2014.TEL.7909
Signal detection by automated systems
This theory could also be applied to automated detection systems. False alarms caused by automated systems
have a major negative impact on human performance since such alarms are mentally hard to block. Therefore
Endsley et al. (2012); Marshall, Lee, and Austria (2007); Meyer (2001) all emphasize the need to reduce false
alarms as much as possible.
A nuisance alarm is an alarm which is correctly triggered but where the operator is already acquainted with the
event that triggered the alarm. This is also considered as a false alarm. A miss by the automated system could be
costly since operators can rely on the automation system which imposes a high risk.
Automation & automation pitfalls
Technical developments now enable the automation of many steps of human information processing and
decision making. The question rises what functions to automate and to what extent these functions should be
automated (Parasuraman, Sheridan, & Wickens, 2000), because automation could lead to a large information
gap. This gap is the difference between all the available data and the actual necessary information. According to
Endsley et al. (2012) the most effective way to minimize the information gap is adopting a human-centered design
philosophy.
Parasuraman et al. (2000) propose a four-staged human information processing model with ten levels of
automation per stage. These stages match the elements of the SA-model developed by Endsley. The only major
difference is the addition of sensory processing stage before the stage of perception/working memory. Sensory
processing is however the same process as situation assessment, so this stage is covered by the SA-model as well.
The 10-point scale automation levels ranges from full manual operation to full takeover where human
interference is completely ignored.
Parasuraman et al. (2000) point out that “examination of human performance issues is especially important
because modern technical capabilities now force system designers to consider some hard choices regarding what
to automate and to what extent, given that there is little that cannot be automated” (p. 287). These human
performance issues are also known as automation pitfalls (de Winter, 2012) and have to be considered when
automation could be implemented.
Technology acceptation
To make the technology work as intended it is essential for any new technology to get adopted by its users. Davis,
Bagozzi, and Warshaw (1989) propose two technology acceptance models where the technology acceptance model
is especially designed for information systems.

13 2014.TEL.7909
Figure 4 - Technology acceptance model (adapted from Davis et al. (1989))
Two factors emerge from the model that influence the behavioural intention to use which is an indication of the
actual system use. These factors are perceived usefulness and perceived ease of use. Davis et al. (1989) conclude that
it is believed by many designers that increasing usability by improving user interfaces is the key to success.
However their data indicates that the usefulness is even more important than the ease of use.
2.1.4 Conclusion
Safety is obtained when risks are minimized or eliminated. This can either be done by reducing the probability of
an incident or by reducing the impact of an incident. The risks and countermeasures can be mapped by a fault
tree diagram.
A collision can be divided in different collision phases. The approach is to keep the driver away from the later
phases of the collision. Therefore the focus should be on the first phase ‘driver assistance’ to prevent a collision as
early as possible.
The SA model of Endsley provides insight in the cognitive processes of a driver. This model is used to describe
the straddle carrier driver and to design an appropriate solution for the blind spot problem. The solution should
enable continuous perception of the elements in the situation and the design process should take the automation
pitfalls into account. Finally the technology acceptation can be measured by the technology acceptance model.
14 2014.TEL.7909
2.2 Blind spots solutions in other industries Since no scientific research is known about blind spots regarding straddle carriers or container terminal
equipment, a literature research has been conducted in the fields of:
• Heavy duty equipment;
• Automotive;
• Trucks;
• Aviation.
2.2.1 Heavy duty equipment
Literature shows that the blind spot is a major concern in the mining and road construction industry. The drivers
experience a blind spot situated behind the back of the truck forcing the drivers to guess whether it is safe to
reverse or not. To cope with this problem several techniques and systems could be applied. These technologies
include RFID, radar, video cameras and GPS (T. Ruff, 2000a, 2000b, 2003a). The challenge in these industries is
however to cope with the harsh operating conditions. Due to these conditions camera lenses get dirty and high
false alarm rates occur (T. Ruff, 2001).
GPS
T. Ruff and Holden (2003) propose a GPS-based approach to overcome these problems. Especially the low false
alarm rate is seen as a benefit for using GPS technology for proximity warnings at mining facilities. Due to the
occasional disappearance of the GPS signal, they conclude that the GPS system should be combined with other
sensors to provide the redundancy needed for a highly reliable system.
Radar, RFID and cameras
Radar is one of the techniques that is suited as this ‘second sensor’. T. Ruff (2006) showed that the radar system
introduces a high false alarm rate which would negatively affect the driver’s performance. RFID technology could
be used to overcome this high false alarm rate. The electronic tags are attached to every moving object in the
mine and the antenna is placed at the back of the dump truck. An alarm is triggered when one of the tags is in
too close proximity of the dump truck. A disadvantage of the RFID system is that the system does not provide
the location of the object causing the alarm. So for both the radar as the RFID system additional information is
needed. Alarms need to be verified with the radar system and the exact locations are missing with the RFID
system. This is the reason why the manufacturers of both systems recommend using cameras in combination
with their systems (T. Ruff, 2003b).
15 2014.TEL.7909
2.2.2 Automotive
Such systems are in a further state of development in the automotive industry. This industry uses cutting edge
technologies to ensure a safe trip. These systems are known as advanced driver assistance systems (ADAS) or
collision warning systems. The systems that are currently available for consumers are:
• Cruise control;
• Adaptive cruise control;
• Pre-crash systems;
• Blind spot information systems;
• Lane departure warning system;
• Autonomous parking assistance systems;
• Drowsiness detection system (Shaout, Colella, & Awad, 2011).
Cruise control and adaptive cruise control are used to automate the throttle of the car. This increases driver
comfort. Pre-crash systems are used to detect and warn the driver for imminent crashes and are also known as
forward collision avoidance systems. Nowadays radar, laser and camera systems are used to detect obstacles in the
roadway of the car, but researchers are seeking for new ways of detecting other vehicles such as the cooperative
collision warning system based on GPS and wireless communication (Sengupta et al., 2007). According to Shaout
et al. (2011) the car manufactures all have a different implementation of their pre-crash system with
combinations of driver warning, automatic braking and seatbelt pretensioning. The lane departure warning
system warns the driver when an unintended lane change is detected. When the car is leaving the lane and the
turn signal is not activated a warning signal is provided. Shaout et al. (2011) mention that lane departure is
detected with cameras and feedback is provided through a combination of visual, audible and tactile senses.
According to the authors the autonomous parking assistance system uses radar technology to detect obstacles.
The drowsiness detection system is based on camera images taken from the eyes of the driver or is based on
vehicle sensor data which provides a visual and audible alarm when drowsiness is detected (Shaout et al., 2011).
16 2014.TEL.7909
ADAS pitfalls
Van Gijssel (2013) concludes that ADAS are still largely feature-based and do not consider the human
performance in an integrated way. He therefore proposes to adopt a human-centered design approach. The
author acknowledges the potential beneficial effects of ADAS regarding traffic safety but also points out to the
pitfalls in ADAS development:
• Habituation to automation;
• The multitude of symbol-based ADAS information;
• High glance direction variation due to different display locations;
• ADAS warnings are often intrusive;
• Reduced driver control and sovereignty due to task automation.
These pitfalls have a negative impact on the driver performance and are considered challenges for future design
and development of advanced driver assistance systems (Van Gijssel, 2013). Seatbelts for example tend to
provoke higher speeds since driver feel more safe with a seatbelt. These negative side effects thus have to be
assessed.
Blind spot information systems
The blind spot information was first introduced by the Volvo Car Corporation and is based on radar technology
(Shaout et al., 2011). The system provides a visual warning when another vehicle is in the vicinity of the car
(Figure 5). However it provides no information about the exact location of the other vehicle. The driver only
knows it is somewhere in the adjacent lane hindering the driver of a good understanding of the situation.
Matsubara, Itoh, and Inagaki (2012) propose to display camera images directly to the driver instead of providing
filtered information about the presence of another vehicle –i.e. the ‘lamp system’-. They concluded that both
systems reduce the number of collisions compared to no support system. However the system of camera images
resulted in a lower workload of drivers compared to the blind spot information system made by Volvo. The
reduction in workload was explained by the easy and quick situation assessment which enabled the drivers to
operate their cars in a more stable way. Secondly they concluded that both systems improved safety, but
decreased driver’s direct surveillance. This could be dangerous when the lamp system fails to detect the other
vehicle. Therefore Matsubara et al. (2012) conclude that decreased driver’s direct surveillance may be less
dangerous with the camera system than with the lamp system.
17 2014.TEL.7909
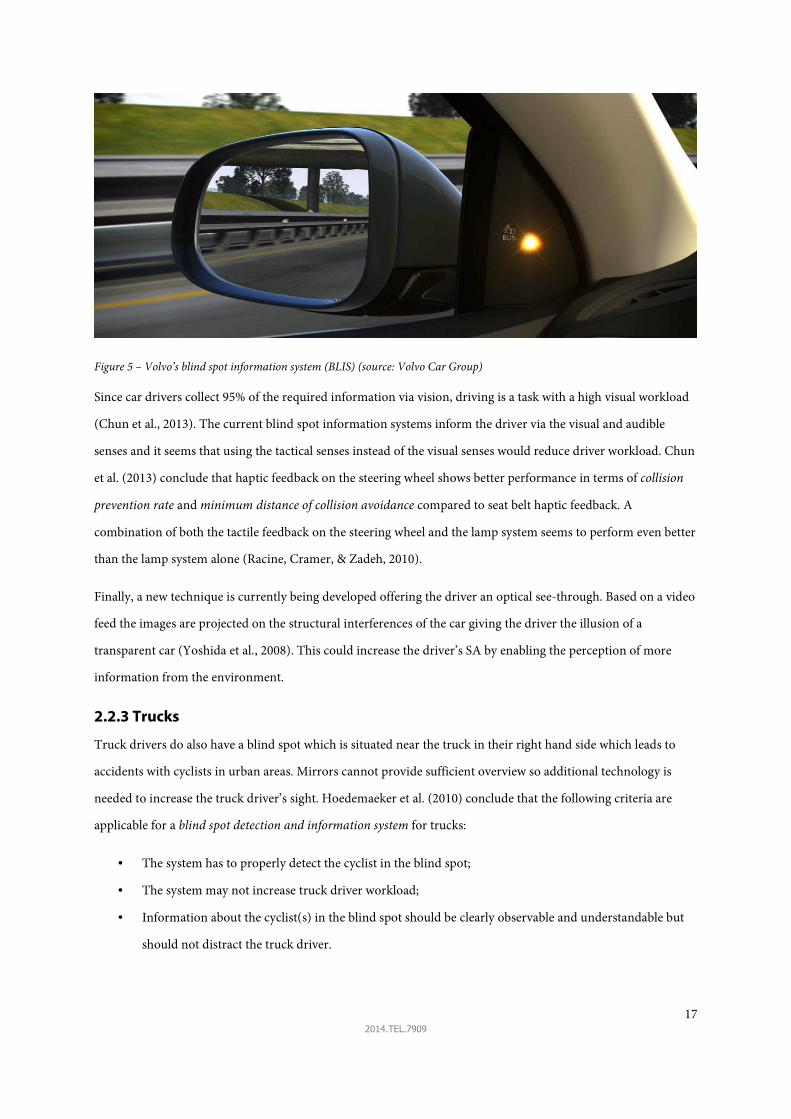
Figure 5 – Volvo’s blind spot information system (BLIS) (source: Volvo Car Group)
Since car drivers collect 95% of the required information via vision, driving is a task with a high visual workload
(Chun et al., 2013). The current blind spot information systems inform the driver via the visual and audible
senses and it seems that using the tactical senses instead of the visual senses would reduce driver workload. Chun
et al. (2013) conclude that haptic feedback on the steering wheel shows better performance in terms of collision
prevention rate and minimum distance of collision avoidance compared to seat belt haptic feedback. A
combination of both the tactile feedback on the steering wheel and the lamp system seems to perform even better
than the lamp system alone (Racine, Cramer, & Zadeh, 2010).
Finally, a new technique is currently being developed offering the driver an optical see-through. Based on a video
feed the images are projected on the structural interferences of the car giving the driver the illusion of a
transparent car (Yoshida et al., 2008). This could increase the driver’s SA by enabling the perception of more
information from the environment.
2.2.3 Trucks
Truck drivers do also have a blind spot which is situated near the truck in their right hand side which leads to
accidents with cyclists in urban areas. Mirrors cannot provide sufficient overview so additional technology is
needed to increase the truck driver’s sight. Hoedemaeker et al. (2010) conclude that the following criteria are
applicable for a blind spot detection and information system for trucks:
• The system has to properly detect the cyclist in the blind spot;
• The system may not increase truck driver workload;
• Information about the cyclist(s) in the blind spot should be clearly observable and understandable but
should not distract the truck driver.
18 2014.TEL.7909
Besides informing the truck driver the system could also warn the truck driver or intervene by applying the
brakes. The authors call such a system a supportive blind spot detection and information system. Additional
criteria for such a system are:
• The system should make a proper distinction between critical and non-critical events;
• A warning system should warn in time to offer the truck driver enough time to react;
• An intervening system only intervenes in highly time-critical situations and brings the truck to a
complete standstill;
• The warnings should differ substantially from the informing signals.
Wilschut, Meijering, Merkus, IJsselsteijn, and Ham (2010) add that such systems should not make the truck
driver feel limited or undervalued. Moreover the authors conclude that a blind spot detection system should both
inform and warn the truck driver for the same reason as seen with the heavy duty equipment: alarm verification
due to false alarms. Hoedemaeker et al. (2010) finally conclude that no literature or research is known that
objectively demonstrates the beneficial effect of warning systems on truck and cyclist safety.
However, figures of blind spot causes accidents in the Netherlands show a negative correlation between an
installed blind spot camera and the number of accidents (Kampen & Schoon, 1999). The authors estimate the
efficiency in terms of reduced accidents of a camera compared to direct view at 60%.
Recent developments in technology for reducing blind spots on trucks are the Zigbee method proposed by De
Lausnay et al. (2011), the use of catadioptric cameras proposed by Ehlgen, Pajdla, and Ammon (2008) and the
use of stereo cameras proposed by Broggi, Medici, and Porta (2007). The Zigbee method uses the Zigbee protocol
to communicate with the surrounding mobile phones of the cyclists. One of the advantages of this system is the
ability for the truck driver to inform the cyclist when he detects the cyclist (De Lausnay et al., 2011). The
catadioptric camera system provides a top down overview of the truck. The system creates a satellite photo-like
image by combining several video feeds from the cameras mounted on the corners of the truck. This provides the
truck driver with an overview of the total surroundings of the truck. The stereo camera system uses two camera
to detect obstacles in front of the truck. When an object is detected an audible alarm is sounded warning the
driver of an obstacle.
2.2.4 Aviation
Although a large part of the SA literature is based on aviation practices, blind spots are uncommon in the
aviation industry. However, the helmet concept of the Joint Strike Fighter (Lockheed Martin) could provide new
insights to cope with blind spots in other industries. The system uses six cameras to provide the pilot with
augmented images in his visor. This enables the pilot to ‘see-through’ his aircraft.

19 2014.TEL.7909
2.2.5 Conclusion
A camera system seems to be an indispensable tool for blind spot problems. Although an alarm system has
theoretical advantages, no scientific proof has yet been provided that these alarm systems indeed increase
collision avoidance performance. For the location determination a majority of technologies is available but the
most robust option seems to be the blind spot camera.

20 2014.TEL.7909
2.3 Field of research This chapter introduces the field of research. It discusses:
• Straddle carrier container terminals in general;
• The operational situation at APMTR;
• The straddle carrier design;
• The straddle carrier driver.
The goal of this chapter is to gain insight in the elements operating in this system.
2.3.1 Straddle carrier container terminals
One of the possible container terminal system designs is the straddle carrier system. The horizontal and vertical
transport of containers is executed by straddle carriers (SC). These mobile cranes can move and hoist a container
up to four containers high. More on the straddle carrier later in this chapter.
The main advantage of a straddle carrier system is the high flexibility of the total system. For example, the
terminal layout can be simply altered compared to other systems such as the rail-mounted gantry crane system
and the deployment of operational SC’s can be precisely adapted to the day-to-day demand of the container
terminal. The use of SC’s can be combined with other container terminal equipment such as automated guided
vehicles (AGV), gantry cranes, empty handlers and multi-trailer systems (MTS). When no other equipment is
used for the container handling except for the SC and the ship-to-shore gantry crane (STS), the system is called a
pure SC system (Böse, 2011). This is depicted in Figure 6.
Figure 6 - Pure SC-system (adapted from (Böse, 2011))
In order to get an idea about the worldwide application of straddle carriers, a location analysis is provided. With
the help of the world port rankings (American Association of Port Authorities (AAPA), 2012) and satellite
images, it shows that at least 58 ports are using straddle carriers in their operation. This is visualised in the map
in Figure 7. Furthermore the analysis shows that at least 3000 straddle carriers are operational worldwide, with
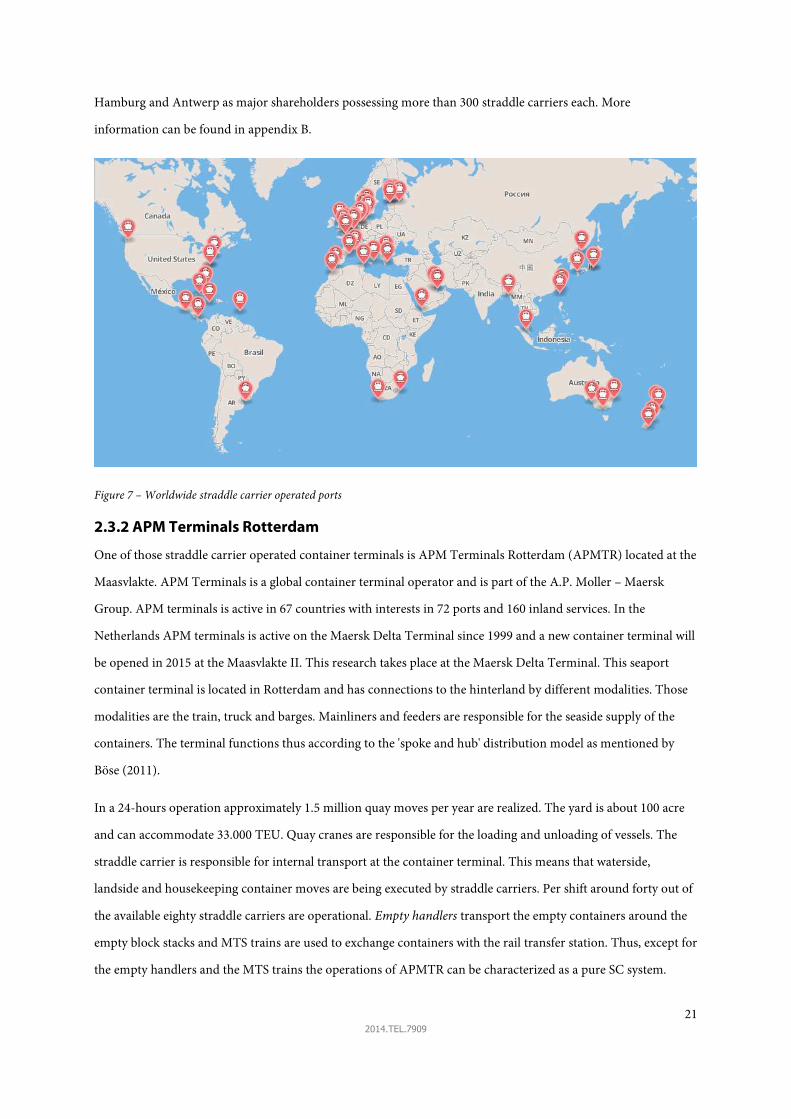
21 2014.TEL.7909
Hamburg and Antwerp as major shareholders possessing more than 300 straddle carriers each. More
information can be found in appendix B.
Figure 7 – Worldwide straddle carrier operated ports
2.3.2 APM Terminals Rotterdam
One of those straddle carrier operated container terminals is APM Terminals Rotterdam (APMTR) located at the
Maasvlakte. APM Terminals is a global container terminal operator and is part of the A.P. Moller – Maersk
Group. APM terminals is active in 67 countries with interests in 72 ports and 160 inland services. In the
Netherlands APM terminals is active on the Maersk Delta Terminal since 1999 and a new container terminal will
be opened in 2015 at the Maasvlakte II. This research takes place at the Maersk Delta Terminal. This seaport
container terminal is located in Rotterdam and has connections to the hinterland by different modalities. Those
modalities are the train, truck and barges. Mainliners and feeders are responsible for the seaside supply of the
containers. The terminal functions thus according to the 'spoke and hub' distribution model as mentioned by
Böse (2011).
In a 24-hours operation approximately 1.5 million quay moves per year are realized. The yard is about 100 acre
and can accommodate 33.000 TEU. Quay cranes are responsible for the loading and unloading of vessels. The
straddle carrier is responsible for internal transport at the container terminal. This means that waterside,
landside and housekeeping container moves are being executed by straddle carriers. Per shift around forty out of
the available eighty straddle carriers are operational. Empty handlers transport the empty containers around the
empty block stacks and MTS trains are used to exchange containers with the rail transfer station. Thus, except for
the empty handlers and the MTS trains the operations of APMTR can be characterized as a pure SC system.

22 2014.TEL.7909
Terminal layout
The terminal of APMTR is divided in 6 different section types, as depicted in Figure 8:
� Quay
� Empty containers
� Container stack lanes & streets
� Reefer area
� Truck groups
� MTS area
Figure 8 - Terminal layout APMTR (background image: Google Maps)
Along the 1600 meters wide berth 13 post-Panamax cranes and 1 barge crane are available for loading and
unloading of the container vessels. Empty containers are stored in a block stack adjacent to the quay and reefer
containers that need power supply for powering their cooling units are placed at the reefer slots. Trucks are
handled at the 3 truck groups situated at the landside of the terminal. Each truck group consists of 12-13 truck
lanes enabling the terminal to handle 38 trucks simultaneously. At the MTS area MTS trailers are parked for the
exchange of containers with the rail transfer station of Europe Container Terminals.
The container stacks for the so called dry containers are divided over several blocks throughout the yard. A
container position is indicated by:
• Lane number, ranging from lane 4 to 404 counted from east to west;
• Block, ranging from block A to C where block A is adjacent to the quay and block C is adjacent to the
landside;
• Position, ranging from 1 to 21 counted form north to south within a block;
• Container height, ranging from A to C where position A is at ground level and position C is the top
position.

23 2014.TEL.7909
For example, a container in lane 245, block B, position 10 at ground level is indicated as: 245B10A. A forty foot
container occupying two positions at position 10 and 11 is indicated as: 245B10/11A.
Traffic
The traffic at the terminal mainly consists of straddle carrier traffic. In the operational area no other traffic is
allowed other than the straddle carriers. An exception is the empty handler at the empty container area and
occasionally some other vehicles types. This is for example the case when maintenance vehicles have to be within
the yard. When this is necessary two straddle carriers escort this vehicle to create a safe passageway.
At the waterside three straddle carriers are assigned per quay crane handling a mainliner. For feeder and barge
vessels two straddle carriers per crane are assigned. These straddle carriers are responsible for supplying the
crane with containers in case the crane is loading a vessel and for removal of the containers in case the crane is
discharging a vessel. At the landside straddle carriers are responsible for loading and discharging trucks as well as
housekeeping. Due to the repetitious characteristics of those moves, the traffic at the container terminal is much
more predictable than civil road traffic.
The straddle carriers must adhere to the Dutch traffic regulations. Special regulations are:
• Traffic driving on the quay has priority;
• Traffic driving in the straits perpendicular to the quay have priority over traffic in the straits parallel to
the quay;
• Traffic in the straits have priority over traffic from the container stack lanes;
• Quay crane needs to be entered from his starboard side with backwards driving;
• Container doors need to be directed towards the quay when placing a container in the stack.
2.3.3 Straddle carrier
The straddle carrier is the object of this research. The straddle carrier is a mobile crane which can hoist and move
a container. It can lift a container up to four containers high. This is called ‘1-over-3-high’. Due to the
combination of lifting and driving functions plus the fact that it is operated by a human, the straddle carrier
belongs to the most flexible terminal equipment currently available.
History
The straddle carrier has its origins in the pulp and lumber industry. The machine was used to transport lumber
and buckets of pulp on the factory terrains. When Keith Tantlinger –the inventor of the twist locks and the
container spreader-, approached a material handling company to install the spreader in a straddle carrier, the
container straddle carrier was born. Since then the design of the straddle carrier has been continuously altered to
the needs of both the drivers and terminals. These adjustments includes extending the height of the straddle

24 2014.TEL.7909
carrier, creating holes in the legs of the carrier and adding tools such as a pointing stick to increase driving
comfort (C. Bodbijl, personal communication, September 2, 2014). This process shows that the straddle carrier is
designed with a technology-centered design approach.
Figure 9 - Ancestor of the modern container straddle carrier (source: Kalmar )
General layout
The straddle carrier is able to lift one forty feet container or two twenty feet containers at the same time. The
straddle carriers used at APMTR can lift a container up to four containers high in order to move the container
over the stack. These straddle carriers are 15 meters high where the driver is located at a height of around 12
meters.

25 2014.TEL.7909
Figure 10 - A Noell straddle carrier (source: APMTR)
The straddle carrier is able to drive in both directions which enables the carrier to reverse immediately without
having to make a turn. The reverse mode has no technical limitations, so in reverse the carrier is responding in
the same way as driving forward. The driving directions and side names are indicated in Figure 11.
Figure 11 – Top view straddle carrier driving directions and side indications
Caution is needed since this definition can be confusing. When the straddle carrier is driving with the cabin in
the same direction as the driving direction – i.e. cabin in front-, it is driving backwards.
Cabin
The cabin is positioned at the top of the straddle carrier. This to ensure a clear overview for the straddle carrier
driver, even when the carrier is operating in the container stack. Some carriers have been equipped with side-

26 2014.TEL.7909
mounted cabins, but due to safety and visibility considerations most cabins are now installed at the back of the
straddle carrier. This is the case for all the straddle carriers at APMTR. At the back the cabins are mounted on
one of the two outside positions, either on the port or starboard side of the straddle carrier. This way the driver
can look past the container when driving forward. At APMTR the cabins are mounted at starboard side.
The driver of the straddle carrier is positioned sideways. In this way the driver is able to switch easily between
driving direction without having to adjust his seat (Figure 12). It is possible to turn the seat parallel to the driving
direction, but one of the straddle carriers pointed out that this orientation is inconvenient and quite frightening
to drive.
Figure 12 – Driver position and looking directions
Cabin displays and controls
The cabin is equipped with several controls and displays in order to let the driver control the straddle carrier.
Since these systems influence the driver’s situation awareness it is necessary to look into the magnitude of these
systems installed in the cabin. Besides the seat, steering wheel and pedals the following control equipment is
present in the Noell3 cabins of APMTR (Noell Mobile Systems GmbH, 2008) (Figure 13):
• Lift height indicator (1);
• Straddle carrier status screen (2);
• Emergency button (3);
• Twist lock indicator (4);
• Spreader control stick (5);
• Control panel (6);
• Switch cabinet (7);
• Radio (not displayed);
3 Straddle carrier made by Noell Mobile Systems GmbH. The older straddle carriers owned by APMTR are made
by Nelcon B.V.

27 2014.TEL.7909
• Vehicle mounted computer (not displayed);
• Mirrors.
The lift height indicator shows the current height of the spreader. However due to a combination of mistrust and
unreliable technology this indication caused many accidents. Hence this indicator was switched off. The status
screen provides the driver with necessary information regarding the status of the straddle carrier. When driving
the screen projects the current driving speed and stability indicator. When the stability of the carrier is at risk an
audible alarm is activated. However the straddle carrier drivers indicate this as a nuisance alarm since it is too
loud and provides the warning too early. The twist lock indicator shows a red light when all the twist locks on the
spreader are locked and a green light when the twist locks are unlocked. In this way the driver is informed
whether the container is correctly attached to the straddle carrier. The spreader control stick is used to move the
spreader. The spreader is lowered by pushing the stick away and the spreader is hoisted by pulling the stick
towards the driver. The buttons on the stick provide the trimming functions for shifting the spreader, a button to
change driving direction and a button to activate the microphone of the communication radio. The control panel
is used to switch settings such as changing the spreader length, engine speed and provides the light switches. The
switch cabinet is used for the other settings such as the air conditioning and beacons.
Figure 13 - Cabin controls (adapted from Noell Mobile Systems GmbH (2008))
The radio is used to communicate with the other crane gang members and to receive general messages from the
control tower. The vehicle mounted computer4 provides the straddle carrier driver a list with available container
moves. From this list the driver can select his preferred move. This move is then removed from the queue
4 Made by Psion Teklogix Inc., now part of Motorola Solutions, Inc.

28 2014.TEL.7909
preventing other drivers to select the same container. When a move is completed the driver confirms the move
within the board computer. The computer is placed on the left side of the steering wheel. Finally, the cabin is
equipped with mirrors to enhance the driver’s view behind his back.
2.3.4 Straddle carrier driver
The straddle carrier driver is the subject of this research. The driver is responsible for driving the straddle carrier
safely over the yard and transporting containers from A to B. The straddle carrier driver has several differences
with an average car driver. Since the straddle carrier driver is a professional driver he makes more driving hours
leading to more driving experience than an average car driver would obtain. The straddle carrier drivers are also
operating in an 8-hours shift which leads to longer driving times than the average car driver (van Beuningen,
2013). Therefore caution is needed when comparing literature based on average car drivers. Based on these
driving hours the straddle carrier driver is more or less comparable with a truck driver. The differences with a
truck driver are however the traffic situations and the different vehicles.
APM Terminals Rotterdam
At APMTR the straddle carrier drivers are divided over 5 different teams alternating in a non-stop schedule. The
team can be designated to the day, evening or night shift and the shift is divided in two assignments: before and
after the break. One team consists of about 72 people. This includes the crane operators, deck hands and crane
coordinators. At APMTR it is possible for one person to have a license for more than one of these jobs, making
the resource planning more flexible. Therefore some straddle carrier drivers are alternating between those
positions.
The straddle carrier drivers are assigned to either the landside or waterside pool. When active in the waterside
pool the straddle carrier driver is assigned to a specific crane in a crane gang. One crane gang consists of a crane
operator, one deck hand, one crane operator and 2 straddle carriers responsible for supplying and discharging
the crane with containers. A third flexible straddle carrier is added to the crane gang which is able to absorb
production peaks at the other cranes.
The majority of the straddle carrier driver are men between 18 and 65 years old. One part of the carrier drivers
are employed by APMTR whether the other part of the straddle carriers is hired at other companies. The amount
of extra people per shift ranges from 0-20 persons and are mainly deployed on the straddle carriers.
Field experts consider the traffic in the yard of APMTR is as busy. This could be one of the underlying causes for
the accidents. The major difference with civil traffic is that the traffic is highly predictable. Straddle carriers
drivers are aware of the directions from where another straddle carrier could emerge. Within civil traffic a hazard
could suddenly pop up. This is not the case at APMTR due to the repetitive character of the traffic.

29 2014.TEL.7909
2.4 Conclusion: research questions Blind spots caused by structural interference seems to be one of the major causes of SC-SC collisions. Literature
from other fields suggest a variety of possible solutions. It is however not yet known if these technologies are also
applicable to a straddle carrier system.
The goal of this research is to decrease risk by either reducing the probability or the impact of a collision. Since
collision mitigation is out of scope, the focus is on reducing the probability of a straddle carrier collision. The
solution should be in the collision phase of ‘driver assistance’. The SA model of Endsley should be used to model
the straddle carrier driver. Situation awareness theory is used to investigate what information the straddle carrier
drivers actually need to make the correct decisions which would prevent a collision. By applying human factors
knowledge on a straddle carrier driver an ideal solution for the blind spot problem of straddle carriers should be
found. The solution should enable the driver to continuously perceive the elements in his environment. With this
literature review the main research questions can be adjusted and sub research questions can be formulated.
How to increase situation awareness of a straddle carrier driver to reduce the probability of a
carrier-carrier collision caused by the blind spot?
This main research question will be divided in sub-research questions to obtain a step by step solution.
2.4.1 Sub research questions
The sub research questions that have to be answered in order to answer the main question are:
1. In what situations do the SC-SC collisions caused by the blind spot occur?
2. What are the design criteria?
3. What designs are possible and what is the best design?
4. Does the proposed solution increase SA?
When these questions are answered the proposed design can be evaluated whether the design will reduce the
probability of a SC-SC collision.
2.4.2 Contribution to theory and practice
Theory
Research regarding blind spots is mainly executed in the fields of heavy duty equipment and the automotive
industry. No scientific research regarding blind spots or impaired vision of straddle carrier drivers is known to
the author. This research will indicate the blind spots of a straddle carrier and will add knowledge about the
information needs of a straddle carrier driver. Moreover, Salmon and Stanton (2013) remark that SA-driven
30 2014.TEL.7909
design research on safety and performance is sparse. Where other SA-related research comes in after the design
stage, this research will be one of the few bridges between SA theory and a real world intervention.
Finally the research will add knowledge about the applicability of blind spot systems from other industries to the
container terminal industry. Or more specifically to the straddle carrier. One knows how to prevent collisions
with AGVs (Ho, 2000; Möhring, Köhler, Gawrilow, & Stenzel, 2005; Reveliotis, 2000) and automated straddle
carriers (Durrant-Whyte, Pagac, Rogers, Stevens, & Nelmes, 2007) but collisions with man-operated terminal
equipment is still an unsolved problem.
Practice
This research will offer insight in the hazards and situations causing blind spot collisions. It could offer a solution
to the problems resulting from blind spot of a straddle carrier driver which in turn reduces the risk of a SC-SC
collision. The reduced risk will in turn express in a reduced number of SC-SC collision caused by the blind spot
which could save lives in the future.

31 2014.TEL.7909
3. Method & problem analysis
Figure 14 – Detail of report structure
The research is divided in four sub-research questions. The SA-oriented design method developed by Endsley et
al. (2012) will be used to obtain a user-centered solution for the blind spot problem of straddle carriers.
Figure 15 – Research method
The SA-oriented design method is a three-phase methodology for optimizing driver’s SA. The method starts with
a SA requirements analysis, followed by SA-oriented design. The final step of the method is SA measurement to
verify if the design increases SA. The original method requires global SA analysis. This means that the total
information needs of a straddle carrier driver needs to be mapped. Since only the SC-SC collisions are in scope,
the focus should be on the information needs for these situations. Therefore the first step is to gain insight in the
situations when SC-SC collisions caused by the blind spot occur. This will provide clues for the second step to
improve driver’s SA. The accident analysis step is added to the research method.

32 2014.TEL.7909
3.1 Accident analysis
Figure 16 - Accident analysis
The accident analysis phase answers the following sub-question:
In what situations do the SC-SC collisions caused by the blind spot occur?
Since the straddle carrier drivers are used to deal with the blind spots of a straddle carrier, it is necessary to
understand why the blind spots occasionally lead to a collision. By using accident reports of APMTR of the past
10 years the situations are reconstructed to discover other escalation factors leading to a straddle carrier collision.
This case study is also used to group the collisions and to identify the location of the major contributing blind
spot of a straddle carrier with the help of a fault tree diagram.
3.1.1 Fact gathering: figures
The accident reports used for this research are the reports of APMTR over the period between 2005 and August
2014. The SC-SC accidents reports were filtered from all the available damage reports. However some of these
accident reports were missing or incomplete. These reports are included in the total number of SC-SC collisions
but are excluded from the situation reconstruction since this cannot be done with certainty. It is assumed that
none of the reported collisions are caused on purpose.
Between 2005 and August 2014 105 SC-SC collisions were reported which is about 10-11 collisions on average
per year. The first subdivision is made between collisions where the straddle carrier driver was either unaware or
aware of the other straddle carrier at the moment the collision was still avoidable. This classification is made
because all the cases where a driver was unaware of the other carrier, the collision could be caused by the blind
spot. In the case of the driver being aware of the other carrier the blind spot could not have caused the collision.
This is the starting point of the fault tree (Figure 17).

33 2014.TEL.7909
Figure 17 - Fault tree top-event
The top-event is the SC-SC collision and is caused by the straddle carrier driver braking too late and a second
carrier in the pathway of the straddle carrier. The abundance or too late execution of a braking action –i.e. a
human error- is caused by the driver being unaware of the other straddle carrier or the driver being aware of the
other straddle carrier but being unaware of the risk. 44 collisions occurred by a driver who was unaware of the
other straddle carrier and 57 collisions occurred by a driver who was aware of the other straddle carrier (Figure
18). Those 44 ‘unaware’ collisions (42%) were responsible for 70% of the material and labour costs.
Figure 18 - Causes of SC-SC collisions at APMTR 2005 - August 2014 (left: number of collisions, right: cost)
The next step is to determine the causes of why the driver was unaware of the other straddle carrier. Since a
collision is always a combination of multiple factors the most prominent factor causing the collision is selected
from the accident report. In the accidents reports this is indicated as ‘immediate cause’. However caution is
needed since these causes are indicated by the straddle carrier drivers who can be reluctant to provide the real

34 2014.TEL.7909
cause, for example when the use of a mobile phone caused a collision. Since the use of a mobile phone is
prohibited on the container terminal, the driver will be reluctant to provide the real cause and thus providing the
accident reporter with an aberrant cause. Although it is assumed that the statements represent the real cause
considering that the statement is checked by the accident reporter and the statement of truth signed by the
straddle carrier drivers. With this in mind the underlying causes of the straddle carrier driver being unaware of
the other straddle carrier are:
• Not looking backwards (4);
• Not looking in driving direction (3);
• Impaired vision caused by the blind spot (15);
• Impaired vision caused by a high spreader (5).
No exact cause can be assigned to the other 17 collisions but distraction, inattention, high traffic density, rush
and routine driving are causes that are cited in those accident reports. In Figure 19 and Figure 20 these accidents
are also indicated as ‘unaware of other SC’. Those factors are indicated as escalation factors and are enumerated
in Table 12 in appendix C. The escalation factors do also play a role in the collisions where an exact cause can be
defined, since impaired vision does not always cause a collision.

35 2014.TEL.7909
Figure 19 - Causes of SC driver unaware of other SC at APMTR – Number of collisions (2005 - August 2014)
Figure 20 - Causes of SC driver unaware of other SC at APMTR – Cost (2005 - August 2014)
This shows that the blind spot cause has the largest share in SC-SC collision costs. The fault tree is extended with
the next layer of causes.

36 2014.TEL.7909
Figure 21 - Fault tree imminent causes of the SC driver being unaware of the other SC
More information on the figures of the SC-SC collisions such as the imminent causes of the other SC-SC
collisions is described in attachment C.
3.1.2 Fact analysis: situations
Although the figures provide insight in the scale of the problem it does not provide qualitative information about
the situations. Therefore the situations are reconstructed to determine were the blind spot is located and what
situations have the most priority to prevent. The reconstruction and grouping of collision situations was done in
three steps:
1. Draw a top-down overview of every collision;
2. Determine the hazard direction seen from the driver who made an error of every collision;
3. Group collisions by hazard direction.
All the collisions where the driver was unaware of the other carrier are drawn since the blind spot could be an
underlying cause of these accidents. From the 44 collisions 7 collisions are excluded from the reconstruction. 4 of
which the accident reports are not unambiguous5 and 3 collisions where the driver did not look in the driving
direction6.
This analysis resulted in six distinct groups. For every group an example is given. The total analysis can be found
in appendix D. The straddle carriers which made an error are indicated in red. The numbers represent the
straddle carrier numbers used at APMTR.
5 6% of the total costs 6 3% of the total costs
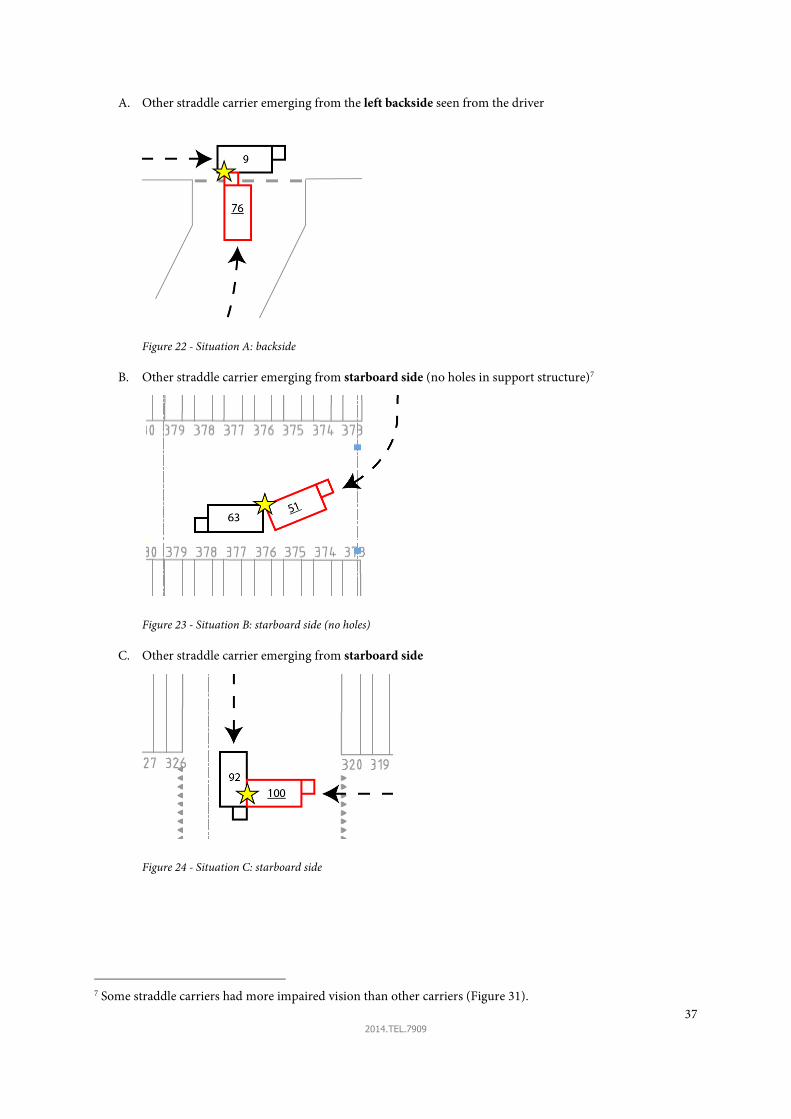
37 2014.TEL.7909
A. Other straddle carrier emerging from the left backside seen from the driver
Figure 22 - Situation A: backside
B. Other straddle carrier emerging from starboard side (no holes in support structure)7
Figure 23 - Situation B: starboard side (no holes)
C. Other straddle carrier emerging from starboard side
Figure 24 - Situation C: starboard side
7 Some straddle carriers had more impaired vision than other carriers (Figure 31).

38 2014.TEL.7909
D. Other straddle carrier emerging from port side
Figure 25 - Situation D: port side
E. Other straddle carrier in front port side
Figure 26 - Situation E: front port side
F. Other straddle carrier emerging from the right backside seen from the driver
Figure 27 - Situation F: right backside
The occurrence and damage contribution is different between the groups which is depicted in Figure 28.
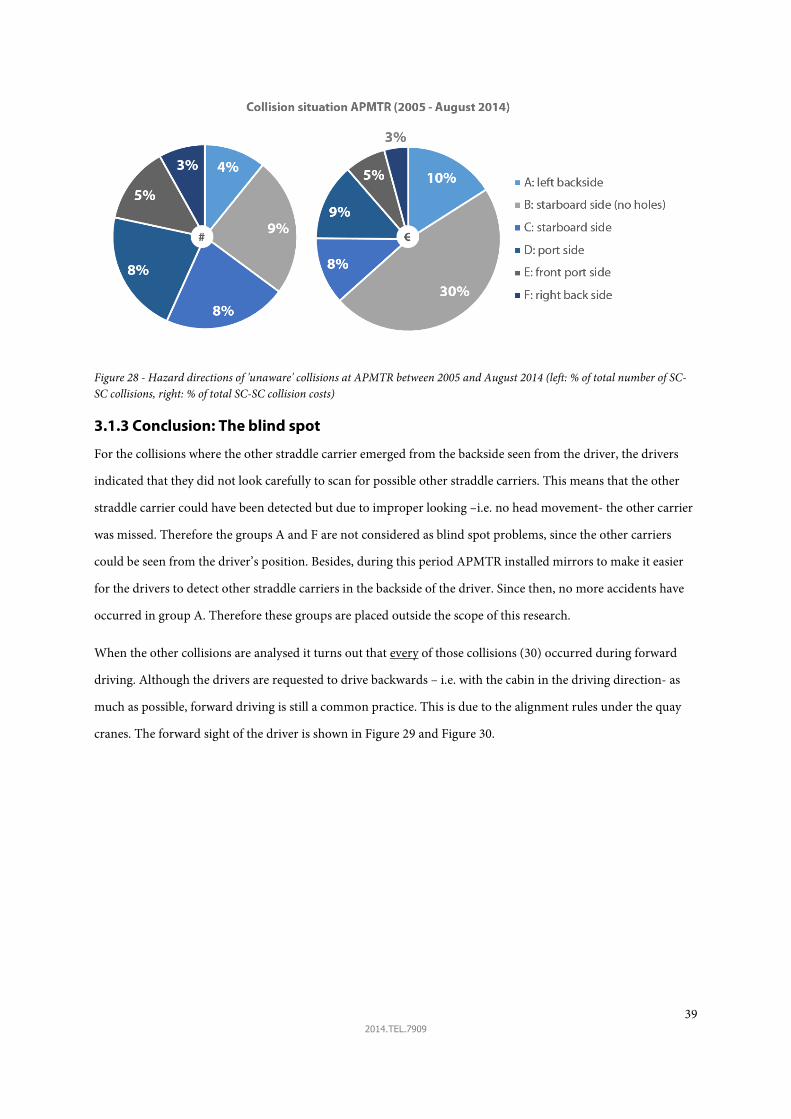
39 2014.TEL.7909
Figure 28 - Hazard directions of 'unaware' collisions at APMTR between 2005 and August 2014 (left: % of total number of SC-
SC collisions, right: % of total SC-SC collision costs)
3.1.3 Conclusion: The blind spot
For the collisions where the other straddle carrier emerged from the backside seen from the driver, the drivers
indicated that they did not look carefully to scan for possible other straddle carriers. This means that the other
straddle carrier could have been detected but due to improper looking –i.e. no head movement- the other carrier
was missed. Therefore the groups A and F are not considered as blind spot problems, since the other carriers
could be seen from the driver’s position. Besides, during this period APMTR installed mirrors to make it easier
for the drivers to detect other straddle carriers in the backside of the driver. Since then, no more accidents have
occurred in group A. Therefore these groups are placed outside the scope of this research.
When the other collisions are analysed it turns out that every of those collisions (30) occurred during forward
driving. Although the drivers are requested to drive backwards – i.e. with the cabin in the driving direction- as
much as possible, forward driving is still a common practice. This is due to the alignment rules under the quay
cranes. The forward sight of the driver is shown in Figure 29 and Figure 30.
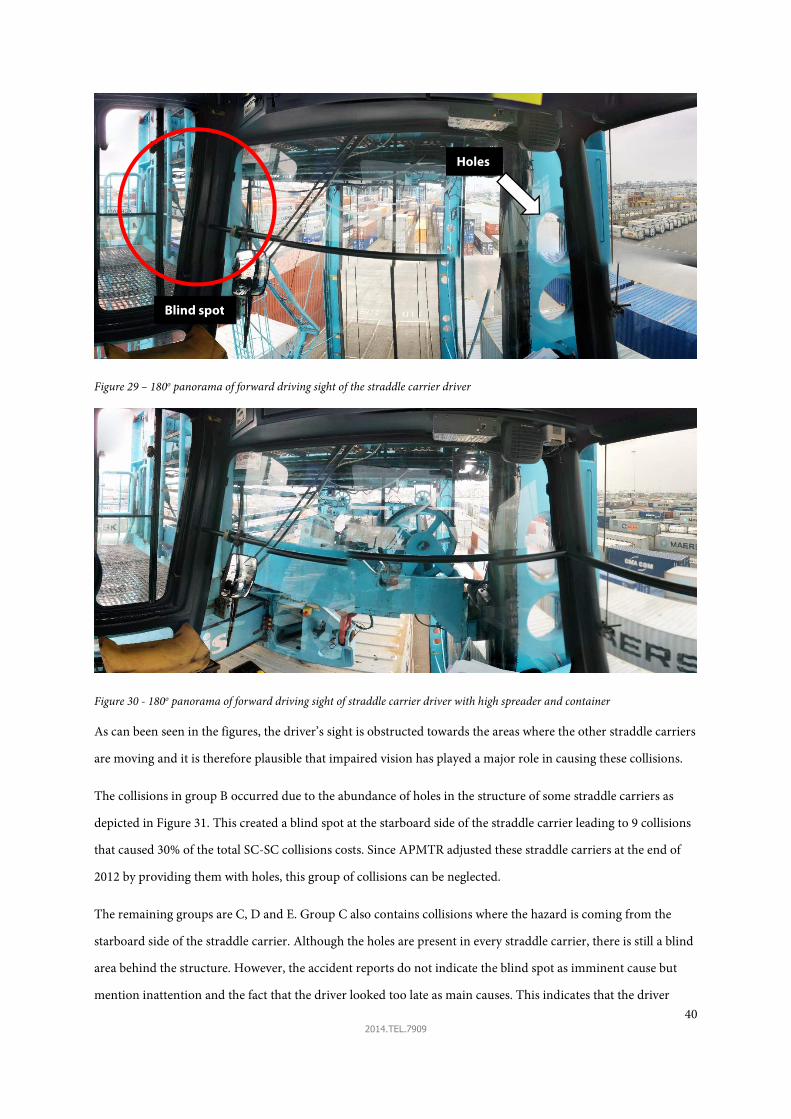
40 2014.TEL.7909
Figure 29 – 180o panorama of forward driving sight of the straddle carrier driver
Figure 30 - 180o panorama of forward driving sight of straddle carrier driver with high spreader and container
As can been seen in the figures, the driver’s sight is obstructed towards the areas where the other straddle carriers
are moving and it is therefore plausible that impaired vision has played a major role in causing these collisions.
The collisions in group B occurred due to the abundance of holes in the structure of some straddle carriers as
depicted in Figure 31. This created a blind spot at the starboard side of the straddle carrier leading to 9 collisions
that caused 30% of the total SC-SC collisions costs. Since APMTR adjusted these straddle carriers at the end of
2012 by providing them with holes, this group of collisions can be neglected.
The remaining groups are C, D and E. Group C also contains collisions where the hazard is coming from the
starboard side of the straddle carrier. Although the holes are present in every straddle carrier, there is still a blind
area behind the structure. However, the accident reports do not indicate the blind spot as imminent cause but
mention inattention and the fact that the driver looked too late as main causes. This indicates that the driver
Holes
Blind spot

41 2014.TEL.7909
could have seen the other straddle carrier by moving his head. Therefore this group of collisions is placed outside
the scope of this research.
Figure 31 - Closed structure of some straddle carriers at APMTR, looking towards starboard (source: APMTR)
This leaves group D and E: impaired vision towards the port side of the straddle carrier when driving forward. As
indicated by the accident reports, the imminent cause of the collisions of group D is the blind spot. This front-
end blind spot is created by the structural interference of the cabin door, ladder and the main structure of the
straddle carrier. Although there is still a small stroke in the blind spot where the other straddle carrier could be
detected, it is hard for the driver to discriminate the other SC from his own. Since the SC’s approach each other
in a 90 degrees angle, the other straddle carrier has a low angular velocity in the field of view of the driver. This
mechanism in combination with the small stroke makes the other straddle carrier hard to detect when it is not
completely covered by the structure. Since this stroke is not located near the driver, the driver cannot easily
compensate for this blind spot by moving his head. See appendix E for a schematic map of the blind spot.
The imminent cause of collisions of group E is impaired vision due to a high spreader. The spreader blocks the
view towards a part of the other straddle carrier making it harder to detect.
Concluding, collisions occurred due to impaired vision towards the port side of the straddle carrier when driving
forward are the focus of this research. The signal/noise ratio should be increased to establish better detection by
the driver. Referring to the SA model (Figure 3), level 1 SA –i.e. perception of the other straddle carrier- could
not easily be obtained. The research of de Lange (2014) also rated the situations of group D as the situations with

42 2014.TEL.7909
the least mutual detectability. So this blind spot has indeed the most influence on the safety of straddle carrier
traffic.
The next step is to determine the SA requirements to obtain high levels of SA.
Figure 32 - Collision situations in scope

43 2014.TEL.7909
3.2 SA requirements analysis
Figure 33 - Research method: SA requirements analysis
This chapter provides the functional requirements as well as the program requirements. It answers the sub-
question:
What are the design criteria?
3.2.1 Solution directions
The next step is to add barriers for one or more hazards of the fault tree (see Figure 54, appendix C). The hazards
are:
• The second straddle carrier in the pathway;
• Escalation factors;
• Impaired vision due to the high spreader;
• Impaired vision due to the blind spot.
Second straddle carrier
The probability of a second straddle carrier in the pathway can be reduced by the means of routing. As de Lange
(2014) pointed out, this should be done by introducing partially unidirectional straits. Another possible solution
could be a route support choice tool for the straddle carrier driver. However, due to the fact that 4 out of 13
carriers causing a collision had no route choice, a route choice support tool does not seem to be a promising
concept. Reducing the probability of a second straddle in the pathway is therefore not considered as an option.
Escalation factor
The escalation factor could be reduced by several measures. This includes measures such as driver training,
increasing driver comfort or changing the yard lay-out. Reducing the contribution of the escalation factors is
however out of scope.
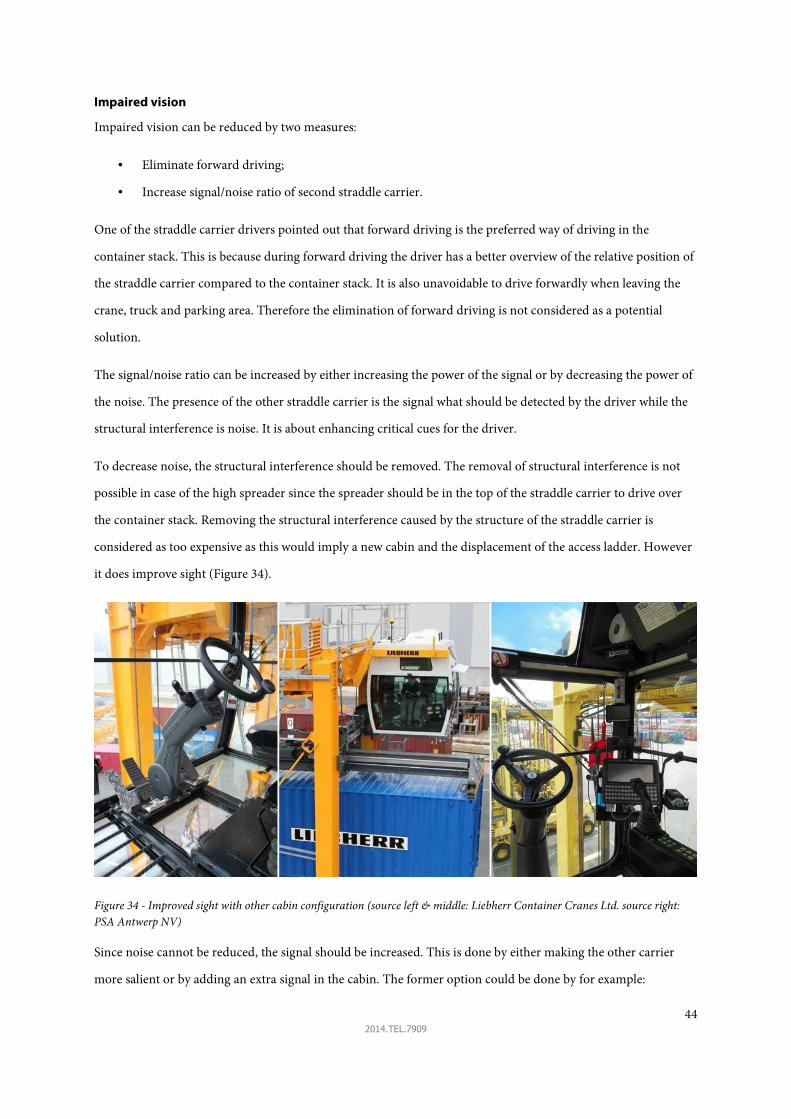
44 2014.TEL.7909
Impaired vision
Impaired vision can be reduced by two measures:
• Eliminate forward driving;
• Increase signal/noise ratio of second straddle carrier.
One of the straddle carrier drivers pointed out that forward driving is the preferred way of driving in the
container stack. This is because during forward driving the driver has a better overview of the relative position of
the straddle carrier compared to the container stack. It is also unavoidable to drive forwardly when leaving the
crane, truck and parking area. Therefore the elimination of forward driving is not considered as a potential
solution.
The signal/noise ratio can be increased by either increasing the power of the signal or by decreasing the power of
the noise. The presence of the other straddle carrier is the signal what should be detected by the driver while the
structural interference is noise. It is about enhancing critical cues for the driver.
To decrease noise, the structural interference should be removed. The removal of structural interference is not
possible in case of the high spreader since the spreader should be in the top of the straddle carrier to drive over
the container stack. Removing the structural interference caused by the structure of the straddle carrier is
considered as too expensive as this would imply a new cabin and the displacement of the access ladder. However
it does improve sight (Figure 34).
Figure 34 - Improved sight with other cabin configuration (source left & middle: Liebherr Container Cranes Ltd. source right:
PSA Antwerp NV)
Since noise cannot be reduced, the signal should be increased. This is done by either making the other carrier
more salient or by adding an extra signal in the cabin. The former option could be done by for example:

45 2014.TEL.7909
• Painting the straddle carrier in a more contrasting colour with the background8;
• Increase light intensity during the night.
Although these measures could help to trigger a faster detection, the other straddle carrier is still undetectable in
the blind spot caused by the structure of the straddle carrier, i.e. level 1 SA could not be obtained. Therefore the
option to add a signal in the cabin is the most suited approach.
3.2.2 SA requirements analysis
The next step is to perform the SA requirements analysis. According to Endsley et al. (2012) this is typically done
through a cognitive task analysis where researchers use observations of operations, interviews with subject matter
experts and available documentation. The analysis for this research is loosely based on the goal directed task
analysis (GDTA) proposed by Endsley et al. (2012). However, since this research is focussed on increasing the
drivers SA to prevent blind spot caused collisions it is essential to scope the GDTA, because the GDTA requires
to map all the goals of the driver. The enhancement of global SA of the driver is however beyond the scope of this
research project. Global SA for the straddle carrier driver encompasses knowledge about the technical state of the
straddle carrier, information concerning vertical container moves and information flows regarding the start and
stop of a shift such as damage reporting. Although global SA is an important aspect of a straddle carrier driver to
perform his job according to the given requirements, these aspects are assumed to have minor influence on the
causation of SC-SC collision caused by the blind spot. Therefore the SA requirements analysis is focussed on the
information needs of a straddle carrier driver in a situation where the blind spot causes a problem.
The GDTA is constructed from the goals of the straddle carrier driver. Each goal is accompanied by decisions
that have to be made by the driver. Those decisions are posed in the form of questions. The SA requirements is
the information that is needed by the driver to answer those questions.
The GDTA is constructed from the APMTR instruction manual for straddle carrier drivers, operational
observations by the author and by interviews done with the straddle carrier drivers. The GDTA can be found in
appendix F. The SA requirements to identify a potential conflicting straddle carrier are:
• Geographic location of the straddle carrier;
• Speed of the straddle carrier;
• Direction of the straddle carrier;
• Destination of the straddle carrier.
8 Straddle carriers, quay cranes and vessels of Maersk line are all blue

46 2014.TEL.7909
The speed and direction are derived by the perception of the location over time where exact magnitudes are not
an SA requirement. Ideally the destination could help the driver to project the pathway of the other straddle
carrier which contributes to higher SA.
So the location of other straddle carriers is a required continuous information flow. This means that only
informing the driver whether another straddle carrier is present is not sufficient. Such a binary signal will not
provide enough information for the driver to understand the situation. For example when two or more straddle
carriers are present. This is confirmed by Chen, Wang, and Duan (2014) who have determined the continuous
location information as a requirement for a blind spot system in the automotive industry. Wilschut et al. (2010)
also conclude that the locations of vulnerable road users should be made visible for a truck driver.
3.2.3 Inform, warn or a combination
Since the continuous flow of information is not a guarantee that the straddle carrier driver will perceive and
comprehend the presence of a second straddle carrier on its pathway, alarms could be added to the system. The
alarms are used to warn the driver in case of inattention or distraction. However, several arguments contradict
the need for a warning system.
1. The experience from the heavy duty equipment industry shows that a continuously informing signal is
at least necessary. So only an alarm is no option.
2. From the 13 selected accidents, only 1 report speaks of a distracted driver. This means that in the other
cases the driver was probably attentive but did not comprehend the situation due to the blind spot. It is
likely that the timely provision of location information could have prevented the collision. This is
confirmed by the fact that in only 5 from the 37 of the ‘unaware’ SC-SC collisions occurred during
forward driving. In 4 of the 5 of those collisions the straddle carrier did not have mirrors installed. This
indicates that impaired sight is a more likely cause than a distracted driver. Therefore there is no need to
warn the driver.
3. Alarms are used for attracting the driver’s attention in unexpected situations or abnormal operating
conditions. The selected situations are neither. In fact, these situations are highly predictable due to the
repetitive character of the straddle carrier traffic. Therefore it is not difficult for the driver to anticipate
from which directions other straddle carriers could appear which is why an alarm system is not
appropriate.
4. Wilschut et al. (2010) state that the literature on motivation shows that the less invasive the intervention
to achieve particular behaviour is, the better the results are in the long term. Thus, the intervention
should be reduced to a minimal.

47 2014.TEL.7909
5. The alarms could lead to misuse of automation. “When no alarm is activated it should be safe to drive.”
When the alarm system misses the detection of the other straddle carrier this could lead to a collision,
introducing a potentially higher risk than without the system.
6. A warning could increase driver response time since it alerts the driver of a potential collision. However,
a warning could also decrease driver response time since drivers tend to seek extra information to
validate the alarm which costs extra time. No scientific literature is known that objectively demonstrates
the beneficial effect of a warning system on traffic safety (Hoedemaeker et al., 2010; Jongeneel, 2014).
7. Even when a warning system is applied, it should only alarm when a driver did not detect the other
straddle carrier considering the minimization of false alarms. However, it is not technically possible to
determine in time whether the driver did not detect the other straddle carrier. This is only possible
when the time to collision approaches the braking time of the straddle carrier. Since the driver has a
perception-brake reaction times between 1 and 1.5 seconds (Campbell, Richard, Brown, & McCallum,
2007), the warning should be activated at least 1.5 seconds before braking time to prevent a collision.
However, due to productivity requirements it is likely that drivers stop their straddle carriers at the end
of the stack lane, thus braking at the latest time possible. The alarm will therefore introduce to many
nuisance alarms, leading to rejection of the warning system.
Therefore the focus is on the first collision phase: driver assistance to enable the straddle carrier driver to stay in
his comfort zone. This is done by informing the driver continuously about the locations of other straddle carriers
at the forward port side of the straddle carrier. By assisting the driver as early as possible - i.e. when the time to
collision is high- it is less likely that a potential collision develops in a more critical stage due to early detection.
3.2.4 Design requirements
The design requirements are derived from the previous analysis, requirements from APMTR and checklists from
Endsley et al. (2012) and Roozenburg and Eekels (1991). With this list of requirements concepts are generated.
Environmental conditions
• The system should work during day and night. Minimum lighting level: 50 lux9;
• The system should withstand vibrations occurred by the straddle carrier;
• The system should fit within the straddle carrier cabin;
• A modular implementation of the system should be possible;
• Failure of the system may not lead to the suspension of the straddle carrier;
• Failure of the system may not lead to increased risk compared to current situation;
9 According to global minimum requirements APMTR 2014

48 2014.TEL.7909
• The costs should be minimized;
User
• The solution should be usable by straddle carrier drivers;
• The solution should be vandal resistant;
• The solution should withstand weather influences;
• The solution should be fool proof;
• The solution should be as comfortable as possible;
Operational requirements
• The system should provide the locations of other potential conflicting straddle carriers in the port-side
blind spot of the straddle carrier in a continuous manner to the straddle carrier driver.

49 2014.TEL.7909
3.3 SA-oriented design
Figure 35 - Research method: SA-oriented design
The next step in the design phase is SA-oriented design (Endsley et al., 2012). Design concepts are generated
from the SA-requirements analysis, technology analysis and the requirements of APMTR. The technology
analysis should provide the available techniques for determining straddle carrier locations and interface
technology. It answers the sub-question:
What designs are possible and what is the best design?
3.3.1 Location determination
The sensor technologies for location determination are adapted from systems used in the heavy duty equipment,
automotive industry and container terminals. This is because the system will be used for safety purposes.
Therefore only reliable and proven sensors are discussed. The checkmark (�) or cross (�) indicate whether a
technology is suited for location determination.
� GPS-IMU
The global positioning system is based on satellite signals to calculate the position of a GPS-receiver. Since the
GPS signal is susceptible to interference by metal objects, a container terminal seems to be an environment
unsuited for GPS equipment. Durrant-Whyte et al. (2007) conclude that the physics of the GPS system preclude
the system from being a reliable stand-alone location determination sensor in container terminal operation. The
authors propose a GPS-IMU sensor10 to overcome this problem. The differential global positioning system can
provide even more accuracy by providing a correction signal to the receiver. The GPS-IMU sensor seems suited
for the system.
10 IMU = Inertial measurement unit
50 2014.TEL.7909
� LIDAR
Light detection and ranging (LIDAR) is a technique to measure the distance to an object by making use of a laser
and its reflections. This system is for example used in automated straddle carriers for obstacle detection
(Durrant-Whyte et al., 2007). However this system is only accurate for short range detections (Marks & Teizer,
2012) and needs other sensor information in order to determine if the detected obstacle is a straddle carrier.
The LIDAR system is not suited as a stand-alone location determination sensor. Only in combination with other
sensors this could be a suitable sensor.
� Radar
Radar uses radio waves to determine the distance to obstacles. Since the radar systems available in these
industries are only able to detect objects in short-range (Marks & Teizer, 2012; T. M. Ruff, 2007), this sensor is
not suited for the use in the straddle carrier.
� RFID
Radio frequency identification tags are used in the heavy equipment industry to identify workers on ground. A
tag is attached to the workers helmet and the antenna is placed at the back of the dump truck. However, RFID
technology only enables the presence detection of a tag in the area, but without any information regarding the
physical location of the tag. Therefore RFID technology is not suited for location determination.
� Sonar
Sonar uses sound propagation to detect obstacles. However, the sensor is susceptible to outdoor elements and has
only a maximum detection range of 3 meter (Marks & Teizer, 2012; T. M. Ruff, 2007). Therefore the sonar is not
a suited sensor for position determination.
� Transponders
Transponders are used in the field of automated guided vehicles. Low frequency transponders are in-ground tags
that are detected by the AGVs to determine their location. Although this system seems to be suited for the
location determination of straddle carriers, the system should have a high density of transponders since the free
routes of straddle carriers. Due to recent investment in a new yard surface at APMTR this solution seems
unlikely.
The transponder system is therefore not suited for location determination of the straddle carriers at APMTR.
51 2014.TEL.7909
� Video cameras
Video cameras are used in combination with video displays to provide an overview of the situation. Since it
provides an overview of the situation it also detects the locations of potential objects. Although sight is reduced
during night-time, the video camera is considered as suitable option for the location determination of straddle
carriers.
3.3.2 Interface technology
The same analysis is done for interface technology.
� Audio display
Audio speakers could provide spatial information to the driver. An example is the Dolby Surround system used
in cinemas. However for the selected situations the audio would only provide one dimensional location
information which is insufficient for the driver to understand what the exact location of the other straddle carrier
is. Hence a continuous auditory signal is undesirable. Therefore an auditory display is not considered as a
suitable interface.
� Head mounted display
Head mounted displays (HMDs) are used to provide the driver with visual information regardless of the viewing
direction. This is an advantage when the driver has to look in many directions. This is the case for a straddle
carrier driver thus a HMD seems like a suitable interface.
� Heads up display
Heads up displays are used to project visual information on the windows of a vehicle to provide the driver with
information in his field of view. Such a display eliminates the need for a driver to turn his head away from the
road when looking for information. Since there is no visual information from the environment in the direction of
the blind spot there is no need for a heads up display.
� Lights
Lights could be used to inform the driver of the presence of a straddle carrier. However since a light can only
provide a binary signal this is not considered as a suitable interface.
� Vibration
Tactile feedback could be provided in the steering wheel or seat of the driver. The tactile feedback in the steering
wheel is only one dimensional and the tactile feedback in the seat will not provide sufficient spatial information
due to the vibration of the seat itself. Therefore a vibrotactile stimulus is considered as unsuitable.
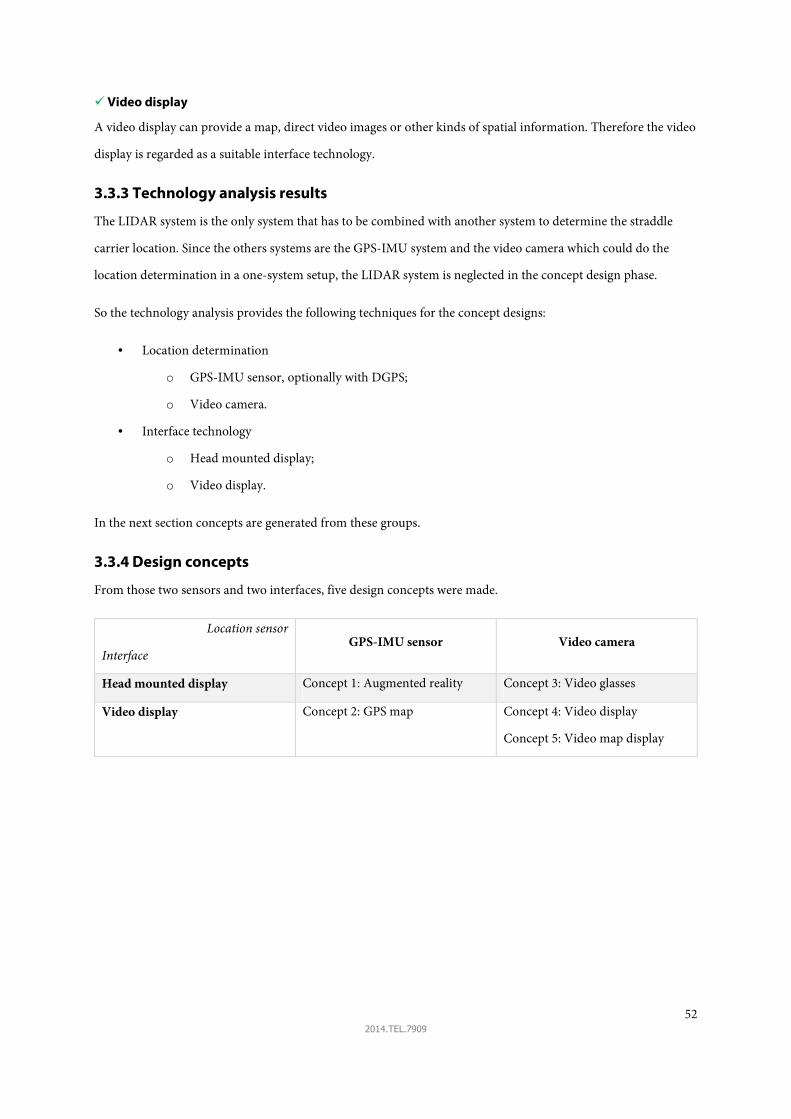
52 2014.TEL.7909
� Video display
A video display can provide a map, direct video images or other kinds of spatial information. Therefore the video
display is regarded as a suitable interface technology.
3.3.3 Technology analysis results
The LIDAR system is the only system that has to be combined with another system to determine the straddle
carrier location. Since the others systems are the GPS-IMU system and the video camera which could do the
location determination in a one-system setup, the LIDAR system is neglected in the concept design phase.
So the technology analysis provides the following techniques for the concept designs:
• Location determination
o GPS-IMU sensor, optionally with DGPS;
o Video camera.
• Interface technology
o Head mounted display;
o Video display.
In the next section concepts are generated from these groups.
3.3.4 Design concepts
From those two sensors and two interfaces, five design concepts were made.
Location sensor
Interface GPS-IMU sensor Video camera
Head mounted display Concept 1: Augmented reality Concept 3: Video glasses
Video display Concept 2: GPS map Concept 4: Video display
Concept 5: Video map display

53 2014.TEL.7909
Concept 1: Augmented reality
Figure 36 - Concept 1: Augmented reality - left: drivers view, right: head mounted display (source: Vuzix)
This concept is based on the interface for military users wearing a HMD (Argenta et al., 2010). It uses a rugged
HMD and projects the locations of the straddle carriers as overlay on the real world. Orientation sensors in the
HMD are used to align the overlay with the real world. At the bottom of the overlay there is a map showing the
surrounding straddle carriers. The locations are determined with GPS-IMU sensors in the straddle carriers and
are send to a central computer. Those locations are send to the HMD which projects the overlay for the straddle
carrier driver. The distance to the other straddle carriers is indicated by the size of the dots.
Concept 2: GPS map
Figure 37 - Concept 2: GPS map on display, left: drivers view, right: possible interface
This system projects a map with the surrounding straddle carriers on a video display. It uses the same system
architecture as concept 1 except for the display. This concept is based on the system proposed by T. Ruff and
Holden (2003).

54 2014.TEL.7909
Concept 3: Video glasses
Figure 38 - Concept 3: Video glasses left: driver view, middle: camera direction, right: HMD (source: Vuzix)
This concept is inspired by the F-35’s HMD system which enables the pilot to ‘see’ through his aircraft (Lockheed
Martin). By installing a camera on the straddle carrier which is pointed towards the port side other straddle
carriers could be detected. The camera is installed in the extended line of view of the straddle carrier driver to
provide a natural field of view. By feeding the image to the top right side of the HMD, the straddle carrier driver
is able to see what is going on in the port side of the straddle carrier.
Concept 4: Video display
Figure 39 - Concept 4: Video display - left: driver view (display not intended size), right: camera direction
This concept is inspired by the reverse camera system of the mining industry and is a regular combination of a
video camera and a video display. The video image shows the environment on the forward port side of the
straddle carrier. Just like in concept 3, the camera is installed in the extended line of view of the straddle carrier
driver to provide a natural field of view.

55 2014.TEL.7909
Concept 5: Video map display
This concept is inspired by the off-board camera system by Borges, Zlot, and Tews (2013). When the video
cameras are mounted to the light poles in the yard, those video images could be transmitted to the straddle
carrier drivers providing them with a top-down view of their situation.
The next step is to select one of the five concepts.
3.3.5 Concept selection
Now the design concepts are known, one concept should be selected for further exploration. This section answers
the following sub-question:
What is the best design?
A first step is to check whether the concepts pass all the criteria. The concepts are rated according to the design
requirements. It turns out that concept 1 and 2 fail on the following criteria:
• A modular implementation of the system is be possible;
• Failure of the system does not lead to the suspension of the straddle carrier;
• Failure of the system does not lead to increased risk compared to current situation;
Since those concepts only function when every individual unit is operational, the concepts do not pass these
criteria. A failure of one unit leads for example to a missing point of interest for the other straddle carrier drivers.
When they blindly follow the provided information it could look like a free pathway, while in reality there will be
another straddle carrier in the pathway.
Since it is expected that concept 5 performs worse than concept 3 and 4, this concept is also removed from the
possibilities. This is because the fact that the driver should first find its own carrier in the display, before he can
make an assessment of his own situation. It is assumed that the signal/noise ratio is too low for this concept.

56 2014.TEL.7909
When comparing concept 3 and 4, the HMD does not seem to have an advantage over the video display. When
costs are taken into account option 3 is no longer viable compared to concept 4. Therefore the video display is
chosen as the best design. From now on this system is referred as the blind spot camera. The variables of the
design are indicated in appendix H.
Conclusion
From the five generated concepts, the best design is the blind spot camera. This corresponds to the conclusion of
section 2.2. The blind spot camera will function as a barrier to prevent a SC-SC collision caused by impaired
vision due to the blind spot. This concept will be tested in an experiment to determine whether SA indeed
increases.

57 2014.TEL.7909
3.4 Experiment: SA measurement
Figure 40 - Research approach: SA measurement
In the previous section it was concluded that a blind spot camera is the most suited option to eliminate the blind
spot of the straddle carrier. An experiment is needed to answer the last sub-question:
Does the proposed solution increase SA?
When the solution indeed increases SA, a decrease of the probability of blind-spot caused collisions can be
assumed. To indicate a positive contribution to safety an experiment has to be executed to determine if the blind
spot camera has a positive influence on SA. This is the final step of the SA-oriented design method.
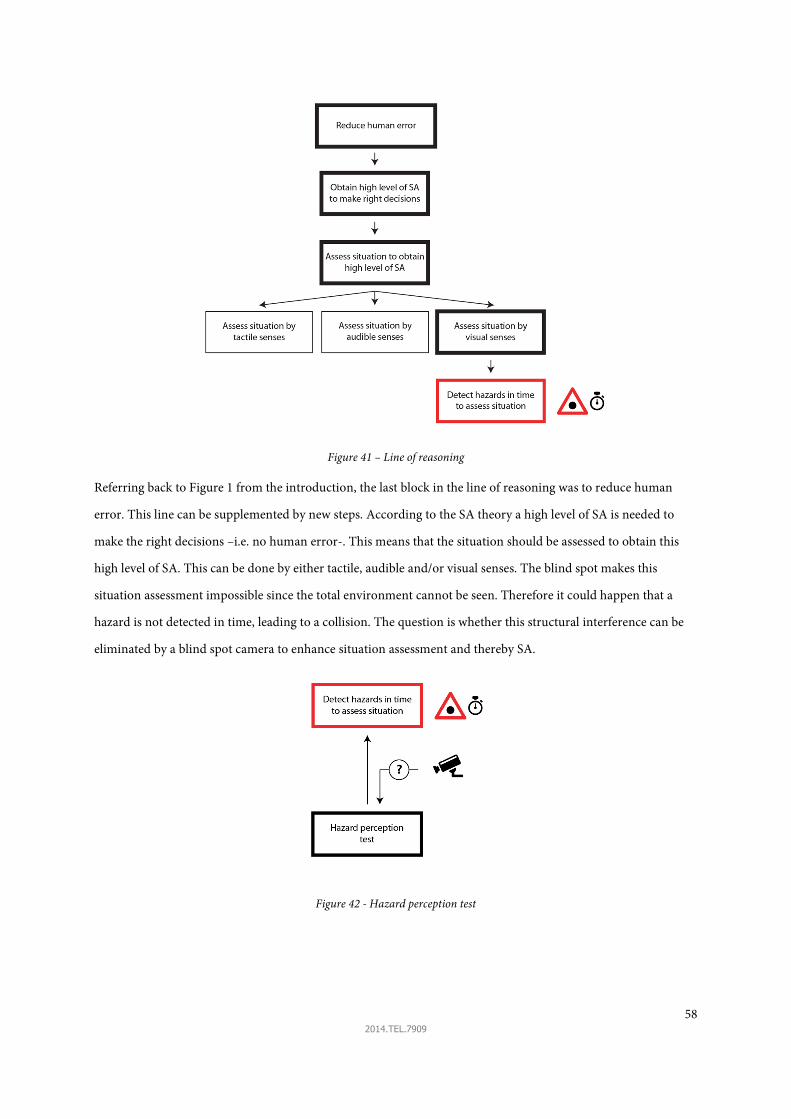
58 2014.TEL.7909
Figure 41 – Line of reasoning
Referring back to Figure 1 from the introduction, the last block in the line of reasoning was to reduce human
error. This line can be supplemented by new steps. According to the SA theory a high level of SA is needed to
make the right decisions –i.e. no human error-. This means that the situation should be assessed to obtain this
high level of SA. This can be done by either tactile, audible and/or visual senses. The blind spot makes this
situation assessment impossible since the total environment cannot be seen. Therefore it could happen that a
hazard is not detected in time, leading to a collision. The question is whether this structural interference can be
eliminated by a blind spot camera to enhance situation assessment and thereby SA.
Figure 42 - Hazard perception test
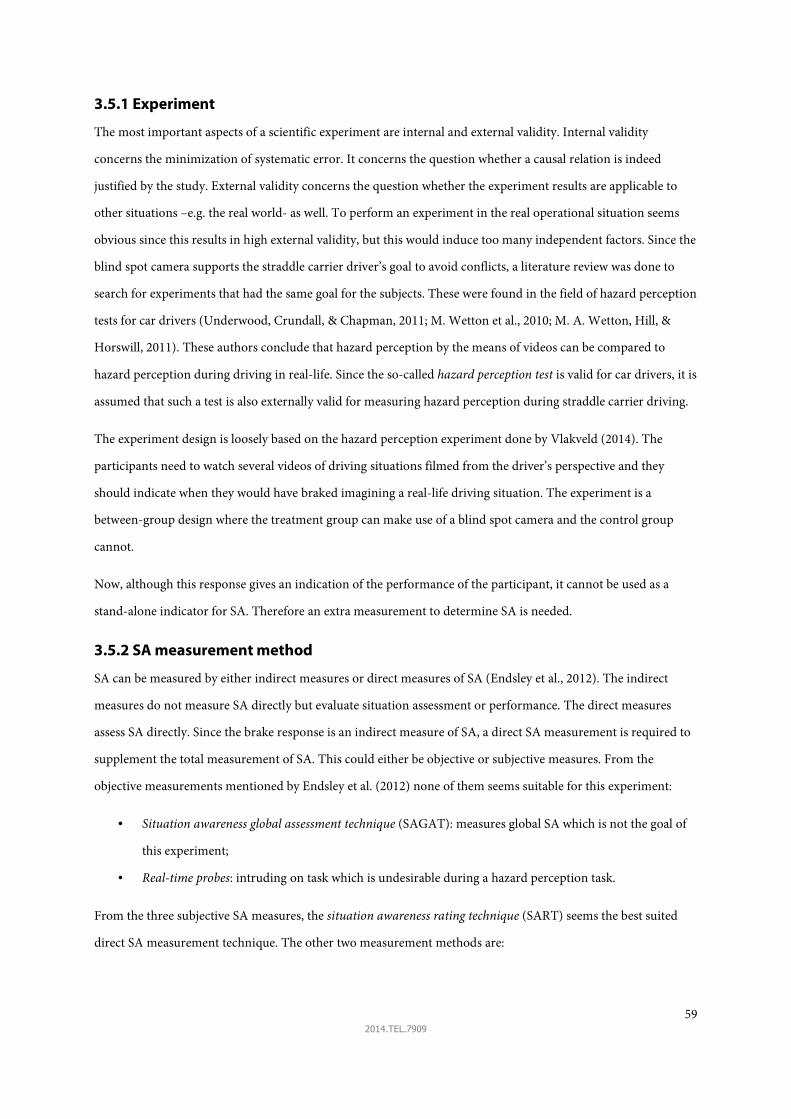
59 2014.TEL.7909
3.5.1 Experiment
The most important aspects of a scientific experiment are internal and external validity. Internal validity
concerns the minimization of systematic error. It concerns the question whether a causal relation is indeed
justified by the study. External validity concerns the question whether the experiment results are applicable to
other situations –e.g. the real world- as well. To perform an experiment in the real operational situation seems
obvious since this results in high external validity, but this would induce too many independent factors. Since the
blind spot camera supports the straddle carrier driver’s goal to avoid conflicts, a literature review was done to
search for experiments that had the same goal for the subjects. These were found in the field of hazard perception
tests for car drivers (Underwood, Crundall, & Chapman, 2011; M. Wetton et al., 2010; M. A. Wetton, Hill, &
Horswill, 2011). These authors conclude that hazard perception by the means of videos can be compared to
hazard perception during driving in real-life. Since the so-called hazard perception test is valid for car drivers, it is
assumed that such a test is also externally valid for measuring hazard perception during straddle carrier driving.
The experiment design is loosely based on the hazard perception experiment done by Vlakveld (2014). The
participants need to watch several videos of driving situations filmed from the driver’s perspective and they
should indicate when they would have braked imagining a real-life driving situation. The experiment is a
between-group design where the treatment group can make use of a blind spot camera and the control group
cannot.
Now, although this response gives an indication of the performance of the participant, it cannot be used as a
stand-alone indicator for SA. Therefore an extra measurement to determine SA is needed.
3.5.2 SA measurement method
SA can be measured by either indirect measures or direct measures of SA (Endsley et al., 2012). The indirect
measures do not measure SA directly but evaluate situation assessment or performance. The direct measures
assess SA directly. Since the brake response is an indirect measure of SA, a direct SA measurement is required to
supplement the total measurement of SA. This could either be objective or subjective measures. From the
objective measurements mentioned by Endsley et al. (2012) none of them seems suitable for this experiment:
• Situation awareness global assessment technique (SAGAT): measures global SA which is not the goal of
this experiment;
• Real-time probes: intruding on task which is undesirable during a hazard perception task.
From the three subjective SA measures, the situation awareness rating technique (SART) seems the best suited
direct SA measurement technique. The other two measurement methods are:

60 2014.TEL.7909
• SA-subjective workload dominance technique: to be used when comparing design features or concepts.
This is not the case in this experiment;
• Observer ratings: the observers would not have more knowledge of reality than the straddle carrier
drivers themselves.
SART was developed by Taylor (1990) to measure aircrew SA and the author identified the three broad domains
that determine SA:
• Demands on attentional resources (D);
• Supply of attentional resources (S);
• Understanding of the situation (U).
These domains could be assessed by different scale lengths. Due to the fact that SA should be assessed after every
video of a situation, the choice is made to pick the shortest scale length: 3D-SART. Only the three broad domains
–i.e. questions- will be assessed. Picking the shortest scale length will reduce sensitivity but will increase the speed
of the assessment.
The participants are asked to indicate their demand, supply and understanding of the situation on a 7-point
Likert scale. The lowest score is given 1 point, the highest score 7. SA is then calculated by the following formula:
�� = ����������� − �"���� − �#��� � (3.1)
The SART method thus assumes an interval scale.
Since a proper question for the supply domain could not be found, required effort was asked. The assumption is
that the higher the effort, the lower the available supply of attentional resources and vice versa. Therefore the
highest and lowest scores were switched for the supply domain.
So two null hypothesis could be determined:
• H0 = The blind spot camera will have no effect on straddle carrier driver braking response time when
driving forward;
• H0 = The blind spot camera will have no effect on straddle carrier driver SA when driving forward;
3.5.3 Other measurements
Since it is not unlikely that the blind spot camera introduces data overload, the perceived workload is measured.
Data overload has a negative impact on SA, so this should be prevented. Although the blind spot camera could
also reduce perceived workload since it is likely that the camera makes the situation assessment easier. To
determine the perceived workload, the participants should fill out a NASA-TLX questionnaire at the end of the
experiment. The scores are calculated with equal weighting factors according to the raw NASA-TLX method.

61 2014.TEL.7909
To validate the experimental setup, the control group is asked to answer two questions about the validity:
• To what extent does this experiment resembles forward driving with a straddle carrier?
• To what extent is this experiment comparable with hazard perception during forward driving with a
straddle carrier?
To predict the acceptation of the blind spot camera by the straddle carrier drivers, the treatment group is asked
to answer two questions based on the technology acceptance model of Davis et al. (1989):
• To what extent is the blind spot camera a useful addition for your job?
• To what extent do you rate the ease of use of the blind spot camera?
3.5.4 Experiment design
Stimuli
For both groups the same situations were used. For the treatment group however, a video overlay of the blind
spot camera was added (Figure 43). More information of the creation of those videos can be found in appendix
H. The average length of the videos was 37 seconds.
Figure 43 - Video images left and right view, top: control group view, bottom: treatment group view

62 2014.TEL.7909
Task
The task for the participants was to detect another straddle carrier emerging from either the left or right side of
the straddle carrier. When they would have braked during real-life driving, they should press the spacebar. The
straddle carriers appear from both sides and not every situation requires a braking action.
Apparatus
In order to let the driver turn his head like in the real straddle carrier –i.e. 90 degrees to the right-, the
experiment was conducted on a pc with two 22 inch monitors. One monitor for the image towards the port side
of the straddle carrier, one for towards the starboard side of the straddle carrier (Figure 44). Each monitor
showed a video with a resolution of 1280x720 pixels.
Figure 44 – Left: experimental setup, right: Experimental setup projected on straddle carrier (grey)
The brake response could be indicated by pressing the space bar. Software started the videos simultaneously and
recorded the time stamps of the space bar presses. See appendix J for the software code written in Delphi. The
average distance from the eyes to the middle of the screens was 40-50 centimetres. Two identical setups were
used for this experiment.
Participants
With G*Power a power analysis was done prior to the experiment. With an expected effect size of 0.8 – large-, an
error probability of α = 0.05 and required power of 0.8, it showed that both sample sizes should be 21 for
significant results.
The error probability α of 0.05 means that a 5% chance of a type I error is accepted. This means that there is a 5%
chance –or less – of an incorrect rejection of a true null hypothesis. The required power of 0.8 means that there is
an 80% chance of a correct rejection of a false null hypothesis.

63 2014.TEL.7909
The participants were recruited from one group of straddle carriers of APMTR. It is assumed that there is no
significant difference between the straddle carrier driver groups. The experiment started at 3:15 PM and lasted to
10:00 PM. The drivers were asked not to talk about the experiment until the next day. This measure should
minimize the effect that the drivers would have influenced each other’s performance. The composition of both
groups was:
• Control group: n = 15; mean age = 35, SD age = 9; minimum age 21, maximum age 51; SC experience in
years = 4, SD experience = 4; 100% male.
• Treatment group: n = 16; mean age = 35, SD age = 9; minimum age 21, maximum age 48; SC experience
in years = 5, SD experience= 4; 94% male.
Two-tailed t-tests for independent samples showed no significant difference in age (t(28) = 0.06 p = 0.954) and
SC experience (t(28) = -0.61 p = 0.546).
Procedure
To increase internal validity the drivers were randomly selected from the straddle carrier driver group. The
experiment was conducted in parallel by two participants and they could pick a PC by themselves. For each
driver couple one PC served the control trail, the other the experiment trail. For the next driver couple the
control and experiment tasks were switched between the PCs in order to eliminate the potential differences in
apparatus.
After the participants were informed about the experiment and an informed consent form was signed, the trials
started. The videos contained instructions to inform the participants about the upcoming situation with a map
and when to answer the questions. These questions can be found in appendix I. The treatment group did not
receive any training or extra advice. Only the message that they could make use of a blind spot camera was added
to the instruction. This to prevent response bias as much as possible.

64 2014.TEL.7909

65 2014.TEL.7909
4. Results
From the accident analysis, SA requirements analysis and the concept design
phase, a final design is chosen: the blind spot camera. The camera system
increases the likelihood of detecting another straddle carrier by providing a
continuous information flow to the straddle carrier driver. An experiment is
executed to determine if the blind spot camera enhances SA and enhances
braking response time. Due to the continuous flow of information there is a risk
of overloading the driver with information which could lead to increased
workload. It is of importance that the camera system does not increase workload
since this influences SA, the decision making process and the performance of
actions. Therefore the workload is measured as well. To successfully implement
the blind spot camera, the system should be accepted by the straddle carrier
drivers. This is measured according to two factors of the technology acceptance
model: perceived usefulness and perceived ease of use. The data can be found in
appendix K. Driver remarks are also included in this appendix.
This chapter presents the results obtained from the experiment. The chapter is divided in five parts:
1. Validity of the experiment;
2. Situation awareness;
3. Braking response time;
4. Data overload;
5. Technology acceptation;
Figure 45 - Report structure
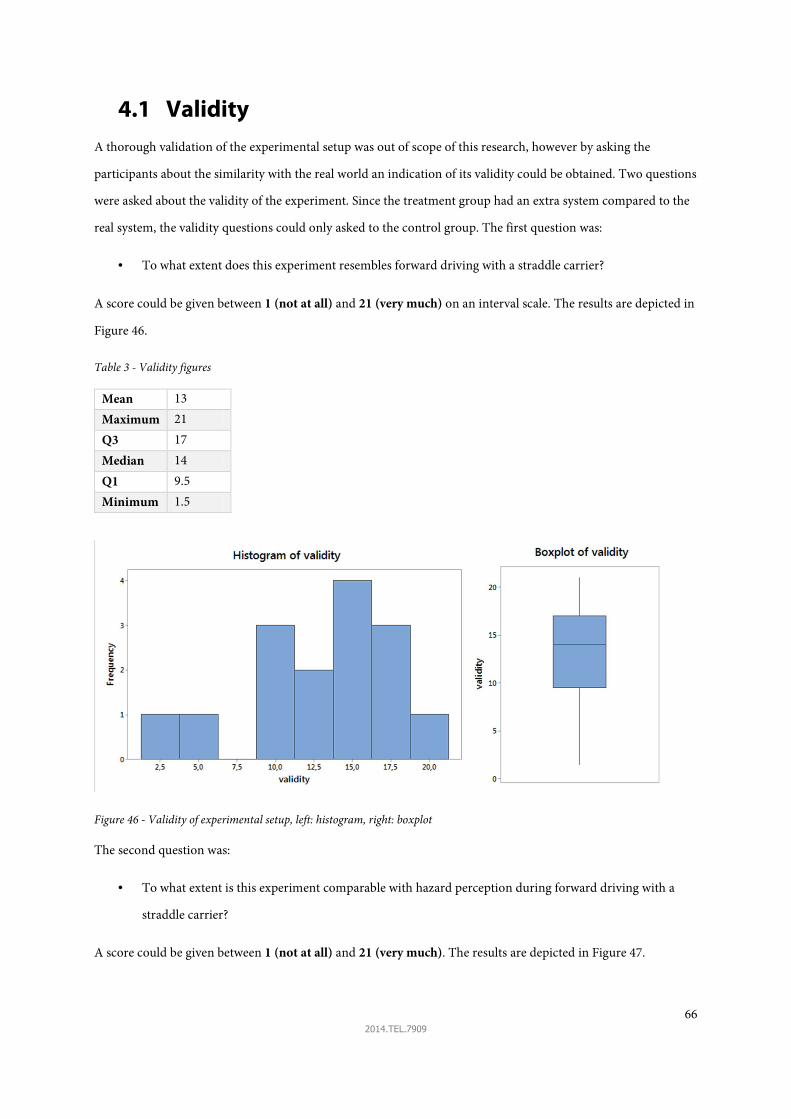
66 2014.TEL.7909
4.1 Validity A thorough validation of the experimental setup was out of scope of this research, however by asking the
participants about the similarity with the real world an indication of its validity could be obtained. Two questions
were asked about the validity of the experiment. Since the treatment group had an extra system compared to the
real system, the validity questions could only asked to the control group. The first question was:
• To what extent does this experiment resembles forward driving with a straddle carrier?
A score could be given between 1 (not at all) and 21 (very much) on an interval scale. The results are depicted in
Figure 46.
Table 3 - Validity figures
Mean 13
Maximum 21
Q3 17
Median 14
Q1 9.5
Minimum 1.5
Figure 46 - Validity of experimental setup, left: histogram, right: boxplot
The second question was:
• To what extent is this experiment comparable with hazard perception during forward driving with a
straddle carrier?
A score could be given between 1 (not at all) and 21 (very much). The results are depicted in Figure 47.
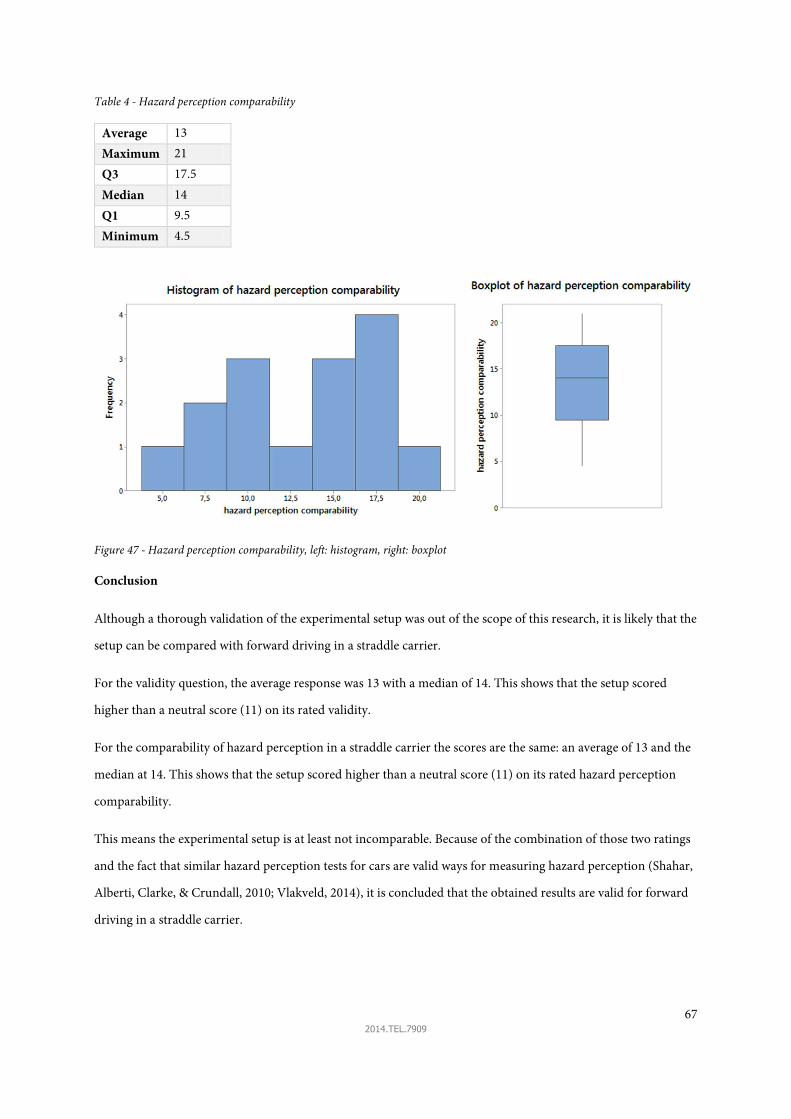
67 2014.TEL.7909
Table 4 - Hazard perception comparability
Average 13
Maximum 21
Q3 17.5
Median 14
Q1 9.5
Minimum 4.5
Figure 47 - Hazard perception comparability, left: histogram, right: boxplot
Conclusion
Although a thorough validation of the experimental setup was out of the scope of this research, it is likely that the
setup can be compared with forward driving in a straddle carrier.
For the validity question, the average response was 13 with a median of 14. This shows that the setup scored
higher than a neutral score (11) on its rated validity.
For the comparability of hazard perception in a straddle carrier the scores are the same: an average of 13 and the
median at 14. This shows that the setup scored higher than a neutral score (11) on its rated hazard perception
comparability.
This means the experimental setup is at least not incomparable. Because of the combination of those two ratings
and the fact that similar hazard perception tests for cars are valid ways for measuring hazard perception (Shahar,
Alberti, Clarke, & Crundall, 2010; Vlakveld, 2014), it is concluded that the obtained results are valid for forward
driving in a straddle carrier.

68 2014.TEL.7909
4.2 Situation awareness The main goal of this experiment is to determine whether a blind spot camera increases the SA of the straddle
carrier driver when driving forward. When SA is increased, the probability of making a correct traffic decision is
increased which in turn decreases the probability of a collision. Per situation the difference in SA is analysed
between the treatment and control group.
Therefore the null hypothesis is:
H0 = The blind spot camera will have no effect on straddle carrier driver SA
when driving forward
It is expected that the blind spot camera increases SA of the operator. Therefore alternative hypothesis is:
H1 = The blind spot camera increases straddle carrier driver SA
when driving forward
To determine the SA score, the participants were asked to answer three SA questions according to the SART
method after each situation during the trail. These responses are combined to determine a SA score per situation
per participant. The null hypothesis will be tested with a one-tailed statistical test since the test only needs to
show whether SA of the treatment group increases or not. Since the SA scores of the groups pass the Ryan-Joiner
normality test, independent t-tests are used to compare these scores. A significance level of α=0.05 is used to
determine if the results are statistically significant.
Situation 1 - Driving away from the quay crane
H0 = The blind spot camera will have no effect on SC driver SA when driving forward in situation 1
H1 = The blind spot camera increases straddle carrier driver SA when driving forward in situation 1
A one-tailed independent t-test was conducted to evaluate the hypothesis that the blind spot camera has no effect
on driver SA in situation 1. There was a significant difference in the SA scores for the treatment group (M=9.42,
SD=2.20) and the SA scores for the control group (M=8.23, SD=1.08) conditions; t(22)=1.90, p = 0.035.
Therefore the null hypothesis is rejected and the alternative hypothesis is accepted:
� H0 = The blind spot camera will have no effect on straddle carrier driver SA when driving forward in situation
1
� H1 = The blind spot camera increases straddle carrier driver SA when driving forward in situation 1

69 2014.TEL.7909
Situation 2 - Turning into stack
H0 = The blind spot camera will have no effect on SC driver SA when driving forward in situation 2
H1 = The blind spot camera increases straddle carrier driver SA when driving forward in situation 2
There was a not a significant difference in the SA scores for the treatment group (M=8.69, SD=3.58) and the SA
scores for the control group (M=9.20, SD=2.40) conditions; t(29)=-0.46, p = 0.677.
Therefore this test failed to reject the null hypothesis for situation 2.
Situation 3 - Driving over an intersection
H0 = The blind spot camera will have no effect on SC driver SA when driving forward in situation 3
H1 = The blind spot camera increases straddle carrier driver SA when driving forward in situation 3
There was a not a significant difference in the SA scores for the treatment group (M=10.06, SD=3.28) and the SA
scores for the control group (M=8.50, SD=2.57) conditions; t(29)= 1.47, p = 0.076.
Therefore this test failed to reject the null hypothesis for situation 3.
Situation 4 - Driving from stack with high spreader
H0 = The blind spot camera will have no effect on SC driver SA when driving forward in situation 4
H1 = The blind spot camera increases straddle carrier driver SA when driving forward in situation 4
There was a significant difference in the SA scores for the treatment group (M=8.13, SD=3.11) and the SA scores
for the control group (M=5.87, SD=4.03) conditions; t(29)= 1.75, p = 0.045.
Therefore the null hypothesis is rejected and the alternative hypothesis is accepted:
� H0 = The blind spot camera will have no effect on straddle carrier driver SA when driving forward in situation
4
� H1 = The blind spot camera increases straddle carrier driver SA when driving forward in situation 4
Situation 5 - Driving away from the truck group
H0 = The blind spot camera will have no effect on SC driver SA when driving forward in situation 5
H1 = The blind spot camera increases straddle carrier driver SA when driving forward in situation 5
There was a not a significant difference in the SA scores for the treatment group (M=8.88, SD=2.98) and the SA
scores for the control group (M=9.37, SD=2.98) conditions; t(29)= -0.46, p = 0.675.
Therefore this test failed to reject the null hypothesis for situation 5.

70 2014.TEL.7909
Situation 6 - Driving from stack with low spreader
H0 = The blind spot camera will have no effect on SC driver SA when driving forward in situation 6
H1 = The blind spot camera increases straddle carrier driver SA when driving forward in situation 6
There was a not a significant difference in the SA scores for the treatment group (M=6.97, SD=4.13) and the SA
scores for the control group (M=6.20, SD=2.94) conditions; t(29)= 0.59, p = 0.279.
Therefore this test failed to reject the null hypothesis for situation 6.
Situation 7 - Driving away from the quay crane
H0 = The blind spot camera will have no effect on SC driver SA when driving forward in situation 7
H1 = The blind spot camera increases straddle carrier driver SA when driving forward in situation 7
There was a significant difference in the SA scores for the treatment group (M=8.09, SD=2.89) and the SA scores
for the control group (M=6.17, SD=2.71) conditions; t(29)= 1.91, p = 0.033.
Therefore the null hypothesis is rejected and the alternative hypothesis is accepted:
� H0 = The blind spot camera will have no effect on straddle carrier driver SA when driving forward in situation
7
� H1 = The blind spot camera increases straddle carrier driver SA when driving forward in situation 7
Situation 8 - Turning into stack
H0 = The blind spot camera will have no effect on SC driver SA when driving forward in situation 8
H1 = The blind spot camera increases straddle carrier driver SA when driving forward in situation 8
There was a not a significant difference in the SA scores for the treatment group (M=9.63, SD=2.90) and the SA
scores for the control group (M=8.50, SD=2.86) conditions; t(29)= 1.09, p = 0.143.
Therefore this test failed to reject the null hypothesis for situation 8.
Conclusion
When looking to the t-values, the results indicate SA improvement for 6 out of the 8 situations: 1, 3, 4, 6, 7 and 8.
This means that in the following situations the blind spot camera seems to have a positive contribution to the
driver’s SA:
• Leaving the quay crane area forwardly –situation 1 and 7- ;
• Driving over an intersection –situation 3-;
• Leaving the container stack with a top-lifted spreader forwardly –situation 4-;
• Leaving the container stack with a low spreader forwardly – situation 6 -;
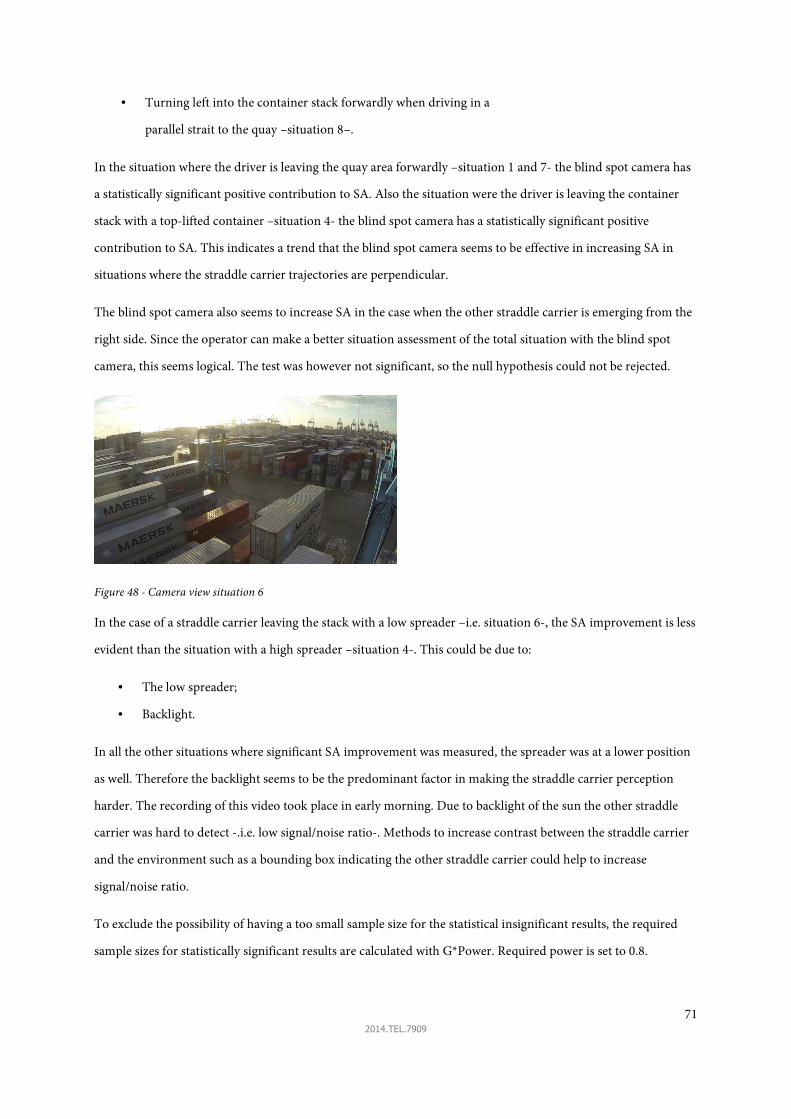
71 2014.TEL.7909
• Turning left into the container stack forwardly when driving in a
parallel strait to the quay –situation 8–.
In the situation where the driver is leaving the quay area forwardly –situation 1 and 7- the blind spot camera has
a statistically significant positive contribution to SA. Also the situation were the driver is leaving the container
stack with a top-lifted container –situation 4- the blind spot camera has a statistically significant positive
contribution to SA. This indicates a trend that the blind spot camera seems to be effective in increasing SA in
situations where the straddle carrier trajectories are perpendicular.
The blind spot camera also seems to increase SA in the case when the other straddle carrier is emerging from the
right side. Since the operator can make a better situation assessment of the total situation with the blind spot
camera, this seems logical. The test was however not significant, so the null hypothesis could not be rejected.
Figure 48 - Camera view situation 6
In the case of a straddle carrier leaving the stack with a low spreader –i.e. situation 6-, the SA improvement is less
evident than the situation with a high spreader –situation 4-. This could be due to:
• The low spreader;
• Backlight.
In all the other situations where significant SA improvement was measured, the spreader was at a lower position
as well. Therefore the backlight seems to be the predominant factor in making the straddle carrier perception
harder. The recording of this video took place in early morning. Due to backlight of the sun the other straddle
carrier was hard to detect -.i.e. low signal/noise ratio-. Methods to increase contrast between the straddle carrier
and the environment such as a bounding box indicating the other straddle carrier could help to increase
signal/noise ratio.
To exclude the possibility of having a too small sample size for the statistical insignificant results, the required
sample sizes for statistically significant results are calculated with G*Power. Required power is set to 0.8.

72 2014.TEL.7909
Table 5 - Required sample sizes
Effect size Total required sample
size
Situation 2 0.17 858
Situation 3 0.53 90
Situation 5 0.16 970
Situation 6 0.21 564
Situation 8 0.39 166
Table 5 shows that the total required sample sizes are at least three times larger than in this experiment, so
adding a few more samples would not have made the results statistically significant.
For situation 2 and 5, –turning into stack and driving away from the truck group respectively– show a small
effect size. This is probably due to the fact that the other straddle carrier was already in view long before a
potential collision occurred. Therefore in these situations the blind spot camera had no added value leading to
unincreased driver SA.
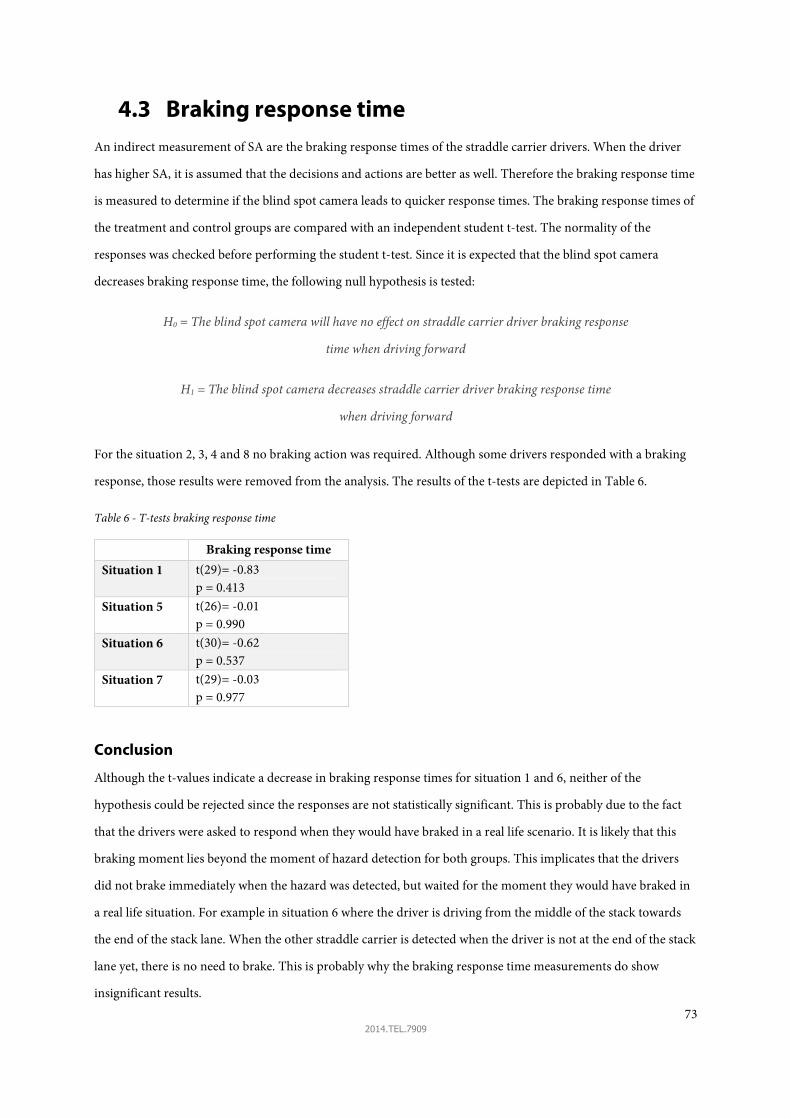
73 2014.TEL.7909
4.3 Braking response time
An indirect measurement of SA are the braking response times of the straddle carrier drivers. When the driver
has higher SA, it is assumed that the decisions and actions are better as well. Therefore the braking response time
is measured to determine if the blind spot camera leads to quicker response times. The braking response times of
the treatment and control groups are compared with an independent student t-test. The normality of the
responses was checked before performing the student t-test. Since it is expected that the blind spot camera
decreases braking response time, the following null hypothesis is tested:
H0 = The blind spot camera will have no effect on straddle carrier driver braking response
time when driving forward
H1 = The blind spot camera decreases straddle carrier driver braking response time
when driving forward
For the situation 2, 3, 4 and 8 no braking action was required. Although some drivers responded with a braking
response, those results were removed from the analysis. The results of the t-tests are depicted in Table 6.
Table 6 - T-tests braking response time
Braking response time
Situation 1 t(29)= -0.83
p = 0.413
Situation 5 t(26)= -0.01
p = 0.990
Situation 6 t(30)= -0.62
p = 0.537
Situation 7 t(29)= -0.03
p = 0.977
Conclusion
Although the t-values indicate a decrease in braking response times for situation 1 and 6, neither of the
hypothesis could be rejected since the responses are not statistically significant. This is probably due to the fact
that the drivers were asked to respond when they would have braked in a real life scenario. It is likely that this
braking moment lies beyond the moment of hazard detection for both groups. This implicates that the drivers
did not brake immediately when the hazard was detected, but waited for the moment they would have braked in
a real life situation. For example in situation 6 where the driver is driving from the middle of the stack towards
the end of the stack lane. When the other straddle carrier is detected when the driver is not at the end of the stack
lane yet, there is no need to brake. This is probably why the braking response time measurements do show
insignificant results.

74 2014.TEL.7909
4.4 Data overload The blind spot camera could introduce data overload which could distract the driver from looking to the road
ahead. This should be avoided because data overload could result in a higher workload. However due to the fact
that the blind spot camera provides the required information in a continuous matter, the workload could also be
reduced. Therefore the perceived workload was measured to determine if data overload poses a problem.
Perceived workload
The perceived workload was assessed by the NASA-TLX assessment tool (Hart, 2006). After the runs the drivers
had to fill out the NASA-TLX questionnaire. The total perceived workload score is calculated according to the
Raw TLX method. This is calculated by enumerating the six subscales of the questionnaire and dividing this total
score by 126. Since the subscales range from 1 to 21, this leads to a total score of perceived workload between 5
and 100. A score of 5 means a very low perceived workload, a score of 100 means a very high perceived workload.
The result is depicted in Figure 49.
Table 7 - Workload NASA-TLX
Control group Treatment group
Average 31 Average 14
Maximum 55 Maximum 33
Q3 43 Q3 19
Median 33.5 Median 10
Q1 16 Q1 7
Minimum 10 Minimum 5
Figure 49 – Boxplots of perceived workload of control and treatment group
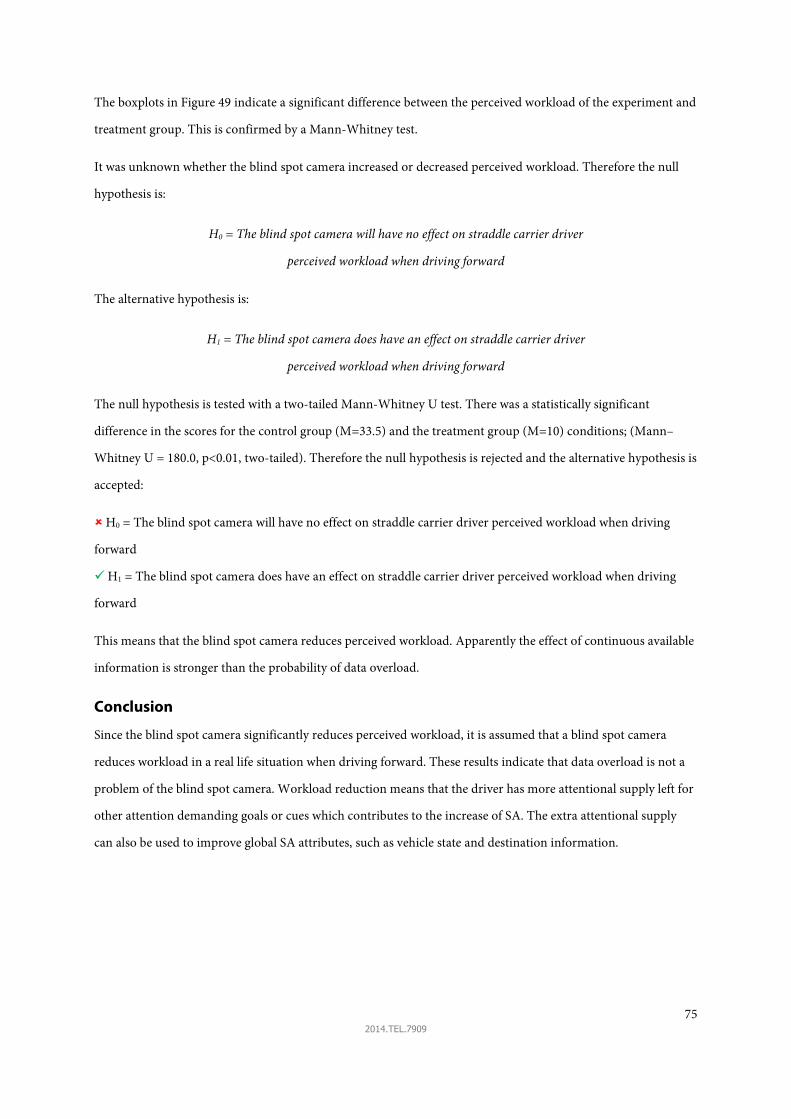
75 2014.TEL.7909
The boxplots in Figure 49 indicate a significant difference between the perceived workload of the experiment and
treatment group. This is confirmed by a Mann-Whitney test.
It was unknown whether the blind spot camera increased or decreased perceived workload. Therefore the null
hypothesis is:
H0 = The blind spot camera will have no effect on straddle carrier driver
perceived workload when driving forward
The alternative hypothesis is:
H1 = The blind spot camera does have an effect on straddle carrier driver
perceived workload when driving forward
The null hypothesis is tested with a two-tailed Mann-Whitney U test. There was a statistically significant
difference in the scores for the control group (M=33.5) and the treatment group (M=10) conditions; (Mann–
Whitney U = 180.0, p<0.01, two-tailed). Therefore the null hypothesis is rejected and the alternative hypothesis is
accepted:
� H0 = The blind spot camera will have no effect on straddle carrier driver perceived workload when driving
forward
� H1 = The blind spot camera does have an effect on straddle carrier driver perceived workload when driving
forward
This means that the blind spot camera reduces perceived workload. Apparently the effect of continuous available
information is stronger than the probability of data overload.
Conclusion
Since the blind spot camera significantly reduces perceived workload, it is assumed that a blind spot camera
reduces workload in a real life situation when driving forward. These results indicate that data overload is not a
problem of the blind spot camera. Workload reduction means that the driver has more attentional supply left for
other attention demanding goals or cues which contributes to the increase of SA. The extra attentional supply
can also be used to improve global SA attributes, such as vehicle state and destination information.
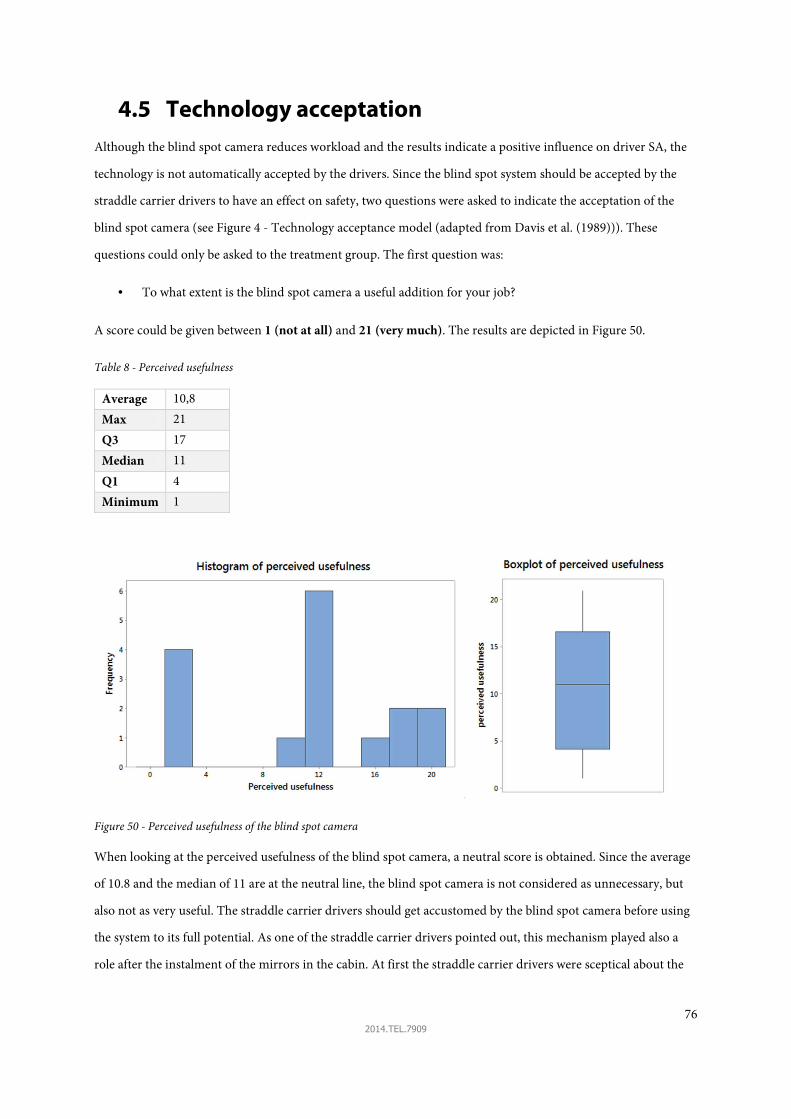
76 2014.TEL.7909
4.5 Technology acceptation Although the blind spot camera reduces workload and the results indicate a positive influence on driver SA, the
technology is not automatically accepted by the drivers. Since the blind spot system should be accepted by the
straddle carrier drivers to have an effect on safety, two questions were asked to indicate the acceptation of the
blind spot camera (see Figure 4 - Technology acceptance model (adapted from Davis et al. (1989))). These
questions could only be asked to the treatment group. The first question was:
• To what extent is the blind spot camera a useful addition for your job?
A score could be given between 1 (not at all) and 21 (very much). The results are depicted in Figure 50.
Table 8 - Perceived usefulness
Average 10,8
Max 21
Q3 17
Median 11
Q1 4
Minimum 1
Figure 50 - Perceived usefulness of the blind spot camera
When looking at the perceived usefulness of the blind spot camera, a neutral score is obtained. Since the average
of 10.8 and the median of 11 are at the neutral line, the blind spot camera is not considered as unnecessary, but
also not as very useful. The straddle carrier drivers should get accustomed by the blind spot camera before using
the system to its full potential. As one of the straddle carrier drivers pointed out, this mechanism played also a
role after the instalment of the mirrors in the cabin. At first the straddle carrier drivers were sceptical about the

77 2014.TEL.7909
mirrors, however at a later stage the usefulness of the mirrors was admitted. For some, the mirrors are now
indispensable.
After the experiment some straddle carriers pointed out that the blind spot camera could be very useful,
especially when novice drivers are trained to operate with the blind spot camera. Drivers indicated that
familiarization with the blind spot camera is probably an important factor in the rated usefulness. This indicates
that the learning curve plays a role in the acceptation of the blind spot camera.
It seems however difficult for an experienced driver to adapt a new technology. This is confirmed by the
statistical significant negative correlation between the perceived ease of use of the blind spot system and a
straddle carrier driver´s age (r(29) = -0.52, p <0.05). This is probably due to the fact that it is hard to change
driving habits. Although a correlation with years of experience seems more logical, this correlation was not
significant (p<0.10).
The second question was:
• To what extent do you rate the ease of use of the blind spot camera?
A score could be given between 1 (not at all) and 21 (very much). The results are depicted in Figure 51.
Table 9 - Perceived ease of use
Average 12,8
Max 21
Q3 17
Median 11
Q1 11
Minimum 1,5
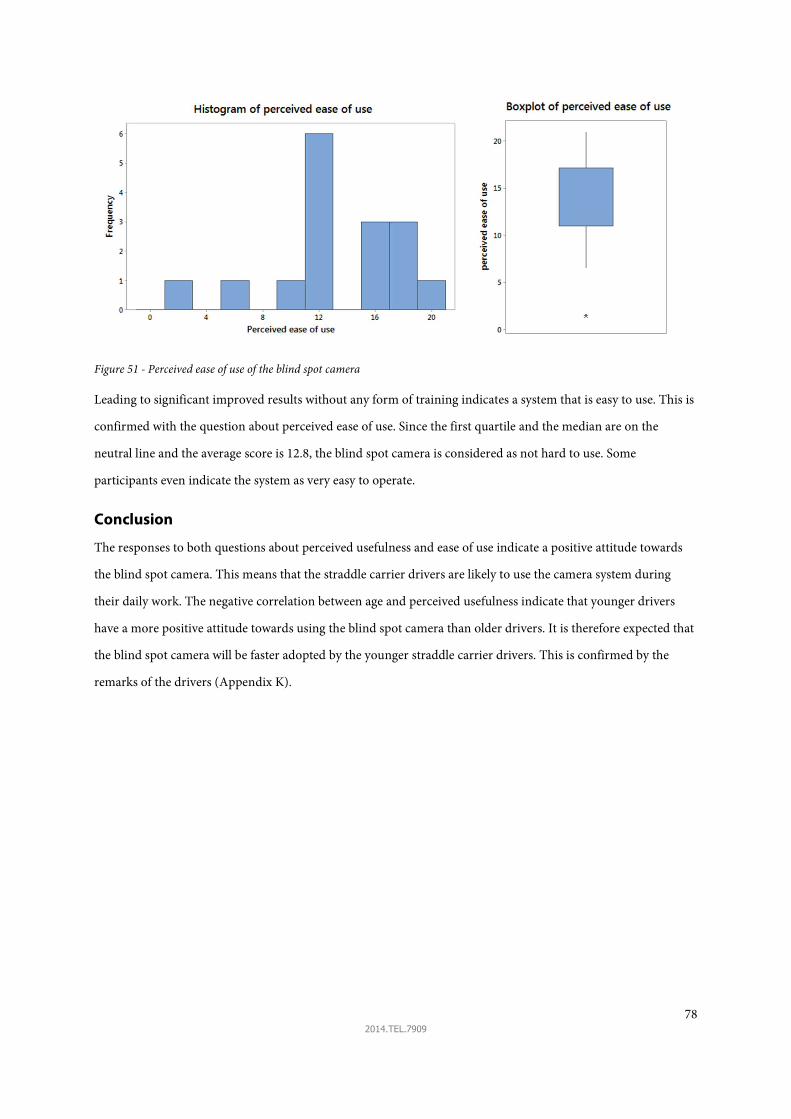
78 2014.TEL.7909
Figure 51 - Perceived ease of use of the blind spot camera
Leading to significant improved results without any form of training indicates a system that is easy to use. This is
confirmed with the question about perceived ease of use. Since the first quartile and the median are on the
neutral line and the average score is 12.8, the blind spot camera is considered as not hard to use. Some
participants even indicate the system as very easy to operate.
Conclusion
The responses to both questions about perceived usefulness and ease of use indicate a positive attitude towards
the blind spot camera. This means that the straddle carrier drivers are likely to use the camera system during
their daily work. The negative correlation between age and perceived usefulness indicate that younger drivers
have a more positive attitude towards using the blind spot camera than older drivers. It is therefore expected that
the blind spot camera will be faster adopted by the younger straddle carrier drivers. This is confirmed by the
remarks of the drivers (Appendix K).

79 2014.TEL.7909
5. Conclusions
The main research question can now be answered to conclude this research. The main research question was:
How to increase situation awareness of a straddle carrier driver to reduce the probability of a
carrier-carrier collision caused by the blind spot?
First, this research identified the situations in which a collision occurred due to a driver who was unaware of the
other straddle carrier. Almost all of these collisions occurred during forward driving. The front-end blind spot of
the straddle carrier driver towards the port side when driving forward was identified as the main problem. The
blind spot impedes easy detection of the other straddle carrier which sometimes leads to a collision due to one of
the escalation factors.
This research focussed on preventing a collision in an early stage by enabling the driver to stay in his comfort
zone. After analysing the information needs five concepts were developed to increase driver’s SA by providing a
tool to assist the driver in his decision making process. The camera system was found to be the most optimal
concept. This concept was then tested with an experiment to determine whether the blind spot camera increases
SA or not. In two situations the blind spot camera led to significantly increased SA. These are:
• Driving away from the quay crane;
Figure 52 – Situation 1 and 7, left: current driver view, right: camera view
• Driving from stack with high spreader;
Figure 53 – Situation 4, left: current driver view, right: camera view

80 2014.TEL.7909
Referring to Figure 1, it is plausible that the probability of a SC-SC collision in these situations will be reduced by
the blind spot camera, since increased SA reduces the probability of a human error. The decrease of this
probability leads to a higher safety level of the container terminal.
The blind spot camera seems to be effective in increasing SA in situations where the straddle carrier trajectories
are perpendicular, although the results of situation 6 could not confirm this. This is probably due to the backlight
of the scene. Further research should investigate whether this indeed is the cause of the small difference in driver
SA and how to increase contrast in case of a backlit scene. Therefore it cannot be concluded that for all situations
where the driver leaves the container stack, SA will be increased by the blind spot camera.
The blind spot camera also decreases perceived workload which indicates that the risk of data overload by a
camera monitor is not a problem in the case of a blind spot problem. The workload reduction results in more
attentional supply for other demanding goals or cues which contributes to global SA.
By evaluating technology acceptance indicators and driver remarks it is expected that the blind spot camera will
be accepted -and thus used- by the younger straddle carrier drivers. It is however uncertain whether the older
and experienced straddle carrier drivers will use the blind spot camera. Some drivers indicated that the
acceptation is dependent on the familiarization with the blind spot camera. This indicates that the learning curve
plays a role in the acceptation of the blind spot camera. At least the drivers should be instructed how and when
the camera should be used to ensure that the camera will be correctly used.
These findings are applicable to straddle carriers with impaired sight towards the port side of the straddle carrier.

81 2014.TEL.7909
6. Discussion
This chapter discusses the results in the light of the choices that are made and provides recommendations for
further research on the basis of this discussion.
Experiment results
The experiment did not take into account an important factor: the learning curve. Therefore the potential of the
blind spot camera system could be underestimated in this experiment. To bias the experiment as little as possible
the treatment group was only informed that they could use a camera system as an extra assistance tool compared
to their real-life jobs. Drivers indicated that familiarization with the blind spot camera could lead to better
results.
Although drivers indicate a fair score to the hazard perception comparability of the experiment setup with a real
straddle carrier, the experimental setup was not highly realistic. This is due to:
• Lack of driver control;
• Lack of 360o view;
• Lack of movement and sound;
• Lack of driver head movement;
• Short task duration;
The drivers had not much time to assess the total situation –i.e. status and location of all objects and ego straddle
carrier-. To incorporate the effects of other factors such as distraction by the on-board computer and fatigue a
high fidelity simulator can be used to assess driver SA.
The videos were shot from a Noell carrier. Since APMTR operates with both Noell and Nelcon carriers, the
question is whether these results are applicable for the Nelcon carriers as well. As the straddle carrier drivers
pointed out, the view is even worse on the Nelcon carrier. Thus these results seems to be applicable for the
Nelcon carrier as well.
The experiment only showed situations during the day. The question is if these results are applicable for the
night as well. Since there are camera systems available with a sensor sensitivity of 0.05 lux it is expected that this
would not impose a problem, because the minimum lighting levels at APMTR is 50 lux for the operational areas.
Increase safety
Although it is possible for the driver to detect the other straddle carrier coming from the starboard side by
moving his head, this is not always done which could lead to a collision –i.e. collision group C (Figure 32)-. The

82 2014.TEL.7909
holes made in straddle carrier do not seem to be sufficient to prevent a collision. Therefore further research
should be done how to increase ergonomics to increase detectability of a straddle carrier emerging from
starboard side when driving forward. A blind spot camera for this direction could be a promising solution as
well.
For the collisions where the driver is aware of the other straddle carrier, the ‘unaware of geometry’ is a large
subgroup of these minor accidents. Research should be done how to minimize these collisions. It is a possibility
that the blind spot camera could serve for this purpose as well.
SC-SC collision risk could also be reduced by reducing the impact of a collision. However, since a straddle carrier
turnover –i.e. a possible consequence of a SC-SC collision- is very expensive (Jones, 2007) and hard to prevent
injury due to the operating height of the driver, it is the best choice to prevent a SC-SC collision in the first place.
The risk of a SC-SC can be further reduced by implementing passive safety features like airbags and oblige the
use of seatbelts. Seatbelts do however prevent the driver to move freely in his seat which could severely decrease
safety since looking over the shoulder is hampered. This decreases the probability of detecting the other SC in
time.
Since the blind spot camera is not a guarantee that driver errors will be prevented, a decrease in SC-SC collisions
cannot be guaranteed. However backward driving –i.e. a clear direct view-, does not cause any SC-SC collision.
This indicates that when the driver has overview of the situation –i.e. a high level of SA-, human errors leading to
SC-SC collisions are abundant. The camera monitor is however not a complete replacement for direct view since
it lacks for example depth perception. This reduces the signal/noise ratio compared to direct view. Kampen and
Schoon (1999) indicated this efficiency for blind spot cameras in trucks as 60%, but this was arbitrarily
determined. Therefore the efficiency of a blind spot camera should be investigated.
An automatic braking system could reduce this uncertainty. It can reduce the effect of human error by reducing
the severity of a collision. Such a system should be highly reliable and thus will be costly. However, the question
is whether such an expensive system is still needed when the driver is assisted to obtain high levels of SA leading
to a reduced probability of SC-SC collisions. Also the effect on the drivers should be investigated since it could
induce automation misuse. A solution could be found in the field of haptic feedback in the gas pedal.
Another way of increasing safety is to minimize the effect of the escalation factor (see Table 12 in appendix C). A
prominent factor of inattention seems to be the on-board computer. As several drivers pointed out, the visibility
of the information on the screen is bad. Especially on sunny days, the screen’s contrast is a problem. The
perception of this information –i.e. container location- should be enhanced to enable quick intermediate checks.
This should minimize the distraction time and enable more attentional supply for driving. A solution could be
found in changing the interface.

83 2014.TEL.7909
SA
The SA-oriented design method developed by Endsley had to be adjusted for this blind spot problem, since the
original method would have been too comprehensive. The original method focuses on data overload while the
blind spot creates a problem of missing data. By adding an accident analysis phase before this method and by
only focussing on one driver goal, the total analysis could be done more efficient. This has however the
consequence that the SA of other goals might degrade. In other words, global SA may be reduced. Since driving
and avoiding collisions is the main goal of the straddle carrier driver, ignoring the other driver goals in this
analysis is not regarded as a problem. This is confirmed by the reduction in workload which suggests that the
blind spot camera provides more attentional supply to these other goals than without this system.
SA should also be the implemented in straddle carrier design, by implementing a user-centred design strategy. It
is likely that this strategy would have prevented the collisions that occurred due to the blind spot in the port side
of the straddle carrier driver.
Blind spot camera
To further extend this research of the blind spot camera and to extend the effect on driver SA the following steps
should be taken:
• Do a field test with a straddle carrier equipped with a blind spot camera to ensure real life performance
–e.g. light sensitivity during the night and reflection of the monitor in the cabin-;
• Determine the optimal camera and monitor configuration and install on straddle carriers;
• Provide driver training or instructions when and how to use the blind spot camera;
• Investigate whether a bounding box on the monitor around the straddle carrier could increase detection
by the straddle carrier driver;

84 2014.TEL.7909
References
A.P. Moller - Maersk Group. Triple-E Vessels. Retrieved October 24, 2014, from
http://www.maersktechnology.com/stories/stories/pages/triple-evessels.aspx
American Association of Port Authorities (AAPA). (2012). World port rankings 2012. http://aapa.files.cms-
plus.com/Statistics/WORLD%20PORT%20RANKINGS%202012.pdf
Argenta, C., Murphy, A., Hinton, J., Cook, J., Sherrill, T., & Snarski, S. (2010). Graphical user interface concepts
for tactical augmented reality. Paper presented at the SPIE Defense, Security, and Sensing.
Borges, P. V. K., Zlot, R., & Tews, A. (2013). Integrating Off-Board Cameras and Vehicle On-Board Localization
for Pedestrian Safety. IEEE Transactions on Intelligent Transportation Systems, 14(2).
Böse, J. W. (2011). Handbook of terminal planning (Vol. 49): Springer.
Bostelman, R., Teizer, J., Ray, S. J., Agronin, M., & Albanese, D. (2014). Methods for improving visibility
measurement standards of powered industrial vehicles. Safety science, 62, 257-270.
Broggi, A., Medici, P., & Porta, P. P. (2007). StereoBox: a robust and efficient solution for automotive short-range
obstacle detection. EURASIP Journal on Embedded Systems, 2007(1), 6-6.
Campbell, J. L., Richard, C. M., Brown, J. L., & McCallum, M. (2007). Crash warning system interfaces: human
factors insights and lessons learned: US Department of Transportation, National Highway Traffic Safety
Administration.
Chen, F., Wang, M., & Duan, L. (2014). Chapter 10 - Letting Drivers Know What is Going on in Traffic. In Y. C.
Li (Ed.), Advances in Intelligent Vehicles (pp. 291-318). Boston: Academic Press.
Chun, J., Lee, I., Park, G., Seo, J., Choi, S., & Han, S. H. (2013). Efficacy of haptic blind spot warnings applied
through a steering wheel or a seatbelt. Transportation research part F: traffic psychology and behaviour,
21, 231-241.
Davis, F. D., Bagozzi, R. P., & Warshaw, P. R. (1989). User acceptance of computer technology: a comparison of
two theoretical models. Management science, 35(8), 982-1003.
de Lange, C. C. (2014). How to decrease straddle carrier traffic risk from a routing perspective? (Master), Delft
University of Technology, Delft.
De Lausnay, S., Standaert, T., Stevens, N., Joseph, W., Verloock, L., Goeminne, F., & Martens, L. (2011). Zigbee as
a means to reduce the number of blind spot incidents of a truck. Paper presented at the Personal Indoor
and Mobile Radio Communications (PIMRC), 2011 IEEE 22nd International Symposium on.
de Winter, J. (2012). WB2404: Man-machine systems - Lecture 5: Human-computer interaction / Automation.
Personal collection of Joost de Winter, Delft University of Technology, Delft.
Durrant-Whyte, H., Pagac, D., Rogers, B., Stevens, M., & Nelmes, G. (2007). Field and service applications-an
autonomous straddle carrier for movement of shipping containers-from research to operational
autonomous Systems. Robotics & Automation Magazine, IEEE, 14(3), 14-23.
Ehlgen, T., Pajdla, T., & Ammon, D. (2008). Eliminating blind spots for assisted driving. Intelligent
Transportation Systems, IEEE Transactions on, 9(4), 657-665.
Endsley, M. R. (1988). Design and evaluation for situation awareness enhancement. Paper presented at the
Proceedings of the Human Factors and Ergonomics Society Annual Meeting.
Endsley, M. R. (1995). Toward a theory of situation awareness in dynamic systems. Human Factors: The Journal
of the Human Factors and Ergonomics Society, 37(1), 32-64.
Endsley, M. R. (2000). Theoretical underpinnings of situation awareness: A critical review. Situation awareness
analysis and measurement, 3-32.
Endsley, M. R., Bolté, B., & Jones, D. G. (2012). Designing for situation awareness: An approach to user-centered
design: CRC Press.
European commision. eCall: Time saved = lives saved. Retrieved October 26, 2014, from
http://ec.europa.eu/digital-agenda/ecall-time-saved-lives-saved

85 2014.TEL.7909
Flach, J. M. (1995). Situation awareness: Proceed with caution. Human Factors: The Journal of the Human
Factors and Ergonomics Society, 37(1), 149-157.
Glancey, J. (2006). Failure Analysis Methods. Available from University of Delaware
http://research.me.udel.edu/~jglancey/FailureAnalysis.pdf
Goossenaerts, K., & de Lie, S. (2004, 13-04-2004). Haven betreurt derde dode. Nieuwsblad. Retrieved from
http://www.nieuwsblad.be/article/detail.aspx?articleid=GK759CPM
Harms-Ringdahl, L. (2013). Guide to safety analysis for accident prevention. IRS Riskhantering AB.
Hart, S. G. (2006). NASA-task load index (NASA-TLX); 20 years later. Paper presented at the Proceedings of the
Human Factors and Ergonomics Society Annual Meeting.
Heeger, D. (1998). Signal Detection Theory Handout. Retrieved November 3, 2014, from http://www-
psych.stanford.edu/~lera/psych115s/notes/signal/
Ho, Y.-C. (2000). A dynamic-zone strategy for vehicle-collision prevention and load balancing in an AGV system
with a single-loop guide path. Computers in Industry, 42(2), 159-176.
Hoedemaeker, D., Doumen, M., de Goede, M., Hogema, J., Brouwer, R., & Wennemers, A. (2010). Modelopzet
voor Dodehoek Detectie en Signalerings Systemen (DDSS).
Jones, L. (2007). TT Club identifies where to focus on loss prevention.
Jones, L. (2009). Human error – still the major factor Baltic Transport Journal, 1.
Jongeneel, C. (2014). Op naar nul verkeersdoden. Technisch weekblad.
Kalmar. Kalmar Straddle Carrier. http://www.podshop.se/content/12/opensearchresult.aspx?file=SB-SCK-EN-
WW_L.pdf
Kampen, L. v., & Schoon, C. (1999). De veiligheid van vrachtauto’s; Een ongevals-en maatregelenanalyse in
opdracht van Transport en Logistiek Nederland.[The safety of lorries; An accident and measures
analysis commissioned by the Dutch Transport Operators Association].
Lockheed Martin. Unprecedented Situational Awareness. Retrieved June 20, 2014, from
https://www.f35.com/about/capabilities/helmet
Mahar, D. J., & Wilbur, J. W. (1990). Fault Tree Analysis Application Guide: The Center.
Marks, E., & Teizer, J. (2012). Safety first: real-time proactive equipment operator and ground worker warning
and alert system in steel manufacturing. Iron and Steel Technology, 9(10), 56.
Marshall, D. C., Lee, J. D., & Austria, P. A. (2007). Alerts for in-vehicle information systems: Annoyance,
urgency, and appropriateness. Human Factors: The Journal of the Human Factors and Ergonomics
Society, 49(1), 145-157.
Matsubara, F., Itoh, M., & Inagaki, T. (2012). Effectiveness of a blind spot visualization system with a video camera
for safe lane changes. Paper presented at the SICE Annual Conference (SICE), 2012 Proceedings of.
Meyer, J. (2001). Effects of warning validity and proximity on responses to warnings. Human Factors: The
Journal of the Human Factors and Ergonomics Society, 43(4), 563-572.
Möhring, R. H., Köhler, E., Gawrilow, E., & Stenzel, B. (2005). Conflict-free real-time AGV routing. Paper
presented at the Operations Research Proceedings 2004.
Noell Mobile Systems GmbH. (2008). Bestuurdershandboek.
Parasuraman, R., Sheridan, T. B., & Wickens, C. D. (2000). A model for types and levels of human interaction
with automation. Systems, Man and Cybernetics, Part A: Systems and Humans, IEEE Transactions on,
30(3), 286-297.
Patrick, J., & James, N. (2004). A task-oriented perspective of situation awareness. A cognitive approach to
situation awareness: theory and application, 61-81.
Patrick, J., & Morgan, P. L. (2010). Approaches to understanding, analysing and developing situation awareness.
Theoretical Issues in Ergonomics Science, 11(1-2), 41-57.
Racine, D. P., Cramer, N. B., & Zadeh, M. H. (2010). Active blind spot crash avoidance system: A haptic solution to
blind spot collisions. Paper presented at the Haptic Audio-Visual Environments and Games (HAVE),
2010 IEEE International Symposium on.
Reveliotis, S. A. (2000). Conflict resolution in AGV systems. IIE Transactions, 32(7), 647-659.
Roozenburg, N. F., & Eekels, J. (1991). Produktontwerpen, structuur en methoden: Lemma.

86 2014.TEL.7909
Ruff, T. (2000a). Test results of collision warning systems for surface mining dump trucks.
Ruff, T. (2000b). Test results of collision warning systems on off-highway dump trucks: phase 2: US Department of
Health and Human Services, Public Health Service, Centers for Disease Control and Prevention,
National Institute for Occupational Safety and Health, Pittsburgh Research Laboratory.
Ruff, T. (2001). Monitoring blind spots-A major concern for haul trucks. E&MJ-ENGINEERING AND MINING
JOURNAL, 202(12).
Ruff, T. (2003a). Evaluation of systems to monitor blind areas behind trucks used in road construction and
maintenance: phase 1.
Ruff, T. (2003b). New technology to monitor blind areas near surface mining equipment. Paper presented at the
Industry Applications Conference, 2003. 38th IAS Annual Meeting. Conference Record of the.
Ruff, T. (2006). Evaluation of a radar-based proximity warning system for off-highway dump trucks. Accident
Analysis & Prevention, 38(1), 92-98.
Ruff, T., & Holden, T. (2003). Preventing collisions involving surface mining equipment: a GPS-based approach.
Journal of Safety Research, 34(2), 175-181.
Ruff, T. M. (2007). Recommendations for evaluating and implementing proximity warning systems on surface
mining equipment: Department of Health and Human Services, Public Health Serivce, Centers for
Disease Control and Prevention, National Institute for Occupational Safety and Health, Spokane
Research Laboratory.
Salmon, P. M., & Stanton, N. A. (2013). Situation awareness and safety: Contribution or confusion? Situation
awareness and safety editorial. Safety science, 56(Complete), 1-5.
Sengupta, R., Rezaei, S., Shladover, S. E., Cody, D., Dickey, S., & Krishnan, H. (2007). Cooperative collision
warning systems: Concept definition and experimental implementation. Journal of Intelligent
Transportation Systems, 11(3), 143-155.
Shahar, A., Alberti, C. F., Clarke, D., & Crundall, D. (2010). Hazard perception as a function of target location
and the field of view. Accident Analysis & Prevention, 42(6), 1577-1584.
Shaout, A., Colella, D., & Awad, S. (2011). Advanced driver assistance systems-past, present and future. Paper
presented at the Computer Engineering Conference (ICENCO), 2011 Seventh International.
Taylor, R. (1990). Situational Awareness Rating Technique(SART): The development of a tool for aircrew
systems design. AGARD, Situational Awareness in Aerospace Operations 17 p(SEE N 90-28972 23-53).
TNO. (2014). Twelve cities, zero accidents. Retrieved October 26, 2014, from
http://www.intertraffic.com/intertraffic-
amsterdam/Documents/TNO%20Presentation%2012.00%20Twelve%20cities,%20zero%20accidents%2
0.pdf
Underwood, G., Crundall, D., & Chapman, P. (2011). Driving simulator validation with hazard perception.
Transportation research part F: traffic psychology and behaviour, 14(6), 435-446.
van Beuningen, J. (2013). Automobilist het snelst op plaats bestemming. Retrieved June 06, 2014, from
http://www.cbs.nl/nl-NL/menu/themas/verkeer-vervoer/publicaties/artikelen/archief/2013/2013-ovin-
art.htm
Van Gijssel, A. (2013). Assisting driver sovereignty: a fail-safe design approach to driver distraction. (PhD), Delft
University of Technology, Delft.
Vlakveld, W. P. (2014). A comparative study of two desktop hazard perception tasks suitable for mass testing in
which scores are not based on response latencies. Transportation research part F: traffic psychology and
behaviour, 22, 218-231.
Wetton, M., Horswill, M., Hatherly, C., Wood, J. M., Pachana, N. A., & Anstey, K. J. (2010). The development
and validation of two complementary measures of drivers’ hazard perception ability. Accident Analysis
& Prevention, 42(4), 1232-1239.
Wetton, M. A., Hill, A., & Horswill, M. S. (2011). The development and validation of a hazard perception test for
use in driver licensing. Accident Analysis & Prevention, 43(5), 1759-1770.
Wilschut, E., Meijering, V., Merkus, B., IJsselsteijn, W., & Ham, J. (2010). Blind spot Detection and Warning
Systems (BDWS): concepts of warning.

87 2014.TEL.7909
Yoshida, T., Jo, K., Minamizawa, K., Nii, H., Kawakami, N., & Tachi, S. (2008). Transparent cockpit: Visual
assistance system for vehicle using retro-reflective projection technology. Paper presented at the Virtual
Reality Conference, 2008. VR'08. IEEE.

88 2014.TEL.7909

89 2014.TEL.7909
Appendix A: Scientific Research Paper
A blind spot camera to reduce the probability of straddle carrier collisions
R.F.H. van den Heuvel1, W.W.A. Beelaerts van Blokland1, A. Muller2, B. Hiemstra2, G. Lodewijks1
1Department Marine and Transport Technology, Faculty of Mechanical Maritime and Materials Engineering, Delft
University of Technology, Delft, The Netherlands
2APM Terminals Rotterdam B.V., Rotterdam, The Netherlands
ABSTRACT
One of the safety problems of a container terminal operated by manned straddle carriers are collisions between
the straddle carriers. A major cause of these collisions is the blind spot of the straddle carrier which reduces sight
and overview of the straddle carrier driver. The purpose of this study was if this sight and overview could be
increased by a blind spot camera. A hazard perception test was done to determine whether the blind spot camera
increased the situation awareness of a straddle carrier driver or not. The experiment was executed by means of
video images of different traffic situations where the straddle carrier drivers were asked to respond with a
braking action. The drivers were also questioned about their situation awareness in each situation. The results
were compared to a control group which had to execute the same experiment but without the help of a blind spot
camera. The results show a significant improvement of situation awareness in the situation when the straddle
carrier leaves the quay crane area and in the situation when the straddle carrier is leaving the container stack with
a top-lifted container. The camera also significantly reduced perceived workload indicating that the camera
monitor does not cause data overload. Since the blind spot camera increases driver situation awareness in the
situations where a collision caused by the blind spot is likely, the probability of human errors is reduced. This
decreases the probability of a collision between straddle carriers which decreases collision risk. The reduction of
collision risk results in increased container terminal safety.
INTRODUCTION
A container terminal operated by manned straddle
carriers is exposed to the risk of a collision between
two straddle carriers. To reduce this risk either the
probability of the collision or the impact of the
collision should be reduced. To prevent a collision –
i.e. reduce the probability of a collision-, the causes
of a collision should be eliminated. By analysing
accident reports from APM Terminals Rotterdam
of the past 10 years it turns out that the blind spot
of a straddle carrier is a major cause of these
collisions. The blind spot is caused by structural
interference of the straddle carrier which reduces
the sight of a straddle carrier driver when driving
forward.
Figure 1 - Driving directions of a straddle carrier
Figure 2 – Driver position, looking to the right when
driving forward
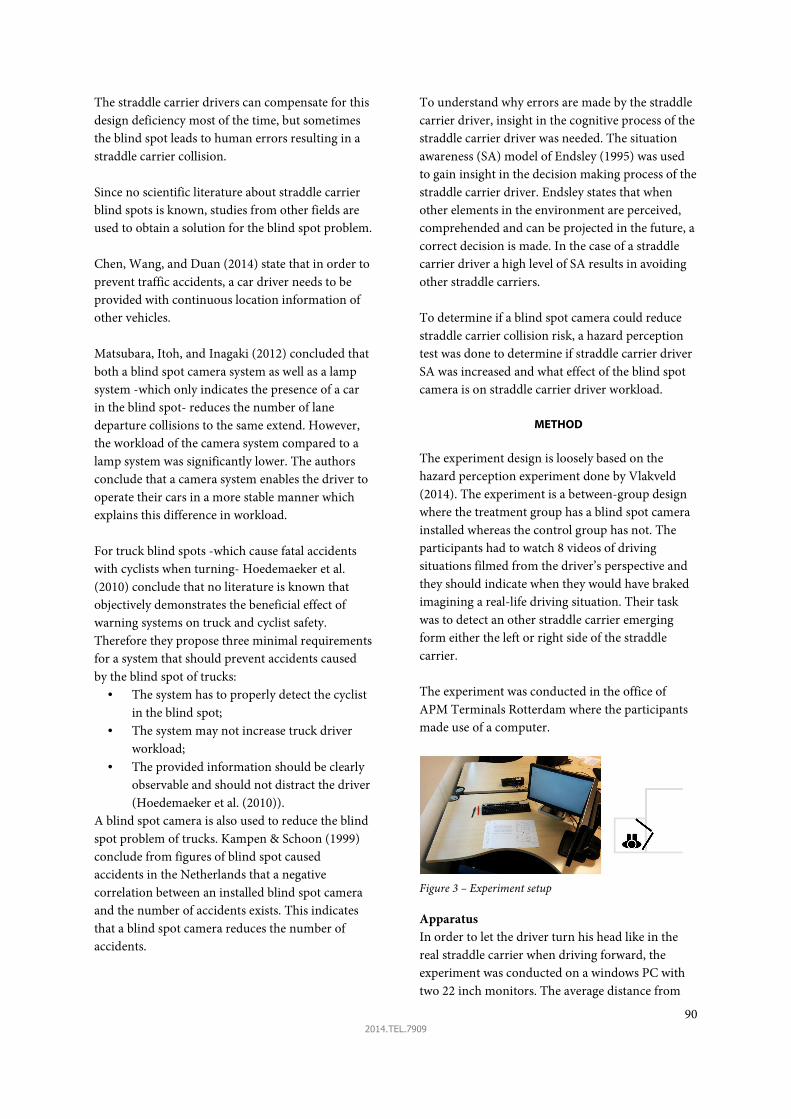
90 2014.TEL.7909
The straddle carrier drivers can compensate for this
design deficiency most of the time, but sometimes
the blind spot leads to human errors resulting in a
straddle carrier collision.
Since no scientific literature about straddle carrier
blind spots is known, studies from other fields are
used to obtain a solution for the blind spot problem.
Chen, Wang, and Duan (2014) state that in order to
prevent traffic accidents, a car driver needs to be
provided with continuous location information of
other vehicles.
Matsubara, Itoh, and Inagaki (2012) concluded that
both a blind spot camera system as well as a lamp
system -which only indicates the presence of a car
in the blind spot- reduces the number of lane
departure collisions to the same extend. However,
the workload of the camera system compared to a
lamp system was significantly lower. The authors
conclude that a camera system enables the driver to
operate their cars in a more stable manner which
explains this difference in workload.
For truck blind spots -which cause fatal accidents
with cyclists when turning- Hoedemaeker et al.
(2010) conclude that no literature is known that
objectively demonstrates the beneficial effect of
warning systems on truck and cyclist safety.
Therefore they propose three minimal requirements
for a system that should prevent accidents caused
by the blind spot of trucks:
• The system has to properly detect the cyclist
in the blind spot;
• The system may not increase truck driver
workload;
• The provided information should be clearly
observable and should not distract the driver
(Hoedemaeker et al. (2010)).
A blind spot camera is also used to reduce the blind
spot problem of trucks. Kampen & Schoon (1999)
conclude from figures of blind spot caused
accidents in the Netherlands that a negative
correlation between an installed blind spot camera
and the number of accidents exists. This indicates
that a blind spot camera reduces the number of
accidents.
To understand why errors are made by the straddle
carrier driver, insight in the cognitive process of the
straddle carrier driver was needed. The situation
awareness (SA) model of Endsley (1995) was used
to gain insight in the decision making process of the
straddle carrier driver. Endsley states that when
other elements in the environment are perceived,
comprehended and can be projected in the future, a
correct decision is made. In the case of a straddle
carrier driver a high level of SA results in avoiding
other straddle carriers.
To determine if a blind spot camera could reduce
straddle carrier collision risk, a hazard perception
test was done to determine if straddle carrier driver
SA was increased and what effect of the blind spot
camera is on straddle carrier driver workload.
METHOD
The experiment design is loosely based on the
hazard perception experiment done by Vlakveld
(2014). The experiment is a between-group design
where the treatment group has a blind spot camera
installed whereas the control group has not. The
participants had to watch 8 videos of driving
situations filmed from the driver’s perspective and
they should indicate when they would have braked
imagining a real-life driving situation. Their task
was to detect an other straddle carrier emerging
form either the left or right side of the straddle
carrier.
The experiment was conducted in the office of
APM Terminals Rotterdam where the participants
made use of a computer.
Figure 3 – Experiment setup
Apparatus
In order to let the driver turn his head like in the
real straddle carrier when driving forward, the
experiment was conducted on a windows PC with
two 22 inch monitors. The average distance from
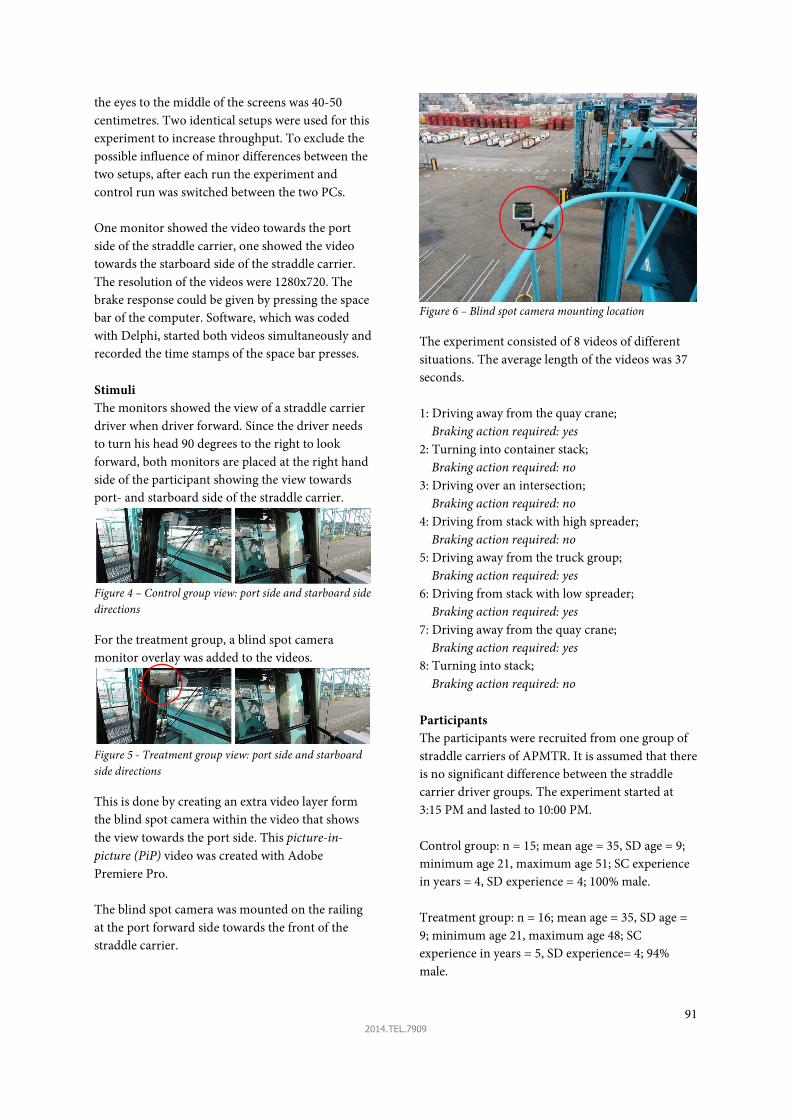
91 2014.TEL.7909
the eyes to the middle of the screens was 40-50
centimetres. Two identical setups were used for this
experiment to increase throughput. To exclude the
possible influence of minor differences between the
two setups, after each run the experiment and
control run was switched between the two PCs.
One monitor showed the video towards the port
side of the straddle carrier, one showed the video
towards the starboard side of the straddle carrier.
The resolution of the videos were 1280x720. The
brake response could be given by pressing the space
bar of the computer. Software, which was coded
with Delphi, started both videos simultaneously and
recorded the time stamps of the space bar presses.
Stimuli
The monitors showed the view of a straddle carrier
driver when driver forward. Since the driver needs
to turn his head 90 degrees to the right to look
forward, both monitors are placed at the right hand
side of the participant showing the view towards
port- and starboard side of the straddle carrier.
Figure 4 – Control group view: port side and starboard side
directions
For the treatment group, a blind spot camera
monitor overlay was added to the videos.
Figure 5 - Treatment group view: port side and starboard
side directions
This is done by creating an extra video layer form
the blind spot camera within the video that shows
the view towards the port side. This picture-in-
picture (PiP) video was created with Adobe
Premiere Pro.
The blind spot camera was mounted on the railing
at the port forward side towards the front of the
straddle carrier.
Figure 6 – Blind spot camera mounting location
The experiment consisted of 8 videos of different
situations. The average length of the videos was 37
seconds.
1: Driving away from the quay crane;
Braking action required: yes
2: Turning into container stack;
Braking action required: no
3: Driving over an intersection;
Braking action required: no
4: Driving from stack with high spreader;
Braking action required: no
5: Driving away from the truck group;
Braking action required: yes
6: Driving from stack with low spreader;
Braking action required: yes
7: Driving away from the quay crane;
Braking action required: yes
8: Turning into stack;
Braking action required: no
Participants
The participants were recruited from one group of
straddle carriers of APMTR. It is assumed that there
is no significant difference between the straddle
carrier driver groups. The experiment started at
3:15 PM and lasted to 10:00 PM.
Control group: n = 15; mean age = 35, SD age = 9;
minimum age 21, maximum age 51; SC experience
in years = 4, SD experience = 4; 100% male.
Treatment group: n = 16; mean age = 35, SD age =
9; minimum age 21, maximum age 48; SC
experience in years = 5, SD experience= 4; 94%
male.
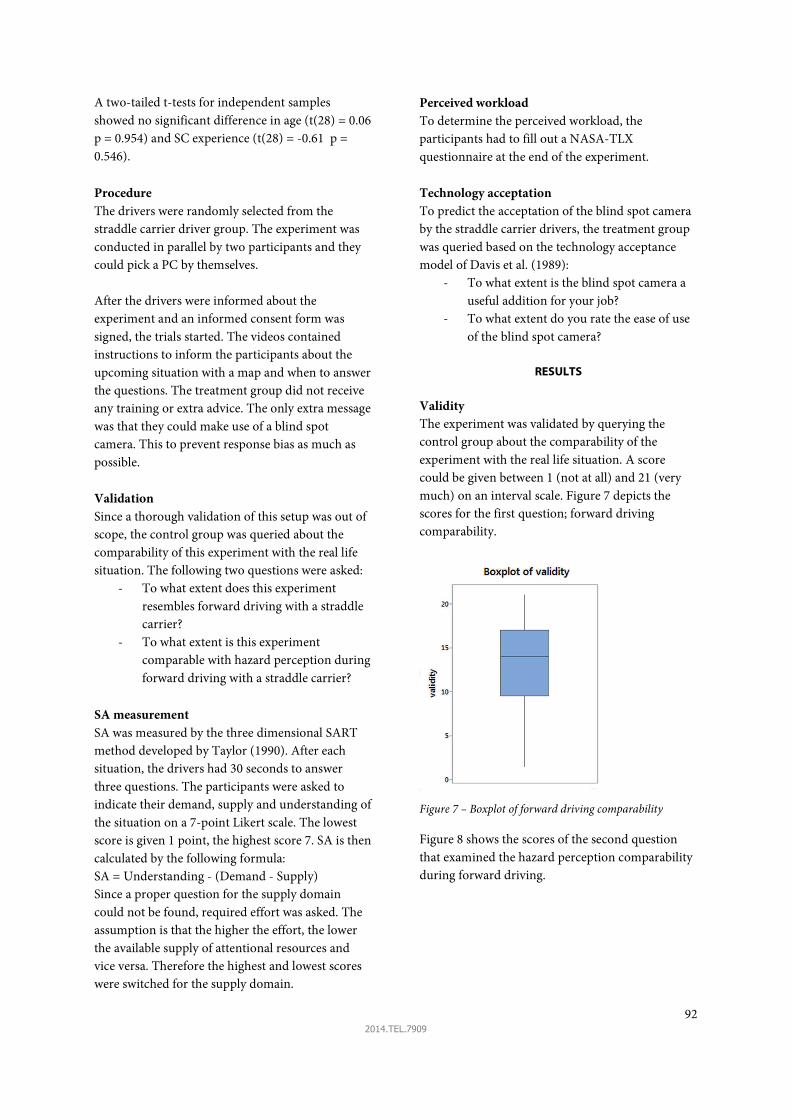
92 2014.TEL.7909
A two-tailed t-tests for independent samples
showed no significant difference in age (t(28) = 0.06
p = 0.954) and SC experience (t(28) = -0.61 p =
0.546).
Procedure
The drivers were randomly selected from the
straddle carrier driver group. The experiment was
conducted in parallel by two participants and they
could pick a PC by themselves.
After the drivers were informed about the
experiment and an informed consent form was
signed, the trials started. The videos contained
instructions to inform the participants about the
upcoming situation with a map and when to answer
the questions. The treatment group did not receive
any training or extra advice. The only extra message
was that they could make use of a blind spot
camera. This to prevent response bias as much as
possible.
Validation
Since a thorough validation of this setup was out of
scope, the control group was queried about the
comparability of this experiment with the real life
situation. The following two questions were asked:
- To what extent does this experiment
resembles forward driving with a straddle
carrier?
- To what extent is this experiment
comparable with hazard perception during
forward driving with a straddle carrier?
SA measurement
SA was measured by the three dimensional SART
method developed by Taylor (1990). After each
situation, the drivers had 30 seconds to answer
three questions. The participants were asked to
indicate their demand, supply and understanding of
the situation on a 7-point Likert scale. The lowest
score is given 1 point, the highest score 7. SA is then
calculated by the following formula:
SA = Understanding - (Demand - Supply)
Since a proper question for the supply domain
could not be found, required effort was asked. The
assumption is that the higher the effort, the lower
the available supply of attentional resources and
vice versa. Therefore the highest and lowest scores
were switched for the supply domain.
Perceived workload
To determine the perceived workload, the
participants had to fill out a NASA-TLX
questionnaire at the end of the experiment.
Technology acceptation
To predict the acceptation of the blind spot camera
by the straddle carrier drivers, the treatment group
was queried based on the technology acceptance
model of Davis et al. (1989):
- To what extent is the blind spot camera a
useful addition for your job?
- To what extent do you rate the ease of use
of the blind spot camera?
RESULTS
Validity
The experiment was validated by querying the
control group about the comparability of the
experiment with the real life situation. A score
could be given between 1 (not at all) and 21 (very
much) on an interval scale. Figure 7 depicts the
scores for the first question; forward driving
comparability.
Figure 7 – Boxplot of forward driving comparability
Figure 8 shows the scores of the second question
that examined the hazard perception comparability
during forward driving.
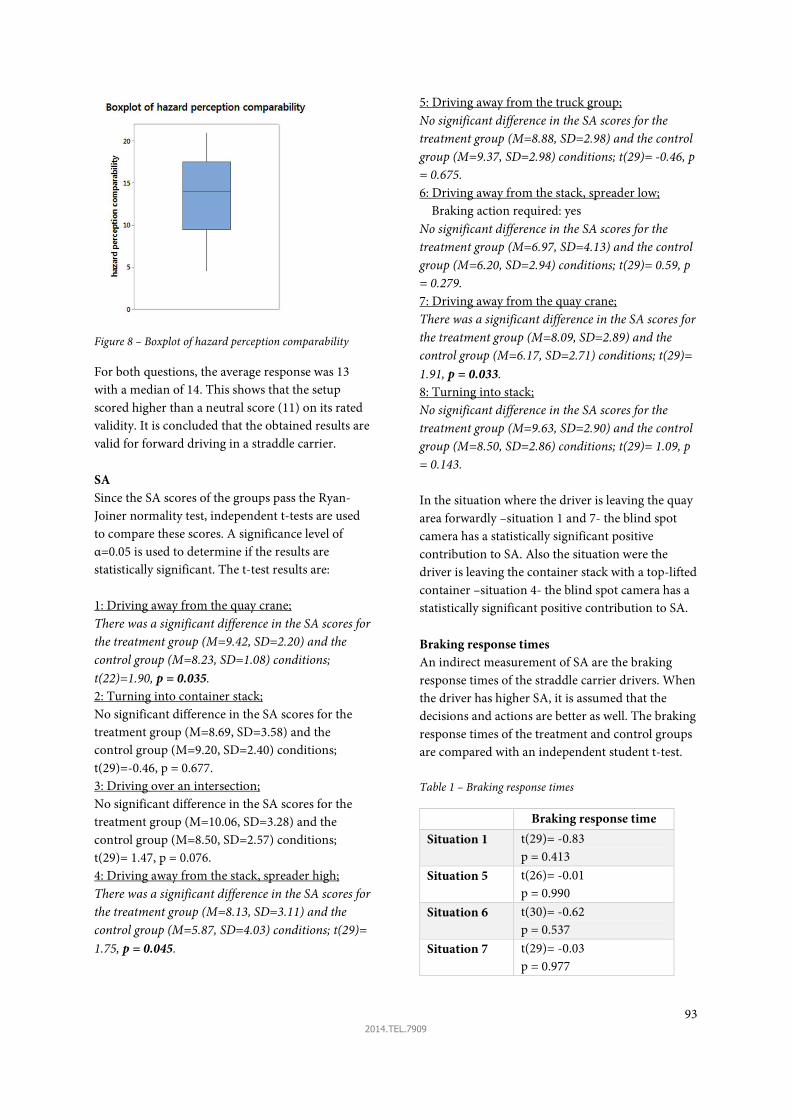
93 2014.TEL.7909
Figure 8 – Boxplot of hazard perception comparability
For both questions, the average response was 13
with a median of 14. This shows that the setup
scored higher than a neutral score (11) on its rated
validity. It is concluded that the obtained results are
valid for forward driving in a straddle carrier.
SA
Since the SA scores of the groups pass the Ryan-
Joiner normality test, independent t-tests are used
to compare these scores. A significance level of
α=0.05 is used to determine if the results are
statistically significant. The t-test results are:
1: Driving away from the quay crane;
There was a significant difference in the SA scores for
the treatment group (M=9.42, SD=2.20) and the
control group (M=8.23, SD=1.08) conditions;
t(22)=1.90, p = 0.035.
2: Turning into container stack;
No significant difference in the SA scores for the
treatment group (M=8.69, SD=3.58) and the
control group (M=9.20, SD=2.40) conditions;
t(29)=-0.46, p = 0.677.
3: Driving over an intersection;
No significant difference in the SA scores for the
treatment group (M=10.06, SD=3.28) and the
control group (M=8.50, SD=2.57) conditions;
t(29)= 1.47, p = 0.076.
4: Driving away from the stack, spreader high;
There was a significant difference in the SA scores for
the treatment group (M=8.13, SD=3.11) and the
control group (M=5.87, SD=4.03) conditions; t(29)=
1.75, p = 0.045.
5: Driving away from the truck group;
No significant difference in the SA scores for the
treatment group (M=8.88, SD=2.98) and the control
group (M=9.37, SD=2.98) conditions; t(29)= -0.46, p
= 0.675.
6: Driving away from the stack, spreader low;
Braking action required: yes
No significant difference in the SA scores for the
treatment group (M=6.97, SD=4.13) and the control
group (M=6.20, SD=2.94) conditions; t(29)= 0.59, p
= 0.279.
7: Driving away from the quay crane;
There was a significant difference in the SA scores for
the treatment group (M=8.09, SD=2.89) and the
control group (M=6.17, SD=2.71) conditions; t(29)=
1.91, p = 0.033.
8: Turning into stack;
No significant difference in the SA scores for the
treatment group (M=9.63, SD=2.90) and the control
group (M=8.50, SD=2.86) conditions; t(29)= 1.09, p
= 0.143.
In the situation where the driver is leaving the quay
area forwardly –situation 1 and 7- the blind spot
camera has a statistically significant positive
contribution to SA. Also the situation were the
driver is leaving the container stack with a top-lifted
container –situation 4- the blind spot camera has a
statistically significant positive contribution to SA.
Braking response times
An indirect measurement of SA are the braking
response times of the straddle carrier drivers. When
the driver has higher SA, it is assumed that the
decisions and actions are better as well. The braking
response times of the treatment and control groups
are compared with an independent student t-test.
Table 1 – Braking response times
Braking response time
Situation 1 t(29)= -0.83
p = 0.413
Situation 5 t(26)= -0.01
p = 0.990
Situation 6 t(30)= -0.62
p = 0.537
Situation 7 t(29)= -0.03
p = 0.977

94 2014.TEL.7909
Although the t-values indicate a decrease in braking
response times for situation 1 and 6, neither of the
hypothesis could be rejected since the responses are
not statistically significant. This is probably due to
the fact that the drivers were asked to respond when
they would have braked in a real life scenario. It is
likely that the braking moment for those situations
lies beyond the moment of hazard detection for
both groups.
Perceived workload
The total perceived workload score is calculated
according to the Raw TLX method. This is
calculated by enumerating the six subscales of the
questionnaire. The scores range from 5-100% where
5% is minimal perceived workload and 100% is
maximum perceived workload. For both groups
this is depicted in Figure 9.
Figure 9 - Boxplots of perceived workload of control and
treatment group
There was a statistically significant difference in the
scores for the control group (M=33.5) and the
treatment group (M=10) conditions; (Mann–
Whitney U = 180.0, p<0.01, two-tailed). This means
that the blind spot camera reduces perceived
workload. Apparently the effect of continuous
available information is stronger than the
probability of data overload.
Technology acceptation
The technology acceptation indicators were queried
on the treatment group. A score could be given
between 1 (not at all) and 21 (very much) on an
interval scale.
Figure 10 - Boxplot of perceived usefulness
Figure 11 – Boxplot of perceived ease of use
The responses to both questions about perceived
usefulness and ease of use indicate a positive
attitude towards the blind spot camera. This means
that the straddle carrier drivers are likely to use the
camera system during their daily work.
Some straddle carrier drivers mentioned after their
run that the blind spot camera could be very useful,
especially when novice drivers are trained to
operate with the blind spot camera. It seems
however difficult for an experienced driver to adapt
a new technology. This is confirmed by the
statistical significant negative correlation between
the perceived ease of use of the blind spot system
and a straddle carrier driver´s age (r(29) = -0.52, p
<0.05). This is probably due to the fact that it is
hard to change driving habits. Although a
correlation with years of experience seems more

95 2014.TEL.7909
logical, this correlation was not significant (p<0.10).
DISCUSSION
Since driver SA is increased when leaving the quay
crane area and when leaving the stack with a top-
lifted container, the blind spot camera reduces the
probability of a human error in these common
situations. It is therefore plausible that the
probability of a straddle carrier collision by a
straddle carrier with impaired sight towards the
port side will be reduced by the blind spot camera,
which increases container terminal safety.
The blind spot camera also significantly decreases
perceived workload which indicates that data
overload by a camera monitor is not a problem in
the case of a blind spot problem. The workload
reduction results in more attentional supply for
other demanding goals or cues which contributes to
global SA.
It is expected that the blind spot camera will be
accepted -and thus used- by the younger straddle
carrier drivers. It is however uncertain whether the
older and experienced straddle carrier drivers will
use the blind spot camera.
The experiment did not incorporate an important
factor: the learning curve. Therefore the potential of
the blind spot camera system could be
underestimated in this experiment. To bias the
experiment as little as possible the treatment group
was only informed that they could use a camera
system as an extra assistance tool compared to their
real-life jobs.
The performance could also be overestimated.
Although drivers indicate a fair score to the
comparability of the experiment setup with a real
straddle carrier, the experimental setup was not
highly realistic. This is due to:
• Lack of driver control;
• Lack of 360o view;
• Lack of movement and sound;
• Lack of driver head movement;
• Short task duration;
Therefore the drivers had not much time to assess
the total situation –i.e. status and location of all
objects and ego straddle carrier-. To incorporate the
effects of other factors such as distraction by the on-
board computer and fatigue a high fidelity
simulator can be used to assess driver SA.
The braking response times results implicates that
the drivers did not brake immediately when the
hazard was detected, but waited for the moment
they would have braked in a real life situation. Since
moment is probably not different for both groups,
the results do not differ significantly.
ACKNOWLEDGEMENT
This study was facilitated by APM Terminals
Rotterdam B.V.
References
- Chen, F., Wang, M., & Duan, L. (2014).
Chapter 10 - Letting Drivers Know What is
Going on in Traffic. In Y. C. Li (Ed.),
Advances in Intelligent Vehicles (pp. 291-
318). Boston: Academic Press.
- Davis, F. D., Bagozzi, R. P., & Warshaw, P.
R. (1989). User acceptance of computer
technology: a comparison of two theoretical
models. Management science, 35(8), 982-
1003.
- Endsley, M. R. (1995). Toward a theory of
situation awareness in dynamic systems.
Human Factors: The Journal of the
Human Factors and Ergonomics Society,
37(1), 32-64.
- Hoedemaeker, D., Doumen, M., de Goede,
M., Hogema, J., Brouwer, R., &
Wennemers, A. (2010). Modelopzet voor
Dodehoek Detectie en Signalerings
Systemen (DDSS).
- Kampen, L. v., & Schoon, C. (1999). De
veiligheid van vrachtauto’s; Een ongevals-
en maatregelenanalyse in opdracht van
Transport en Logistiek Nederland.[The
safety of lorries; An accident and measures

96 2014.TEL.7909
analysis commissioned by the Dutch
Transport Operators Association].
- Matsubara, F., Itoh, M., & Inagaki, T.
(2012). Effectiveness of a blind spot
visualization system with a video camera
for safe lane changes. Paper presented at
the SICE Annual Conference (SICE), 2012
Proceedings of.
- Taylor, R. (1990). Situational Awareness
Rating Technique(SART): The development
of a tool for aircrew systems design.
AGARD, Situational Awareness in
Aerospace Operations 17 p(SEE N 90-
28972 23-53).
- Vlakveld, W. P. (2014). A comparative
study of two desktop hazard perception
tasks suitable for mass testing in which
scores are not based on response latencies.
Transportation research part F: traffic
psychology and behaviour, 22, 218-231.

97 2014.TEL.7909
Appendix B: Worldwide straddle carrier operated ports
This list is based on the world port rankings (American Association of Port Authorities (AAPA), 2012) and
satellite images of Google Maps. The port rankings were used to identify the major ports of the world. The
satellite images of Google Maps were used to count the visible straddle carriers in those ports. The satellite
images were retrieved between May 15, 2014 and May 25, 2014. The counts were rounded down for counting
errors. Automated straddle carrier container terminals are not included in this list.
Table 10 – Worldwide straddle carrier operated ports
City Country Number of
straddle carriers City Country
Number of
straddle carriers
Antwerp Belgium >300 Tokyo Japan >20
Hamburg Germany >300 Port Chalmers,
Dunedin
New Zealand >20
Bremen /
Bremerhaven
Germany >200 Thessaloniki Greece >20
Gioia Tauro Italy >100 Marseilles France >20
Rotterdam Netherlands >100 Cape Town South Africa >20
Durban South Africa >100 Hodeidah Yemen >20
New York / New
Jersey
United States >100 Yokohama Japan >20
Le Havre France >100 Montevideo Uruguay >20
Southampton United Kingdom >100 Wilhemshaven Germany >20
Melbourne Australia >50 Kotka Finland >20
Klang Malasyia >50 Aarhus Denmark >20
Hampton Roads United States >50 Rades Tunesia >20
Kingston Jamaica >50 Algeciras - La
Linea
Spain >20
Tacoma United States >50 Keelung Taiwan >20
Barcelona Spain >50 Havana Cuba >20
Tilbury United Kingdom >50 Tauranga New Zealand >10
Zeebrugge Belgium >40 Nakhodka Russia >10
Piraeus Greece >40 Lyttelton Port of
Christchurch
New Zealand >10
Liverpool / Mersey-
side
United Kingdom >40 Adelaide Australia >10
Portsmouth United States >40 Helsinki Finland >10
Freeport The Bahamas >40 Doha Qatar >10
Casablanca Morocco >40 Hakata Japan >10
Sydney Ports Australia >30 Copenhagen Denmark >10
St. Petersburg Russia >30 Limón-Moin Costa Rica >1
Kaohsiung Taiwan >30 Barbados Barbados >1
Dammam Saudi Arabia >30 Chittagong Bangladesh >1
Gothenburg Sweden >30 Talinn/Muuga Estonia >1
Auckland New Zealand >30 Acajutla El Salvador >1

98 2014.TEL.7909
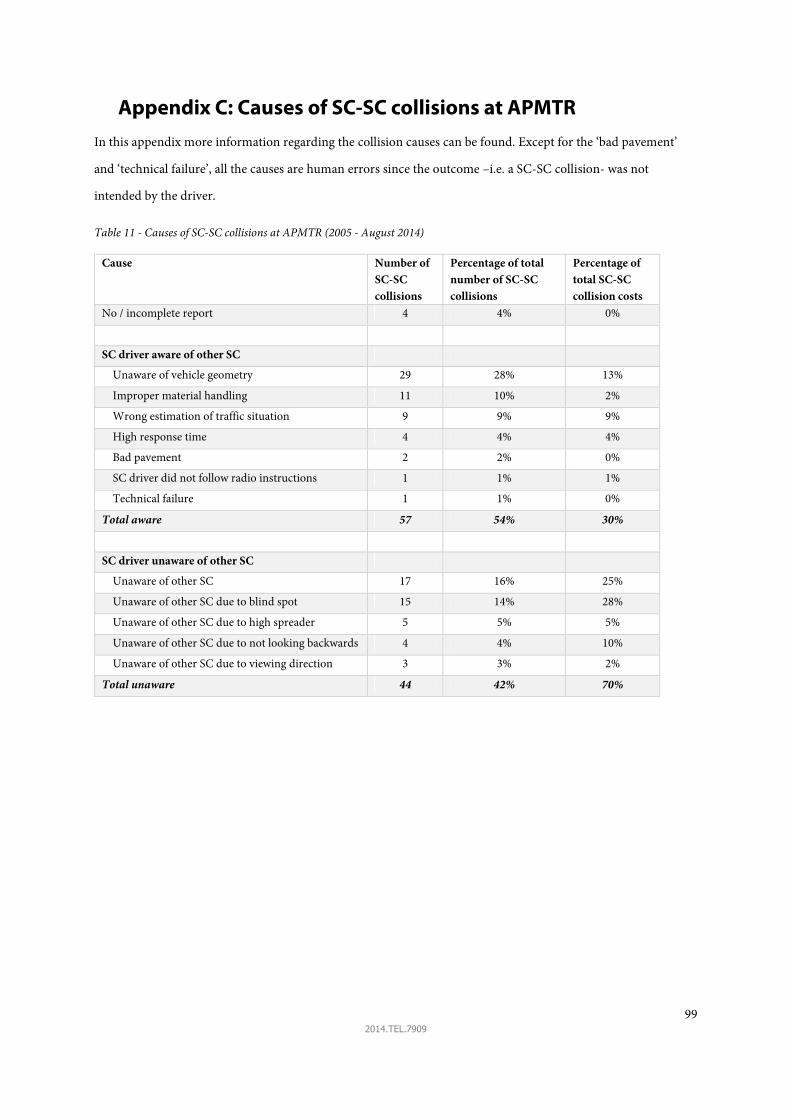
99 2014.TEL.7909
Appendix C: Causes of SC-SC collisions at APMTR
In this appendix more information regarding the collision causes can be found. Except for the ‘bad pavement’
and ‘technical failure’, all the causes are human errors since the outcome –i.e. a SC-SC collision- was not
intended by the driver.
Table 11 - Causes of SC-SC collisions at APMTR (2005 - August 2014)
Cause Number of
SC-SC
collisions
Percentage of total
number of SC-SC
collisions
Percentage of
total SC-SC
collision costs
No / incomplete report 4 4% 0%
SC driver aware of other SC
Unaware of vehicle geometry 29 28% 13%
Improper material handling 11 10% 2%
Wrong estimation of traffic situation 9 9% 9%
High response time 4 4% 4%
Bad pavement 2 2% 0%
SC driver did not follow radio instructions 1 1% 1%
Technical failure 1 1% 0%
Total aware 57 54% 30%
SC driver unaware of other SC
Unaware of other SC 17 16% 25%
Unaware of other SC due to blind spot 15 14% 28%
Unaware of other SC due to high spreader 5 5% 5%
Unaware of other SC due to not looking backwards 4 4% 10%
Unaware of other SC due to viewing direction 3 3% 2%
Total unaware 44 42% 70%
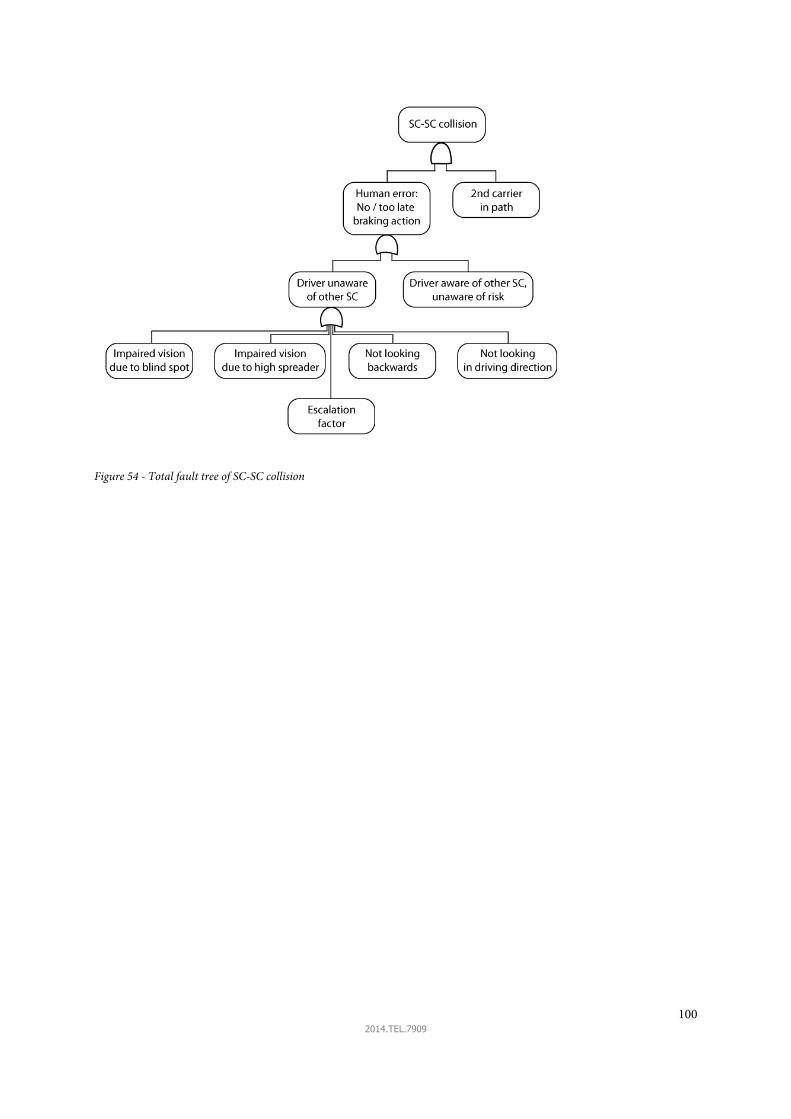
100 2014.TEL.7909
Figure 54 - Total fault tree of SC-SC collision

101 2014.TEL.7909
Figure 55 - Straddle carrier driver aware of other SC: Causes of SC-SC collisions at APMTR 2005 - August 2014 (% collisions per
cause type)
Figure 56 - Straddle carrier driver aware of other SC: Causes of SC-SC collisions at APMTR 2005 - August 2014 (% cost per
cause type)

102 2014.TEL.7909
Table 12 - Escalation factors
Driver & carrier
Attitudes/personality
Gamification due to competition with
other teams
Experience/competence
Hired / own personnel
Experience with straddle carrier driving
Task Demand
High traffic density
Routine driving
Pressure from operations / rush
Driver State
Attentional tunnelling
Requisite memory trap
Anxiety, fatigue and other stressors
Wrong intentions/goals
Inadequate viewing behaviour (no head
movement)
Inattention / Distraction
On-board computer (Techlogix)
Mobile phone
SC status screen
Radio
Data overload
Misplaced Salience
Environment
Night
Weather conditions
Road conditions
Other traffic
Other obstacles
Sunset/sunrise
Stack design

103 2014.TEL.7909
Appendix D: Collision situations
This appendix contains information about the collision situations at APMTR between 2005 and August 2014.
The following pages contain the collision situations. The yellow lines should be ignored.
Table 13 - Hazard direction groups of 'driver unaware of other SC' collisions at APMTR between 2005 and August 2014
Number
of SC-SC
collisions
Percentage of
total number of
SC-SC collisions
Percentage of
total SC-SC
collision costs
A: left backside 4 4% 10%
B: starboard side (no holes) 9 9% 30%
C: starboard side 8 8% 8%
D: port side 8 8% 9%
E: front port side 5 5% 5%
F: right back side 3 3% 3%

104 2014.TEL.7909

105 2014.TEL.7909

106 2014.TEL.7909

107 2014.TEL.7909

108 2014.TEL.7909

109 2014.TEL.7909

110 2014.TEL.7909

111 2014.TEL.7909
Appendix E: Schematic map port-side blind spot
The blind spot angles are derived from a panoramic image according to the panograph method (Bostelman,
Teizer, Ray, Agronin, & Albanese, 2014). These are depicted in Figure 57.
Figure 57 – Angular size estimates port-side blind spot seen from driver position
Figure 58 - Schematic map port-side blind spot
Assuming a straddle carrier length of 12 meter (40 feet) this means that the other straddle carrier driving in the
strait is totally covered by the 13 degrees blind spot when the driver of the straddle carrier is positioned at 22 m
from the stack lane end. This means that the ego straddle carrier is at the penultimate container position when
this happens.

112 2014.TEL.7909
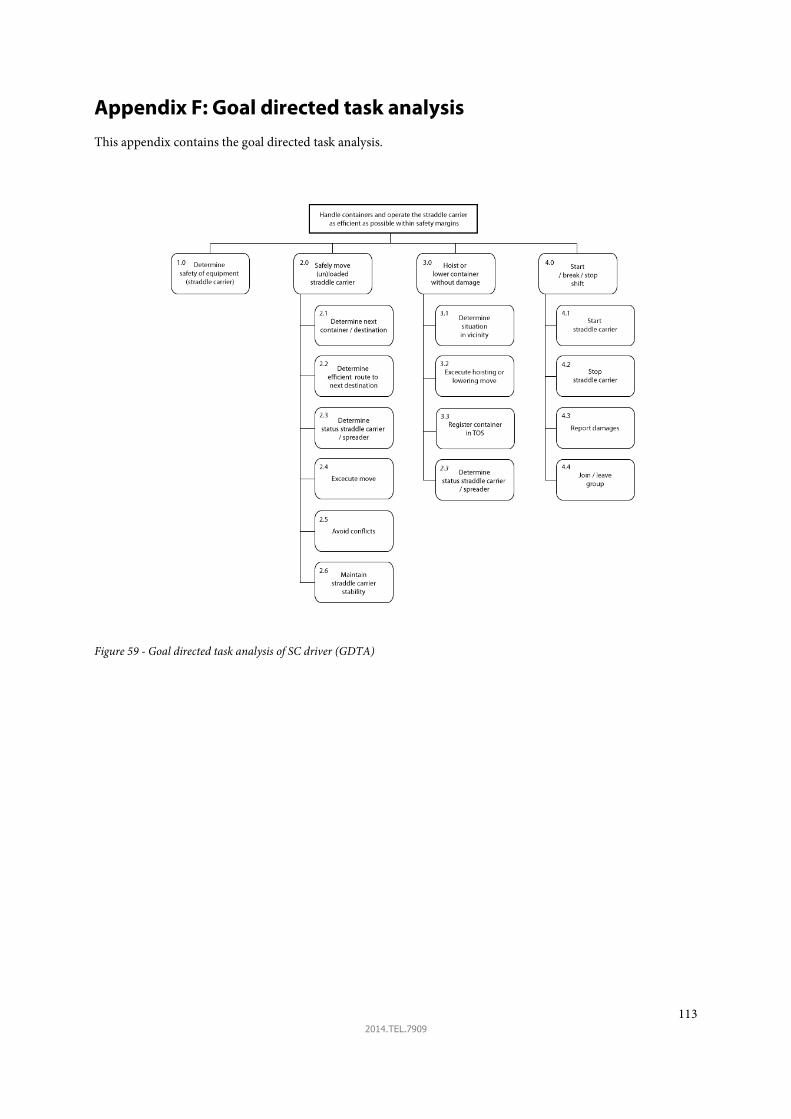
113 2014.TEL.7909
Appendix F: Goal directed task analysis
This appendix contains the goal directed task analysis.
Figure 59 - Goal directed task analysis of SC driver (GDTA)

114 2014.TEL.7909
Figure 60 - GDTA subgoal 2.5: avoid conflicts

115 2014.TEL.7909
Appendix G: Variables blind spot camera design
The following list are the variables concerning the blind spot camera design. The variables are split in a camera
and a display part. Underlined variables are considered to have major influence on the interface of the blind spot
camera system.
Camera Image Physical
Sensor sensitivity Size
Sensor size Mounting abilities
Sensor dynamic range Mounting location
Sensor resolution Mounting angle
Sensor gain Weather resistance
Shutter speed Ruggedness
Aperture Video output signal
Focal length, i.e. field of view Video connections
Focus Vibration sensitivity
Video display Size Size
Resolution Brightness
Saturation Mounting location
Contrast Mounting abilities
Brightness Ruggedness
Video connections
Viewing angle

116 2014.TEL.7909

117 2014.TEL.7909
Appendix H: Experiment videos
This appendix will elaborate on the videos used in the experiments.
System design: pre-test
First, the important variables from appendix G had to be determined. Since a GoPro Hero 3 Black was available,
this was the camera used for the pre-test. With the help of a straddle carrier driver the author determined the
following variables for the system:
Focal length, i.e. field of view: 90 degrees (horizontal);
Mounting location: At the top of the side ladder;
Mounting angle: Towards the front left, where in the right part of the picture the ego straddle carrier was just
visible;
Figure 61 - Blind spot test camera mounting location
Display size: 8 inch;
Display mounting location: in cabin in the drivers line of sight towards the blind spot;
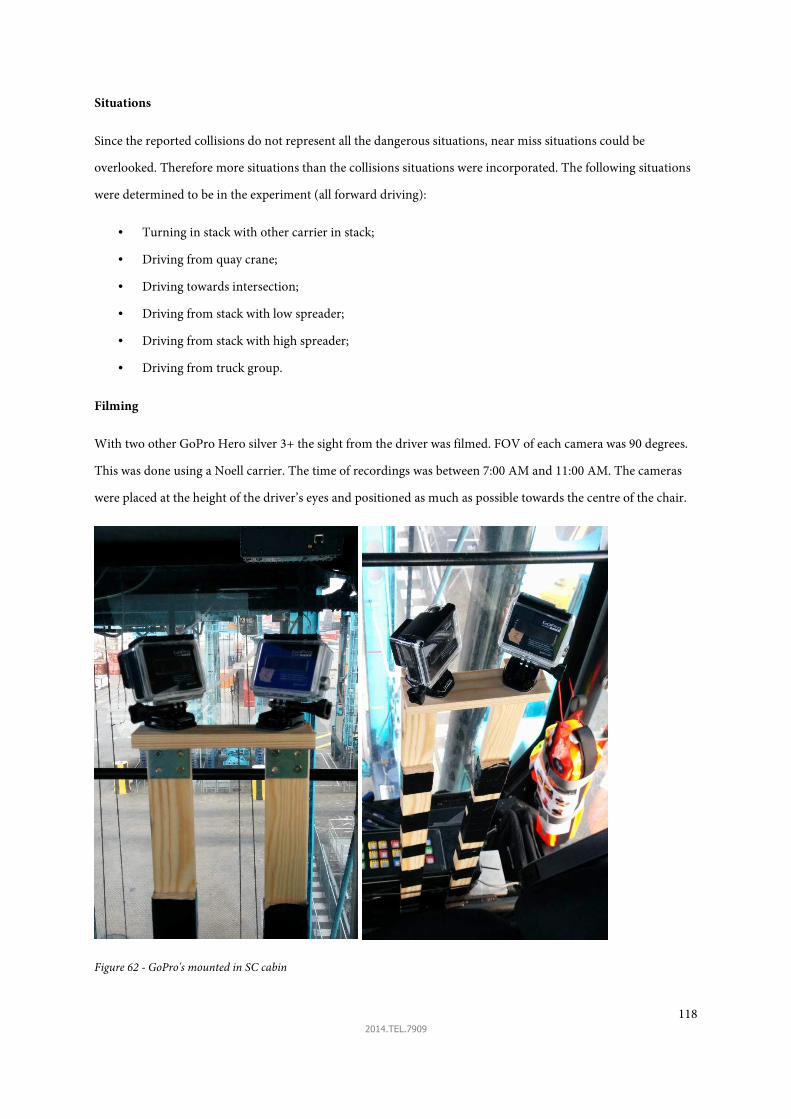
118 2014.TEL.7909
Situations
Since the reported collisions do not represent all the dangerous situations, near miss situations could be
overlooked. Therefore more situations than the collisions situations were incorporated. The following situations
were determined to be in the experiment (all forward driving):
• Turning in stack with other carrier in stack;
• Driving from quay crane;
• Driving towards intersection;
• Driving from stack with low spreader;
• Driving from stack with high spreader;
• Driving from truck group.
Filming
With two other GoPro Hero silver 3+ the sight from the driver was filmed. FOV of each camera was 90 degrees.
This was done using a Noell carrier. The time of recordings was between 7:00 AM and 11:00 AM. The cameras
were placed at the height of the driver’s eyes and positioned as much as possible towards the centre of the chair.
Figure 62 - GoPro's mounted in SC cabin

119 2014.TEL.7909
Editing
The movies were edited using Adobe Premiere CS5.5. To obtain an overlay video for the treatment group, a
picture-in-picture method was used to combine driver view and the blind spot camera view in one image.
Situations in experiment
The following situations are in the final video used in the experiment. The screenshots depict the view towards
the port side of the straddle carrier (left picture) and towards the starboard side of the straddle carrier (right
picture). These screenshots are without the blind spot camera overlay.
1. Driving away from the quay crane
Braking action required: yes
Other SC from: left
Figure 63 - Screenshots situation 1

120 2014.TEL.7909
2. Turning into stack
Braking action required: no
Other SC from: left
Figure 64 - Screenshots situation 2

121 2014.TEL.7909
3. Driving over an intersection
Braking action required: no
Other SC from: right
Figure 65 - Screenshots situation 3
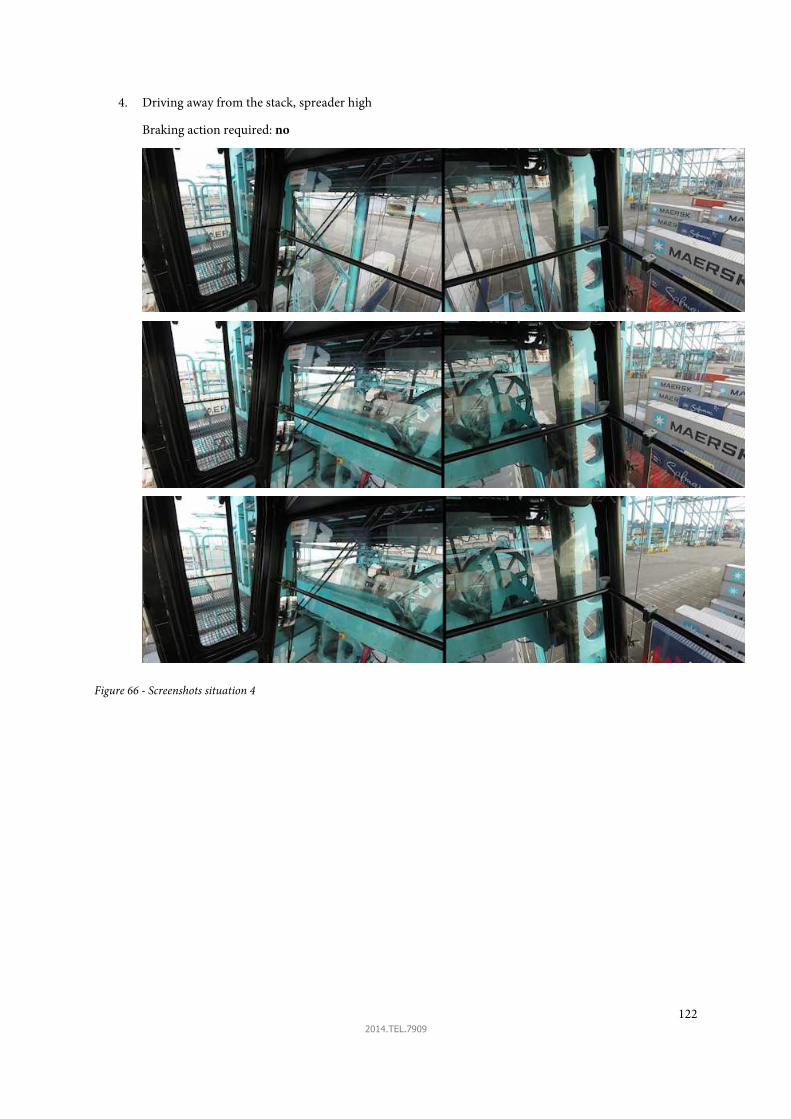
122 2014.TEL.7909
4. Driving away from the stack, spreader high
Braking action required: no
Figure 66 - Screenshots situation 4
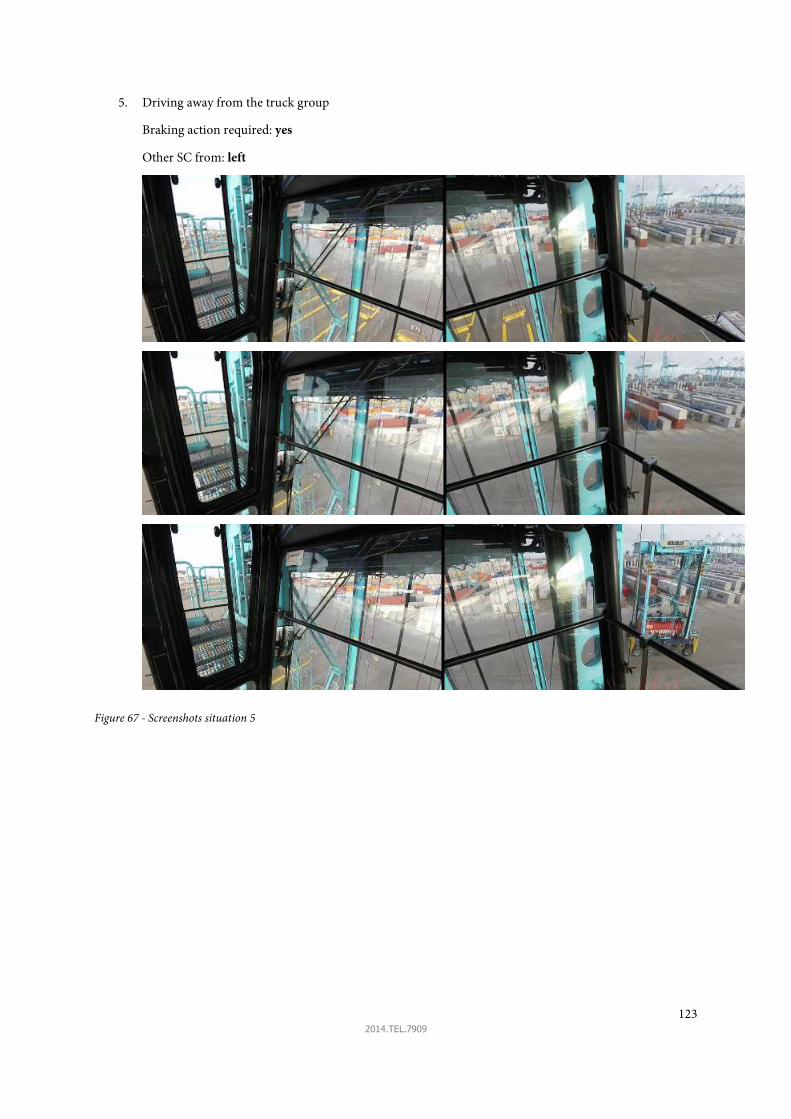
123 2014.TEL.7909
5. Driving away from the truck group
Braking action required: yes
Other SC from: left
Figure 67 - Screenshots situation 5

124 2014.TEL.7909
6. Driving away from the stack, spreader low
Braking action required: yes
Other SC from: left
Figure 68 - Screenshots situation 6

125 2014.TEL.7909
7. Driving away from the quay crane
Braking action required: yes
Other SC from: left
Figure 69 - Screenshots situation 7

126 2014.TEL.7909
8. Turning into stack
Braking action required: no
Other SC from: left
Figure 70 - Screenshots situation 8
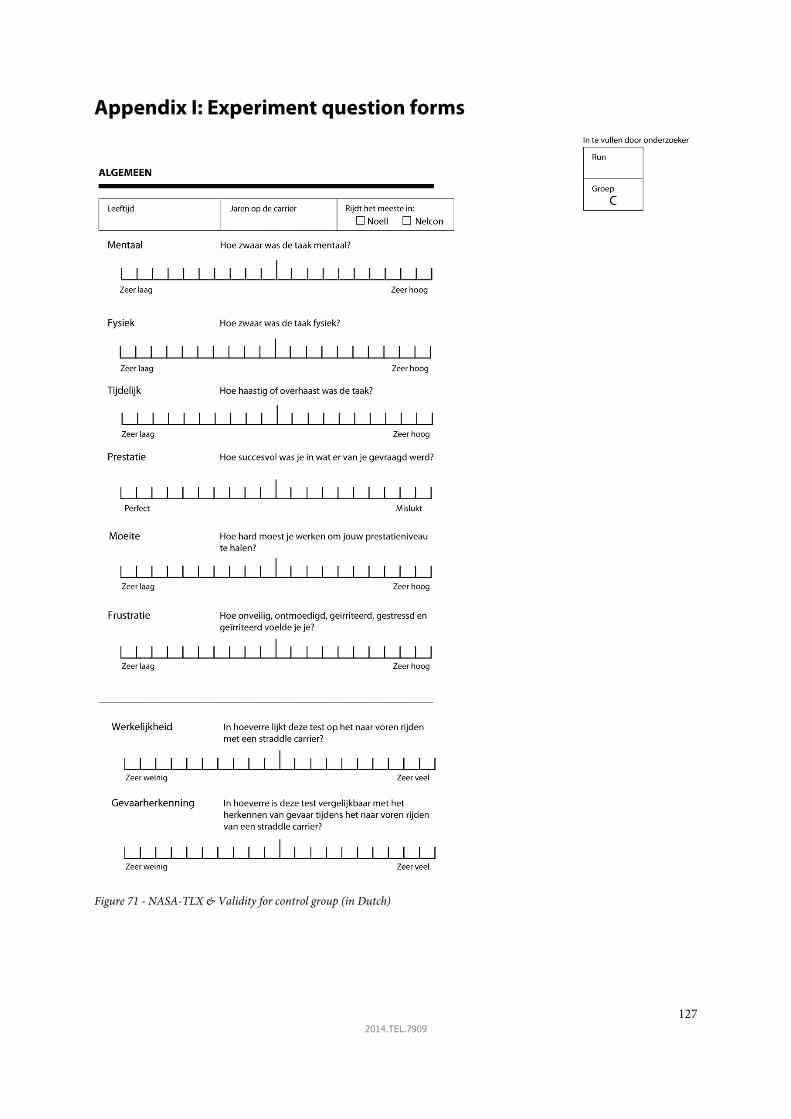
127 2014.TEL.7909
Appendix I: Experiment question forms
Figure 71 - NASA-TLX & Validity for control group (in Dutch)

128 2014.TEL.7909
Figure 72 - NASA-TLX & blind spot camera questions treatment group (in Dutch)

129 2014.TEL.7909
Figure 73 - SART questions (in Dutch)

130 2014.TEL.7909

131 2014.TEL.7909
Appendix J: Software code
unit Unit1;
interface
uses
Windows, Messages, SysUtils, Variants, Classes, Graphics, Controls, Forms,
Dialogs, StdCtrls, ExtCtrls, Unit2;
type
TForm1 = class(TForm)
btnPlay: TButton;
btnStop: TButton;
Edit1: TEdit;
Label1: TLabel;
Label3: TLabel;
procedure FormCreate(Sender: TObject);
procedure btnPlayClick(Sender: TObject);
procedure btnStopClick(Sender: TObject);
procedure hazard(Sender: TObject; var Key: Word; Shift: TShiftState);
private
{ Private declarations }
public
{ Public declarations }
end;
plibvlc_instance_t = type Pointer;
plibvlc_media_player_t = type Pointer;
plibvlc_media_t = type Pointer;
var
Form1: TForm1;
var
libvlc_media_new_path : function(p_instance : Plibvlc_instance_t; path : PAnsiChar) : Plibvlc_media_t; cdecl;
libvlc_media_new_location : function(p_instance : plibvlc_instance_t; psz_mrl : PAnsiChar) : Plibvlc_media_t; cdecl;

132 2014.TEL.7909
libvlc_media_player_new_from_media : function(p_media : Plibvlc_media_t) : Plibvlc_media_player_t; cdecl;
libvlc_media_player_set_hwnd : procedure(p_media_player : Plibvlc_media_player_t; drawable : Pointer); cdecl;
libvlc_media_player_play : procedure(p_media_player : Plibvlc_media_player_t); cdecl;
libvlc_media_player_stop : procedure(p_media_player : Plibvlc_media_player_t); cdecl;
libvlc_media_player_release : procedure(p_media_player : Plibvlc_media_player_t); cdecl;
libvlc_media_player_is_playing : function(p_media_player : Plibvlc_media_player_t) : Integer; cdecl;
libvlc_media_release : procedure(p_media : Plibvlc_media_t); cdecl;
libvlc_new : function(argc : Integer; argv : PAnsiChar) : Plibvlc_instance_t; cdecl;
libvlc_release : procedure(p_instance : Plibvlc_instance_t); cdecl;
vlcLib: integer;
vlcInstance: plibvlc_instance_t;
vlcMedia: plibvlc_media_t;
vlcMediaPlayer: plibvlc_media_player_t;
vlcInstance2: plibvlc_instance_t;
vlcMedia2: plibvlc_media_t;
vlcMediaPlayer2: plibvlc_media_player_t;
implementation
{$R *.dfm}//
function LoadVLCLibrary(): integer;
begin
Result := LoadLibrary(PWideChar('libvlccore.dll'));
Result := LoadLibrary(PWideChar('libvlc.dll'));
end;
function GetAProcAddress(handle: integer; var addr: Pointer; procName: string; failedList: TStringList): integer;
begin
addr := GetProcAddress(handle, PWideChar(procName));
if Assigned(addr) then Result := 0
else begin
if Assigned(failedList) then failedList.Add(procName);
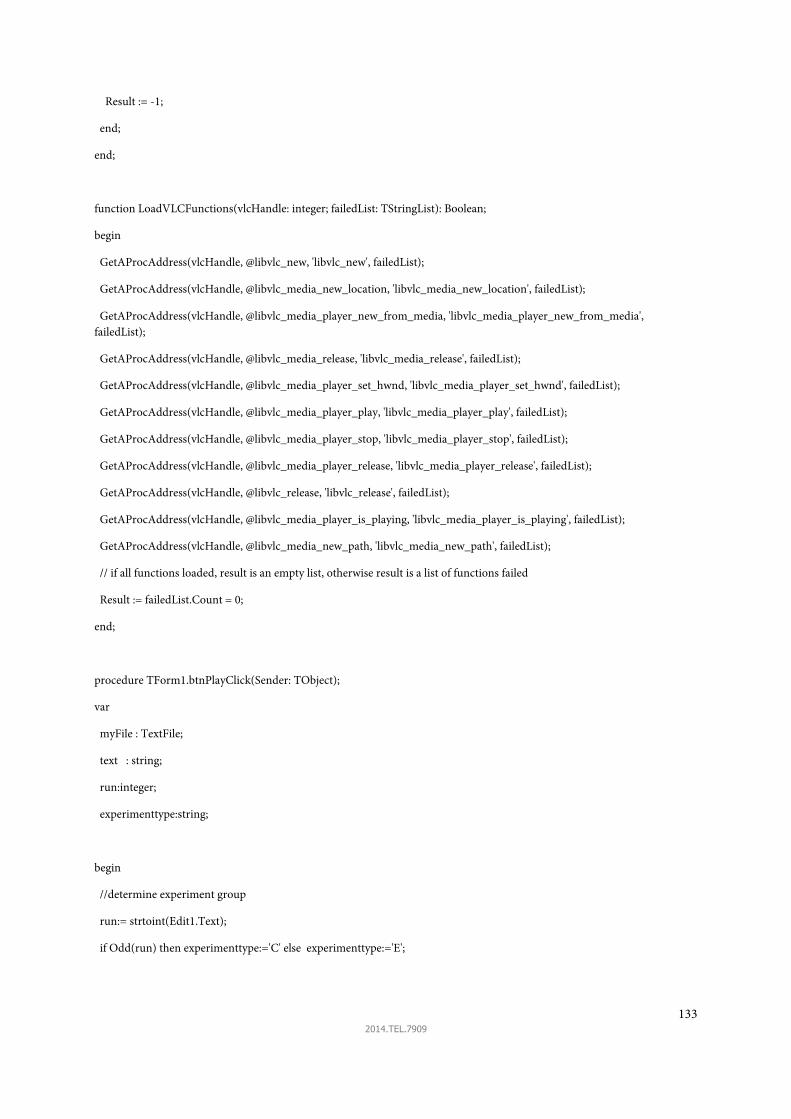
133 2014.TEL.7909
Result := -1;
end;
end;
function LoadVLCFunctions(vlcHandle: integer; failedList: TStringList): Boolean;
begin
GetAProcAddress(vlcHandle, @libvlc_new, 'libvlc_new', failedList);
GetAProcAddress(vlcHandle, @libvlc_media_new_location, 'libvlc_media_new_location', failedList);
GetAProcAddress(vlcHandle, @libvlc_media_player_new_from_media, 'libvlc_media_player_new_from_media',
failedList);
GetAProcAddress(vlcHandle, @libvlc_media_release, 'libvlc_media_release', failedList);
GetAProcAddress(vlcHandle, @libvlc_media_player_set_hwnd, 'libvlc_media_player_set_hwnd', failedList);
GetAProcAddress(vlcHandle, @libvlc_media_player_play, 'libvlc_media_player_play', failedList);
GetAProcAddress(vlcHandle, @libvlc_media_player_stop, 'libvlc_media_player_stop', failedList);
GetAProcAddress(vlcHandle, @libvlc_media_player_release, 'libvlc_media_player_release', failedList);
GetAProcAddress(vlcHandle, @libvlc_release, 'libvlc_release', failedList);
GetAProcAddress(vlcHandle, @libvlc_media_player_is_playing, 'libvlc_media_player_is_playing', failedList);
GetAProcAddress(vlcHandle, @libvlc_media_new_path, 'libvlc_media_new_path', failedList);
// if all functions loaded, result is an empty list, otherwise result is a list of functions failed
Result := failedList.Count = 0;
end;
procedure TForm1.btnPlayClick(Sender: TObject);
var
myFile : TextFile;
text : string;
run:integer;
experimenttype:string;
begin
//determine experiment group
run:= strtoint(Edit1.Text);
if Odd(run) then experimenttype:='C' else experimenttype:='E';

134 2014.TEL.7909
// create new vlc instance
vlcInstance := libvlc_new(0, nil);
vlcInstance2 := libvlc_new(0, nil);
// create new vlc media from file
if experimenttype='C' then vlcMedia := libvlc_media_new_path(vlcInstance, 'C:\videos\left.mp4')
else vlcMedia := libvlc_media_new_path(vlcInstance, 'C:\videos\left_cam.mp4');
vlcMedia2 := libvlc_media_new_path(vlcInstance, 'C:\videos\right.mp4');
// if you want to play from network, use libvlc_media_new_location instead
// vlcMedia := libvlc_media_new_location(vlcInstance, 'udp://@225.2.1.27:5127');
// create new vlc media player
vlcMediaPlayer := libvlc_media_player_new_from_media(vlcMedia);
vlcMediaPlayer2 := libvlc_media_player_new_from_media(vlcMedia2);
// now no need the vlc media, free it
libvlc_media_release(vlcMedia);
libvlc_media_release(vlcMedia2);
// play video in a TPanel, if not call this routine, vlc media will open a new window
libvlc_media_player_set_hwnd(vlcMediaPlayer, Pointer(Unit1.Form1.Handle));
libvlc_media_player_set_hwnd(vlcMediaPlayer2, Pointer(Unit2.Form2.Handle));
// play media
libvlc_media_player_play(vlcMediaPlayer);
libvlc_media_player_play(vlcMediaPlayer2);
btnPlay.Enabled:=False;
AssignFile(myFile, Edit1.Text+'.txt');
rewrite(myFile);
Write(myFile, floattostr(Now));
WriteLn(myFile);

135 2014.TEL.7909
Write(myFile, experimenttype);
WriteLn(myFile);
Write(myFile, 'START');
WriteLn(myFile);
CloseFile(myFile);
end;
procedure TForm1.btnStopClick(Sender: TObject);
begin
if not Assigned(vlcMediaPlayer) then begin
Showmessage('Not playing');
Exit;
end;
// stop vlc media player
libvlc_media_player_stop(vlcMediaPlayer);
libvlc_media_player_stop(vlcMediaPlayer2);
// and wait until it completely stops
while libvlc_media_player_is_playing(vlcMediaPlayer) = 1 do begin
Sleep(100);
end;
// release vlc media player
libvlc_media_player_release(vlcMediaPlayer);
libvlc_media_player_release(vlcMediaPlayer2);
vlcMediaPlayer := nil;
// release vlc instance
libvlc_release(vlcInstance);
libvlc_release(vlcInstance2);
end;
procedure TForm1.FormCreate(Sender: TObject);
var sL: TStringList;
begin

136 2014.TEL.7909
// load vlc library
vlclib := LoadVLCLibrary();
if vlclib = 0 then begin
Showmessage('Load vlc library failed');
Exit;
end;
// sL will contains list of functions fail to load
sL := TStringList.Create;
if not LoadVLCFunctions(vlclib, sL) then begin
Showmessage('Some functions failed to load : ' + #13#10 + sL.Text);
FreeLibrary(vlclib);
sL.Free;
Exit;
end;
sL.Free;
end;
procedure TForm1.hazard(Sender: TObject; var Key: Word; Shift: TShiftState);
var
myFile : TextFile;
text : string;
begin
if Key=VK_SPACE then
begin
AssignFile(myFile, Edit1.Text+'.txt');
append(myFile);
Write(myFile, floattostr(Now));
WriteLn(myFile);
CloseFile(myFile);
end;
end;
end.

137 2014.TEL.7909
Appendix K: Experiment data
Run = Sample number
PC = Experiment computer, left (L) or right (R)
Group = Control group (C) or experiment group (E)
Sart-x = SA score of situation x according to SART method
T_brake_x = Braking response time of situation x (in minutes, seconds,
milliseconds)
Age = Age of driver in years
Years = Experience of driver in years
Carrier type = Most driven SC type (Noell or Nelcon)
Nasa-tlx = Perceived workload score according to the NASA-TLX method
C-validity = Score of comparability with forward driving with real SC for control
group
C-hazard perception = Score of comparability with hazard perception during
forward driving with real SC for control group
E-cam = Perceived usage score of camera for treatment group
E-utility = Perceived utility score of camera for treatment group
E-ease = Perceived ease score of camera for treatment group
E-distraction = Perceived distraction score of camera for treatment group
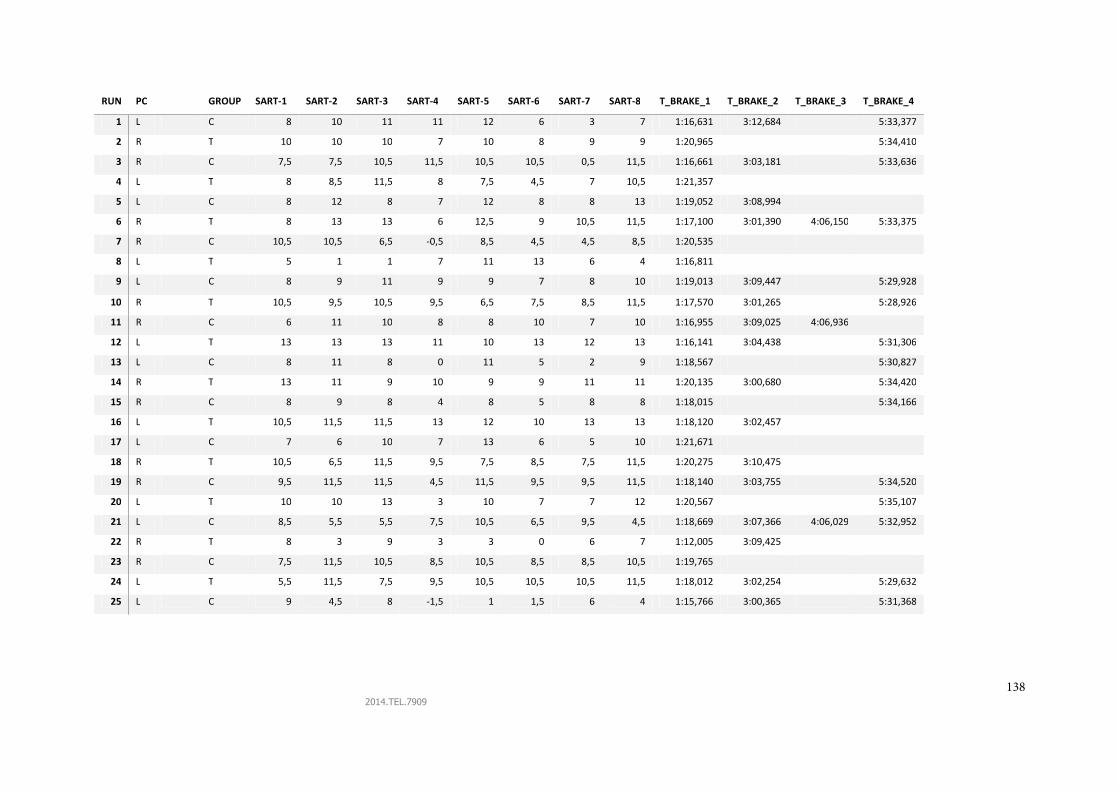
138 2014.TEL.7909
RUN PC GROUP SART-1 SART-2 SART-3 SART-4 SART-5 SART-6 SART-7 SART-8 T_BRAKE_1 T_BRAKE_2 T_BRAKE_3 T_BRAKE_4
1 L C 8 10 11 11 12 6 3 7 1:16,631 3:12,684 5:33,377
2 R T 10 10 10 7 10 8 9 9 1:20,965 5:34,410
3 R C 7,5 7,5 10,5 11,5 10,5 10,5 0,5 11,5 1:16,661 3:03,181 5:33,636
4 L T 8 8,5 11,5 8 7,5 4,5 7 10,5 1:21,357
5 L C 8 12 8 7 12 8 8 13 1:19,052 3:08,994
6 R T 8 13 13 6 12,5 9 10,5 11,5 1:17,100 3:01,390 4:06,150 5:33,375
7 R C 10,5 10,5 6,5 -0,5 8,5 4,5 4,5 8,5 1:20,535
8 L T 5 1 1 7 11 13 6 4 1:16,811
9 L C 8 9 11 9 9 7 8 10 1:19,013 3:09,447 5:29,928
10 R T 10,5 9,5 10,5 9,5 6,5 7,5 8,5 11,5 1:17,570 3:01,265 5:28,926
11 R C 6 11 10 8 8 10 7 10 1:16,955 3:09,025 4:06,936
12 L T 13 13 13 11 10 13 12 13 1:16,141 3:04,438 5:31,306
13 L C 8 11 8 0 11 5 2 9 1:18,567 5:30,827
14 R T 13 11 9 10 9 9 11 11 1:20,135 3:00,680 5:34,420
15 R C 8 9 8 4 8 5 8 8 1:18,015 5:34,166
16 L T 10,5 11,5 11,5 13 12 10 13 13 1:18,120 3:02,457
17 L C 7 6 10 7 13 6 5 10 1:21,671
18 R T 10,5 6,5 11,5 9,5 7,5 8,5 7,5 11,5 1:20,275 3:10,475
19 R C 9,5 11,5 11,5 4,5 11,5 9,5 9,5 11,5 1:18,140 3:03,755 5:34,520
20 L T 10 10 13 3 10 7 7 12 1:20,567 5:35,107
21 L C 8,5 5,5 5,5 7,5 10,5 6,5 9,5 4,5 1:18,669 3:07,366 4:06,029 5:32,952
22 R T 8 3 9 3 3 0 6 7 1:12,005 3:09,425
23 R C 7,5 11,5 10,5 8,5 10,5 8,5 8,5 10,5 1:19,765
24 L T 5,5 11,5 7,5 9,5 10,5 10,5 10,5 11,5 1:18,012 3:02,254 5:29,632
25 L C 9 4,5 8 -1,5 1 1,5 6 4 1:15,766 3:00,365 5:31,368

139 2014.TEL.7909
RUN PC GROUP SART-1 SART-2 SART-3 SART-4 SART-5 SART-6 SART-7 SART-8 T_BRAKE_1 T_BRAKE_2 T_BRAKE_3 T_BRAKE_4
26 R T 9 12 13 13 12 2 3 5 1:14,550 3:07,405 5:26,990
27 R C 9 8 2 8 9 5 7 4 1:19,430 2:57,465 5:33,465
28 L T 10 6 12 7 5 -1 3 6 1:18,957 3:02,209
29 L C
30 R T 10,5 7,5 10,5 9,5 11,5 4,5 8,5 10,5 1:18,450
31 R C 9 11 7 4 6 0 6 6 1:21,795 3:04,705
32 L T 9 5 5 4 4 6 7 7 1:18,037 5:27,452
RUN GROUP T_BRAKE_5 T_BRAKE_6 T_BRAKE_7 T_BRAKE_8 AGE YEARS CARRIERTYPE NASA-
TLX
C-
VALIDITY
C-HAZARD
PERCEPTION
E-
CAM
E-
UTILITY
E-
EASE
E-
DISTRACTION
1 C 6:31,653 7:50,644 8:50,510 38 0,5 Noell 17 21 21
2 T 6:35,365 7:51,971 8:52,276 47 6 Noell 19 3 11 11 4
3 C 6:26,211 7:50,476 8:56,886 23 3 Noell 14 9,5 4,5
4 T 6:31,378 7:48,821 8:54,547 40 8 Noell 9 8,5 11,5 10,5 11
5 C 6:25,283 7:50,215 8:50,101 36 6 Noell 1,5 6,5
6 T 6:30,176 7:51,146 8:52,411 27 0,5 Noell 9 1,5 15,5 15,5 1,5
7 C 6:30,465 7:50,415 8:54,130 45 8 Noell 55 13,5 17,5
8 T 6:26,122 7:46,364 8:50,745 11 9 11 17
9 C 6:28,316 7:49,330 8:51,737 37 3,5 Noell 50 16 15
10 T 6:25,286 7:50,891 8:49,866 35 7 Noell 7 1,5 1,5 6,5 7,5
11 C 7:51,651 21 3 Noell 23 14 14
12 T 7:49,419 8:51,370 10:13,342 48 10 Noell 6 4 1 11 11
13 C 6:30,423 7:49,350 8:52,016 52 9 Noell 35 13 11
14 T 6:31,016 7:51,501 8:55,321 21 1,5 Noell 10 1 2 11 1
15 C 6:29,541 7:51,206 8:53,546 33 0,583333 Nelcon 32 6 7
16 T 6:28,276 7:52,143 8:53,194 36 9 Noell 7 12 19 18 11
17 C 6:31,793 7:49,449 8:56,700 22 1 Noell 10 17 12
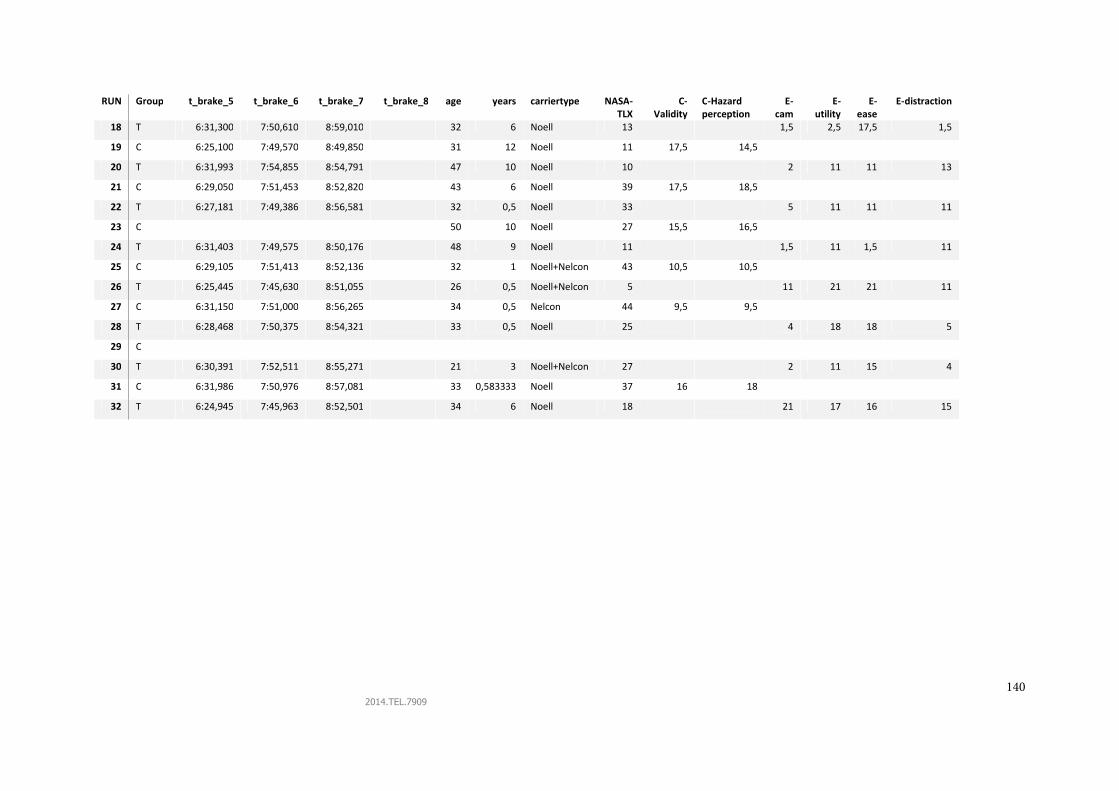
140 2014.TEL.7909
RUN Group t_brake_5 t_brake_6 t_brake_7 t_brake_8 age years carriertype NASA-
TLX
C-
Validity
C-Hazard
perception E-
cam
E-
utility
E-
ease
E-distraction
18 T 6:31,300 7:50,610 8:59,010 32 6 Noell 13 1,5 2,5 17,5 1,5
19 C 6:25,100 7:49,570 8:49,850 31 12 Noell 11 17,5 14,5
20 T 6:31,993 7:54,855 8:54,791 47 10 Noell 10 2 11 11 13
21 C 6:29,050 7:51,453 8:52,820 43 6 Noell 39 17,5 18,5
22 T 6:27,181 7:49,386 8:56,581 32 0,5 Noell 33 5 11 11 11
23 C 50 10 Noell 27 15,5 16,5
24 T 6:31,403 7:49,575 8:50,176 48 9 Noell 11 1,5 11 1,5 11
25 C 6:29,105 7:51,413 8:52,136 32 1 Noell+Nelcon 43 10,5 10,5
26 T 6:25,445 7:45,630 8:51,055 26 0,5 Noell+Nelcon 5 11 21 21 11
27 C 6:31,150 7:51,000 8:56,265 34 0,5 Nelcon 44 9,5 9,5
28 T 6:28,468 7:50,375 8:54,321 33 0,5 Noell 25 4 18 18 5
29 C
30 T 6:30,391 7:52,511 8:55,271 21 3 Noell+Nelcon 27 2 11 15 4
31 C 6:31,986 7:50,976 8:57,081 33 0,583333 Noell 37 16 18
32 T 6:24,945 7:45,963 8:52,501 34 6 Noell 18 21 17 16 15
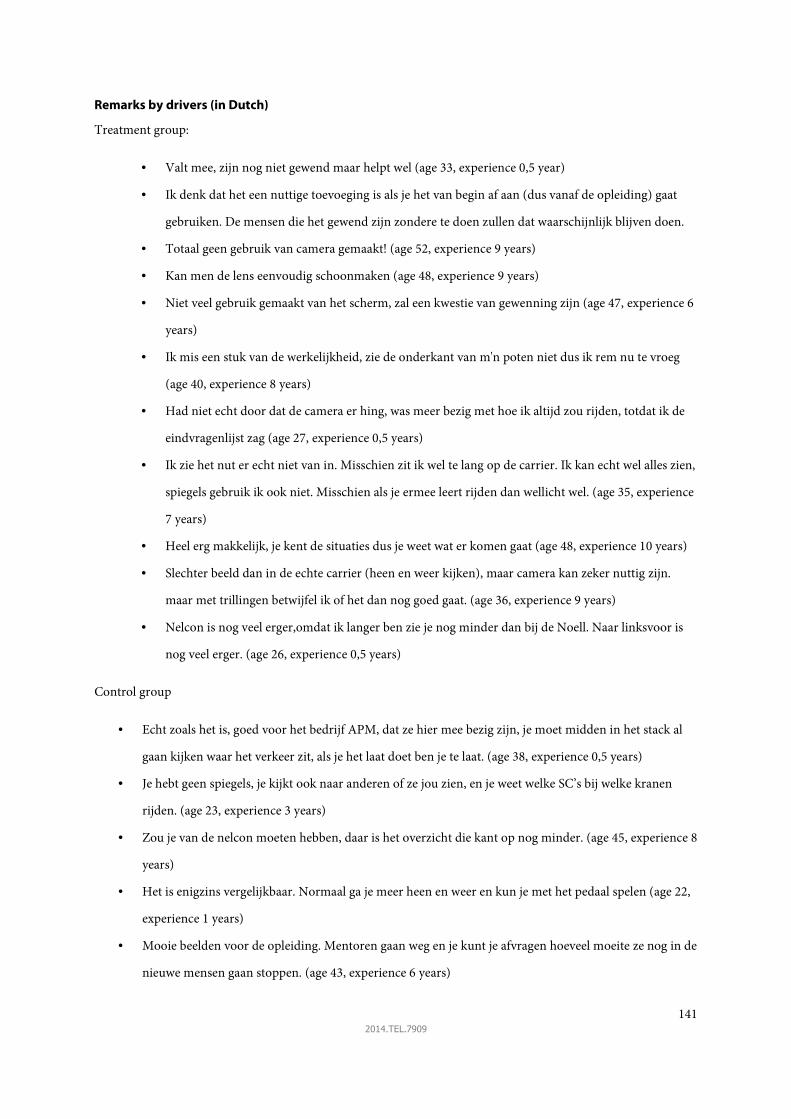
141 2014.TEL.7909
Remarks by drivers (in Dutch)
Treatment group:
• Valt mee, zijn nog niet gewend maar helpt wel (age 33, experience 0,5 year)
• Ik denk dat het een nuttige toevoeging is als je het van begin af aan (dus vanaf de opleiding) gaat
gebruiken. De mensen die het gewend zijn zondere te doen zullen dat waarschijnlijk blijven doen.
• Totaal geen gebruik van camera gemaakt! (age 52, experience 9 years)
• Kan men de lens eenvoudig schoonmaken (age 48, experience 9 years)
• Niet veel gebruik gemaakt van het scherm, zal een kwestie van gewenning zijn (age 47, experience 6
years)
• Ik mis een stuk van de werkelijkheid, zie de onderkant van m'n poten niet dus ik rem nu te vroeg
(age 40, experience 8 years)
• Had niet echt door dat de camera er hing, was meer bezig met hoe ik altijd zou rijden, totdat ik de
eindvragenlijst zag (age 27, experience 0,5 years)
• Ik zie het nut er echt niet van in. Misschien zit ik wel te lang op de carrier. Ik kan echt wel alles zien,
spiegels gebruik ik ook niet. Misschien als je ermee leert rijden dan wellicht wel. (age 35, experience
7 years)
• Heel erg makkelijk, je kent de situaties dus je weet wat er komen gaat (age 48, experience 10 years)
• Slechter beeld dan in de echte carrier (heen en weer kijken), maar camera kan zeker nuttig zijn.
maar met trillingen betwijfel ik of het dan nog goed gaat. (age 36, experience 9 years)
• Nelcon is nog veel erger,omdat ik langer ben zie je nog minder dan bij de Noell. Naar linksvoor is
nog veel erger. (age 26, experience 0,5 years)
Control group
• Echt zoals het is, goed voor het bedrijf APM, dat ze hier mee bezig zijn, je moet midden in het stack al
gaan kijken waar het verkeer zit, als je het laat doet ben je te laat. (age 38, experience 0,5 years)
• Je hebt geen spiegels, je kijkt ook naar anderen of ze jou zien, en je weet welke SC’s bij welke kranen
rijden. (age 23, experience 3 years)
• Zou je van de nelcon moeten hebben, daar is het overzicht die kant op nog minder. (age 45, experience 8
years)
• Het is enigzins vergelijkbaar. Normaal ga je meer heen en weer en kun je met het pedaal spelen (age 22,
experience 1 years)
• Mooie beelden voor de opleiding. Mentoren gaan weg en je kunt je afvragen hoeveel moeite ze nog in de
nieuwe mensen gaan stoppen. (age 43, experience 6 years)

142 2014.TEL.7909
• Het lijkt er wel op hoor, maar anticipatie van wie waar rijdt mist hier. Carriernummers en vaak zit je
met je kraanteam in zelfde gebied. Dan kun je wel praten met elkaar, zo van: kom maar. (age 50,
experience 10 years)
Related Documents