SPECIAL AND DIFFERENTIAL TREATMENT IN MULTILATERAL TRADE NEGOTIATIONS Shamim Shakur, Allan N Rae and Srikanta Chatterjee Department of Applied and International Economics Massey University, Palmerston North, New Zealand Abstract WTO trade negotiations stalled in recent years because of north-south trade conflicts reaching their lows during the Cancun fiasco of September 2003. The developed countries with a much longer history as "industrial economies" have always argued - often with some justification - that the developing countries have long used many and varied instruments to restrict trade. The developed countries, in their turn, have maintained high protection to agriculture and textile imports to the detriment of the developing countries. One cornerstone of the Doha Development Agenda (DDA) is the provision of special and differential treatment (SDT) of developing countries. The WTO framework accord reached in July 2004 reaffirms that the least-developed countries, which will have full access to all SDT provisions as stated in section 2.2 of DDA, are not required to undertake tariff reduction commitments. We believe, however, that non-reciprocity as implied in SDT must be approached with caution. Standard trade theory literature suggests that the bulk of the gains from trade come from unilateral trade liberalisation and results of our experiments support this point. We quantify the gains and losses - and their sources - by simulating a trade liberalisation scenario with and without SDT in a computable general equilibrium (CGE) modelling framework. The welfare gains to most developing countries are shown to improve when SDT does not apply, and the LDC welfare gains turn out to be either small or even negative under SDT arrangements. Ironically, the already-agreed elimination of agricultural export subsidies is shown to be welfare- reducing for much of the developing world. We conclude that bold improvements in market access provide greatest prospect of gains to developing countries, and need not be treated as “concessions” to these groups of countries. JEL Classification: F13, F17, O19 Paper prepared for presentation at the 46th Annual Conference of New Zealand Association of Economists, Christchurch, 29 June-1 July 2005. Enquiries about the paper may be addressed to [email protected] 1

Welcome message from author
This document is posted to help you gain knowledge. Please leave a comment to let me know what you think about it! Share it to your friends and learn new things together.
Transcript

SPECIAL AND DIFFERENTIAL TREATMENT IN
MULTILATERAL TRADE NEGOTIATIONS
Shamim Shakur, Allan N Rae and Srikanta Chatterjee
Department of Applied and International Economics
Massey University, Palmerston North, New Zealand
Abstract
WTO trade negotiations stalled in recent years because of north-south trade conflicts reaching their lows during the Cancun fiasco of September 2003. The developed countries with a much longer history as "industrial economies" have always argued - often with some justification - that the developing countries have long used many and varied instruments to restrict trade. The developed countries, in their turn, have maintained high protection to agriculture and textile imports to the detriment of the developing countries. One cornerstone of the Doha Development Agenda (DDA) is the provision of special and differential treatment (SDT) of developing countries. The WTO framework accord reached in July 2004 reaffirms that the least-developed countries, which will have full access to all SDT provisions as stated in section 2.2 of DDA, are not required to undertake tariff reduction commitments. We believe, however, that non-reciprocity as implied in SDT must be approached with caution. Standard trade theory literature suggests that the bulk of the gains from trade come from unilateral trade liberalisation and results of our experiments support this point. We quantify the gains and losses - and their sources - by simulating a trade liberalisation scenario with and without SDT in a computable general equilibrium (CGE) modelling framework. The welfare gains to most developing countries are shown to improve when SDT does not apply, and the LDC welfare gains turn out to be either small or even negative under SDT arrangements. Ironically, the already-agreed elimination of agricultural export subsidies is shown to be welfare-reducing for much of the developing world. We conclude that bold improvements in market access provide greatest prospect of gains to developing countries, and need not be treated as “concessions” to these groups of countries. JEL Classification: F13, F17, O19
Paper prepared for presentation at the 46th Annual Conference of New Zealand Association of Economists, Christchurch, 29 June-1 July 2005.
Enquiries about the paper may be addressed to [email protected]
1

I. INTRODUCTION
The Doha Development round missed the January 2005 completion deadline and key disputes
remain to be resolved in the upcoming sixth WTO ministerial conference in Hong Kong in
December of this year. Foremost among these unresolved disputes is the topic of further
liberalisation of agricultural trade and the state of many developing countries (DCs) as well as
the least developed countries (LDCs) in the post-MFA era. The sixth ministerial will attempt
to untangle these disputes and determine a framework for modalities in agriculture based on
principles agreed in July 2004 (to be called “July framework” in rest of the paper).1 In this
paper, we model scenarios based on our interpretation of the July framework accord. We
calculate regional welfare gains (and losses) arising from various proposals implicit in this
accord. We further decompose these gains and losses based on the type of proposed reforms
(tariff, export subsidy, domestic subsidy), the origination of reform (in developed or
developing regions) and the sectors involved (agriculture, textile or manufacturing).
The “July framework” firmly reiterates special and differential treatment (SDT) for least-
developed countries and adds some specific recommendations to the original Doha
Ministerial Declaration. The current trade round has differentiated itself from its predecessors
by calling it the “development round”. Understandably the WTO and at least some developed
members are sincere in their efforts to grant some “concessions” to the least-developed
countries. The justification for such SDT may be traced to some perceived notions which
have been challenged in recent writings. Some of these notions are: (i) DCs and LDCs can
generally be considered to possess comparative advantage in agriculture such that
liberalisation of agricultural trade will be beneficial to these nations; (ii) developed countries
are the most notorious in terms of creating agricultural trade distortions that works to the
detriments of DCs and LDCs; (iii) previous trade negotiations, except for the Uruguay Round,
1 For a complete text of the July Framework accord, see www.wto.org/english/tratop_e/dda_e/draft_text_gc_dg_31july04_e.htm. For an overview of the events leading up to July Framework accord, see Shakur, Rae and Chatterjee (2004).
2

ignored agricultural reforms altogether such that this sector currently remains most protected;
(iv) Agricultural trade liberalisation would benefit the DCs and LDCs the most. As if to rid
themselves of their “sins” from the past, SDT has been proposed in the current trade round as
a favour to these developing countries.
Several recent papers, however, would argue against these perceived views. Results of our
simulation exercise show that if reforms are restricted to the agricultural sectors of developed
countries, many DCs and LDCs suffer a worsened plight with only the developed countries
themselves being the real winners. The developing countries may do better by also addressing
their own protectionism and should seek SDT as an extended phase-in period to implement
their reforms rather than a lesser depth of these reforms. However, within SDT, some clear
gains emerge from a market access agenda in developed countries such that proposals like
that of tariff reduction should be the top priority of a development round.
On the first of the perceived notions, that of the issue of comparative advantage, some
decomposition across agricultural products is warranted. For example in large scale cereal
production and livestock, the developed countries enjoy cost advantage by economies of
scale. In what Stiglitz et al. (2005, p. 304) calls programme crops and livestocks, the
developed countries are net exporters and the developing countries are net importers.
Generalisation of developing countries comparative advantage in tropical products and
processed foods are faulty and often lead to perverse policy recommendations. Stiglitz et al.
(2005, p. 305) would like the developing countries to focus their attention to the elimination
of tariffs and quotas on these later products in which they have high elasticities with respect
to price. A similar argument can be made to the perceived notion that comparative advantage
in manufactured products belong to the developed countries. In labour-intensive
manufacturing like textiles, developing country supremacy is already established. These latter
countries are quickly claiming advantage in electronics, spare parts and other niche areas.
Hertel and Martin (2000, p.468) note that manufactured exports already account for about
3
three-quarters of total merchandise exports for the average developing country. Accordingly,
trade liberalisation in manufacturing is also a vital component of a development agenda and
we calculate these gains in this research.
Some of the other perceived views stated above have been debunked in Arvind Panagariya’s
most recent paper (Panagariya 2005) which has received widespread pre-release publicity
especially in popular press. Specifically Panagariya has identified six fallacies in respect to
agricultural liberalisation and developing countries, and offered credible evidence to debunk
them. The first these fallacies he states is “agricultural border protection and subsidies are
largely a developed-country phenomenon.” Using average tariff rates as measures of
protection, Panagariya (2005, p.9) shows major developing countries being more protective
than developed countries. By yet another indicator, the proportion of duty-free agro-food
items in developed countries is clearly higher than in developing countries. The worst two
offenders among developed countries, namely Iceland and Norway with average tariff rates of
72 and 47 percent respectively are dwarfed by the two developing country counterparts,
namely Colombia and India that impose tariff rates of 105 and 101 percent respectively to
agricultural imports (Panagariya 2005, p.10).
The perceived notion that current agricultural protection is much higher than manufactured
products (stated alternatively, that not further gain can be realised from already low protection
level in manufactured products) may be true in general, but need some qualifications. First,
with respect to developed countries, the average tariff imposed on manufactured imports from
developing countries are, on average, four time as high as those imposed on manufactured
imports from other high-income countries (Hertel and Martin 2000, p.464). Contrast this to
the fact that most food products from developing countries, except for some “sensitive items”,
already enter key developed markets of the EU and US virtually free of any tariff and the
notion of high agricultural tariff vis a vis manufacturing goods is less obvious. Again it lends
4
support to our view that liberalising trade in manufactured products should not be forgotten in
the name of disciplining agricultural trade.
The last among the list of our four perceived notions is the most contentious issue in the Doha
round and to which we devote most of this research. This notion is stated by Arvind
Panagariya somewhat differently as Fallacy # 2: “developed-country agricultural
subsidies and protection hurt the poorest developing countries most” (Panagariya
2005, p. 3) which we take to imply that agricultural trade liberalisation by developed
countries would benefit the developing countries the most. Panagariya believes this fallacy to
be the most important one to debunk from among the six fallacies that he states “because it
enjoys the near-universal acceptance” as well as its practical importance to LDCs.” The
simple but convincing argument offered here is the fact that many of the developing countries
are net food importers who would be faced with higher food prices should the developed
countries remove their export and domestic subsidies and import tariffs. Valdes and McCalla
(1999) state that of 48 of the world’s poorest countries, 33 were net importers of agricultural
products, and an even higher number of countries, 45, were net food importers. Our
calculation of welfare changes from agricultural reforms in developed countries alone lend
support to Panagariya’s debunking of this fallacy and points to other areas of reform in
developed and developing countries that have the potential to provide gains for the latter
groups.
The rest of the paper is structured as follows: in section 2 we discuss post-WWII history of
SDT. Modelling techniques and data are introduced in section 3, with an elaboration of the
commodities and regional aggregations selected. Section 4 reports and interprets the results
from the trade liberalisation experiments. Section 5 concludes with some policy
recommendations.
5

2. SPECIAL AND DIFFERENTIAL TREATMENT (SDT)
(a) SDT in GATT/WTO2
It would be fair to say that until the Uruguay Round, developing countries were either absent
from the negotiating table or their participation was not taken seriously in multilateral trade
negotiations. However, their development concerns and need for special treatment were
recognised by the developed members of GATT since its inception. As early as 1958, the
Haberler Report concluded that developing country export earnings were insufficient to meet
development needs and identified developed country trade barriers as significant part of the
problem.3 In 1964, the UN Conference on Trade and Development (UNCTAD) was formed
specifically to look after developing country interests. One year later (1965), Part IV of
GATT introduced three articles, encouraging industrial countries to assist developing nation
members "as a matter of conscious and purposeful effort" in their trading conditions and not
to expect reciprocity for concessions made to developing countries in negotiations. Another
measure, agreed at the end of the Tokyo Round in 1979 and normally referred to as the
"enabling clause", provided a permanent legal cover for the market access concessions made
by developed to developing countries under the generalized system of preferences (GSP).
Concluded in 1995, the single undertaking of the Uruguay Round meant all WTO members
had to accept all agreements which included smaller tariff cuts for developing
countries.Developing country members were also accorded longer phase-in periods. We
believe that a focus on the length of phase-in (adjustment) period is a better approach towards
improving development objectives compared to non-reciprocity as contained in earlier deals.
2 This section on how SDT has evolved in multilateral trade negotiations under GATT/WTO represents a summary from the writings of several authors, including Hoekman et al. (2003), Keck and Low (2004), Michalopoulos (2000), Pangestu (2000), Prowse (2002), Stevens (2002), and Whalley (1999). 3 Headed by Professor Gottfried Haberler, a Panel of Experts was formed as a result of a GATT ministerial level meeting in 1957. Failure of developing countries to deal with rising import demand and fluctuating commodity prices coupled with agricultural import protection in developed countries affecting LDC export revenues were considered as undesirable features in an accelerated trading environment following WWII.
6

At Doha, SDT provisions for developing countries have, if anything, been strengthened. The
Doha Ministerial declaration states "…the contribution of developing countries to market
access reduction commitments in the non-agricultural market access and agriculture
negotiations should take account of their levels of development in particular sectors, as well
as their food security, rural development and livelihood concerns.." Paragraph 44 of the Doha
Declaration calls for a review of all SDT provisions “with a view to strengthening them and
making them more precise, effective and operational. Finally, the text of the “July
framework” agreement makes clear that the Least-Developed Countries, which will have full
access to all special and differential treatment provisions as stated in section 2.2, are not
required to undertake reduction commitments. "The specific concerns of preference
dependent, commodity dependent countries and net food-importing developing countries shall
be appropriately addressed, in the context of multilateral liberalization commitments
undertaken in the Doha Round" (Doha Work Programme, Draft General Council Decision of
July 2004, WT/GC/W/5351, 31 July 2004).
SDT in terms of non-reciprocity, as contained in the Doha Ministerial Declaration was meant
for least-developed countries. WTO's concern here is that the least-developed countries have
legitimate implementation issues to address given the complexity of the Uruguay Round
agreements and their limited capacity to give effect to them domestically. The middle-income
developing countries like India or Argentina do not have these problems of comparable
magnitude to those of Sub-Saharan Africa. We have incorporated these concerns in our
simulation exercise by categorising the member states as (i) developed, (ii) developing, and
(iii) least developed economies for selective use of SDT in line with the DDA declaration. For
a list of these countries, see Appendix Table 2.
(b) SDT outside WTO
In February 2001, the EU General Affairs Council adopted the so-called "EBA (Everything
But Arms) Regulation”, granting duty-free access to imports of all products from least
7

developed countries without any quantitative restrictions, except to arms and munitions.4
This regulation is applicable from 5 March 2001. Currently 48 LDCs enjoy benefits of EBA
on a non-reciprocal basis.5 Only the three most sensitive products are not liberalised
immediately. These are fresh bananas, rice and sugar. Further, the EBA Regulation foresees
that the special arrangements for LDCs should be maintained for an unlimited period of time
and not be subject to the periodic renewal of the Community's scheme of generalised
preferences. The EU considers EBA as a very significant step to fulfil the objective of the
DDA.
The African Growth and Opportunity Act (AGOA) was promulgated in the USA in 2000. The
Act significantly liberalises trade between the U.S. and 37 designated Sub-Saharan African
countries, but does not cover LDCs elsewhere. The Act originally covered an 8-year period
from October 2000 to September 2008, but amendments added in July 2004 further extend
AGOA to 2015. Roughly 1,800 product lines including apparel and footwear and a variety of
agricultural products, which are of particular interest in this paper, were added to duty-free
access list to the U.S. market by the AGOA legislation.
The effect of these regional preferential arrangements on target LDCs has generally been
positive. Welfare gains from EBA alone were estimated in the range of US$300 million (Yu
and Jensen, 2005) to US$400 million (Bora et al., 2002). The latter study was commissioned
by UNCTAD. Similarly AGOA has had positive impact on target Sub-Saharan African
countries. For example textile and apparel imports rose by 80 percents from 1999 to 2002
from AGOA while vehicles and parts imports rose by an astounding 370 percent (Cline 2004,
p.269). Currently LDCs enjoy dual benefits from two of the largest markets- EU and US.
Preferential access means their exports enter duty-free while other measures in support of
4 Regulation 416/2001 of 26 February 2001, EU Official Journal no. L 60 of 1.3.2001. 5 The 48 LDCs are taken from the UN list, of which 39 are ACP countries. The non-ACP LDCs are: Yemen, Afghanistan, Bangladesh, Maldives, Nepal, Bhutan, Myanmar, Laos, and Cambodia. However, all GSP and EBA preferences for Myanmar have been suspended.
8

high cost domestic producers (tariffs on other countries and domestic subsidy) means
premium prices are received by LDCs. As Yu and Jensen (2005, p.375) argue, “multilateral
trade liberalisations resulting from WTO negotiations may reduce the attractiveness of these
preferences on both fronts.” Many high-cost LDC exporters could find themselves
disadvantaged as trade liberalisation advances on a most favoured nation (MFN) basis, which,
ironically, is also ideal in terms of maximising global welfare. Data used in our experiments
incorporate non-reciprocal tariff preferences such as those embodied in EBA and AGOA and
our estimates confirm these fears, lending support to the case for an alternative financial
package that may be offered to LDCs in a development friendly trade round.
3. MODEL, DATA AND LIBERALISATION EXPERIMENTS
The model and data
We use a slightly-modified version of the GTAP applied general equilibrium model (Hertel
1997. This is a relatively standard, multi-region model built on a complete set of economic
accounts and detailed inter-industry linkages for each of the economies represented.6 The
GTAP model and database are fully documented and publicly available.7 Although GTAP is
among the most sophisticated applied trade models currently available, it necessarily involves
some simplifications and abstractions from the real world. While resources are heterogeneous,
the production system distinguishes sectors by their intensities in just four primary production
factors: land (demanded by agricultural sectors only), natural resources (extractive sectors
only), capital, and labour. Some differentiation is introduced by dividing the labour resource
into two classes – skilled and unskilled. In this study, labour and capital are assumed to be
mobile between production sectors within each region. While substitution amongst the
6 An excellent summary of the major modules and equations of the model are found in Hertel (1997, Chapter 2). 7 See www.gtap.org for details.
9

employment of these resources in any sector in response to price changes is allowed,
intermediate inputs are used in fixed proportions in producing the various outputs.
While all units of output from any sector in a given country are assumed identical, traded
products are differentiated by country of origin, allowing bilateral trade to be modelled. This
formulation of the model also assumes perfectly competitive markets and constant returns to
scale in production. The standard GTAP macro closure is used here, by which investment at
the global level is adjusted to global savings through the use of a ‘global bank’ to assemble
savings and disburse investments. Therefore the global closure is neoclassical, while at the
regional level some adjustment in the mix of investment in response to trade policy reforms is
permitted. The model is solved using GEMPACK (Harrison and Pearson 1996).
Almost all individuals and agencies conducting analysis of the global implications of
agricultural liberalisation make use of the GTAP database. Our trade model is coupled with
the recently-released GTAP Version 6 database benchmarked to the year 2001. This
database contains a number of improvements compared with earlier versions. Trade-
weighted agricultural tariffs have been sourced from the MAcMap Database,8 including
tariff preferences such as those of the EBA and AGOA agreements affecting developing
countries, ad valorem equivalents of specific tariffs and tariff reductions as at 2001
associated with implementation of the URAA. Trade elasticities are amongst the most
critical parameters of global trade models, and are crucial in determining the terms of trade
effects associated with export expansion. This latest database uses estimates based on the
methodology of Hummels (1999) that used trade, tariff and transport cost data from various
countries to estimate a differentiated products model of import demand. Unlike the previous
database the elasticities are sector-specific and for the majority of farm sectors are larger
than the values in the previous database (Hertel et al. 2003). As in the previous database,
8 Market Access Map (MAcMap) is a joint development of ITC (UNCTAD-WTO, Geneva) and CEPII (Paris). It provides for 2001 bilateral measurement of applied tariffs, taking into account regional agreements and trade preferences.
10

agricultural export subsidies are based on country expenditure notifications to the WTO, and
agricultural domestic subsidies are classified as in the OECD’s PSE measure and data are
taken from that source. This means that output subsidies, input subsidies, and payments
based on land or capital (such as on livestock numbers) are represented separately.
International trade data are sourced from the UN COMTRADE database, agricultural
commodity balances and producer prices from the FAO, and input-output tables from
national sources.
The GTAP Version 6 database covers 87 regions and 57 commodity sectors. For this study,
we aggregate the database to 16 individual countries or country groupings, with remaining
countries aggregated into a rest-of-the world group, and 21 sectors. This aids computation and
enables us to highlight sectors and regions of particular interest. As regards regions, our
choices allow the definition of three regional groupings - developed, developing and the least
developed (see Appendix Table 2). At the sectoral level, we define a number of farm and
processed food sectors to enrich the agricultural reform components of our liberalisation
scenarios, including a crop-fibre sector to allow us to say something about impacts on the
cotton sector. Among other sectors, those associated with textiles, apparel and leather
products are separately modelled (see Appendix Table 1).
Scenario Design
It is not possible to model all the details of many of the proposals offered during the Doha
agricultural negotiations, such as those related to special safeguards, food aid, state trading
enterprises, export credits, and the non-trade concerns. In addition, other simplifications and
omissions are made, given the available data and trade model to be used here. For example,
the data to be used include the applied levels of tariffs rather than the bound rates. Any agreed
liberalisation will be phased in over a number of years, however the trade model used here is
comparative static in nature and the dynamic adjustment path to the targeted reductions in
support cannot be revealed.
11

The first scenario modelled here represents our interpretation of the ‘July framework’,
informed by the various proposals and texts presented during the WTO Round. They
incorporate changes within each of the major negotiation pillars – market access, export
competition and domestic support.
Export subsidies
We eliminate developed countries’ agricultural export subsidies by cutting subsidy
expenditures to zero. This has the effect in developed countries of equating domestic prices to
f.o.b. prices and export quantities adjust endogenously. Recognising their minor use of export
subsidies and the likelihood that they will face longer phase-out periods, we do not reduce
export subsidies in developing countries.
Import tariffs
The principles we apply to the design of tariff cuts are drawn from the ‘July framework’,
namely a tiered approach with tariff bands, higher tariffs subject to deeper cuts and
differential treatment for developing countries including no tariff reductions for the least-
developed countries. We use the URAA formula of fixed percentage cuts in some bands, and
a Swiss formula in others. In all cases, reductions are made from applied tariff rates (since it
is those that are included in the database) rather than the bound rates that are specified in the
‘July framework’ text. Clearly there is scope for our results to over-estimate responses to this
market access component of a liberalisation package, depending on actual gaps between
bound and applied rates. Gibson et al. (2001) reported a comparison of applied and bound
rates for several developing countries that revealed applied tariffs substantially below bound
levels in several cases. They also reported, however, that many developing countries and most
developed countries tend to apply tariffs at the bound rate.
12

For agricultural tariffs in developed countries, all those below 5% are eliminated. A formula
similar to that of the URAA is applied to reduce tariffs in the range of 5% to 55% by 36%.
Remaining agricultural tariffs in developed countries (those above 55%) are reduced with a
Swiss formula, calibrated so that a tariff of 55% is reduced by 36%, with increasingly deeper
cuts to higher tariffs9. Special and differential treatment (SDT) for developing countries is
recognised through a modality that reduces all agricultural tariffs under 100% by 20%, with
those over 100% being reduced by 30%. For any base tariff, this approach ensures a smaller
tariff reduction for developing countries compared with any of the developed country
modalities. Reforms to non-agricultural market access are modelled via a Swiss formula tariff
reduction, with a=16 for developed countries and a=50 for developing regions. Finally, no
reforms are applied to the least-developed regions.
Table 1 Tariff Reductions for Scenario Simulation Developed countries Agricultural commodities If to ≥ 55%, Swiss formula: a=100
If 5% ≤ to < 55%, t1 = to * 0.64 If to < 5%, t1 = 0%
Non-agricultural commodities
Swiss formula: a=16
Developing countries
Agricultural commodities If to ≥ 100% t1 = t0 * 0.7 If 0 < to < 100%, t1 = t0 * 0.8
Non-agricultural commodities
Swiss formula: a=50
Least developed countries
No changes to agricultural or non-agricultural commodities
Note: t0 is the base tariff; t1 is the post-reform tariff.
9 The Swiss formula is t1 =(a*to) / (a+to), where to and t1 are the initial and final tariffs, respectively. This approach (which was used to reduce tariffs on industrial goods in the GATT Tokyo Round) makes deeper tariff cuts, the higher the initial tariff, with the severity of the cuts increasing as the parameter ‘a’ is made smaller.
13

Domestic support
Modelling domestic support reform using the Global Trade Analysis Project (GTAP) data that
we have available is problematic for a number of reasons. One is that the GTAP data come
from the OECD’s Producer Support Estimate (PSE) data, and therefore do not directly
correspond to the WTO’s amber (AMS), blue and green box classifications. In addition, and
given the assumption that countries with administered market price support schemes in
agriculture will lower such support prices in parallel with any tariff or export subsidy
reduction, then the latter will contribute to any reduction commitment regarding the WTO’s
Aggregate Measure of Support (AMS). Nevertheless, in the following way we attempt to
capture the spirit of the ‘July framework’ principles of reducing the total bound AMS, de
minimus and agreed blue box payments (the latter being the greater of actual expenditure in
the base year and 5% of the total value of farm production), and differential treatment of
developing countries.
A base-year total of the above three domestic support components was calculated and then
reduced by 50%. That value was then compared with a country’s actual base support spending
to determine the level of cut to be modelled. We will focus only on domestic support
payments of the EU15, the USA, Japan and EFTA (Switzerland10 and Norway only) since
WTO notifications for 2000 indicate that together they accounted for over 97% of the sum of
total amber (AMS), de minimus and blue box payments. This is an extreme-tiered approach,
since we applied zero reductions for all other countries.
Our estimates required cuts in the sum of total AMS, de minimus and blue box actual
payments amounted to 31% for the EU15, 25% for the USA, nil for Japan and 35% for
EFTA.11 These were all less than our assumed nominal 50% cut in domestic support. Main
10 Latest notifications for Switzerland were for 1998. 11 The cuts were computed as: [(AMSA + dm + BLUEA) – (AMSB + dm + max{BLUEA, 0.05*TVAP})/2] / [(AMSA + dm + BLUEA) where AMSA, AMSB are actual and bound AMS spending; dm is de minimus spending; BLUEA,
14

reasons for the EU and US are that in 2000 (the most recent year for which detailed
notifications were available for these countries), US blue box spending was zero12 and thus a
base value of 5% of the value of agricultural output was used, and the EU’s spending on AMS
was only 63% of the bound value. In the case of Japan, actual blue box spending was well
below the alternative base value of 5% of production, and actual AMS spending was less than
20% of the bound value. Finally, we applied these percentage cuts to each of the output
subsidy, intermediate input subsidy, and land and capital payment categories, for each farm
output in the GTAP database for these countries. In this way, domestic support payments to
any farm output cannot be increased, reflecting the ‘July framework’ cap on product-specific
support (Table 2).
Table 2 Domestic Support Reductions Region Formula USA, EU, Japan and EFTA Applied to all farma output and intermediate input subsidies, and subsidies to land and capital
USA: 25% cut in subsidy expenditures EU: 31% cut in subsidy expenditures Japan: 0% cut in subsidy expenditures EFTA: 35% cut in subsidy expenditures
Other developed countries No changes Developing countries
No changes
Least developed
No changes
a. All farm production sectors as listed in Appendix Table 1.
Non-agricultural market access
The Doha Ministerial Mandate describes the negotiations as a ‘single undertaking’ and it is
unrealistic to imagine further agricultural liberalisation being agreed in the absence of reforms
in other areas. With respect to market access for non-agricultural products, the Mandate states
that such negotiations shall aim to reduce or eliminate tariffs, and that product coverage shall
BLUEB are actual and base Blue box spending; and TVAP is total value of agricultural production. Should this computation give a negative result, the cut would be zero. 12 Notified Blue box spending by the US has been nil from 1996 to 2000, due to changes in the 1996 Farm Bill.
15

be comprehensive without a priori exclusions. The Chair of the Negotiating Group on Non-
Agricultural Market Access circulated a draft of modalities on 16 May 2003 (WTO 2003).
This included the suggestion that a Swiss formula approach be taken to reduce such tariffs
from the 2001 bound levels. While no specific numerical parameter was provided, the
suggested formula would, for any given base tariff, provide a required tariff reduction that
would be larger, the higher a country’s average level of non-agricultural tariffs. While no
members rejected the draft modalities as a basis for negotiation, this Group could not reach
agreement before its end-of-May 2003 deadline with many negotiators expressing the view
that non-agricultural progress must await movement in agriculture.13
The ‘July framework’ instructs the Group to “continue its work on a non-linear formula” with
no further details on modalities. It is unrealistic therefore to consider liberalisation scenarios
only involving agricultural products. Therefore a Swiss formula with a=16 as used in the
Tokyo Round (Laird and Yeats, 1987) is used in all scenarios to calculate tariff reductions for
all non-agricultural tariffs in developed countries, and a=50 for developing countries. As for
agricultural reforms, no tariff cuts are applied to the least-developed countries.
We also construct a second scenario that is identical to the above in all respects except for the
treatment of tariffs. Here, we assume that no SDT applies to developing countries, whose
agricultural, TLA and manufactured tariffs are assumed to be reduced according to the same
modalities as applied to the developed countries. SDT is assumed still to apply to the least-
developed regions.
4. RESULTS AND DISCUSSION
Regional welfare gains from the first scenario are reported in Table 3 below. Table 4 then
goes on to decompose global welfare gains by type of reform and their origin from developed
or developing regions and Table 5 reports welfare results should reforms be limited to 13 BRIDGES Weekly Trade News Digest 7(19), 28 May 2003
16

agriculture in developed countries. WTO member states are still negotiating on actual tariff-
cutting formulas so that tariff and domestic subsidy reductions applied are hypothetical and
taken as "reasonable" in our judgement. However, the one area of firm agreement in the July
2004 framework accord is elimination of all export subsidies by developed countries in
agriculture. Accordingly, we calculate and report regional welfare gains from its
implementation in Table 6. Tables 7-13 then give estimates of welfare gains to selected
developing economies - all under scenario 1. These tables are reported at the end of this
section. Gains to these developing countries are also decomposed by type of reform and
whether they are initiated in developed or developing regions. All gains are calculated as
equivalent variation measures and measured in 2001 US dollars.
Table 3: Welfare Changes from Reform (Equivalent Variation) Region Scenario #1 Scenario #2
Change in Welfare (US$million)
Change in real GDP (%)
Change in Welfare (US$million)
Change in real GDP (%)
rest_NAFTA -53 0.08 -70 0.09 USA 1165 0.01 1306 0.01 Japan 11401 0.28 13172 0.28 China 3562 0.29 4069 0.48 ASEAN5 1755 0.11 2473 0.22 NEAsia 3586 0.21 11568 1.04 LDC_Asia 425 0.03 561 0.05 LDC_Africa -209 -0.05 -93 -0.03 EFTA 6105 1.28 6171 1.28 Rest_Eur -134 0.04 -76 0.15 CER 1461 0.08 1503 0.08 EU_new 145 0.07 285 0.07 Indi_SL 926 0.35 1191 0.60 EU 5143 0.10 7076 0.10 Sth_America 2110 0.06 1616 0.10 SACU 402 0.17 582 0.28 ROW 2174 0.31 2770 0.43 Global 39965 54104
17
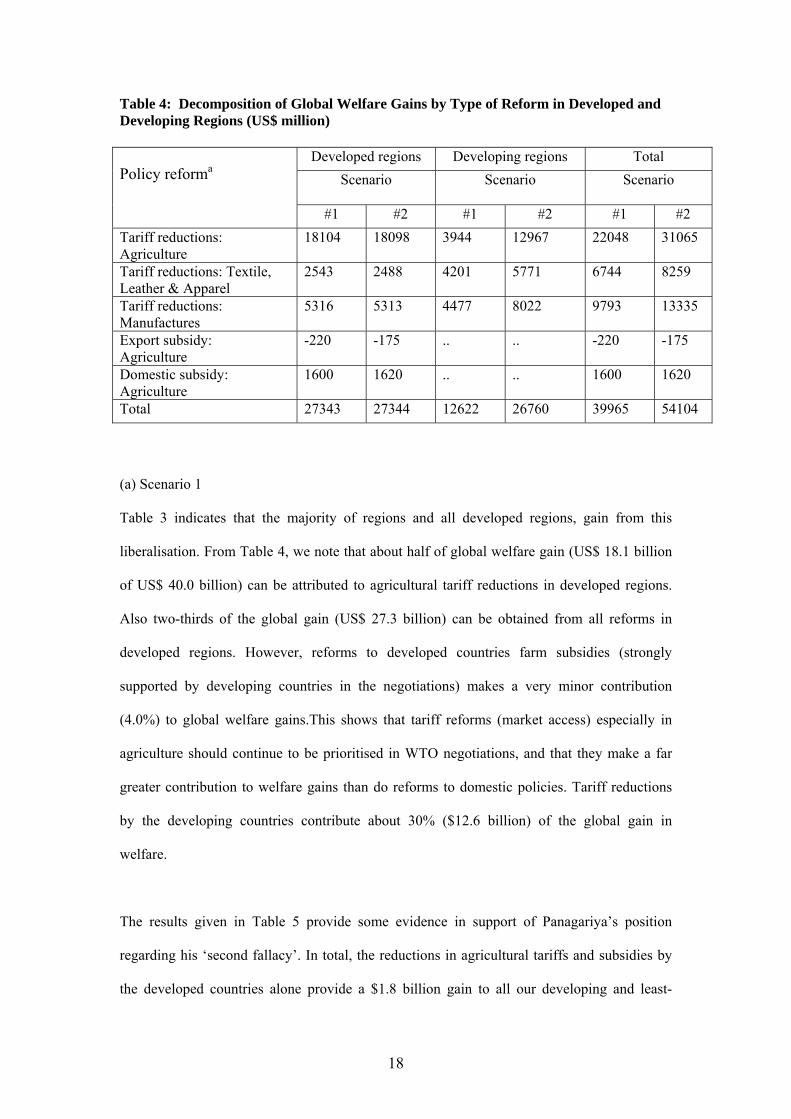
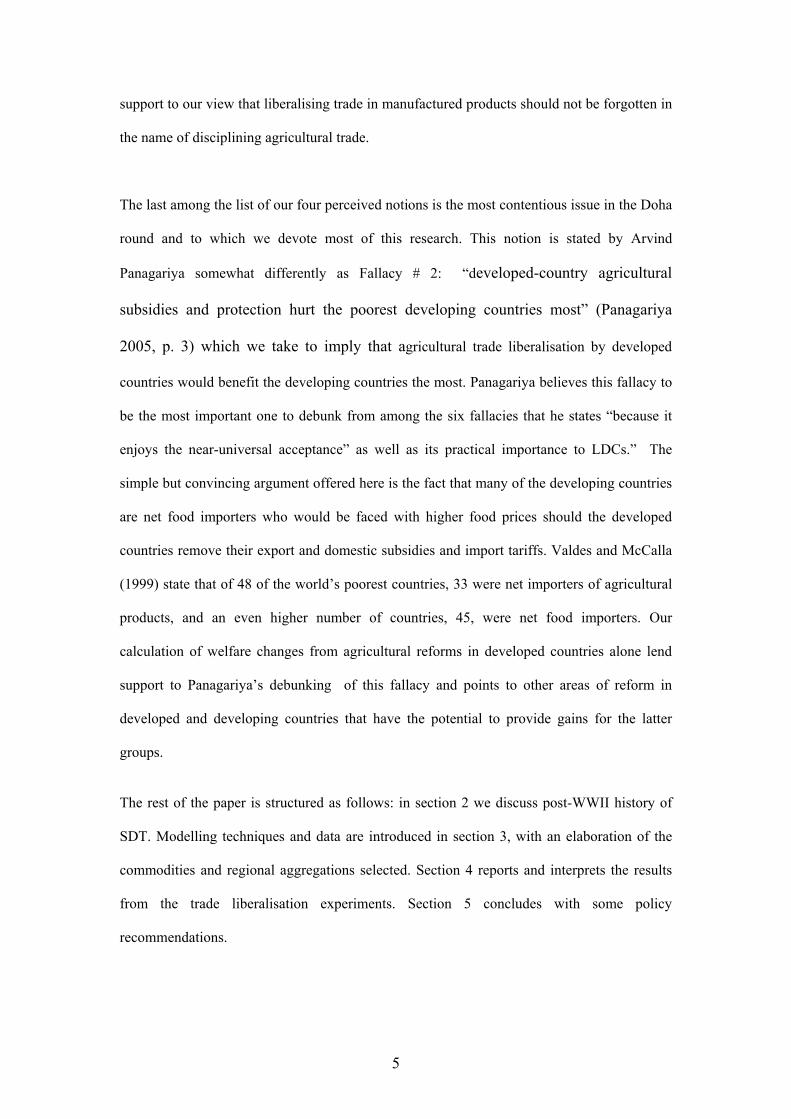
Table 4: Decomposition of Global Welfare Gains by Type of Reform in Developed and Developing Regions (US$ million)
Developed regions Developing regions Total Scenario
Scenario Scenario
Policy reforma
#1 #2 #1 #2 #1 #2 Tariff reductions: Agriculture
18104 18098 3944 12967 22048 31065
Tariff reductions: Textile, Leather & Apparel
2543 2488 4201 5771 6744 8259
Tariff reductions: Manufactures
5316 5313 4477 8022 9793 13335
Export subsidy: Agriculture
-220 -175 .. .. -220 -175
Domestic subsidy: Agriculture
1600 1620 .. .. 1600 1620
Total 27343 27344 12622 26760 39965 54104
(a) Scenario 1
Table 3 indicates that the majority of regions and all developed regions, gain from this
liberalisation. From Table 4, we note that about half of global welfare gain (US$ 18.1 billion
of US$ 40.0 billion) can be attributed to agricultural tariff reductions in developed regions.
Also two-thirds of the global gain (US$ 27.3 billion) can be obtained from all reforms in
developed regions. However, reforms to developed countries farm subsidies (strongly
supported by developing countries in the negotiations) makes a very minor contribution
(4.0%) to global welfare gains.This shows that tariff reforms (market access) especially in
agriculture should continue to be prioritised in WTO negotiations, and that they make a far
greater contribution to welfare gains than do reforms to domestic policies. Tariff reductions
by the developing countries contribute about 30% ($12.6 billion) of the global gain in
welfare.
The results given in Table 5 provide some evidence in support of Panagariya’s position
regarding his ‘second fallacy’. In total, the reductions in agricultural tariffs and subsidies by
the developed countries alone provide a $1.8 billion gain to all our developing and least-
18

developed countries and regions. However, by far the major beneficiaries are the agricultural
exporting nations of South America. These reforms if restricted to the developed countries are
estimated to hurt other developing regions, most notably the least-developed countries of sub-
Saharan Africa. These points are further illustrated in Figure 1, where elimination of export
subsidies and reductions in domestic subsidies are shown to have a negative effect on welfare
in many of the developing countries. The welfare gains to these countries are overwhelmingly
due to improved market access into the developed countries, for both agricultural and non-
agricultural goods.
Table 5: Impacts of Agricultural Reform in Developed Countries on the Developing Regions (US$million)
a. Summed over reforms to agricultural tariffs, domestic support and export subsidies.
Developing Country/Region Change in welfare due to Developed agricultural reforms a
China -81 ASEAN5 378 NEAsia -329 LDC_Asia 80 LDC_Africa -204 Indi_SL -5 Sth_America 1810 SACU 140
Table 6: Export subsidy: Contributions to Regional Gains in Welfare Due to Removal of Ag. Export Subsidy by Developed Countries Region Welfare gain
(US$million) European Union 2279 CER + S. America 371 LDC Asia + LDC Africa -270 Other developing regions -1510 Other developed regions -1091 Total -220
19
Much of the recent rhetoric over the WTO negotiations has been on agricultural export
subsidies. The decision reached in the July 2004 accord to remove agricultural export
subsidies would appear, however, to contribute little to global welfare gains – in fact, we
estimate a loss in welfare (Table 6). By far the main beneficiary is expected to be the EU (not
surprising since this region accounts for nearly all of the global spending on such subsidies),
but there is also some gain to CER (Australia and New Zealand) and South America owing to
improved terms-of-trade (ToT) for their agricultural exports. This result can be seen as a
rationalisation of the EU's support to remove all export subsidies in the framework agreement.
The corollary of this, of course, is that the least developed food-importing regions, as well as
other developed and developing regions experience a negative welfare impact from removal
of agricultural export subsidies because of the adverse ToT effect on food imports. Thus the
one solid agricultural outcome of the Doha Development Agenda thus far is shown to be of
little or no benefit to many developing countries.
Table 3 showed that most regions have welfare gains. However, three primarily-developing
regions show welfare loses – LDC_Africa, the rest of Europe (i.e. Europe apart from EU-25
and EFTA) and the rest-of-NAFTA group which includes Mexico. Estimates of welfare
changes to developing regional economies, including a break down of these gains from
selected policy reforms under scenario 1 are reported in Tables 7-13. For China (Table 9),
TLA tariff cuts in developed regions contributed half of her welfare gain, and other
significant contributions resulted from reform of agricultural and manufactured tariffs in
developing countries. The results are very similar for LDC_Asia (Table 10), although
developed country reform of agricultural tariffs are also important here. India_SL (Table 11)
benefits primarily from developing region cuts in agricultural and manufacturing tariffs (also
reflecting this region's high tariffs in these sectors) and TLA tariff cuts in developed regions.
The countries of the South African Customs Union (SACU, Table 13) benefit primarily from
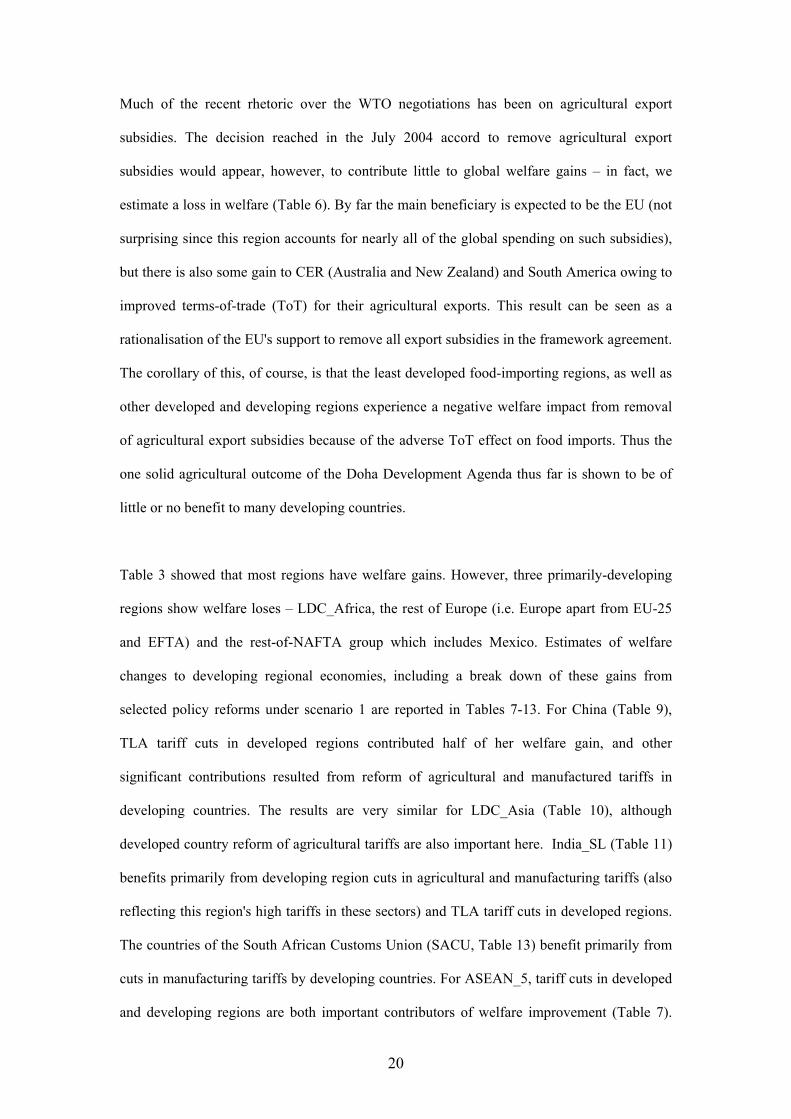
cuts in manufacturing tariffs by developing countries. For ASEAN_5, tariff cuts in developed
and developing regions are both important contributors of welfare improvement (Table 7).
20

Gains to South America are entirely due to developed country reforms, especially in access to
their agricultural markets. This is also the only developing region in our analysis that would
suffer a welfare loss from trade liberalisation by the developing world.
LDC_Africa experienced a welfare loss in this scenario, by far the major contributor being the
developed country removal of agricultural export subsidies (Table 8). Other contributing
factors to this loss were developed country TLA and manufacturing tariff cuts, in which there
would be an element of loss of preferences. However cuts in developed country agricultural
tariffs and support to their farmers (including cotton) made a positive contribution. Table 14
shows that LDC-Africa's cotton output rose 7.5% and her exports by 12%. In each case, one-
half of the increase was due to the reductions in domestic support in developed regions
(mainly EU and US). The global (import) price index for this sector increased about 3%, with
two-thirds of that increase due to cuts in domestic farm support (Table 15).
(b) Scenario 2
In this scenario, developing regions are assumed to make the same reductions in tariffs as do
their developed country counterparts. The result was an extra $14 billion (35%) added to
world welfare gains (Table 3). Over 70% ($10 billion) of that additional $14 billion is gain to
the developing (primarily NE_Asia) and least-developing countries (Figure 2). Of the $14
billion, 64% is due to developing countries additional cuts to their own agricultural tariffs,
11% due to further cuts in developing country TLA tariffs and the remaining 25% to their
additional manufacturing tariff cuts (Table 4). These results suggest a case could be made for
special and differential treatment (SDT) that involves a longer phase-in period, but not lower
tariff reductions.
5. CONCLUDING OBSERVATIONS
The findings of this paper point to some useful policy considerations in the current round of
trade liberalisation under the DDA. The importance of tariff reforms in developed and
21

developing countries is highlighted by the results of the reform scenarios simulated in the
study. In particular, tariff reforms that affect agricultural trade by allowing greater market
access in the developed countries have much to recommend themselves. Likewise, reduction
in tariffs on all imports by developing countries also helps improve welfare of both groups of
countries, developed and developing.
One interesting, if unconventional, finding of the study has been the virtual insignificance of
the removal of agricultural export and domestic subsidies in developed countries as a means
to improving the welfare of the developing countries. In fact, the decline in the terms of trade
facing these latter countries as a consequence of any removal of such export subsidies would
make them worse off in welfare terms, at any rate in the short term. We showed some
evidence that countries belonging to the LDC_Africa group would benefit from the prospect
of increased trade in cotton resulting when domestic support by the US and EU are reduced.
The principal beneficiary of such reductions would be the EU. Given its widespread use of
such subsidies, this finding is hardly surprising. Nevertheless, such subsidies are globally
trade distorting, and should therefore be considered in need of reform as part of a long term
strategy. The long term production response of the developing countries in the face of rising
prices of agricultural, particularly food, products, should such subsidies be removed or
reduced, would be a relevant issue in setting any targets for policy reform involving export
subsidies. The gains accruing to the beneficiary countries such as the EU (and possibly the
US) could well be used to set up transitional assistance funds to alleviate the short run decline
in the welfare of the developing countries.
Antimiani et al. (2005) also used the GTAP model with the Version 6 database to simulate
welfare impacts of trade reform on regional economies. The results are qualitatively similar to
ours in that OECD countries together with the Cairns group nations benefit the most from
global agricultural reforms. When it comes to African, South Asian, and Latin American
countries, Antimiani et al. (2005) find that most of these countries (fewer for Latin America)
22

would be left worse off. Lack of diversification of these economies means that unlike OECD
(or developed) countries, relocation of resources cannot easily take place in response to new
price signals following global agricultural reforms. Unlike our study, their research is
restricted to agricultural trade liberalisation scenarios only. We find gains from reduction in
tariffs on labour intensive manufactured goods such as textiles, apparel and leather would be
enjoyed by developing countries with a more diversified economic structure such as China,
India and the ASEAN_5. Such reductions would also open up more South-South trade, to the
benefit of all developing countries.
Finally, the study suggests that developing countries can make substantial additional gains by
accepting similar agricultural and manufacturing tariff cuts to those of the developed world,
and not lobbying for SDT in this regard, making way for increased imports from developed
and other developing countries. It may be necessary however to phase-in such tariff cuts,
given the short run difficulties the developing countries are bound to face when their trade is
freed up. We also suggest scope for the creation of international financing of adjustments in
the developing world, financed from the reform-driven gains to developed countries. The
SDT negotiations could well be the route to such a reform agenda. However a word of
caution is appropriate, as Charlton and Stiglitz (2005) argue that CGE models like the ones
we used, do not address adjustment costs nor the fact that implementation and adjustment
costs following trade liberalisation are likely to be higher in developing countries. These
result from weak safety nets and inefficient risk markets (Charlton and Stiglitz 2005, p.300).
Tariff revenues account for a significant proportion of government revenue. Trade
liberalisation would jeopardise this important source of government revenue in addition
worsening income distributions. Attempts to recoup this loss as well as redistributive justice
would mean increases in other taxes leading to increased deadweight losses. These may offset
efficiency gains from trade liberalisation.
23
Table 7: Decomposition of ASEAN 5 Welfare by Type of Reform in Developed and Developing Regions (US$ million) Policy reform Developed regions Developing regions Total Tariff reductions: Agriculture 455 154 609 Tariff reductions: Textile, Leather & Apparel
599 -53 546
Tariff reductions: Manufactures 78 599 677 Export subsidy: Agriculture -73 .. -73 Domestic subsidy: Agriculture -3 .. -3 Total 1056 700 1756
Table 8: Decomposition of LDC_Africa Welfare by Type of Reform in Developed and Developing Regions (US$ million) Policy reform Developed regions Developing regions Total Tariff reductions: Agriculture 27 15 42 Tariff reductions: Textile, Leather & Apparel
-18 8 -10
Tariff reductions: Manufactures -11 1 -10 Export subsidy: Agriculture -232 .. -232 Domestic subsidy: Agriculture 2 .. 2 Total -232 26 -206
Table 9: Decomposition of China’s Welfare by Type of Reform in Developed and Developing Regions (US$ million) Policy reform Developed regions Developing regions Total Tariff reductions: Agriculture 126 830 956 Tariff reductions: Textile, Leather & Apparel
1742 267 2009
Tariff reductions: Manufactures 29 774 803 Export subsidy: Agriculture -91 .. -91 Domestic subsidy: Agriculture -116 .. -116 Total 1690 1871 3561
24

Table 10: Decomposition of LDC_Asia Welfare by Type of Reform in Developed and Developing Regions (US$ million) Policy reform Developed regions Developing regions Total Tariff reductions: Agriculture 117 37 154 Tariff reductions: Textile, Leather & Apparel
311 -88 223
Tariff reductions: Manufactures -2 88 86 Export subsidy: Agriculture -38 .. -38 Domestic subsidy: Agriculture 0 .. 0 Total 388 37 425
Table 11: Decomposition of Welfare Change in India + Sri Lanka by Type of Reform in Developed and Developing Regions (US$ million) Policy reform Developed regions Developing regions Total Tariff reductions: Agriculture -13 250 237 Tariff reductions: Textile, Leather & Apparel
238 -117 121
Tariff reductions: Manufactures -43 603 560 Export subsidy: Agriculture 1 .. 1 Domestic subsidy: Agriculture 8 .. 8 Total 191 736 927
Table 12: Decomposition of Welfare Change in Sth_America by Type of Reform in Developed and Developing Regions (US$ million) Policy reform Developed regions Developing regions Total Tariff reductions: Agriculture 1535 121 1656 Tariff reductions: Textile, Leather & Apparel
316 -123 193
Tariff reductions: Manufactures 114 -129 -15 Export subsidy: Agriculture 46 .. 46 Domestic subsidy: Agriculture 229 .. 229 Total 2240 -131 2110
25

Table 13: Decomposition of Welfare Change in SACU by Type of Reform in Developed and Developing Regions (US$ million) Policy reform Developed regions Developing regions Total Tariff reductions: Agriculture 133 9 142 Tariff reductions: Textile, Leather & Apparel
7 45 52
Tariff reductions: Manufactures 12 188 200 Export subsidy: Agriculture -5 .. -5 Domestic subsidy: Agriculture 12 .. 12 Total 159 242 402
Table 14: Changes to LDC-Africa’s Cotton Economy: Scenario #1
Variable Total change Change due to developed countries reforms of:
Agricultural tariffs
TLA tariffs Agricultural domestic support
Net exports US$91.5million 22.9 27.3 34.8 Output 4.4% 1.09 1.58 1.66 Producer price 0.687% 0.19 0.16 0.31 Total export volume 6.97% 1.72 2.16 2.60
Table 15: Change in Global Import Price Index of Crop Fibre (Cotton): Decomposition by Type of Reform in Developed and Developing Regions (percentage change) : Scenario #1
Policy reform Developed regions Developing regions Total
Tariff reductions: Agriculture 0.45 -0.05 0.40 Tariff reductions: Textile, Leather & Apparel
0.11 -0.06 0.05
Tariff reductions: Manufactures -0.03 -0.09 -0.12 Export subsidy: Agriculture 0.25 .. 0.25 Domestic subsidy: Agriculture 0.95 .. 0.95 Total 1.73 -0.20 1.53
26

Figure 1 Developed Country Reforms: What Matters to the Developing World? (Scenario #1)
-1000
-500
0
500
1000
1500
2000
2500
China
ASEAN5
NEAsia
LDC_Asia
LDC_Afri
ca
Indi_SL
Sth_Ameri
caSACU
ROW
US$
mill
ion
tariffsexport subsidiesdomestic support
Figure 2 Boost to Developing World's Welfare due to Deeper Reforms of Own Tariffs
-2000
0
2000
4000
6000
8000
10000
12000
14000
China
ASEAN5
NEAsia
LDC_A
sia
LDC_A
frica
Indi_SL
Sth_Amer
icaSACU
ROW
US$
mill
ion
scenario #1scenario #2
27

References
Antimiani, A., Conforti, P and Salvatici, L. (2005) “Alternative Scenarios and Strategic
Interactions between Developed and Developing Countries in the Agricultural Trade
Negotiations of the Doha Round: A Reappraisal”. Paper presented to 8th Annual
Conference on Global Trade Analysis, Lubeck, Germany, 9-11 June 2005.
Bora, B., L. Cernat and A. Turrini (2002), 'Duty and Quota-free Access for LDCs: Further
Evidence from CGE Modeling', Policy Issues in International Trade and
Commodities Study Series No. 13, UNCTAD, United Nations (New York and
Geneva).
Charlton, Andrew H. & Stiglitz, Joseph E. (2005) A Development-friendly Prioritisation of
Doha Round Proposals. The World Economy 28 (3), 293-312.
Gibson, P., Wainio, J., Whitley, D. and Bohman, M. (2001). Profiles of Tariffs in Global
Agricultural Markers, Agricultural Economic Report No. 796. Economic Research
Service, USDA, Washington, DC.
Harrison, W.J., Pearson, K.R. (1996). “Computing Solutions for Large General Equilibrium
Models using GEMPACK,” Computational Economics 9, 83-127.
Hertel, T.W., Hummels, D., Ivanic, M., and Keeney, R. (2003). “Hoe Confident Can We Be
in CGE-Based Assessments of Free Trade Agreements?”, GTAP Working Paper No.
26, Purdue University, USA.
Hertel, T.W. and Martin, W. (2000). “Liberalising Agriculture and Manufactures in a
Millennium Round: Implications for Developing Countries,” World Economy, 455-
469, (April).
Hertel, T.W. (Ed.), (1997). Global Trade Analysis: Modeling and Applications. Cambridge
University Press, Cambridge and New York.
28

Hoekman, B., Michalopoulos, C., Winters, L. A. (2003) "Special and Differential Treatment
for Developing Countries: Towards a New Approach in the WTO", World Bank:
mimeograph.
Hummels, D. (1999). “Towards a Geography of Trade Costs,” GTAP Working Paper No. 17, Purdue University, USA.
Keck , Alexander and Low, Patrick. (2004) “Special and Differential Treatment in the WTO:
Why, When and How?” Staff Working Paper ERSD-2004-03, Economic Research
and Statistics Division, WTO, May.
Laird, S. and Yeats, A. (1987), ‘Tariff cutting formulas—and complications’, in Finger,
J.M. and Olechowski, A. (eds.) The Uruguay Round: a Handbook for the Multilateral
Trade Negotiators, World Bank, Washington DC.
Olarreaga, Marcelo & Özden, Çaglar (2005). AGOA and Apparel: Who Captures the Tariff
Rent in the Presence of Preferential Market Access?. The World Economy 28 (1), 63-
77.
Panagariya, A (2005) “Agricultural liberalisation and the developing countries :debunking the
fallacies”. Available at http://www.columbia.edu/~ap2231/
Pangestu, M. (2000) "Special and Differential Treatment in the Millenium: Special for
Whom and How Different?", The World Economy 23, 9: 1285-1302.
Prowse, S. (2002) "The Role of International and National Agencies in Trade-related
Capacity Building", The World Economy 25, 9: 1235-1261.
Shakur, S., Rae, A N., and Chatterjee, S. (2004) “A Road Ahead from Cancun? Weighing up
Some Give-and-Take Scenarios in a DDA Spirit”, Discussion Paper No. 04.10,
Applied and International Economics, Massey University, Palmerston North, June.
Rae, A., Chatterjee, S. and Shakur, S. (2001), ‘The Sectoral Approach To Trade
Liberalisation: Should We Try To Do Better?, International Trade Journal, 15(3),
293-322.
29

Rae, Allan and Strutt, Anna (2005) “Multilateral Agricultural Trade Reform: Potential
Impacts of Current Negotiations on New Zealand” New Zealand Economic Papers,
38(2): 175-205.
Rae, A.N. & Strutt, A. (2003) The current round of agricultural trade negotiations: should we
bother about domestic support? The Estey Centre Journal of International Law and
Trade Policy, 4(2), pp. 98-122.
Valdes, Alberto and McCalla, Alex F., (1999) “Issues, Interests and Options of Developing
Countries,” presented at the joint World Bank and WTO Conference on Agriculture
and the New Trade Agenda in the WTO 2000 Negotiations, October 1-2, 1999,
Geneva, Switzerland.
Whalley, J. (1999) "Special and Differential Treatment in the Millenium Round", World
Economy 22, 8: 1065-1093.
WTO (2003). Draft Elements of Modalities for Negotiations on Non-agricultural Products.
TN/MA/W/35/Rev.1, World Trade Organisation, Geneva.
Yu, Wusheng & Jensen, Trine Vig (2005) Tariff Preferences, WTO Negotiations and the
LDCs: The Case of the 'Everything But Arms' Initiative. The World Economy 28 (3),
375-405.
30

Appendix: Definition of regions and sectors: Appendix Table 1: Sectoral Aggregation
Sector name Description Farm production:
Rice Paddy rice grain_oilsd Wheat, other grains, oilseeds hort Fresh fruit, vegetables & nuts crop_fibre Plant-based fibres (e.g. cotton) oth_crops Other crops (e.g. sugar) animal_prod Livestock farming Milk Milk Other natural resource based:
nat_res Forestry, fishing, coal, oil & gas, other minerals Processed food sectors:
meat Red and white meats dairy Dairy products sugar Refined sugar oth_procfood All other processed foods Textiles & clothing:
textile Textiles apparel Wearing apparel leather Leather products Other manufacturing and service sectors:
natres_prods Wood & paper products, petroleum, coal, chemical, rubber & plastic products
metals Ferrous metals, metal products transprt Motor vehicles, transport equipment & parts elctronic Electronic equipment oth_mnfcs Others Svces All services
31

Appendix Table 2: Regional Aggregation
Region name Description Developed regions
rest_NAFTA Canada, Mexico USA USA Japan Japan CER Australia, New Zealand EU EU-15 EU_new The ten new members as of 2004 EFTA Switzerland, rest of EFTA Developing regions
China Mainland China ASEAN5 Indonesia, Malaysia, Thailand, Philippines, Singapore Indi_SL India, Sri Lanka NEAsia South Korea, Hong Kong, Taiwan Sth_America Caribbean, Central & South America Rest_Eur Rest of Europe including Russia SACU South Africa, Botswana & rest of South African CU ROW Turkey, Morocco, & rest of Middle East & North Africa Least developed regions
LDC_Asia Vietnam, Bangladesh, rest of East, South & Southeast Asia, Pacific Islands
LDC_Africa Rest of Sub-Saharan Africa
32
Related Documents