Speaker normalization in speech perception Keith Johnson Ohio State University Acoustic-phonetic analysis of speech, made practical by the advent of the speech spectrograph (Koenig, Dunn & Lacy, 1946), prompted a number of foundational questions regarding the perception of speech because spectrograms showed that speech is highly variable both within and between talkers. Among early researchers, Liberman et al. (1967) focussed on within-talker variation in the acoustic cues for stop place of articulation, while others focussed on between-talker variation in the acoustic cues for vowels. “Speaker normalization” refers to this second line of research centering on the fact that phonologically identical utterances show a great deal of acoustic variation across talkers, and that listeners are able to recognize words spoken by different talkers despite this variation. In defining speaker normalization in this way, we assume that phonological identity occurs when utterances are identified by listeners as instances of the same linguistic object (word or phoneme). For example, the word “cat” spoken by a man and a woman might be identified as “cat” by listeners though spectrograms will show that the man and woman have quite different vowel formant frequencies (Figure 1). --------------------- Figure 1. Spectrograms of a man and a woman saying “cat”. The three lowest vowel formants (vocal tract resonant frequencies) are marked as F1, F2, and F3. --------------------- 1

Welcome message from author
This document is posted to help you gain knowledge. Please leave a comment to let me know what you think about it! Share it to your friends and learn new things together.
Transcript
Speaker normalization in speech perception
Keith JohnsonOhio State University
Acoustic-phonetic analysis of speech, made practical by the advent of the speech
spectrograph (Koenig, Dunn & Lacy, 1946), prompted a number of foundational questions
regarding the perception of speech because spectrograms showed that speech is highly variable
both within and between talkers. Among early researchers, Liberman et al. (1967) focussed on
within-talker variation in the acoustic cues for stop place of articulation, while others focussed on
between-talker variation in the acoustic cues for vowels. “Speaker normalization” refers to this
second line of research centering on the fact that phonologically identical utterances show a great
deal of acoustic variation across talkers, and that listeners are able to recognize words spoken by
different talkers despite this variation. In defining speaker normalization in this way, we assume
that phonological identity occurs when utterances are identified by listeners as instances of the
same linguistic object (word or phoneme). For example, the word “cat” spoken by a man and a
woman might be identified as “cat” by listeners though spectrograms will show that the man and
woman have quite different vowel formant frequencies (Figure 1).
---------------------
Figure 1. Spectrograms of a man and a woman saying “cat”. The
three lowest vowel formants (vocal tract resonant frequencies) are
marked as F1, F2, and F3.
---------------------
1
The most dramatic demonstration of between-speaker acoustic vowel variation is the
well-known study reported by Peterson and Barney (1952). Figure 2 shows their plot of the
first two vowel formant frequencies (F1 and F2) of vowels produced by men, women and
children. All of the vowels represented in the figure were correctly identified by listeners. This
figure - one of the most frequently reprinted in all of phonetics - has prompted decades of
research, and serves as a starting point for this contribution
------------------------
Figure 2. Scatter plot of first and second formant frequency values
of American English vowels. From Peterson & Barney (1952).
-------------------------
Speaker normalization research prompted by between-talker vowel formant variation
seeks to explain how listeners can correctly identify vowels when the main acoustic cues for
vowel identity (F1 and F2) are ambiguous.
PERCEIVING VOWELS IN ISOLATED SYLLABLES.
Formants in vowel perception. The importance of vowels formants (resonant frequencies
of the vocal tract) in cueing vowel sounds has been known for over a century. For example,
Helmholtz (1885) synthesized vowel sounds with resonators having frequencies that matched the
vowel formant frequencies. The role of vowel formants in vowel perception was also
demonstrated by Fry et al. (1962) using a continuum of synthetic vowels.
A debate pitting “formant-based” theories of vowel perception, in which auditory
preprocessing is assumed to code vowels in terms of formant frequencies, against “whole
2
spectrum” theories of vowel perception, in which a neural spectrogram serves as input to
perception, suggests that the perceptual importance of vowel formants may result from the fact
that the resonant frequencies of the vocal tract are the primary determinants of the spectral shape
of vowels (see Rosner & Pickering, 1994, pp. 152-156). What is clear though is that in numerous
studies using multi-dimensional scaling to empirically discover the dimensions of perceptual
vowel space (Mohr & Wang, 1968; Pols, et al., 1969; Shepard, 1972; Terbeek & Harshman,
1972; Fox, 1982, 1983; Rakerd & Verbrugge, 1985) the first two perceptual dimensions always
correspond to the frequencies of F1 and F2. However, the perceptual value of F1 and F2 are
modulated by other acoustic properties of vowels.
Perceptual influence of F0. Miller (1953) doubled the fundamental frequency of vocal fold
vibration (F0) of two-formant vowels (from 120Hz to 240Hz) and found vowel category
boundary shifts for most of the vowels of English. Fujisaki and Kawashima (1968) also studied
the role of F0 in vowel perception and found F1 boundary shifts of 100Hz to 200Hz for F0
shifts of 200 Hz. Slawson (1968) estimated that an octave change in F0 produced a perceived
change in F1 and F2 of about 10-12%.
Listeners are also strongly affected by mismatched F0. Lehiste & Metzger (1972) found
lower vowel perception accuracy when they put children’s high F0 with male vowel formants,
and (to a lesser extent) when they put low male F0 with children’s vowel formants. Gottfried &
Chew (1986) found that listener vowel identification performance was less accurate when vowels
were produced by a counter tenor at a much higher F0 than is typcial for a male voice.
Johnson (1990) found that the F0 effect was sensitive to mode of presentation. If tokens
having different F0 were randomly mixed, so that listeners couldn’t predict the upcoming F0 the
F0 vowel boundary shift was observed, but when stimuli were presented blocked by F0 the
3
boundary shift was substantially reduced.
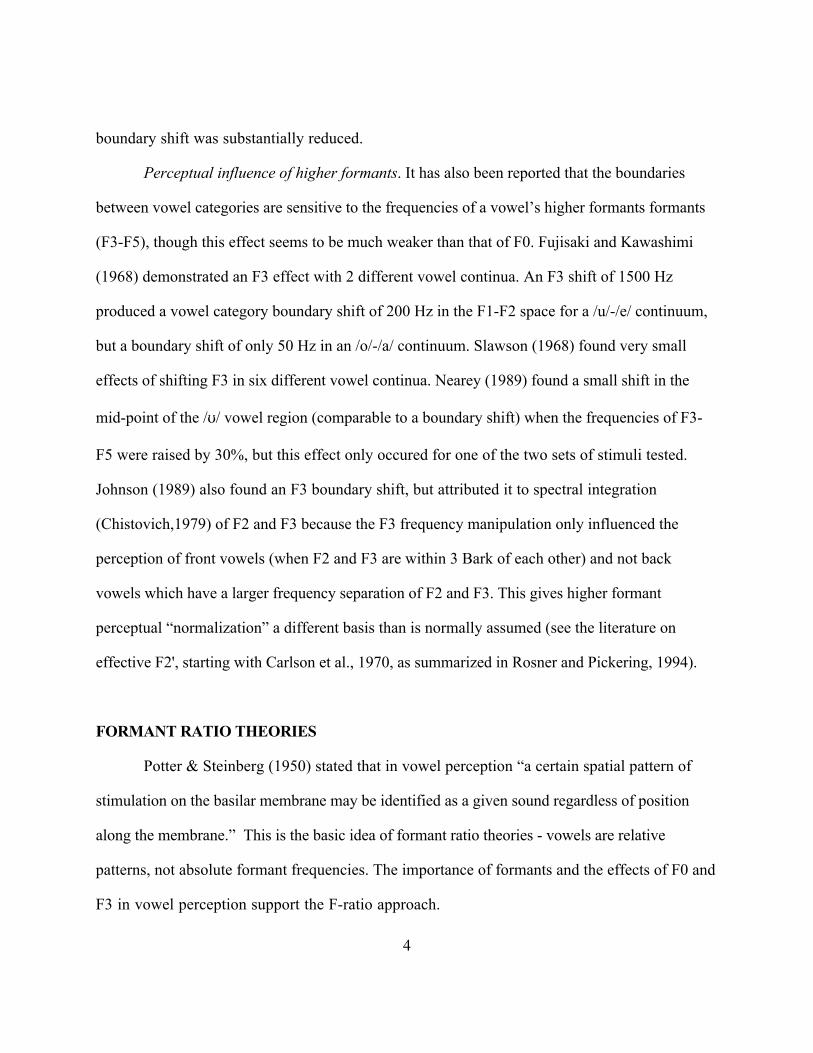
Perceptual influence of higher formants. It has also been reported that the boundaries
between vowel categories are sensitive to the frequencies of a vowel’s higher formants formants
(F3-F5), though this effect seems to be much weaker than that of F0. Fujisaki and Kawashimi
(1968) demonstrated an F3 effect with 2 different vowel continua. An F3 shift of 1500 Hz
produced a vowel category boundary shift of 200 Hz in the F1-F2 space for a /u/-/e/ continuum,
but a boundary shift of only 50 Hz in an /o/-/a/ continuum. Slawson (1968) found very small
effects of shifting F3 in six different vowel continua. Nearey (1989) found a small shift in the
mid-point of the /U/ vowel region (comparable to a boundary shift) when the frequencies of F3-
F5 were raised by 30%, but this effect only occured for one of the two sets of stimuli tested.
Johnson (1989) also found an F3 boundary shift, but attributed it to spectral integration
(Chistovich,1979) of F2 and F3 because the F3 frequency manipulation only influenced the
perception of front vowels (when F2 and F3 are within 3 Bark of each other) and not back
vowels which have a larger frequency separation of F2 and F3. This gives higher formant
perceptual “normalization” a different basis than is normally assumed (see the literature on
effective F2', starting with Carlson et al., 1970, as summarized in Rosner and Pickering, 1994).
FORMANT RATIO THEORIES
Potter & Steinberg (1950) stated that in vowel perception “a certain spatial pattern of
stimulation on the basilar membrane may be identified as a given sound regardless of position
along the membrane.” This is the basic idea of formant ratio theories - vowels are relative
patterns, not absolute formant frequencies. The importance of formants and the effects of F0 and
F3 in vowel perception support the F-ratio approach.
4
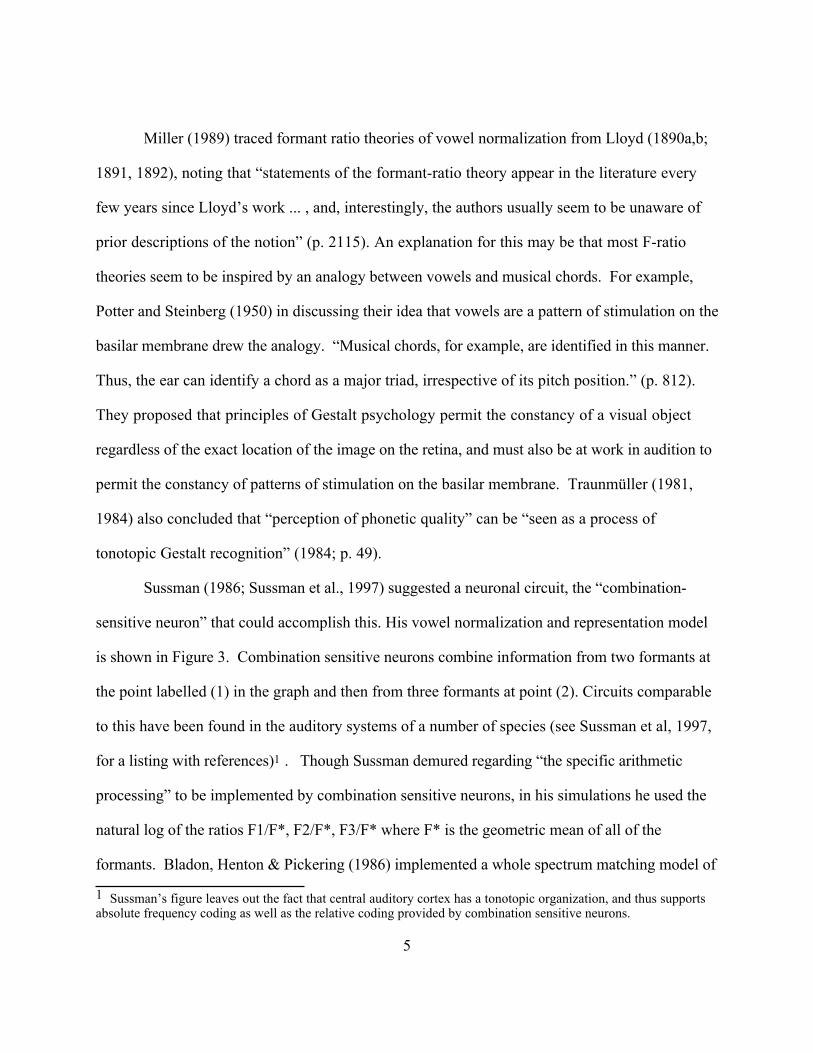
Miller (1989) traced formant ratio theories of vowel normalization from Lloyd (1890a,b;
1891, 1892), noting that “statements of the formant-ratio theory appear in the literature every
few years since Lloyd’s work ... , and, interestingly, the authors usually seem to be unaware of
prior descriptions of the notion” (p. 2115). An explanation for this may be that most F-ratio
theories seem to be inspired by an analogy between vowels and musical chords. For example,
Potter and Steinberg (1950) in discussing their idea that vowels are a pattern of stimulation on the
basilar membrane drew the analogy. “Musical chords, for example, are identified in this manner.
Thus, the ear can identify a chord as a major triad, irrespective of its pitch position.” (p. 812).
They proposed that principles of Gestalt psychology permit the constancy of a visual object
regardless of the exact location of the image on the retina, and must also be at work in audition to
permit the constancy of patterns of stimulation on the basilar membrane. Traunmüller (1981,
1984) also concluded that “perception of phonetic quality” can be “seen as a process of
tonotopic Gestalt recognition” (1984; p. 49).
Sussman (1986; Sussman et al., 1997) suggested a neuronal circuit, the “combination-
sensitive neuron” that could accomplish this. His vowel normalization and representation model
is shown in Figure 3. Combination sensitive neurons combine information from two formants at
the point labelled (1) in the graph and then from three formants at point (2). Circuits comparable
to this have been found in the auditory systems of a number of species (see Sussman et al, 1997,
for a listing with references)1 . Though Sussman demured regarding “the specific arithmetic
processing” to be implemented by combination sensitive neurons, in his simulations he used the
natural log of the ratios F1/F*, F2/F*, F3/F* where F* is the geometric mean of all of the
formants. Bladon, Henton & Pickering (1986) implemented a whole spectrum matching model of
1 Sussman’s figure leaves out the fact that central auditory cortex has a tonotopic organization, and thus supports absolute frequency coding as well as the relative coding provided by combination sensitive neurons.
5
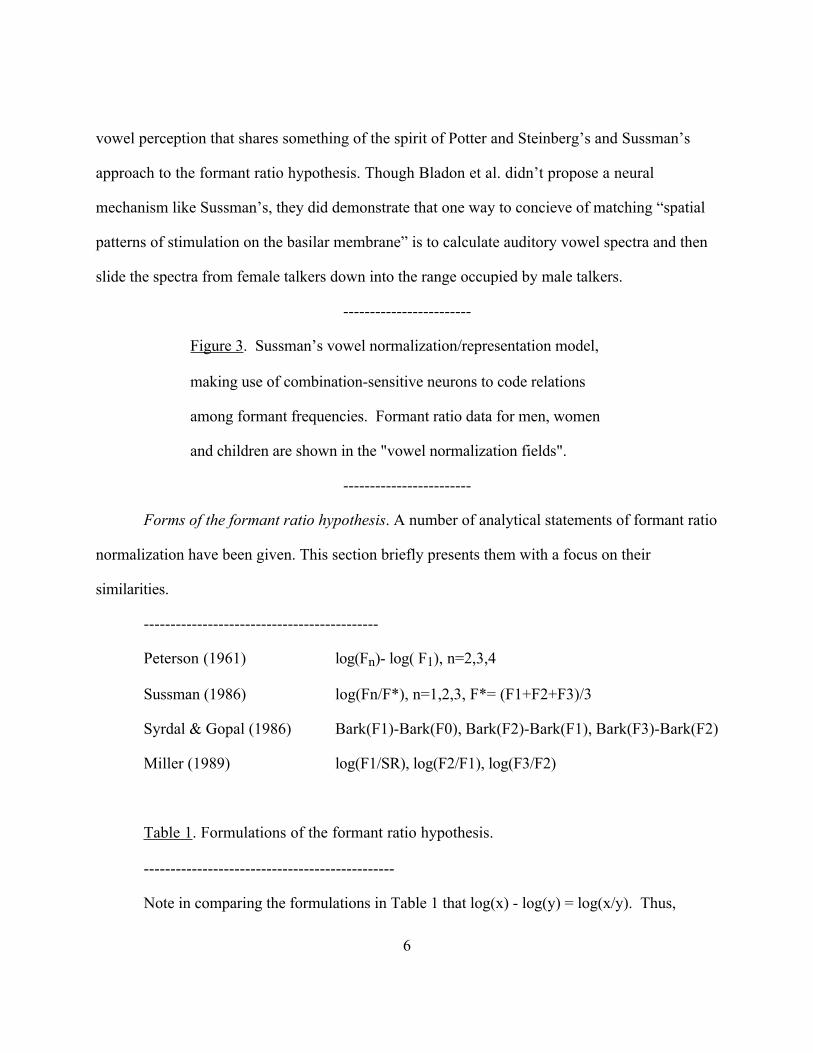
vowel perception that shares something of the spirit of Potter and Steinberg’s and Sussman’s
approach to the formant ratio hypothesis. Though Bladon et al. didn’t propose a neural
mechanism like Sussman’s, they did demonstrate that one way to concieve of matching “spatial
patterns of stimulation on the basilar membrane” is to calculate auditory vowel spectra and then
slide the spectra from female talkers down into the range occupied by male talkers.
------------------------
Figure 3. Sussman’s vowel normalization/representation model,
making use of combination-sensitive neurons to code relations
among formant frequencies. Formant ratio data for men, women
and children are shown in the "vowel normalization fields".
------------------------
Forms of the formant ratio hypothesis. A number of analytical statements of formant ratio
normalization have been given. This section briefly presents them with a focus on their
similarities.
--------------------------------------------
Peterson (1961) log(Fn)- log( F1), n=2,3,4
Sussman (1986) log(Fn/F*), n=1,2,3, F*= (F1+F2+F3)/3
Syrdal & Gopal (1986) Bark(F1)-Bark(F0), Bark(F2)-Bark(F1), Bark(F3)-Bark(F2)
Miller (1989) log(F1/SR), log(F2/F1), log(F3/F2)
Table 1. Formulations of the formant ratio hypothesis.
-----------------------------------------------
Note in comparing the formulations in Table 1 that log(x) - log(y) = log(x/y). Thus,
6
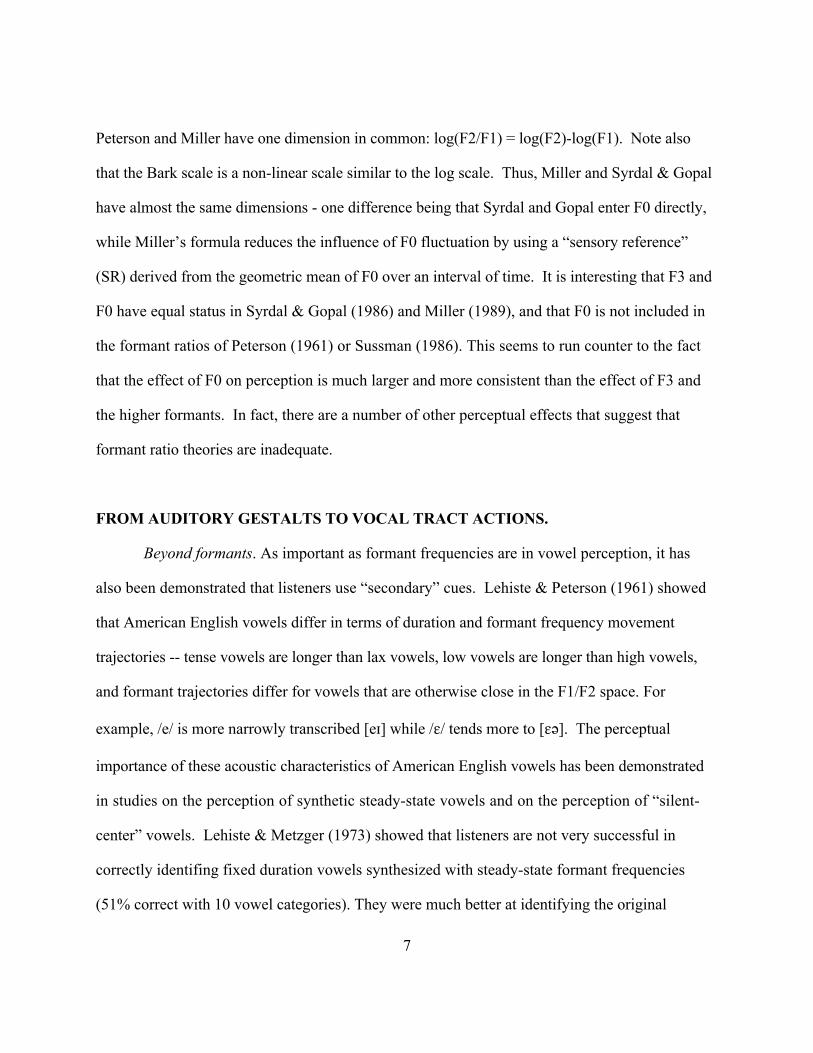
Peterson and Miller have one dimension in common: log(F2/F1) = log(F2)-log(F1). Note also
that the Bark scale is a non-linear scale similar to the log scale. Thus, Miller and Syrdal & Gopal
have almost the same dimensions - one difference being that Syrdal and Gopal enter F0 directly,
while Miller’s formula reduces the influence of F0 fluctuation by using a “sensory reference”
(SR) derived from the geometric mean of F0 over an interval of time. It is interesting that F3 and
F0 have equal status in Syrdal & Gopal (1986) and Miller (1989), and that F0 is not included in
the formant ratios of Peterson (1961) or Sussman (1986). This seems to run counter to the fact
that the effect of F0 on perception is much larger and more consistent than the effect of F3 and
the higher formants. In fact, there are a number of other perceptual effects that suggest that
formant ratio theories are inadequate.
FROM AUDITORY GESTALTS TO VOCAL TRACT ACTIONS.
Beyond formants. As important as formant frequencies are in vowel perception, it has
also been demonstrated that listeners use “secondary” cues. Lehiste & Peterson (1961) showed
that American English vowels differ in terms of duration and formant frequency movement
trajectories -- tense vowels are longer than lax vowels, low vowels are longer than high vowels,
and formant trajectories differ for vowels that are otherwise close in the F1/F2 space. For
example, /e/ is more narrowly transcribed [eI] while /E/ tends more to [E´]. The perceptual
importance of these acoustic characteristics of American English vowels has been demonstrated
in studies on the perception of synthetic steady-state vowels and on the perception of “silent-
center” vowels. Lehiste & Metzger (1973) showed that listeners are not very successful in
correctly identifing fixed duration vowels synthesized with steady-state formant frequencies
(51% correct with 10 vowel categories). They were much better at identifying the original
7
isolated vowel recordings - though with mixed lists containing tokens from men, women, and
children the identification rate even in this task was quite low (79% correct) (see also Ainsworth,
1972). Assman and Nearey (1986) spliced small chunks out of vowels near the beginning of the
vowel segment (the “nucleus”) and near the end (the “glide”) and found that correct identification
was higher when the chunks were played in the order nucleus/glide than when either chunk was
presented alone or when they were played in the order glide/nucleus. Hillenbrand and Nearey
(1999) presented an extensive study of vowel identification that confirms the conclusions of
these earlier studies. Flat-formant vowels (vowels synthesized with only steady-state formant
frequencies, but having the duration of the original utterance) were correctly identified 74% of the
time, while vowels synthesized with the original formant frequency trajectories were correctly
identified 89% of the time.
The point in citing these studies is to counter the tendency (sometimes stated explicitly)
to think of formant ratio vowel representations as points in a normalized vowel space. Miller’s
(1989) description of vowels as trajectories through normalized space is much more in keeping
with the data reviewed in this section. However, even with these richer vowel representations,
formant ratio theories fail to account for perceptual speaker normalization.
Whispered vowels. Rosen & Pickering (1994) note that formant ratio models of vowel
perception that necessarily include F0 (e.g. Miller, 1989; Syrdal and Gopal, 1986; and
Traunmüller, 1981) have no explanation for the fact that listeners can identify whispered vowels.
It should be noted, though, that whispered vowels are not identified as accurately as normally
phonated vowels.. Eklund and Traunmüller (1997) found error rates of 4.5% for voiced vowels
and 12% for whispered vowels. In whisper the vocal tract resonances (particularly F1) shift up
in frequency with the glottis open (introducing tracheal resonances and zeros), and x-ray studies
8
show that vowel articulations also change in whispered speech (Sovijärvi, 1938). So it is not
surprizing that whispered vowels are harder to identify, but the fact remains that models that
require F0 in the representation of vowels fail to account for the perception of whispered vowels.
Beyond vowels. Though the focus of speaker normalization research has been on vowel
perception, listeners are also sensitive to talker differences in the perception of consonants and
prosody. Schwartz(1968) found in an acoustic study that fricatives produced by men and
women have, on average, different spectral shapes (fricatives produced by women had slightly
higher spectral center of gravity), and May (1976) found that when a continuum from [s] to [S]
was spliced to [A] produced by a male or a female voice, the [s]-[S] boundary was at a higher
spectral center of gravity for the female voice. This was taken to mean that listeners
“normalized” the fricative based on the contextual information provided by the vowel. This
finding has been replicated a number of times (e.g. Mann and Repp, 1980; Johnson, 1991; Strand
and Johnson, 1996).
Leather (1983) found speaker normalization effects with Mandarin Chinese tones. The
pitch range of a context utterance influenced the perception of test tones spanning a range of F0
values. This type of tone normalization effect has also been reported by Fox and Qi (1990) and
by Moore (1994).
Scatter reduction. Normalization algorithms such as formant ratio recoding are evaluated
according to how well they reduce within-category scatter and between-category vowel overlap.
The goal is to devise a cognitively plausible algorithm that is able to separate the overlapping
clusters of vowels in the Peterson & Barney (1952) figure, for example, and so classify the
vowels about as accurately as Peterson & Barney’s listeners did. When it comes to scatter
reduction, though, no algorithm has been shown to work better than simple statistical
9
standarization of formant values (Labonov, 1971; Disner, 1980; Nearey, 1978).2 The problem
with this kind of method, from the perspective of cognitive plausibility is that in order to recode
a talker’s formants into speaker-specific z-scores (
†
z = (x - x ) / sd ) the algorithm has to have a full
listing of formant frequency measurements of vowels produced by the talker. It does not seem
plausible to suppose that listeners could have enough information from an unfamiliar talker to be
able to perform this kind of normalization.
Despite this, most of the practically useful vowel normalization algorithms require that
summary statistics be derived over a full set of vowels for each talker. As we have seen,
Lobanov’s (1971) method requires the mean and standard deviation of F1 and F2. Nearey’s
(1978) constant log interval normalization uses the mean of the log values of the talkers’ F1 and
F2. Gerstman’s (1968) range normalization technique (which is less successful than formant
standardization or log interval coding) requires that the minimum and maximum values of F1 and
F2 be found. Bladon, Henton and Pickering (1984) used a single value to normalize vowels - a
boolean to indicate whether the talker is male or female. If the vowel was produced by a woman
the auditory spectrum was shifted down by about 1 Bark. The specta of vowels produced by
men were not shifted. In this approach 1 Bark is about the magnitude of the average frequency
difference between the formants of vowels produced by men and of those produced by women
(see figures 5 and 6 below).
The main point of these observations is to note that it has proven useful in the practical
quantitative normalization of vowel formant data to express formant frequencies relative to a
representation of the talker. In Lobanov’s method the talker representation has four dimensions
mF1, mF2, sF1, and sF2. In Nearey’s most successful version of the constant log interval method
2 Hindle (1978) describes a six parameter regression model attributed to Sankoff, Shorrock & McKay which reduces scatter to such an extent that known sociolinguistic variability is removed from the normalized vowel space.
10
the speaker is represented as mlogF1 and mlogF2. For Bladon et al. the boolean shift factor is a
kind of talker representation - men are represented as 0 and women are represented as 1. In
considering these normalization algorithms as possible models of human perceptual speaker
normalization, it is interesting to note that a perceptual frame of reference perhaps analogous to
these statistical acoustic representations is used by listeners. We turn now to some evidence
supporting this view.
Context influences perception. One of the cleverest and most influential studies of vowel
perception was the one reported by Ladefoged and Broadbent (1957). Like Peterson & Barney’s
(1952) study, Ladefoged & Broadbent’s results have had a lasting impact on the theory of speech
perception. They found that vowels judged in the context of a precursor carrier phrase with the
vowel formant frequencies shifted up were identified differently than when the precursor phrase
had relatively low vowel formants. In effect, the test vowels were identified as if the precursor
phrase provided a coordinate system within which to judge them. This “extrinsic” context effect
has been demonstrated in numerous subsequent studies (Ainsworth, 1974; Nearey, 1978, 1989;
Dechovitz, 1977). Remez et al. (1987) found that the context formant range effect also occurs in
the perception of sinewave analogs of speech. Johnson (1990) found a variant of the effect in
which the F0 range of the carrier phrase was varied instead of the vowel formant frequency range.
The effect of carrier phrase F0 range was comparable to the vowel formant frequency range effect
noted by Ladefoged and Broadbent.
The impact of context on vowel perception suggests that listeners use a cognitive “frame
of reference” that is in some sense a representation of the talker who produced the speech. If
something like this actually happens in speech perception, it would be reasonable to expect to
find evidence that listeners take a little time to adapt to a new talker exhibit processing difficulties
11
such as misperceptions and/or slowed responses before talker adaptation has been completed.
These expectations have been born out in a number of studies over the years.
Talker normalization is an active process. Creelman (1957) found that word recognition
accuracy in noise decreases when the identity of the talker is unpredictable from trial to trial. In
this study and many later ones, talker identity was kept predictable by presenting stimuli in
“single-talker” lists, while in the unpredictable talker condition the stimuli were presented in
“mixed-talker” lists. Summerfield & Haggard (1975) found that word recognition reaction times
were slower in mixed-talker lists than in single-talker lists. Verbrugge et al. (1976) found that
vowel identification was more accurate in single-talker lists (9.5% errors) than in mixed-talker
lists (17% errors). Mullennix, et al. (1989) tested word recognition speed and accuracy in mixed
and single-talker lists and also investigated interactions with word frequency and lexical density.
They suggested that speaker adaptation is an active process and that talker voice information is
not automatically “removed” from the speech signal by a normalizing recoding of the signal
otherwise the talker variability manipulation wouldn’t have had an effect.
Kakehi (1992) described experiments done earlier by Kato & Kakehi (1988) that
investigated listener adaptation to talker voice. They found a very interesting effect of adaptation
(as indicated by increased syllable recognition accuracy in noise) over the course of five
successive stimuli. Accuracy increased monotonically from 70% correct on the first stimulus
produced by a talker, to 76% correct on the fifth stimulus. After the fifth stimulus, no further
increase in recognition accuracy was observed. This study calibrates the amount of information
needed to adapt to a new talker for isolated nonsense syllables (letter names basically). Nusbaum
& Morin (1992) used a speeded phoneme monitoring task to evaluate the effect of talker
uncertainty in a mixed talker list. They found that listeners were slower to report the presence of
12
target syllables in mixed-talker lists. This was taken to indicate that speaker normalization is an
active adaptation process that demands cognitive resources.
Talker normalization is subject to expecations. Magnuson and Nusbaum (1994)
compared “1-voice” instructions with “2-voice” instructions in a mixed-talker monitoring task
where the two synthetic voices were only slightly different in F0. Listeners were told either that
the tokens were produced by two talkers or one. In the 2-voice instruction condition, they found
the typical advantage for blocked-talker presentation versus the mixed-talker presentation, but
this effect disappeared in the 1-voice instruction condition. A perceptual effect of instructions
was also found in another study by Johnson, Strand and D’Imperio (1999). In one experiment,
listeners were presented synthetic tokens on a “hood” [hUd]-”HUD” [h!d] continuum with an
androgynous voice. One group of listeners was told that the talker was female and the other
group was told that the talker was male. The category boundaries were different as a function of
instructions in the same direction as found when F0 or visual gender was used to cue talker
differences.
Eklund and Traunmüller (1997) found evidence of a connection between talker perception
and vowel perception, this time in a study of whispered speech. When listeners misidentified the
sex of the talker their vowel identification error rate was 25%, but when they correctly identified
the sex of the speaker the vowel error rate was only 5%. This suggests that talker perception and
vowel perception are interconnected with each other, as the studies using experimenter-suggested
talker expectations seems to show.
Audio-visual interactions in normalization. Several studies have shown that listeners
process speech differently in audio-visual presentation depending on the visual gender of the
talker (Walker et al., 1995; Strand and Johnson, 1996; Schwippert and Benoit, 1997; Johnson et
13
al. 1999). Auditory/visual perceptual integration is more likely to occur when the gender of the
visually presented face matches the gender of the auditorily presented word. Strand and
Johnson, and Johnson et al. also found that fricative and vowel identification boundaries can be
shifted by visual gender in much the way that they can be shifted by F0, or other auditory cues
for talker gender. Walker et al. found a very interesting interaction between auditory/visual
integration and listener familiarity with the talker.
Taken together, these phenomena suggest that listeners perceive speech relative to an
internal representation of the person talking. The earliest and most straightforward proposal was
that the “talker” frame of reference (or perceptual coordinate system) for speech perception is
the vocal tract of the talker.
VOCAL TRACT NORMALIZATION
Whereas formant ratio theories view normalization as a function of the auditory gestalt
encoding of vowels, vocal tract normalization theories consider that listeners perceptually
evaluate vowels on a talker-specific coordinate system - most simply, by reference to the
perceived length of the talker’s vocal tract. The normalization mechanism in this approach is
thus a kind of predictive analysis-by-synthesis mental model of the vocal tract.
Here is Martin Joos’ (1948) account of vocal tract normalization.
“On first meeting a person, the listener hears a few vowel phones, and on
the basis of this small but apparently sufficient evidence he swiftly constructs a
fairly complete vowel pattern to serve as a background (coordinate system) upon
which he correctly locates new phones as fast as he hears them. ... On first
14
meeting a person, one hears him say “How do you do?”. The very first vowel
phone heard is a sample of the noise this speaker makes when his articulation is
(in my dialect) low central; the last one is a sample of the noise he makes with his
highest and backest articulation; and in the middle (spelling “y”) there is a sample
of sound belonging to palatal articulation, offering evidence about his higher and
fronter vowels. Now these samples of sound as sound are already sufficient to
establish the acoustic vowel pattern: the pattern’s corners are now located, and
the other phones can be assumed to be spaced relative to them as they generally
are spaced in this dialect.” (p. 61)
The fact that perceived vowel quality is influenced by the formant frequencies of context
vowels (Ladefoged & Broadbent, 1957) suggests that something like Joos’ “coordinate system” is
involved in vowel perception. And evidence that speaker normalization is an active process open
to visual information about the talker, and other information that can be used to specify the
talker’s vocal tract size, fits with the idea that listeners are constructing a perceptual frame of
reference. Additionally, the analysis-by-synthesis mechanism is general enough to be extended to
account for perceptual normalization in the perception of consonants and tones.
Besides extrinsic cues such as the range of formant frequency values in the immediately
preceding speech context, some vowel internal cues carry information about the talker’s vocal
tract. For example, though F0 is not causally linked to vocal tract length (as Nearey, 1989,
memorably noted with his imitations of the cartoon character Popeye whose vocal tract was long
though his vocal pitch was high, and the American television personality Julia Child whose low
pitch voice belied her short vocal tract), there is a presumptive correlational relationship so that
15
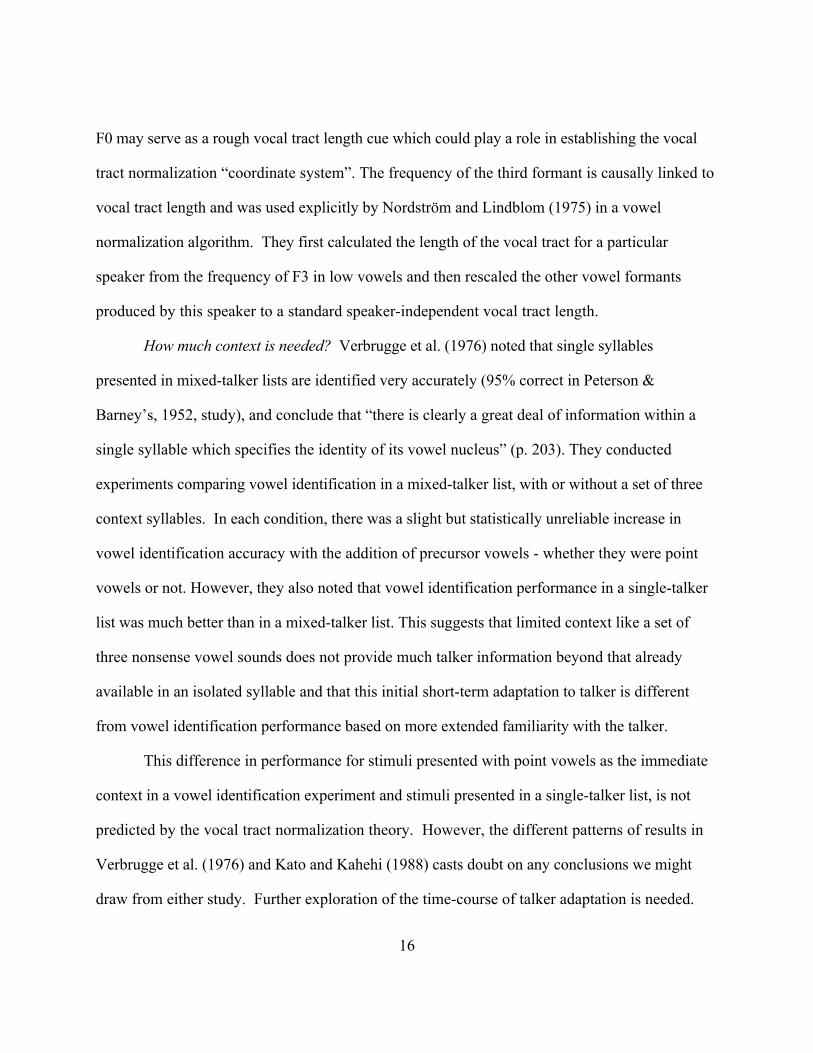
F0 may serve as a rough vocal tract length cue which could play a role in establishing the vocal
tract normalization “coordinate system”. The frequency of the third formant is causally linked to
vocal tract length and was used explicitly by Nordström and Lindblom (1975) in a vowel
normalization algorithm. They first calculated the length of the vocal tract for a particular
speaker from the frequency of F3 in low vowels and then rescaled the other vowel formants
produced by this speaker to a standard speaker-independent vocal tract length.
How much context is needed? Verbrugge et al. (1976) noted that single syllables
presented in mixed-talker lists are identified very accurately (95% correct in Peterson &
Barney’s, 1952, study), and conclude that “there is clearly a great deal of information within a
single syllable which specifies the identity of its vowel nucleus” (p. 203). They conducted
experiments comparing vowel identification in a mixed-talker list, with or without a set of three
context syllables. In each condition, there was a slight but statistically unreliable increase in
vowel identification accuracy with the addition of precursor vowels - whether they were point
vowels or not. However, they also noted that vowel identification performance in a single-talker
list was much better than in a mixed-talker list. This suggests that limited context like a set of
three nonsense vowel sounds does not provide much talker information beyond that already
available in an isolated syllable and that this initial short-term adaptation to talker is different
from vowel identification performance based on more extended familiarity with the talker.
This difference in performance for stimuli presented with point vowels as the immediate
context in a vowel identification experiment and stimuli presented in a single-talker list, is not
predicted by the vocal tract normalization theory. However, the different patterns of results in
Verbrugge et al. (1976) and Kato and Kahehi (1988) casts doubt on any conclusions we might
draw from either study. Further exploration of the time-course of talker adaptation is needed.
16
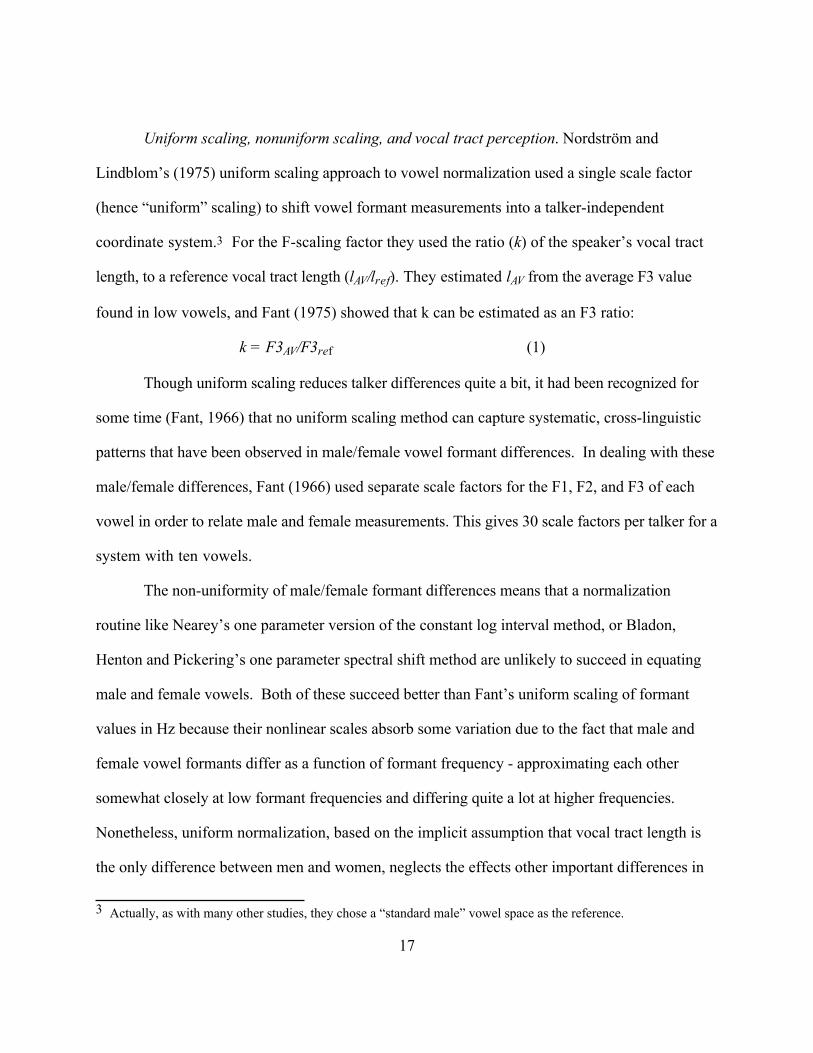
Uniform scaling, nonuniform scaling, and vocal tract perception. Nordström and
Lindblom’s (1975) uniform scaling approach to vowel normalization used a single scale factor
(hence “uniform” scaling) to shift vowel formant measurements into a talker-independent
coordinate system.3 For the F-scaling factor they used the ratio (k) of the speaker’s vocal tract
length, to a reference vocal tract length (lAV/lref). They estimated lAV from the average F3 value
found in low vowels, and Fant (1975) showed that k can be estimated as an F3 ratio:
k = F3AV/F3ref (1)
Though uniform scaling reduces talker differences quite a bit, it had been recognized for
some time (Fant, 1966) that no uniform scaling method can capture systematic, cross-linguistic
patterns that have been observed in male/female vowel formant differences. In dealing with these
male/female differences, Fant (1966) used separate scale factors for the F1, F2, and F3 of each
vowel in order to relate male and female measurements. This gives 30 scale factors per talker for a
system with ten vowels.
The non-uniformity of male/female formant differences means that a normalization
routine like Nearey’s one parameter version of the constant log interval method, or Bladon,
Henton and Pickering’s one parameter spectral shift method are unlikely to succeed in equating
male and female vowels. Both of these succeed better than Fant’s uniform scaling of formant
values in Hz because their nonlinear scales absorb some variation due to the fact that male and
female vowel formants differ as a function of formant frequency - approximating each other
somewhat closely at low formant frequencies and differing quite a lot at higher frequencies.
Nonetheless, uniform normalization, based on the implicit assumption that vocal tract length is
the only difference between men and women, neglects the effects other important differences in
3 Actually, as with many other studies, they chose a “standard male” vowel space as the reference.
17
vocal tract geometry. For example, men tend to have a proportionally longer pharynx than
women, and thus lower back-cavity resonance frequencies.
Nonuniform normalization, utilizing different scale factors for different formants
(including multiparameter models like Lobanov, 1971, and Nearey, 1978) provides more complex
representations of the talker --- reflecting presumably, for the moment, differences in vocal tract
geometry beyond vocal tract length. Model studies of typical vocal tract differences between
men and women have attempted to derive Fant’s (1966) nonuniform scaling factors from
anatomical differences between men and women (Nordström, 1977; Goldstein, 1980;
Traunmüller, 1984).
Rather than simply to rescale formant frequencies based on an estimate of vocal tract
length, or to characterize the talker in terms of acoustic formant scale factors, McGowan (1997,
McGowan & Cushing, 1999) attempted to recover a detailed characterization of vocal tract
geometry from the acoustic signal. One difficulty with this more literal approach to vocal tract
normalization is that indeterminacies in the extraction of acoustic parameters are magnified during
vocal tract simulation. This coupled with a degree of vocal tract underspecification (such that
virtually identical acoustic values can be produced by substantially different vocal tracts, Atal, et
al. 1978) puts speech gesture recovery, as a practical normalization strategy, out of reach at this
time. Whether listeners veridically recover the talker’s vocal tract for use in perceptual speaker
normalization is another question.
The presence of individual differences in speech production (Johnson, et al., 1993) also
complicates matters for vocal tract normalization. Though normalization research has usually
focussed on male/female differences in vocal tract size and shape, vocal tracts -- even within
genders -- come in lots of different sizes and shapes. Johnson et al.’s results suggest that talkers
18
apparently adopt different (possibly arbitrarily different) articulatory strategies to produce the
“same” sounds. Thus, accurate recovery of the talker’s articulatory gestures would not
completely succeed in “normalizing” speech.
TALKERS OR VOCAL TRACTS?
We turn now to a discussion of talkers, starting with consideration of the articulatory
origins of gender differences in speech, followed by a discussion of the role of the perceived
identity of the talker in speech perception. As noted above, talkers may differ from each other at
the level of their articulatory habits of speech. This in itself would suggest that perception may
not be able to depend on vocal tract normalization to “remove” talker differences by removing
vocal tract differences. However, because so much of the normalization literature focusses on the
differences between men’s and women’s speech, we will start by asking a prickly question.
Do men’s and women’s voices differ only by anatomy? Vocal tract normalization theory
assumes that speakers differ from each other in vocal tract anatomy, but that when this source of
difference is factored out all speakers of a language have the same phonetic targets. Traunmüller
(1984) presented results supporting this idea from simulations of differences between male and
female formant frequencies. In his simulations, Traunmüller modeled male/female differences in
pharynx length and resting tongue position (assuming that the decent of the larynx lowers the
resting position of the tongue). Possible gender difference in resting tongue position had not been
considered in previous studies (Nordström, 1977; Goldstein, 1980) and Traunmüller offered no
data to support the crucial assumption. Nonetheless, his simulated male/female formant ratios
closely match the average ratios reported by Fant (1966, 1975). Rosner and Pickering (1994)
accepted Traunmüller’s conclusion that “it is not necessary to postulate sex-specific vowel
19
articulations in order to explain the [non-uniform formant scaling] data” (Traunmüller, 1984, p.
55).
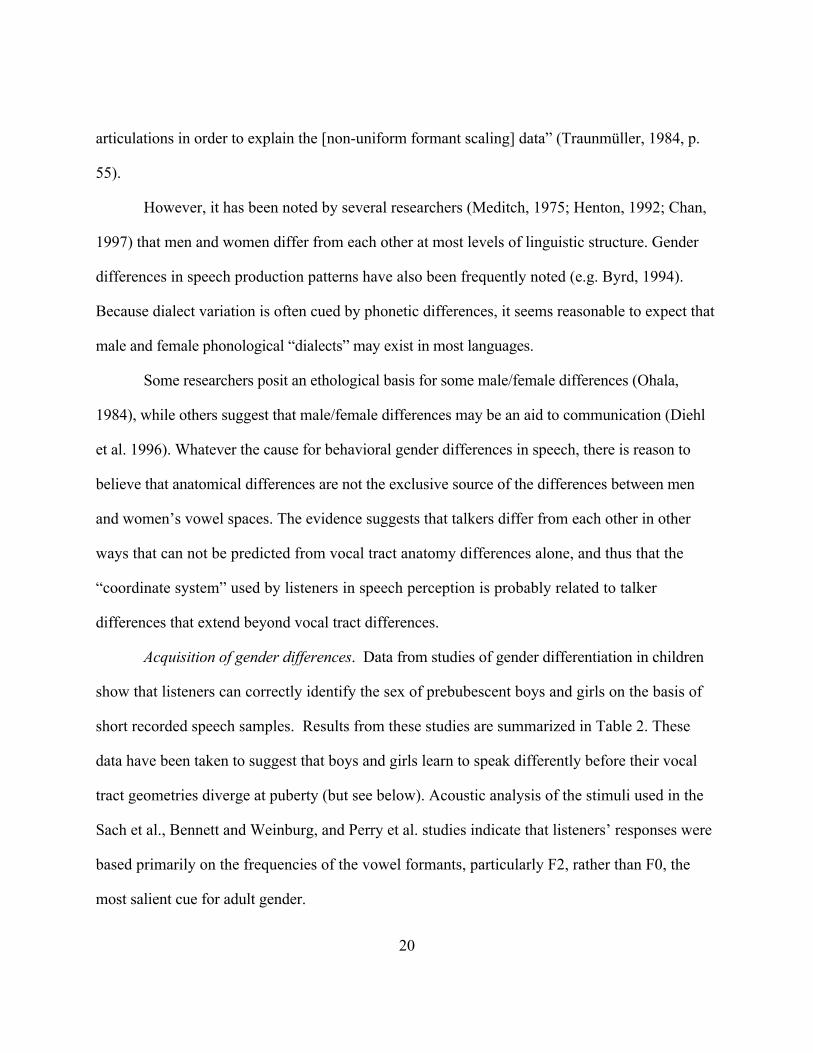
However, it has been noted by several researchers (Meditch, 1975; Henton, 1992; Chan,
1997) that men and women differ from each other at most levels of linguistic structure. Gender
differences in speech production patterns have also been frequently noted (e.g. Byrd, 1994).
Because dialect variation is often cued by phonetic differences, it seems reasonable to expect that
male and female phonological “dialects” may exist in most languages.
Some researchers posit an ethological basis for some male/female differences (Ohala,
1984), while others suggest that male/female differences may be an aid to communication (Diehl
et al. 1996). Whatever the cause for behavioral gender differences in speech, there is reason to
believe that anatomical differences are not the exclusive source of the differences between men
and women’s vowel spaces. The evidence suggests that talkers differ from each other in other
ways that can not be predicted from vocal tract anatomy differences alone, and thus that the
“coordinate system” used by listeners in speech perception is probably related to talker
differences that extend beyond vocal tract differences.
Acquisition of gender differences. Data from studies of gender differentiation in children
show that listeners can correctly identify the sex of prebubescent boys and girls on the basis of
short recorded speech samples. Results from these studies are summarized in Table 2. These
data have been taken to suggest that boys and girls learn to speak differently before their vocal
tract geometries diverge at puberty (but see below). Acoustic analysis of the stimuli used in the
Sach et al., Bennett and Weinburg, and Perry et al. studies indicate that listeners’ responses were
based primarily on the frequencies of the vowel formants, particularly F2, rather than F0, the
most salient cue for adult gender.
20
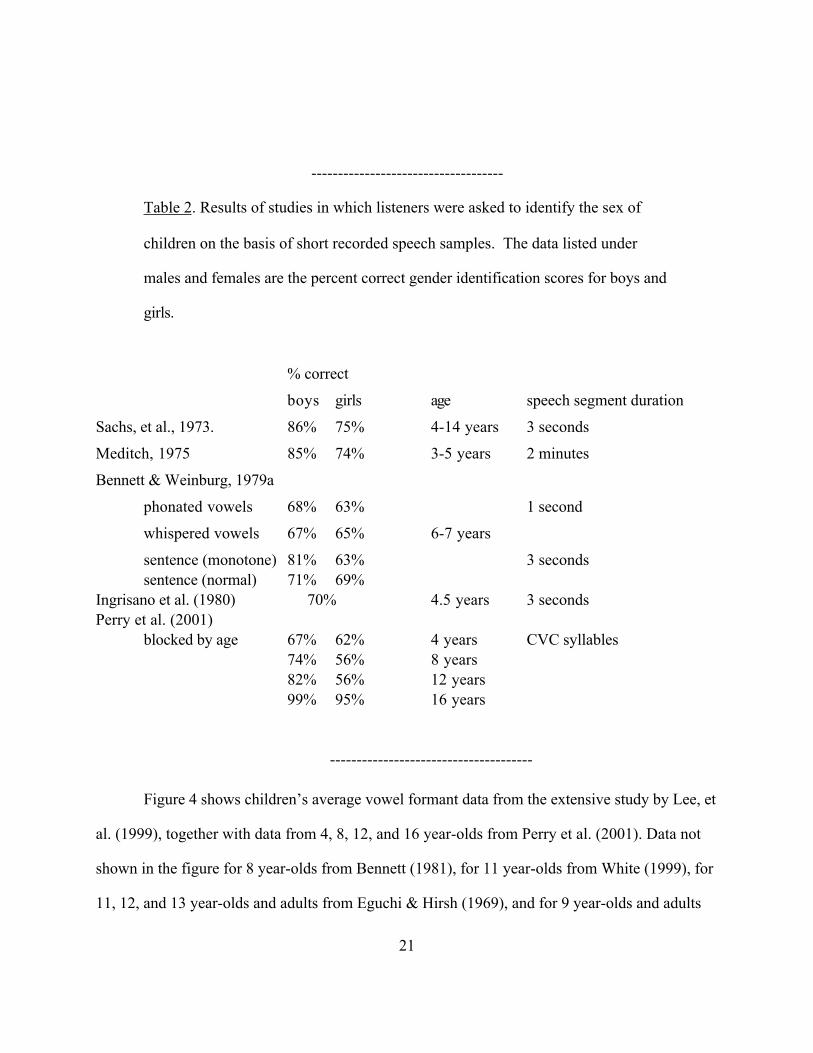
------------------------------------
Table 2. Results of studies in which listeners were asked to identify the sex of
children on the basis of short recorded speech samples. The data listed under
males and females are the percent correct gender identification scores for boys and
girls.
% correct
boys girls age speech segment duration
Sachs, et al., 1973. 86% 75% 4-14 years 3 seconds
Meditch, 1975 85% 74% 3-5 years 2 minutes
Bennett & Weinburg, 1979a
phonated vowels 68% 63% 1 second
whispered vowels 67% 65% 6-7 years
sentence (monotone) 81% 63% 3 secondssentence (normal) 71% 69%
Ingrisano et al. (1980) 70% 4.5 years 3 secondsPerry et al. (2001)
blocked by age 67% 62% 4 years CVC syllables74% 56% 8 years82% 56% 12 years99% 95% 16 years
--------------------------------------
Figure 4 shows children’s average vowel formant data from the extensive study by Lee, et
al. (1999), together with data from 4, 8, 12, and 16 year-olds from Perry et al. (2001). Data not
shown in the figure for 8 year-olds from Bennett (1981), for 11 year-olds from White (1999), for
11, 12, and 13 year-olds and adults from Eguchi & Hirsh (1969), and for 9 year-olds and adults
21
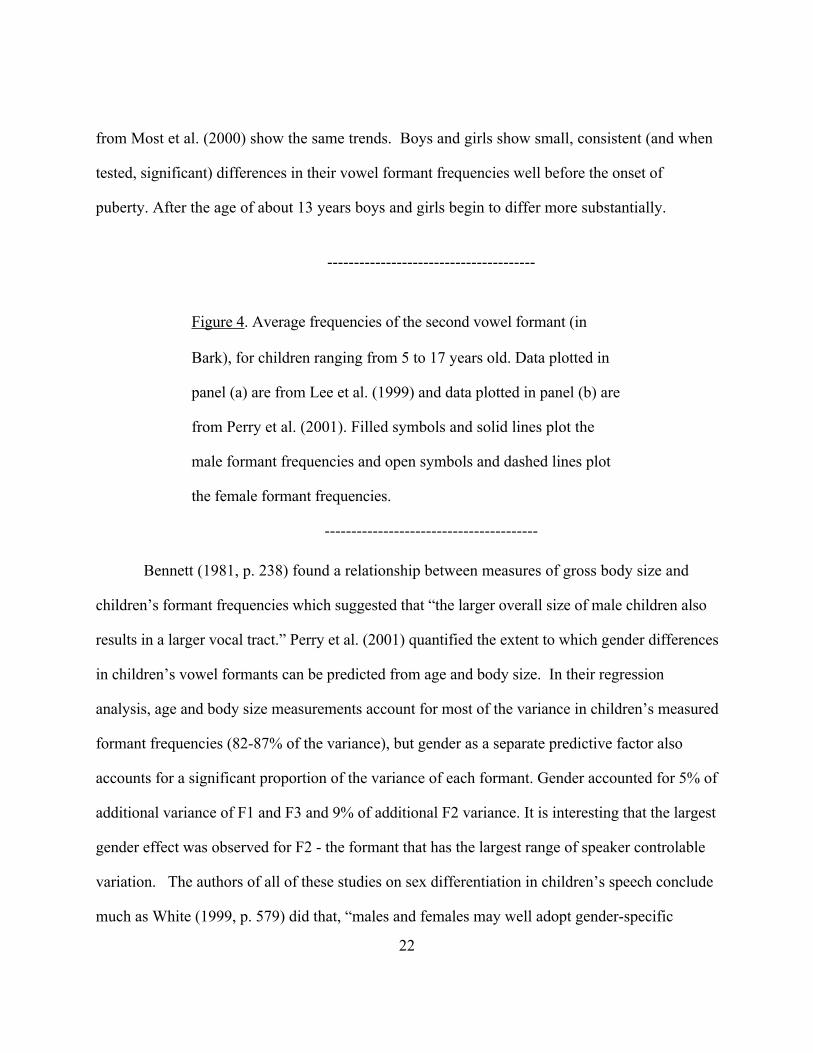
from Most et al. (2000) show the same trends. Boys and girls show small, consistent (and when
tested, significant) differences in their vowel formant frequencies well before the onset of
puberty. After the age of about 13 years boys and girls begin to differ more substantially.
---------------------------------------
Figure 4. Average frequencies of the second vowel formant (in
Bark), for children ranging from 5 to 17 years old. Data plotted in
panel (a) are from Lee et al. (1999) and data plotted in panel (b) are
from Perry et al. (2001). Filled symbols and solid lines plot the
male formant frequencies and open symbols and dashed lines plot
the female formant frequencies.
----------------------------------------
Bennett (1981, p. 238) found a relationship between measures of gross body size and
children’s formant frequencies which suggested that “the larger overall size of male children also
results in a larger vocal tract.” Perry et al. (2001) quantified the extent to which gender differences
in children’s vowel formants can be predicted from age and body size. In their regression
analysis, age and body size measurements account for most of the variance in children’s measured
formant frequencies (82-87% of the variance), but gender as a separate predictive factor also
accounts for a significant proportion of the variance of each formant. Gender accounted for 5% of
additional variance of F1 and F3 and 9% of additional F2 variance. It is interesting that the largest
gender effect was observed for F2 - the formant that has the largest range of speaker controlable
variation. The authors of all of these studies on sex differentiation in children’s speech conclude
much as White (1999, p. 579) did that, “males and females may well adopt gender-specific
22
articulatory behaviors from childhood to further enhance sex distinctions.”
Cross-linguistic gender differences. Bladon, Henton and Pickering (1984) compared the
amount of spectral shift needed to normalize male and female spectra for speakers of different
languages. They found that the difference between men and women varied from language to
language. Cross-linguistic variation in how male and female talkers differ from each other might
indicate that cultural factors are involved in defining and shaping male or female speech - and thus
that anatomy does not completely determine the vowel formant frequencies.
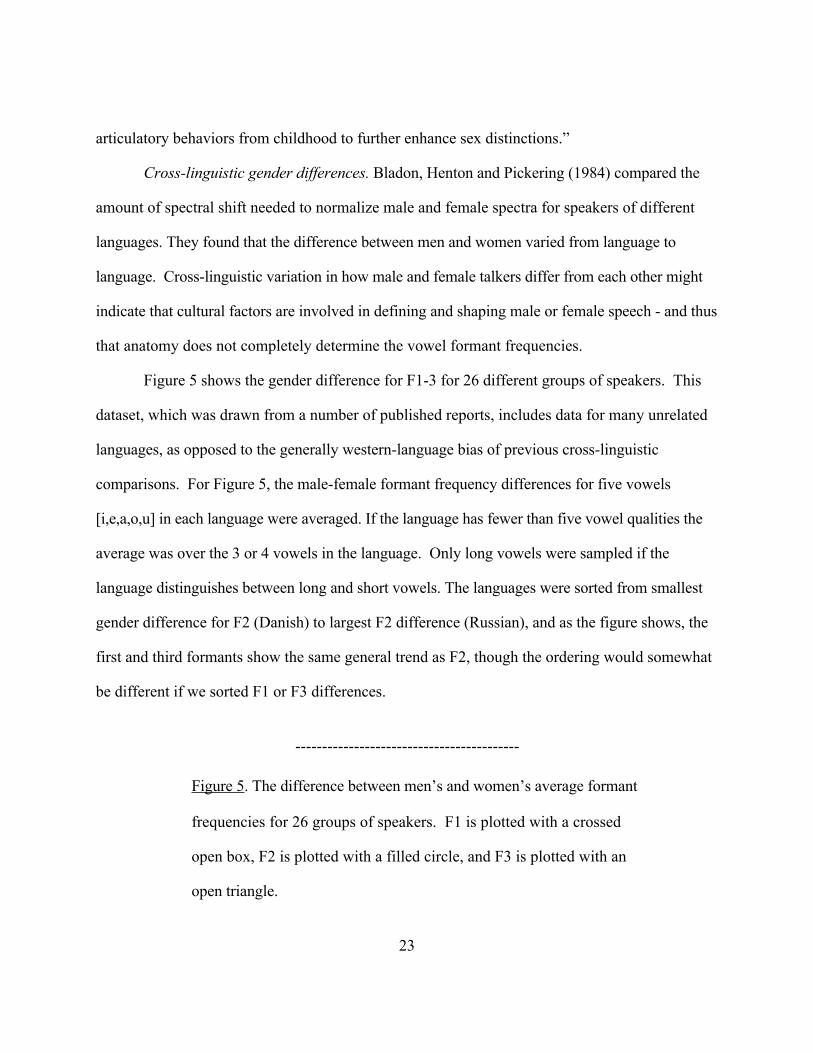
Figure 5 shows the gender difference for F1-3 for 26 different groups of speakers. This
dataset, which was drawn from a number of published reports, includes data for many unrelated
languages, as opposed to the generally western-language bias of previous cross-linguistic
comparisons. For Figure 5, the male-female formant frequency differences for five vowels
[i,e,a,o,u] in each language were averaged. If the language has fewer than five vowel qualities the
average was over the 3 or 4 vowels in the language. Only long vowels were sampled if the
language distinguishes between long and short vowels. The languages were sorted from smallest
gender difference for F2 (Danish) to largest F2 difference (Russian), and as the figure shows, the
first and third formants show the same general trend as F2, though the ordering would somewhat
be different if we sorted F1 or F3 differences.
------------------------------------------
Figure 5. The difference between men’s and women’s average formant
frequencies for 26 groups of speakers. F1 is plotted with a crossed
open box, F2 is plotted with a filled circle, and F3 is plotted with an
open triangle.
23
--------------------------------------------
As the figure shows, men and women have quite similar vowel formants in some
languages like Danish with less than 1/2 of a Bark difference between men and women for F1, F2
and F3, while other languages show formant frequency differences that are more than double this
like Russian.
Figure 6 shows the formant frequency differences between men and women as a function
of the women’s formant frequencies for the raw data that went into Figure 5. (The F by DF
space was suggested by Simpson, 2001.) The horizontal axis shows the vowel formant frequency
for women’s vowels, and the vertical axis shows the formant frequency difference between men
and women. Three clusters of points, for F1, F2 and F3, are shown against Traunmüller’s (1984)
model predictions plotted with filled symbols. Traunmüller’s gender differences predictions
match the average cross-linguistic pattern for this sample of 26 studies quite well, indicating that
vocal tract geometry differences may account for the general pattern of the data, but the data are
not tightly clustered around the predicted values. Overall only 30% of the variance is accounted
for by the vocal tract differences model.
---------------------------------------------Figure 6. The F by DF space for 26 groups of male and female adult
speakers. Male-female formant differences as a function of female formant
frequency. F1 values from the cross-linguistic data set are plotted with plus
signs, F2 data are plotted with x, and F3 is plotted with diamonds. The solid
symbols plot the predicted F by DF relationships from Traunmüller’s (1984)
simulations of male-female “anatomy-only” formant differences. The solid
regression lines are fit to Traunmüller’s predictions, and the dashed
24
regression lines fit the cross-linguistic data.
-------------------------------------------
Traunmüller’s (1984) model of male-female vocal tract differences was based on anatomy
studies of particular speakers, so the unexplained variance in Figure 6 needs to be partialled
between variance due to specific talker’s vocal tract (vs. average male or female geometry) and
remaining gender differences in habits of articulation attributable to gender “dialect” differences
specific to particular speech communities.
These explorations into gender differences in vowel production by children and across
cultures suggest that talkers choose different styles of speaking as social, dialectal gender
markers. Thus, a speaker normalization that removes vocal tract differences will fail to account
for the linguistic categorical similarity of vowels that are different due to different habits of
articulation (for individuals or gender “dialect” differences). Numerous studies indicate that
talker-specific characteristics interact with spoken language processing. What is more, if listeners
were not able to sense the aspects of phonetic production that vary due to the idiosyncrasies of
talkers, then they would be unable to control their own expression of these free subphonemic
contrasts.
Familiarity with the talker affects recognition. Interactions between talker identity and
spoken language processing have been found in studies where prior familiarity with the talker
influences processing. For example, Lightfoot (1989) trained listeners to recognize talkers and
found that listeners remembered words presented in a serial recall list better when they were
spoken in a familiar voice. Walker et al. (1995) took advantage of listener’s natural familiarity
with talkers (by using colleagues as talkers and listeners) and found that audio/visual integration
in the “McGurk effect” was modulated by familiarity. When the face and voice came from
25
different talkers, the audio and visual streams were not integrated for listeners who were familiar
with the talkers. Nygaard and Pisoni (1998) using a talker learning paradigm like Lightfoot’s
found that learning a talker from sentences does not lead to better word recognition performance,
but learning a talker from words leads to better word recognition performance and learning talkers
from sentences leads to better sentence processing performance. This is a quite important finding
because it suggests that the talker information being learned is not simply related to static vocal
tract geometry, but instead must have something to do with how people say things in the
particular instances heard – reflecting their habits of articulation.
Sociophonetic effects in spoken language processing. We saw in a section above that
listener expectations can influence speech perception. We discussed that data in the section
leading up to vocal tract normalization theory because it could be assumed that the effect of
listener expectations is limited to relating the incoming speech to a particular vocal tract
represenation. However, further evidence suggests that listener’s expectations are related to social
stereotypes rather than veridical vocal tract parameters. In socio-phonetics it has been
demonstrated through “matched guise” experiments that listeners are likely to attribute
personality traits to people on the basis of their speech patterns. Recently, this approach has
been extended to speech perception. Rubin (1992) found that speech intelligibility is reduced
when American college-age listeners associate a voice with an Asian looking face. He presented
the same recorded lectures with a picture of an Asian lecturer or a Caucasian lecturer, and found
lower listening comprehension scores for listeners who saw the Asian lecturer. Niedzielski
(1997) found that the perceived nationality of a talker (“Canadian” or “American”) influenced
vowel perception. She used a vowel matching procedure and told one group of listeners that the
speaker was from Ontario, Canada and another group of listeners that the speaker was a native of
26
Detroit. In matching synthetic vowel tokens to naturally produced words, listeners choose vowel
tokens that exhibited Canadian raising (the pronunciation of the English /aU/ diphthong as [!U]) if
the talker was identified as a “Canadian”, but choose nonraised variants as vowel matches if the
talker was identified as an “American”. What is especially telling about this result is that the
speaker (a Detroit native) actually pronounced the words with Canadian raising, so these Detroit
listeners ended up giving non-veridical answers in their matching responses to the “American”
speaker. In both of these studies, listeners’ socially-based expectations, regarding the talker’s
group membership, influenced perception. Similar perceptual effects for socially-based
expectations have also been observed in a role for gender in speech perception.
Strand (2000) found that gender stereotypicality influences auditory word recognition.
She measured stereotypicality implicitly as the convergence of a multidimensional scaling
analysis of the perceptual space for a group of talkers and a speeded gender classification task.
The main result of Strand’s study is that auditory word naming was slower when the talker was a
nonstereotypical male or female than when the talker was stereotypical. Interestingly, the male
“nonstereotypical” talker in this study had an unusually low fundamental frequency - so he was
nonstereotypical by sounding somewhat “hypermale” rather than being a bit androgynous.
Exemplar effects in word recognition. Acoustic-phonetic details of utterances seem to be a
part of the listener’s long term representation of speech. This has been demonstrated in tests of
recognition memory and more importantly in tests of auditory word recognition. Palmeri et al.
(1993) using a continuous recognition memory task, found that spoken words were more
accurately recognized as “old” when they were repeated in the same voice than if they were
repeated by a different talker. Church and Schacter (1994) found effects of voice, affect, and
pitch range in an implicit memory task. Word recognition performance was better when primes
27
(presented in a study list) and targets (presented in a test list) matched on these dimensions.
These findings indicate that fine phonetic details, such as those associated with talker differences,
remain as a part of the listener’s memory of words. Goldinger (1996, 1997) also tested for the
influence of talker-specific information in recognition memory for words. He found that talker
repetition affected recognition memory with a one day gap between study and test. More
significantly he also found repetition effects in perceptual identification. Previously heard items
were identified more accurately even at the longest interval tested - one week between exposure
and test. The long retention of talker-specific acoustic detail in this study is not consistent with
abstractionist models of speaker normalization like the F-ratio and vocal tract normalization
theories but is support for episodic/exemplar coding models.
TALKER NORMALIZATION.
Exemplar-based memory models (a common approach to the study of categorization and
memory in cognitive psychology) offers an advance over vocal tract normalization theory in
accounting for speaker normalization in speech perception. In this approach, cognitive
categories are represented as collections of the stored cognitive representations of experienced
instances of the category, rather than as normalized abstract representations from which
category-internal structure has been removed (Hintzman, 1986; Nosofsky, 1986, 1988; Kruschke
(1992).
Instance-based, or exemplar-based models exhibit behavior that is very much like the
generalization behavior of prototype theories (Hintzman, 1986). The main difference is that
generalization in an instance-based system takes place during retrieval/activation of the category
rather than during category storage/creation. Thus, on-line category adaptation, such as talker
adaptation, is possible.
28
In exemplar-based “speaker normalization” the frame of reference, or coordinate system,
is a set of “experienced” exemplars rather than a vocal tract (Johnson, 1997a,b). Rather than
warp the input signal to match a fixed internal template, the internal representation adapts
according to the “perceived identity of the talker” (Johnson, 1990), as exemplars appropriate for
the talker are activated and inappropriate exemplars are deactivated forming a base activation rate
(Nosofsky, 1988). In this system talker cues of all kinds can be involved in tuning the activated
set of exemplars - visual representation, prior expectations, recognition of a specific known voice,
and acoustic cues (F0 as a gender cue, but also formant range).
Additionally, exemplar models offer an adaptation mechanism that accounts for all kinds
of variation that influences listeners including dialect variation, and the impact of unusual acoustic
environments such as reverberation. Some surprising findings in the literature can be explained
when perception is considered to be based on an exemplar-based memory system. For example,
Nygaard and Pisoni’s (1998) odd finding that talker learning is mode specific - talker
representations learned from isolated words were not helpful to listeners in a sentence processing
task. Eklund and Traunmüller’s (1995) finding that talker and word misperceptions are
correlated - listeners were more likely to misperceive the message if the gender of the talker had
been misperceived. Strand’s (2000) finding that nonstereotypcial voices were processed more
slowly than stereotypical voices. These results are difficult to account for in traditional
abstractionist views of speech perception, and have a fairly straight-forward explanation in
exemplar-based models.
There are however some findings in the literature that seem to pose problems for
exemplar-based models. For example, Nygaard et al. (1994) found that familiarity with a talker’s
voice resulted in improved word recognition for novel stimuli, not used in training listeners to
29
become familiar with the talker. If, as might be expected from an exemplar-based model, the
listener’s knowledge of the talkers was based soley upon the exemplars presented during training,
then the word recognition gain should have been limited to performance with those particular
exemplars.
In summary, research on the talker normalization problem indicates that the listener’s
perceptual representations of linguistic categories are richly structured, with information about
talker identity retained in linguistic representations. One promising modeling strategy that
captures the rich internal structure of linguistic categories, while also accounting for processes of
generalization, is to model linguistic categories as collections of experienced instances rather than
seeing speech perception as a process of mapping variable inputs onto invariant abstract
representations.
REFERENCES
Ainsworth, W.A. (1970) Perception of synthesized isolated vowels and h_d words as a function
of fundamental frequency. Journal of the Acoustical Society of America 49, 1323-1324.
Assman, P.F., Nearey, T.M. & Hogan, J.T. (1982) Vowel identification: Orthographic,
perceptual, and acoustics aspects. J. Acoust. Soc. Am. 71, 975-989.
Atal, B.S., Chang, J.J., Mathews, M.V. and Tukey, J.W. (1978) Inversion of articulatory-to-
acoustic transformation of the vocal tract by a computer-sorting technique. J. Acoust.
Soc. Am. 63, 1535-1555.
Bennett, S. (1981) Vowel formant frequency characteristics of preadolescent males and females.
J. Acoust. Soc. Am. 69, 231-238.
Bennett, S. & Weinberg, B. (1979a) Sexual characteristics of preadolescent children’s voices. J.
Acoust. Soc. Am. 65, 179-189.
Bennett, S. & Weinberg, B. (1979b) Acoustic correlates of perceived sexual identity in
preadolescent children’s voices. J. Acoust. Soc. Am. 66, 989-1000.
30
Bladon, R.A., Henton, C.G. & Pickering, J.B. (1984) Towards an auditory theory of speaker
normalization. Language Communication 4, 59-69.
Byrd, D. (1994) Relations of sex and dialect to reduction. Speech Communication 15, 39-54.
Carlson, R., Granström, B., and Fant, G. (1970) Some studies concerning perception of isolated
vowels. Speech Transmission Laboratory Quarterly Progress and Status Report 2-
3/1970, 19-35.
Chan, M.K.M. (1997) Gender differences in the Chinese language: A preliminary report.
Proceedings of the Ninth North American Conference on Chinese Linguistics (NACCL-9,
May 1997), edited by Hua Lin. 1998. Los Angeles: GSIL Publications, University of
Southern California. Volume 2, pages 35-52.
Chistovich, L.A., Sheikin, R.L. and Lublinskaja, V.V. (1979) “Centres of gravity” and spectral
peaks as the determinants of vowel quality. In B. Lindblom and S. Öhman (Eds.)
Frontiers of Speech Communication Research. New York: Academic Press (pp. 143-
157).
Creelman, C.D. (1957) Case of the unknown talker. J. Acoust. Soc. Am. 29, 655.
Dechovitz, D. (1977) Information conveyed by vowels: A confirmation. Haskins Laboratory
Status Report on Speech Research SR-53/54, 213-219.
Disner, S.F. (1980) Evaluation of vowel normalization procedures. J. Acoust. Soc. Am. 67, 253-
261.
Eguchi, S. & Hirsh, I.J. (1969) Development of speech sounds in children. Acta Oto-
laryngologica, Supplementum 257, 1-51.
Eklund, I. and Traunmüller, H. (1997) Comparative study of male and female whispered and
phonated versions of the long vowels of Swedish. Phonetica 54, 1-21.
Fant, G. (1966) A note on vocal tract size factors and non-uniform F-pattern scalings. STL-QPSR
4/1966, 22-30.
Fant, G. (1975) Non-uniform vowel normalization. STL-QPSR 2-3/1975, 1-19.
Fischer-Jørgensen, E. (1972) Formant frequencies of long and short Danish vowels. In E.S.
Firchow et al. (eds.) Studies for Einar Haugen. The Hague: Mouton, pp. 189-213.
Fox, R. and Qi, Y.Y. (1990) Context effects in the perception of lexical tone. Journal of Chinese
Linguistics 18, 261-283.
31
Fry, D.B., Abramson, A.S., Eimas, P.D. and Liberman, A.M. (1962) The identification and
discrimination of synthetic vowels. Language and Speech 5, 171-189.
Fujisaki, H. and Kawashima, T. (1968) The roles of pitch and higher formants in the perception
of vowels. IEEE Transactions on Audio and Electroacoustics AU-16, 73-77.
Gerstman, L.J. (1968) Classification of self-normalized vowels. IEEE Transactions on Audio and
Electroacoustics AU-16, 78-80.
Goldinger, S.D. (1996) Words and voices: Episodic traces in spoken word identification and
recognition memory. Journal of Experimental Psychology: Learning, Memory, and
Cognition 22, 1166-1183.
Goldinger, S.D. (1997) Words and voices: Perception and production in an episodic lexicon. In K.
Johnson and J.W. Mullennix (eds.) Talker Variability in Speech Processing. San Diego:
Academic Press (pp. 33-66).
Goldstein, U. (1980) An articulatory model for the vocal tracts of growing children. Unpublished
PhD dissertation. MIT, Cambridge, MA.
Gottfried, T.L. & Chew, S.L. (1986) Intelligibility of vowels sung by a countertenor. J. Acoust.
Soc. Am. 79, 124-130.
Günzburger, D. (1987) Duality in gender roles. Progress Report Institute of Phonetics Utrecht
12(2), 1-10.
Helmholtz, H.L.F. (1885) On the Sensations of Tone (Translated by A.J. Ellis) (2nd edition).
New York: Longmans.
Henton, C. (1992) The abnormality of male speech. In New Departures in Linguistics (G. Wolf,
Ed.) New York: Garland Publishing Co. (pp. 27-55).
Hillenbrand, J.M. and Nearey, T.M. (1999) Identification of resynthesized /hVd/ utterances:
Effects of formant contour. J. Acoust. Soc. Am. 105, 3509-3523.
Hindle, D. (1978) Approaches to vowel normalization in the study of natural speech. In D.
Sankoff (Ed.) Language Variation: Models and Methods. New York: Academic Press
(pp. 161-171).
Jassem, W. (1968) Vowel formant frequencies as cues to speaker discrimination. Speech Analysis
and Synthesis 1, 9-41. Warsaw: Panstwowe Wydawnictwo Naukowe. Institute of
Fundamental Research, Polish Academy of Sciences.
32
Johnson, K. (1989) Higher formant normalization results from auditory integration of F2 and F3.
Perception & Psychophysics 46, 174-180.
Johnson, K. (1990a) The role of perceived speaker identity in F0 normalization of vowels. J.
Acoust. Soc. Am. 88, 642-654.
Johnson, K. (1990b) Contrast and normalization in vowel perception. Journal of Phonetics 18,
229-254.
Johnson, K. (1981) Differential effects of speaker and vowel variability on fricative perception.
Language and Speech 34, 265-279.
Johnson, K. (1997a) Speech perception without speaker normalization: an exemplar model. In K.
Johnson and J.W. Mullennix (eds.) Talker Variability in Speech Processing. San Diego:
Academic Press (pp. 145-166).
Johnson, K. (1997b) The auditory/perceptual basis for speech segmentation. OSU Working
Papers in Linguistics 50, 101-113, Columbus, Ohio.
Johnson, K., Ladefoged, P. & Lindau, M. (1993) Individual differences in vowel production. J.
Acoust. Soc. Am. 94, 701-714.
Johnson, K., Strand, E.A. and D’Imperio, M. (1999) Auditory-visual integration of talker gender
in vowel perception. Journal of Phonetics 27, 359-384.
Joos, M.A. (1948) Acoustic Phonetics, Language 24, Suppl. 2, 1-136.
Kahn, M. (1975) Arabic Emphatics: The evidence for cultural determinants of phonetic sex-
typing. Phonetica 31, 38-50.
Kakehi, K. (1992) Adaptability to differences between talkers in Japanese Monosyllabic
perception. In Y. Tohkura, E. Vatikiotis-Bateson, & Y. Sagisaka (Eds.) Speech
Perception, Speech Production, and Linguistic Structure. Tokyo: OHM (pp. 135-142).
Kato, K. and Kakehi, K. (1988) Listener adaptability to individual speaker differences in
monosyllabic speech perception. J. Acoust. Soc. of Japan 44, 180-186.
Koenig, W., Dunn, H.K. and Lacy, L.Y. (1946) The sound spectrograph. J. Acoust. Soc. Am. 18,
19-49.
Kruschke, J.K. (1992) ALCOVE: An exemplar-based connectionist model of category learning.
Psychological Review, 99, 22-44.
Ladefoged, P. & Broadbent, D.E. (1957) Information conveyed by vowels. J. Acoust. Soc. Am.
33
29, 98-104.
Leather, J. (1983) Speaker normalization in the perception of lexical tone. Journal of Phonetics
11, 373-382.
Lee, S., Potamianos, A. & Narayanan, S. (1999) Acoustics of children’s speech: Developmental
changes of temporal and spectral parameters. J. Acoust. Soc. Am. 105, 1455-1468.
Lehiste, I. & Meltzer, D. (1973) Vowel and speaker identification in natural and synthetic
speech. Language and Speeech 16, 356-364.
Lehiste, I. & Peterson, G.E. (1961) Transitions, glides, and diphthongs. J. Acoust. Soc. Am. 33,
268-277.
Liberman, A.M., Cooper, F.S., Shankweiler, D. & Studdert-Kennedy, M. (1967) Perception of
the speech code. Psychological Review 74, 431-461.
Liberman, A.M. & Mattingly, I.G. (1985) The motor theory of speech perception revised.
Cognition 21, 1-36.
Lightfoot, N. (1989) Effects of talker familiarity on serial recall of spoken word lists. Research
on Speech Perception Progress Report (Bloomington: Indiana University, Department of
Psychology) 15, 419-443.
Lindau, M.E. (1975). Features for Vowels. Unpublished PhD Dissertation, UCLA.
Lloyd, R.J. (1890a) Some Researches into the Nature of Vowel-Sound. (Turner & Dunnett,
Liverpool, England).
Lloyd, R.J. (1890b) Speech sounds: Their nature and causation (I). Phonetische Studien 3, 251-
278.
Lloyd, R.J. (1891) Speech sounds: Their nature and causation (II-IV). Phonetische Studien 4, 37-
67, 183-214, 275-306.
Lloyd, R.J. (1892) Speech sounds: Their nature and causation (V-VII). Phonetische Studien 5, 1-
32, 129-141, 263-271.
Lobanov, B.M. (1971) Classification of Russian vowels spoken by different speakers. J. Acoust.
Soc. Am. 49, 606-608.
Magnuson, J.S. and Nusbaum, H.C. (1994) Some acoustic and non-acoustic conditions that
produce talker normalization. Proceedings of the 1994 Spring Meeting of the Acoustical
Society of Japan (pp. 637-638).
34
Magnuson, J.S. Yamada, R.A. and Nusbaum, H. (1994) Are representations used for talker
identification available for talker normalization? Proceedings of the International
Conference on Spoken Language Processing.
Martin, C.S., Mullennix, J.W., Pisoni, D.B. and Summers, W.V. (1989) Effects of talker
variability on recall of spoken word lists. Journal of Experimental Psychology: Learning,
Memory & Cognition 15, 676-681.
McGowan, R. S. (1997) Vocal tract normalization for articulatory recovery and adaptation. In K.
Johnson & J.W. Mullennix (eds.) Talker Variability in Speech Processing. San Diego:
Academic Press (pp. 211-226).
McGowan R.S. and Cushing S. (1999) Vocal tract normalization for midsagittal articulatory
recovery with analysis-by-synthesis. J. Acoust. Soc. Am. 106, 1090-1105.
Meditch, A. (1975) The development of sex-specific speech patterns in young children.
Anthropological Linguistics 17,421-433.
Miller, J.D. (1989) Auditory-perceptual interpretation of the vowel. J.Acoust. Soc. Am. 85,
2114-2134.
Miller, R.L. (1953) Auditory tests with synthetic vowels. J. Acoust. Soc. Am. 25, 114-121.
Mohr, B. and Wang, W. (1968) Perceptual distances and the specification of phonological
features. Phonetica 18, 31-45.
Moore, C. (1996) Speaker and Rate Normalization in the Perception of Lexical Tone by
Mandarin and English Listeners. PhD Dissertation. Cornell University.
Most, T., Amir, O. & Tobin, Y. (2000) The Hebrew vowel system: Raw and normalized acoustic
data. Language & Speech 43, 295-308.
Mullennix, J.W., Pisoni, D.B. & Martin, C.S. (1989) Some effects of talker variability on spoken
word recognition. J. Acoust. Soc. Am. 85, 365-378.
Nearey, T.M. (1978) Phonetic feature systems for vowels. (Indiana Univ. Linguistics Club,
Bloomington, IN).
Nearey, T.M. (1989) Static, dynamic, and relational properties in vowel perception. J. Acoust.
Soc. Am. 85, 2088-2113.
Niedzielski, N.A. (1997) The effect of social information on the phonetic perception of
sociolinguistic variables. PhD Dissertation, UC Santa Barbara.
35
Nordström, P.-E. (1977) Female and infant vocal tracts simulated from male area functions.
Journal of Phonetics 5, 81-92.
Nordström, P.-E. & Lindblom, B. (1975) A normalization procedure for vowel formant data.
Proceedings of the 8th International Congress of Phonetic Sciences, Leeds, England.
Nosofsky, R. M. (1986) Attention, similarity, and the identification-categorization relationship.
Journal of Experimental Psychology: General 115, 39-57.
Nosofsky, R.M. (1988) Exemplar-based accounts of relations between classification, recognition,
and typicality. Journal of Experimental Psychology: Learning Memory, and Cognition
14, 700-708.
Nusbaum, H. and Magnuson, J. (1997) Talker normalization: Phonetic constancy as a cognitive
process. In K. Johnson and J.W. Mullennix (eds.) Talker Variability in Speech
Processing. San Diego: Academic Press (pp. 109-132).
Nusbaum, H.C. and Morin, T.M. (1992) Paying attention to differences among talkers. In
Tohkura, Y., Sagisaka, Y. and Vatikiotis-Bateson, E. (Eds.), Speech Perception, Speech
Production, and Linguistic Structure. Tokyo: OHM (pp. 113-134).
Nygaard, L.C. & Pisoni, D.B. (1998) Talker-specific learning in speech perception. Perception &
Psychophysics 60, 355-376.
Nygaard, L.C., Sommers, M.S. & Pisoni, D.B. (1994) Speech perception as a talker-contingent
process. Psychological Science 5, 42-45.
Perry, T.L., Ohde, R.N. and Ashmead, D.H. (2001) The acoustic bases for gender identification
from children’s voices. J. Acoust. Soc. Am. 109, 2988-2998.
Peterson, G.E. (1961) Parameters of vowel quality. Journal of Speech and Hearing Research 4,
10-29.
Peterson, G.E. & Barney, H.L. (1952) Control methods used in the study of vowels. J. Acoust.
Soc. Am. 24, 175-184.
Pisoni, D.B. (1992) Talker normalization in speech perception. In Y. Tohkura, E. Vatikiotis-
Bateson, & Y. Sagisaka (Eds.) Speech Perception, Speech Production, and Linguistic
Structure. Tokyo: OHM (pp. 143-151).
Pisoni, D.B. (1997) Some thoughts on “normalization” in speech perception. In K. Johnson and
J.W. Mullennix (eds.) Talker Variability in Speech Processing. San Diego: Academic
36
Press (pp. 9-32).
Pols, (1969)L.C.W., van der Kamp, L.J.T., and Plomp, R. (1969) Perceptual and physical space
of vowel sounds. J. Acoust. Soc. Am. 46, 458-467.
Potter, R. & Steinberg, J. (1950) Toward the specification of speech. J. Acoust. Soc. Am. 22, 807-
820.
Rand, T.C. (1971) Vocal tract size normalization in the perception of stop consonants. Haskins
Lab. Status Report on Speech Research SR-25/26, 141-146.
Remez, R.E., Rubin, P.E., Nygaard, L.C. and Howell, W.A. (1987) Perceptual normalization of
vowels produced by sinusoidal voices. Journal of Experimental Psychology: Human
Perception and Performance 13, 40-61.
Rosner, B.S. and Pickering, J.B. (1994) Vowel Perception and Production. Oxford University
Press.
Rubin, D. L. (1992). Non-language factors affecting undergraduates’ judgements of non-native
English-speaking teaching assistants. Research in Higher Education 33, 4.
Ryalls, J.H. and Lieberman, P. (1982) Fundamental frequency and vowel perception. J. Acoust.
Soc. Am. 72, 1631-1634.
Sachs, J., Lieberman, P. and Erickson, D. (1973) Anatomical and cultural determinants of male
and female speech. In Language Attitudes: Current Trends and Prospects. (R.W. Shuy &
R.W. Fasold, Eds.) Washington, D.C.; Georgetown University Press (pp. 74-84).
Schwippert, C. and Benoit, C. (1997) Audiovisual intelligibility of an androgynous speaker. In
Proceedings of the ESCA workshop on audiovisual speech processing (AVSP’97):
Cognitive and computational approaches, Rhodes, Greece (C. Benoit & R. Campbell,
editors), pp. 81-84.
Shankweiler, D., Verbrugge, R.R. and Studdert-Kennedy, M. (1978) Insufficiency of the target
for vowel perception. J. Acoust. Soc. Am 63, S4.
Shepard, R.N. (1972) Psychological representation of speech sounds. In Human Communication:
A Unified View (P.B. Denes & E.E. David, Eds.) New York: McGraw-Hill.
Simpson, A.P. (2001) Dynamic consequences of differences in male and female vocal tract
dimensions. J. Acoust. Soc. Am. 109, 2153-2164.
Slawson, A.W. (1968) Vowel quality and musical timbre as functions of spectrum envelope and
37
fundamental frequency. J. Acoust. Soc. Am. 43, 87-101.
Sovijärvi, A. (1938), Die gehaltenen, geflüsterten und gesungenen Vokale und Nasale der
finnischen Sprache, Annu. Acad. Sci., Fennicae, Helsinki B64, 2.
Strand, E.A. (2000) Gender Stereotype Effects in Speech Processing. PhD Dissertation. Ohio
State University.
Strand, E.A. & Johnson, K. (1996) Gradient and visual speaker normalization in the perception
of fricatives. In Natural language processing and speech technology: results of the 3rd
KONVENS conference, Bielefeld, (D. Gibbon, Ed.), Berlin: Mouton de Gruyter (pp. 14-
26).
Summerfield, Q. & Haggard, M.P. (1973) Vocal tract normalization as demonstrated by reaction
times. Report of Speech Research in Progress 2, 1-12, The Queen’s University of
Belfast, Belfast, Ireland.
Sussman, H.M. (1986) A neuronal model of vowel normalization and representation. Brain Lang.
28, 12-23.
Sussman, H.M., Fruchter, D., Hilbert, J. and Sirosh, J. (1997) Linear correlates in the speech
signal: The orderly output constraint. Brain & Behavioral Science
Syrdal, A.K. & Gopal, H.S. (1986) A perceptual model of vowel recognition based on the
auditory representation of American English vowels. J. Acoust. Soc. Am. 79, 1086-1100.
Tartter, V.C. (1991) Identifiability of vowels and speakers from whispered syllables. Perception
& Psychophysics 49, 365-372.
Terbeek, D. and Harshman, R. (1972) Is vowel perception non-Euclidian? J. Acoust. Soc. Am. 51,
81.
Traunmüller, H. (1981) Perceptual dimension of openness in vowels. J. Acoust. Soc. Am. 69,
1465-1475.
Traunmüller, H. (1984) Articulatory and perceptual factors controlling the age- and sex-
conditioned variability in formant frequencies of vowels. Speech Communication 3, 49-
61.
Verbrugge, R.R., Strange, W., Shankweiler, D.P. & Edman, T.R. (1976) What information enables
a listener to map a talker’s vowel space? J. Acoust. Soc. Am. 60, 198-212.
Walker, S., Bruce, V., and O’Malley, C. (1995) Facial identity and facial speech processing:
38
Familiar faces and voices in the McGurk effect. Perception & Psychophysics 57, 1124-
1133.
Watkins, A.J. & Makin, S.J. (1994) Perceptual compensation for speaker differences and for
spectral-envelope distortion. J. Acoust. Soc. Am. 96, 1263-1282.
Whalen, D.H. and Sheffert, S.M. (1997) Normalization of vowels by breath sounds. In K.
Johnson and J.W. Mullennix (eds.) Talker Variability in Speech Processing. San Diego:
Academic Press (pp. 133-144).
White, P. (1999) Formant frequency analysis of children’s spoken and sung vowels using
sweeping fundamental frequency production. Journal of Voice 13, 570-582.
39
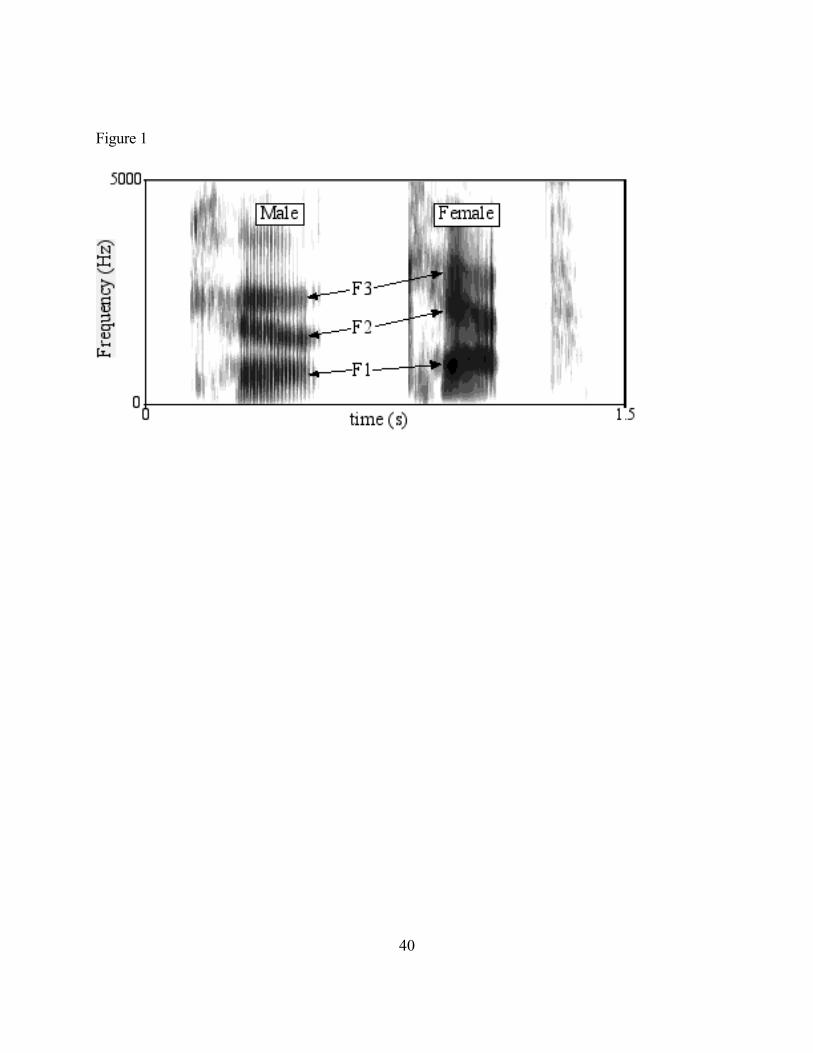
Figure 1
40
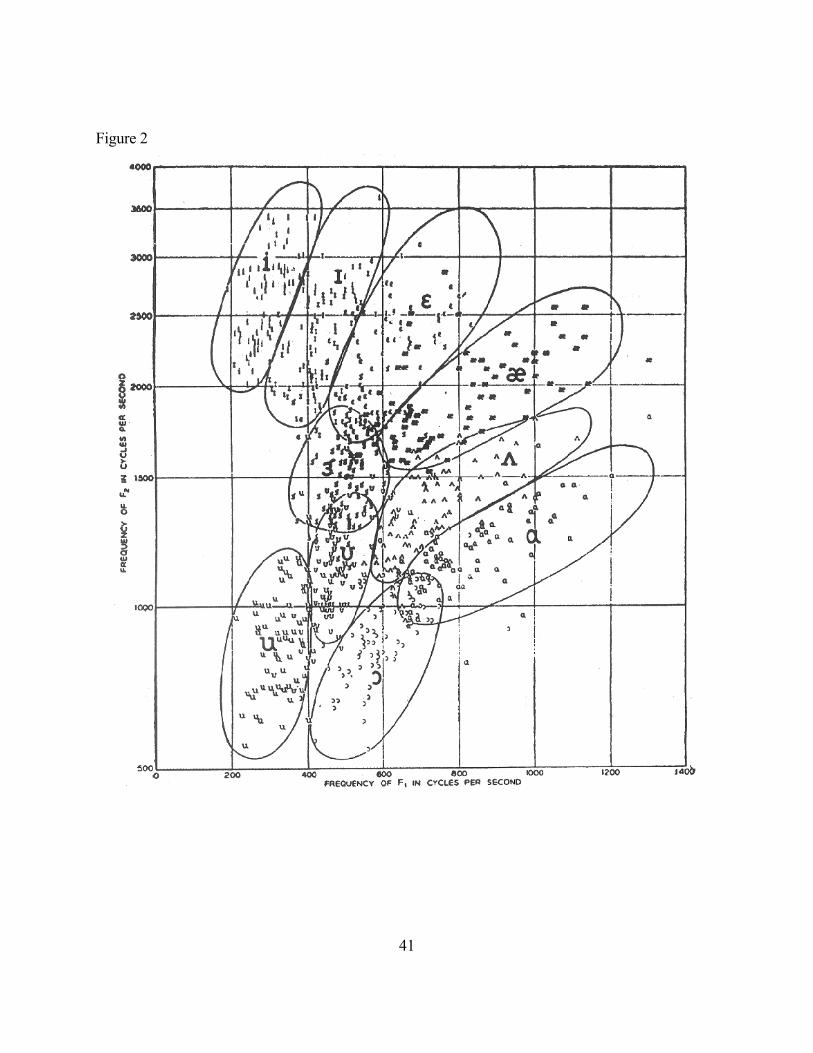
Figure 2
41
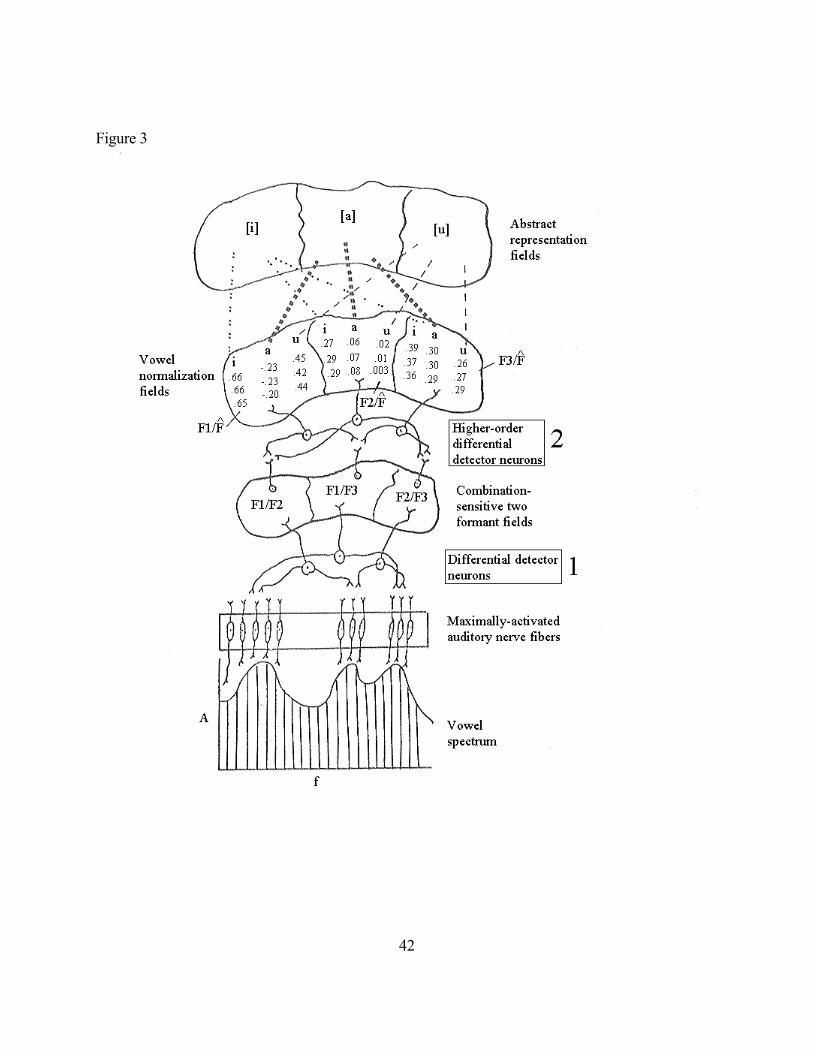
Figure 3
42
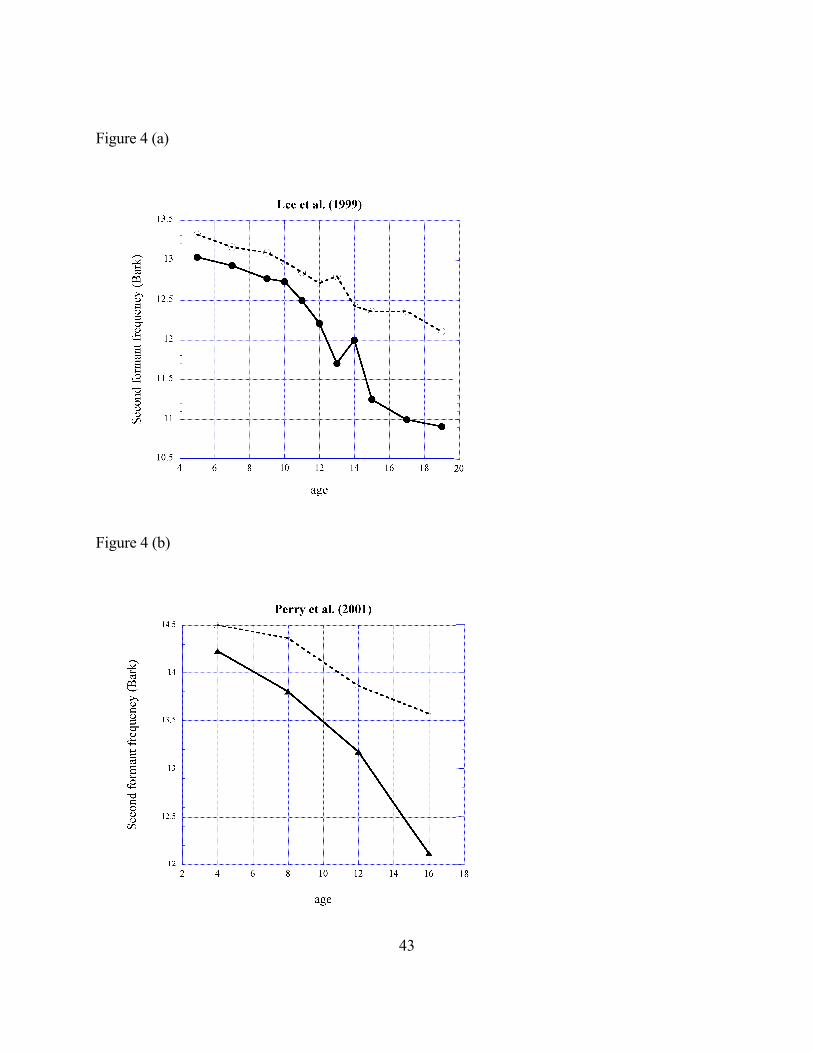
Figure 4 (a)
Figure 4 (b)
43
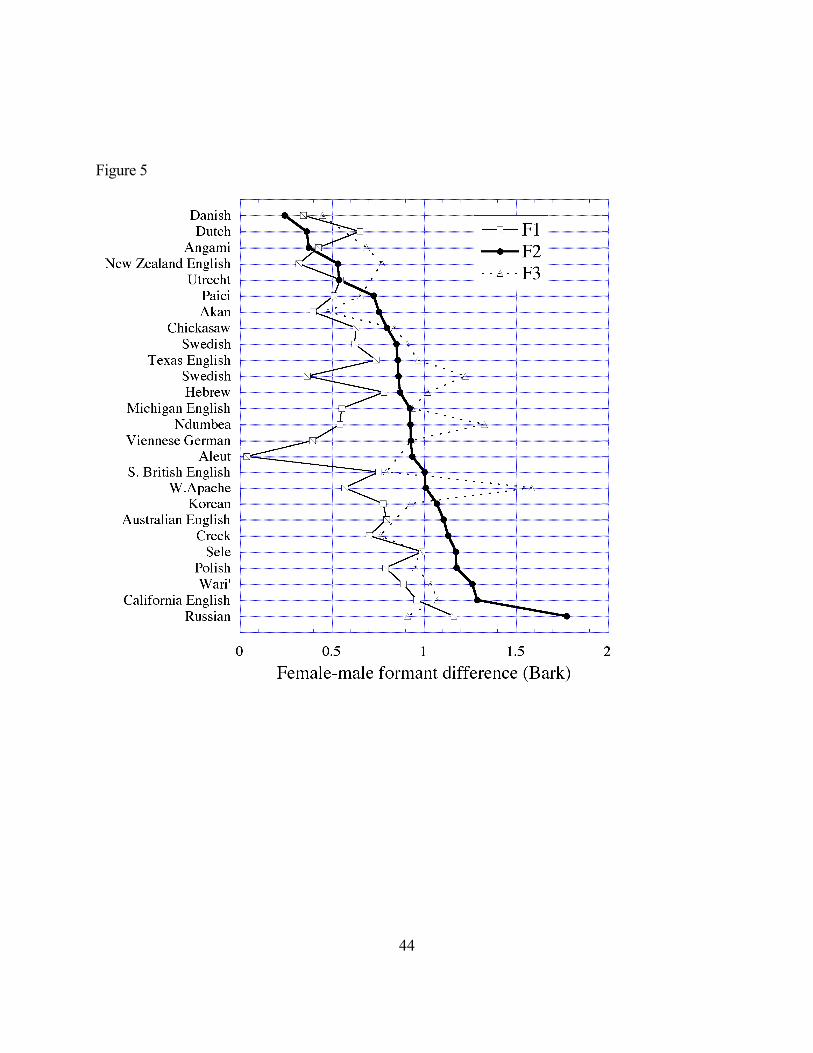
Figure 5
44
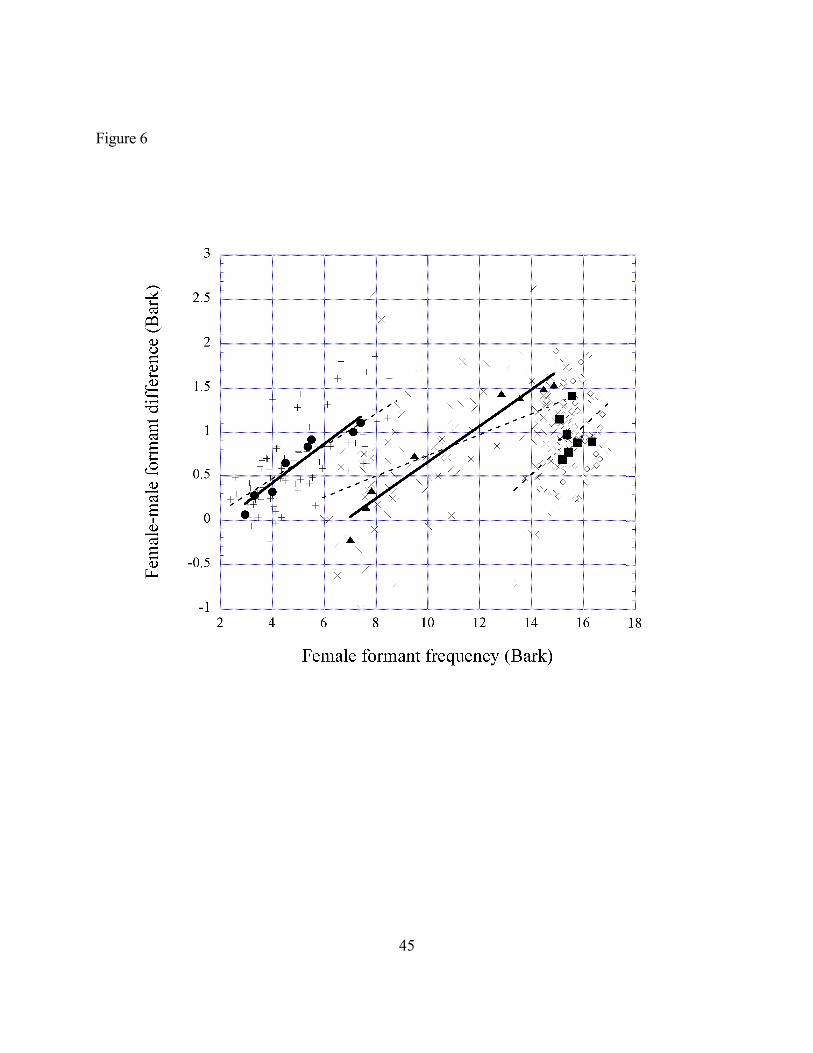
Figure 6
45
Related Documents