Spatiotemporal patterns of beta desynchronization and gamma synchronization in corticographic data during self-paced movement G. Pfurtscheller a,b, * , B. Graimann a , J.E. Huggins c , S.P. Levine c,d , L.A. Schuh e a Department of Medical Informatics, Institute of Biomedical Engineering, University of Technology Graz, Inffeldgasse 16a/II, A-8010 Graz, Austria b Ludwig Boltzmann Institute for Medical Informatics and Neuroinformatics, Inffeldgasse 16a/II, A-8010 Graz, Austria c Department of Biomedical Engineering, University of Michigan, Ann Arbor, MI, USA d Department of Physical Medicine and Rehabilitation, University of Michigan, Ann Arbor, MI, USA e Department of Neurology, Henry Ford Hospital, Detroit, MI 48202, USA Accepted 14 February 2003 Abstract Objective: To study the spatiotemporal pattern of event-related desynchronization (ERD) and event-related synchronization (ERS) in electrocorticographic (ECoG) data with closely spaced electrodes. Methods: Four patients with epilepsy performed self-paced hand movements. The ERD/ERS was quantified and displayed in the form of time – frequency maps. Results: In all subjects, a significant beta ERD with embedded gamma ERS was found. Conclusions: Self-paced movement is accompanied not only by a relatively widespread mu and beta ERD, but also by a more focused gamma ERS in the 60–90 Hz frequency band. q 2003 International Federation of Clinical Neurophysiology. Published by Elsevier Science Ireland Ltd. All rights reserved. Keywords: Electrocorticogram; Event-related desynchronization; Event-related synchronization; Self-paced movement; Beta activity; Gamma activity 1. Introduction Subdural electrodes are closer to neuronal structures in superficial cortical layers than electroencephalogram (EEG) electrodes placed on the scalp. It is estimated by Cooper et al. (1965) that scalp electrodes represent the spatially averaged electrical activity over a cortical area of at least several square centimeters. Several closely spaced subdural electrodes can be placed over an area of this size such that each of these electrodes measures the spatially averaged bioelectrical activity of an area very likely much smaller than several square centimeters. The advantages of subdural recordings include recording from smaller sources of ‘synchronized activity’, higher signal-to-noise ratio than scalp recordings, and increased ability to record and study gamma activity above 30 Hz. Gamma activity is generated by rapidly oscillating cell assemblies comprised of a small number of neurons (Singer, 1993). Consequently, gamma activity is characterized by small amplitude fluctuations that are not easily recordable with scalp electrodes. Sheer et al. (1966) was the first to report movement-induced gamma activity in scalp EEG. Gamma bursts of 40 Hz embedded in desynchronized mu and central beta rhythms were recorded during a finger movement task in an able-bodied subject by Pfurtscheller et al. (1993). Self-paced limb movements are accompanied by 3 different types of event-related desynchronization and synchronization (ERD/ERS) patterns on scalp EEG: (i) contralateral dominant alpha and beta ERD prior to movement; (ii) bilateral symmetrical alpha and beta ERD during execution of movement and (iii) contralateral dominant beta rebound (beta ERS) within the first second after movement-offset (Pfurtscheller and Lopes da Silva, 1999a). Additionally, in subdural recordings, contralateral dominant gamma bursts (gamma ERS) are expected during the execution phase. The aim of the present investigation is to study the dynamics of oscillatory activity in the alpha, beta, and Clinical Neurophysiology 114 (2003) 1226–1236 www.elsevier.com/locate/clinph 1388-2457/03/$30.00 q 2003 International Federation of Clinical Neurophysiology. Published by Elsevier Science Ireland Ltd. All rights reserved. doi:10.1016/S1388-2457(03)00067-1 * Corresponding author. Tel.: þ43-316-873-5300; fax: þ 43-316-873- 5349. E-mail address: [email protected] (G. Pfurtscheller).

Welcome message from author
This document is posted to help you gain knowledge. Please leave a comment to let me know what you think about it! Share it to your friends and learn new things together.
Transcript
Spatiotemporal patterns of beta desynchronization and gamma
synchronization in corticographic data during self-paced movement
G. Pfurtschellera,b,*, B. Graimanna, J.E. Hugginsc, S.P. Levinec,d, L.A. Schuhe
aDepartment of Medical Informatics, Institute of Biomedical Engineering, University of Technology Graz, Inffeldgasse 16a/II, A-8010 Graz, AustriabLudwig Boltzmann Institute for Medical Informatics and Neuroinformatics, Inffeldgasse 16a/II, A-8010 Graz, Austria
cDepartment of Biomedical Engineering, University of Michigan, Ann Arbor, MI, USAdDepartment of Physical Medicine and Rehabilitation, University of Michigan, Ann Arbor, MI, USA
eDepartment of Neurology, Henry Ford Hospital, Detroit, MI 48202, USA
Accepted 14 February 2003
Abstract
Objective: To study the spatiotemporal pattern of event-related desynchronization (ERD) and event-related synchronization (ERS) in
electrocorticographic (ECoG) data with closely spaced electrodes.
Methods: Four patients with epilepsy performed self-paced hand movements. The ERD/ERS was quantified and displayed in the form of
time–frequency maps.
Results: In all subjects, a significant beta ERD with embedded gamma ERS was found.
Conclusions: Self-paced movement is accompanied not only by a relatively widespread mu and beta ERD, but also by a more focused
gamma ERS in the 60–90 Hz frequency band.
q 2003 International Federation of Clinical Neurophysiology. Published by Elsevier Science Ireland Ltd. All rights reserved.
Keywords: Electrocorticogram; Event-related desynchronization; Event-related synchronization; Self-paced movement; Beta activity; Gamma activity
1. Introduction
Subdural electrodes are closer to neuronal structures in
superficial cortical layers than electroencephalogram (EEG)
electrodes placed on the scalp. It is estimated by Cooper
et al. (1965) that scalp electrodes represent the spatially
averaged electrical activity over a cortical area of at least
several square centimeters. Several closely spaced subdural
electrodes can be placed over an area of this size such that
each of these electrodes measures the spatially averaged
bioelectrical activity of an area very likely much smaller
than several square centimeters. The advantages of subdural
recordings include recording from smaller sources of
‘synchronized activity’, higher signal-to-noise ratio than
scalp recordings, and increased ability to record and study
gamma activity above 30 Hz. Gamma activity is generated
by rapidly oscillating cell assemblies comprised of a small
number of neurons (Singer, 1993). Consequently, gamma
activity is characterized by small amplitude fluctuations that
are not easily recordable with scalp electrodes. Sheer et al.
(1966) was the first to report movement-induced gamma
activity in scalp EEG. Gamma bursts of 40 Hz embedded in
desynchronized mu and central beta rhythms were recorded
during a finger movement task in an able-bodied subject by
Pfurtscheller et al. (1993).
Self-paced limb movements are accompanied by 3
different types of event-related desynchronization and
synchronization (ERD/ERS) patterns on scalp EEG: (i)
contralateral dominant alpha and beta ERD prior to
movement; (ii) bilateral symmetrical alpha and beta ERD
during execution of movement and (iii) contralateral
dominant beta rebound (beta ERS) within the first second
after movement-offset (Pfurtscheller and Lopes da Silva,
1999a). Additionally, in subdural recordings, contralateral
dominant gamma bursts (gamma ERS) are expected during
the execution phase.
The aim of the present investigation is to study the
dynamics of oscillatory activity in the alpha, beta, and
Clinical Neurophysiology 114 (2003) 1226–1236
www.elsevier.com/locate/clinph
1388-2457/03/$30.00 q 2003 International Federation of Clinical Neurophysiology. Published by Elsevier Science Ireland Ltd. All rights reserved.
doi:10.1016/S1388-2457(03)00067-1
* Corresponding author. Tel.: þ43-316-873-5300; fax: þ43-316-873-
5349.
E-mail address: [email protected] (G. Pfurtscheller).
gamma bands during self-paced movement in the form of a
palmar pinch and tongue protrusion. We studied the
spatiotemporal characteristics of ERD/ERS patterns in
electrocorticographic (EcoG) data recorded from 4 patients
who participated in an epilepsy surgery program in the
course of which 62–120 subdural electrodes had been
implanted over frontal and parietal areas.
2. Methods
2.1. Subjects and experimental paradigms
Subjects participating in this study were patients in the
comprehensive epilepsy program at the Henry Ford Hospital
in Detroit, Michigan, who had undergone implantation of
subdural electrodes for the purpose of epilepsy surgery.
Electrode locations were selected exclusively as part of their
epilepsy surgery evaluation and no consideration was made
for research purposes. The 4 subjects, 3 females and one
male, had an average age of 29 ^ 8.7 years. Additional
information about the participating subjects is listed in
Table 1. The subjects performed 2–4 groups of 50
repetitions of a palmar pinch movement and tongue
protrusion in a self-paced manner. The execution of the
requested hand movement was documented by electromyo-
gram (EMG) electrodes placed on the first dorsal inteross-
eous muscle and the ulnar styloid process. The occurrence
of the tongue movement was documented by EMG
electrodes placed above and below opposite corners of the
mouth. ECoG and EMG were recorded on a Nicolet BMSI
5000 at a sampling rate of 200 Hz with bandpass-filter
settings between 0.55 and 100 Hz. More details of the
applied recording technique are described elsewhere
(Levine et al., 2000).
2.2. Quantification of ERD/ERS
The quantification of ERD/ERS was done in 5 steps:
bandpass filtering, extraction of trials, squaring of samples,
averaging over trials, and smoothing of the ERD/ERS
values. The first step, bandpass filtering, was performed in
the frequency domain. The ECoG signal was transformed
into the frequency domain by the fast Fourier transform
(FFT). After multiplying by the bandpass-filter function, the
signal was inverse-transformed to obtain a filtered signal in
the time domain. The bandpass-filtered ECoG was then
segmented into trials of 6 s in length (1200 samples) and
aligned to the onset of the trigger event (600 samples before
and 600 samples after the trigger). Due to the self-paced
recording protocol, the time periods between consecutive
movements could be shorter than 6 s. This implies the
possibility of overlapping consecutive trials and thus a
compromise between the number of trials available for
Table 1
Characteristics of the participating subjects
Subject C17 Age 19 Sex Female
#Electrodes and grid placement 120(32)/left frontal parietal grid
Seizure type Localization-related epilepsy with secondarily generalized tonic–clonic
seizures from both hippocampi
Seizure etiology Cryptogenic; seizure frequency worsened following a closed head injury
Cortical abnormalities, physical impairments None
Subject C18 Age 29 Sex Female
#Electrodes and grid placement 62(8)/sensorimotor strip
Seizure type Localization-related epilepsy with complex partial seizures of left posterior
temporal neocortical onset
Seizure etiology Cryptogenic
Cortical abnormalities, physical impairments Prior left temporal lobectomy
Subject C20 Age 26 Sex Male
#Electrodes and grid placement 114(36)/right parietal grid
Seizure type Localization-related epilepsy with secondarily generalized tonic–clonic
seizures of right parietal-posterior temporal neocortical onset
Seizure etiology Unclear; premature by 4 weeks but no neonatal seizures or developmental
delay; probably cryptogenic
Cortical abnormalities, physical impairments None
Subject C24 Age 40 Sex Female
#Electrodes and grid placement 112(20)/left partietal frontal grid
Seizure type Localization-related epilepsy with complex partial seizures of regional
right fronto-central onset
Seizure etiology Stroke at age 10 months
Cortical abnormalities, physical impairments Left hemiparesis and severe loss of brain volume of the right; hemisphere
Beside the total number of electrodes, the investigated electrodes (in brackets), the location of the implanted electrode grid/strip and other parameters of
interest are indicated.
G. Pfurtscheller et al. / Clinical Neurophysiology 114 (2003) 1226–1236 1227
ERD/ERS analysis and number of overlapping trials was
necessary. Therefore, trials with a trigger-to-trigger interval
shorter than 4.5 s were not considered. This left a minimum
of 30 trials in each group of actions for further analysis.
The ERD/ERS is defined as the proportional power
decrease (ERD) or power increase (ERS) in relation to the
baseline activity determined from a specific reference
interval which is usually placed several seconds before
trigger onset (Pfurtscheller and Lopes da Silva, 1999b). For
this study, the occasional overlap occurring between trials
made it difficult to choose an appropriate placement of the
reference interval. Therefore, the baseline activity was
derived from the whole trial interval, i.e. the whole trial was
taken to be the reference interval. Since evoked potentials
can mask induced activities, the mean of the averaged data
was subtracted from each sample before squaring the data.
In mathematical terms, the procedure can be expressed as
follows:
Aj ¼1
M 2 1
XM
i¼1
ðxij 2 �xjÞ2 ð1Þ
R ¼1
k
Xr0þk
r0
Aj ð2Þ
ERDj ¼Aj 2 R
R£ 100% ð3Þ
where, M is the total number of trials, xij is the j-th sample of
the i-th trial of the bandpass-filtered data, �xj is the mean of
the j-th sample averaged over all bandpass-filtered trials,
and Aj is the j-th power sample. R is the average power in the
reference interval [r0, r0 þ k ] with r0, the first sample of the
trial and r0 þ k, the last sample of the trial.
The statistical significance of the ERD/ERS values was
verified by applying a t-percentile bootstrap to calculate
confidence intervals with a ¼ 0:01. An ERD/ERS value
was considered as significant with a 99% confidence when
both confidence values of this sample show the same sign.
Details about the bootstrapping of ERD/ERS values can be
found elsewhere (Graimann et al., 2002).
By following this procedure, ERD/ERS values of 10 Hz
bands ranging from 5 to 90 Hz and with an overlap of 5 Hz
were calculated. All values for one ECoG channel were
subsequently used to construct time–frequency plots
(ERD/ERS maps). ERD/ERS maps only display significant
power decrease (ERD, colored in red) or increase (ERS,
colored in blue). Together with the topographical infor-
mation, they provide a clear overview of the movement-
related behavior of the non-phase locked activity over a
broad frequency range. Concrete information on frequency
components occurring at specific electrode locations and the
type of significant reactivity is immediately accessible.
3. Results
In all 4 subjects, movement-related desynchronization in
the alpha and beta bands and synchronization in the gamma
band were observed. The gamma ERS included frequency
components from 60 to 90 Hz, was short-lasting (,1 s) and
was always embedded in mu and/or beta desynchronization.
Examples of time–frequency ERD/ERS maps for a left
parietal frontal electrode (subject C24) and corresponding
ERD/ERS time courses for 4 electrodes arranged in one row
are displayed in Figs. 1 and 2.
The first column in Fig. 1 represents 4 electrodes
overlaying the pre-central region, the next two columns
corresponds to the post-central area and the last columns to
the parietal cortex. A broad banded ERD was present on the
majority of electrodes, whereas, gamma activity was
focused to electrodes overlaying pre- and post-central
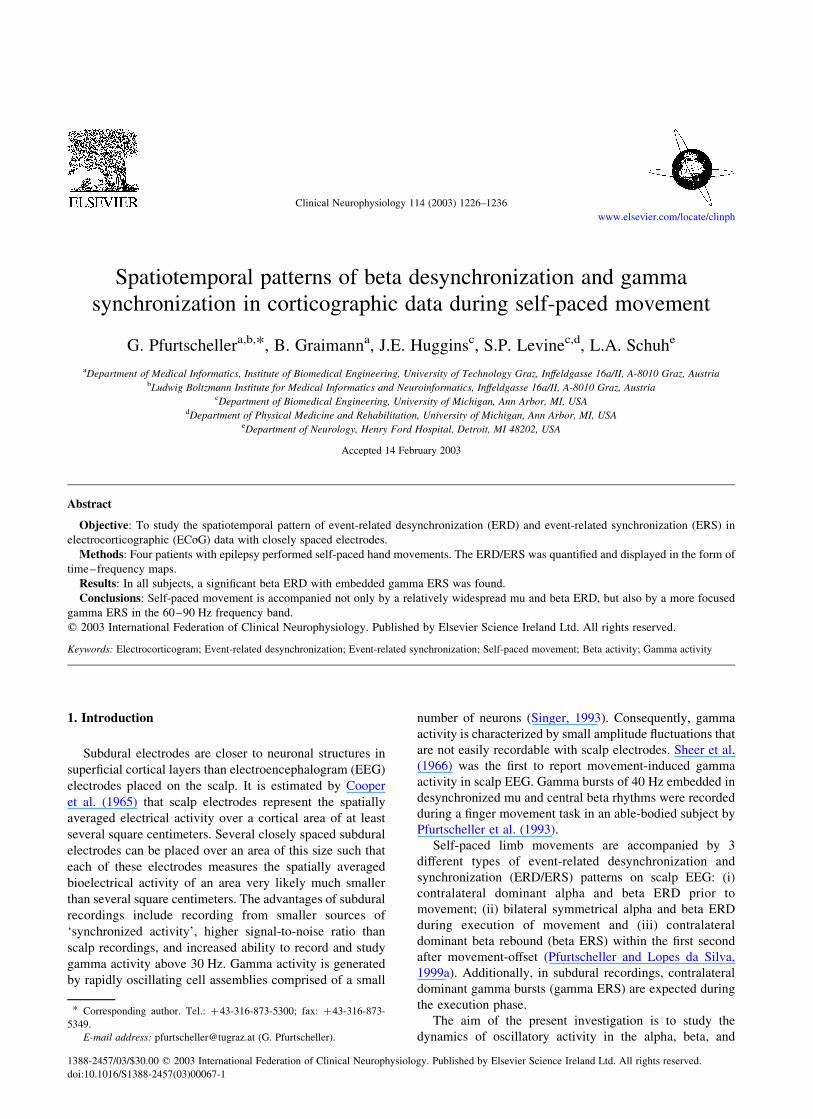
regions. Examples of time courses calculated for the 4
electrode positions in the fourth row in Fig. 1 are displayed
in Fig. 2.
The time courses in Fig. 2 show a significant power
decrease in the 20–30 Hz band with a duration of more than
1 s and a power increase in the 70–80 Hz band with a
duration of less than 1 s. On the right-most electrode (H44),
neither a significant beta power decrease nor gamma power
increase was present. It is of interest to note that the
electrode with the largest beta power decrease (electrode
H42) showed also the largest gamma power increase.
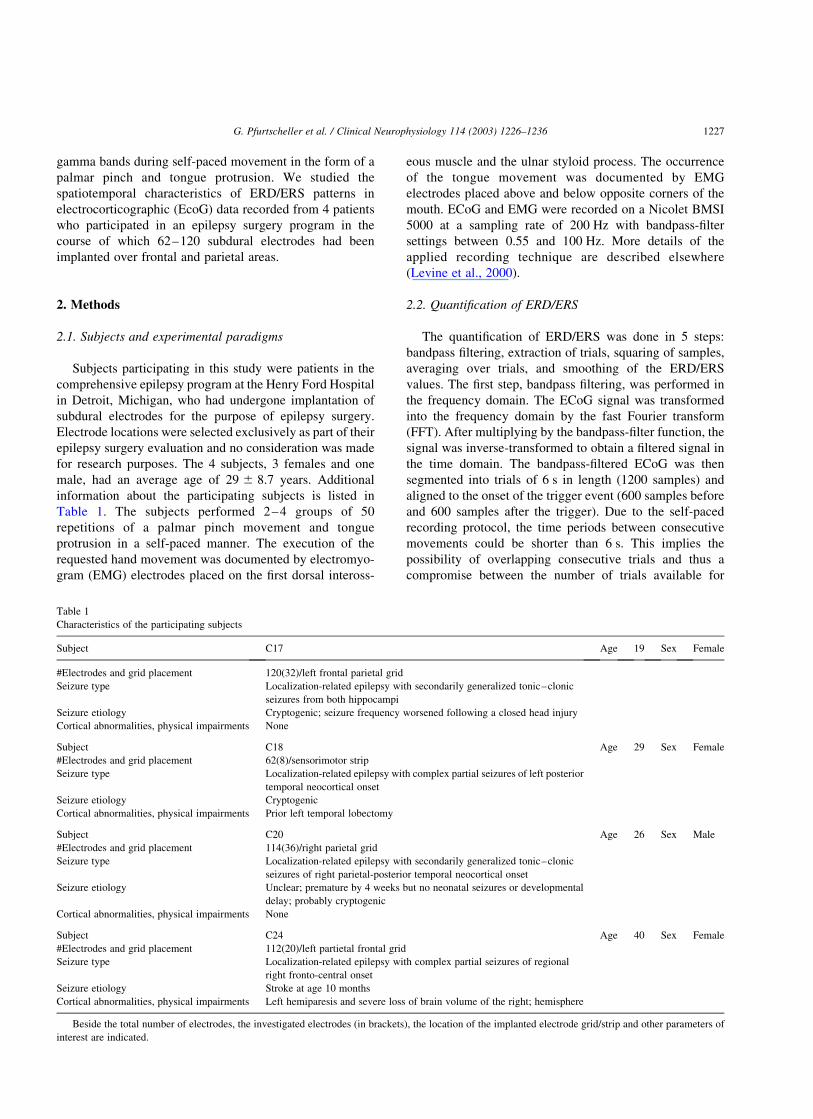
Another example (subject C17) of time–frequency
ERD/ERS maps is presented in Fig. 3. The electrode grid
is located over the pre-motor, pre-, post-central, and parietal
areas. From the 7 electrodes showing significant gamma
ERS (.100%), one was located over pre-central, two over
post-central, and 4 over parietal areas. The largest gamma
response was on electrode LC44 placed over the parietal
cortex. In addition to the gamma ERS, the majority of
electrodes displayed beta ERS. The post-movement power
increase over the respective electrode positions always
occurred in close relationship to the previous beta power
decrease.
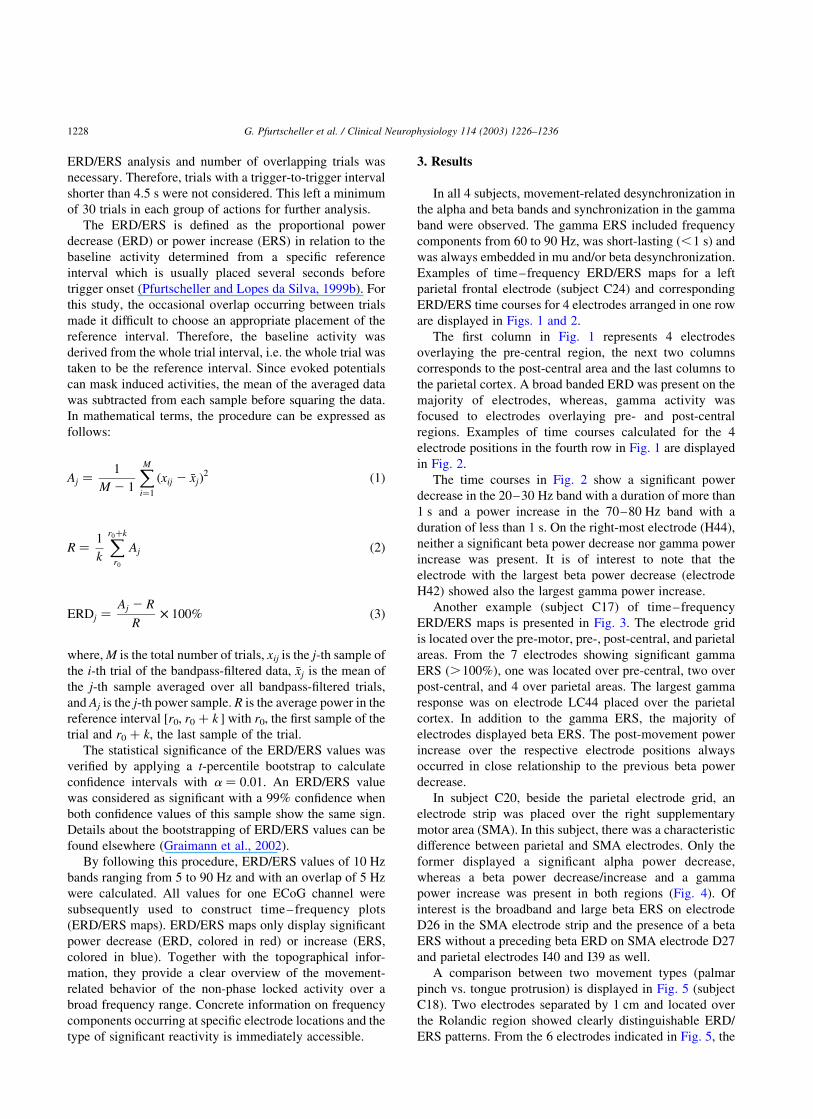
In subject C20, beside the parietal electrode grid, an
electrode strip was placed over the right supplementary
motor area (SMA). In this subject, there was a characteristic
difference between parietal and SMA electrodes. Only the
former displayed a significant alpha power decrease,
whereas a beta power decrease/increase and a gamma
power increase was present in both regions (Fig. 4). Of
interest is the broadband and large beta ERS on electrode
D26 in the SMA electrode strip and the presence of a beta
ERS without a preceding beta ERD on SMA electrode D27
and parietal electrodes I40 and I39 as well.
A comparison between two movement types (palmar
pinch vs. tongue protrusion) is displayed in Fig. 5 (subject
C18). Two electrodes separated by 1 cm and located over
the Rolandic region showed clearly distinguishable ERD/
ERS patterns. From the 6 electrodes indicated in Fig. 5, the
G. Pfurtscheller et al. / Clinical Neurophysiology 114 (2003) 1226–12361228
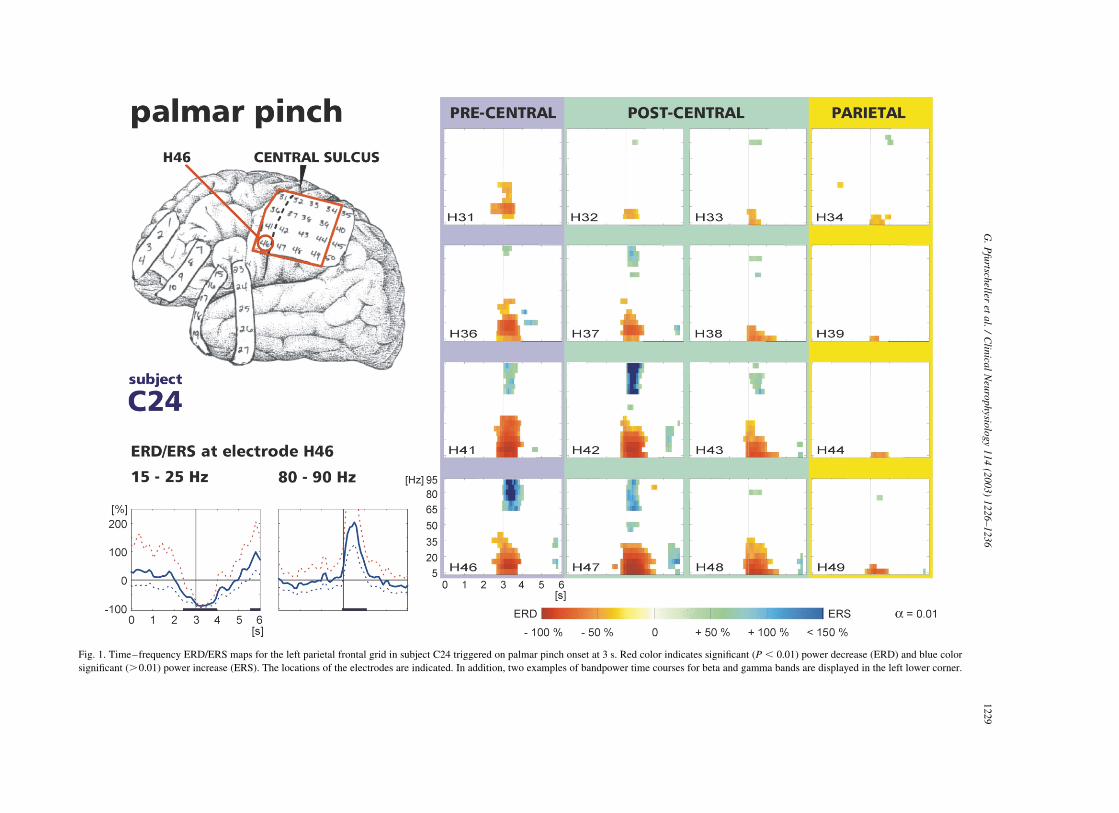
Fig. 1. Time–frequency ERD/ERS maps for the left parietal frontal grid in subject C24 triggered on palmar pinch onset at 3 s. Red color indicates significant ðP , 0:01Þ power decrease (ERD) and blue color
significant (.0.01) power increase (ERS). The locations of the electrodes are indicated. In addition, two examples of bandpower time courses for beta and gamma bands are displayed in the left lower corner.
G.
Pfu
rtscheller
eta
l./
Clin
ical
Neu
rop
hysio
log
y1
14
(20
03
)1
22
6–
123
61
22
9

Fig. 2. Bandpower time courses calculated in the bands 20–30 Hz and 70–80 Hz for 4 closely spaced ECoG electrodes in subject C24. The mean values and the 95% confidence intervals are displayed in the form
of curves. Significant changes are indicated by black bars above the x-axis. Note the occurrence of maximal gamma power increase during maximal attenuation of power in the beta band.
G.
Pfu
rtscheller
eta
l./
Clin
ical
Neu
rop
hysio
log
y1
14
(20
03
)1
22
6–
12
36
12
30
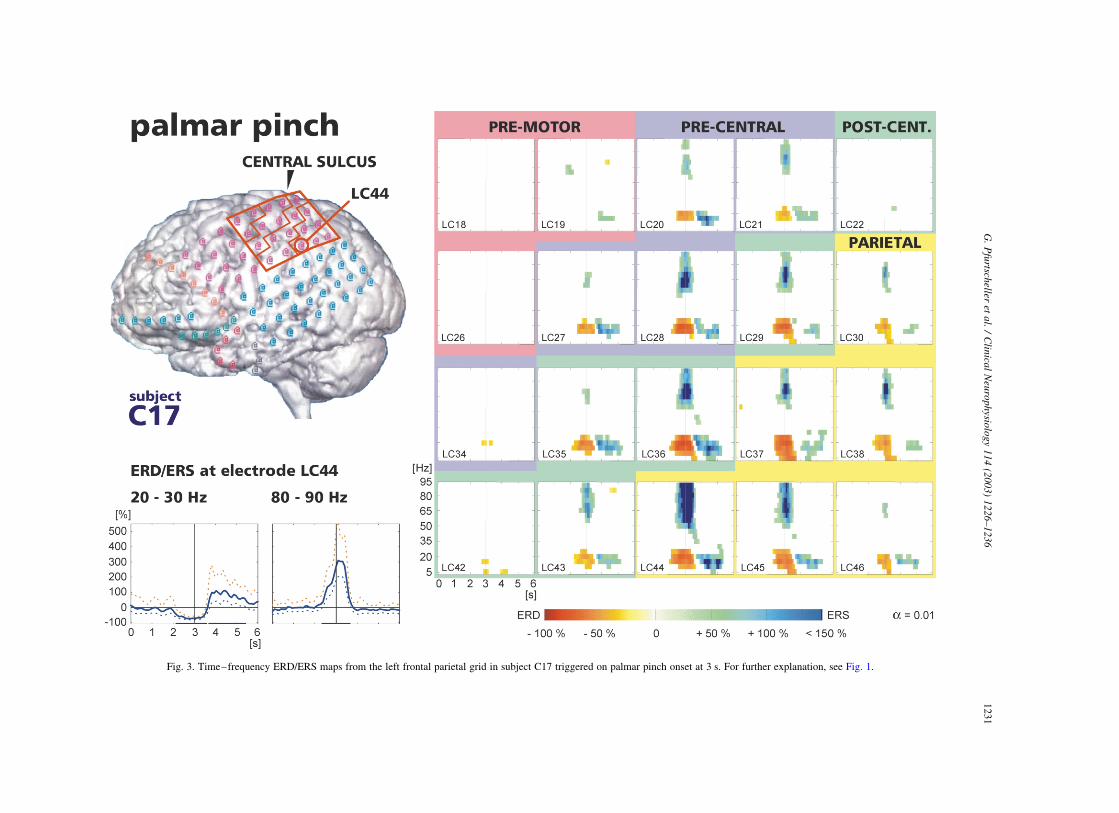
Fig. 3. Time–frequency ERD/ERS maps from the left frontal parietal grid in subject C17 triggered on palmar pinch onset at 3 s. For further explanation, see Fig. 1.
G.
Pfu
rtscheller
eta
l./
Clin
ical
Neu
rop
hysio
log
y1
14
(20
03
)1
22
6–
123
61
23
1
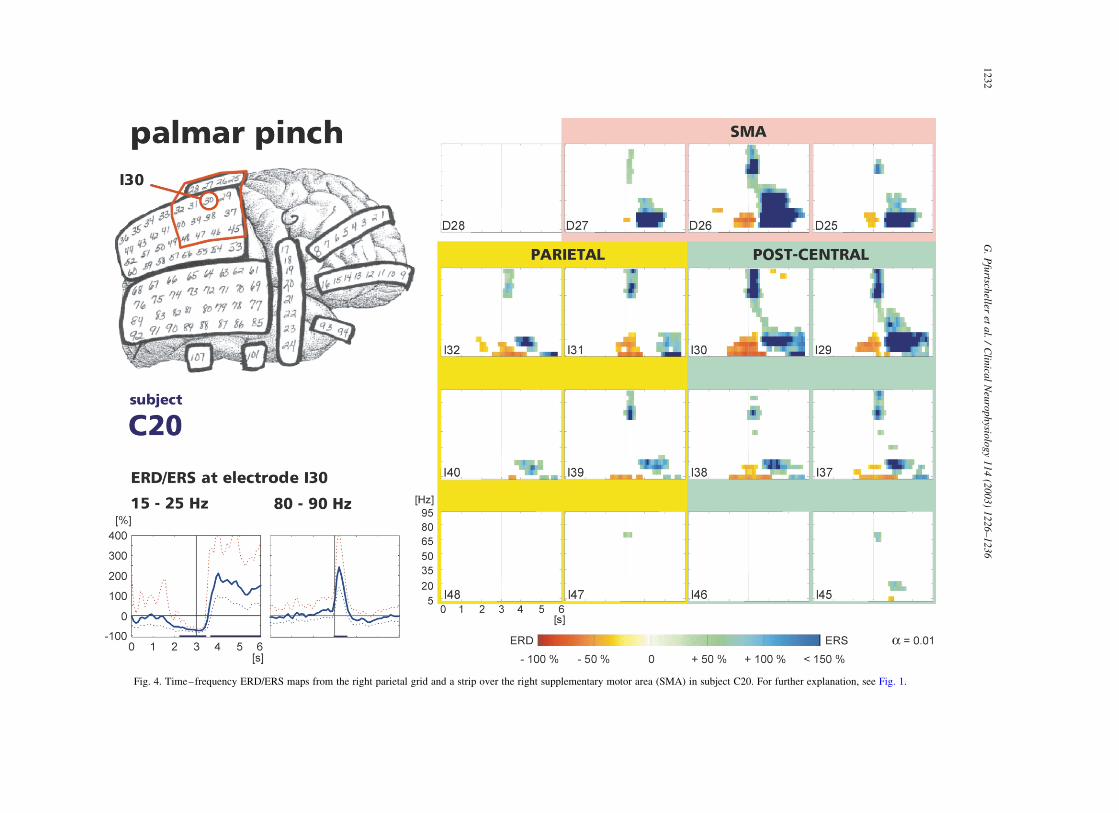
Fig. 4. Time–frequency ERD/ERS maps from the right parietal grid and a strip over the right supplementary motor area (SMA) in subject C20. For further explanation, see Fig. 1.
G.
Pfu
rtscheller
eta
l./
Clin
ical
Neu
rop
hysio
log
y1
14
(20
03
)1
22
6–
12
36
12
32
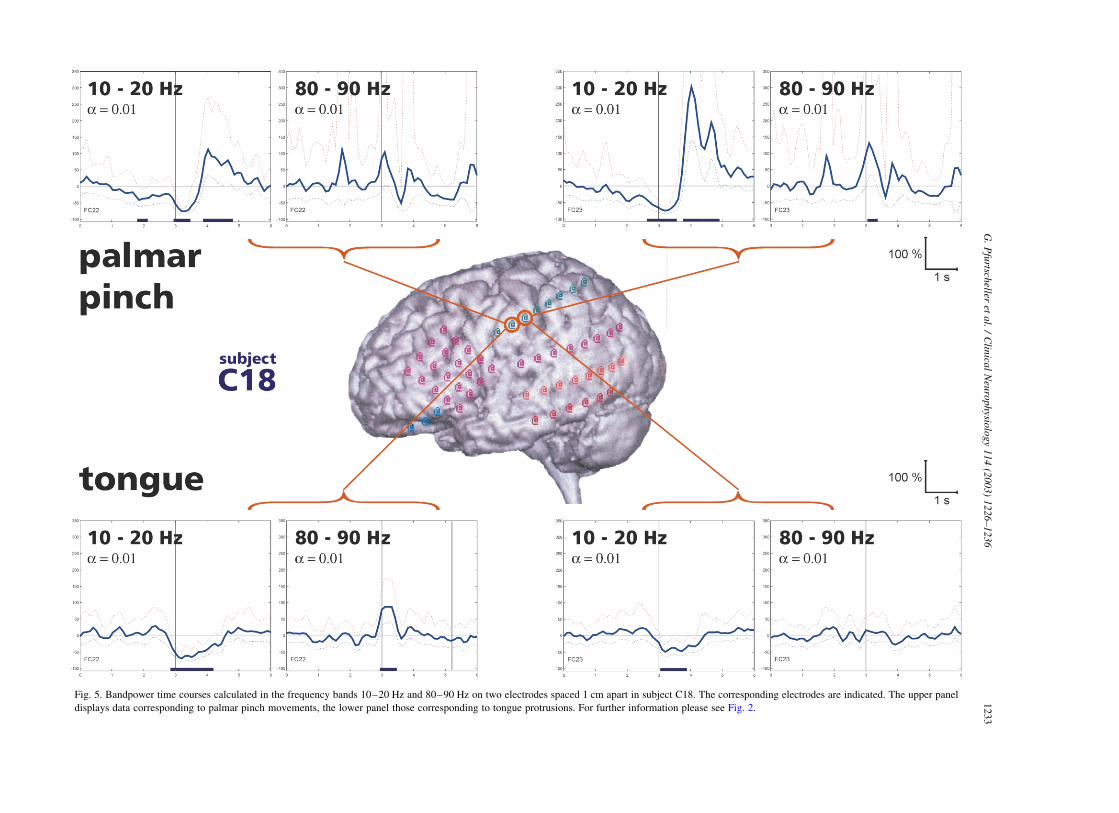
Fig. 5. Bandpower time courses calculated in the frequency bands 10–20 Hz and 80–90 Hz on two electrodes spaced 1 cm apart in subject C18. The corresponding electrodes are indicated. The upper panel
displays data corresponding to palmar pinch movements, the lower panel those corresponding to tongue protrusions. For further information please see Fig. 2.
G.
Pfu
rtscheller
eta
l./
Clin
ical
Neu
rop
hysio
log
y1
14
(20
03
)1
22
6–
123
61
23
3
first 4 were overlaying the post-central region and the last
two the parietal cortex. The palmar pinch was accompanied
by a significant power decrease in the 10–20 Hz band,
followed by a power increase after hand movement-offset
on the more posterior electrode (FC23). In addition, there
was also a significant power increase of close to 100% in the
80–90 Hz band. Tongue protrusion was accompanied by a
weak power decrease in the 10–20 Hz band and no
augmentation of gamma power on electrode FC23.
The more anterior electrode (FC22) showed similarly a
significant power decrease/increase in the 10–20 Hz band
but no significant power increase in the gamma band during
hand movement (upper left diagrams in Fig. 5). Tongue
protrusion, however, resulted on this electrode in a
significant power increase in the gamma band embedded
in a power decrease in the 10–20 Hz band.
Summarized results focused on the occurrence of ERD
and ERS in the 4 subjects are depicted in Table 2. Out of the
96 investigated electrodes, 34 showed a beta ERD
(significant power decrease of .50%) and 20 electrodes
showed a gamma ERS (significant power increase of
.100%). A post-movement beta rebound (beta ERS) was
only present on 17 electrodes. This means that the most
frequent decline found was movement-related beta
desynchronization.
The locations corresponding to the electrodes displaying
significant ERD/ERS patterns as indicated in Table 2 are
summarized in Table 3. It has to be mentioned again that the
position of the electrodes were selected exclusively as part
of subject’s epilepsy surgery evaluation and no consider-
ation was made for research purposes. Nevertheless, the
post-central- and parietal dominance of the gamma response
is evident in the data reported.
4. Discussion
The spread of ERD and/or ERS over closely spaced
subdural electrodes mounted in a grid (strip) can be used to
estimate the size of the source of synchronized activity. As
indicated in Table 2, in different subjects, 5–11 electrodes
in close proximity contributed to the beta ERD. This may be
interpreted as evidence that the spatial extent of the source
of the desynchronized beta activity appeared in the range of
at least some square centimeters, whereas, the source of
synchronized gamma activity (3–7 electrodes, see Table 2)
was evidently smaller. The gamma activity is expected to
originate from a much smaller area, since such relatively
high frequency components are associated with small
amplitudes (Singer, 1993). The further argument for a
relatively small source of gamma activity is that an
intermediate-range synchrony of 1–3 cm can be expected
in the case of subdural recordings (Nunez, 1995). So for
example, Bullock et al. (1995) measured the subdural
human coherence with 2 mm diameter electrodes and found
that the coherence falls to zero at electrode separations
greater than about 2 cm.
It should explicitly be noted that the percentage gamma
power increase has to be interpreted cautiously. The time–
frequency maps and the time courses represent percentage
changes of band power. The percentage changes are referred
to the total trial length and, therefore, always depend on the
level of corresponding oscillatory activity in the ongoing
ECoG (Pfurtscheller and Lopes da Silva, 1999b). If the level
of gamma activity in each trial is low and the gamma bursts
are of short duration, a high percentage value of gamma
power is obtained.
By comparing the ERD/ERS maps of all 4 subjects,
different types of reactivity patterns during hand movement
can be detected. Subject C24 (Fig. 1) showed relatively
widespread ERD, hardly any post-movement beta ERS, and
a more focused gamma ERS. It is not clear if the diffuse
right cerebral volume loss in subject C24 could have had an
effect on the location and distribution of the ERS and ERD.
Subject C17 (Fig. 3) displayed relatively widespread beta
ERD and gamma ERS and subject C20 (Fig. 4) displayed
beta ERD, gamma ERS, and especially a prominent post-
movement beta ERS. Taking these observations together, it
can be concluded that the 3 phenomena (beta ERD, post-
movement beta ERS, and gamma ERS) do not exhibit the
Table 2
Number of ECoG electrodes displaying significant ðP , 0:01Þ ERD and/or ERS in the alpha and beta bands and significant ðP , 0:01Þ ERS in the gamma band
Subject #Electrodes on grid/strip ERD .50% (5–15 Hz) ERD .50% (20–30 Hz) ERS .100% (20–30 Hz) ERS .100% (60–90 Hz)
C17 32 2 11 5 7
C18 8 5 5 2 3
C20 36 6 7 9 7
C24 20 11 11 1 3
Sum 96 24 34 17 20
Table 3
Location of ECoG electrodes displaying significant ERD/ERS patterns as
indicated in Table 2
SMA Pre-central Post-central Parietal Sum
C17 1 2 4* 7
C18 2* 1 3
C20 1 4 2* 7
C24 1 2* 3
Sum 1 2 10 7 20
The location of the electrode with the most significant ERD/ERS is
marked by an asterisk.
G. Pfurtscheller et al. / Clinical Neurophysiology 114 (2003) 1226–12361234
same behavior, but rather display some degree of indepen-
dence. Their occurrence may depend not only on the cortical
state prior to movement and on the amount of ongoing
rhythmic components, but also on the fact that different
neuronal networks with different properties are involved in
the dynamic behavior of oscillatory activity in different
frequency bands.
Fig. 5 shows that two movement types (palmar pinch and
tongue protrusion) can be distinguished by two closely
spaced subdural electrodes especially when the gamma ERS
is included in the evaluation. This result is in agreement
with the data reported by Crone et al. (1998a,b) who used a
similar electrode montage and processing technique but a
slightly different experimental paradigm. In Crone’s studies,
the subjects were instructed to perform a sustained
voluntary muscle contraction, as objects were visually
displayed depicting the body part to be moved. Each
voluntary movement lasted 3 s, with different movements
(tongue protrusion, eye-winking, fist-clenching, or dorsi-
flexion of one foot) indicated on a monitor in a random
sequence. The subject had to first observe the pictorial
stimulus, then, decide which type of movement to initiate,
and finally, execute the sustained movement. Crone et al.
(1998b) found a broadbanded gamma augmentation of
frequency components between 60 and 100 Hz in the ECoG
data. This induced gamma activity was highly movement-
specific, whereas, the beta ERD was less movement-
specific, but somatotopically more localized than the alpha
ERD (Crone et al., 1998a).
As shown in Figs. 1 and 3, there is no clear beta ERD
difference on electrodes placed anterior and posterior to the
central sulcus. This is surprising because, there is evidence
that central beta activity is generated in the motor cortex.
Dipole source localization from magnetoencephalogram
(MEG) data revealed that the source of central beta
oscillations is in the primary motor area and that the source
of the mu rhythms is in the somatosensory area (Salmelin
and Hari, 1994). Papakostopolulos et al. (1980) presented
ECoG data that revealed beta activity over pre-central and
alpha band activity over post-central areas, with electrodes
that had a distance of 4 mm. One reason for the smeared
differences in the ERD/ERS patterns between pre- and post-
central areas observed in our ECoG data may be due to the
fact that our subjects have epilepsy and this pathophysio-
logical condition may have had an unknown effect on the
ERD/ERS patterns. However, none of the subjects except
subject C24 had cortical abnormalities under the electrodes
from which ECoG was analyzed. Our results are, however,
comparable to those from a similar study performed by
Crone et al. (1998a) in epileptic patients.
A comparison between scalp EEG and subdural ECoG
reactivity patterns related to self-paced hand/finger move-
ment revealed some interesting results. Scalp recordings
show a clear difference between lower (8–10 Hz) and upper
(10–12 Hz) frequency components, with a more focused
desynchronization pattern of the upper frequency com-
ponents close to the electrodes overlaying the contralateral
hand representation areas (Pfurtscheller and Berghold,
1989; Toro et al., 1994; Pfurtscheller et al., 2000). In
contrast to this, no significant difference between lower and
upper alpha band was observed in our ECoG data. This is
also consistent with the findings in ECoG of Arroyo et al.
(1993), Torro et al. (1994), and Crone et al. (1998a).
Both scalp EEG and subdural ECoG recordings show a
similar spread of the movement-related alpha (mu) ERD to
the parietal lobe. The involvement of the posterior parietal
cortex (PPC) in the generation of mu ERD was for the first
time discussed by Babiloni et al. (1999). Such a parietal
alpha band ERD was present in all investigated subjects (see
Figs. 1, 3, and 4). Also, Crone et al. (1998a) observed an
alpha ERD over the inferior parietal lobe during movements
of all investigated body parts. In addition to the parietal
ERD, we found also a gamma ERS on subdural electrodes
placed over the parietal cortex. In the traditional view, the
PPC is a sensory ‘association’ area, but more recently, it was
reported (Andersen and Buneo, 2002) that broadbanded
gamma oscillations in the local field potentials are found in
PPC during planning of a movement. This implies that
neurons in the PPC are also involved in sensory–motor
transformation and the observed alpha band ERD and
induced gamma oscillations may reflect a part of this
transformation process.
The involvement of the SMA in the preparation of
movement is well documented by functional magnetic
resonance imaging (fMRI) studies (for example, Wildgruber
et al., 1997; Ball et al., 1999). A quite recent finding,
however, is that the dynamics of oscillatory activity in the
beta band originating in the SMA is modified by self-paced
finger movement. Exemplarily, Ohara et al. (2000) observed
a beta ERD in the 18–22 Hz frequency band on ECoG
electrodes in the SMA starting 3.4 ^ 0.5 s (mean ^ SD)
prior to movement-onset. This beta ERD was followed by a
fast recovery and weak beta ERS. In contrast to Ohara’s
data, we observed a beta ERD followed by a broadbanded,
large amplitude beta ERS in ECoG recordings from the
SMA and, what is novel, a short-lasting gamma ERS.
Recently, Pfurtscheller et al. (2003) reported about move-
ment-related beta bursts with frequencies around 26 Hz on
midcentrally placed EEG electrodes overlaying the SMA.
Bursts of movement-related gamma oscillations around
40 Hz were observed in EEG (DeFrance and Sheer, 1988;
Pfurtscheller et al., 1993) and MEG (Salenius et al., 1996).
In all of our subjects, we found broadband gamma
oscillations in a frequency range from 60 to 90 Hz, similar
to those as observed by Crone et al. (1998b) and Arroyo et al.
(1993) in ECoG. The latter reported a movement-related
less prominent relative power increase in the 40–100 Hz
band, while the former reported highly movement-specific
60–100 Hz gamma oscillations. The most interesting result
is that gamma activity in ECoG is broadbanded and covers a
frequency range reaching from about 60 to 90 Hz. A
possible explanation for this observation may be that each
G. Pfurtscheller et al. / Clinical Neurophysiology 114 (2003) 1226–1236 1235
subdural electrode represents the spatial average over a
greater number of cortical modules and neuronal assem-
blies, respectively, while each module may oscillate in a
slightly different frequency band within the 60–90 Hz
range. An alternative explanation is that gamma activity
shows a dynamic oscillatory behavior with varying
frequencies and/or phases. Further research, however,
needs to be devoted to this topic. The observed dominant
60–90 Hz ERS during movement execution may originate
in neuronal assemblies that are involved in active cortical
control of movements in motor and parietal areas. There-
fore, these oscillations may represent ‘binding’ phenomena
in the motor system, adjusting the activity of different
muscle groups according to the movement requirements.
Acknowledgements
This study was supported by the Austrian Fonds zur
Foerderung der wissenschaftlichen Forschung (project
P14831PSY), the National Institute of Health, Bethesda,
Maryland, grant NS 4068108, and the National Institute of
Health (NIH) Bioengineering Research Partnership 1-RO1-
NS40681-01. We thank Mr G. Krausz for producing the
figures.
References
Andersen RA, Buneo CA. Intentional maps in posterior parietal cortex.
Annu Rev Neurosci 2002;25:189–220.
Arroyo S, Lesser RP, Gordon B, Uematsu S, Jackson D, Webber R.
Functional significance of the mu rhythms of human cortex: an
electrophysiologic study with subdural electrodes. Electroenceph clin
Neurophysiol 1993;87:76–87.
Babiloni C, Carducci F, Cincotti F, Rossini PM, Neuper C, Pfurtscheller G,
Babiloni G. Human cortical responses to voluntary finger movements.
Mean movement-related potentials vs. desynchronization of EEG mu
rhythm. Neuroimage 1999;10(6):658–65.
Ball T, Schreiber A, Feige B, Wagner M, Lucking CH, Kristeva-Feige R.
The role of higher-order motor areas in voluntary movement as revealed
by high-resolution EEG and fMRI. Neuroimage 1999;10:682–94.
Bullock TH, McClurne MC, Achimowicz JZ, Iraguri-Madoz VJ, Duckrow
RB, Spencer SS. Temporal fluctuations in coherence of brain waves.
Proc Natl Acad Sci USA 1995;92:11568–72.
Cooper R, Winter AL, Crow HL, Walter WG. Comparison of subcortical,
cortical and scalp activity using electronically indwelling electrodes in
man. Electroenceph clin Neurophysiol 1965;18:217–28.
Crone NE, Miglioretti DL, Gordon B, Sieracki JM, Wilson WT, Uematsu S,
Lesser RP. Functional mapping of human sensorimotor cortex with
electrocorticographic spectral analysis: I Alpha and beta event-related
desynchronization. Brain 1998a;121:2271–99.
Crone NE, Miglioretti DL, Gordon B, Lesser RP. Functional mapping
of human sensorimotor cortex with electrocorticographic spectral
analysis: II. Event-related synchronization in the gamma band. Brain
1998b;121:2301–15.
DeFrance J, Sheer DE. Focused arousal, 40-Hz EEG, and motor
programming. In: Giannitrapani D, Murri L, editors. The EEG of
mental activities. Basel: Karger; 1988. p. 153–68.
Graimann B, Huggins JE, Levine SP, Pfurtscheller G. Visualization of
significant ERD/ERS patterns in multichannel EEG and ECoG data.
Clin Neurophysiol 2002;113:43–7.
Levine SP, Huggins JE, BeMent SL, Kushwaha RK, Schuh LA, Rohde
MM, Passaro EA, Ross DA, Elisevich KV, Smith BJ. A direct brain
interface based on event-related potentials. IEEE Trans Rehabil Eng
2000;8(2):180–5.
Nunez PL. Neocortical dynamics and human EEG rhythms. New York,
NY: Oxford University Press; 1995.
Ohara S, Ikeda A, Kunieda T, Yazawa S, Baba K, Nagamine T, Taki W,
Hashimoto N, Mihara T, Shibasaki H. Movement-related change of
electrocorticographic activity in human supplementary motor area
proper. Brain 2000;123:1203–15.
Papakostopolulos D, Crown HJ, Newton P. Spatiotemporal characteristics
for intrinsic evoked and event related potentials in the human cortex. In:
Pfurtscheller G, Buser P, Lopes da Silva FH, Petsche H, editors.
Rhythmic EEG activities and cortical functioning. Amsterdam: Else-
vier/North-Holland Biomedical; 1980. p. 179–200.
Pfurtscheller G, Berghold A. Patterns of cortical activation during
planning of voluntary movement. Electroencheph clin Neurophysiol
1989;72:250–8.
Pfurtscheller G, Lopes da Silva FH. Event-related desynchronization.
Handbook of electroencephalography and clinical neurophysiology,
Vol. 6. Amsterdam: Elsevier; 1999a. (revised edition).
Pfurtscheller G, Lopes da Silva FH. Event-related EEG/MEG synchroniza-
tion and desynchronization: basic principles. Clin Neurophysiol 1999b;
110:1842–57.
Pfurtscheller G, Neuper C, Kalcher J. 40-Hz oscillation during motor
behavior in man. Neurosci Lett 1993;164:179–82.
Pfurtscheller G, Neuper C, Krausz G. Functional dissociation of lower and
upper frequency mu rhythms in relation to voluntary limb movement.
Clin Neurophysiol 2000;111:1873–9.
Pfurtscheller G, Woertz M, Supp G, Lopes da Silva FH. Early onset of post-
movement beta synchronization in the supplementary motor area
(SMA) during self-paced finger movement in man. Neurosci Lett 2003;
(in press).
Salmelin R, Hari R. Spatiotemporal characteristics of sensorimotor
neuromagnetic rhythms related to thumb movment. Neuroscience
1994;60(2):537–50.
Salenius S, Salmelin R, Neuper C, Pfurtscheller G, Hari R. Human cortical
40 Hz rhythm is closely related to EMG rhythmicity. Neurosci Lett
1996;213:75–8.
Sheer DE, Grandstaff NW, Benignus VA. Behavior and 40-c sec, electrical
activity in the brain. Psychol Rep 1966;19:1333–4.
Singer W. Synchronization of cortical activity and its putative role in
information processing and learning. Annu Rev Physiol 1993;55:
349–74.
Toro C, Deuschl G, Thatcher R, Sato S, Kufta C, Hallett M. Event-related
desynchronization and movement-related cortical potentials on the
ECoG and EEG. Electroenceph clin Neurophysiol 1994;93:380–9.
Wildgruber D, Erb M, Klose U, Grodd W. Sequential activation of
supplementary motor area and primary motor cortex during self-paced
finger movement in human evaluated by functional MRI. Neurosci Lett
1997;227:161–4.
G. Pfurtscheller et al. / Clinical Neurophysiology 114 (2003) 1226–12361236
Related Documents