Nature Methods Spatiotemporal control of gene expression by a light-switchable transgene system Xue Wang, Xianjun Chen & Yi Yang Supplementary Figure 1 Absorption spectrum of purified Gal4(65)-VVD Supplementary Figure 2 Schematic representation of LightON system components. Supplementary Figure 3 Comparison of induction levels of Fluc reporters driven by GAVV and the conventional CMV driven vectors. Supplementary Figure 4 Light induced expression of fluorescent proteins in HEK293 cells. Supplementary Figure 5 RT-PCR analysis of Fluc transcription. Supplementary Figure 6 Effect of duration of illumination on Gluc reporter expression. Supplementary Figure 7 Semilogorithmic plot of cellular Gluc mRNA dynamics. Supplementary Figure 8 Expression kinetics of the Gluc reporter in cell culture medium. Supplementary Figure 9 Quantitative control of gene expression in mammalian cells by modulating the light irradiance Supplementary Figure 10 Effect of light irradiance on Gluc expression induced by a single blue light pulse Supplementary Figure 11 Printing an image on a single layer of cultured cells by light induction of mCherry expression. Supplementary Figure 12 Spatial control of mCherry transgene expression in mice liver Supplementary Figure 13 LED arrays and laser devices used for light-switchable transgene expression Supplementary Figure 14 Full-length gels of Fig. 1b Supplementary Figure 15 Full-length blots of Fig. 1e Supplementary Table 1 Comparison of light-inducible gene expression methodologies. Supplementary Table 2 Primers for RNA analysis Supplementary Note Sequence information. Nature Methods: doi:10.1038/nmeth.1892

Welcome message from author
This document is posted to help you gain knowledge. Please leave a comment to let me know what you think about it! Share it to your friends and learn new things together.
Transcript

Nature Methods
Spatiotemporal control of gene expression by a light-switchable
transgene system
Xue Wang, Xianjun Chen & Yi Yang
Supplementary Figure 1 Absorption spectrum of purified Gal4(65)-VVD Supplementary Figure 2 Schematic representation of LightON system components. Supplementary Figure 3 Comparison of induction levels of Fluc reporters driven
by GAVV and the conventional CMV driven vectors. Supplementary Figure 4 Light induced expression of fluorescent proteins in
HEK293 cells. Supplementary Figure 5 RT-PCR analysis of Fluc transcription. Supplementary Figure 6 Effect of duration of illumination on Gluc reporter
expression. Supplementary Figure 7 Semilogorithmic plot of cellular Gluc mRNA dynamics. Supplementary Figure 8 Expression kinetics of the Gluc reporter in cell culture
medium. Supplementary Figure 9 Quantitative control of gene expression in mammalian
cells by modulating the light irradiance Supplementary Figure 10 Effect of light irradiance on Gluc expression induced by a
single blue light pulse Supplementary Figure 11 Printing an image on a single layer of cultured cells by
light induction of mCherry expression. Supplementary Figure 12 Spatial control of mCherry transgene expression in mice
liver Supplementary Figure 13 LED arrays and laser devices used for light-switchable
transgene expression Supplementary Figure 14 Full-length gels of Fig. 1b Supplementary Figure 15 Full-length blots of Fig. 1e Supplementary Table 1 Comparison of light-inducible gene expression
methodologies. Supplementary Table 2 Primers for RNA analysis Supplementary Note Sequence information.
Nature Methods: doi:10.1038/nmeth.1892

Supplementary Figure 1
Absorption spectrum of purified Gal4(65)-VVD.
Absorption spectrum of Gal4(65)-VVD under dark (black line) or light activated
states (red line) was acquired in increments of 5 nm from 300 nm to 700 nm.
Nature Methods: doi:10.1038/nmeth.1892

Supplementary Figure 2
Schematic representation of LightON system components.
The light-inducible transactivators consist of the Gal4 DNA binding domain, the VVD
light sensor and a transactivation domain. These synthetic proteins were constitutively
expressed using the CMV promoter. The expression of the gene of interest is
controlled by a Gal4-responsive promoter assembled by placing a 5× UASG element
adjacent to a TATA box.
Nature Methods: doi:10.1038/nmeth.1892

Supplementary Figure 3
Comparison of induction levels of Fluc reporters driven by GAVV and the
conventional CMV driven vectors.
The genetically encoded light-responsive transactivator GAVV consists of the Gal4
DNA binding domain, the VVD light sensor and VP16 transactivation domain.
Experimental conditions were as described for Fig. 1c. The data were normalized to
the Fluc expression level of the pcDNA3.1-Fluc vector under dark condition. Error
bars, mean s.e.m. (n = 4) from the same experiment.
Nature Methods: doi:10.1038/nmeth.1892
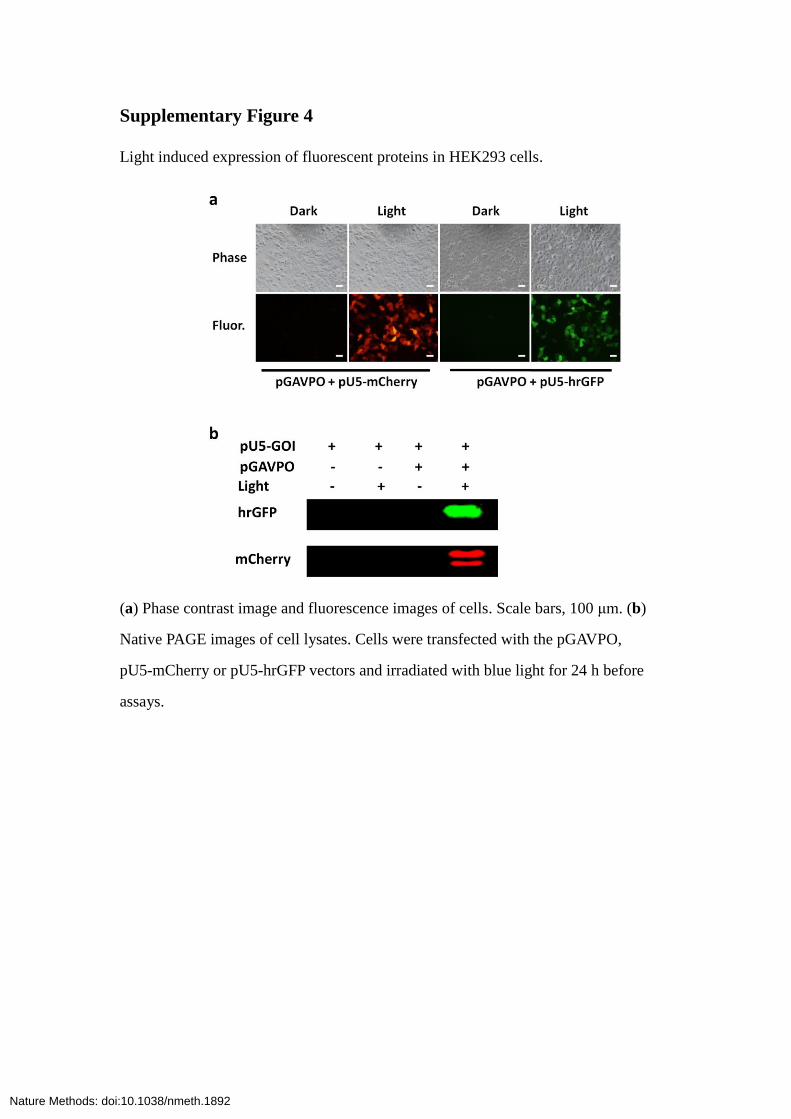
Supplementary Figure 4
Light induced expression of fluorescent proteins in HEK293 cells.
(a) Phase contrast image and fluorescence images of cells. Scale bars, 100 μm. (b)
Native PAGE images of cell lysates. Cells were transfected with the pGAVPO,
pU5-mCherry or pU5-hrGFP vectors and irradiated with blue light for 24 h before
assays.
Nature Methods: doi:10.1038/nmeth.1892

Supplementary Figure 5
RT-PCR analysis of Fluc transcription.
HEK293 cells were transiently transfected with the indicated vectors. Experimental
conditions were as described for Fig . 1c.
Nature Methods: doi:10.1038/nmeth.1892

Supplementary Figure 6
Effect of duration of illumination on Gluc reporter expression.
HEK293 cells were transiently transfected with the pGAVPO and pU5-Gluc vectors.
Ten hours after transfection, cells were illuminated by different duration of 0.84
W·m-2
blue light. (a) Gluc expression profiles measured at different time point. (b)
Effect of illumination periods of time on Gluc expression measured at 30 h after
initial illumination. (c) Effect of illumination periods of time on Gluc expression
(expressed as fold of induction comparing to dark samples) measured at 10 h after
initial illumination. Error bars, mean s.e.m. (n = 4) from the same experiment.
Nature Methods: doi:10.1038/nmeth.1892

Supplementary Figure 7
Semilogorithmic plot of cellular Gluc mRNA dynamics.
Data re-plotted from Fig. 2a. By fitting the data, rate constants of the biphasic time
course was determined to be 0.50 ± 0.07 h-1
and 0.10 ± 0.01 h-1
for the fast phase and
slow phase, respectively. Solid circle, experimental data; dashed line, fitting of the
slow phase; blank triangle, fitting of the slow phase subtracted by experimental data.
Error bars, mean s.e.m. (n = 4) from the same experiment .
Nature Methods: doi:10.1038/nmeth.1892

Supplementary Figure 8
Expression kinetics of the Gluc reporter in cell culture medium.
HEK293 cells were transiently transfected with the pGAVPO vector and pU5-Gluc (a)
or pU5-Gluc-ARE (b) vectors. pU5-Gluc-ARE vector encoded a destabilized mRNA.
Ten hours after transfection, cells were illuminated by 0.84 W·m-2
blue light or blue
light for 2 h and then dark conditions. Experimental conditions were as described for
Fig. 2a. Gluc activity were measured at indicated time point after illumination. Error
bars, mean s.e.m. (n = 4) from the same experiment .
Nature Methods: doi:10.1038/nmeth.1892

Supplementary Figure 9
Quantitative control of gene expression in mammalian cells by modulating the light
irradiance.
Fluc expression in pGAVPO and pU5-Fluc transfected HEK293 cells under different
light irradiances. Experimental conditions were as described in Fig. 3. Error bars,
mean s.e.m. (n = 4) from the same experiment .
Nature Methods: doi:10.1038/nmeth.1892

Supplementary Figure 10
Effect of light irradiance on Gluc expression induced by a single blue light pulse.
Ten hours after transfection of Gluc reporter and GAVPO vectors, HEK293 cells were
illuminated by blue light of different irradiances adjusted by neutral density filters for
a single 10 s pulse, then kept in the darkness for 4 h before measurements. Error bars,
mean s.e.m. (n = 4) from the same experiment .
Nature Methods: doi:10.1038/nmeth.1892
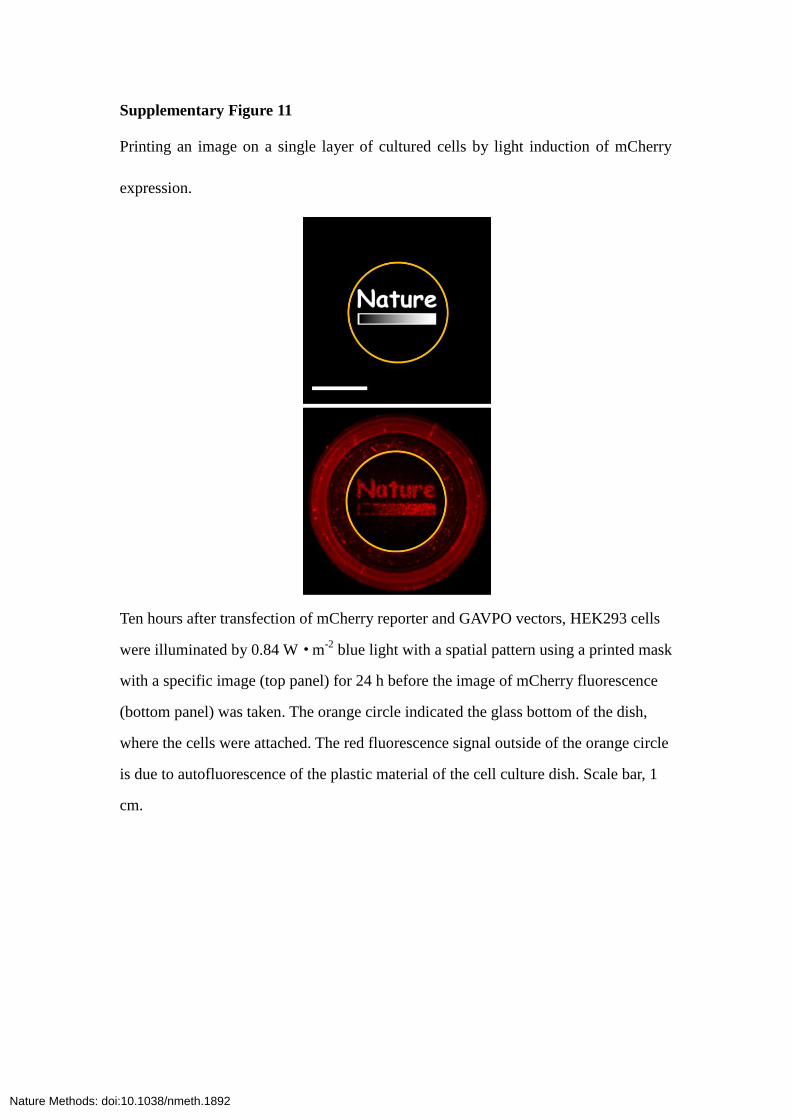
Supplementary Figure 11
Printing an image on a single layer of cultured cells by light induction of mCherry
expression.
Ten hours after transfection of mCherry reporter and GAVPO vectors, HEK293 cells
were illuminated by 0.84 W·m-2
blue light with a spatial pattern using a printed mask
with a specific image (top panel) for 24 h before the image of mCherry fluorescence
(bottom panel) was taken. The orange circle indicated the glass bottom of the dish,
where the cells were attached. The red fluorescence signal outside of the orange circle
is due to autofluorescence of the plastic material of the cell culture dish. Scale bar, 1
cm.
Nature Methods: doi:10.1038/nmeth.1892
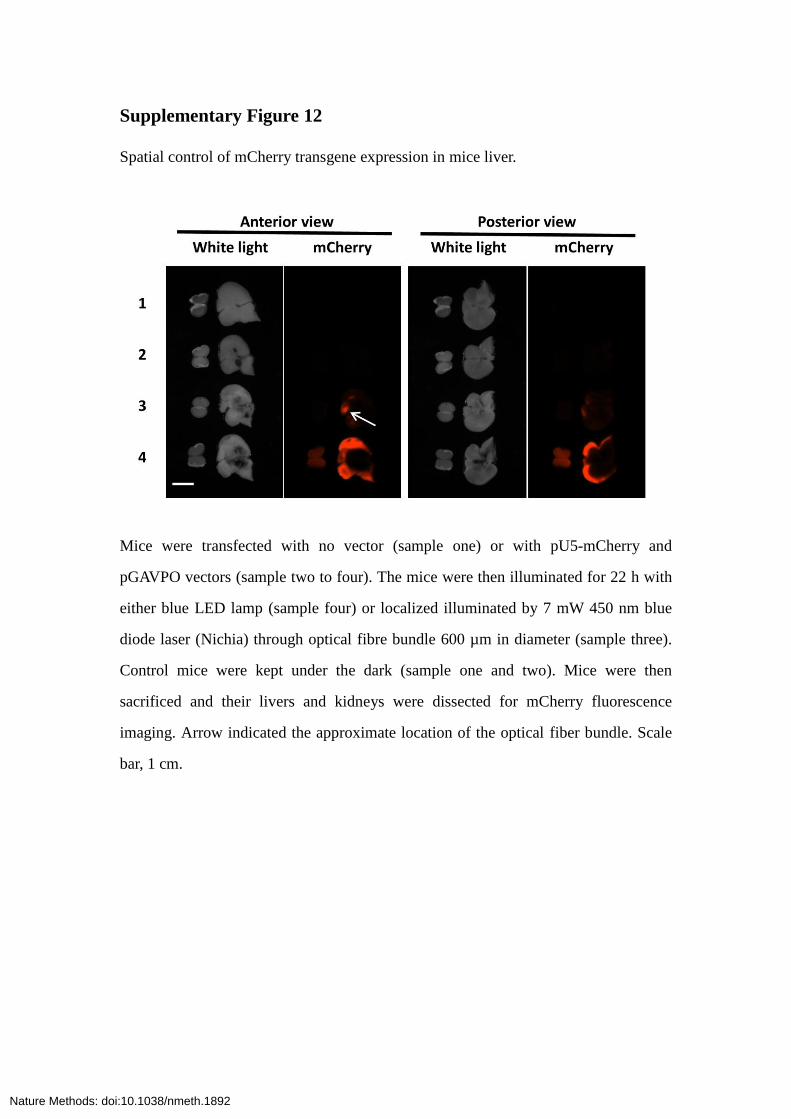
Supplementary Figure 12
Spatial control of mCherry transgene expression in mice liver.
Mice were transfected with no vector (sample one) or with pU5-mCherry and
pGAVPO vectors (sample two to four). The mice were then illuminated for 22 h with
either blue LED lamp (sample four) or localized illuminated by 7 mW 450 nm blue
diode laser (Nichia) through optical fibre bundle 600 µm in diameter (sample three).
Control mice were kept under the dark (sample one and two). Mice were then
sacrificed and their livers and kidneys were dissected for mCherry fluorescence
imaging. Arrow indicated the approximate location of the optical fiber bundle. Scale
bar, 1 cm.
Nature Methods: doi:10.1038/nmeth.1892

Supplementary Figure 13
LED arrays and laser devices used for light-switchable transgene expression.
(a) Timer controlled LED arrays for monolayer cultures. (b) Timer controlled LED
arrays for mice. (c) Laser coupled optically fibre bundle for localized illumination of
mice. The head of the optical fibre bundle was fixed onto mice using glue.
Nature Methods: doi:10.1038/nmeth.1892

Supplementary Figure 14
Full-length gels of Fig. 1b
Nature Methods: doi:10.1038/nmeth.1892

Supplementary Figure 15
Full-length blots of Fig. 1e
Nature Methods: doi:10.1038/nmeth.1892

Supplementary Table 1
Comparison of light-inducible gene expression methodologies. LightON Caged Gal43,4 Caged
doxycycline5 Infrared
laser-mediated
expression6
PhyB-GBD/PIF3-GAD7
Gal4-GI and FKF1-VP169
GBD-CRY2/CIB1-GAD10
Synthetic optogenetic transcription
device11 Cell culture Mammalian N.D. Mammalian N.A. Yeast Mammalian Yeast Mammalian
In vivo study Mice via transgene
Drosophila, Xenopus, and
Zebrafish embryos
Mouse embryos and
Xenopus laevis
tadpoles
Caenorhabditis elegans
N.A. N.D. N.A. Mice implanted
with heterogonou
s cells Genetically
encoded light sensor
VVD None None None PhyB FKF1 CRY2 Melanopsin
Exogenous chemical None Caged Gal4 Caged
doxycycline None Phycocyanobilin None None None
Exogenous proteins required
One One One None Two Two Two One
Reversibility Reversible Irreversible Irreversible Reversible Reversible Reversible Reversible Reversible Gene
Activation efficiency
compared to common promoter
Similar to CMV in
tested cell lines
N.D. N.D. N.D. 17% of Native Gal4 protein N.D. 10% of Native
Gal4 protein N.D.
Type of light Blue UV UV Infrared Red and Far-red Blue Blue Blue
Single-light-pulse
Inducible gene
expression
Yes Yes Yes Yes Yes No No N.D.
Average light irradiance
used for gene activationa
0.04 W m-2 for 10-fold
gene activation
2.5 W m-2 for less 5-fold
gene activation#
70 W m-2 for less than
10-fold gene activation#
0.22 W m-2 for about
10-fold gene activation#
Interfere with
intracellular signaling
Minimal Substantial Substantial Minimal Minimal Minimal
Substantial
Maximum On/Off ratio
tested
> 200-fold in HEK293 cell
line N.D. >1,000-fold in
yeast
5-fold in HEK293 T cell
line
<10-fold in yeast
20-fold in HEK293 cell
line Rate of
activation Rapid Rapid Rapid Rapid Rapid Rapid Slow
Other
Activity of GAVPO
protein can be fine tuned and further improved
Require single-
cell/embryo injection
Require sophiscated instruments to avoid side
effects
Hard to be
further improved
N.A. Not applicable.
N.D. Not determined or not available.
aAverage light irradiance used for gene activation estimated from Fig. 3f9, Fig. 1b10, and Fig. 2a11.
When cells were illuminated with blue light pulse, the irradiance values were averaged by the
whole experimental period.
Nature Methods: doi:10.1038/nmeth.1892

Supplementary Table 2
Primers for RNA analysis
Primer name Sequence
Fluc forward GAGATACGCCCTGGTTCCTG
Fluc reverse CGAAATGCCCATACTGTTGAG
Gluc forward GCCAATGCCCGGAAAGCT
Gluc reverse ACCCAGGAATCTCAGGAATGTCG
Actin forward CATGTACGTTGCTATCCAGGC
Actin reverse CTCCTTAATGTCACGCACGAT
Nature Methods: doi:10.1038/nmeth.1892
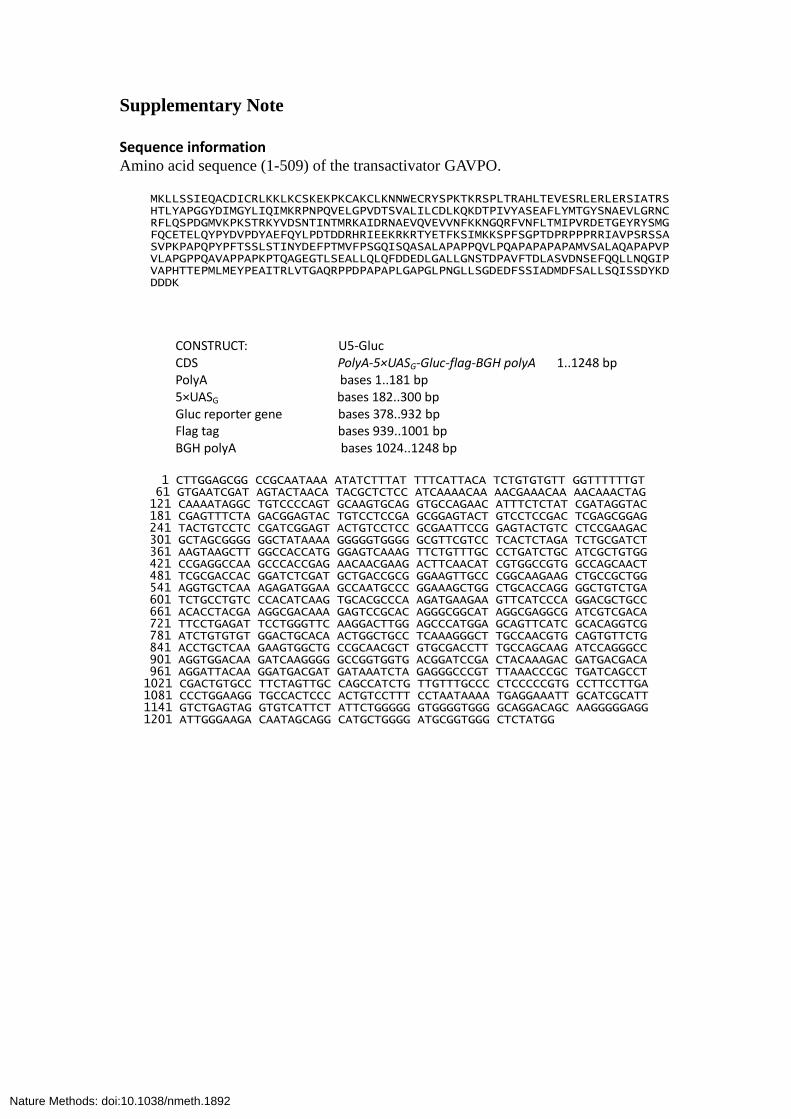
Supplementary Note
Sequence information Amino acid sequence (1-509) of the transactivator GAVPO.
MKLLSSIEQACDICRLKKLKCSKEKPKCAKCLKNNWECRYSPKTKRSPLTRAHLTEVESRLERLERSIATRSHTLYAPGGYDIMGYLIQIMKRPNPQVELGPVDTSVALILCDLKQKDTPIVYASEAFLYMTGYSNAEVLGRNCRFLQSPDGMVKPKSTRKYVDSNTINTMRKAIDRNAEVQVEVVNFKKNGQRFVNFLTMIPVRDETGEYRYSMGFQCETELQYPYDVPDYAEFQYLPDTDDRHRIEEKRKRTYETFKSIMKKSPFSGPTDPRPPPRRIAVPSRSSASVPKPAPQPYPFTSSLSTINYDEFPTMVFPSGQISQASALAPAPPQVLPQAPAPAPAPAMVSALAQAPAPVPVLAPGPPQAVAPPAPKPTQAGEGTLSEALLQLQFDDEDLGALLGNSTDPAVFTDLASVDNSEFQQLLNQGIPVAPHTTEPMLMEYPEAITRLVTGAQRPPDPAPAPLGAPGLPNGLLSGDEDFSSIADMDFSALLSQISSDYKDDDDK
CONSTRUCT: U5-Gluc CDS PolyA-5×UASG-Gluc-flag-BGH polyA 1..1248 bp PolyA bases 1..181 bp 5×UASG bases 182..300 bp Gluc reporter gene bases 378..932 bp Flag tag bases 939..1001 bp BGH polyA bases 1024..1248 bp
1 CTTGGAGCGG CCGCAATAAA ATATCTTTAT TTTCATTACA TCTGTGTGTT GGTTTTTTGT 61 GTGAATCGAT AGTACTAACA TACGCTCTCC ATCAAAACAA AACGAAACAA AACAAACTAG 121 CAAAATAGGC TGTCCCCAGT GCAAGTGCAG GTGCCAGAAC ATTTCTCTAT CGATAGGTAC 181 CGAGTTTCTA GACGGAGTAC TGTCCTCCGA GCGGAGTACT GTCCTCCGAC TCGAGCGGAG 241 TACTGTCCTC CGATCGGAGT ACTGTCCTCC GCGAATTCCG GAGTACTGTC CTCCGAAGAC 301 GCTAGCGGGG GGCTATAAAA GGGGGTGGGG GCGTTCGTCC TCACTCTAGA TCTGCGATCT 361 AAGTAAGCTT GGCCACCATG GGAGTCAAAG TTCTGTTTGC CCTGATCTGC ATCGCTGTGG 421 CCGAGGCCAA GCCCACCGAG AACAACGAAG ACTTCAACAT CGTGGCCGTG GCCAGCAACT 481 TCGCGACCAC GGATCTCGAT GCTGACCGCG GGAAGTTGCC CGGCAAGAAG CTGCCGCTGG 541 AGGTGCTCAA AGAGATGGAA GCCAATGCCC GGAAAGCTGG CTGCACCAGG GGCTGTCTGA 601 TCTGCCTGTC CCACATCAAG TGCACGCCCA AGATGAAGAA GTTCATCCCA GGACGCTGCC 661 ACACCTACGA AGGCGACAAA GAGTCCGCAC AGGGCGGCAT AGGCGAGGCG ATCGTCGACA 721 TTCCTGAGAT TCCTGGGTTC AAGGACTTGG AGCCCATGGA GCAGTTCATC GCACAGGTCG 781 ATCTGTGTGT GGACTGCACA ACTGGCTGCC TCAAAGGGCT TGCCAACGTG CAGTGTTCTG 841 ACCTGCTCAA GAAGTGGCTG CCGCAACGCT GTGCGACCTT TGCCAGCAAG ATCCAGGGCC 901 AGGTGGACAA GATCAAGGGG GCCGGTGGTG ACGGATCCGA CTACAAAGAC GATGACGACA 961 AGGATTACAA GGATGACGAT GATAAATCTA GAGGGCCCGT TTAAACCCGC TGATCAGCCT 1021 CGACTGTGCC TTCTAGTTGC CAGCCATCTG TTGTTTGCCC CTCCCCCGTG CCTTCCTTGA 1081 CCCTGGAAGG TGCCACTCCC ACTGTCCTTT CCTAATAAAA TGAGGAAATT GCATCGCATT 1141 GTCTGAGTAG GTGTCATTCT ATTCTGGGGG GTGGGGTGGG GCAGGACAGC AAGGGGGAGG 1201 ATTGGGAAGA CAATAGCAGG CATGCTGGGG ATGCGGTGGG CTCTATGG
Nature Methods: doi:10.1038/nmeth.1892
Related Documents