Research Article Spatiotemporal Characteristics and Self-Organization of Urban Taxi Dispatch Wei Zhang and Ying Fan School of Systems Science, Beijing Normal University, Beijing 100875, China Correspondence should be addressed to Ying Fan; [email protected] Received 3 March 2020; Revised 11 July 2020; Accepted 22 July 2020; Published 11 August 2020 Academic Editor: Vincent Labatut Copyright © 2020 Wei Zhang and Ying Fan. is is an open access article distributed under the Creative Commons Attribution License, which permits unrestricted use, distribution, and reproduction in any medium, provided the original work is properly cited. is paper proposes a matching degree to study dynamic spatiotemporal characteristics of urban taxi and offers a novel under- standing of self-organization taxi dispatch in hotspots on top of the Fermi learning model. e proposed matching degree can not only reflect the overall spatiotemporal characteristics of urban taxi supply and demand but also show that the density of distribution and the distance between the taxis supply and the city center will affect the satisfaction of demand. Besides, it is interesting to note that supply always exceeds demand and they will self-organize into an equilibrium state in hotspots. To understand the phenomenon, we develop the Fermi learning model based on the prospect theory and compared the results with the popular reinforcement learning model. e results demonstrate that both models can account for self-organization behavior under different scenarios. We believe our work is crucial to explore taxis data and our indicator can provide a significant suggestion for urban taxis development. 1. Introduction Because of the flexibility and convenience, taxis become one of the most important ways to travel. In Guangzhou, taxis account for 7.7% of the transportation modes, and there are about 1,776,000 taxi trips per day [1]. In order to understand the characteristics and opera- tion of urban taxis, three general measurements of taxis supply and demand indicators—the number of ownership, full-load ratios, and mileage utilization rate—have been widely used [2–4]. e number of ownership is an indicator defined from the quantitative point of view. e full-load ratios are to measure the use of taxis in a certain area by sampling. Mileage utilization refers to the ratio of pas- senger mileage to total mileage during operation time. ese indicators can only reflect the urban taxis operations in a macroscope. More works addressing data distribution characteristics of taxi trips have been done. e traveling displacements of urban taxis were found to follow an exponential distribution [5] while the traveling duration and interevent time dis- tributions can be approximated by log-normal distributions [6]. Christoforou et al. find that user’s residence area which has high population density is related to longer journey durations and off-peak and nighttime traveling last longer than others [7]. However, those distribution characteristics can only present the static feature. anks to the development of information technology, a number of companies established taxi services on top of the mobile network, such as Didi, Uber, and Lyft. ere are three advantages using these services. (a) Realizing the informa- tion exchange between passengers and taxi drivers, reducing the mutual search cost between passengers and drivers: the drivers do not need roaming around the city vacantly, and the passengers can also enjoy instant services [8]. (b) Saving fuel costs and reducing environmental pollution: informa- tion exchange allows drivers to spend less time looking for passengers and saving fuel [9, 10]. (c) Relieving the heavy traffic flow: taxi can be allocated reasonably in a limited space according to passenger needs [11, 12]. e emerging taxi Global Positioning System (GPS) trip datasets of origin and destination of passengers and drivers provide the op- portunity to extract spatiotemporal characteristics for a particular region [13]. Hindawi Complexity Volume 2020, Article ID 3659315, 11 pages https://doi.org/10.1155/2020/3659315

Welcome message from author
This document is posted to help you gain knowledge. Please leave a comment to let me know what you think about it! Share it to your friends and learn new things together.
Transcript
Research ArticleSpatiotemporal Characteristics and Self-Organization of UrbanTaxi Dispatch
Wei Zhang and Ying Fan
School of Systems Science Beijing Normal University Beijing 100875 China
Correspondence should be addressed to Ying Fan yfanbnueducn
Received 3 March 2020 Revised 11 July 2020 Accepted 22 July 2020 Published 11 August 2020
Academic Editor Vincent Labatut
Copyright copy 2020 Wei Zhang and Ying Fan is is an open access article distributed under the Creative Commons AttributionLicense which permits unrestricted use distribution and reproduction in any medium provided the original work isproperly cited
is paper proposes a matching degree to study dynamic spatiotemporal characteristics of urban taxi and offers a novel under-standing of self-organization taxi dispatch in hotspots on top of the Fermi learning model e proposed matching degree can notonly reflect the overall spatiotemporal characteristics of urban taxi supply and demand but also show that the density of distributionand the distance between the taxis supply and the city center will affect the satisfaction of demand Besides it is interesting to note thatsupply always exceeds demand and they will self-organize into an equilibrium state in hotspots To understand the phenomenon wedevelop the Fermi learning model based on the prospect theory and compared the results with the popular reinforcement learningmodel e results demonstrate that both models can account for self-organization behavior under different scenarios We believeour work is crucial to explore taxis data and our indicator can provide a significant suggestion for urban taxis development
1 Introduction
Because of the flexibility and convenience taxis become oneof the most important ways to travel In Guangzhou taxisaccount for 77 of the transportation modes and there areabout 1776000 taxi trips per day [1]
In order to understand the characteristics and opera-tion of urban taxis three general measurements of taxissupply and demand indicatorsmdashthe number of ownershipfull-load ratios and mileage utilization ratemdashhave beenwidely used [2ndash4]e number of ownership is an indicatordefined from the quantitative point of view e full-loadratios are to measure the use of taxis in a certain area bysampling Mileage utilization refers to the ratio of pas-senger mileage to total mileage during operation timeese indicators can only reflect the urban taxis operationsin a macroscope
More works addressing data distribution characteristicsof taxi trips have been done e traveling displacements ofurban taxis were found to follow an exponential distribution[5] while the traveling duration and interevent time dis-tributions can be approximated by log-normal distributions
[6] Christoforou et al find that userrsquos residence area whichhas high population density is related to longer journeydurations and off-peak and nighttime traveling last longerthan others [7] However those distribution characteristicscan only present the static feature
anks to the development of information technology anumber of companies established taxi services on top of themobile network such as Didi Uber and Lyftere are threeadvantages using these services (a) Realizing the informa-tion exchange between passengers and taxi drivers reducingthe mutual search cost between passengers and drivers thedrivers do not need roaming around the city vacantly andthe passengers can also enjoy instant services [8] (b) Savingfuel costs and reducing environmental pollution informa-tion exchange allows drivers to spend less time looking forpassengers and saving fuel [9 10] (c) Relieving the heavytraffic flow taxi can be allocated reasonably in a limitedspace according to passenger needs [11 12] e emergingtaxi Global Positioning System (GPS) trip datasets of originand destination of passengers and drivers provide the op-portunity to extract spatiotemporal characteristics for aparticular region [13]
HindawiComplexityVolume 2020 Article ID 3659315 11 pageshttpsdoiorg10115520203659315
e indicators and researches mentioned above are allstatic ey cannot reflect the dynamic characteristics oftaxis supply and demand especially after the intelligentdynamically dispatching systems by these taxis platformsus we need a dynamic indicator based on origin anddestination GPS data to measure the characteristics of taxissupply and demand in the urban area
erefore we proposed a matching degree using bi-partite networks [14 15] based dynamic allocation model tomeasure the characteristics of taxis supply and demand inthe urban area Based on the Hungarian method [16ndash18] weestablished the best match between taxis supply and demandunder the conditions of meeting the minimum cost at isto say the matching degree is constructed on the assumptionof the passengers waiting for the least time because taxismove more quickly and are more flexible than passengersWe then explore the spatiotemporal characteristics of supplyand demand through data
One of the main approaches to address both charac-teristics and taxi dispatch problems is agent-based model-ling where passengers and drivers are modeled asautonomous agents that are able to interact in a dynamicenvironment A multiple trip negotiation model is intro-duced in [19] where flexible activity scheduling is consid-ered between a small group of agents Flexible trip departuretimes are also studied in theory and experiment [20 21] emultiagent model is also introduced in taxi-sharing [22]considering driversrsquo multiple preferences and taxi dispatch[23] with reduction in customer waiting and empty taxicruising times Although some different aspects of taximultiagent dispatching are studied in these approachesnone of them consider dynamic characteristics and multipleoften-conflicting interest for passenger and driver agents
We propose a new multiagent model that models bothpassengers and drivers as autonomous agents and conductmultiagents simulations on top of reinforcement learningmodel [21 24 25] and prospect theory [26ndash30] based Fermilearning model [21 31]
e remainder of this paper is organized as follows InSection 2 we first review the basic knowledge of our bipartitenetworks based dynamic allocation model such as the bi-partite networks and Hungarian method en we im-proved the method to be better applied to our model andproposed matching degree In Section 3 we analyze thespatiotemporal characteristics through actual data from fourcities In Section 4 by the analysis of data we find that taxidemand and supply in hotspots will form a balanced systemjust like a kind of double-role-like EI Farol Bar game Tobetter explain the phenomenon we propose a multiagentmodel which models both passengers and drivers as au-tonomous agents and conducts simulations based on rein-forcement learningmodel and a novel Fermi learningmodelIn the last section we present our conclusion and discussion
2 Establish the Matching Degree
Table 1 shows the commonly used taxi operation indicatorsthe possession quantity of taxis per ten thousand persons c
and mileage utilization rate ϕ Beijing is the capital of China
with a large population Shanghai and Guangzhou aremodern cities Xirsquoan is an old city in central China ey arelying in the north east south and central part of Chinarespectively us we choose these four cities as repre-sentative examples in our paper
According to the data the possession quantity of taxisin Beijing and Shanghai are higher than those in Xirsquoan andGuangzhou while the mileage utilization rates are theopposite ese traditional indicators give a big picture ofurban taxi operation status in the four cities in ChinaHowever if people want to know the satisfaction of urbantaxi demand spatially and temporally a more specificindicator is needed us in this section we will utilize theclassical binary matching methodmdashHungarian algorithmto build the matching model e obtained optimalmatching degree can be seen as an indicator to measurespatiotemporal characteristics of urban taxi supply anddemand
In this section the methods to acquire a matchingdegree will be elaborated Since the time window of thedata that we are going to use is hourly it was decided thatthe best method to adopt for this investigation was totransform continuous matching into discretely distributedmatching e best match between the taxi distributionpoints and the demand points is solved under the con-dition that the cost of passengers allocated to taxis isminimized that is the waiting time of passengers isminimum Next we will first introduce the theoreticalbackground of the model bipartite matching and Hun-garian method And then the algorithm steps of matchingdegree will be given
21 BipartiteMatching When modelling relations betweentwo different classes of objects bipartite networks usuallyarise naturally It is widely used in social network analysis[32ndash34] optimization problem [14 15] and recommendersystems [35ndash37] Let G (V E) be an undirected graph Ifthe vertex set V can be divided into two mutually disjointsubsets S T graph G is a bipartite graph e bipartitegraph can also be recorded as G (S T E) We propose acomplete bipartite graph G (S T E) with passengernodes S and taxi nodes T and each edge has a nonnegativecost c(i j) We want to find a perfect matching with aminimum total cost A simple bipartite matching is shownin Figure 1
Table 1 Traditional indicators for measuring taxi operations
City Ndagger Pdagger LDagger LDaggerp c ϕ
Beijing 68284 2170 589815 378382 3147 064Shanghai 49586 2415 608488 392688 2053 065Xirsquoan 14459 87 mdash mdash 1662 073lowastGuangzhou 22022 135 mdash mdash 1631 07lowast
N denotes the number of taxisP denotes resident population (106 persons)L denotes operating mileage (106 kilometres) Lp denotes passenger mileage(106 kilometres) c (NP) denotes the number of ownership (per 104persons) ϕ (LpL) denotes mileage utilization rate Source daggerChina CityStatistical Yearbook 2016 DaggerMinistry of Transport of the Peoplersquos Republicof China lowastData from news
2 Complexity
22 Hungarian Method e Hungarian method is a com-binatorial optimization algorithm based on bipartitematching to solve the assignment problem [16 17]According to Bergersquos lemma [18] a matching is maximum ifand only if it does not have any augmenting path
A maximum matching is a matching that contains asmany edges as possible [38] A perfect matching (com-plete matching) is a matching which matches all nodes ofthe graph A perfect matching can only occur when thegraph has an even number of nodes [39] Since our goal isto measure whether passengersrsquo needs are met theperfect matching in our paper describes a matchingsatisfying all passengersrsquo requirements that is maximummatching
In general we set a matching matrix M In each step wefind an augmenting path P to get a bigger match Mprime than MAugmenting path P is a path in graph G that connects twounmatched vertices V E If the matched and unmatchededges alternate onP then P is an augmenting path relative toM e process is done if we cannot find a new augmentingpath e detailed algorithm of the Hungarian method isshown in Figure 2
23 Matching Degree Since the demand and supply of taxisin each place are changing over time the adjacency matrix ofthe bipartite network is also changing correspondingly Tosolve this problem we use the idea of discretization tosimplify this complex problem In our model we deal withthis continuity problem step by step We can consider thatthere is only one person at each demand point and each taxisupply point only supplies one taxi every timeWe repeat theprocess until there is no passenger at the demand point
e bipartite networks based dynamic allocation processconsists of four steps
Step 1 establish the adjacency matrix M the elementmij in the adjacency matrix is the spatial distancebetween passenger i and taxi j based on latitude andlongitude that is the matching costStep 2 discretize the continuity problem we assumethat in each time window only one passenger in each
demand point participates in the matching In eachmatching process we use the Hungarian method toestablish an optimal match e matching process isjust like the simple example in Figure 1 e goal is tomatch all passengers with a minimal matching costAfter each round of matching all demand pointsshould be reduced by one passenger If supply pointsmeet the matching one taxi should also be reducedStep 3 in a point when all the passengers or taxis arematched the cost of matching will be set to infinityM(i j) infin+ which means this point is no longerinvolved in the next matchingStep 4 the above steps are performed continuouslyWhen all the passengers have been matched the matchprocess is ended In this case the remaining number ofthe taxis at each taxi supply point Rj can be obtainedus the matching degree of each taxi supply point canbe calculated by ((Tj minus Rj)Tj) where Tj is the initialnumber of taxis
3 Spatiotemporal Characteristics
According to the algorithm steps of matching degree in theprevious section we will then substitute the datasets of fourcities and use matching degree to explore spatiotemporalcharacteristics of urban taxis e dataset is from CangqiongIntelligent Travel Platform which includes the location ofthe supply points of taxis and the location of the passengersin need at each moment
Figure 3 shows the spatial distribution of taxi demandand supply at 8 am in Beijing Shanghai Xirsquoan andGuangzhou respectively An important finding is that thetaxis supply is always higher than demand but taxis usuallygather around hotspots We then study the temporalcharacters of taxi demand and supply Figure 4 shows theaverage matching degree of Shanghai Beijing Xirsquoan andGuangzhou On the whole the four cities have three peaktravel times mainly around 8 am 6 pm and 9 pm whichis in line with reality
When looking at the results of the four cities separatelywe can find that the average matching degree of Beijing is the
1
2
3
4
5
6
2
2
53
2
(a)
1
2
3
4
5
6
(b)
1
2
3
4
5
6
(c)
1
2
3
4
5
6
(d)
Figure 1 A simple example of the Hungarian method (a)is is a simple bipartite network where the value on each edge is matching costRed circles indicate the matched nodes and blue circles indicate the unmatched nodes (b) Firstly let node 1 match node 4 Now thematching degree is 1 (c) Node 2 can only link with node 4 Although node 4 has already matched node 1 it can be replaced by node 6 at thesame cost erefore let node 1 match node 6 instead and node 2 matching node 4 can give a minimum cost So the matching degreebecomes 2 (d) Finally let node 3 match the node 5 In this example the maximum matching degree is 3 at minimum cost
Complexity 3
highest followed by Shanghaiese two cities are two of themost developed cities in China In addition we find thateven in Beijing during the peak hours of commuting theaverage matching degree is still less than 40 We suspectthat the urban taxi matching degree is related to taxi dis-tribution density and urban spatial structure As shown inFigure 5 in Beijing Shanghai and Xirsquoan when the taxidensity in the unit space becomes too large the matchingdegree will be reduced However Guangzhou is the oppositeAccording to the number of ownership (Table 1) we thinkthe overall taxi supply in Guangzhou is insufficient InBeijing and Shanghai the number of ownership per 104persons is more than 20 thus they have relatively sufficientsupply
Next we study the relationship between taxis supplydensity and matching degree We find that the spatial dis-tribution of taxi has a great influence on the matchingdegree which reflects the importance of information ex-change between passengers and taxi drivers
Specific to each city we analyze the impact of spatialdistribution on the matching of taxi supply and demand Asshown in Figure 6 for Beijing the area with the highest taxiutilization rate is about 15ndash20km and 32km away from the citycenter (Tiananmen Square) is result can be easily explainedby the specific situation in Beijing e existing urban area ofBeijing is built on the old city thusmost of its commercial areasare about 10ndash20 kilometers away from the center of the city Sothere will be a large matching degree in this distance rangeWith the expansion of urban areas such as the Beijing FourthRing Road and the Fifth Ring Road the development is alsorelatively rapid which leads to the emergence of the secondmatching peak in the map For the more emerging cityShanghai it is quite different from Beijing e largestmatching area is mostly within 18 km from the city centererefore the influence of the urban structure on thematchingdegree of supply and demand for taxis is also remarkableRationally dispatching taxis according to urban space layoutscan make the allocation of taxi resources much reasonable
Establish a costadjacency matrix
Update the coefficient matrixEach column or row of the
coefficient matrix subtracts theminimum value of the column orrow ensuring that each row and
column has at least one zero
All zeros in the matrix must becovered by marking as few rows
andor columns as possible
Yes
No
No
In the row where thezero is located find
zeros that uncoveredand mark as Z
Look for zero in thecolumn where Z is
located
No
Yes
Cover the row anduncover the column
where the zero islocated
Find an uncoveredzero and mark as Z
Yes
Yes
Find the minimum value of thenoncovered area e elements of all
noncovered areas minus the minimumthe elements at the intersection of the
covered area plus the minimum
No
Get the optimal allocation
Whether all the rows andcolumns are covered
Whether the row of Zcontains zeros
Whether there is anuncovered zero
Whether the column of Zcontains zeros
Figure 2 e process of bipartite networks based optimal match
4 Complexity
4 The Demand and Supply of Taxis andDynamics Model Simulation
41 e Demand and Supply of Taxis in Hotspotsrough Figure 3 we find that passenger demand is scat-tered while the supply of taxis is denser in certain areashereinafter as hotspots Taking Beijing as an example wecalculate the demand and supply around Beijing RailwayStation (116433547 39909462) and Beijing South RailwayStation (116385488 3987128) As shown in Figure 7 theblue line indicates the demand for taxis and the orange lineindicates the number of taxis that can be provided aroundthe areas We find that in hotspots supply always exceedsdemand
is phenomenon is easy to understand In hotspotssuch as office buildings tourist attractions and stationsthere will be a relatively stable demand Taxi drivers do notneed to search passengers if they wait around hotspots Inthis way the driver can reduce the fuel and time cost ofempty cruising However if too many taxis crowed intopopular areas drivers may not receive orders due tooversupply
is problem is similar to the El Farol Bar Problemproposed by Arthur in 1994 [40 41]e game is that everyweekend a group of people such as n 100 persons haveto decide whether to go to a bar or stay at home e barrsquoscapacity is limited assuming 60 persons If someonepredicts that more than 60 persons will go to the bar would
0
gt100
Demand
Beijing-demand
(a)
0
gt100
Supply
Beijing-supply
(b)
0
gt100
Demand
Shanghai-demand
(c)
0
gt100
Supply
Shanghai-supply
(d)
0
gt100
Demand
Xirsquoan-demand
(e)
0
gt100
Supply
Xirsquoan-supply
(f )
0
gt100
Demand
Guangzhou-demand
(g)
0
gt100
Supply
Guangzhou-supply
(h)
Figure 3 e supply and demand distribution of taxis at 8 am
Complexity 5
she go to the bar or not Each participant or decision-maker only knows the number of people who went to thebar before us the strategy can only be summarized
based on the information of the previous feedback is is atypical dynamic game problem rough computer sim-ulation we can get an interesting result After a period of
040
035
Beijing Shanghai
XirsquoanGuangzhou
030
025
020
015
010
005
0000 2 4 6 10 12 14 16 18 20 22 24
TimeM
atch
ing
degr
ee8
Figure 4 From top to bottom the lines represent the average matching degree of Beijing Shanghai Xirsquoan and Guangzhou in 24 hours ofone day is diagram indicator can measure the degree of matching between passengers and taxis at the current moment
Vehicle density
OriginalFit
10
08
06
04
02
0050 75 100 150 175 200
Resp
onse
ratio
125 225
(a)
Vehicle density
OriginalFit
10
08
06
04
02
00150 200 250 300 350 400
Resp
onse
ratio
(b)
Vehicle density
04
OriginalFit
03
02
01
00
20 40 60 80 100
Resp
onse
ratio
(c)
06
05
04
03
02
01
00
20 30 40 50 60 70 80Vehicle density
OriginalFit
Resp
onse
ratio
(d)
Figure 5 e matching degree varies with taxi density (andashd) Beijing Shanghai Xirsquoan and Guangzhou respectively e blue stars areoriginal average values and the red curves are trend fitting curves e X-axis represents the number of taxis per unit space and the Y-axisrepresents the matching degree
6 Complexity
time the number of people who went to the bar tends to be60 e participants will self-organize into a balancedsystem
However unlike the El Farol Bar game there are tworoles in our problem We need to consider not only thenumber of drivers but also the number of passengers In ahotspot passengers can choose to take a taxi which is morecomfortable and faster than other public transportationHowever if too many people take taxies at the same timethere will be a supply shortage and it will take more time forpassengers to wait for vehicle dispatch For this double-role-like bar game scenario will it also form a stable equilibriumsystem Based on the data shown in Figure 7 we think thatdemand and supply of taxis in hotspots will also form suchan equilibrium state Below we construct a dynamic gamemodel and verify this conjecture through a multiagentsimulation
42 Demand and Supply Dynamics Model We assume thatthe system consists of two types of agents passengers whocan choose transportation method taxi or other publictransportations and taxi drivers who can decide to waitaround the hotspot or cruise for searching potential pas-sengers e expected returns for these two types of agentsare affected by the number of demand and supply of thesame system
If there are Np passengers choosing to take taxis and Nd
taxis are waiting around the hotspot their payoffs are givenby
πd pl + ρ + cd
Np
Nd
1113888 1113889Np
Nd
πp U minus pl minus cp
Np
Nd
⎧⎪⎪⎪⎪⎪⎪⎨
⎪⎪⎪⎪⎪⎪⎩
(1)
10
08
06
04
02
00
0 10 20 30 40Distance from the city center
50 60
MaxAverage
Resp
onse
ratio
(a)
MaxAverage
10
06
08
04
02
00
0 10 20 30Distance from the city center
40 50
Resp
onse
ratio
(b)
Figure 6 e matching degree varies with the distance from the city center (a) Beijing (b) Shanghai e blue dots are the maximummatching degree and the orange stars are average matching degree e X-axis represents the distance of taxis supply points from the citycenter e Y-axis represents the matching degree of taxi resources
Demand Supply
4000
3500
3000
2500
2000
1500
1000
500
20160806 20160807 20160808 20160809 20160810 20160811 20160812
(a)
3000
Demand Supply
2500
2000
1500
1000
500
20160806 20160807 20160808 20160809 20160810 20160811 20160812
(b)
Figure 7 e supply and demand relationship around hotspots e blue line is the demand for taxis and the orange line is the supply (a)Beijing railway station (b) Beijing south railway station
Complexity 7
where p denotes the average income per kilometre l denotesthe average operating mileage ρ denotes the starting pricecd denotes the cost of searching time for drivers cp denotesthe cost of waiting time for passengers and U denotes thedegree of comfort by taxis compared with other trans-portation When the demand is greater than supply thepassengers have to wait for taxis the waiting time cost iscp(NpNd) and the drivers can save the searching timecd(NpNd) To make it easier we assume cp cd c in thefollowing simulation However the passengers who worrythat there are lots of people waiting for taxis and choose totake the bus or subway will have fixed income P0 Also thetaxi drivers who choose to supply the service out of hotspotshave fixed income D0
In order to get a deeper insight we have conductedmultiagents simulations based on two popular models thereinforcement learning model and the Fermi learningmodel
421 e Reinforcement Learning Model Reinforcementlearning has been widely used to develop decision behaviormodels [21 24 25] In reinforcement learning the benefitsof a strategy selected in the previous round will be used toreinforce the tendency to choose that strategy and thetendency to choose a different strategy will be converted intothe probability of that strategy
We firstly examined the ability of the reinforcementlearning model to simulate the multiagents system Simu-lation processes of the model are shown as follows
(1) Initial propensity we assume that all agents have thesame initial propensity which is set equal to the fixedincome 50
(2) Update propensity suppose an individual (passengeror driver) has chosen action a isin i minusi in round t thepropensities in round t + 1 are updated by
qas (t + 1) θπs(t) +(1 minus θ)q
as (t) s isin p d1113864 1113865 (2)
where qas (t + 1) is the propensity to choose action a
in the next round t + 1 πs(t) is the payoff corre-sponding to the action in round t and θ is thelearning rate
(3) Update probability the probability of choosing ac-tion i in round t + 1 is determined by
pis(t + 1)
exp cqis(t + 1)( 1113857
exp cqis(t + 1)( 1113857 + exp cqminusi
s (t + 1)( 1113857 (3)
where cgt 0 is a parameter that determines reinforcementsensitivity In our simulations with the reinforcementlearning model we set c 05 θ 01 02 e results areshown in Figure 8
422 e Fermi Learning Model We then propose a newFermi learning model based on the prospect theory andFermi rule
Prospect theory prospect theory is an economics theorydeveloped by Tversky and Kahneman which proposesan asymmetric form of risk aversion [26 27] Accordingto the prospect theory people make decisions based onthe potential gains or losses relative to the referencepoint rather than in absolute terms [28] e valuefunction of prospect theory that passes through thereference point is s-shaped and asymmetrical Facedwith a risky choice leading to gains individuals are risk-averse while faced with a risky choice leading to lossesindividuals are risk-seeking [29 30]Fermi rule Fermi rule originated from condensedmatter physics and is widely used in decision modellingin evolutionary games [21 31] Compared with thegeneral reinforcement learning model the number ofadjustable parameters using Fermi rule is reduced byone As far as we know the Fermi rule combined withthe prospect theory has not been employed to modelindividual choice behaviors in self-organization sys-tems erefore the Fermi learning model is based onthe Fermi rule and prospect theory to offer a simplercharacterization of individual choice behavior for thesystemsIn our Fermi learning model passengers and driversuse the expected return as a reference point to measuregains or losses at is for passengers they will use thefixed income D0 of other transportation as a referencepoint When πd gtD0 the passengers consider gainswhen πd ltD0 the passengers consider incurring losse same goes for taxi drivers Let xd and xp denote thegains or losses of the passengers and driversrsquo expecteddecision respectively When the passengers choose totake taxis and drivers choose to serve in the hotspotarea xd πd minus D0 xp πp minus P0Agents in the system will update the probability oftaking a taxi (passengers) or waiting around the hotspot(drivers) based on the potential gains or lossesaccording to their historical experience
P 1
1 + exp r 1113936ni1 xminus
s minus 1113936mj1 x+
s1113872 11138731113872 1113873 s isin p d1113864 1113865 (4)
where λ n + m denotes the memory length and rgt 0 de-notes intensity of selection [31] In our simulations with theFermi learning model we set r 01 Here 1113936
ni1 xminus
s is thesum of historical losses and 1113936
mj1 x+
s is the sum of historicalgains e results are shown in Figure 9
43 Results Figures 8 and 9 show the simulation results ofthe reinforcement learning model and Fermi learning modelat different parameter settings We set the initial number ofpassengers and taxi drivers as 1000 and 3000 respectivelyWe hypothesize that the average income per kilometre p 3and the average operating mileage l 10 starting priceρ 13 and the fixed income P0 D0 50 ese resultsdemonstrate that both models can account for self-orga-nization behavior under different scenarios
8 Complexity
1500
1400
500
400
300
200
100
00 20 40
Time60 80 100
PassengerDriver
Num
ber
(a)
1500
1400500
400
300
200
100
00 20
PassengerDriver
40 60Time
80 100
Num
ber
(b)
300029001000
900
500
400
300
200
100
00 20 40
Time60 80 100
PassengerDriver
Num
ber
(c)
3000
29001000
900
500
400
300
200
100
00 20
PassengerDriver
40 60Time
80 100
Num
ber
(d)
Figure 8 e reinforcement learning model results ere are totally 3000 drivers and 1000 passengers in the systems (a c) θ 01 (b d)θ 05 e probability of taking a taxi and waiting around hotspots for (a) and (b) at the initial state is half and for (c) and (d) it is 1
1500
1400500
400
300
200
100
00 20 40 60 80 100
Time
Num
ber
PassengerDriver
(a)
1500
1400
500
400
300
200
100
00 20 40 60 80 100
Time
Num
ber
PassengerDriver
(b)
Figure 9 Continued
Complexity 9
Furthermore we set different memory lengths λ in theFermi learning model Figure 9 also shows the memorylength will slightly inhibit the amount of supply and de-mand However the demand and supply in hotspots tend tobe stable after a period of time ese results support thatdemand and supply of taxis in hotspots will self-organizeinto a balanced system over a period of time
5 Conclusion and Discussion
e research of urban transport is a complex system in-volving multidomain and multidisciplinary With the de-velopment of the Internet and technology taxi operationdata are more detailed and specific erefore we can betterexplore these data to provide useful suggestions for urbandevelopment Traditional operation indicators of urban taxispay more attention to the overall situation of taxi supply andoperation If urban planners want a more detailed de-scription especially spatiotemporal characteristics of urbantaxis the matching degree provides a novel perspective
In this work we study the dynamic spatiotemporalcharacteristics of the urban taxis We propose the matchingdegree through bipartite networks based dynamic allocationmodel to measure supply and demand e peak travel timeshown in our results keeps in touch with reality We find thatmatching degree can be influenced by taxi supply density andlocation Rationally dispatching taxis according to urbanspace layouts can allocate the taxi resources much morereasonable According to the analysis of data taxi supply isalways more than demand but taxis usually gather aroundhotspots It is interesting to note that the demand and supplyof taxis in hotspots tend to be stable after a while en weestablish a dynamic game model which is a kind of double-role-like bar game and simulate the multiagents system usingtwo learning models reinforcement learning and prospecttheory based Fermi learning e results of the two learningmodels both show that the amount of demand and supply inhotspot will self-organize into a balanced system finally
Regardless of this there is still some room for im-provement Firstly our matching degree will be more op-timistic than the actual situation because we ignore the factthat drivers will selectively accept orders in real life Sec-ondly in ourmultiagents simulation maybe we can considerdiversity in individual behaviors to offer a better charac-terization of collective behaviors
Data Availability
e data used to support the findings of this study areavailable from the corresponding author upon request
Conflicts of Interest
e authors declare no conflicts of interest
Acknowledgments
is work was supported by the National Natural ScienceFoundation of China (Grant nos 61573065 and 71731002)
References
[1] GTPR Institute Guangzhou Transport Key Figures GTPRInstitute Gangzhou China 2018
[2] N Wu S Zhao and Q Zhang ldquoA study on the determinantsof private car ownership in China findings from the paneldatardquo Transportation Research Part A Policy and Practicevol 85 pp 186ndash195 2016
[3] J Yang J Dong Z Lin and L Hu ldquoPredicting market po-tential and environmental benefits of deploying electric taxisin Nanjing Chinardquo Transportation Research Part D Transportand Environment vol 49 pp 68ndash81 2016
[4] K I Wong S C Wong H Yang and J H Wu ldquoModelingurban taxi services with multiple user classes and vehiclemodesrdquo Transportation Research Part B Methodologicalvol 42 no 10 pp 985ndash1007 2008
[5] X Liang X Zheng W Lv T Zhu and K Xu ldquoe scaling ofhuman mobility by taxis is exponentialrdquo Physica A Statistical
3000
29001000
900400
300
200
100
00 20 40 60 80 100
Time
Num
ber
PassengerDriver
(c)
3000
2900
1000
900400
300
200
100
00 20 40 60 80 100
Time
Num
ber
PassengerDriver
(d)
Figure 9 e Fermi learning results ere are totally 3000 drivers and 1000 passengers in the systems (a c) λ 1 (b d) λ 5 eprobability of taking a taxi and waiting around hotspots for (a) and (b) at the initial state is half and for (c) and (d) it is 1
10 Complexity
Mechanics and Its Applications vol 391 no 5 pp 2135ndash21442012
[6] W Wang L Pan N Yuan S Zhang and D Liu ldquoA com-parative analysis of intra-city human mobility by taxirdquoPhysica A Statistical Mechanics and Its Applications vol 420pp 134ndash147 2015
[7] Z Christoforou C Milioti D Perperidou andM G Karlaftis ldquoInvestigation of taxi travel time character-isticsrdquo in Proceedings of the 2011 Transportation ResearchBoard 90th Annual Meeting Washington DC USA 2011
[8] Y Lin W Li F Qiu and H Xu ldquoResearch on optimization ofvehicle routing problem for ride-sharing taxirdquo Procedia -Social and Behavioral Sciences vol 43 pp 494ndash502 2012
[9] P-Y Chen J-W Liu and W-T Chen ldquoA fuel-saving andpollution-reducing dynamic taxi-sharing protocol in vanetsrdquoin Proceedings of the 2010 IEEE 72nd Vehicular TechnologyConference-Fall pp 1ndash5 Ottawa Canada 2010
[10] F Stodolsky L Gaines and A Vyas ldquoAnalysis of technologyoptions to reduce the fuel consumption of idling trucksrdquoTechnical report Argonne National Laboratory Lemont ILUSA 2000
[11] P S Castro D Zhang and S Li ldquoUrban traffic modelling andprediction using large scale taxi GPS tracesrdquo in Proceedings ofthe 2012 International Conference on Pervasive Computingpp 57ndash72 Newcastle UK 2012
[12] J M Viegas ldquoMaking urban road pricing acceptable andeffective searching for quality and equity in urban mobilityrdquoTransport Policy vol 8 no 4 pp 289ndash294 2001
[13] Y Han and W Wang ldquoOn the spatial and temporal distri-bution of resident trip based on taxi GPS datardquo Geomatics ampSpatial Information Technology vol 2 pp 87ndash89 2018
[14] P Calegari F Guidec P Kuonen and F Nielsen ldquoCombi-natorial optimization algorithms for radio network planningrdquoeoretical Computer Science vol 263 no 1-2 pp 235ndash2452001
[15] R Niedermeier ldquoInvitation to fixed-parameter algorithmsrdquoOxford Lecture Series in Mathematics and Its Applicationsvol 31 Oxford University Press Oxford UK 2006
[16] H W Kuhn ldquoe Hungarian method for the assignmentproblemrdquo Naval Research Logistics Quarterly vol 2 no 1-2pp 83ndash97 1955
[17] H W Kuhn ldquoVariants of the Hungarian method for as-signment problemsrdquo Naval Research Logistics Quarterlyvol 3 no 4 pp 253ndash258 1956
[18] C Berge ldquoTwo theorems in graph theoryrdquo Proceedings of theNational Academy of Sciences vol 43 no 9 pp 842ndash844 1957
[19] I Hussain L Knapen T Bellemans D Janssens and GWetsldquoAn agent-based negotiation model for carpooling a casestudy for flanders (Belgium)rdquo in Proceedings of the 94thTransportation Research Board Meeting WWashington DCUSA 2015
[20] N Ronald T Arentze and H Timmermans ldquoAn agent-basedframework for modelling social influence on travel behav-iourrdquo in Proceedings of the 18th World IMACS Congress andMODSIM09 International Congress on Modelling and Simu-lation pp 2955ndash2961 Canberra Australia 2009
[21] X Sun X Han J-Z Bao et al ldquoDecision dynamics of de-parture times experiments and modelingrdquo Physica A Sta-tistical Mechanics and Its Applications vol 483 pp 74ndash822017
[22] F Golpayegani et al ldquoCo-ride collaborative preference-basedtaxi-sharing and taxi-dispatchrdquo in Proceedings of the 2018IEEE 30th International Conference on Tools with ArtificialIntelligence (ICTAI) pp 864ndash871 Volos Greece 2018
[23] K T Seow N H Dang and D-H Lee ldquoA collaborativemultiagent taxi-dispatch systemrdquo IEEE Transactions on Au-tomation Science and Engineering vol 7 no 3 pp 607ndash6162009
[24] R Selten T Chmura T Pitz S Kube and M SchreckenbergldquoCommuters route choice behaviourrdquo Games and EconomicBehavior vol 58 no 2 pp 394ndash406 2007
[25] T E Daniel E J Gisches and A Rapoport ldquoDeparture timesin y-shaped traffic networks with multiple bottlenecksrdquoAmerican Economic Review vol 99 no 5 pp 2149ndash21762009
[26] A Tversky and D Kahneman ldquoProspect theory an analysis ofdecision under riskrdquo Econometrica vol 47 no 2 pp 263ndash2911979
[27] D Kahneman and A Tversky ldquoProspect theory an analysis ofdecision under riskrdquo in Handbook of the Fundamentals ofFinancial Decision Making Part I pp 99ndash127 World Sci-entific Singapore 2013
[28] A Karlstrom and J P Franklin ldquoBehavioral adjustments andequity effects of congestion pricing analysis of morningcommutes during the Stockholm trialrdquo Transportation Re-search Part A Policy and Practice vol 43 no 3 pp 283ndash2962009
[29] S Fujii and R Kitamura ldquoDriversrsquo mental representation oftravel time and departure time choice in uncertain trafficnetwork conditionsrdquo Networks and Spatial Economics vol 4no 3 pp 243ndash256 2004
[30] H-l Xu J Zhou and X-g Chen ldquoAnalysis and demon-stration of the travelerrsquos route choice behavior rule based onthe prospect theoryrdquo Journal of Transportation Systems En-gineering and Information Technology vol 6 2007
[31] M Perc and A Szolnoki ldquoCoevolutionary gamesmdasha minireviewrdquo BioSystems vol 99 no 2 pp 109ndash125 2010
[32] S Wasserman and K Faust Social Network Analysis Methodsand applications vol 8 Cambridge University Press Cam-bridge UK 1994
[33] G Ergun ldquoHuman sexual contact network as a bipartitegraphrdquo Physica A Statistical Mechanics and Its Applicationsvol 308 no 1ndash4 pp 483ndash488 2002
[34] P Zhang J Wang X Li M Li Z Di and Y Fan ldquoClusteringcoefficient and community structure of bipartite networksrdquoPhysica A Statistical Mechanics and Its Applications vol 387no 27 pp 6869ndash6875 2008
[35] T Zhou J Ren M Medo and Y-C Zhang ldquoBipartite net-work projection and personal recommendationrdquo PhysicalReview E vol 76 no 4 Article ID 046115 2007
[36] R-R Liu J-G Liu C-X Jia and B-H Wang ldquoPersonalrecommendation via unequal resource allocation on bipartitenetworksrdquo Physica A Statistical Mechanics and Its Applica-tions vol 389 no 16 pp 3282ndash3289 2010
[37] F Yu A Zeng S Gillard and M Medo ldquoNetwork-basedrecommendation algorithms a reviewrdquo Physica A StatisticalMechanics and Its Applications vol 452 pp 192ndash208 2016
[38] J Edmonds ldquoMaximummatching and a polyhedron with 01-verticesrdquo Journal of Research of the National Bureau ofStandards B vol 69 no 125ndash130 pp 55-56 1965
[39] R M Karp E Upfal and A Wigderson ldquoConstructing aperfect matching is in random ncrdquo Combinatorica vol 6no 1 pp 35ndash48 1986
[40] W B Arthur ldquoInductive reasoning and bounded rationalityrdquoe American Economic Review vol 84 no 2 pp 406ndash4111994
[41] W B Arthur ldquoComplexity and the economyrdquo Sciencevol 284 no 5411 pp 107ndash109 1999
Complexity 11
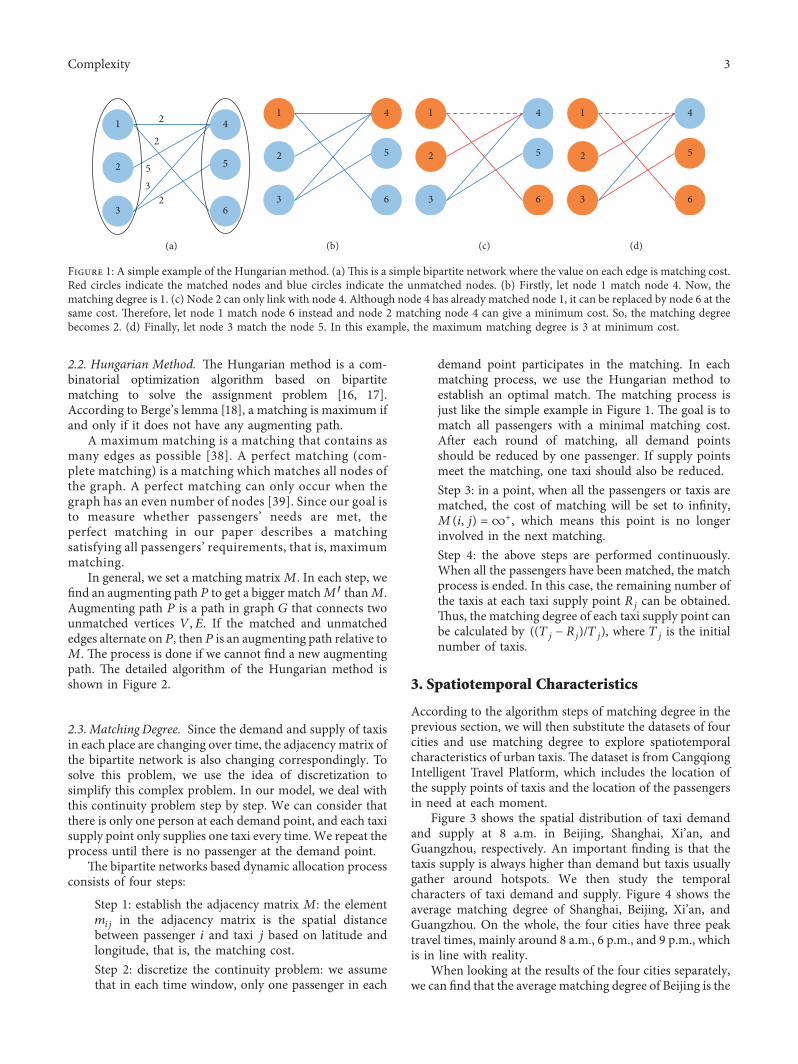
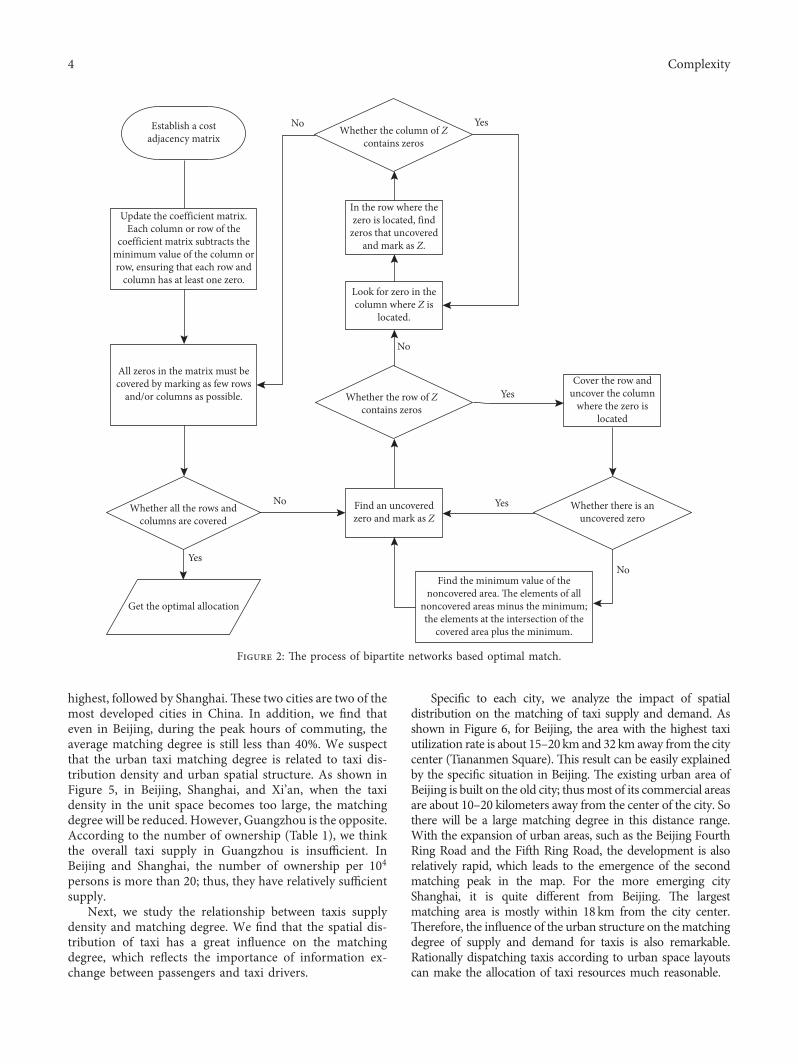
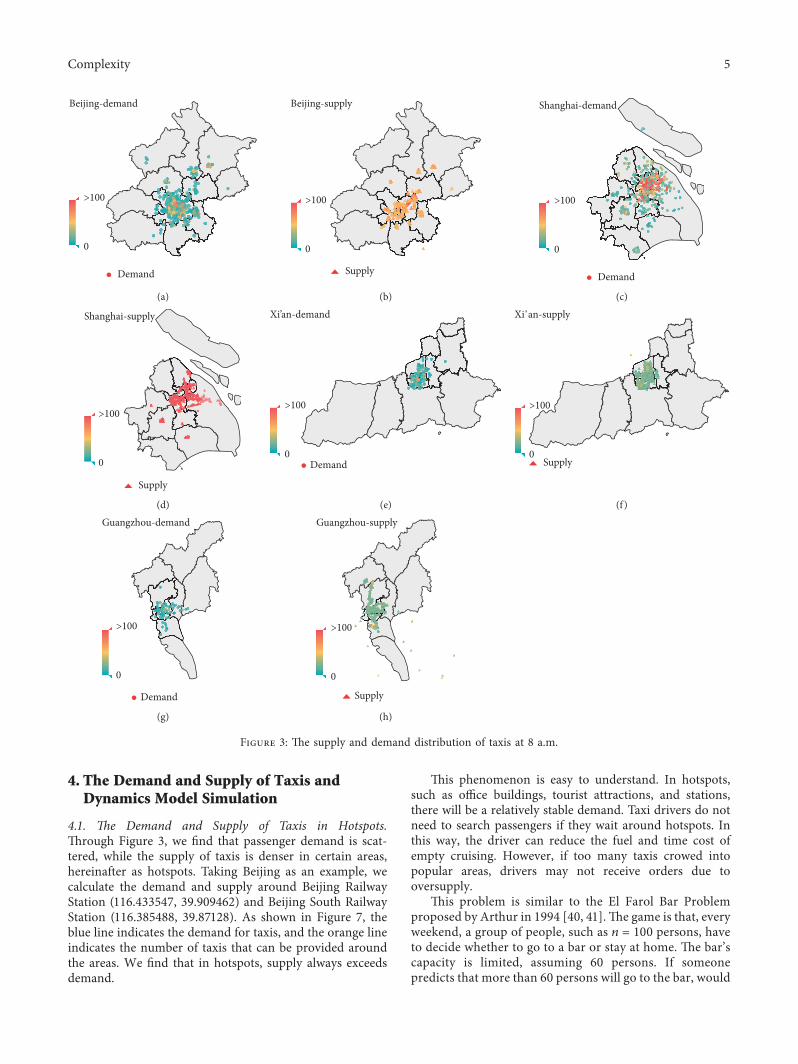
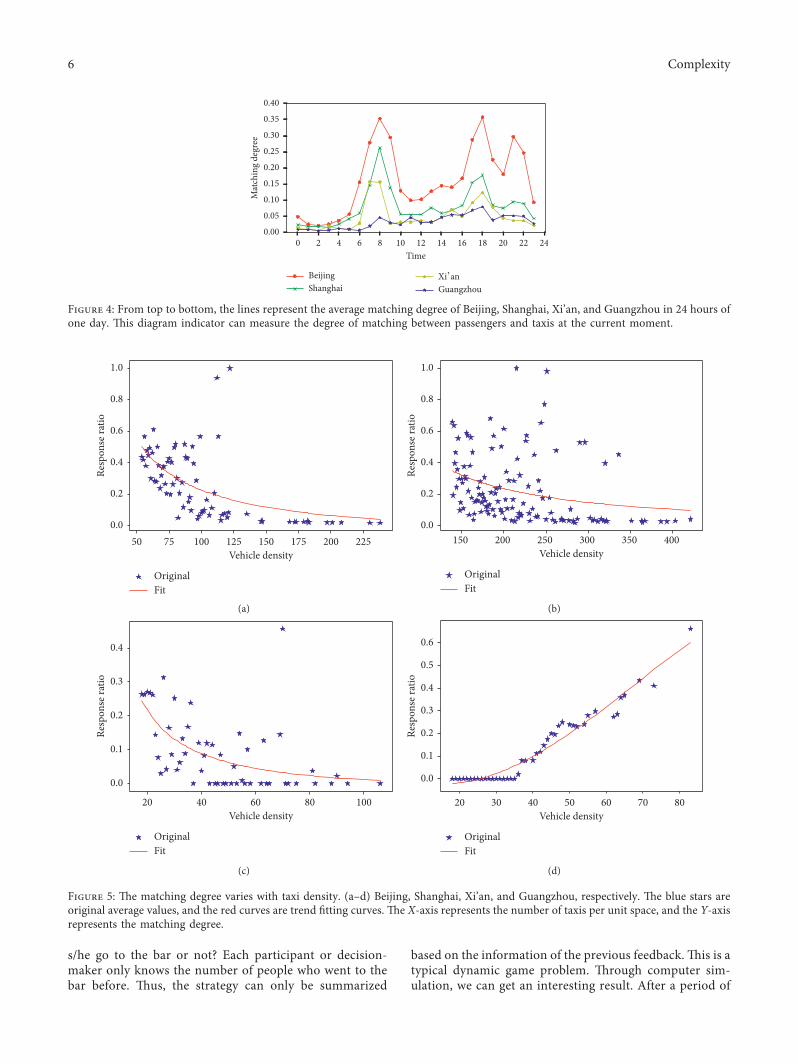
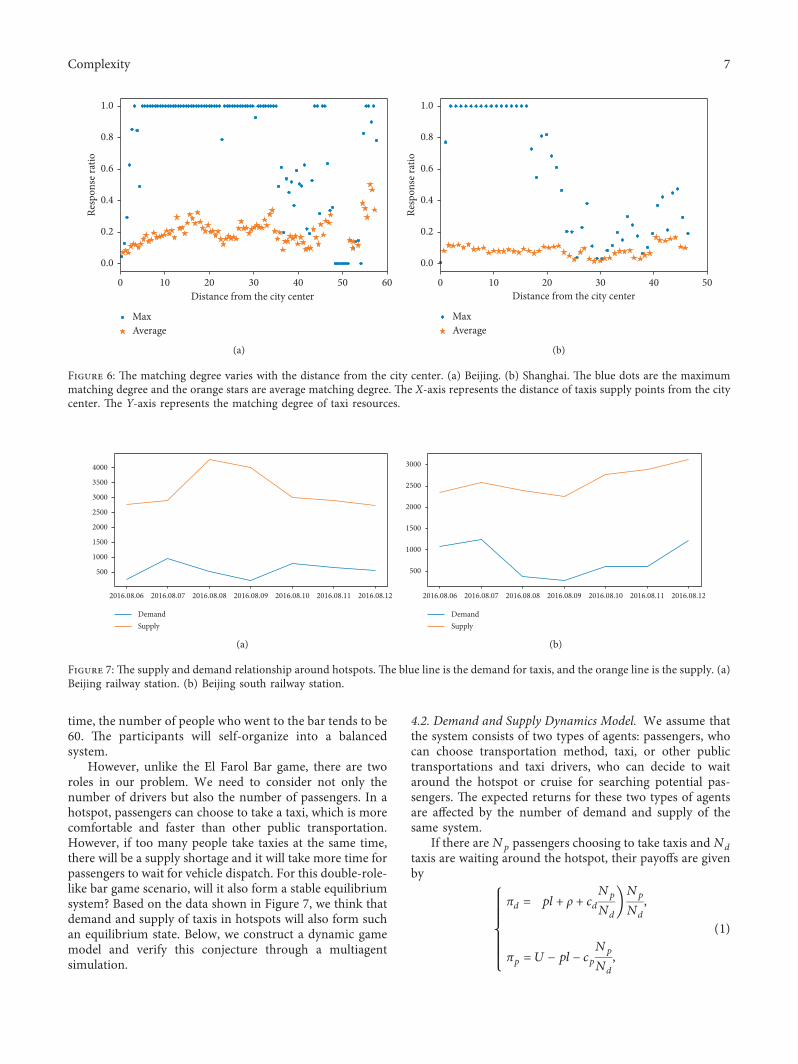
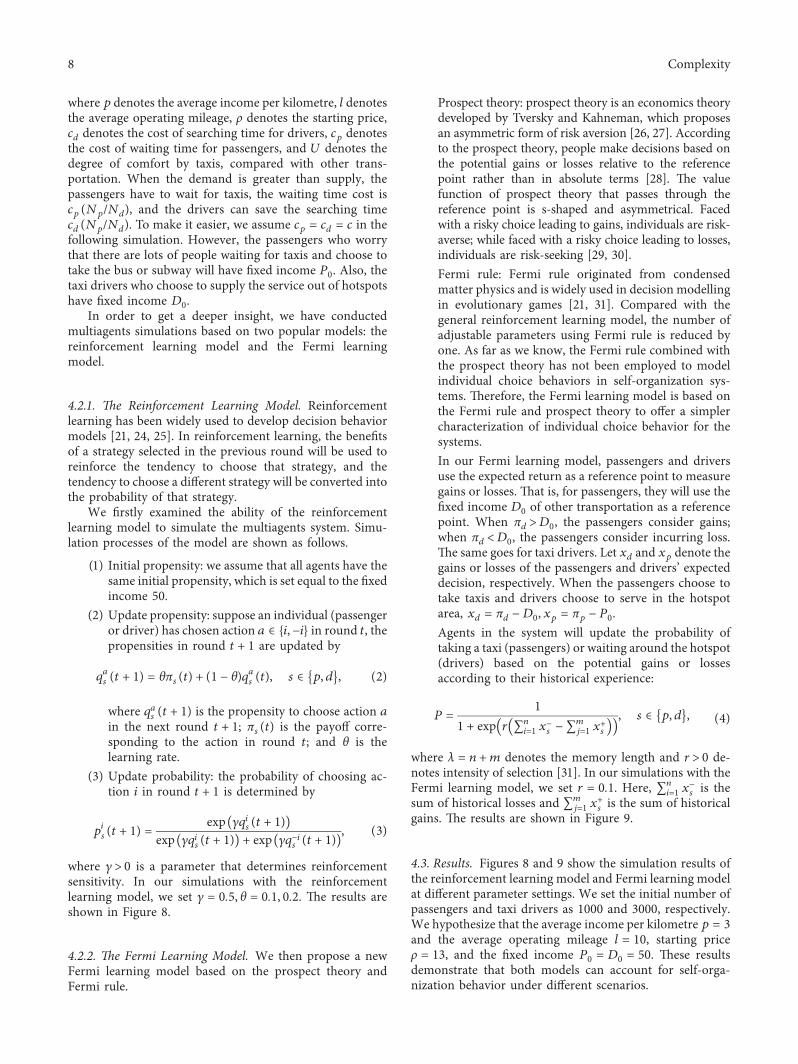
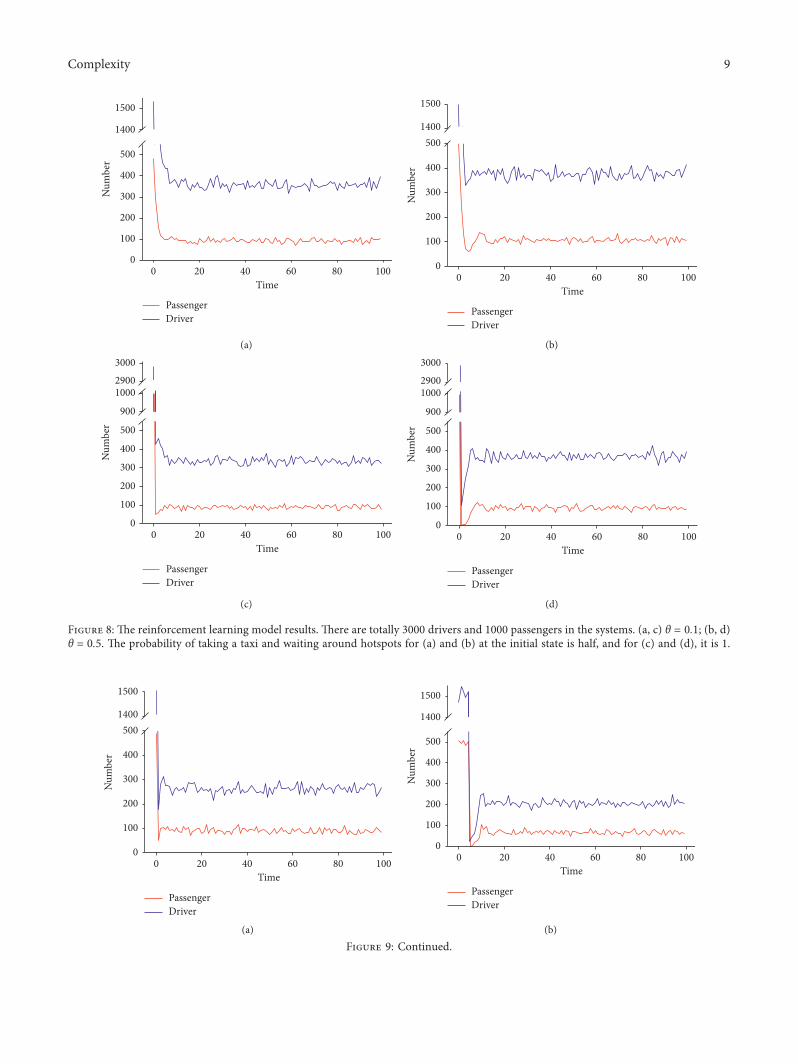
1500
1400
500
400
300
200
100
00 20 40
Time60 80 100
PassengerDriver
Num
ber
(a)
1500
1400500
400
300
200
100
00 20
PassengerDriver
40 60Time
80 100
Num
ber
(b)
300029001000
900
500
400
300
200
100
00 20 40
Time60 80 100
PassengerDriver
Num
ber
(c)
3000
29001000
900
500
400
300
200
100
00 20
PassengerDriver
40 60Time
80 100
Num
ber
(d)
Figure 8 e reinforcement learning model results ere are totally 3000 drivers and 1000 passengers in the systems (a c) θ 01 (b d)θ 05 e probability of taking a taxi and waiting around hotspots for (a) and (b) at the initial state is half and for (c) and (d) it is 1
1500
1400500
400
300
200
100
00 20 40 60 80 100
Time
Num
ber
PassengerDriver
(a)
1500
1400
500
400
300
200
100
00 20 40 60 80 100
Time
Num
ber
PassengerDriver
(b)
Figure 9 Continued
Complexity 9
Furthermore we set different memory lengths λ in theFermi learning model Figure 9 also shows the memorylength will slightly inhibit the amount of supply and de-mand However the demand and supply in hotspots tend tobe stable after a period of time ese results support thatdemand and supply of taxis in hotspots will self-organizeinto a balanced system over a period of time
5 Conclusion and Discussion
e research of urban transport is a complex system in-volving multidomain and multidisciplinary With the de-velopment of the Internet and technology taxi operationdata are more detailed and specific erefore we can betterexplore these data to provide useful suggestions for urbandevelopment Traditional operation indicators of urban taxispay more attention to the overall situation of taxi supply andoperation If urban planners want a more detailed de-scription especially spatiotemporal characteristics of urbantaxis the matching degree provides a novel perspective
In this work we study the dynamic spatiotemporalcharacteristics of the urban taxis We propose the matchingdegree through bipartite networks based dynamic allocationmodel to measure supply and demand e peak travel timeshown in our results keeps in touch with reality We find thatmatching degree can be influenced by taxi supply density andlocation Rationally dispatching taxis according to urbanspace layouts can allocate the taxi resources much morereasonable According to the analysis of data taxi supply isalways more than demand but taxis usually gather aroundhotspots It is interesting to note that the demand and supplyof taxis in hotspots tend to be stable after a while en weestablish a dynamic game model which is a kind of double-role-like bar game and simulate the multiagents system usingtwo learning models reinforcement learning and prospecttheory based Fermi learning e results of the two learningmodels both show that the amount of demand and supply inhotspot will self-organize into a balanced system finally
Regardless of this there is still some room for im-provement Firstly our matching degree will be more op-timistic than the actual situation because we ignore the factthat drivers will selectively accept orders in real life Sec-ondly in ourmultiagents simulation maybe we can considerdiversity in individual behaviors to offer a better charac-terization of collective behaviors
Data Availability
e data used to support the findings of this study areavailable from the corresponding author upon request
Conflicts of Interest
e authors declare no conflicts of interest
Acknowledgments
is work was supported by the National Natural ScienceFoundation of China (Grant nos 61573065 and 71731002)
References
[1] GTPR Institute Guangzhou Transport Key Figures GTPRInstitute Gangzhou China 2018
[2] N Wu S Zhao and Q Zhang ldquoA study on the determinantsof private car ownership in China findings from the paneldatardquo Transportation Research Part A Policy and Practicevol 85 pp 186ndash195 2016
[3] J Yang J Dong Z Lin and L Hu ldquoPredicting market po-tential and environmental benefits of deploying electric taxisin Nanjing Chinardquo Transportation Research Part D Transportand Environment vol 49 pp 68ndash81 2016
[4] K I Wong S C Wong H Yang and J H Wu ldquoModelingurban taxi services with multiple user classes and vehiclemodesrdquo Transportation Research Part B Methodologicalvol 42 no 10 pp 985ndash1007 2008
[5] X Liang X Zheng W Lv T Zhu and K Xu ldquoe scaling ofhuman mobility by taxis is exponentialrdquo Physica A Statistical
3000
29001000
900400
300
200
100
00 20 40 60 80 100
Time
Num
ber
PassengerDriver
(c)
3000
2900
1000
900400
300
200
100
00 20 40 60 80 100
Time
Num
ber
PassengerDriver
(d)
Figure 9 e Fermi learning results ere are totally 3000 drivers and 1000 passengers in the systems (a c) λ 1 (b d) λ 5 eprobability of taking a taxi and waiting around hotspots for (a) and (b) at the initial state is half and for (c) and (d) it is 1
10 Complexity
Mechanics and Its Applications vol 391 no 5 pp 2135ndash21442012
[6] W Wang L Pan N Yuan S Zhang and D Liu ldquoA com-parative analysis of intra-city human mobility by taxirdquoPhysica A Statistical Mechanics and Its Applications vol 420pp 134ndash147 2015
[7] Z Christoforou C Milioti D Perperidou andM G Karlaftis ldquoInvestigation of taxi travel time character-isticsrdquo in Proceedings of the 2011 Transportation ResearchBoard 90th Annual Meeting Washington DC USA 2011
[8] Y Lin W Li F Qiu and H Xu ldquoResearch on optimization ofvehicle routing problem for ride-sharing taxirdquo Procedia -Social and Behavioral Sciences vol 43 pp 494ndash502 2012
[9] P-Y Chen J-W Liu and W-T Chen ldquoA fuel-saving andpollution-reducing dynamic taxi-sharing protocol in vanetsrdquoin Proceedings of the 2010 IEEE 72nd Vehicular TechnologyConference-Fall pp 1ndash5 Ottawa Canada 2010
[10] F Stodolsky L Gaines and A Vyas ldquoAnalysis of technologyoptions to reduce the fuel consumption of idling trucksrdquoTechnical report Argonne National Laboratory Lemont ILUSA 2000
[11] P S Castro D Zhang and S Li ldquoUrban traffic modelling andprediction using large scale taxi GPS tracesrdquo in Proceedings ofthe 2012 International Conference on Pervasive Computingpp 57ndash72 Newcastle UK 2012
[12] J M Viegas ldquoMaking urban road pricing acceptable andeffective searching for quality and equity in urban mobilityrdquoTransport Policy vol 8 no 4 pp 289ndash294 2001
[13] Y Han and W Wang ldquoOn the spatial and temporal distri-bution of resident trip based on taxi GPS datardquo Geomatics ampSpatial Information Technology vol 2 pp 87ndash89 2018
[14] P Calegari F Guidec P Kuonen and F Nielsen ldquoCombi-natorial optimization algorithms for radio network planningrdquoeoretical Computer Science vol 263 no 1-2 pp 235ndash2452001
[15] R Niedermeier ldquoInvitation to fixed-parameter algorithmsrdquoOxford Lecture Series in Mathematics and Its Applicationsvol 31 Oxford University Press Oxford UK 2006
[16] H W Kuhn ldquoe Hungarian method for the assignmentproblemrdquo Naval Research Logistics Quarterly vol 2 no 1-2pp 83ndash97 1955
[17] H W Kuhn ldquoVariants of the Hungarian method for as-signment problemsrdquo Naval Research Logistics Quarterlyvol 3 no 4 pp 253ndash258 1956
[18] C Berge ldquoTwo theorems in graph theoryrdquo Proceedings of theNational Academy of Sciences vol 43 no 9 pp 842ndash844 1957
[19] I Hussain L Knapen T Bellemans D Janssens and GWetsldquoAn agent-based negotiation model for carpooling a casestudy for flanders (Belgium)rdquo in Proceedings of the 94thTransportation Research Board Meeting WWashington DCUSA 2015
[20] N Ronald T Arentze and H Timmermans ldquoAn agent-basedframework for modelling social influence on travel behav-iourrdquo in Proceedings of the 18th World IMACS Congress andMODSIM09 International Congress on Modelling and Simu-lation pp 2955ndash2961 Canberra Australia 2009
[21] X Sun X Han J-Z Bao et al ldquoDecision dynamics of de-parture times experiments and modelingrdquo Physica A Sta-tistical Mechanics and Its Applications vol 483 pp 74ndash822017
[22] F Golpayegani et al ldquoCo-ride collaborative preference-basedtaxi-sharing and taxi-dispatchrdquo in Proceedings of the 2018IEEE 30th International Conference on Tools with ArtificialIntelligence (ICTAI) pp 864ndash871 Volos Greece 2018
[23] K T Seow N H Dang and D-H Lee ldquoA collaborativemultiagent taxi-dispatch systemrdquo IEEE Transactions on Au-tomation Science and Engineering vol 7 no 3 pp 607ndash6162009
[24] R Selten T Chmura T Pitz S Kube and M SchreckenbergldquoCommuters route choice behaviourrdquo Games and EconomicBehavior vol 58 no 2 pp 394ndash406 2007
[25] T E Daniel E J Gisches and A Rapoport ldquoDeparture timesin y-shaped traffic networks with multiple bottlenecksrdquoAmerican Economic Review vol 99 no 5 pp 2149ndash21762009
[26] A Tversky and D Kahneman ldquoProspect theory an analysis ofdecision under riskrdquo Econometrica vol 47 no 2 pp 263ndash2911979
[27] D Kahneman and A Tversky ldquoProspect theory an analysis ofdecision under riskrdquo in Handbook of the Fundamentals ofFinancial Decision Making Part I pp 99ndash127 World Sci-entific Singapore 2013
[28] A Karlstrom and J P Franklin ldquoBehavioral adjustments andequity effects of congestion pricing analysis of morningcommutes during the Stockholm trialrdquo Transportation Re-search Part A Policy and Practice vol 43 no 3 pp 283ndash2962009
[29] S Fujii and R Kitamura ldquoDriversrsquo mental representation oftravel time and departure time choice in uncertain trafficnetwork conditionsrdquo Networks and Spatial Economics vol 4no 3 pp 243ndash256 2004
[30] H-l Xu J Zhou and X-g Chen ldquoAnalysis and demon-stration of the travelerrsquos route choice behavior rule based onthe prospect theoryrdquo Journal of Transportation Systems En-gineering and Information Technology vol 6 2007
[31] M Perc and A Szolnoki ldquoCoevolutionary gamesmdasha minireviewrdquo BioSystems vol 99 no 2 pp 109ndash125 2010
[32] S Wasserman and K Faust Social Network Analysis Methodsand applications vol 8 Cambridge University Press Cam-bridge UK 1994
[33] G Ergun ldquoHuman sexual contact network as a bipartitegraphrdquo Physica A Statistical Mechanics and Its Applicationsvol 308 no 1ndash4 pp 483ndash488 2002
[34] P Zhang J Wang X Li M Li Z Di and Y Fan ldquoClusteringcoefficient and community structure of bipartite networksrdquoPhysica A Statistical Mechanics and Its Applications vol 387no 27 pp 6869ndash6875 2008
[35] T Zhou J Ren M Medo and Y-C Zhang ldquoBipartite net-work projection and personal recommendationrdquo PhysicalReview E vol 76 no 4 Article ID 046115 2007
[36] R-R Liu J-G Liu C-X Jia and B-H Wang ldquoPersonalrecommendation via unequal resource allocation on bipartitenetworksrdquo Physica A Statistical Mechanics and Its Applica-tions vol 389 no 16 pp 3282ndash3289 2010
[37] F Yu A Zeng S Gillard and M Medo ldquoNetwork-basedrecommendation algorithms a reviewrdquo Physica A StatisticalMechanics and Its Applications vol 452 pp 192ndash208 2016
[38] J Edmonds ldquoMaximummatching and a polyhedron with 01-verticesrdquo Journal of Research of the National Bureau ofStandards B vol 69 no 125ndash130 pp 55-56 1965
[39] R M Karp E Upfal and A Wigderson ldquoConstructing aperfect matching is in random ncrdquo Combinatorica vol 6no 1 pp 35ndash48 1986
[40] W B Arthur ldquoInductive reasoning and bounded rationalityrdquoe American Economic Review vol 84 no 2 pp 406ndash4111994
[41] W B Arthur ldquoComplexity and the economyrdquo Sciencevol 284 no 5411 pp 107ndash109 1999
Complexity 11
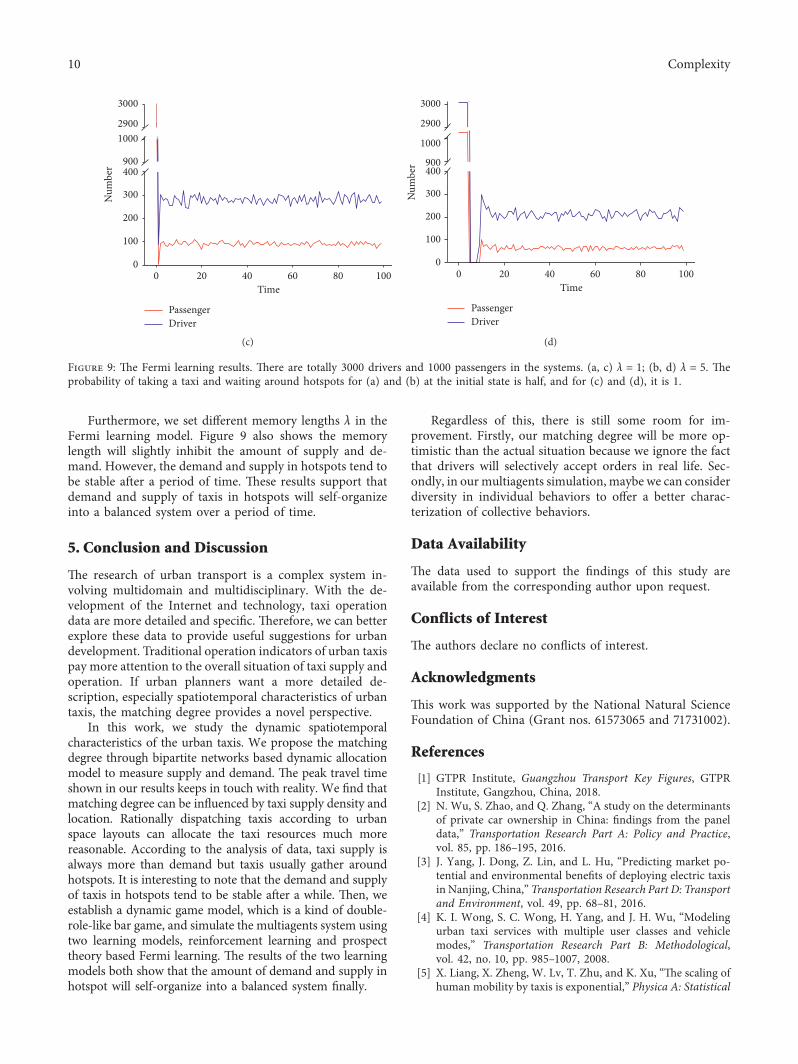
Related Documents