Spatio-temporal variations in deep-sea demersal communities off the Balearic Islands (western Mediterranean) Joan Moranta a, ⁎ , Antoni Quetglas a , Enric Massutí a , Beatriz Guijarro a , Manuel Hidalgo b , Paz Diaz a a IEO - Centre Oceanogràfic de les Balears, Moll de Ponent s/n, 07015 Palma de Mallorca, Spain b UIB - CSIC Institut Mediterrani d'Estudis Avançats, Miquel Marquès 21, 07190 Esporles, Spain Received 27 July 2006; received in revised form 15 January 2007; accepted 14 February 2007 Available online 31 December 2007 Abstract The spatial and temporal variations of deep-sea megafaunal assemblages from the western Mediterranean are analysed in the present paper. The assemblages from two locations of the Balearic Islands situated 120 km apart were compared using data collected seasonally on a bathymetric stratum covering the 150–750 m depth range during six bottom-trawl surveys. The assemblage structure, in terms of species composition, species dominance and population sizes, was differentially affected by the spatio-temporal variables analysed (depth, location and fishing period). Although depth was the main factor determining the assemblage composition, the differences obtained between the two locations were also relevant. On the upper slope these between-location differences in the dynamics of megafaunal assemblages were found to be related to the effect of fishing exploitation. Population size-based metrics and biomass spectra were good predictors of meso-scale fishing effects, and were mainly reflected by elasmobranchs and demersal teleosts. Nevertheless, the effects of fishing depended on the species considered. Two dominant large-sized fish species found on the upper slope in both localities, Galeus melastomus and Phycis blennoides, had higher biomass values associated with lower fishing effort. Although the mean body weight (MBW) of both species and also the mean maximum body weight (MMBW) of G. melastomus agreed with this pattern, the P. blennoides MMBW did not. This last case could be indicative of natural size-trends such as the bigger– deeper phenomenon which refers to the displacement of large individuals towards the deeper limit of their bathymetric distribution, beyond the maximum depth sampled in this study for this species. By contrast, the target species of the upper slope fishery, the red shrimp Aristeus antennatus, was not negatively affected by the direct impact of fishing activity and other environmental factors, such as the presence of specific water masses could also be important. © 2007 Elsevier B.V. All rights reserved. Keywords: Megafaunal communities; Demersal species; Spatial distribution; Fishing impact; Biomass spectra; Deep-sea; Western Mediterranean 1. Introduction The spatial variations of demersal communities have been extensively studied to establish general patterns in species distribution (e.g. Haedrich and Merrett, 1990; Koslow, 1993). In most cases, the vertical zonation, or Available online at www.sciencedirect.com Journal of Marine Systems 71 (2008) 346 – 366 www.elsevier.com/locate/jmarsys ⁎ Corresponding author. E-mail address: [email protected] (J. Moranta). 0924-7963/$ - see front matter © 2007 Elsevier B.V. All rights reserved. doi:10.1016/j.jmarsys.2007.02.029

Welcome message from author
This document is posted to help you gain knowledge. Please leave a comment to let me know what you think about it! Share it to your friends and learn new things together.
Transcript
Available online at www.sciencedirect.com
s 71 (2008) 346–366www.elsevier.com/locate/jmarsys
Journal of Marine System
Spatio-temporal variations in deep-sea demersal communities off theBalearic Islands (western Mediterranean)
Joan Moranta a,⁎, Antoni Quetglas a, Enric Massutí a, Beatriz Guijarro a,Manuel Hidalgo b, Paz Diaz a
a IEO - Centre Oceanogràfic de les Balears, Moll de Ponent s/n, 07015 Palma de Mallorca, Spainb UIB - CSIC Institut Mediterrani d'Estudis Avançats, Miquel Marquès 21, 07190 Esporles, Spain
Received 27 July 2006; received in revised form 15 January 2007; accepted 14 February 2007Available online 31 December 2007
Abstract
The spatial and temporal variations of deep-sea megafaunal assemblages from the western Mediterranean are analysed in thepresent paper. The assemblages from two locations of the Balearic Islands situated 120 km apart were compared using data collectedseasonally on a bathymetric stratum covering the 150–750 m depth range during six bottom-trawl surveys. The assemblage structure,in terms of species composition, species dominance and population sizes, was differentially affected by the spatio-temporal variablesanalysed (depth, location and fishing period). Although depth was the main factor determining the assemblage composition, thedifferences obtained between the two locations were also relevant. On the upper slope these between-location differences in thedynamics of megafaunal assemblages were found to be related to the effect of fishing exploitation. Population size-based metrics andbiomass spectra were good predictors of meso-scale fishing effects, and were mainly reflected by elasmobranchs and demersalteleosts. Nevertheless, the effects of fishing depended on the species considered. Two dominant large-sized fish species found on theupper slope in both localities, Galeus melastomus and Phycis blennoides, had higher biomass values associated with lower fishingeffort. Although the mean bodyweight (MBW) of both species and also the meanmaximum bodyweight (MMBW) ofG. melastomusagreed with this pattern, the P. blennoidesMMBWdid not. This last case could be indicative of natural size-trends such as the bigger–deeper phenomenon which refers to the displacement of large individuals towards the deeper limit of their bathymetric distribution,beyond the maximum depth sampled in this study for this species. By contrast, the target species of the upper slope fishery, the redshrimp Aristeus antennatus,was not negatively affected by the direct impact of fishing activity and other environmental factors, suchas the presence of specific water masses could also be important.© 2007 Elsevier B.V. All rights reserved.
Keywords: Megafaunal communities; Demersal species; Spatial distribution; Fishing impact; Biomass spectra; Deep-sea; Western Mediterranean
⁎ Corresponding author.E-mail address: [email protected] (J. Moranta).
0924-7963/$ - see front matter © 2007 Elsevier B.V. All rights reserved.doi:10.1016/j.jmarsys.2007.02.029
1. Introduction
The spatial variations of demersal communities havebeen extensively studied to establish general patterns inspecies distribution (e.g. Haedrich and Merrett, 1990;Koslow, 1993). In most cases, the vertical zonation, or
347J. Moranta et al. / Journal of Marine Systems 71 (2008) 346–366
bathymetric gradient, is considered the main factorresponsible for faunistic changes (e.g. Haedrich et al.,1975; Bianchi, 1992). However, depth is not a causativefactor and other factors, such as temperature, high pressureand limited food availability, have also been proposed ascausal factors (Carney, 2005).
The general conclusion that can be extracted from theavailable information on this topic (e.g. Haedrich andKrefft, 1978; Hecker, 1990; Bianchi, 1992; Smale et al.,1993; Koslow et al., 1994) is that faunistic associations aremost probably determined by a combination of bothabiotic (in particular the structure and type of the bottomand dynamics of the water masses) and biotic (competi-tion, food availability) factors. The horizontal distributionof deep-sea communities on a large scale, and the existenceof general geographical patterns in assemblage composi-tion also seem to be unclear (Haedrich and Merrett, 1990;Koslow, 1993; Haedrich, 1997). In the Mediterranean,studies of megafaunal assemblages have been carried outon exploited grounds of the continental shelf and upperslope (e.g. Tsimenides et al., 1991; D'Onghia et al., 1998;Tserpes et al., 1999; Ungaro et al., 1999; Demestre et al.,2000a; Colloca et al., 2003) and also on unexploitedgrounds of the middle and lower slope (e.g. Abelló andValladares, 1988;Cartes andSardà, 1992; Stefanescu et al.,1992; Cartes and Sardà, 1993; Stefanescu et al., 1993;Moranta et al., 1998; Company et al., 2004; D'Onghiaet al., 2004). However, most of these works are focussedon analysing depth related trends, whereas geographicaldistribution studies have so far received less attention(Abelló et al., 2002; Massutí et al., 2004; Gaertner et al.,2005).
Unlike spatially related studies, there is little informa-tion referring to temporal variations of the deep-seademersal communities. It is necessary to consider that,traditionally, the temporal stability of the oceanographicconditions in the deep-sea was considered a valid conceptfor most oceans (Tyler, 1988). This also applies to theMediterranean, which is characterised by a high degree ofenvironmental stability in both temperature and salinitybelow 200m depth (Hopkins, 2006). In this area, there arefewer studies carried out to analyse seasonal variations inmegafaunal communities (Sardà et al., 1994a; Maynouet al., 1996; Cartes, 1998; Ungaro et al., 1998; Maynouand Cartes, 2000; Kallianiotis et al., 2000; Madurell et al.,2004) than studies focussing on single species (e.g.Demestre and Abelló, 1993; Sardà et al., 1994b, Massutíet al., 1996a;Morales-Nin et al., 1996; Labropoulou et al.,1997; Matarrese et al., 1998; Recasens et al., 1998;D'Onghia et al., 1999; Maynou et al., 2003).
The effects of fishing exploitation on ecosystems arewidely described (e.g. Pauly et al., 1998; Tegner and
Dayton, 1999; Gislason and Sinclair, 2000). The impactof fishing on both continental shelf and deep-sea speciesand habitats has been extremely costly, not only due todrastic declines in the commercial stocks, but alsobecause of collateral damage to non-target species andhabitat destruction (e.g. Dayton et al., 1995; Goñi, 1998;Kaiser et al., 1999; Kaiser and De Groot, 2000). Thedeclining abundance, biomass and size, both of targetand non-target species due to fishing exploitation, is awell known phenomenon (e.g. Haedrich and Barnes,1997; Merrett and Haedrich, 1997; Philippart, 1998;Gislason et al., 2000). Community size-based metricshave been proved to be more sensitive than using targetspecies alone for detecting the effects of fishingexploitation on marine assemblages, since this approachtakes into account a broader range of impacts (Jennings2005, and references cited therein). In particular,analysing size-spectra has been suggested to be a usefultool because their slope changes consistently, over timeand space, with exploitation-mediated changes in thecommunity structure (e.g. Bianchi et al., 2000; Jenningset al., 2002; Daan et al., 2005; Graham et al., 2005, Pietand Jennings, 2005).
Mediterranean bottom trawl fisheries are multispecificfor certain target species due to their high commercialvalue (e.g. red mullet, hake, Norway lobster and redshrimp), and an exploitation pattern mainly based oncapturing young individuals (Caddy, 1993). Fleets arecharacterised by their versatility, which in many cases isdetermined by the specific dynamic of the resource. In thewestern Mediterranean, exploitation of demersalresources extents to 800 m depth, reaching 1000 mdepth in some northern areas. The present study wascarried out in exploited grounds of the Balearic Islands, anarea from the north-western Mediterranean where someprevious works have been done on both the megafaunalcommunities (Massutí et al., 1996b; Moranta et al., 2000;Quetglas et al., 2000; Massutí and Reñones, 2005) andpopulation dynamics of target species (Oliver, 1993;Reñones et al., 1995; Merella et al., 1998; Quetglas et al.,1998a,b; Carbonell et al., 1999).
The objective of this paper is to analyse the spatial andtemporal variations of deep-sea megafaunal assemblagesin two areas (separated by 120 km) off Mallorca (BalearicIslands, western Mediterranean). These two locations areinfluenced by different oceanographic and fishing exploi-tation conditions. In order to assess how these differentenvironmental and anthropogenic factors affect thedynamics of deep-sea megafaunal assemblages, ecologi-cal variables such as species-specific densities (abundanceand biomass), univariate community descriptors and size-based metrics were analysed.
348 J. Moranta et al. / Journal of Marine Systems 71 (2008) 346–366
2. Material and methods
2.1. Study area
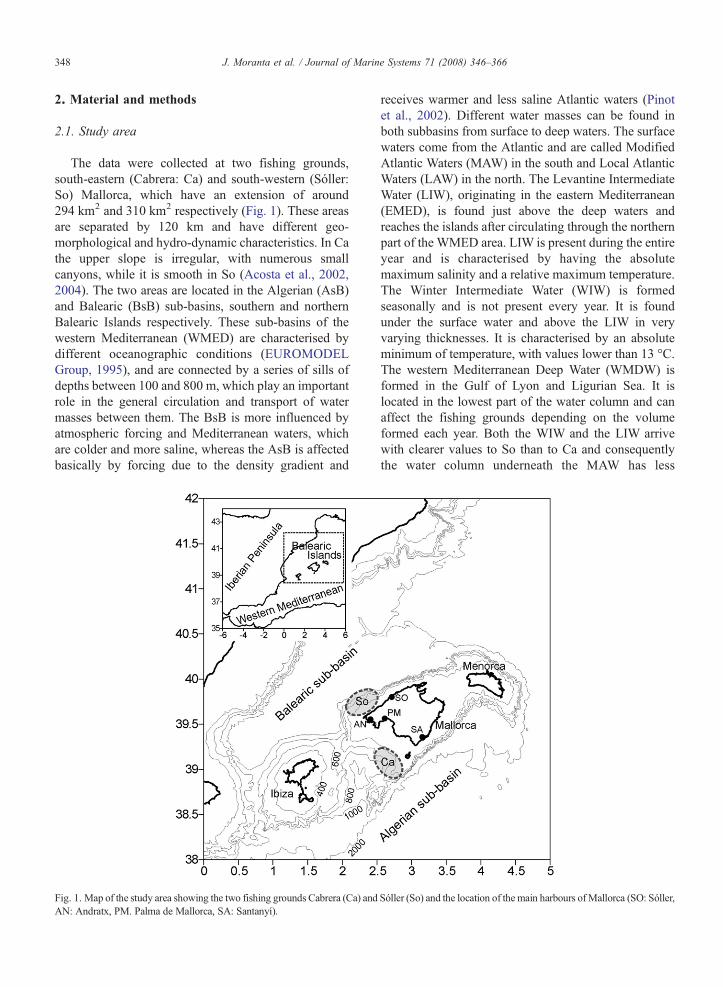
The data were collected at two fishing grounds,south-eastern (Cabrera: Ca) and south-western (Sóller:So) Mallorca, which have an extension of around294 km2 and 310 km2 respectively (Fig. 1). These areasare separated by 120 km and have different geo-morphological and hydro-dynamic characteristics. In Cathe upper slope is irregular, with numerous smallcanyons, while it is smooth in So (Acosta et al., 2002,2004). The two areas are located in the Algerian (AsB)and Balearic (BsB) sub-basins, southern and northernBalearic Islands respectively. These sub-basins of thewestern Mediterranean (WMED) are characterised bydifferent oceanographic conditions (EUROMODELGroup, 1995), and are connected by a series of sills ofdepths between 100 and 800 m, which play an importantrole in the general circulation and transport of watermasses between them. The BsB is more influenced byatmospheric forcing and Mediterranean waters, whichare colder and more saline, whereas the AsB is affectedbasically by forcing due to the density gradient and
Fig. 1. Map of the study area showing the two fishing grounds Cabrera (Ca) andAN: Andratx, PM. Palma de Mallorca, SA: Santanyí).
receives warmer and less saline Atlantic waters (Pinotet al., 2002). Different water masses can be found inboth subbasins from surface to deep waters. The surfacewaters come from the Atlantic and are called ModifiedAtlantic Waters (MAW) in the south and Local AtlanticWaters (LAW) in the north. The Levantine IntermediateWater (LIW), originating in the eastern Mediterranean(EMED), is found just above the deep waters andreaches the islands after circulating through the northernpart of the WMED area. LIW is present during the entireyear and is characterised by having the absolutemaximum salinity and a relative maximum temperature.The Winter Intermediate Water (WIW) is formedseasonally and is not present every year. It is foundunder the surface water and above the LIW in veryvarying thicknesses. It is characterised by an absoluteminimum of temperature, with values lower than 13 °C.The western Mediterranean Deep Water (WMDW) isformed in the Gulf of Lyon and Ligurian Sea. It islocated in the lowest part of the water column and canaffect the fishing grounds depending on the volumeformed each year. Both the WIW and the LIW arrivewith clearer values to So than to Ca and consequentlythe water column underneath the MAW has less
Sóller (So) and the location of the main harbours ofMallorca (SO: Sóller,
349J. Moranta et al. / Journal of Marine Systems 71 (2008) 346–366
variations at the AsB than at the BsB (López-Juradoet al., 2008-this issue).
2.2. Fishing activity
The trawl fishing fleet of Mallorca consists of 38boats. In the study area there are four harbours withtrawlers operating at Ca and So fishing grounds (Fig. 1).The largest harbour is Palma with 11 trawlers, followedbyAndratx with 9, Sóller with 6, and lastly Santanyí with5. The other 7 trawlers are in other harbours of Mallorcaand do not operate in the studied fishing grounds. On theshelf break and upper slope there are two main targetspecies: the European hake Merluccius merluccius,which is fished at the shelf break and the beginning ofthe slope between 120 and 350 m depth, and the redshrimp Aristeus antennatus, which is fished at the upperslope between 550 and 800 m depth. Nowadays, themain characteristics of the trawl fleet of Mallorca are thedisplacement of fishing towards greater depths and theconcentration of the fleet (which usually operates in Ca)at the So fishing ground during summer. The displace-ment of this fleet, which targets red shrimp, occurs eachyear. During the rest of the year, this species is fished atboth locations. To assess the fleet movement betweenboth locations, the fishing activity was monitored bymeans of log-books (during 2003 and 2004) filled out bysix commercial bottom otter trawlers, three from Palmaharbour and three from Sóller harbour. Each day theskipper recorded the position and depth during the hauland also the number of bottom trawlers operating in thesame zone where they were fishing, within a radius of12 miles, using the radar. The total fishing effort exertedin the two locations was calculated from the daily salesslips (note that each sales slip corresponds to one dailyfishing trip) of the commercial bottom trawlers, takinginto account the effort ratios obtained at the two locationsfrom the log-books.
2.3. Sampling
A total of 72 bottom trawls were carried out in sixoceanographic surveys during two consecutive years (2003and 2004) on board the commercial bottom trawler F/V‘‘Moralti Nou’’ (length 22m; 59 grt; nominal engine power365 hp). The surveys were carried out in August,September and December during 2003 and in February,April and June during 2004. In each fishing survey, 12hauls were carried out using a commercial ‘huelvano’-typetrawl (Guijarro andMassutí, 2006), with a 20mm diamondmesh codend. In each area, 6 hauls were made at around150, 250, 350, 550, 650 and 750 m depth. As the effect of
depth on megafaunal assemblages is well know (seeIntroduction), our sampling design was focused onidentifying between-location and between-survey differ-ences. For this reason, only one haul per depth interval wasperformed, assuming that the variability in the catch due tothe depth gradient could be removed from the analysis (seebelow). Each haul was tracked using GPS and the openingof the net was monitored using a SCANMAR system.Horizontal and vertical net openings were, on average,25 m and 1.8–2.1 m respectively. The towing speed variedbetween 2.4 and 3 knots and the trawling time variedbetween 45 and 60 min. These data were used to calculatethe exact swept area and to standardise the catch(abundance and biomass) to 1 km2. Total number andweight of all species captured were taken. The size of themost important species of fishes, crustaceans and cepha-lopods was also recorded.
2.4. Data procedure and statistical analysis
For species composition analyses (species-specificdensities), only those species with a density greater than0.09% in each location and strata were included in orderto reduce the variability in the species matrix due to thepresence of a lot of zero values. To detect zonationpatterns, cluster analysis was applied to the species-specific densities (response) matrix for both abundanceand biomass values. The response matrix is a matrixwith the species in the columns (i), the samples in therows (j) and each Xij value corresponding to the density(abundance or biomass) of the species i in the sample j.The Bray–Curtis similarity index was chosen as thesimilarity coefficient and Group Average was utilised asthe clustering algorithm (Clarke and Warwick, 1994).
Redundancy Analysis (RDA) was used to detectpossible variations in the environmental variables betweensurveys and locations. It was applied to the species-specific density matrix considering the entire bathymetricrange analysed and separately for each group resultingfrom the previous cluster analysis. The RDAs were usedbecause they link the species composition (response)matrix directly with the environmental (explanatory)matrix.RDAs aremore appropriate than othermultivariateanalyseswhen species turnover is not very large since theyassume that there is a short gradient when it is plausiblethat the abundance of each species is linearly dependent onenvironmental variables (ter Braak and Smilauer, 2002).In order to reduce the effect of depth, theRDAwas appliedseparately for each stratum resulting from cluster analysis.Two different models were tested on both abundance andbiomass data. These two models contained a singlecontinuous variable (depth) but two different categorical
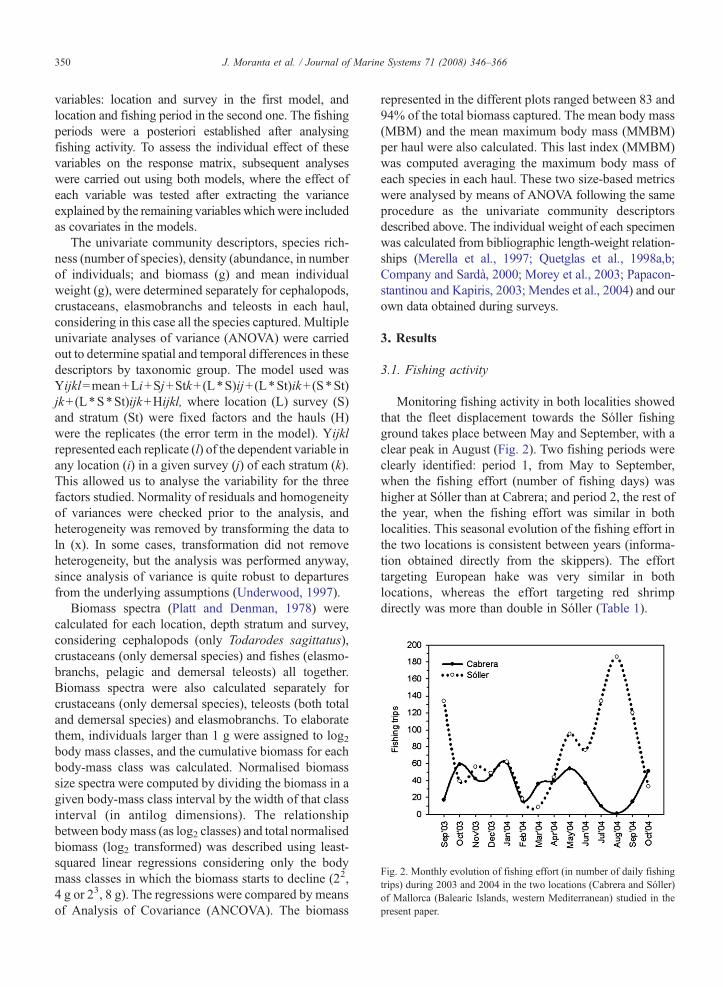
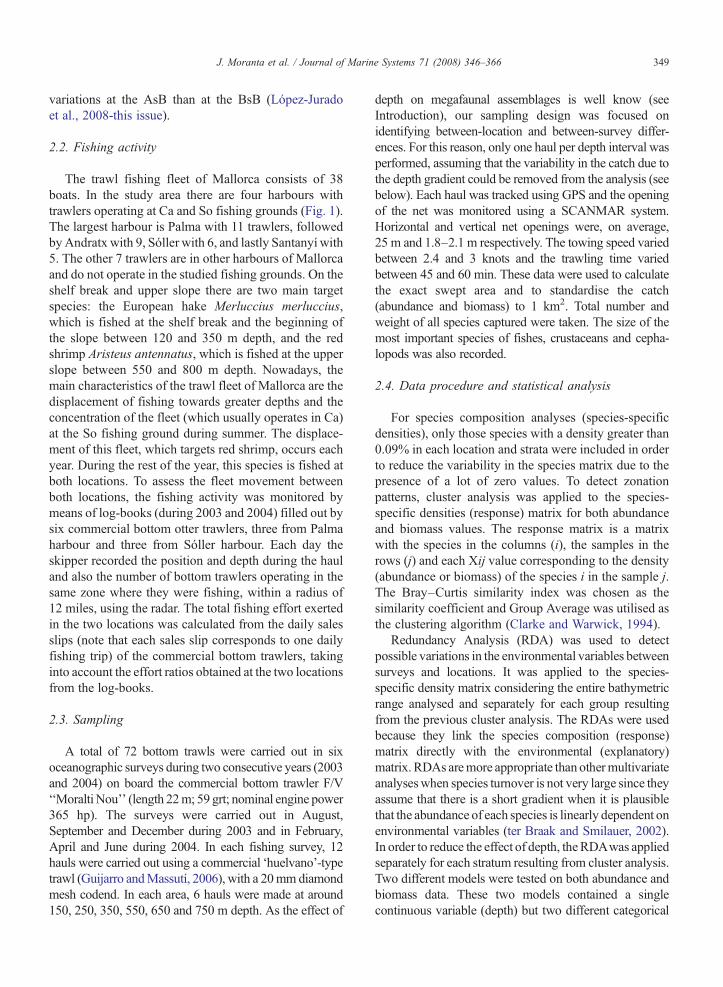
Fig. 2. Monthly evolution of fishing effort (in number of daily fishingtrips) during 2003 and 2004 in the two locations (Cabrera and Sóller)of Mallorca (Balearic Islands, western Mediterranean) studied in thepresent paper.
350 J. Moranta et al. / Journal of Marine Systems 71 (2008) 346–366
variables: location and survey in the first model, andlocation and fishing period in the second one. The fishingperiods were a posteriori established after analysingfishing activity. To assess the individual effect of thesevariables on the response matrix, subsequent analyseswere carried out using both models, where the effect ofeach variable was tested after extracting the varianceexplained by the remaining variables whichwere includedas covariates in the models.
The univariate community descriptors, species rich-ness (number of species), density (abundance, in numberof individuals; and biomass (g) and mean individualweight (g), were determined separately for cephalopods,crustaceans, elasmobranchs and teleosts in each haul,considering in this case all the species captured. Multipleunivariate analyses of variance (ANOVA) were carriedout to determine spatial and temporal differences in thesedescriptors by taxonomic group. The model used wasYijkl=mean+Li+Sj+Stk+(L⁎S)ij+(L⁎St)ik+(S⁎St)jk+(L⁎S⁎St)ijk+Hijkl, where location (L) survey (S)and stratum (St) were fixed factors and the hauls (H)were the replicates (the error term in the model). Yijklrepresented each replicate (l) of the dependent variable inany location (i) in a given survey (j) of each stratum (k).This allowed us to analyse the variability for the threefactors studied. Normality of residuals and homogeneityof variances were checked prior to the analysis, andheterogeneity was removed by transforming the data toln (x). In some cases, transformation did not removeheterogeneity, but the analysis was performed anyway,since analysis of variance is quite robust to departuresfrom the underlying assumptions (Underwood, 1997).
Biomass spectra (Platt and Denman, 1978) werecalculated for each location, depth stratum and survey,considering cephalopods (only Todarodes sagittatus),crustaceans (only demersal species) and fishes (elasmo-branchs, pelagic and demersal teleosts) all together.Biomass spectra were also calculated separately forcrustaceans (only demersal species), teleosts (both totaland demersal species) and elasmobranchs. To elaboratethem, individuals larger than 1 g were assigned to log2body mass classes, and the cumulative biomass for eachbody-mass class was calculated. Normalised biomasssize spectra were computed by dividing the biomass in agiven body-mass class interval by the width of that classinterval (in antilog dimensions). The relationshipbetween bodymass (as log2 classes) and total normalisedbiomass (log2 transformed) was described using least-squared linear regressions considering only the bodymass classes in which the biomass starts to decline (22,4 g or 23, 8 g). The regressions were compared by meansof Analysis of Covariance (ANCOVA). The biomass
represented in the different plots ranged between 83 and94% of the total biomass captured. The mean body mass(MBM) and the mean maximum body mass (MMBM)per haul were also calculated. This last index (MMBM)was computed averaging the maximum body mass ofeach species in each haul. These two size-based metricswere analysed by means of ANOVA following the sameprocedure as the univariate community descriptorsdescribed above. The individual weight of each specimenwas calculated from bibliographic length-weight relation-ships (Merella et al., 1997; Quetglas et al., 1998a,b;Company and Sardà, 2000; Morey et al., 2003; Papacon-stantinou and Kapiris, 2003; Mendes et al., 2004) and ourown data obtained during surveys.
3. Results
3.1. Fishing activity
Monitoring fishing activity in both localities showedthat the fleet displacement towards the Sóller fishingground takes place between May and September, with aclear peak in August (Fig. 2). Two fishing periods wereclearly identified: period 1, from May to September,when the fishing effort (number of fishing days) washigher at Sóller than at Cabrera; and period 2, the rest ofthe year, when the fishing effort was similar in bothlocalities. This seasonal evolution of the fishing effort inthe two locations is consistent between years (informa-tion obtained directly from the skippers). The efforttargeting European hake was very similar in bothlocations, whereas the effort targeting red shrimpdirectly was more than double in Sóller (Table 1).
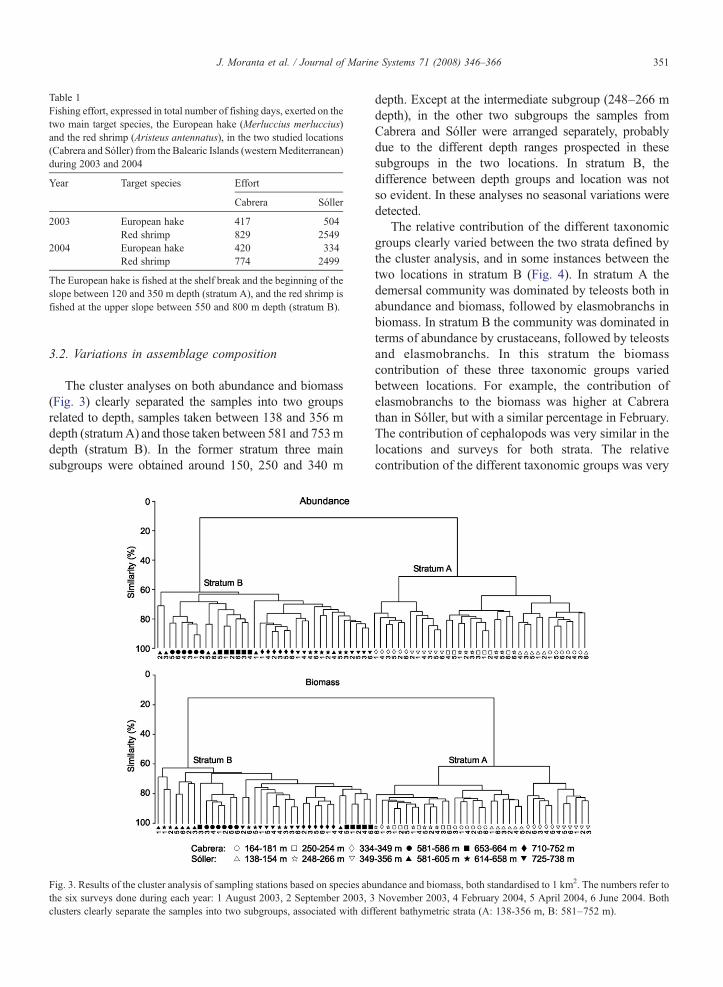
Table 1Fishing effort, expressed in total number of fishing days, exerted on thetwo main target species, the European hake (Merluccius merluccius)and the red shrimp (Aristeus antennatus), in the two studied locations(Cabrera and Sóller) from the Balearic Islands (westernMediterranean)during 2003 and 2004
Year Target species Effort
Cabrera Sóller
2003 European hake 417 504Red shrimp 829 2549
2004 European hake 420 334Red shrimp 774 2499
The European hake is fished at the shelf break and the beginning of theslope between 120 and 350 m depth (stratum A), and the red shrimp isfished at the upper slope between 550 and 800 m depth (stratum B).
351J. Moranta et al. / Journal of Marine Systems 71 (2008) 346–366
3.2. Variations in assemblage composition
The cluster analyses on both abundance and biomass(Fig. 3) clearly separated the samples into two groupsrelated to depth, samples taken between 138 and 356 mdepth (stratumA) and those taken between 581 and 753mdepth (stratum B). In the former stratum three mainsubgroups were obtained around 150, 250 and 340 m
Fig. 3. Results of the cluster analysis of sampling stations based on species abthe six surveys done during each year: 1 August 2003, 2 September 2003, 3clusters clearly separate the samples into two subgroups, associated with dif
depth. Except at the intermediate subgroup (248–266 mdepth), in the other two subgroups the samples fromCabrera and Sóller were arranged separately, probablydue to the different depth ranges prospected in thesesubgroups in the two locations. In stratum B, thedifference between depth groups and location was notso evident. In these analyses no seasonal variations weredetected.
The relative contribution of the different taxonomicgroups clearly varied between the two strata defined bythe cluster analysis, and in some instances between thetwo locations in stratum B (Fig. 4). In stratum A thedemersal community was dominated by teleosts both inabundance and biomass, followed by elasmobranchs inbiomass. In stratum B the community was dominated interms of abundance by crustaceans, followed by teleostsand elasmobranchs. In this stratum the biomasscontribution of these three taxonomic groups variedbetween locations. For example, the contribution ofelasmobranchs to the biomass was higher at Cabrerathan in Sóller, but with a similar percentage in February.The contribution of cephalopods was very similar in thelocations and surveys for both strata. The relativecontribution of the different taxonomic groups was very
undance and biomass, both standardised to 1 km2. The numbers refer toNovember 2003, 4 February 2004, 5 April 2004, 6 June 2004. Both
ferent bathymetric strata (A: 138-356 m, B: 581–752 m).
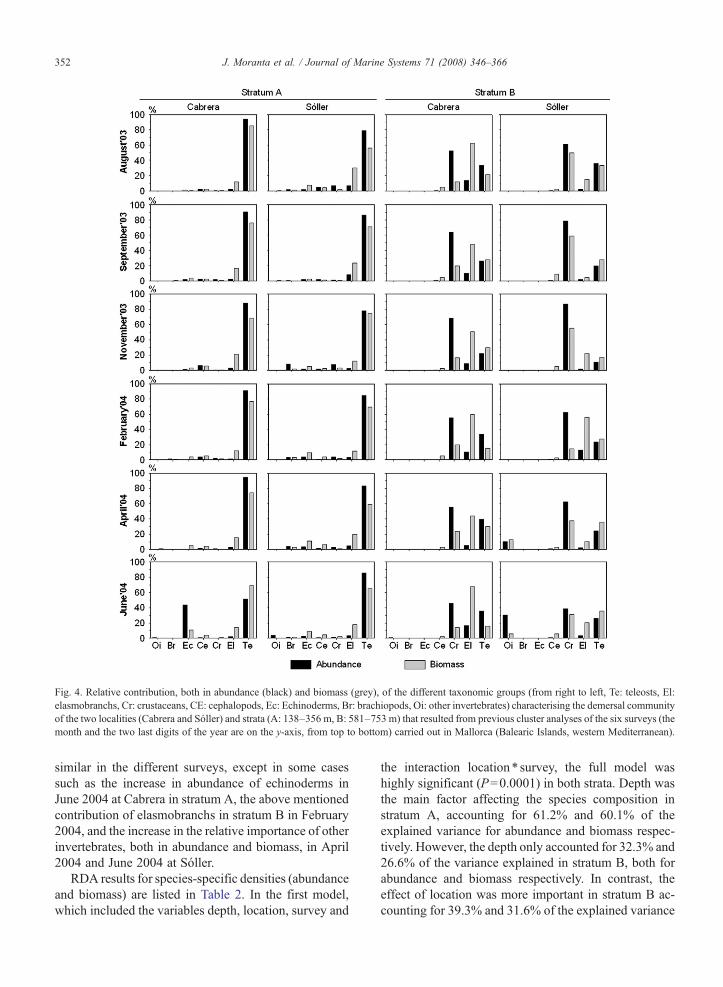
Fig. 4. Relative contribution, both in abundance (black) and biomass (grey), of the different taxonomic groups (from right to left, Te: teleosts, El:elasmobranchs, Cr: crustaceans, CE: cephalopods, Ec: Echinoderms, Br: brachiopods, Oi: other invertebrates) characterising the demersal communityof the two localities (Cabrera and Sóller) and strata (A: 138–356 m, B: 581–753 m) that resulted from previous cluster analyses of the six surveys (themonth and the two last digits of the year are on the y-axis, from top to bottom) carried out in Mallorca (Balearic Islands, western Mediterranean).
352 J. Moranta et al. / Journal of Marine Systems 71 (2008) 346–366
similar in the different surveys, except in some casessuch as the increase in abundance of echinoderms inJune 2004 at Cabrera in stratum A, the above mentionedcontribution of elasmobranchs in stratum B in February2004, and the increase in the relative importance of otherinvertebrates, both in abundance and biomass, in April2004 and June 2004 at Sóller.
RDA results for species-specific densities (abundanceand biomass) are listed in Table 2. In the first model,which included the variables depth, location, survey and
the interaction location⁎ survey, the full model washighly significant (P=0.0001) in both strata. Depth wasthe main factor affecting the species composition instratum A, accounting for 61.2% and 60.1% of theexplained variance for abundance and biomass respec-tively. However, the depth only accounted for 32.3% and26.6% of the variance explained in stratum B, both forabundance and biomass respectively. In contrast, theeffect of location was more important in stratum B ac-counting for 39.3% and 31.6% of the explained variance
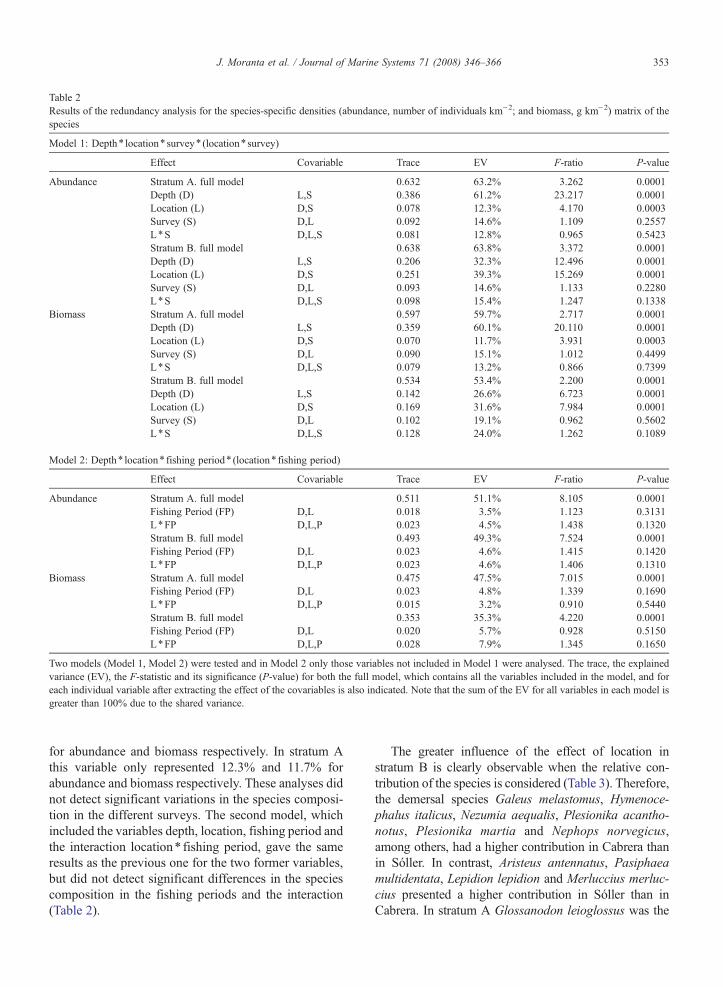
Table 2Results of the redundancy analysis for the species-specific densities (abundance, number of individuals km−2; and biomass, g km−2) matrix of thespecies
Model 1: Depth⁎ location⁎ survey⁎ (location⁎ survey)
Effect Covariable Trace EV F-ratio P-value
Abundance Stratum A. full model 0.632 63.2% 3.262 0.0001Depth (D) L,S 0.386 61.2% 23.217 0.0001Location (L) D,S 0.078 12.3% 4.170 0.0003Survey (S) D,L 0.092 14.6% 1.109 0.2557L⁎S D,L,S 0.081 12.8% 0.965 0.5423Stratum B. full model 0.638 63.8% 3.372 0.0001Depth (D) L,S 0.206 32.3% 12.496 0.0001Location (L) D,S 0.251 39.3% 15.269 0.0001Survey (S) D,L 0.093 14.6% 1.133 0.2280L⁎S D,L,S 0.098 15.4% 1.247 0.1338
Biomass Stratum A. full model 0.597 59.7% 2.717 0.0001Depth (D) L,S 0.359 60.1% 20.110 0.0001Location (L) D,S 0.070 11.7% 3.931 0.0003Survey (S) D,L 0.090 15.1% 1.012 0.4499L⁎S D,L,S 0.079 13.2% 0.866 0.7399Stratum B. full model 0.534 53.4% 2.200 0.0001Depth (D) L,S 0.142 26.6% 6.723 0.0001Location (L) D,S 0.169 31.6% 7.984 0.0001Survey (S) D,L 0.102 19.1% 0.962 0.5602L⁎S D,L,S 0.128 24.0% 1.262 0.1089
Model 2: Depth⁎ location⁎ fishing period⁎ (location⁎ fishing period)
Effect Covariable Trace EV F-ratio P-value
Abundance Stratum A. full model 0.511 51.1% 8.105 0.0001Fishing Period (FP) D,L 0.018 3.5% 1.123 0.3131L⁎FP D,L,P 0.023 4.5% 1.438 0.1320Stratum B. full model 0.493 49.3% 7.524 0.0001Fishing Period (FP) D,L 0.023 4.6% 1.415 0.1420L⁎FP D,L,P 0.023 4.6% 1.406 0.1310
Biomass Stratum A. full model 0.475 47.5% 7.015 0.0001Fishing Period (FP) D,L 0.023 4.8% 1.339 0.1690L⁎FP D,L,P 0.015 3.2% 0.910 0.5440Stratum B. full model 0.353 35.3% 4.220 0.0001Fishing Period (FP) D,L 0.020 5.7% 0.928 0.5150L⁎FP D,L,P 0.028 7.9% 1.345 0.1650
Two models (Model 1, Model 2) were tested and in Model 2 only those variables not included in Model 1 were analysed. The trace, the explainedvariance (EV), the F-statistic and its significance (P-value) for both the full model, which contains all the variables included in the model, and foreach individual variable after extracting the effect of the covariables is also indicated. Note that the sum of the EV for all variables in each model isgreater than 100% due to the shared variance.
353J. Moranta et al. / Journal of Marine Systems 71 (2008) 346–366
for abundance and biomass respectively. In stratum Athis variable only represented 12.3% and 11.7% forabundance and biomass respectively. These analyses didnot detect significant variations in the species composi-tion in the different surveys. The second model, whichincluded the variables depth, location, fishing period andthe interaction location⁎ fishing period, gave the sameresults as the previous one for the two former variables,but did not detect significant differences in the speciescomposition in the fishing periods and the interaction(Table 2).
The greater influence of the effect of location instratum B is clearly observable when the relative con-tribution of the species is considered (Table 3). Therefore,the demersal species Galeus melastomus, Hymenoce-phalus italicus, Nezumia aequalis, Plesionika acantho-notus, Plesionika martia and Nephops norvegicus,among others, had a higher contribution in Cabrera thanin Sóller. In contrast, Aristeus antennatus, Pasiphaeamultidentata, Lepidion lepidion and Merluccius merluc-cius presented a higher contribution in Sóller than inCabrera. In stratum A Glossanodon leioglossus was the
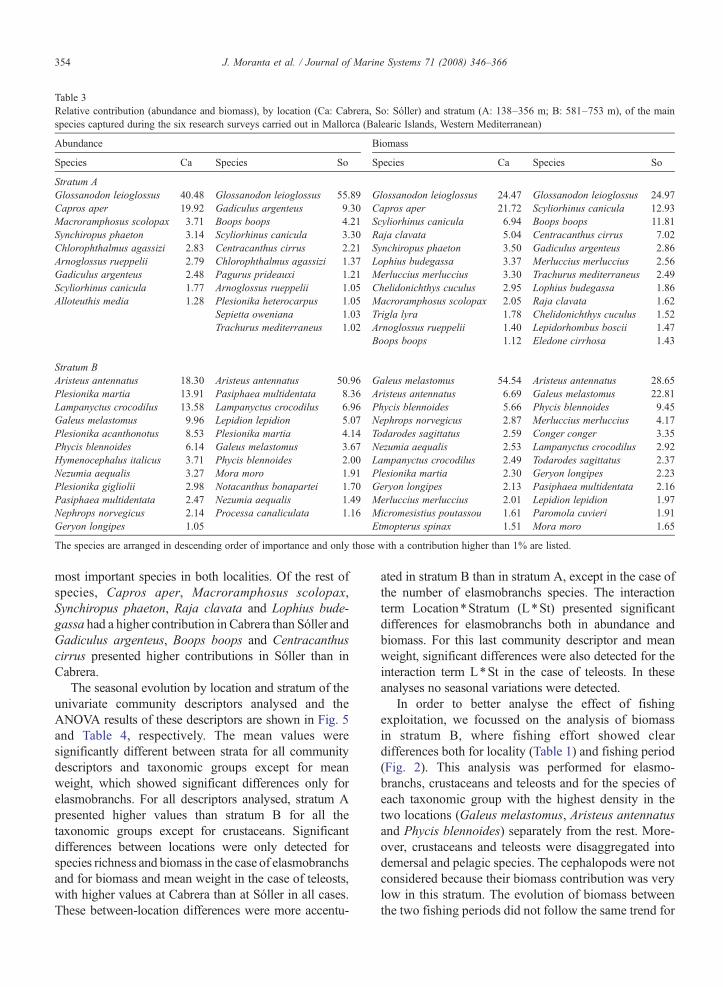
Table 3Relative contribution (abundance and biomass), by location (Ca: Cabrera, So: Sóller) and stratum (A: 138–356 m; B: 581–753 m), of the mainspecies captured during the six research surveys carried out in Mallorca (Balearic Islands, Western Mediterranean)
Abundance Biomass
Species Ca Species So Species Ca Species So
Stratum AGlossanodon leioglossus 40.48 Glossanodon leioglossus 55.89 Glossanodon leioglossus 24.47 Glossanodon leioglossus 24.97Capros aper 19.92 Gadiculus argenteus 9.30 Capros aper 21.72 Scyliorhinus canicula 12.93Macroramphosus scolopax 3.71 Boops boops 4.21 Scyliorhinus canicula 6.94 Boops boops 11.81Synchiropus phaeton 3.14 Scyliorhinus canicula 3.30 Raja clavata 5.04 Centracanthus cirrus 7.02Chlorophthalmus agassizi 2.83 Centracanthus cirrus 2.21 Synchiropus phaeton 3.50 Gadiculus argenteus 2.86Arnoglossus rueppelii 2.79 Chlorophthalmus agassizi 1.37 Lophius budegassa 3.37 Merluccius merluccius 2.56Gadiculus argenteus 2.48 Pagurus prideauxi 1.21 Merluccius merluccius 3.30 Trachurus mediterraneus 2.49Scyliorhinus canicula 1.77 Arnoglossus rueppelii 1.05 Chelidonichthys cuculus 2.95 Lophius budegassa 1.86Alloteuthis media 1.28 Plesionika heterocarpus 1.05 Macroramphosus scolopax 2.05 Raja clavata 1.62
Sepietta oweniana 1.03 Trigla lyra 1.78 Chelidonichthys cuculus 1.52Trachurus mediterraneus 1.02 Arnoglossus rueppelii 1.40 Lepidorhombus boscii 1.47
Boops boops 1.12 Eledone cirrhosa 1.43
Stratum BAristeus antennatus 18.30 Aristeus antennatus 50.96 Galeus melastomus 54.54 Aristeus antennatus 28.65Plesionika martia 13.91 Pasiphaea multidentata 8.36 Aristeus antennatus 6.69 Galeus melastomus 22.81Lampanyctus crocodilus 13.58 Lampanyctus crocodilus 6.96 Phycis blennoides 5.66 Phycis blennoides 9.45Galeus melastomus 9.96 Lepidion lepidion 5.07 Nephrops norvegicus 2.87 Merluccius merluccius 4.17Plesionika acanthonotus 8.53 Plesionika martia 4.14 Todarodes sagittatus 2.59 Conger conger 3.35Phycis blennoides 6.14 Galeus melastomus 3.67 Nezumia aequalis 2.53 Lampanyctus crocodilus 2.92Hymenocephalus italicus 3.71 Phycis blennoides 2.00 Lampanyctus crocodilus 2.49 Todarodes sagittatus 2.37Nezumia aequalis 3.27 Mora moro 1.91 Plesionika martia 2.30 Geryon longipes 2.23Plesionika gigliolii 2.98 Notacanthus bonapartei 1.70 Geryon longipes 2.13 Pasiphaea multidentata 2.16Pasiphaea multidentata 2.47 Nezumia aequalis 1.49 Merluccius merluccius 2.01 Lepidion lepidion 1.97Nephrops norvegicus 2.14 Processa canaliculata 1.16 Micromesistius poutassou 1.61 Paromola cuvieri 1.91Geryon longipes 1.05 Etmopterus spinax 1.51 Mora moro 1.65
The species are arranged in descending order of importance and only those with a contribution higher than 1% are listed.
354 J. Moranta et al. / Journal of Marine Systems 71 (2008) 346–366
most important species in both localities. Of the rest ofspecies, Capros aper, Macroramphosus scolopax,Synchiropus phaeton, Raja clavata and Lophius bude-gassa had a higher contribution in Cabrera than Sóller andGadiculus argenteus, Boops boops and Centracanthuscirrus presented higher contributions in Sóller than inCabrera.
The seasonal evolution by location and stratum of theunivariate community descriptors analysed and theANOVA results of these descriptors are shown in Fig. 5and Table 4, respectively. The mean values weresignificantly different between strata for all communitydescriptors and taxonomic groups except for meanweight, which showed significant differences only forelasmobranchs. For all descriptors analysed, stratum Apresented higher values than stratum B for all thetaxonomic groups except for crustaceans. Significantdifferences between locations were only detected forspecies richness and biomass in the case of elasmobranchsand for biomass and mean weight in the case of teleosts,with higher values at Cabrera than at Sóller in all cases.These between-location differences were more accentu-
ated in stratum B than in stratum A, except in the case ofthe number of elasmobranchs species. The interactionterm Location⁎Stratum (L⁎St) presented significantdifferences for elasmobranchs both in abundance andbiomass. For this last community descriptor and meanweight, significant differences were also detected for theinteraction term L⁎St in the case of teleosts. In theseanalyses no seasonal variations were detected.
In order to better analyse the effect of fishingexploitation, we focussed on the analysis of biomassin stratum B, where fishing effort showed cleardifferences both for locality (Table 1) and fishing period(Fig. 2). This analysis was performed for elasmo-branchs, crustaceans and teleosts and for the species ofeach taxonomic group with the highest density in thetwo locations (Galeus melastomus, Aristeus antennatusand Phycis blennoides) separately from the rest. More-over, crustaceans and teleosts were disaggregated intodemersal and pelagic species. The cephalopods were notconsidered because their biomass contribution was verylow in this stratum. The evolution of biomass betweenthe two fishing periods did not follow the same trend for
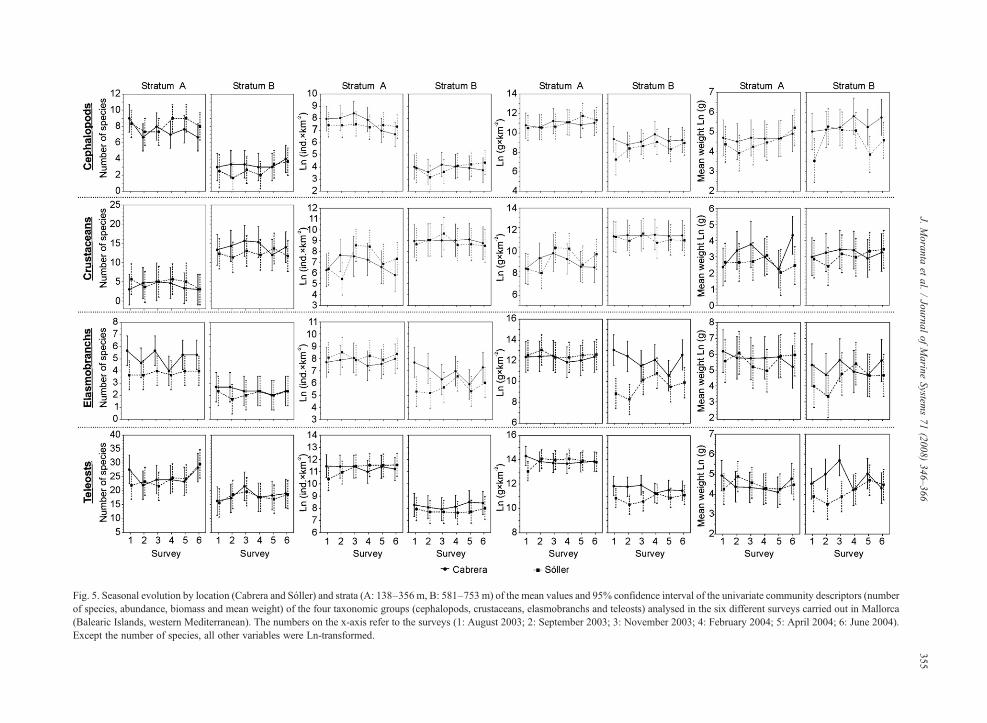
Fig. 5. Seasonal evolution by location (Cabrera and Sóller) and strata (A: 138–356 m, B: 581–753 m) of the mean values and 95% confidence interval of the univariate community descriptors (numberof species, abundance, biomass and mean weight) of the four taxonomic groups (cephalopods, crustaceans, elasmobranchs and teleosts) analysed in the six different surveys carried out in Mallorca(Balearic Islands, western Mediterranean). The numbers on the x-axis refer to the surveys (1: August 2003; 2: September 2003; 3: November 2003; 4: February 2004; 5: April 2004; 6: June 2004).Except the number of species, all other variables were Ln-transformed.
355J.
Moranta
etal.
/Journal
ofMarine
Systems71
(2008)346–366
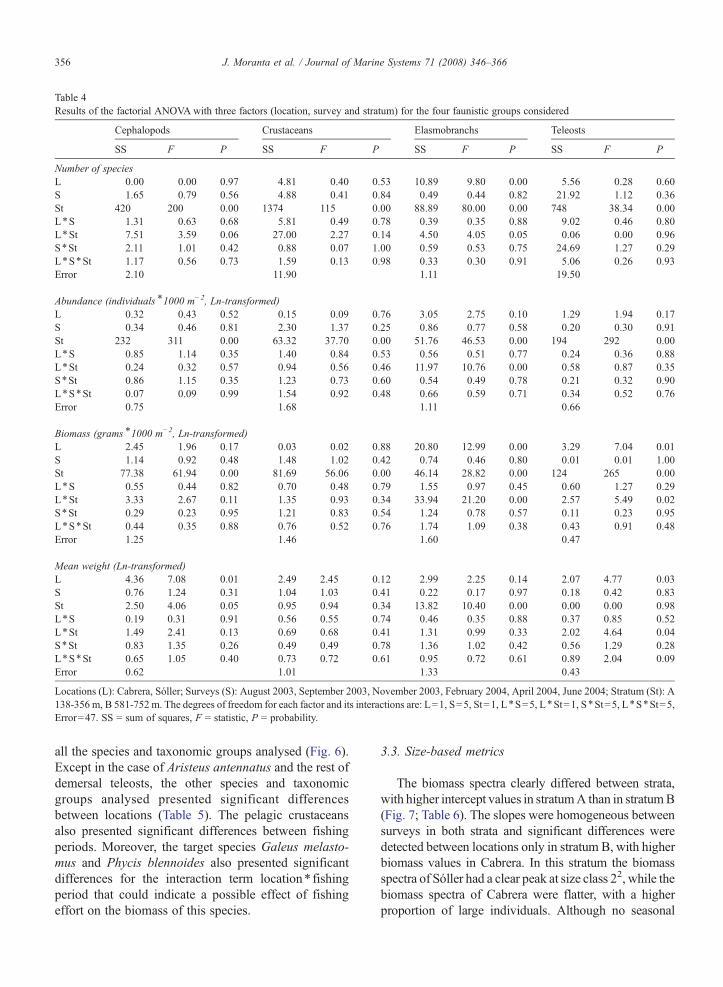
Table 4Results of the factorial ANOVA with three factors (location, survey and stratum) for the four faunistic groups considered
Cephalopods Crustaceans Elasmobranchs Teleosts
SS F P SS F P SS F P SS F P
Number of speciesL 0.00 0.00 0.97 4.81 0.40 0.53 10.89 9.80 0.00 5.56 0.28 0.60S 1.65 0.79 0.56 4.88 0.41 0.84 0.49 0.44 0.82 21.92 1.12 0.36St 420 200 0.00 1374 115 0.00 88.89 80.00 0.00 748 38.34 0.00L⁎S 1.31 0.63 0.68 5.81 0.49 0.78 0.39 0.35 0.88 9.02 0.46 0.80L⁎St 7.51 3.59 0.06 27.00 2.27 0.14 4.50 4.05 0.05 0.06 0.00 0.96S⁎St 2.11 1.01 0.42 0.88 0.07 1.00 0.59 0.53 0.75 24.69 1.27 0.29L⁎S⁎St 1.17 0.56 0.73 1.59 0.13 0.98 0.33 0.30 0.91 5.06 0.26 0.93Error 2.10 11.90 1.11 19.50
Abundance (individuals⁎1000 m−2, Ln-transformed)L 0.32 0.43 0.52 0.15 0.09 0.76 3.05 2.75 0.10 1.29 1.94 0.17S 0.34 0.46 0.81 2.30 1.37 0.25 0.86 0.77 0.58 0.20 0.30 0.91St 232 311 0.00 63.32 37.70 0.00 51.76 46.53 0.00 194 292 0.00L⁎S 0.85 1.14 0.35 1.40 0.84 0.53 0.56 0.51 0.77 0.24 0.36 0.88L⁎St 0.24 0.32 0.57 0.94 0.56 0.46 11.97 10.76 0.00 0.58 0.87 0.35S⁎St 0.86 1.15 0.35 1.23 0.73 0.60 0.54 0.49 0.78 0.21 0.32 0.90L⁎S⁎St 0.07 0.09 0.99 1.54 0.92 0.48 0.66 0.59 0.71 0.34 0.52 0.76Error 0.75 1.68 1.11 0.66
Biomass (grams⁎1000 m−2, Ln-transformed)L 2.45 1.96 0.17 0.03 0.02 0.88 20.80 12.99 0.00 3.29 7.04 0.01S 1.14 0.92 0.48 1.48 1.02 0.42 0.74 0.46 0.80 0.01 0.01 1.00St 77.38 61.94 0.00 81.69 56.06 0.00 46.14 28.82 0.00 124 265 0.00L⁎S 0.55 0.44 0.82 0.70 0.48 0.79 1.55 0.97 0.45 0.60 1.27 0.29L⁎St 3.33 2.67 0.11 1.35 0.93 0.34 33.94 21.20 0.00 2.57 5.49 0.02S⁎St 0.29 0.23 0.95 1.21 0.83 0.54 1.24 0.78 0.57 0.11 0.23 0.95L⁎S⁎St 0.44 0.35 0.88 0.76 0.52 0.76 1.74 1.09 0.38 0.43 0.91 0.48Error 1.25 1.46 1.60 0.47
Mean weight (Ln-transformed)L 4.36 7.08 0.01 2.49 2.45 0.12 2.99 2.25 0.14 2.07 4.77 0.03S 0.76 1.24 0.31 1.04 1.03 0.41 0.22 0.17 0.97 0.18 0.42 0.83St 2.50 4.06 0.05 0.95 0.94 0.34 13.82 10.40 0.00 0.00 0.00 0.98L⁎S 0.19 0.31 0.91 0.56 0.55 0.74 0.46 0.35 0.88 0.37 0.85 0.52L⁎St 1.49 2.41 0.13 0.69 0.68 0.41 1.31 0.99 0.33 2.02 4.64 0.04S⁎St 0.83 1.35 0.26 0.49 0.49 0.78 1.36 1.02 0.42 0.56 1.29 0.28L⁎S⁎St 0.65 1.05 0.40 0.73 0.72 0.61 0.95 0.72 0.61 0.89 2.04 0.09Error 0.62 1.01 1.33 0.43
Locations (L): Cabrera, Sóller; Surveys (S): August 2003, September 2003, November 2003, February 2004, April 2004, June 2004; Stratum (St): A138-356 m, B 581-752 m. The degrees of freedom for each factor and its interactions are: L=1, S=5, St=1, L⁎S=5, L⁎St=1, S⁎St=5, L⁎S⁎St=5,Error=47. SS = sum of squares, F = statistic, P = probability.
356 J. Moranta et al. / Journal of Marine Systems 71 (2008) 346–366
all the species and taxonomic groups analysed (Fig. 6).Except in the case of Aristeus antennatus and the rest ofdemersal teleosts, the other species and taxonomicgroups analysed presented significant differencesbetween locations (Table 5). The pelagic crustaceansalso presented significant differences between fishingperiods. Moreover, the target species Galeus melasto-mus and Phycis blennoides also presented significantdifferences for the interaction term location⁎ fishingperiod that could indicate a possible effect of fishingeffort on the biomass of this species.
3.3. Size-based metrics
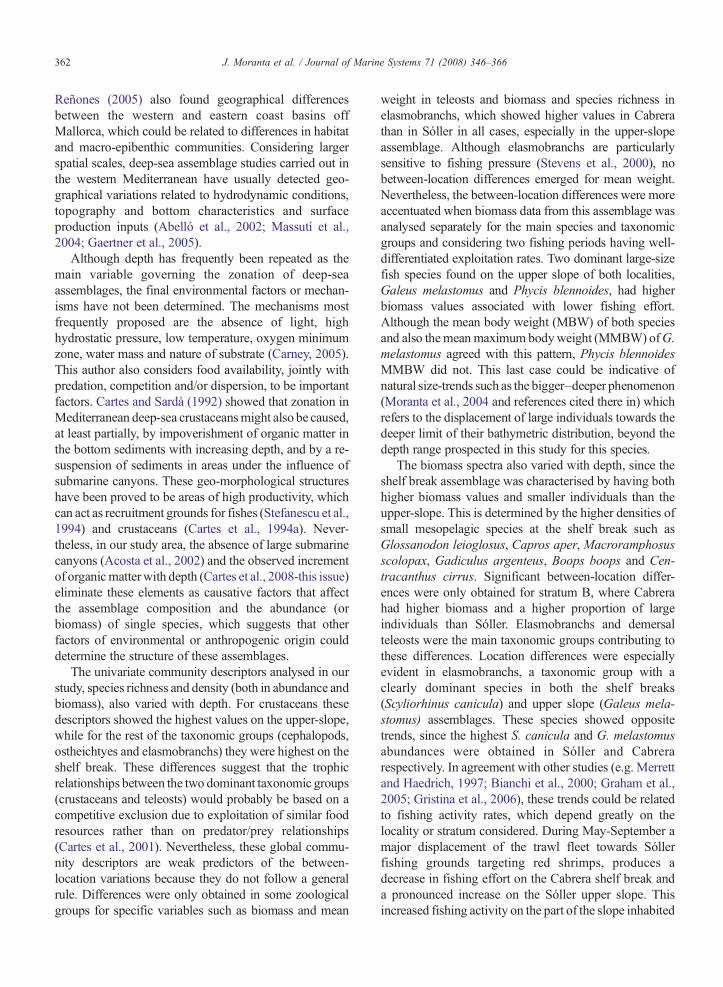
The biomass spectra clearly differed between strata,with higher intercept values in stratumA than in stratumB(Fig. 7; Table 6). The slopes were homogeneous betweensurveys in both strata and significant differences weredetected between locations only in stratum B, with higherbiomass values in Cabrera. In this stratum the biomassspectra of Sóller had a clear peak at size class 22, while thebiomass spectra of Cabrera were flatter, with a higherproportion of large individuals. Although no seasonal
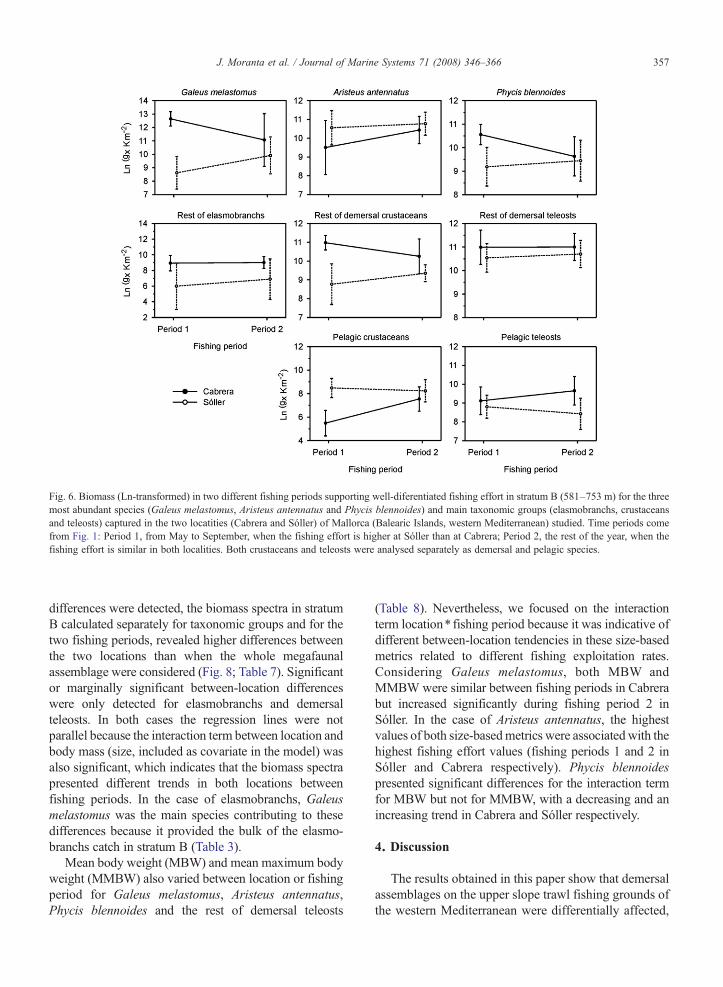
Fig. 6. Biomass (Ln-transformed) in two different fishing periods supporting well-diferentiated fishing effort in stratum B (581–753 m) for the threemost abundant species (Galeus melastomus, Aristeus antennatus and Phycis blennoides) and main taxonomic groups (elasmobranchs, crustaceansand teleosts) captured in the two locatities (Cabrera and Sóller) of Mallorca (Balearic Islands, western Mediterranean) studied. Time periods comefrom Fig. 1: Period 1, from May to September, when the fishing effort is higher at Sóller than at Cabrera; Period 2, the rest of the year, when thefishing effort is similar in both localities. Both crustaceans and teleosts were analysed separately as demersal and pelagic species.
357J. Moranta et al. / Journal of Marine Systems 71 (2008) 346–366
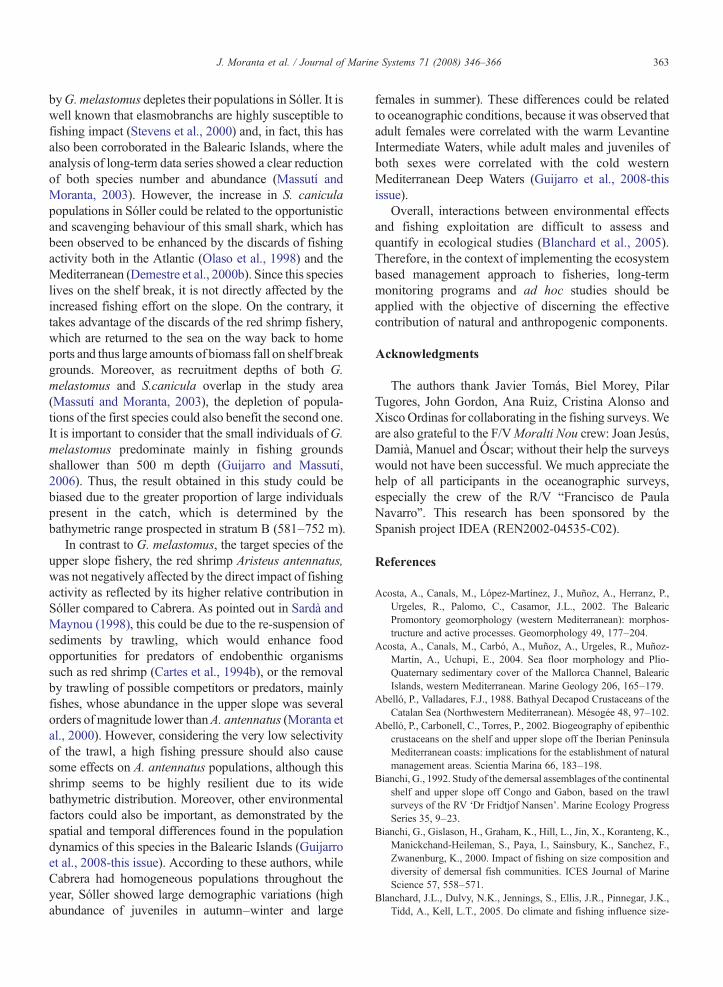
differences were detected, the biomass spectra in stratumB calculated separately for taxonomic groups and for thetwo fishing periods, revealed higher differences betweenthe two locations than when the whole megafaunalassemblage were considered (Fig. 8; Table 7). Significantor marginally significant between-location differenceswere only detected for elasmobranchs and demersalteleosts. In both cases the regression lines were notparallel because the interaction term between location andbody mass (size, included as covariate in the model) wasalso significant, which indicates that the biomass spectrapresented different trends in both locations betweenfishing periods. In the case of elasmobranchs, Galeusmelastomus was the main species contributing to thesedifferences because it provided the bulk of the elasmo-branchs catch in stratum B (Table 3).
Mean body weight (MBW) and mean maximum bodyweight (MMBW) also varied between location or fishingperiod for Galeus melastomus, Aristeus antennatus,Phycis blennoides and the rest of demersal teleosts
(Table 8). Nevertheless, we focused on the interactionterm location⁎ fishing period because it was indicative ofdifferent between-location tendencies in these size-basedmetrics related to different fishing exploitation rates.Considering Galeus melastomus, both MBW andMMBW were similar between fishing periods in Cabrerabut increased significantly during fishing period 2 inSóller. In the case of Aristeus antennatus, the highestvalues of both size-basedmetrics were associated with thehighest fishing effort values (fishing periods 1 and 2 inSóller and Cabrera respectively). Phycis blennoidespresented significant differences for the interaction termfor MBW but not for MMBW, with a decreasing and anincreasing trend in Cabrera and Sóller respectively.
4. Discussion
The results obtained in this paper show that demersalassemblages on the upper slope trawl fishing grounds ofthe western Mediterranean were differentially affected,
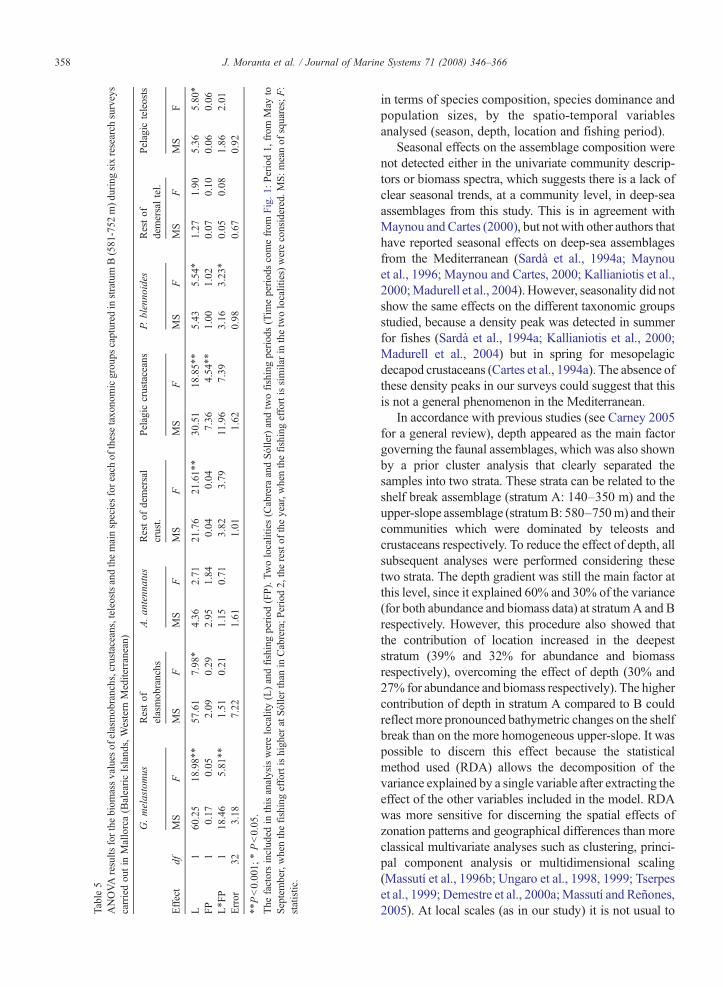
Table5
ANOVAresults
forthe
biom
assvalues
ofelasmobranchs,crustaceans,teleostsandthemainspeciesforeach
ofthesetaxono
micgrou
pscaptured
instratumB(581
-752
m)d
uringsixresearch
surveys
carriedoutin
Mallorca(BalearicIslands,Western
Mediterranean)
G.melastomus
Restof
elasmobranchs
A.an
tenn
atus
Restof
demersal
crust.
Pelagic
crustaceans
P.blenno
ides
Restof
demersaltel.
Pelagic
teleosts
Effect
dfMS
FMS
FMS
FMS
FMS
FMS
FMS
FMS
F
L1
60.25
18.98⁎⁎
57.61
7.98⁎
4.36
2.71
21.76
21.61⁎⁎
30.51
18.85⁎⁎
5.43
5.54⁎
1.27
1.90
5.36
5.80⁎
FP
10.17
0.05
2.09
0.29
2.95
1.84
0.04
0.04
7.36
4.54⁎⁎
1.00
1.02
0.07
0.10
0.06
0.06
L⁎ F
P1
18.46
5.81⁎⁎
1.51
0.21
1.15
0.71
3.82
3.79
11.96
7.39
3.16
3.23⁎
0.05
0.08
1.86
2.01
Error
323.18
7.22
1.61
1.01
1.62
0.98
0.67
0.92
⁎⁎Pb0.00
1;⁎Pb0.05
.The
factorsincluded
inthisanalysiswerelocality(L)andfishingperiod
(FP).Tw
olocalities(Cabrera
andSóller)andtwofishingperiods(Tim
eperiod
scomefrom
Fig.1
:Period1,
from
May
toSeptember,whenthefishingeffortishigher
atSóllerthan
inCabrera;P
eriod2,
therestof
theyear,w
henthefishingeffortissimilarin
thetwolocalities)wereconsidered.M
S:m
eanof
squares;F:
statistic.
358 J. Moranta et al. / Journal of Marine Systems 71 (2008) 346–366
in terms of species composition, species dominance andpopulation sizes, by the spatio-temporal variablesanalysed (season, depth, location and fishing period).
Seasonal effects on the assemblage composition werenot detected either in the univariate community descrip-tors or biomass spectra, which suggests there is a lack ofclear seasonal trends, at a community level, in deep-seaassemblages from this study. This is in agreement withMaynou and Cartes (2000), but not with other authors thathave reported seasonal effects on deep-sea assemblagesfrom the Mediterranean (Sardà et al., 1994a; Maynouet al., 1996; Maynou and Cartes, 2000; Kallianiotis et al.,2000;Madurell et al., 2004). However, seasonality did notshow the same effects on the different taxonomic groupsstudied, because a density peak was detected in summerfor fishes (Sardà et al., 1994a; Kallianiotis et al., 2000;Madurell et al., 2004) but in spring for mesopelagicdecapod crustaceans (Cartes et al., 1994a). The absence ofthese density peaks in our surveys could suggest that thisis not a general phenomenon in the Mediterranean.
In accordance with previous studies (see Carney 2005for a general review), depth appeared as the main factorgoverning the faunal assemblages, which was also shownby a prior cluster analysis that clearly separated thesamples into two strata. These strata can be related to theshelf break assemblage (stratum A: 140–350 m) and theupper-slope assemblage (stratumB: 580–750m) and theircommunities which were dominated by teleosts andcrustaceans respectively. To reduce the effect of depth, allsubsequent analyses were performed considering thesetwo strata. The depth gradient was still the main factor atthis level, since it explained 60% and 30% of the variance(for both abundance and biomass data) at stratumA and Brespectively. However, this procedure also showed thatthe contribution of location increased in the deepeststratum (39% and 32% for abundance and biomassrespectively), overcoming the effect of depth (30% and27% for abundance and biomass respectively). The highercontribution of depth in stratum A compared to B couldreflect more pronounced bathymetric changes on the shelfbreak than on the more homogeneous upper-slope. It waspossible to discern this effect because the statisticalmethod used (RDA) allows the decomposition of thevariance explained by a single variable after extracting theeffect of the other variables included in the model. RDAwas more sensitive for discerning the spatial effects ofzonation patterns and geographical differences than moreclassical multivariate analyses such as clustering, princi-pal component analysis or multidimensional scaling(Massutí et al., 1996b; Ungaro et al., 1998, 1999; Tserpeset al., 1999; Demestre et al., 2000a;Massutí and Reñones,2005). At local scales (as in our study) it is not usual to
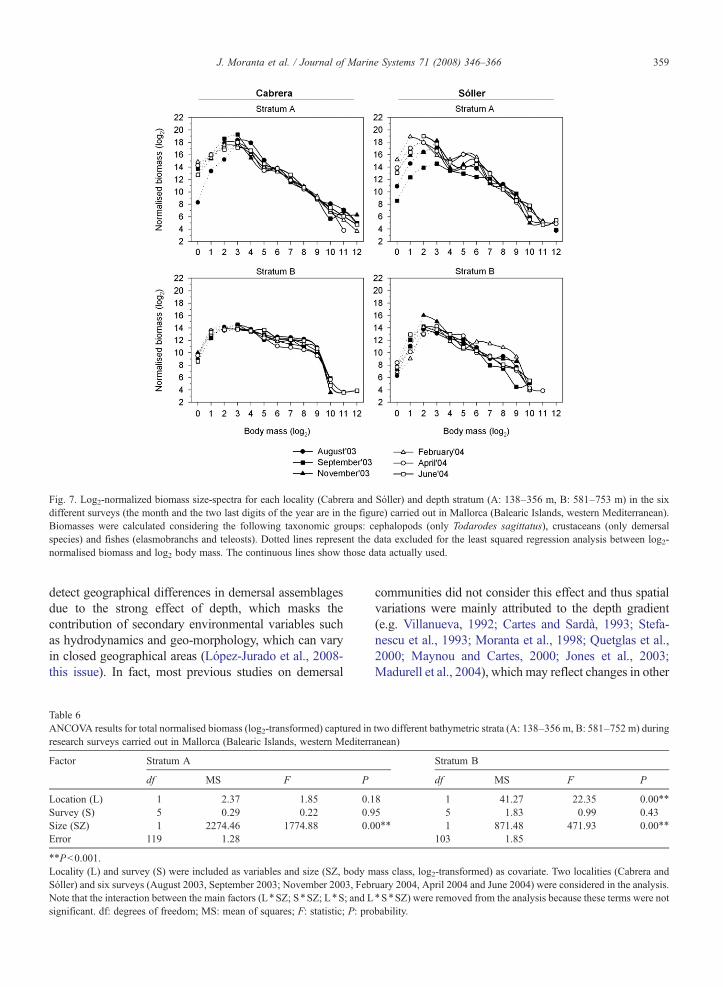
Fig. 7. Log2-normalized biomass size-spectra for each locality (Cabrera and Sóller) and depth stratum (A: 138–356 m, B: 581–753 m) in the sixdifferent surveys (the month and the two last digits of the year are in the figure) carried out in Mallorca (Balearic Islands, western Mediterranean).Biomasses were calculated considering the following taxonomic groups: cephalopods (only Todarodes sagittatus), crustaceans (only demersalspecies) and fishes (elasmobranchs and teleosts). Dotted lines represent the data excluded for the least squared regression analysis between log2-normalised biomass and log2 body mass. The continuous lines show those data actually used.
359J. Moranta et al. / Journal of Marine Systems 71 (2008) 346–366
detect geographical differences in demersal assemblagesdue to the strong effect of depth, which masks thecontribution of secondary environmental variables suchas hydrodynamics and geo-morphology, which can varyin closed geographical areas (López-Jurado et al., 2008-this issue). In fact, most previous studies on demersal
Table 6ANCOVA results for total normalised biomass (log2-transformed) captured inresearch surveys carried out in Mallorca (Balearic Islands, western Mediterr
Factor Stratum A
df MS F P
Location (L) 1 2.37 1.85 0.1Survey (S) 5 0.29 0.22 0.9Size (SZ) 1 2274.46 1774.88 0.0Error 119 1.28
⁎⁎Pb0.001.Locality (L) and survey (S) were included as variables and size (SZ, body mSóller) and six surveys (August 2003, September 2003; November 2003, FebNote that the interaction between the main factors (L⁎SZ; S⁎SZ; L⁎S; and Lsignificant. df: degrees of freedom; MS: mean of squares; F: statistic; P: pro
communities did not consider this effect and thus spatialvariations were mainly attributed to the depth gradient(e.g. Villanueva, 1992; Cartes and Sardà, 1993; Stefa-nescu et al., 1993; Moranta et al., 1998; Quetglas et al.,2000; Maynou and Cartes, 2000; Jones et al., 2003;Madurell et al., 2004), which may reflect changes in other
two different bathymetric strata (A: 138–356 m, B: 581–752 m) duringanean)
Stratum B
df MS F P
8 1 41.27 22.35 0.00⁎⁎
5 5 1.83 0.99 0.430⁎⁎ 1 871.48 471.93 0.00⁎⁎
103 1.85
ass class, log2-transformed) as covariate. Two localities (Cabrera andruary 2004, April 2004 and June 2004) were considered in the analysis.⁎S⁎SZ) were removed from the analysis because these terms were notbability.
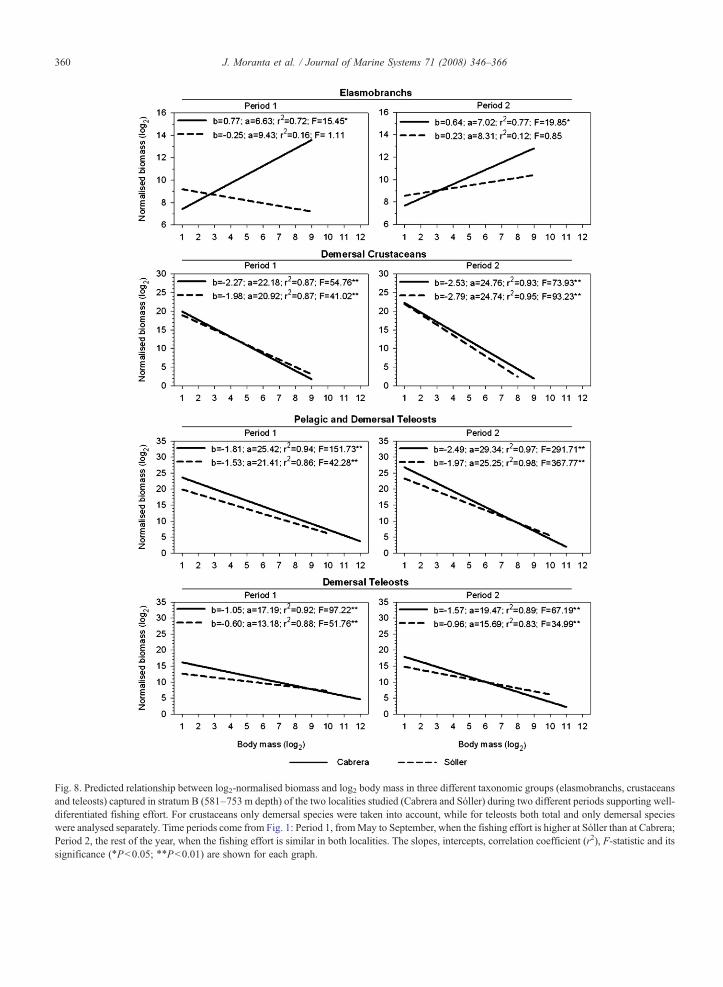
Fig. 8. Predicted relationship between log2-normalised biomass and log2 body mass in three different taxonomic groups (elasmobranchs, crustaceansand teleosts) captured in stratum B (581–753 m depth) of the two localities studied (Cabrera and Sóller) during two different periods supporting well-diferentiated fishing effort. For crustaceans only demersal species were taken into account, while for teleosts both total and only demersal specieswere analysed separately. Time periods come from Fig. 1: Period 1, fromMay to September, when the fishing effort is higher at Sóller than at Cabrera;Period 2, the rest of the year, when the fishing effort is similar in both localities. The slopes, intercepts, correlation coefficient (r2), F-statistic and itssignificance (⁎Pb0.05; ⁎⁎Pb0.01) are shown for each graph.
360 J. Moranta et al. / Journal of Marine Systems 71 (2008) 346–366
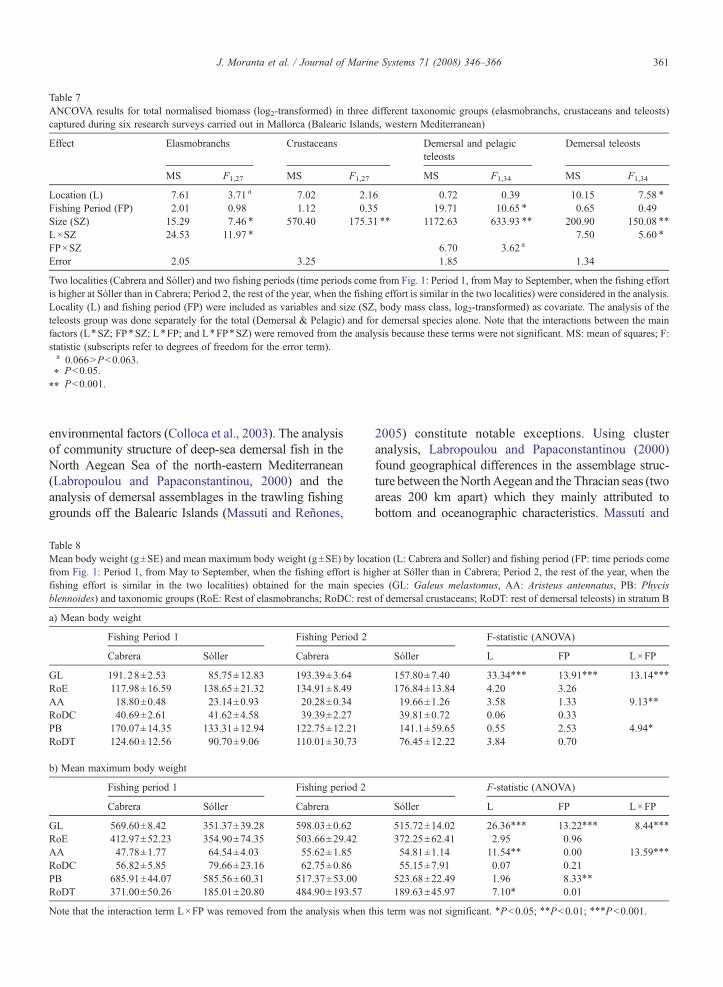
Table 7ANCOVA results for total normalised biomass (log2-transformed) in three different taxonomic groups (elasmobranchs, crustaceans and teleosts)captured during six research surveys carried out in Mallorca (Balearic Islands, western Mediterranean)
Effect Elasmobranchs Crustaceans Demersal and pelagicteleosts
Demersal teleosts
MS F1,27 MS F1,27 MS F1,34 MS F1,34
Location (L) 7.61 3.71 a 7.02 2.16 0.72 0.39 10.15 7.58 ⁎
Fishing Period (FP) 2.01 0.98 1.12 0.35 19.71 10.65 ⁎ 0.65 0.49Size (SZ) 15.29 7.46 ⁎ 570.40 175.31 ⁎⁎ 1172.63 633.93 ⁎⁎ 200.90 150.08 ⁎⁎
L×SZ 24.53 11.97 ⁎ 7.50 5.60 ⁎
FP×SZ 6.70 3.62 a
Error 2.05 3.25 1.85 1.34
Two localities (Cabrera and Sóller) and two fishing periods (time periods come from Fig. 1: Period 1, fromMay to September, when the fishing effortis higher at Sóller than in Cabrera; Period 2, the rest of the year, when the fishing effort is similar in the two localities) were considered in the analysis.Locality (L) and fishing period (FP) were included as variables and size (SZ, body mass class, log2-transformed) as covariate. The analysis of theteleosts group was done separately for the total (Demersal & Pelagic) and for demersal species alone. Note that the interactions between the mainfactors (L⁎SZ; FP⁎SZ; L⁎FP; and L⁎FP⁎SZ) were removed from the analysis because these terms were not significant. MS: mean of squares; F:statistic (subscripts refer to degrees of freedom for the error term).a 0.066NPb0.063.⁎ Pb0.05.⁎⁎ Pb0.001.
361J. Moranta et al. / Journal of Marine Systems 71 (2008) 346–366
environmental factors (Colloca et al., 2003). The analysisof community structure of deep-sea demersal fish in theNorth Aegean Sea of the north-eastern Mediterranean(Labropoulou and Papaconstantinou, 2000) and theanalysis of demersal assemblages in the trawling fishinggrounds off the Balearic Islands (Massutí and Reñones,
Table 8Mean body weight (g±SE) and mean maximum body weight (g±SE) by locafrom Fig. 1: Period 1, from May to September, when the fishing effort is hifishing effort is similar in the two localities) obtained for the main specblennoides) and taxonomic groups (RoE: Rest of elasmobranchs; RoDC: rest
a) Mean body weight
Fishing Period 1 Fishing Period 2
Cabrera Sóller Cabrera
GL 191.28±2.53 85.75±12.83 193.39±3.64RoE 117.98±16.59 138.65±21.32 134.91±8.49AA 18.80±0.48 23.14±0.93 20.28±0.34RoDC 40.69±2.61 41.62±4.58 39.39±2.27PB 170.07±14.35 133.31±12.94 122.75±12.21RoDT 124.60±12.56 90.70±9.06 110.01±30.73
b) Mean maximum body weight
Fishing period 1 Fishing period 2
Cabrera Sóller Cabrera
GL 569.60±8.42 351.37±39.28 598.03±0.62RoE 412.97±52.23 354.90±74.35 503.66±29.42AA 47.78±1.77 64.54±4.03 55.62±1.85RoDC 56.82±5.85 79.66±23.16 62.75±0.86PB 685.91±44.07 585.56±60.31 517.37±53.00RoDT 371.00±50.26 185.01±20.80 484.90±193.57
Note that the interaction term L×FP was removed from the analysis when t
2005) constitute notable exceptions. Using clusteranalysis, Labropoulou and Papaconstantinou (2000)found geographical differences in the assemblage struc-ture between theNorthAegean and the Thracian seas (twoareas 200 km apart) which they mainly attributed tobottom and oceanographic characteristics. Massutí and
tion (L: Cabrera and Soller) and fishing period (FP: time periods comegher at Sóller than in Cabrera; Period 2, the rest of the year, when theies (GL: Galeus melastomus, AA: Aristeus antennatus, PB: Phycisof demersal crustaceans; RoDT: rest of demersal teleosts) in stratum B
F-statistic (ANOVA)
Sóller L FP L×FP
157.80±7.40 33.34⁎⁎⁎ 13.91⁎⁎⁎ 13.14⁎⁎⁎
176.84±13.84 4.20 3.2619.66±1.26 3.58 1.33 9.13⁎⁎
39.81±0.72 0.06 0.33141.1±59.65 0.55 2.53 4.94⁎
76.45±12.22 3.84 0.70
F-statistic (ANOVA)
Sóller L FP L×FP
515.72±14.02 26.36⁎⁎⁎ 13.22⁎⁎⁎ 8.44⁎⁎⁎
372.25±62.41 2.95 0.9654.81±1.14 11.54⁎⁎ 0.00 13.59⁎⁎⁎
55.15±7.91 0.07 0.21523.68±22.49 1.96 8.33⁎⁎
189.63±45.97 7.10⁎ 0.01
his term was not significant. ⁎Pb0.05; ⁎⁎Pb0.01; ⁎⁎⁎Pb0.001.
362 J. Moranta et al. / Journal of Marine Systems 71 (2008) 346–366
Reñones (2005) also found geographical differencesbetween the western and eastern coast basins offMallorca, which could be related to differences in habitatand macro-epibenthic communities. Considering largerspatial scales, deep-sea assemblage studies carried out inthe western Mediterranean have usually detected geo-graphical variations related to hydrodynamic conditions,topography and bottom characteristics and surfaceproduction inputs (Abelló et al., 2002; Massutí et al.,2004; Gaertner et al., 2005).
Although depth has frequently been repeated as themain variable governing the zonation of deep-seaassemblages, the final environmental factors or mechan-isms have not been determined. The mechanisms mostfrequently proposed are the absence of light, highhydrostatic pressure, low temperature, oxygen minimumzone, water mass and nature of substrate (Carney, 2005).This author also considers food availability, jointly withpredation, competition and/or dispersion, to be importantfactors. Cartes and Sardà (1992) showed that zonation inMediterranean deep-sea crustaceansmight also be caused,at least partially, by impoverishment of organic matter inthe bottom sediments with increasing depth, and by a re-suspension of sediments in areas under the influence ofsubmarine canyons. These geo-morphological structureshave been proved to be areas of high productivity, whichcan act as recruitment grounds for fishes (Stefanescu et al.,1994) and crustaceans (Cartes et al., 1994a). Never-theless, in our study area, the absence of large submarinecanyons (Acosta et al., 2002) and the observed incrementof organicmatterwith depth (Cartes et al., 2008-this issue)eliminate these elements as causative factors that affectthe assemblage composition and the abundance (orbiomass) of single species, which suggests that otherfactors of environmental or anthropogenic origin coulddetermine the structure of these assemblages.
The univariate community descriptors analysed in ourstudy, species richness and density (both in abundance andbiomass), also varied with depth. For crustaceans thesedescriptors showed the highest values on the upper-slope,while for the rest of the taxonomic groups (cephalopods,ostheichtyes and elasmobranchs) they were highest on theshelf break. These differences suggest that the trophicrelationships between the two dominant taxonomic groups(crustaceans and teleosts) would probably be based on acompetitive exclusion due to exploitation of similar foodresources rather than on predator/prey relationships(Cartes et al., 2001). Nevertheless, these global commu-nity descriptors are weak predictors of the between-location variations because they do not follow a generalrule. Differences were only obtained in some zoologicalgroups for specific variables such as biomass and mean
weight in teleosts and biomass and species richness inelasmobranchs, which showed higher values in Cabrerathan in Sóller in all cases, especially in the upper-slopeassemblage. Although elasmobranchs are particularlysensitive to fishing pressure (Stevens et al., 2000), nobetween-location differences emerged for mean weight.Nevertheless, the between-location differences were moreaccentuated when biomass data from this assemblage wasanalysed separately for the main species and taxonomicgroups and considering two fishing periods having well-differentiated exploitation rates. Two dominant large-sizefish species found on the upper slope of both localities,Galeus melastomus and Phycis blennoides, had higherbiomass values associated with lower fishing effort.Although the mean body weight (MBW) of both speciesand also themeanmaximum bodyweight (MMBW) ofG.melastomus agreed with this pattern, Phycis blennoidesMMBW did not. This last case could be indicative ofnatural size-trends such as the bigger–deeper phenomenon(Moranta et al., 2004 and references cited there in) whichrefers to the displacement of large individuals towards thedeeper limit of their bathymetric distribution, beyond thedepth range prospected in this study for this species.
The biomass spectra also varied with depth, since theshelf break assemblage was characterised by having bothhigher biomass values and smaller individuals than theupper-slope. This is determined by the higher densities ofsmall mesopelagic species at the shelf break such asGlossanodon leioglosus, Capros aper, Macroramphosusscolopax, Gadiculus argenteus, Boops boops and Cen-tracanthus cirrus. Significant between-location differ-ences were only obtained for stratum B, where Cabrerahad higher biomass and a higher proportion of largeindividuals than Sóller. Elasmobranchs and demersalteleosts were the main taxonomic groups contributing tothese differences. Location differences were especiallyevident in elasmobranchs, a taxonomic group with aclearly dominant species in both the shelf breaks(Scyliorhinus canicula) and upper slope (Galeus mela-stomus) assemblages. These species showed oppositetrends, since the highest S. canicula and G. melastomusabundances were obtained in Sóller and Cabrerarespectively. In agreement with other studies (e.g. Merrettand Haedrich, 1997; Bianchi et al., 2000; Graham et al.,2005; Gristina et al., 2006), these trends could be relatedto fishing activity rates, which depend greatly on thelocality or stratum considered. During May-September amajor displacement of the trawl fleet towards Sóllerfishing grounds targeting red shrimps, produces adecrease in fishing effort on the Cabrera shelf break anda pronounced increase on the Sóller upper slope. Thisincreased fishing activity on the part of the slope inhabited
363J. Moranta et al. / Journal of Marine Systems 71 (2008) 346–366
byG.melastomus depletes their populations in Sóller. It iswell known that elasmobranchs are highly susceptible tofishing impact (Stevens et al., 2000) and, in fact, this hasalso been corroborated in the Balearic Islands, where theanalysis of long-term data series showed a clear reductionof both species number and abundance (Massutí andMoranta, 2003). However, the increase in S. caniculapopulations in Sóller could be related to the opportunisticand scavenging behaviour of this small shark, which hasbeen observed to be enhanced by the discards of fishingactivity both in the Atlantic (Olaso et al., 1998) and theMediterranean (Demestre et al., 2000b). Since this specieslives on the shelf break, it is not directly affected by theincreased fishing effort on the slope. On the contrary, ittakes advantage of the discards of the red shrimp fishery,which are returned to the sea on the way back to homeports and thus large amounts of biomass fall on shelf breakgrounds. Moreover, as recruitment depths of both G.melastomus and S.canicula overlap in the study area(Massutí and Moranta, 2003), the depletion of popula-tions of the first species could also benefit the second one.It is important to consider that the small individuals ofG.melastomus predominate mainly in fishing groundsshallower than 500 m depth (Guijarro and Massutí,2006). Thus, the result obtained in this study could bebiased due to the greater proportion of large individualspresent in the catch, which is determined by thebathymetric range prospected in stratum B (581–752 m).
In contrast to G. melastomus, the target species of theupper slope fishery, the red shrimp Aristeus antennatus,was not negatively affected by the direct impact of fishingactivity as reflected by its higher relative contribution inSóller compared to Cabrera. As pointed out in Sardà andMaynou (1998), this could be due to the re-suspension ofsediments by trawling, which would enhance foodopportunities for predators of endobenthic organismssuch as red shrimp (Cartes et al., 1994b), or the removalby trawling of possible competitors or predators, mainlyfishes, whose abundance in the upper slope was severalorders of magnitude lower thanA. antennatus (Moranta etal., 2000). However, considering the very low selectivityof the trawl, a high fishing pressure should also causesome effects on A. antennatus populations, although thisshrimp seems to be highly resilient due to its widebathymetric distribution. Moreover, other environmentalfactors could also be important, as demonstrated by thespatial and temporal differences found in the populationdynamics of this species in the Balearic Islands (Guijarroet al., 2008-this issue). According to these authors, whileCabrera had homogeneous populations throughout theyear, Sóller showed large demographic variations (highabundance of juveniles in autumn–winter and large
females in summer). These differences could be relatedto oceanographic conditions, because it was observed thatadult females were correlated with the warm LevantineIntermediate Waters, while adult males and juveniles ofboth sexes were correlated with the cold westernMediterranean Deep Waters (Guijarro et al., 2008-thisissue).
Overall, interactions between environmental effectsand fishing exploitation are difficult to assess andquantify in ecological studies (Blanchard et al., 2005).Therefore, in the context of implementing the ecosystembased management approach to fisheries, long-termmonitoring programs and ad hoc studies should beapplied with the objective of discerning the effectivecontribution of natural and anthropogenic components.
Acknowledgments
The authors thank Javier Tomás, Biel Morey, PilarTugores, John Gordon, Ana Ruiz, Cristina Alonso andXisco Ordinas for collaborating in the fishing surveys.Weare also grateful to the F/VMoralti Nou crew: Joan Jesús,Damià, Manuel and Óscar; without their help the surveyswould not have been successful. We much appreciate thehelp of all participants in the oceanographic surveys,especially the crew of the R/V “Francisco de PaulaNavarro”. This research has been sponsored by theSpanish project IDEA (REN2002-04535-C02).
References
Acosta, A., Canals, M., López-Martínez, J., Muñoz, A., Herranz, P.,Urgeles, R., Palomo, C., Casamor, J.L., 2002. The BalearicPromontory geomorphology (western Mediterranean): morphos-tructure and active processes. Geomorphology 49, 177–204.
Acosta, A., Canals, M., Carbó, A., Muñoz, A., Urgeles, R., Muñoz-Martín, A., Uchupi, E., 2004. Sea floor morphology and Plio-Quaternary sedimentary cover of the Mallorca Channel, BalearicIslands, western Mediterranean. Marine Geology 206, 165–179.
Abelló, P., Valladares, F.J., 1988. Bathyal Decapod Crustaceans of theCatalan Sea (Northwestern Mediterranean). Mésogée 48, 97–102.
Abelló, P., Carbonell, C., Torres, P., 2002. Biogeography of epibenthiccrustaceans on the shelf and upper slope off the Iberian PeninsulaMediterranean coasts: implications for the establishment of naturalmanagement areas. Scientia Marina 66, 183–198.
Bianchi, G., 1992. Study of the demersal assemblages of the continentalshelf and upper slope off Congo and Gabon, based on the trawlsurveys of the RV ‘Dr Fridtjof Nansen’. Marine Ecology ProgressSeries 35, 9–23.
Bianchi, G., Gislason, H., Graham, K., Hill, L., Jin, X., Koranteng, K.,Manickchand-Heileman, S., Paya, I., Sainsbury, K., Sanchez, F.,Zwanenburg, K., 2000. Impact of fishing on size composition anddiversity of demersal fish communities. ICES Journal of MarineScience 57, 558–571.
Blanchard, J.L., Dulvy, N.K., Jennings, S., Ellis, J.R., Pinnegar, J.K.,Tidd, A., Kell, L.T., 2005. Do climate and fishing influence size-
364 J. Moranta et al. / Journal of Marine Systems 71 (2008) 346–366
based indicators of Celtic Sea fish community structure? ICESJournal of Marine Science 62, 405–411.
Caddy, J.F., 1993. Some future perspectives for assessment andmanagement of Mediterranean fisheries. Scientia Marina 57,121–130.
Carbonell, A., Carbonell, M., Demestre, M., Grau, A., Monserrat, S.,1999. The red shrimp Aristeus antennatus (Risso, 1816) fisheryand biology in the Balearic Islands, western Mediterranean.Fisheries Research 44, 1–13.
Carney, R.S., 2005. Zonation of deep biota on continental margins.Oceanography and Marine Biology: An Annual Review 43,211–278.
Cartes, J.E., 1998. Dynamics of the bathyal Benthic Boundary Layer inthe northwestern Mediterranean: depth and temporal variations inmacrofaunal–megafaunal communities and their possible connec-tions within deep-sea trophic webs. Progress in Oceanography 41,111–139.
Cartes, J.E., Sardà, F., 1992. Abundance and diversity of decapodcrustaceans in the deep Catalan Sea (western Mediterranean).Journal of Natural History 26, 1305–1323.
Cartes, J.E., Sardà, F., 1993. Zonation of deep-sea decapod fauna in theCatalan Sea (western Mediterranean). Marine Ecology ProgressSeries 94, 27–34.
Cartes, J.E., Company, J.B., Maynou, F., 1994a. Deep-water decapodcrustacean communities in the Northwestern Mediterranean:influence of submarine canyons and season. Marine Biology120, 221–229.
Cartes, J.E., Sorbe, J.C., Sardà, F., 1994b. Spatial distribution of deep-sea decapods and euphausiids near the bottom in the northwesternMediterranean. Journal of Experimental Marine Biology andEcology 179, 131–144.
Cartes, J.E., Maynou, F., Morales-Nin, B., Massutí, E., Moranta, J.,2001. Trophic structure of a bathial benthopelagic boundary layercommunity south of the Balearic Islands (southwestern Mediterra-nean). Marine Ecology Progress Series 215, 23–35.
Cartes, J.E., Madurell, T., Fanelli, E., López-Jurado, J.L., 2008.Dynamics of suprabenthos-zooplankton communities around theBalearic Islands (NW Mediterranean): influence of environmentalvariables and effects on the biological cycle of Aristeus antennatus.Journal of Marine Systems 71, 316–335 (this issue).
Clarke, K.R., Warwick, R.M., 1994. Changes in marine communities:an approach to statistical analysis and interpretation. PlymouthMarine Laboratory, Plymouth. 16.
Colloca, F., Cardinale, M., Belluscio, A., Ardizzone, G.D., 2003.Pattern of distribution and diversity of demersal assemblages in thecentral Mediterranean Sea. Estuarine, Coastal and Shelf Science56, 469–480.
Company, J., Sarda, F., 2000. Growth parameters of deep-waterdecapod crustaceans in the Northwestern Mediterranean Sea: acomparative approach. Marine Biology 136, 79–90.
Company, J., Maiorano, P., Tselepides, A., Politou, C.Y., Plaity, W.,Rotllant, G., Sarda, F., 2004. Deep-sea decapod crustaceans in thewestern and central Mediterranean Sea: preliminary aspects ofspecies distribution, biomass and population structure. ScientiaMarina 68, 73–86.
D'Onghia, G., Tursi, A., Maiorano, P., Matarrese, A., Panza, M., 1998.Demersal fish assemblages from the bathyal grounds of the IonianSea (middle-eastern Mediterranean). Italian Journal of Zoology 65,287–292.
D'Onghia, G., Basanisi, M., Matarrese, A., Megli, F., 1999. Reproduc-tive strategies in macrourid fish: seasonality or not? Marine EcologyProgress Series 184, 189–196.
D'Onghia, G., Politou, C.Y., Bozzano, A., Lloris, D., Rotllant, G.,Sion, L., Mastrototaro, F., 2004. Deep-water fish assemblages inthe Mediterranean Sea. Scientia Marina 68, 87–99.
Daan, N., Gislason, H., Pope, G., Rice, C., 2005. Changes in the NorthSea fish community: evidence of indirect effects of fishing? ICESJournal of Marine Science 62, 177–188.
Dayton, P.K., Thrush, S.F., Agardy, M.T., Hofman, R.J., 1995.Environmental effects of marine fishing. Aquatic Conservation:Marine and Freshwaters Ecosystems 5, 205–232.
Demestre, M., Abelló, P., 1993. Growth and distribution of Solenoceramembranacea (Risso, 1816) (Decapoda, Dendrobranchiata) in thenorthwestern Mediterranean Sea. Scientia Marina 57, 161–166.
Demestre, M., Sánchez, P., Abelló, P., 2000a. Demersal fishassemblages and habitat characteristics on the continental shelfand upper slope of the north-western Mediterranean. Journal ofMarine Biology Association U.K. 80, 981–988.
Demestre, M., Sánchez, P., Kaiser, M.J., 2000b. The behaviouralresponse of benthic scavengers to otter-trawling disturbance in theMediterranean. In: Kaiser, M.J., De Groot, S.J. (Eds.), Effects ofFishing on Non-target Species and Habitats. Biological, Con-servation and Socioeconomic Issues. Blackwell Science, Oxford,pp. 121–129.
EUROMODEL Group, 1995. Progress from 1989 to 1992 in under-standing the circulation of the western Mediterranean. Oceanolo-gica Acta 18, 255–271.
Gaertner, J.C., Bertrand, J.A., Gil de Sola Simarro, L., Durbec, J.P.,Ferrandis, E., Souplet, A., 2005. Large spatial scale variation ofdemersal fish assemblage structure on the continental shelf of theNWMediterranean Sea. Marine Ecology Progress Series 297, 245–257.
Gislason, H., Sinclair, M.M., 2000. Ecosystem effects of fishing. ICESJournal of Marine Science 57, 466–467.
Gislason, H., Sinclair, M., Sainsbury, K., O'boyle, R., 2000. Symposiumoverview: incorporating ecosystem objectives within fisheriesmanagement. ICES Journal of Marine Science 57, 468–475.
Goñi, R., 1998. Ecosystem effects of marine fisheries: an overview.Ocean & Coastal Management 40, 37–64.
Graham, N.A.J., Dulvy, N.K., Jennings, S., Polunin, N.V.C., 2005.Size-spectra as indicators of the effects of fishing on coral reef fishassemblages. Coral Reefs 24, 118–124.
Gristina, M., Bahri, T., Fiorentino, F., Garofalo, G., 2006. Comparisonof demersal fish assemblages in three areas of the Strait of Sicilyunder different trawling pressure. Fisheries Research 81, 60–71.
Guijarro, B., Massutí, E., 2006. Selectivity of diamond- and square-mesh codends in the deepwater crustacean trawl fishery off theBalearic Islands (western Mediterranean). ICES Journal of MarineScience 63, 52–67.
Guijarro, B., Massutí, E., Moranta, J., Diaz, P., 2008. Populationdynamics of the red shrimp Aristeus antennatus in the BalearicIslands (western Mediterranean): spatiotemporal differences andinfluence of environmental factors. Journal of Marine Systems 71,385–402 (this issue).
Haedrich, R.L., 1997. Distribution and population ecology. In:Randall, D.J., Farrell, A.P. (Eds.), Deep-sea fishes. AcademicPress, San Diego, pp. 79–114.
Haedrich, R.L., Krefft, G., 1978. Distribution of bottom fishes in theDenmark Strait and Irminger Sea. Deep-sea Research 25, 705–720.
Haedrich, R.L., Merrett, N.R., 1990. Little evidence for faunalzonation or communities in deep sea demersal fish faunas.Progress in Oceanography 24, 239–250.
Haedrich, R.L., Barnes, S.M., 1997. Changes over time of the sizestructure on an exploited shelf fish community. Fisheries Research31, 229–239.
365J. Moranta et al. / Journal of Marine Systems 71 (2008) 346–366
Haedrich, R.L., Rowe, G.T., Polloni, P.T., 1975. Zonation and faunalcomposition of epibenthic populations on continental slope southof New England. Journal of Marine Research 33, 191–212.
Hecker, B., 1990. Variation in megafaunal assemblages on thecontinental margin south of New England. Deep-sea Research 37,37–57.
Hopkins, T.S., 2006. Physics of the sea. In: Margalef, R. (Ed.), KeyEnvironments: Western Mediterranean. Pergamon Press, New York,pp. 100–125.
Jennings, S., 2005. Indicators to support an ecosystem approach tofisheries. Fish and Fisheries 6, 212–232.
Jennings, S., Greenstreet, S.P.R., Hill, L., Piet, G.J., Pinnegar, J.K., Warr,K.J., 2002. Long-term trends in the trophic structure of the North Seafish community: evidence from stable-isotope analysis, size-spectraand community metrics. Marine Biology 141, 1085–1097.
Jones, E.G., Tselepides, A., Babley, P.M., Collins, M.A., Priede, I.G.,2003. Bathymetric distribution of some benthic and benthopelagicspecies attracted to baited cameras and traps in the deep easternMediterranean. Marine Ecology Progress Series 251, 75–86.
Kaiser, M.J., De Groot, S.J., 2000. The Effects of Fishing on Non-Target Species and Habitats. Biological, Conservation and Socio-economics Issues. Blackwell Science, Oxford.
Kaiser, M.J., Cheney, K., Spence, F.E., Edwards, D.B., Radford, K.,1999. Fishing effects in northeast Atlantic shelf seas: patterns infishing effort, diversity and community structure VII. The effectsof trawling disturbance on the fauna associated with the tubeheadsof serpulid worms. Fisheries Research 40, 195–205.
Kallianiotis, A., Sophronidis, K., Vidoris, P., Tselepides, A., 2000.Demersal fish and megafaunal assemblages on the Cretancontinental shelf and slope (NE Mediterranean): seasonal variationin species density, biomass and diversity. Progress in Oceano-graphy 46, 429–455.
Koslow, J.A., 1993. Community structure in North Atlantic deep-seafishes. Progress in Oceanography 31, 321–338.
Koslow, J.A., Bulman, C.M., Lyle, J.M., 1994. The mid-slopedemersal fish community off southeastern Australia. Deep-SeaResearch I 41, 113–141.
Labropoulou, M., Papaconstantinou, C., 2000. Community structureof deep-sea demersal fish in the North Aegean Sea (northeasternMediterranean). Hydrobiologia 440, 281–296.
Labropoulou, M., Machias, A., Tsimenides, N., Eleftheriou, A., 1997.Feeding habits and ontogenetic diet shift of the striped red mullet,Mullus surmuletus Linnaeus, 1758. Fisheries Research 3, 257–267.
López-Jurado, J., Monserrat, S., Marcos, M., 2008. Hydrodynamicconditions at the Balearic Islands during 2003-2004. Journal of MarineSystems 71, 303–315 (this issue). doi:10.1016/j.jmarsys.2007.03.007.
Madurell, T., Cartes, J.E., Labropoulou, M., 2004. Changes in thestructure of fish assemblages in a bathyal site of the Ionian Sea(eastern Mediterranean). Fisheries Research 66, 245–260.
Massutí, E., Moranta, J., 2003. Demersal assemblages and depthdistribution of elasmobranchs from the continental shelf and slopeoff the Balearic Islands (western Mediterranean). ICES Journal ofMarine Science 60, 753–766.
Massutí, E., Reñones, O., 2005. Demersal resource assemblages in thetrawl fishing grounds off the Balearic Islands (western Mediterra-nean). Scientia Marina 69, 167–181.
Massutí, E., Morales-Nin, B., Lloris, D., 1996a. Bathymetric distributionand recruitment patterns ofPhycis blennoides (Pisces: Gadidae) fromthe slope of the northwestern Mediterranean. Scientia Marina 60,481–488.
Massutí, E., Reñones, O., Carbonell, A., Oliver, P., 1996b. Demersalfish communities exploited on the continental shelf and slope off
Majorca (Balearic Islands, NW Mediterranean). Vie Milieu 46,45–55.
Massutí, E., Gordon, J.D.M., Moranta, J., Swan, S.C., Stefanescu, C.,Merrett, N.R., 2004. Mediterranean and Atlantic deep-sea fishassemblages: differences in biomass composition and size-relatedstructure. Scientia Marina 68, 101–115.
Matarrese, A., D'Onghia, G., Basanisi, M., Mastrototaro, F., 1998.Spawning and recruitment of Phycis blennoides (Phycidae) fromthe north-western Ionian Sea (middle-eastern Mediterranean).Italian Journal of Zoology 65, 203–209.
Maynou, F., Cartes, J.E., 2000. Community structure of bathyal decapodcrustaceans off southwest Balearic Islands (western Mediterranean):seasonality and regional patterns in zonation. Journal of the MarineBiological Association of the United Kingdom. 80, 789–798.
Maynou, F., Conan, G.Y., Cartes, J.E., 1996. Spatial structure andseasonality of decapod crustacean populations on the northwesternMediterranean slope. Limnology and Oceanography 4, 113–125.
Maynou, F., Lleonart, J., Cartes, J.E., 2003. Seasonal and spatialvariability of hake (Merluccius merluccius L.) recruitment in theNW Mediterranean. Fisheries Research 60, 65–78.
Mendes, B., Fonseca, P., Campos, A., 2004. Weight-length relation-ships for 46 fish species of the Portuguese west coast. Journal ofApplied Ichthyology 20, 355–361.
Merella, P., Quetglas, A., Alemany, F., Carbonell, A., 1997. Length-weight relationship of fishes and cephalopods from the BalearicIslands (western Mediterranean). Naga, The Worldfish CenterQuaterly 20, 66–68.
Merella, P., Alemany, F., Carbonell, A., Quetglas, A., 1998. Fisheryand biology of Norway lobster Nephrops norvegicus (Decapoda:Nephropidae) in Mallorca (western Mediterranean). Journal ofNatural History 32, 1631–1640.
Merrett, N.R., Haedrich, R.L., 1997. Deep-sea Demersal Fish andFisheries. Chapman & Hall, London.
Morales-Nin, B., Massutí, E., Stefanescu, C., 1996. Distribution andbiology of Alepocephalus rostratus from the Mediterranean Sea.Journal of Fish Biology 48, 1097–1112.
Moranta, J., Stefanescu, C., Massutí, E., Morales-Nin, B., Lloris, D.,1998. Fish community structure and depth-related trends on thecontinental slope of the Balearic Islands (Algerian basin, westernMediterranean). Marine Ecology Progress Series 171, 247–259.
Moranta, J., Massutí, E., Morales-Nin, B., 2000. Fish catch composi-tion of the deep-sea decapod crustacean fisheries in the BalearicIslands (western Mediterranean). Fisheries Research 45, 253–264.
Moranta, J., Palmer, M., Massutí, E., Stefanescu, C., Morales-Nin, B.,2004. Body fish size tendencies within and among species in thedeep-sea of the western Mediterranean. Scientia Marina 68,141–152.
Morey, G., Moranta, J., Massutí, E., Grau, A., Linde, M., Riera, F.,Morales-Nin, B., 2003. Weight-length relationships of littoral tolower slope fishes from the western Mediterranean. FisheriesResearch 62, 89–96.
Olaso, I., Velasco, F., Perez, N., 1998. Importance of discarded bluewhiting (Micromesistius poutassou) in the diet of lesser spotteddogfish (Scyliorhinus canicula) in the Cantabrian Sea. ICESJournal of Marine Science 55, 331–341.
Oliver, P., 1993. Analysis of fluctuations observed in the trawl fleetlandings of the Balearic Islands. Scientia Marina 57, 219–227.
Papaconstantinou, C., Kapiris, K., 2003. The biology of the giant redshrimp (Aristaeomorpha foliacea) at an unexploited fishingground in the Greek Ionian Sea. Fisheries Research 62, 37–51.
Pauly, D., Christensen, V., Dalsgaard, J., Froese, R., Torres Jr., F.,1998. Fishing down marine food webs. Science 279, 860–863.
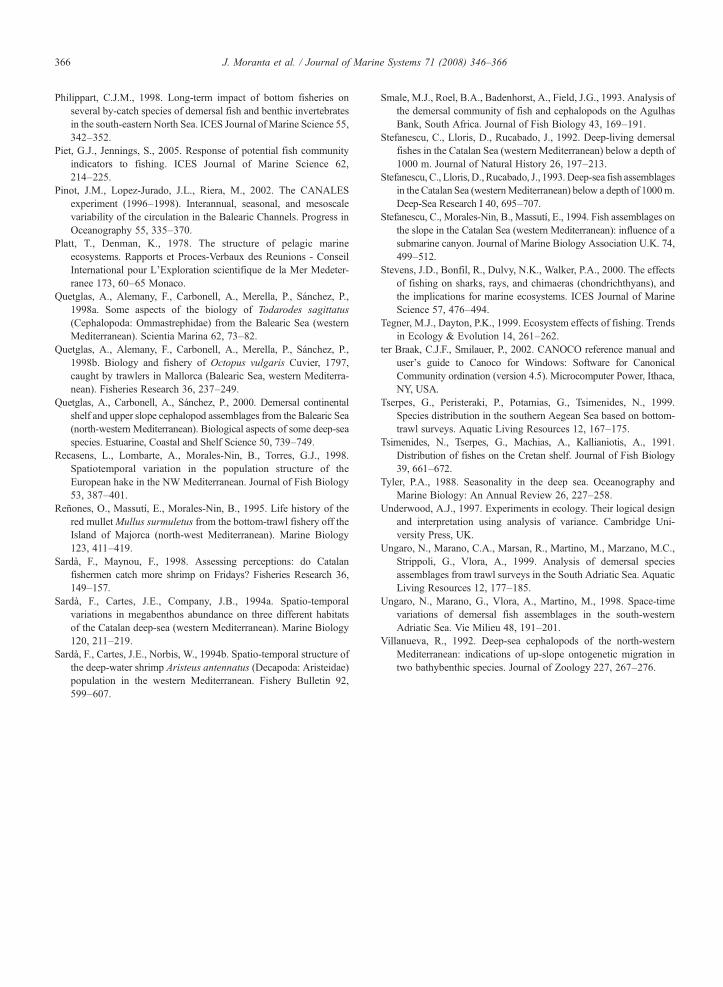
366 J. Moranta et al. / Journal of Marine Systems 71 (2008) 346–366
Philippart, C.J.M., 1998. Long-term impact of bottom fisheries onseveral by-catch species of demersal fish and benthic invertebratesin the south-eastern North Sea. ICES Journal of Marine Science 55,342–352.
Piet, G.J., Jennings, S., 2005. Response of potential fish communityindicators to fishing. ICES Journal of Marine Science 62,214–225.
Pinot, J.M., Lopez-Jurado, J.L., Riera, M., 2002. The CANALESexperiment (1996–1998). Interannual, seasonal, and mesoscalevariability of the circulation in the Balearic Channels. Progress inOceanography 55, 335–370.
Platt, T., Denman, K., 1978. The structure of pelagic marineecosystems. Rapports et Proces-Verbaux des Reunions - ConseilInternational pour L'Exploration scientifique de la Mer Medeter-ranee 173, 60–65 Monaco.
Quetglas, A., Alemany, F., Carbonell, A., Merella, P., Sánchez, P.,1998a. Some aspects of the biology of Todarodes sagittatus(Cephalopoda: Ommastrephidae) from the Balearic Sea (westernMediterranean). Scientia Marina 62, 73–82.
Quetglas, A., Alemany, F., Carbonell, A., Merella, P., Sánchez, P.,1998b. Biology and fishery of Octopus vulgaris Cuvier, 1797,caught by trawlers in Mallorca (Balearic Sea, western Mediterra-nean). Fisheries Research 36, 237–249.
Quetglas, A., Carbonell, A., Sánchez, P., 2000. Demersal continentalshelf and upper slope cephalopod assemblages from the Balearic Sea(north-western Mediterranean). Biological aspects of some deep-seaspecies. Estuarine, Coastal and Shelf Science 50, 739–749.
Recasens, L., Lombarte, A., Morales-Nin, B., Torres, G.J., 1998.Spatiotemporal variation in the population structure of theEuropean hake in the NW Mediterranean. Journal of Fish Biology53, 387–401.
Reñones, O., Massutí, E., Morales-Nin, B., 1995. Life history of thered mulletMullus surmuletus from the bottom-trawl fishery off theIsland of Majorca (north-west Mediterranean). Marine Biology123, 411–419.
Sardà, F., Maynou, F., 1998. Assessing perceptions: do Catalanfishermen catch more shrimp on Fridays? Fisheries Research 36,149–157.
Sardà, F., Cartes, J.E., Company, J.B., 1994a. Spatio-temporalvariations in megabenthos abundance on three different habitatsof the Catalan deep-sea (western Mediterranean). Marine Biology120, 211–219.
Sardà, F., Cartes, J.E., Norbis, W., 1994b. Spatio-temporal structure ofthe deep-water shrimp Aristeus antennatus (Decapoda: Aristeidae)population in the western Mediterranean. Fishery Bulletin 92,599–607.
Smale, M.J., Roel, B.A., Badenhorst, A., Field, J.G., 1993. Analysis ofthe demersal community of fish and cephalopods on the AgulhasBank, South Africa. Journal of Fish Biology 43, 169–191.
Stefanescu, C., Lloris, D., Rucabado, J., 1992. Deep-living demersalfishes in the Catalan Sea (western Mediterranean) below a depth of1000 m. Journal of Natural History 26, 197–213.
Stefanescu, C., Lloris, D., Rucabado, J., 1993.Deep-sea fish assemblagesin the Catalan Sea (westernMediterranean) below a depth of 1000m.Deep-Sea Research I 40, 695–707.
Stefanescu, C., Morales-Nin, B., Massutí, E., 1994. Fish assemblages onthe slope in the Catalan Sea (western Mediterranean): influence of asubmarine canyon. Journal of Marine Biology Association U.K. 74,499–512.
Stevens, J.D., Bonfil, R., Dulvy, N.K., Walker, P.A., 2000. The effectsof fishing on sharks, rays, and chimaeras (chondrichthyans), andthe implications for marine ecosystems. ICES Journal of MarineScience 57, 476–494.
Tegner, M.J., Dayton, P.K., 1999. Ecosystem effects of fishing. Trendsin Ecology & Evolution 14, 261–262.
ter Braak, C.J.F., Smilauer, P., 2002. CANOCO reference manual anduser's guide to Canoco for Windows: Software for CanonicalCommunity ordination (version 4.5). Microcomputer Power, Ithaca,NY, USA.
Tserpes, G., Peristeraki, P., Potamias, G., Tsimenides, N., 1999.Species distribution in the southern Aegean Sea based on bottom-trawl surveys. Aquatic Living Resources 12, 167–175.
Tsimenides, N., Tserpes, G., Machias, A., Kallianiotis, A., 1991.Distribution of fishes on the Cretan shelf. Journal of Fish Biology39, 661–672.
Tyler, P.A., 1988. Seasonality in the deep sea. Oceanography andMarine Biology: An Annual Review 26, 227–258.
Underwood, A.J., 1997. Experiments in ecology. Their logical designand interpretation using analysis of variance. Cambridge Uni-versity Press, UK.
Ungaro, N., Marano, C.A., Marsan, R., Martino, M., Marzano, M.C.,Strippoli, G., Vlora, A., 1999. Analysis of demersal speciesassemblages from trawl surveys in the South Adriatic Sea. AquaticLiving Resources 12, 177–185.
Ungaro, N., Marano, G., Vlora, A., Martino, M., 1998. Space-timevariations of demersal fish assemblages in the south-westernAdriatic Sea. Vie Milieu 48, 191–201.
Villanueva, R., 1992. Deep-sea cephalopods of the north-westernMediterranean: indications of up-slope ontogenetic migration intwo bathybenthic species. Journal of Zoology 227, 267–276.
Related Documents