167 International Journal of Intelligent Engineering and Systems, Vol.9, No.4, 2016 DOI: 10.22266/ijies2016.1231.18 Spatio-Temporal Modelling of Frequent Human Mobility Pattern to Analyse the Dynamics of Epidemic Disease M. Parimala* Daphne Lopez 1 VIT University, India * Corresponding author’s Email: [email protected] Abstract: Spatial data mining is a rapidly growing field for analysing the data related to space and time. Nowadays most of the applications are based on these factors, so numerous data mining algorithms are developed for spatial characterization and to analyse the spatial trends. The spatial trend analysis determines the change in pattern of some non-spatial attributes on neighbourhood objects. In this paper, we identify spatio-temporal mobility pattern on the dynamics of Epidemic disease (H1N1) that plays a significant role in analysing the outbreak of an infectious disease. Modelling the transmission among the human population with respect to time and space leads to improved understanding of transmission mechanisms. A compartmental model is designed to characterize the disease dynamics of a random variable extracted from binomial and multinomial distribution. ArcGIS tool is used to visualize the mobility distribution of the infected host spatially and yields an output of frequent mobility locations with respect to different time slices. The results thus obtained would help the district administrative authorities to take strategic decisions and prevent the spread of the disease. Keywords: Multinomial distribution; frequent; mobility pattern; GIS; dynamics; epidemic model; spatio-temporal 1. Introduction Spatio-temporal field in Data Mining has gained high popularity in geographic data sciences because of the pervasiveness of a wide range of location based or ecological gadgets that record position, time or/and natural properties of an item or set of objects in real time. So, different approach is required to deal with knowledge discovery and the challenges in information analysis for different kinds of spatio-temporal data. Adapting more about individuals mobility is an essential task for administrative leaders and urban organizers. Mobility information describes the properties of objects in various locations over time and in addition movements of individuals between the locations. The investigation of mobility data is a difficult task to understand the spatio-temporal changes due to its different spatial location. For each object in each time period, there is more number of measurements associated with them, which is not feasible to analyze every measurement in a complex time series. Thus the series of time are analyzed in terms of time slices that represent unique temporal features within which discovery of pattern analysis can be focused. Tracking the spatial change over the time intervals is a challenging and difficult task. The main motivation of this paper is to identify the change and dynamics in spatial-temporal pattern analysis over the mobility of objects in Health Analytics. 2009, H1N1 (swine flu) is a new influenza virus similar to regular seasonal influenza virus that spreads from person-to-person through contact of an infected individual or transportation. Transportation via air traffic has largely contributed to this rapid spread across the globe. The rapidity of the spread depends on the nature of the growing population and the mobility of the infected agent [1]. Though the practice of using concrete data and evidence to support medical decisions has existed for centuries

Welcome message from author
This document is posted to help you gain knowledge. Please leave a comment to let me know what you think about it! Share it to your friends and learn new things together.
Transcript
167
International Journal of Intelligent Engineering and Systems, Vol.9, No.4, 2016 DOI: 10.22266/ijies2016.1231.18
Spatio-Temporal Modelling of Frequent Human Mobility Pattern to Analyse the
Dynamics of Epidemic Disease
M. Parimala* Daphne Lopez
1VIT University, India
* Corresponding author’s Email: [email protected]
Abstract: Spatial data mining is a rapidly growing field for analysing the data related to space and time. Nowadays
most of the applications are based on these factors, so numerous data mining algorithms are developed for spatial
characterization and to analyse the spatial trends. The spatial trend analysis determines the change in pattern of some
non-spatial attributes on neighbourhood objects. In this paper, we identify spatio-temporal mobility pattern on the
dynamics of Epidemic disease (H1N1) that plays a significant role in analysing the outbreak of an infectious disease.
Modelling the transmission among the human population with respect to time and space leads to improved
understanding of transmission mechanisms. A compartmental model is designed to characterize the disease
dynamics of a random variable extracted from binomial and multinomial distribution. ArcGIS tool is used to
visualize the mobility distribution of the infected host spatially and yields an output of frequent mobility locations
with respect to different time slices. The results thus obtained would help the district administrative authorities to
take strategic decisions and prevent the spread of the disease.
Keywords: Multinomial distribution; frequent; mobility pattern; GIS; dynamics; epidemic model; spatio-temporal
1. Introduction
Spatio-temporal field in Data Mining has
gained high popularity in geographic data sciences
because of the pervasiveness of a wide range of
location based or ecological gadgets that record
position, time or/and natural properties of an item or
set of objects in real time. So, different approach is
required to deal with knowledge discovery and the
challenges in information analysis for different
kinds of spatio-temporal data. Adapting more about
individuals mobility is an essential task for
administrative leaders and urban organizers.
Mobility information describes the properties of
objects in various locations over time and in
addition movements of individuals between the
locations. The investigation of mobility data is a
difficult task to understand the spatio-temporal
changes due to its different spatial location. For each
object in each time period, there is more number of
measurements associated with them, which is not
feasible to analyze every measurement in a complex
time series. Thus the series of time are analyzed in
terms of time slices that represent unique temporal
features within which discovery of pattern analysis
can be focused. Tracking the spatial change over the
time intervals is a challenging and difficult task. The
main motivation of this paper is to identify the
change and dynamics in spatial-temporal pattern
analysis over the mobility of objects in Health
Analytics.
2009, H1N1 (swine flu) is a new influenza
virus similar to regular seasonal influenza virus that
spreads from person-to-person through contact of an
infected individual or transportation. Transportation
via air traffic has largely contributed to this rapid
spread across the globe. The rapidity of the spread
depends on the nature of the growing population and
the mobility of the infected agent [1]. Though the
practice of using concrete data and evidence to
support medical decisions has existed for centuries

168
International Journal of Intelligent Engineering and Systems, Vol.9, No.4, 2016 DOI: 10.22266/ijies2016.1231.18
[2], the first outbreak of swine flu was discovered
only four months after the first outbreak in India.
The country’s first swine flu death, that of a 14-
year-old school girl on August 3, 2009 followed by
many more patients succumbing to the disease in the
span of just over a week set off a panic attack that
was spreading faster than the outbreak itself which
is now re-emerging in the state.
A total of 3,315 lives have been lost and
27,236 had been infected due to H1N1 in India. In
2010, the deaths went up to 1,763 while the number
of cases remained around 20,000. In 2011 and 2012,
603 and 5,044 persons, respectively, were diagnosed
positive for the disease and total 480 deaths were
reported. Since January this year, there have been
more than 494 cases of Swine Flu and 95 deaths all
over the country. Rajasthan tops the list with 54
deaths followed by Gujarat (six), Maharashtra and
Delhi (four each). The World Health Organization
(WHO) has reported that in the post-pandemic
period, India had experienced outbreaks during the
period August to October, 2010; May to July 2011;
March and October 2012 and also in January-
February 2016 (Fact sheet of H1N1,WHO [3]).
In a globalized world, infectious diseases such
as SARS, swine flu or seasonal influenza can be
spread over the entire planet by travellers. To enable
a more effective response to this hazard, researchers
are trying to predict the transmission paths and
speed of such epidemics. Mathematical models were
developed to identify the individual mobility
patterns. Human beings are the most complex
unknown system to predict epidemics and their
transmission. The spread of disease entirely depends
on how the infected individual travels. Generally, in
traditional models the human mobility patterns [4]
were idealised because it was difficult to refine them
mathematically. Earlier epidemic models bypassed
this problem by applying the simplified assumption
that an infection spreads according to the principles
of diffusion. Literature studies have proved that it is
difficult to reflect all aspects of human mobility in
the whole huge population. It simplifies the problem
by assuming that each person visit every possible
location or it ignores the members of a population,
as individuals are considered to reach unique source
and destination. This results in an individual
mobility network which consists of the limited
number of destinations that the person will travel to.
In our proposed model, the mobility pattern on
locations is identified rather than mobility pattern on
individual in the population. Any type of epidemic
disease can be classified into various stages namely
susceptible (who are not infected), Infected (who are
infected with the disease), Recovered and Death
compartments. The dynamics of the disease can be
determined by number of people who transit from
one compartment to other compartment. The
transition of human alone is not sufficient to
evaluate the dynamics of disease spread.
Additionally, it requires analysis of mobility pattern
in various locations and time is required to take a
good decision for the administrators.
The main contributions of this paper are as
follows,
(i) A compartmental model (SLITR) is designed to
capture the various disease transition state in the
epidemic disease.
(ii) The rate of change of individual in various
compartments during the transition of disease is
defined using differential equations
(iii) The dynamics of mobility on the epidemic
model with respect spatial (location) and temporal
(time) aspect is determined based on distributive
approach using multinomial distribution.
(iv) The distributive approach is implemented using
Matlab and simulated using Quantum GIS software.
(v) The proposed compartmental model (SLITR) is
compared with other epidemic model (SIR, SEIR)
and proves that the result of the proposed model is
closer to the real dataset.
(vi) The significant contribution from this spatio-
temporal analysis can be used by the district
administrative officers to control the spread or to
make decision on prevention strategies like
vaccination
The paper is organised as follows, Section 2
discuss about the related work, Modelling the
compartmental model is given in Section 3,
Implementation and results are discussed in Section
4 and finally Section 5 concludes the work.
2. Related work
Recently, mining patterns in spatio-temporal
data [5] has been a popular area of research in the
field of data mining. The change of pattern [6][7] in
data with respect to space and time is considered to
be interesting part of spatio-temporal data
mining.W.O. Kermack (1927) laid the foundation
[8] for modeling the spread of epidemics. The very
first mathematical model [9][10] is SIR model
where the closed population is subdivided into
Susceptibles, Infectives and Recovered individuals.
Each infective is infectious for a certain period of
time. The infected individual gets contact with the
susceptibles who will then become infective. After a
certain period, the individual is removed, by
immunization or by death. The above model is
169
International Journal of Intelligent Engineering and Systems, Vol.9, No.4, 2016 DOI: 10.22266/ijies2016.1231.18
proved by certain assumptions [11] like a total
population is kept constant, recovered individuals
are not infected again, age and population structure
is not considered.
Recent methods of ubiquitous computing have
generated large amounts of human behavioural data.
The social and human dynamics are key elements
for the effective modelling of virus spreading.
Traditional epidemiologic models do not capture
individual information and hence have a complex
nature in the ability of disease spreading process. To
overcome this limitation, agent based approaches
are used widely to model spread of epidemic disease.
In agent based modelling (ABM) individual human
behaviour [12][13] and its inherent fuzziness are
simulated by representing every person as a
software agent. In ABM model each agent is
characterized with a variety of variables that are
related to spread of disease such as social
characteristics, socio-economic status, health status,
etc. Even in these approaches the mobility pattern of
human or spatio-temporal aspect is not discussed.
SIR model is based on Agent Based Modeling
(ABM) [14] to model the infectious individual
interactions based on space, time, age and
population structure. The ability to model the spread
of disease is a critical issue for governments and
health organizations. As the behaviour of agent
depends on the census or survey data they fail to
model the spatio temporal dynamics of human
behaviour.
The next compartmental model designed
specifically for sexually transmitted disease is SIS
model where the susceptible individuals become
infected and they become susceptible again. A
slightly varied model SEIR [15], includes
Susceptible individuals who are Exposed to the
environment and become Infectious and then enter
into the Recovered compartment. The SEIAHR [16]
model categorizes the infected individual as
symptomatic and asymptomatic infectious
individual. The symptomatic individual either go for
recovered or treated compartment whereas the
asymptomatic individual transit to the recovered
compartment. The combination of SEIRD and
SEIAHR model is designed as SELMAHRD. In all
the models discussed vaccination rate is taken into
account but in SVEIR [17] model it refers to the
possible states of Susceptible, Vaccination, Exposed,
Infected and Recovered where the vaccinated people
directly enter into recovered compartment
The compartmental models do not focus on
mobility of the individual [18]. In general the
deterministic models fail to consider the spatial
aspects of spread of an epidemic, individual contact
process and the individual behaviour. Global
epidemic and mobility computational model [19]
uses human mobility patterns at a global scale. The
spatial spread of epidemic disease is modelled using
the SEIR where the treated and death compartment
is not analysed. The proposed compartmental model,
analyse the mobility pattern of human population
with disease dynamics in all the compartments with
respect to time. Different levels of population and
human mobility patterns are the most important
factors for spread of disease [20][21]. The
bidirectional movement of an individual mobility
network [22][23] between home and other locations
is analyzed for the spread of disease. The mobility
of the human can be based on the status of the
number of infected individuals in that location [24].
The spatio-temporal pattern for global epidemic is
based on the commuting flows within the local and
global population [25][26]. Segolene et al., [27]
divides the commuting network from residence to
work or school and uses road network to find the
local spread of disease. Two groups are compared
using Jaccard index, where the two districts that are
paired in each network is derived. As a result the
spatial spread of the disease was driven more by
school commuting than by work commuting.
Depending on the age category and commuting
network different patterns of spread are involved in
transmission. But this study fails to analyse the
temporal aspects which is one of the key feature in
epidemic dynamics. Planning for a pandemic (e.g.,
H1N1, influenza, etc) is a public health priority of
any government. Traditional epidemiological
approaches are purely based differential equations
that divide the population into various subgroups
based on the nature and characteristics of the disease.
Although they are extremely successful in guiding
and making decision in health policies, these models
fail to capture the complexity in human mobility
The proposed study models the transmission of
disease with epidemic dynamics derived from
mobility network with respect to various time slices.
The study area includes the densely populated
locations like schools, colleges, work place and
specifically hospitals. This paper focuses on a new
deterministic model for the spread of H1N1 in India
one of the densely populated countries in the world.
This model considers the mobility of the individual
which perhaps, is one of the major strengths to
determine the infection rate. Densely populated
locations are chosen and the spatial mobility of
infected individuals over space and time is
considered to analyse the disease dynamics. Given
the importance of spatial spread of human infectious
diseases, this study demonstrates the crucial role

170
International Journal of Intelligent Engineering and Systems, Vol.9, No.4, 2016 DOI: 10.22266/ijies2016.1231.18
played by human mobility in the spread of epidemic
disease. A compartmental model with Susceptible,
Latent, Infectious and Treatment and Recovered
compartments is designed taking into account the
immunity of the individual. To characterize the
disease dynamics a random variable extracted from
binomial and multinomial distribution is used. In
order to populate the disease spread model, based on
the mobility of the individual road network data of
the state is used. Points of origin are selected based
on the hospitals recognized for treating H1N1 that is
in and around the state of Tamil Nadu, India .A
transport rate factor is derived to estimate the
mobility of the individual from one location to
another based on the number of public transport
plying. This transport rate is then integrated with the
distribution function to determine the location which
has the maximum mobility rate. ArcGIS tool is used
to visualize the mobility distribution of the infected
host. The following section describes the model and
the method of analysis.
3. Modelling of compartmental model Epidemics can be modelled mathematically
inorder to study the severity and prevention
mechanism for spread of disease. A transmission
disease model (SLITR) that is proposed for H1N1
consists of various compartments (Figure 1) such as
Susceptible, Latent, Infectious, Treatment and
Recovered to compute the number of people in a
population at any time. Initial population is
considered in the susceptible compartment. The only
way the people can leave the susceptible group is to
become infected. The people who are infected go to
latent and enter into infected compartment when
they become infectious. Based on the mobility and
symptoms, they are categorized into four
compartments. People with symptoms are treated
and people without symptoms are not treated. Based
on the immunity the treated or non-treated people
enter into recovered and death compartment.
Representation of Symbols
𝑆𝑖 Susceptible Individual at location j
𝐿𝑗 Latent Individual at location j
𝐼𝑗𝑛𝑡 Symptomatic people who do not travel
𝐼𝑗𝑡 Symptomatic people who travel
𝐼𝑗𝑎𝑡
Asymptomatic people who travel
𝐼𝑗𝑎𝑛𝑡
Asymptomatic people who do not travel
𝑇𝑗ℎ People who are treated
𝑇𝑗𝑛ℎ
People who recover with low Immunity
𝑅𝐻𝐼 People who recover with high Immunity
𝐷 People who go to death compartment
3.1 Geographical Dataset
The geographical dataset chosen is for Tamil
Nadu one of the largest and seventh populous states
in India that has the highest number of H1N1
infection according to data (Table 1) provided by
Government of Tamil Nadu, India. It has a
population of 72,138,958 (2011 census) and covers
an area of 130,058 km sq. It has a total of 32
districts which are divided into 10 city corporations,
125 municipalities, 529 town panchayats and 12,524
village panchayats. In the literature, international air
travel has proved to be a good prediction for the
worldwide spread of SARS and influenza A/H1N1
2009, but it was shown that intervention on the
global air traffic would be of limited efficacy. At a
more local scale, air travel is less relevant and other
types of movement must be taken into account.
Commuting, i.e. daily movements from residence to
work, school, college and hospitals has been widely
used to describe spatial mobility in models, using
exhaustive datasets or gravity models. Since the
spread of disease occurs due to the mobility of the
infected individual, we consider road transportation
to be the commuting network.
3.2 Immunity Analysis
Immune system of human comprises of
proteins, tissues and organs that work together to
protect our body. Immune cells are made up of
white blood cells or leukocytes. There are two types
of leukocytes [28] namely B cells and T cells. The B
cells produce antibodies and the T cells determine
the immunity level of the person. The immunity
level of the individual can be determined using age,
vaccination and T cells factors. The normal value of
T cells range between 500-1500 cells/mm. The T
cell count for a H1N1 vaccinated person [29] must
be greater than 200 cells/mm. The age factor is
broadly categorized into three types namely
category-1 whose age value between 1 and 25,
category-2 (26-55) and category-3 (56-80).
Immunity level of an individual either low or high is
based on age, vaccination status and T cell count
and is depicted in Figure 2.

171
International Journal of Intelligent Engineering and Systems, Vol.9, No.4, 2016 DOI: 10.22266/ijies2016.1231.18
Figure. 1 Compartmental model
Figure. 2 Decision tree for Immunity
<20<20
0
>50<50
0
>30
<30
>50
<20>20
<50
Age
Vaccination Vaccination Vaccination
T cells T cells
T cells T
cells
T
cells
T cells
LI
LI
LI LI
H
H
HH
I
LI
Y Y
Y
N N N
Category-1
Category-2 Category-3
𝜇 (1 − 𝜇) 𝜇
(1 − 𝜇) 𝜇
휀(1 − 𝑝ℎ) 휀(1 − 𝑝ℎ) 휀𝑝ℎ 휀𝑝ℎ
ph
휀(1 − 𝑝𝑡)𝑝𝑎
휀𝑝𝑡𝑝𝑎 휀𝑝𝑡(1 − 𝑝𝑎)
휀(1 − 𝑝𝑡)(1
− 𝑝 )
𝛽
AsymInfTravel AsymInfNoTravel SymInfTravel SymInfNotravel
Treated NotTreated
RecoveredHighImm Death RecoveredLowImm
Latent
Susceptible

172
International Journal of Intelligent Engineering and Systems, Vol.9, No.4, 2016 DOI: 10.22266/ijies2016.1231.18
Table 1. A Report on Influenza A (H1N1) of various
districts
Sno State name Number of infected
individual
1 Andra Pradesh 41
2 Kerala 25
3 Maharastra 2
4 Karnataka 6
5 Pune 2
6 Jharkhand 5
7 U.P 1
8 Pondicherry 1
9 Manipur 1
10 Meghalaya 1
11 Jharkhand 5
12 Tamil Nadu 297
13 Others 45
Total 432
3.3 Transition between the compartments
The Susceptible population (𝑆𝑖 ) enter into
latent compartment ( 𝐿𝑗 ) with the probability of
𝛽 ∆𝑡 where ∆𝑡 is the time interval. The symbol
휀 denotes a small probability value that selects
random action independent of the current action
values. The latent individuals either transit to
asymptomatic infectious compartment (𝐼𝑗𝑎 ) with the
probability of 𝑝𝑎 or they transit to the symptomatic
infectious ( 𝐼𝑗 ) compartment with the probability
of (1 − 𝑝𝑎) . People with symptoms are further
divided as who travel (𝐼𝑗𝑡 ) with the probability of
𝑝𝑡 and those who do not travel ( 𝐼𝑗𝑛𝑡 ) with the
probability of (1 − 𝑝𝑡). People without symptoms
are also classified as those who travel ( 𝐼𝑗𝑎𝑡 ) and
those who do not travel (𝐼𝑗𝑎𝑛𝑡) with the probability
of 𝑝𝑡 and (1 − 𝑝𝑡) . The entire symptomatic
infectious person enters into treated compartment
(𝑇𝑗ℎ) with the probability of 𝑝ℎ. The probability at
which an asymptomatic infectious person transit into
compartment with no treatment (𝑇𝑗𝑛ℎ ) is(1 − 𝑝ℎ).
The probability of the treated individuals moving
into the recovered compartment with high and low
immune is µ∆t. Individuals who are not treated
enters into 𝑅𝐻𝐼 (recovered with high immune). A
person enters the death compartment (D)
irrespective of being treated or not treated has a
probability of 1- µ in the time step ∆t. The transition
between each compartment is summarized (Table 2)
as follows
Table 2. Transition between each compartment
Transition Rate
𝑺𝒊 → 𝑳𝒋 𝛽
𝑳𝒊 → 𝑰𝒋𝒕 휀𝑝𝑡(1 − 𝑝𝑎)
𝑳𝒊 → 𝑰𝒋𝒏𝒕 휀(1 − 𝑝𝑡)(1 − 𝑝𝑎)
𝑳𝒊 → 𝑰𝒋𝒂𝒕 휀𝑝𝑡𝑝𝑎
𝑳𝒊 → 𝑰𝒋𝒂𝒏𝒕 휀(1 − 𝑝𝑡)𝑝𝑎
𝑰𝒋𝒕, 𝑰𝒋
𝒏𝒕 → 𝑻𝒋𝒉 휀𝑝ℎ
𝑰𝒋𝒂𝒕, 𝑰𝒋
𝒂𝒏𝒕 → 𝑻𝒋𝒏𝒉 휀(1 − 𝑝ℎ)
𝑻𝒋𝒉 → 𝑹𝑳𝑰, 𝑹𝑯𝑰 𝜇
𝑻𝒋𝒏𝒉 → 𝑹𝑯𝑰 𝜇
𝑻𝒋𝒉, 𝑻𝒋
𝒏𝒉 → 𝑫 (1 − 𝜇)
SLITR model can be described by the following
system of differential equations from Equation (1) to
Equation (11). These equations find the number of
people in each compartment at time t.
𝑑𝑆
𝑑𝑡= 𝑁 − 𝛽𝑆 (1)
𝑑𝐿
𝑑𝑡= 𝛽𝑆 − ((1 − 𝑝𝑡)(1 − 𝑝𝑎) + 𝑝𝑡(1 − 𝑝𝑎) +
𝑝𝑡𝑝𝑎 + (1 − 𝑝𝑡)𝑝𝑎)𝐿 (2)
𝑑𝐼𝑛𝑡
𝑑𝑡= ((1 − 𝑝𝑡)(1 − 𝑝𝑎))𝐿 − 𝑝ℎ𝐼𝑛𝑡 (3)
𝑑𝐼𝑡
𝑑𝑡= (𝑝𝑡(1 − 𝑝𝑎))𝐿 − 𝑝ℎ𝐼𝑡 (4)
𝑑𝐼𝑎𝑛𝑡
𝑑𝑡= 𝑝𝑡𝑝𝑎𝐿 − (1 − 𝑝ℎ)𝐼𝑎𝑛𝑡 (5)
𝑑𝐼𝑎𝑡
𝑑𝑡= (1 − 𝑝𝑡)𝑝𝑎𝐿 − (1 − 𝑝ℎ)𝐼𝑎𝑡 (6)
𝑑𝑇ℎ
𝑑𝑡= 𝑝ℎ(𝐼𝑛𝑡 + 𝐼𝑡) − 𝜇𝑇ℎ (7)
𝑑𝑇𝑛ℎ
𝑑𝑡= (1 − 𝑝ℎ)(𝐼𝑎𝑛𝑡 + 𝐼𝑎𝑡) − 𝑇𝑛ℎ (8)
𝑑𝑅𝐿𝐼
𝑑𝑡= 𝜇𝑇ℎ (9)
𝑑𝑅𝐻𝐼
𝑑𝑡= 𝜇(𝑇ℎ + 𝑇𝑛ℎ) (10)
𝑑𝐷
𝑑𝑡= (1 − 𝜇)(𝑇ℎ + 𝑇𝑛ℎ) (11)
173
International Journal of Intelligent Engineering and Systems, Vol.9, No.4, 2016 DOI: 10.22266/ijies2016.1231.18
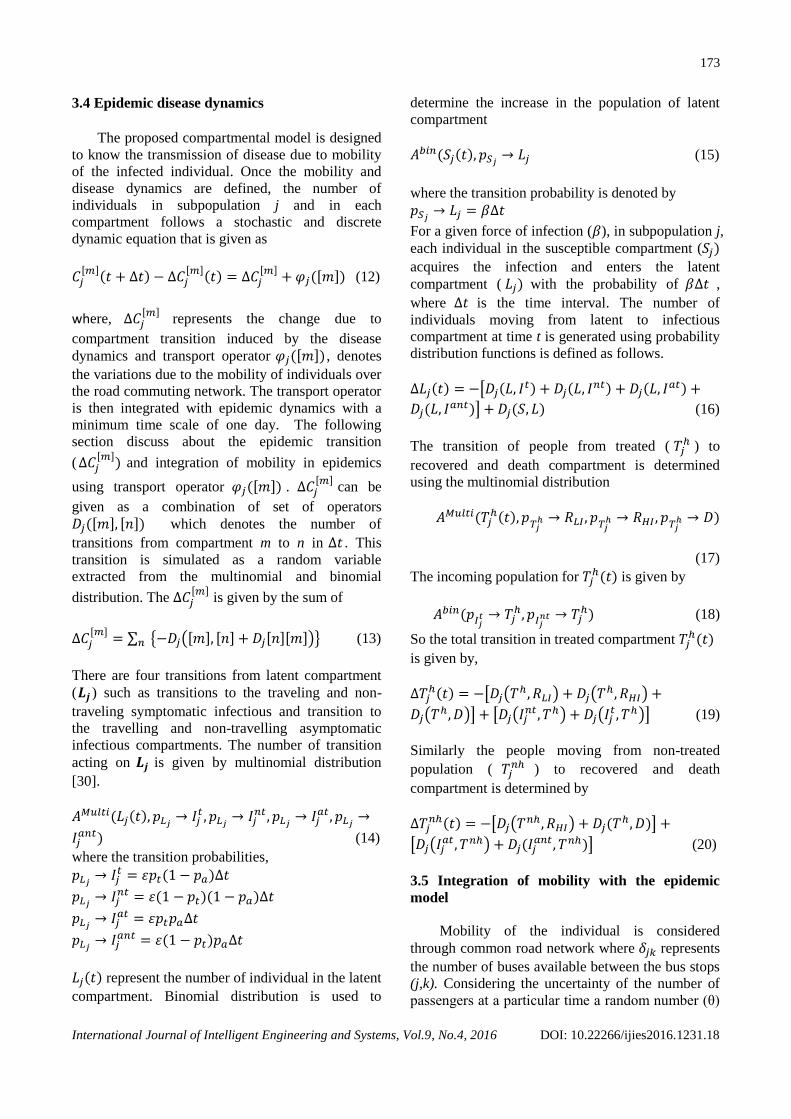
3.4 Epidemic disease dynamics
The proposed compartmental model is designed
to know the transmission of disease due to mobility
of the infected individual. Once the mobility and
disease dynamics are defined, the number of
individuals in subpopulation j and in each
compartment follows a stochastic and discrete
dynamic equation that is given as
𝐶𝑗[𝑚]
(𝑡 + ∆𝑡) − ∆𝐶𝑗[𝑚]
(𝑡) = ∆𝐶𝑗[𝑚]
+ 𝜑𝑗([𝑚]) (12)
where, ∆𝐶𝑗[𝑚]
represents the change due to
compartment transition induced by the disease
dynamics and transport operator 𝜑𝑗([𝑚]), denotes
the variations due to the mobility of individuals over
the road commuting network. The transport operator
is then integrated with epidemic dynamics with a
minimum time scale of one day. The following
section discuss about the epidemic transition
( ∆𝐶𝑗[𝑚]
) and integration of mobility in epidemics
using transport operator 𝜑𝑗([𝑚]) . ∆𝐶𝑗[𝑚]
can be
given as a combination of set of operators
𝐷𝑗([𝑚], [𝑛]) which denotes the number of
transitions from compartment m to n in ∆𝑡 . This
transition is simulated as a random variable
extracted from the multinomial and binomial
distribution. The ∆𝐶𝑗[𝑚]
is given by the sum of
∆𝐶𝑗[𝑚]
= ∑ {−𝐷𝑗([𝑚], [𝑛] + 𝐷𝑗[𝑛][𝑚])}𝑛 (13)
There are four transitions from latent compartment
(𝑳𝒋 ) such as transitions to the traveling and non-
traveling symptomatic infectious and transition to
the travelling and non-travelling asymptomatic
infectious compartments. The number of transition
acting on 𝑳𝒋 is given by multinomial distribution
[30].
𝐴𝑀𝑢𝑙𝑡𝑖(𝐿𝑗(𝑡), 𝑝𝐿𝑗→ 𝐼𝑗
𝑡 , 𝑝𝐿𝑗→ 𝐼𝑗
𝑛𝑡, 𝑝𝐿𝑗→ 𝐼𝑗
𝑎𝑡, 𝑝𝐿𝑗→
𝐼𝑗𝑎𝑛𝑡) (14)
where the transition probabilities,
𝑝𝐿𝑗→ 𝐼𝑗
𝑡 = 휀𝑝𝑡(1 − 𝑝𝑎)∆𝑡
𝑝𝐿𝑗→ 𝐼𝑗
𝑛𝑡 = 휀(1 − 𝑝𝑡)(1 − 𝑝𝑎)∆𝑡
𝑝𝐿𝑗→ 𝐼𝑗
𝑎𝑡 = 휀𝑝𝑡𝑝𝑎∆𝑡
𝑝𝐿𝑗→ 𝐼𝑗
𝑎𝑛𝑡 = 휀(1 − 𝑝𝑡)𝑝𝑎∆𝑡
𝐿𝑗(𝑡) represent the number of individual in the latent
compartment. Binomial distribution is used to
determine the increase in the population of latent
compartment
𝐴𝑏𝑖𝑛(𝑆𝑗(𝑡), 𝑝𝑆𝑗→ 𝐿𝑗 (15)
where the transition probability is denoted by
𝑝𝑆𝑗→ 𝐿𝑗 = 𝛽∆𝑡
For a given force of infection (𝛽), in subpopulation j,
each individual in the susceptible compartment (𝑆𝑗)
acquires the infection and enters the latent
compartment ( 𝐿𝑗) with the probability of 𝛽∆𝑡 ,
where ∆𝑡 is the time interval. The number of
individuals moving from latent to infectious
compartment at time t is generated using probability
distribution functions is defined as follows.
∆𝐿𝑗(𝑡) = −[𝐷𝑗(𝐿, 𝐼𝑡) + 𝐷𝑗(𝐿, 𝐼𝑛𝑡) + 𝐷𝑗(𝐿, 𝐼𝑎𝑡) +
𝐷𝑗(𝐿, 𝐼𝑎𝑛𝑡)] + 𝐷𝑗(𝑆, 𝐿) (16)
The transition of people from treated ( 𝑇𝑗ℎ ) to
recovered and death compartment is determined
using the multinomial distribution
𝐴𝑀𝑢𝑙𝑡𝑖(𝑇𝑗ℎ(𝑡), 𝑝
𝑇𝑗ℎ → 𝑅𝐿𝐼 , 𝑝
𝑇𝑗ℎ → 𝑅𝐻𝐼 , 𝑝
𝑇𝑗ℎ → 𝐷)
(17)
The incoming population for 𝑇𝑗ℎ(𝑡) is given by
𝐴𝑏𝑖𝑛(𝑝𝐼𝑗𝑡 → 𝑇𝑗
ℎ, 𝑝𝐼𝑗𝑛𝑡 → 𝑇𝑗
ℎ) (18)
So the total transition in treated compartment 𝑇𝑗ℎ(𝑡)
is given by,
∆𝑇𝑗ℎ(𝑡) = −[𝐷𝑗(𝑇ℎ, 𝑅𝐿𝐼) + 𝐷𝑗(𝑇ℎ, 𝑅𝐻𝐼) +
𝐷𝑗(𝑇ℎ, 𝐷)] + [𝐷𝑗(𝐼𝑗𝑛𝑡, 𝑇ℎ) + 𝐷𝑗(𝐼𝑗
𝑡, 𝑇ℎ)] (19)
Similarly the people moving from non-treated
population ( 𝑇𝑗𝑛ℎ ) to recovered and death
compartment is determined by
∆𝑇𝑗𝑛ℎ(𝑡) = −[𝐷𝑗(𝑇𝑛ℎ, 𝑅𝐻𝐼) + 𝐷𝑗(𝑇ℎ, 𝐷)] +
[𝐷𝑗(𝐼𝑗𝑎𝑡 , 𝑇𝑛ℎ) + 𝐷𝑗(𝐼𝑗
𝑎𝑛𝑡, 𝑇𝑛ℎ)] (20)
3.5 Integration of mobility with the epidemic
model
Mobility of the individual is considered
through common road network where 𝛿𝑗𝑘 represents
the number of buses available between the bus stops
(j,k). Considering the uncertainty of the number of
passengers at a particular time a random number (θ)

174
International Journal of Intelligent Engineering and Systems, Vol.9, No.4, 2016 DOI: 10.22266/ijies2016.1231.18
is generated between the interval (-1,1) at time t. We
assume that on each route (j,k), the stochastic
variable for the flux of passengers at time t is given
by
𝛿𝑗�̃� = ∆𝛿𝑗𝑘[𝛼 + 𝜃(1 − 𝛼)] (21)
where 𝛼 is the average occupancy rate (70-90%).
The probability of each individual 𝐶𝑗[𝑚]
in
compartment m traveling from j to k location is
𝑝𝑗𝑘 =𝛿𝑗�̃�∆𝑡
𝑁𝑗 where 𝑁𝑗 denotes the number of people
in subpopulation j. The number of individuals
traveling (𝜉𝑗𝑘 ) from the subpopulation j on each
route j → k at time t is defined using multinomial
distribution.
𝑃({𝜉𝑗𝑘}) =𝐶𝑗
[𝑚]!
(𝐶𝑗[𝑚]
−∑ 𝜉𝑗𝑘𝑘 )! ∏ 𝜉𝑗𝑘!𝑘
∏ 𝑝𝑗𝑘𝜉𝑗𝑘 ×𝑘
(1 − ∑ 𝑝𝑗𝑘)𝑘
(𝐶𝑗[𝑚]
−∑ 𝜉𝑗𝑘𝑘 ) (22)
Where
𝐶𝑗[𝑚]
is the number of individuals in compartment
m at j location
𝐶𝑗[𝑚]
− ∑ 𝜉𝑗𝑘𝑘 is the number of individual who do
not travel
𝜉𝑗𝑘 is the number of people who travel from j to k
The multinomial distribution 𝑃({𝜉𝑗𝑘}) gives the
probability of individual traveling from j to all the
other possible routes. Now, the transport operator at
location j in compartment m is defined by,
𝜑𝑗([𝑚]) = ∑ (𝜉𝑘𝑗 (𝐶𝑘[𝑚]
) − 𝜉𝑗𝑘 (𝐶𝑗[𝑚]
)𝑘 ) (23)
The value generated from equation (23) is
substituted in equation (12) to find the number of
people moving from subpopulation j to k for each
compartment.
4. Results and Discussion
The geographic space considered for the study
includes Vellore district and Chennai. The data on
the locations is collected from the National
Informatics centre (NIC) of Vellore district. Table 3
below shows the source and destination locations j
and (𝑘1,2…10) respectively, that are considered for
determining the mobility of the individuals in the
infected (m) compartment. One of the densely
populated location, Christian Medical College
(CMC) hospital is an authorized H1N1 influenza
treatment centre and the locations in and around the
Vellore district is considered as source and
destination locations.
Temporal pattern of a patient in a day is
sliced in five intervals namely t1(7 am - 9 am), t2(9
am- 12 pm), t3(12 pm- 3 pm), t4(3 pm-6 pm) and
t5(6 pm-9 pm). The mobility of an infected
individual through this time interval from source
location j to destination locations 𝑘𝑖 and vice versa
is collected for the month of August, 2012. For each
time slice, data of symptomatic and asymptomatic
infected population who travel is collected and
scaled as 0 to 4 using min-max normalization
technique. If there is more mobility of infected
population, it denotes 4 and 0 if there is no mobility
of infected individual.
Table 3. j represents the source location, 𝑘1,𝑘2 … 𝑘10
represents destination location
Location name
j CMC
Hospital,Vellore
𝑘1 Tirupattur
𝑘2 Vaniyambadi
𝑘3 Ambur
𝑘4 Gudiyattam
𝑘5 Katpadi
𝑘6 Wallaja
𝑘7 Arcot
𝑘8 Arrakonam
𝑘9 Chennai
𝑘10 Tiruvallur
175
International Journal of Intelligent Engineering and Systems, Vol.9, No.4, 2016 DOI: 10.22266/ijies2016.1231.18
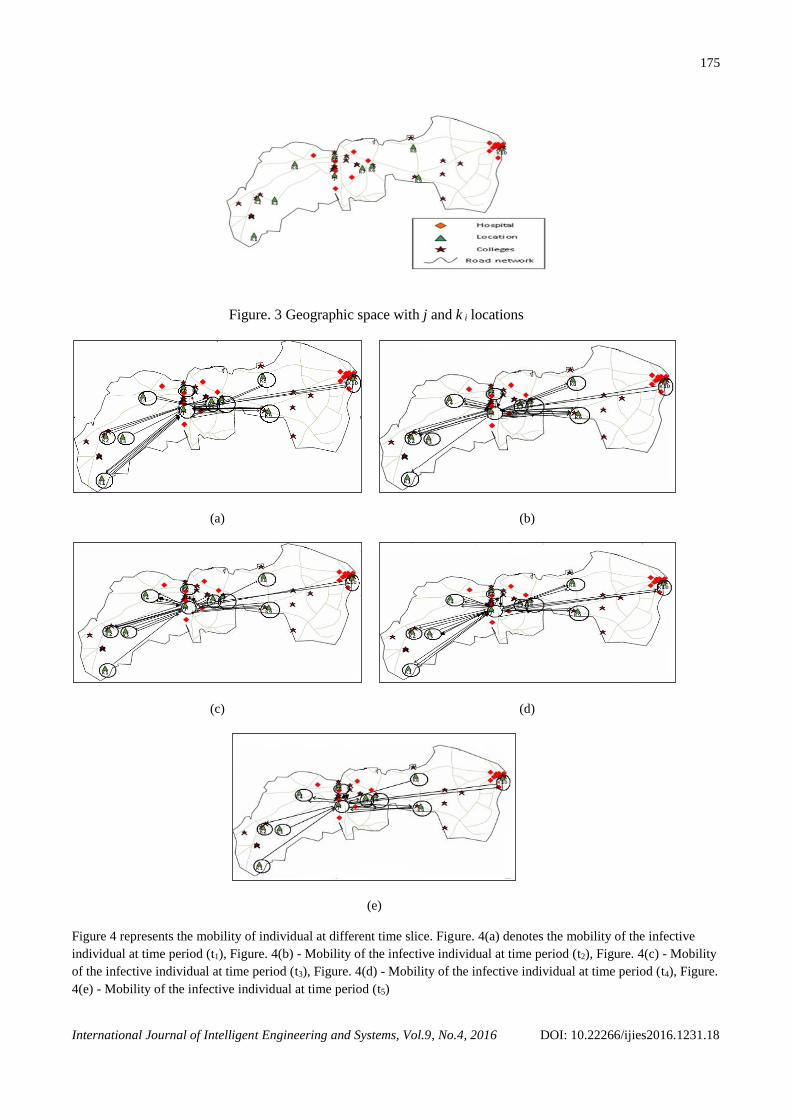
Figure. 3 Geographic space with j and k i locations
(a)
(b)
(c)
(d)
(e)
Figure 4 represents the mobility of individual at different time slice. Figure. 4(a) denotes the mobility of the infective
individual at time period (t1), Figure. 4(b) - Mobility of the infective individual at time period (t2), Figure. 4(c) - Mobility
of the infective individual at time period (t3), Figure. 4(d) - Mobility of the infective individual at time period (t4), Figure.
4(e) - Mobility of the infective individual at time period (t5)

176
International Journal of Intelligent Engineering and Systems, Vol.9, No.4, 2016 DOI: 10.22266/ijies2016.1231.18
Table 4. Probability distribution for mobility of infected
individual
Time
period
Probability
value
Location
𝑡1 0.12 𝑗 → 𝑘3
𝑡2 0.75 𝑗 → 𝑘9
𝑡3 0.52 𝑘3 → 𝑗
𝑡4 0.32 𝑘4 → 𝑗
𝑡5 0.10 𝑗 → 𝑘9
The numbers of people moving from source to
destination location at various time slices are
recorded. When the initial infected population in
each location is defined, the number of individuals
in an infected compartment ( ∆𝐶𝑗[𝑖𝑛𝑓]
) for each
subpopulation is calculated using
∆𝐶𝑗[𝑚]
= ∑ {−𝐷𝑗([𝑚], [𝑛] + 𝐷𝑗[𝑛][𝑚])}𝑛 (24)
A multinomial distribution analysis is
performed using MATLAB. For each time slice the
probability of individuals moving from the source to
each destination location in the infected
compartment is determined. Finally the maximum
probability value at each time slice is taken into
account. Table 4 shows the routes with high
probability distribution value. The probability
distribution for mobility of infected individuals
seems to be high for the time slices 𝑡2 to 𝑡4 in
locations 𝑘3, 𝑘4 and 𝑘9.
The spatio-temporal mobility pattern is derived
using multinomial distribution model where the
probability of people moving from one location to
another location is generated with respect to
dynamics of disease. As a result, the location that
has a frequent mobility of individual in each
compartment for various time slices is calculated. In
order to verify the validity of the model it is
compared with the result of mathematical model.
The model based on differential equations defines
the rate of individual present at that particular time
but it fails to analyze the rate of change based on
location. The mobility pattern on location is more
effective when compared on pattern derived from
human due to its complexity to design the human
patterns. The locations that have frequent mobility
are ranked and is more useful for the district
administrators to make decision on prevention
strategies. The time slice (t2) is the peak time period
where there are more number of people moving
from j location to ki locations in infected
compartment.
To visualize and simulate the mobility
distribution of the input dataset, we use Quantum
GIS (1.7.1) software. It is used to overlay road
network map, source and destination location map,
college map, hospital map and mobility of infected
population over geographical space map (considered
for the study) (Figure 3). The resultant map is then
analyzed to determine the mobility of the infected
individuals at different time slices (Figure 4(a) -
Figure 4(e)). The results clearly depicts that there is
a high mobility during the time periods 𝑡2 to 𝑡4
(Figure 4(b), Figure 4(c) and Figure 4(d)) which is
similar to values derived from multinomial
distribution. The experiment shows that the mobility
distribution pattern identified using multinomial
distribution is effective.
However, this analysis shows that differences
in commuting networks could lead to changes in
spatial spread. For example, the random distribution
is not considered for the analysis. If the infected
individual starts form the source location, but did
not reach the destination location. Instead of using
smoothed version based on a gravity model, we used
the raw commuting data from the census. As our
data collected was exhaustive, preprocessing of data
was not necessary. Even though using raw data
leads to more heterogeneity in commuting links, it
may also lead to results that are very dependent on
the reported mobility that captures only a part of
human mobility. Most of the mobility pattern studies
have used SIR and SEIR compartmental models
where these models fails to analyse the treatment
compartment and also the mobility rate is not
included in these models. In the proposed SLITR
model, various compartments are designed and
distribution of mobility pattern can be derived for
any compartment.
In order to find the effectiveness of the
proposed SLITR model, transmission rate is
calculated for all the epidemic models such as SIR,
SEIR based on two approaches namely differential
and distributive approach. The transmission rate
(TR) is the percentage of the possible contacts that
results in the disease being spread. It calculates the
number of people who get infected per time period
by the infectious person. The outbreak of disease is
identified by reproduction number (R0). If the
reproduction number is less than 1, then the spread
of infection will die out where the removal rate is
greater than the infection rate. If the reproduction
number is greater than one, then the infection will be
able to spread in population where the recovery rate
is greater than the infection rate. To control the
177
International Journal of Intelligent Engineering and Systems, Vol.9, No.4, 2016 DOI: 10.22266/ijies2016.1231.18
spread of disease the infection or transmission rate
must be minimized. The value generated using
transport operator from Equation 23 is used as
mobility rate or contact rate for SLITR model. The
transmission rate (TR=0.29) calculated in time slice
t2 (Table 5) is greater than other time slice. In the
same time slice the TR= 0.16 and TR=0.20 for the
models SIR and SEIR. As a result the proposed
model is closer to the real dataset (TR=0.33) that is
considered for this study and also proves the
significance of mobility factor for the modelling of
disease. This inference also shows that the mobility
is directly proportional to the spread of disease.
These insights and findings not only captures
human mobility relevant for the geographical
epidemic spread, but they may pave the way for
modelling important dynamical process in human
and animal epidemiology. Thus the commuting data
that is used to describe the population mobility in
epidemic models is highly correlated with the spread
of epidemic disease.
Table 5. Transmission rate of different epidemic models
Time
slice
Transmission Rate (TR)
SIR SEIR SLITR Observed
Dataset
t1 0.025 0.042 0.067 0.08
t2 0.16 0.20 0.29 0.33
t3 0.108 0.148 0.150 0.192
t4 0.06 0.075 0.108 0.125
t5 0.01 0.033 0.05 0.067
5. Conclusion
The paper focuses on identifying the mobility of an
infected individual to predict the transmission rate
of H1N1 a pandemic that occurred first in 2009.
Initially a compartmental model is developed that
categorizes the individuals who travel and who do
not travel. Further to this, dynamics of disease is
predicted using a distributive approach. Travel
pattern of the infected individual plays a key role in
predicting the spread of disease over space and time.
The transmission of the proposed model is
compared with other epidemic models and is
observed that SLITR transmission rate is very much
closer to the actual transmission rate, which is 87%
accurate whereas SIR and SEIR is 48% and 60%
respectively over all time slices. This analysis will
be very much useful for policy decision makers on
designing prevention and control strategies. Our
future work considers the social structure and
characteristics of the infected individuals for
designing decision support system.
References
[1] L. Hufnagel, D. Brockmann and T. Geisel,
“Forecast and control of epidemics in a globalized
world”, Proceedings of the National Academy of
Sciences of the United States of America, Vol. 101,
No.42, pp. 15124-15129, 2004. [2] A. Flahault, E. Vergu, L. Coudeville and R. Grais,
“Strategies to conducting a global influenza
pandemic”, Vaccine, Vol. 24, pp. 6751-6755, 2006.
[3] World Health Organization, Influenza: Fact sheet,
http://www.who.int/csr/disease/swineflu/en
[4] B. D. Dalziel, B. Pourbohloul and S. P. Ellner,
“Human mobility patterns predict divergent
epidemic dynamics among cities”, Proceedings of
the Royal Society of London B: Biological
Sciences, Vol. 280, 20130763, 2013.
[5] H. Malchow, S. Petrovskii, and E. Venturino,
Spatio temporal patterns in ecology and
epidemiology: theory, models, and simulation.
London: Chapman & Hall/CRC, 2008.
[6] H. Yang, S. Parthasarathy and S. Mehta, “A
generalized framework for mining spatio-temporal
patterns in scientific data”, In Proceedings of the
eleventh ACM SIGKDD International Conference
on Knowledge discovery in data mining, pp. 716-
721, 2008.
[7] Y. Huang, L. Zhang and P. Zhang, “A framework
for mining sequential patterns from spatio-temporal
event data sets”, IEEE Transactions on Knowledge
and Data Engineering, Vol. 20, No. 4, pp. 433-448,
2008.
[8] W.O. Kermack, “A contribution of the
Mathematical Theory of Epidemics”, Proceedings
of the Royal Society, Vol. 115, pp. 700-72, 1927.
[9] S. A. Karim and R. Razali, “A proposed
Mathematical Model of Influenza A, H1N1 for
Malaysia”, Journal Applied Sciences, Vol. 11, pp.
1457-1460, 2011.
[10] L. Rvachev and I. M. Longini, “A mathematical
model for the global spread of influenza”,
Mathematical biosciences, Vol. 75, No. 1, pp.3-22,
1985.
[11] H. C. Tuckwell and R. J. Williams, “Some
properties of a simple stochastic epidemic model of
SIR type”, Mathematical biosciences, Vol. 208,
No.1, pp.76-97, 2007.
[12] E. Frias-Martinez, G. Williamson and V. Frias-
Martinez, “An agent-based model of epidemic
spread using human mobility and social network
information”, IEEE Third International Conference
on Social Computing (SocialCom),pp. 57-64, 2011
[13] L. Perez, and S. Dragicevic, “An agent-based
approach for modeling dynamics of contagious
disease spread”, International journal of health
geographics, Vol. 8, No. 1, 2009.

178
International Journal of Intelligent Engineering and Systems, Vol.9, No.4, 2016 DOI: 10.22266/ijies2016.1231.18
[14] K.M. Khalil, M. Abdel-Aziz, T.T. Nazmy and A.
Salem, “An Agent-Based Modeling for Pandemic
Influenza in Egypt”, CoRR abs/1001.5275, 2010.
[15] Y. Zhang, Z. Liu, Y. Zhang, H. Yang, L. Fang and
X. Xiao, “Spatially explicit epidemiological
simulation system of influenza A (H1N1) in China”,
18th International Conference on Geoinformatics,
pp. 1-6, 2010.
[16] Yang, Kang-Hung and Jin-Yuan Hsu, "A new SIR-
based model for influenza epidemic", World
Academy of Science, Engineering and
Technology, Vol. 6, 2012.
[17] C. Sun, Y.H. Hsieh, “Global analysis of an SEIR
model with varying population size and
vaccination”, Applied Mathematical Modelling, Vol.
34, No. 10, pp. 2685-2697, 2010.
[18] M. Marder, “Dynamics of epidemics on random
networks”, Physical Review E, Vol. 75, pp.
066103/1–5, 2007.
[19] D. Balcan, B. Gonçalves, H. Hu, J. J. Ramasco, V.
Colizza, and A. Vespignani, “Modeling the spatial
spread of infectious diseases: The GLobal Epidemic
and Mobility computational model”, Journal of
computational science, Vol. 1, No. 3, pp. 132-145,
2010.
[20] S. Merler and M. Ajelli, “Human mobility and
population heterogeneity in the spread of an
epidemic”, Procedia Computer Science, Vol. 1, No.
1, pp. 2237-2244, 2010.
[21] L. Sattenspiel and K. Dietz, “A structured epidemic
model incorporating geographic mobility among
regions”, Mathematical biosciences, Vol. 128, No. 1,
pp. 71-91, 1995.
[22] V. Belik, T. Geisel and D. Brockmann, ”Natural
human mobility patterns and spatial spread of
infectious diseases”, Physical Review X, Vol. 1, No.
1, 011001, 2011
[23] S. Eubank, H. Guclu., V.S. Anil Kumar, M.V.
Marathe, A. Srinivasan, Z. Toroczkai, N. Wang,
“Modelling disease outbreaks in realistic urban
social networks”, Nature, Vol. 429, pp. 180-184,
2004.
[24] B. Wang, L. Cao, H. Suzuki and K. Aihara,
“Safety-information-driven human mobility patterns
with metapopulation epidemic dynamics”, scientific
reports, 2, 2012.
[25] D. Balcan, V. Colizza, B. Gonçalves, H. Hu, J.
Ramasco and A. Vespignani, “Multiscale mobility
networks and the spatial spreading of infectious
diseases”, Proceedings of the National Academy of
Sciences, Vol. 106, No.51, pp. 21484-21489, 2009.
[26] S. Riley, “Large-scale spatial-transmission models
of infectious disease”, Science, Vol. 316, pp. 1298-
1301, 2007.
[27] S. Charaudeau, K. Pakdaman and P. Y. Boelle,
“Commuter mobility and the spread of infectious
diseases: application to influenza in France”, PloS
one, Vol. 9, No. 1, e83002, 2014.
[28] L. Goldman and A. I. Schafer, Cecil Medicine:
Expert Consult-Online. Elsevier Health Sciences,
2011.
[29] A. M. Mavinkurve-Groothuis, M. van der Flier, F.
Stelma, C. van Leer-Buter, F. W. Preijers and P. M.
Hoogerbrugge, “Absolute lymphocyte count
predicts the response to new influenza virus H1N1
vaccination in pediatric cancer patients”, Clinical
and Vaccine Immunology, Vol. 20, No. 1, pp. 118-
121, 2013.
[30] H. Kesten, and N. Morse, “A property of the
multinomial distribution”, The Annals of
Mathematical Statistics, Vol. 30, No. 1, pp. 120-127,
1959.
Related Documents