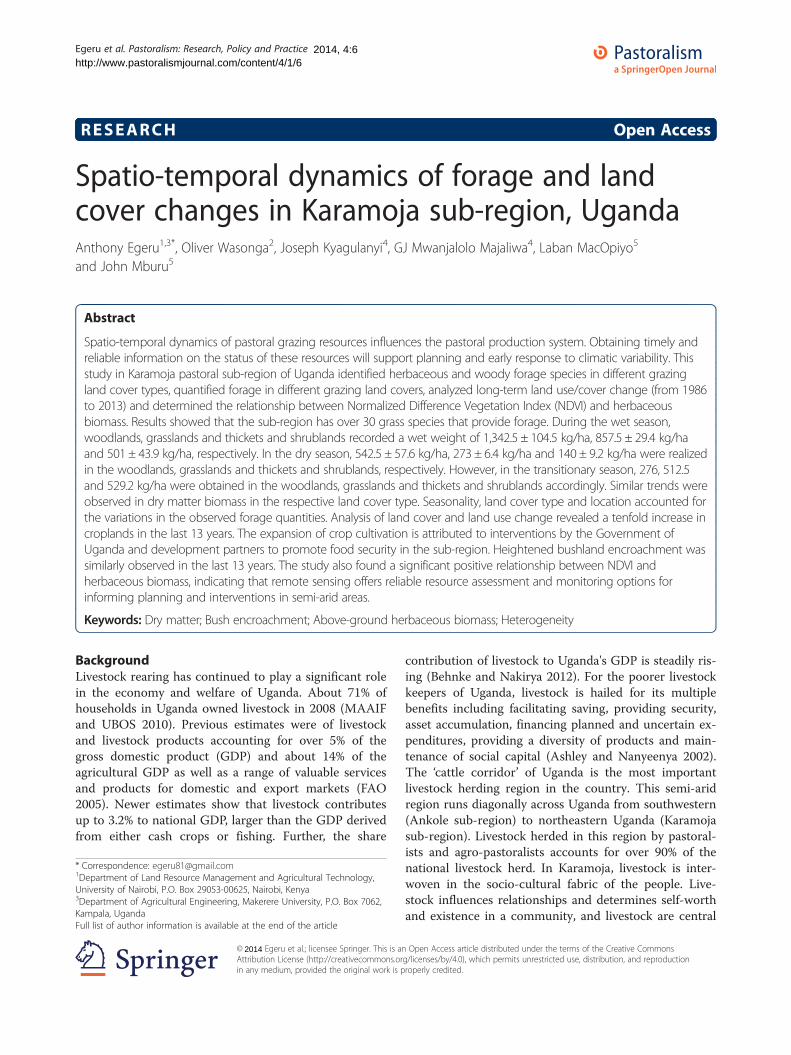
RESEARCH Open Access Spatio-temporal dynamics of forage and land cover changes in Karamoja sub-region, Uganda Anthony Egeru 1,3* , Oliver Wasonga 2 , Joseph Kyagulanyi 4 , GJ Mwanjalolo Majaliwa 4 , Laban MacOpiyo 5 and John Mburu 5 Abstract Spatio-temporal dynamics of pastoral grazing resources influences the pastoral production system. Obtaining timely and reliable information on the status of these resources will support planning and early response to climatic variability. This study in Karamoja pastoral sub-region of Uganda identified herbaceous and woody forage species in different grazing land cover types, quantified forage in different grazing land covers, analyzed long-term land use/cover change (from 1986 to 2013) and determined the relationship between Normalized Difference Vegetation Index (NDVI) and herbaceous biomass. Results showed that the sub-region has over 30 grass species that provide forage. During the wet season, woodlands, grasslands and thickets and shrublands recorded a wet weight of 1,342.5 ± 104.5 kg/ha, 857.5 ± 29.4 kg/ha and 501 ± 43.9 kg/ha, respectively. In the dry season, 542.5 ± 57.6 kg/ha, 273 ± 6.4 kg/ha and 140 ± 9.2 kg/ha were realized in the woodlands, grasslands and thickets and shrublands, respectively. However, in the transitionary season, 276, 512.5 and 529.2 kg/ha were obtained in the woodlands, grasslands and thickets and shrublands accordingly. Similar trends were observed in dry matter biomass in the respective land cover type. Seasonality, land cover type and location accounted for the variations in the observed forage quantities. Analysis of land cover and land use change revealed a tenfold increase in croplands in the last 13 years. The expansion of crop cultivation is attributed to interventions by the Government of Uganda and development partners to promote food security in the sub-region. Heightened bushland encroachment was similarly observed in the last 13 years. The study also found a significant positive relationship between NDVI and herbaceous biomass, indicating that remote sensing offers reliable resource assessment and monitoring options for informing planning and interventions in semi-arid areas. Keywords: Dry matter; Bush encroachment; Above-ground herbaceous biomass; Heterogeneity Background Livestock rearing has continued to play a significant role in the economy and welfare of Uganda. About 71% of households in Uganda owned livestock in 2008 (MAAIF and UBOS 2010). Previous estimates were of livestock and livestock products accounting for over 5% of the gross domestic product (GDP) and about 14% of the agricultural GDP as well as a range of valuable services and products for domestic and export markets (FAO 2005). Newer estimates show that livestock contributes up to 3.2% to national GDP, larger than the GDP derived from either cash crops or fishing. Further, the share contribution of livestock to Uganda's GDP is steadily ris- ing (Behnke and Nakirya 2012). For the poorer livestock keepers of Uganda, livestock is hailed for its multiple benefits including facilitating saving, providing security, asset accumulation, financing planned and uncertain ex- penditures, providing a diversity of products and main- tenance of social capital (Ashley and Nanyeenya 2002). The ‘ cattle corridor’ of Uganda is the most important livestock herding region in the country. This semi-arid region runs diagonally across Uganda from southwestern (Ankole sub-region) to northeastern Uganda (Karamoja sub-region). Livestock herded in this region by pastoral- ists and agro-pastoralists accounts for over 90% of the national livestock herd. In Karamoja, livestock is inter- woven in the socio-cultural fabric of the people. Live- stock influences relationships and determines self-worth and existence in a community, and livestock are central * Correspondence: [email protected] 1 Department of Land Resource Management and Agricultural Technology, University of Nairobi, P.O. Box 29053-00625, Nairobi, Kenya 3 Department of Agricultural Engineering, Makerere University, P.O. Box 7062, Kampala, Uganda Full list of author information is available at the end of the article © Egeru et al.; licensee Springer. This is an Open Access article distributed under the terms of the Creative Commons Attribution License (http://creativecommons.org/licenses/by/4.0), which permits unrestricted use, distribution, and reproduction in any medium, provided the original work is properly credited. Egeru et al. Pastoralism: Research, Policy and Practice 2014 2014, 4:6 http://www.pastoralismjournal.com/content/4/1/6

Welcome message from author
This document is posted to help you gain knowledge. Please leave a comment to let me know what you think about it! Share it to your friends and learn new things together.
Transcript
Egeru et al. Pastoralism: Research, Policy and Practice 2014, 4:6http://www.pastoralismjournal.com/content/4/1/6
RESEARCH Open Access
Spatio-temporal dynamics of forage and landcover changes in Karamoja sub-region, UgandaAnthony Egeru1,3*, Oliver Wasonga2, Joseph Kyagulanyi4, GJ Mwanjalolo Majaliwa4, Laban MacOpiyo5
and John Mburu5
Abstract
Spatio-temporal dynamics of pastoral grazing resources influences the pastoral production system. Obtaining timely andreliable information on the status of these resources will support planning and early response to climatic variability. Thisstudy in Karamoja pastoral sub-region of Uganda identified herbaceous and woody forage species in different grazingland cover types, quantified forage in different grazing land covers, analyzed long-term land use/cover change (from 1986to 2013) and determined the relationship between Normalized Difference Vegetation Index (NDVI) and herbaceousbiomass. Results showed that the sub-region has over 30 grass species that provide forage. During the wet season,woodlands, grasslands and thickets and shrublands recorded a wet weight of 1,342.5 ± 104.5 kg/ha, 857.5 ± 29.4 kg/haand 501 ± 43.9 kg/ha, respectively. In the dry season, 542.5 ± 57.6 kg/ha, 273 ± 6.4 kg/ha and 140 ± 9.2 kg/ha were realizedin the woodlands, grasslands and thickets and shrublands, respectively. However, in the transitionary season, 276, 512.5and 529.2 kg/ha were obtained in the woodlands, grasslands and thickets and shrublands accordingly. Similar trends wereobserved in dry matter biomass in the respective land cover type. Seasonality, land cover type and location accounted forthe variations in the observed forage quantities. Analysis of land cover and land use change revealed a tenfold increase incroplands in the last 13 years. The expansion of crop cultivation is attributed to interventions by the Government ofUganda and development partners to promote food security in the sub-region. Heightened bushland encroachment wassimilarly observed in the last 13 years. The study also found a significant positive relationship between NDVI andherbaceous biomass, indicating that remote sensing offers reliable resource assessment and monitoring options forinforming planning and interventions in semi-arid areas.
Keywords: Dry matter; Bush encroachment; Above-ground herbaceous biomass; Heterogeneity
BackgroundLivestock rearing has continued to play a significant rolein the economy and welfare of Uganda. About 71% ofhouseholds in Uganda owned livestock in 2008 (MAAIFand UBOS 2010). Previous estimates were of livestockand livestock products accounting for over 5% of thegross domestic product (GDP) and about 14% of theagricultural GDP as well as a range of valuable servicesand products for domestic and export markets (FAO2005). Newer estimates show that livestock contributesup to 3.2% to national GDP, larger than the GDP derivedfrom either cash crops or fishing. Further, the share
* Correspondence: [email protected] of Land Resource Management and Agricultural Technology,University of Nairobi, P.O. Box 29053-00625, Nairobi, Kenya3Department of Agricultural Engineering, Makerere University, P.O. Box 7062,Kampala, UgandaFull list of author information is available at the end of the article
© Egeru et al.; licensee Springer. This is anAttribution License (http://creativecommons.orin any medium, provided the original work is p
2014
contribution of livestock to Uganda's GDP is steadily ris-ing (Behnke and Nakirya 2012). For the poorer livestockkeepers of Uganda, livestock is hailed for its multiplebenefits including facilitating saving, providing security,asset accumulation, financing planned and uncertain ex-penditures, providing a diversity of products and main-tenance of social capital (Ashley and Nanyeenya 2002).The ‘cattle corridor’ of Uganda is the most importantlivestock herding region in the country. This semi-aridregion runs diagonally across Uganda from southwestern(Ankole sub-region) to northeastern Uganda (Karamojasub-region). Livestock herded in this region by pastoral-ists and agro-pastoralists accounts for over 90% of thenational livestock herd. In Karamoja, livestock is inter-woven in the socio-cultural fabric of the people. Live-stock influences relationships and determines self-worthand existence in a community, and livestock are central
Open Access article distributed under the terms of the Creative Commonsg/licenses/by/4.0), which permits unrestricted use, distribution, and reproductionroperly credited.
Egeru et al. Pastoralism: Research, Policy and Practice Page 2 of 212014, 4:6http://www.pastoralismjournal.com/content/4/1/6
in traditional ceremonies and rites of passage, in particular,marriage (Grade et al. 2009). Karamoja's livestock aloneconstitute about 10% of the national livestock herd, 20% ofthe national cattle herd, 16% of goats, 60% of all horses,97% of all camels and 91% of all donkeys in Uganda(MAAIF and UBOS 2010).Like most of the pastoral groups in eastern Africa
such as the Turkana of Kenya, Toposa of Sudan and theNyangatom, Rendille and Borana of Ethiopia, the Karamojongpractice mobile livestock herding. Men, often energeticyouth locally known as karachunas, and their livestockseasonally move between wet and dry season grazingareas (Grade et al. 2009). During such times, women,children and elders remain behind in the manyattas(semi-permanent homesteads). It is therefore evident thatthe Karamojong still exercise a self-provisioning form oflivestock rearing - pastoralism (Weber and Horst 2011).This form of livestock rearing largely depends on theavailability of natural resources on the range which aremanaged primarily by livestock and fire (Bassett andCrumney 2003). The use of these primary managementtools has enabled pastoralists to manipulate grazing re-gimes and circumvent patchy vegetation. In so doing, theyhave been able to effect subsequent changes in land coverover time (Weber and Horst 2011) as well as survive theharsh realities of climatic variability.A growing concern among scientists (e.g. Lambin
et al. 2003; Oba 2012; Nelson 2012) focused on pastoralregions is how the current trends in land use and landcover are affecting the grazing resource base. Theseshifts in land use are largely externally driven and haveset in motion a myriad of other challenges including re-stricted mobility of pastoral herds, reductions in grazinglands and increased conflicts, especially those betweenfarming and pastoral communities (Campbell et al. 2003;Nelson 2012; Oba 2012). The fact that changes in landuse and land cover affect forage availability has implica-tions for the viability of the pastoral livestock productionand therefore livelihoods of pastoral communities in theregion. The consequence of diminishing grazing lands isexemplified by livestock losses and exit of pastoralistsamong the pastoral Rufa'a Al Hoi ethnic group of theBlue Nile State in Sudan (Ahmed 2009). Similar trendshave been reported in Burkina Faso among the Fulanipastoral communities (Tenuche and Ifatimehin 2009; Madu2012). In eastern Africa, land use and land cover change dy-namics are evident in privatization of pastoral land andsedentarisation in pastoral communities (Lesorogol 2005).In Uganda, livestock keepers in Kaliro district have experi-enced shortage in forage (Tabuti and Lye 2009) due toconversion of communal grazing lands for agriculture.Such processes exacerbate the vulnerability of pastoralgroups to the vagaries of nature, particularly the devastatingimpacts of climate variability that include livestock losses
and reduced livestock productivity (Nyariki et al. 2009;Kirwa et al. 2012; Nelson 2012).Unlike other rangeland ecosystems in the east African
region, minimal assessment and monitoring of forageand grazing land use changes has been undertaken inthe Karamoja sub-region of Uganda. This is particularlyattributed to prolonged periods of conflict and civil un-rest that have plagued the sub-region. With the returnof relative peace, security and stability, there has beenincreased promotion of sedentarisation and crop cultiva-tion ostensibly to promote food security (Wamani andBagonza 2013; Avery 2014). As a result, the pastoralistsystem in Karamoja is undergoing radical changes thatare negatively affecting the pastoral livestock production(Anderson and Robinson 2009).The ongoing conversion of rangelands to croplands has not
been adequately addressed. Limited efforts (e.g. Nakalembe2013; Scott-Villiers 2013) have been channeled towardsexamining the extent to which the changes, particularlyin the grazing landscapes, have occurred over time.Nonetheless, a few studies have attempted to provideinsights into the land use and land cover changes inKaramoja sub-region. One such study conducted inMoroto district indicated that deforestation was the mostsignificant biophysical change occurring in the district(Majaliwa et al. 2009). In addition, vegetation cover andpasture resources were reported to have undergone sig-nificant changes in the area. No study has attempted toprovide a sub-regional analysis of land use and land coverchanges and how they impact on extensive livestock pro-duction system in the Karamoja sub-region, and yet,pastoralism is still the main livelihood activity for theKaramojong community. Mobile pastoral production sys-tems traverse administrative borders, and therefore, theirassessment requires a landscape approach so as to providedecision-makers with a sub-regional status of grazingresources. It is against this background that the 10thEuropean Development Fund (EDF) Karamoja LivelihoodsProgramme (KALIP) recommended that a full study beundertaken of pasture availability by season and locationin the sub-region (Anderson and Robinson 2009).Sustainability of grazing and forage resources in pastoral
areas requires the assessment and routine monitoring ofspatio-temporal distribution and changes of these re-sources, as well as the awareness of the drivers of the ob-served change dynamics (Feng et al. 2009). Pastoralistshave developed their own rangeland assessment and moni-toring systems based on indigenous knowledge (Oba2012). However, where changes are rapid and unrecorded,earth observations from space provide objective informa-tion on human use of the landscape (Ruelland et al. 2010).Remote sensing further plays a pivotal role in guiding graz-ing management by providing information in support ofanalysis, modeling and forecasting for decision support
Egeru et al. Pastoralism: Research, Policy and Practice Page 3 of 212014, 4:6http://www.pastoralismjournal.com/content/4/1/6
(Angerer 2008; Kawamura and Akiyama 2010). However,the relevance of satellite imagery in providing informationto address challenges relating to livestock grazing resourceswill be greater when satellite data is integrated with ground-based assessments. The ground-based assessments help tofill the gaps in the satellite data particularly with regard tothe composition of vegetation resources (Xie et al. 2008;Gintzburger and Saïdi 2009). A dearth of comparable empir-ical knowledge exists regarding the current real spatial andquantitative extent of forage resources in Karamoja sub-region. Therefore, this study (i) identified herbaceous andwoody forage species in the grazing land covers, (ii) quanti-fied the extent of the land use/land cover change inKaramoja and compared land cover change rates over time,(iii) quantified the potential available forage in the sub-region by integrating clipped wet weight and dry matter andrelated this to the extent of each grazing land cover and (iv)determined the relationship between Normalized DifferenceVegetation Index (NDVI) and herbaceous biomass.
Study areaKaramoja is located in northeastern Uganda (Figure 1) andis bordered to the east by the Rift valley escarpment thatdrops down into the Turkana territory of Kenya. To thenorth lies the Republic of South Sudan and to the south arethe Mt. Elgon highlands. In the west, Karamoja is borderedby the home territories of the Teso, Lango and Acholi ethniccommunities. The mountain areas of Karamoja are inhab-ited by the Tepeth Teuso and Nyangwe (Kagan et al. 2010).The semi-arid lands of Karamoja are inhabited by pastoralistand agro-pastoralist communities. Rainfall in the region isvariable, unpredictable and often sparse (Quam 1999). Rain-fall totals vary (from around 500 to 800 mm) within thesub-region with the few highlands generally receiving highertotals than much of the plains. Temperatures are generallyhigh all year round. In the north and south and along theeastern escarpment are the forested mountainous areas, andin the west of the area (where the Labwor people inhabitthe Abim district), the land is better watered with high vege-tation cover of bushlands and woodlands.The area is dominated by indigenous tropical grasses
such as Themeda triandra, Heteropogon spp., Andropogonspp., Aristida spp., Eragrostis superba, Panicum maximum,Chloris gayana, Setaria spp., Brachiaria spp., Hyparrheniarufa, Cenchrus ciliaris, Cynadon spp. and Hyperthelia spp.The overstorey is dominated by Acacia tree species such asAcacia tortilis, Acacia mellifera, Acacia etbaica, Acacianilotica, Acacia brevispica, Acacia bussei and Acaciaalbida (Anderson and Robinson 2009; Nalule 2010).Owing to the spatial and temporal variability in rainfall andforage availability, the Karamoja pastoralists strategicallymove their animals to optimize utilization of variousecological niches subject to water availability and security(Grade et al. 2009).
Land use/cover types in KaramojaFive land use/cover types were identified in the sub-region, namely subsistence farmlands, woodlands, grasslands,thickets and shrublands, and lastly bushlands (Figure 2a,b,c,d). Table 1 below describes the characteristics ofeach land cover type.
MethodsHerbaceous forage quantificationIn order to quantify the herbaceous and woody forageproduction in different land cover classes, ground mea-surements of above-ground biomass were conducted instudy sites jointly identified by the community eldersand herders. Selection of sampling plots targeted areasthat were currently used for grazing. However, only theaccessible sites and those secure from banditry and raid-ing at the time of the study were selected for sampling.Once the sites were identified, sampling plots for forageclipping, measuring 50 × 40 m with four replications,were randomly established in each of the identified graz-ing land covers. In all the 50 × 40 m plots, nested sub-plots were diagonally established from which forage wasclipped. All the above-ground herbaceous plants, grasses,grass-like species, herbaceous legumes and other forbs col-lectively were clipped. In the woodlands, five plots of 5 ×5 m established diagonally provided sampling sites, while inthe thickets and shrubland, ten plots of 5 × 5 m were uti-lised for forage clipping. In the grasslands, 20 plots of 1 ×1 m were diagonally set up from where forage was clipped.The clipped herbaceous biomass was fresh weighedand a 0.5-kg proportion obtained for dry matter de-termination. Vegetation sampling was done during thedry, wet and transition seasons. Additionally, in eachsampling plot, existing herbaceous and woody specieswere identified on-site by a field taxonomist. Speci-mens of species that could not be readily identifiedwere collected using a plant press and taken toMakerere University for identification.
Satellite data and image processingIn quantifying land use and land cover change inKaramoja, the study made use of 27 years' time-seriesmulti-spectral and multi-temporal Landsat TM andETM + satellite imageries. The images obtained weregenerally cloud-free (less than 10% cloud cover) with a30-m resolution. Four scenes covering the sub-regionwere mosaiced (see Figure 3) in ERDAS IMAGINE 9.1with the projection set at datum WGS 1984, UTM zone36N and Ellipsoid WGS 84. All the image sets utilisedwere acquired within a similar period (season) of thecalendar year so as to minimize distortions associatedwith phenological variations between seasons. Withreference to the 2009 land use/land cover map forKaramoja developed under KALIP, reconnaissance field
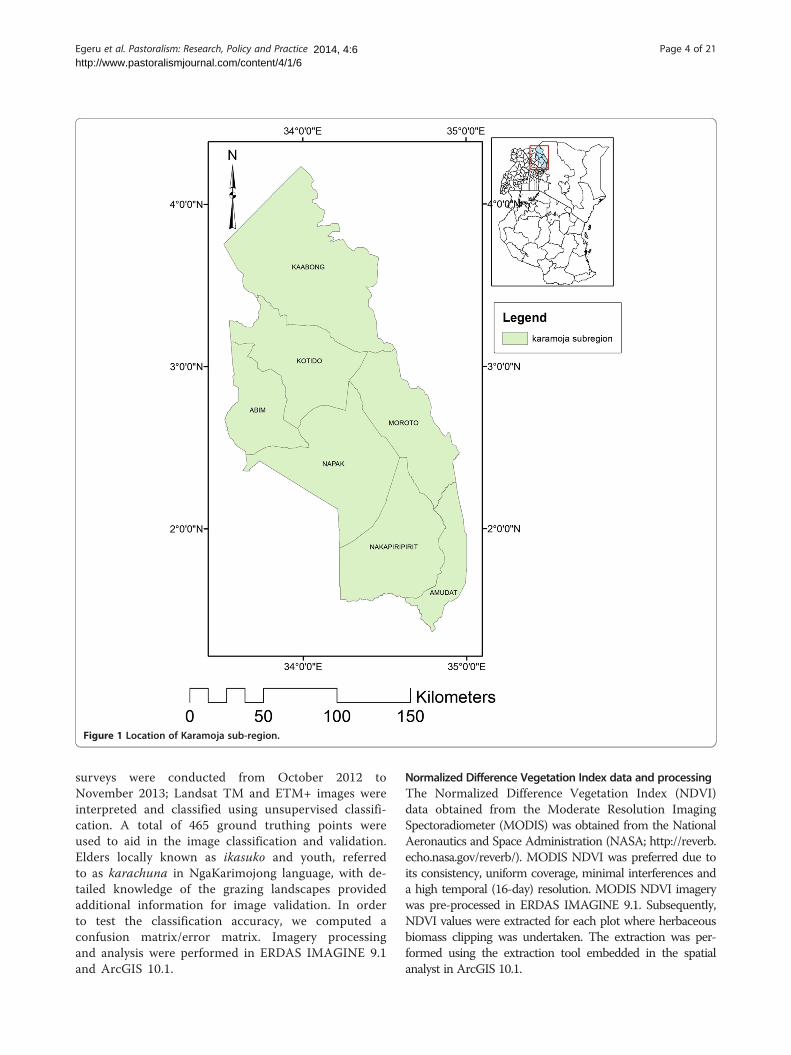
Figure 1 Location of Karamoja sub-region.
Egeru et al. Pastoralism: Research, Policy and Practice Page 4 of 212014, 4:6http://www.pastoralismjournal.com/content/4/1/6
surveys were conducted from October 2012 toNovember 2013; Landsat TM and ETM+ images wereinterpreted and classified using unsupervised classifi-cation. A total of 465 ground truthing points wereused to aid in the image classification and validation.Elders locally known as ikasuko and youth, referredto as karachuna in NgaKarimojong language, with de-tailed knowledge of the grazing landscapes providedadditional information for image validation. In orderto test the classification accuracy, we computed aconfusion matrix/error matrix. Imagery processingand analysis were performed in ERDAS IMAGINE 9.1and ArcGIS 10.1.
Normalized Difference Vegetation Index data and processingThe Normalized Difference Vegetation Index (NDVI)data obtained from the Moderate Resolution ImagingSpectoradiometer (MODIS) was obtained from the NationalAeronautics and Space Administration (NASA; http://reverb.echo.nasa.gov/reverb/). MODIS NDVI was preferred due toits consistency, uniform coverage, minimal interferences anda high temporal (16-day) resolution. MODIS NDVI imagerywas pre-processed in ERDAS IMAGINE 9.1. Subsequently,NDVI values were extracted for each plot where herbaceousbiomass clipping was undertaken. The extraction was per-formed using the extraction tool embedded in the spatialanalyst in ArcGIS 10.1.
Figure 2 Land use/cover types. (a) Typical grassland dominated by Hyparrhenia rufa and Chloris pychnothrix in Karamoja as seen fromNakicument, Napak district. In the background are the Iriir mountains. (b) A thicket and shrubland as seen in Regen sub-county, Kotidodistrict. The landscape is dominated by grasses such as Bracharia spp. and Hyparrhenia spp. grasses and thicket and shrub species suchas Commiphora campestris, Cadaba farinosa and Acacia brevispica. (c) A bushland land cover near Lomogol dam in Kotido district(Acacia oerfota seen in the middle of the picture). (d) A maize garden adjacent to woodland land cover in Nabuin. The woodland is atthe background of the photo.
Egeru et al. Pastoralism: Research, Policy and Practice Page 5 of 212014, 4:6http://www.pastoralismjournal.com/content/4/1/6
Data analysisForage species analysis and determination of herbaceousforage quantityData on the identified herbaceous and woody specieswere collated and subjected to descriptive statisticalanalysis using Genstat 12.1 to generate a matrix offrequency of species and life forms for the differentland cover classes in the study area. In order to de-termine the quantity of dry matter, herbaceous sam-ples taken to the laboratory were oven-dried at 60°Cuntil a constant weight. Following the Undersanderet al. (1993) approach, dry matter was determinedgravimetrically as the residue remaining after ovendrying. The gravimetrical results of different sam-pling plots were pulled together by land cover typeand averaged to obtain dry matter weight (kg/ha).
Determining sources of herbaceous forage quantity variationIn order to identify the sources of variation in the quantityof forage, we conducted a one-way analysis of variance(ANOVA). Mean quantity of forage by land cover type, lo-cation (district) and season were compared. Additionally,interactions between land cover and location (district), landcover and season, and season and district were tested usingF-test statistic at 5% significance level in Genstat 12.1.
Determining land cover change matrixThis study adopted Peng et al.'s (2008) approach(Equation 1) of determining land use/cover change. Landcover change matrix was computed by overlaying two landuse/cover maps. Using this method, an overlay of two landcover maps Ai�i and Bi�i adheres to the map algebraicEquation 1 which is only functionally valid where land
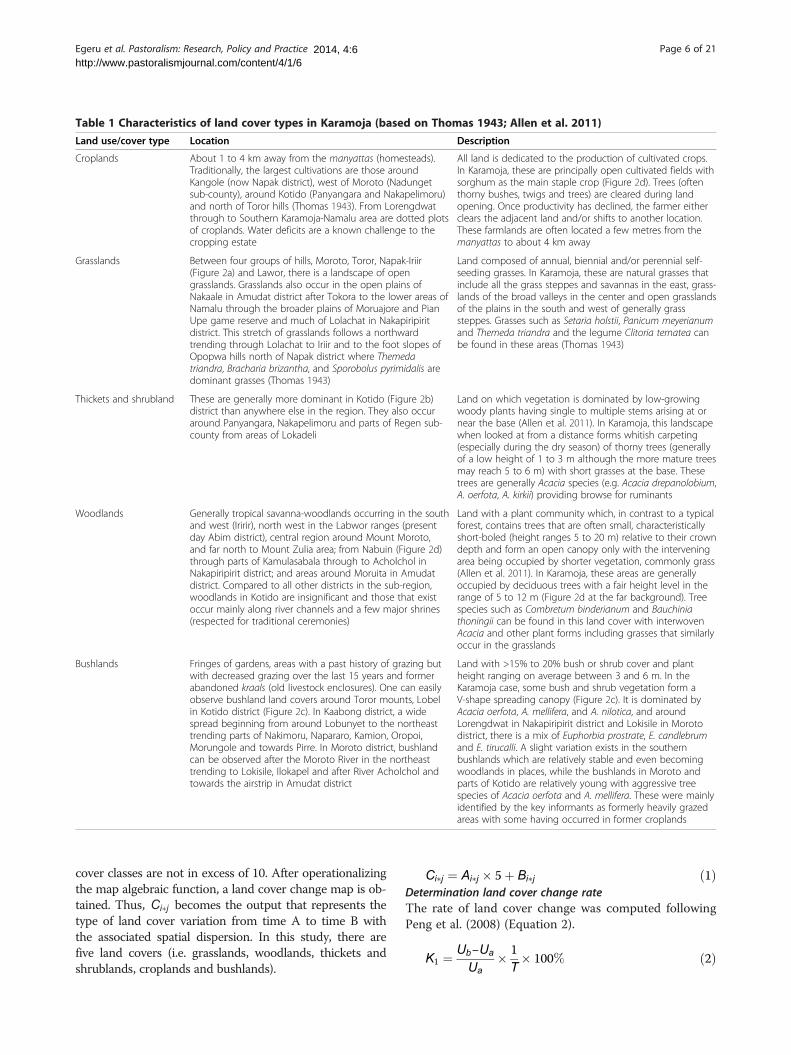
Table 1 Characteristics of land cover types in Karamoja (based on Thomas 1943; Allen et al. 2011)
Land use/cover type Location Description
Croplands About 1 to 4 km away from the manyattas (homesteads).Traditionally, the largest cultivations are those aroundKangole (now Napak district), west of Moroto (Nadungetsub-county), around Kotido (Panyangara and Nakapelimoru)and north of Toror hills (Thomas 1943). From Lorengdwatthrough to Southern Karamoja-Namalu area are dotted plotsof croplands. Water deficits are a known challenge to thecropping estate
All land is dedicated to the production of cultivated crops.In Karamoja, these are principally open cultivated fields withsorghum as the main staple crop (Figure 2d). Trees (oftenthorny bushes, twigs and trees) are cleared during landopening. Once productivity has declined, the farmer eitherclears the adjacent land and/or shifts to another location.These farmlands are often located a few metres from themanyattas to about 4 km away
Grasslands Between four groups of hills, Moroto, Toror, Napak-Iriir(Figure 2a) and Lawor, there is a landscape of opengrasslands. Grasslands also occur in the open plains ofNakaale in Amudat district after Tokora to the lower areas ofNamalu through the broader plains of Moruajore and PianUpe game reserve and much of Lolachat in Nakapiripiritdistrict. This stretch of grasslands follows a northwardtrending through Lolachat to Iriir and to the foot slopes ofOpopwa hills north of Napak district where Themedatriandra, Bracharia brizantha, and Sporobolus pyrimidalis aredominant grasses (Thomas 1943)
Land composed of annual, biennial and/or perennial self-seeding grasses. In Karamoja, these are natural grasses thatinclude all the grass steppes and savannas in the east, grass-lands of the broad valleys in the center and open grasslandsof the plains in the south and west of generally grasssteppes. Grasses such as Setaria holstii, Panicum meyerianumand Themeda triandra and the legume Clitoria ternatea canbe found in these areas (Thomas 1943)
Thickets and shrubland These are generally more dominant in Kotido (Figure 2b)district than anywhere else in the region. They also occuraround Panyangara, Nakapelimoru and parts of Regen sub-county from areas of Lokadeli
Land on which vegetation is dominated by low-growingwoody plants having single to multiple stems arising at ornear the base (Allen et al. 2011). In Karamoja, this landscapewhen looked at from a distance forms whitish carpeting(especially during the dry season) of thorny trees (generallyof a low height of 1 to 3 m although the more mature treesmay reach 5 to 6 m) with short grasses at the base. Thesetrees are generally Acacia species (e.g. Acacia drepanolobium,A. oerfota, A. kirkii) providing browse for ruminants
Woodlands Generally tropical savanna-woodlands occurring in the southand west (Iririr), north west in the Labwor ranges (presentday Abim district), central region around Mount Moroto,and far north to Mount Zulia area; from Nabuin (Figure 2d)through parts of Kamulasabala through to Acholchol inNakapiripirit district; and areas around Moruita in Amudatdistrict. Compared to all other districts in the sub-region,woodlands in Kotido are insignificant and those that existoccur mainly along river channels and a few major shrines(respected for traditional ceremonies)
Land with a plant community which, in contrast to a typicalforest, contains trees that are often small, characteristicallyshort-boled (height ranges 5 to 20 m) relative to their crowndepth and form an open canopy only with the interveningarea being occupied by shorter vegetation, commonly grass(Allen et al. 2011). In Karamoja, these areas are generallyoccupied by deciduous trees with a fair height level in therange of 5 to 12 m (Figure 2d at the far background). Treespecies such as Combretum binderianum and Bauchiniathoningii can be found in this land cover with interwovenAcacia and other plant forms including grasses that similarlyoccur in the grasslands
Bushlands Fringes of gardens, areas with a past history of grazing butwith decreased grazing over the last 15 years and formerabandoned kraals (old livestock enclosures). One can easilyobserve bushland land covers around Toror mounts, Lobelin Kotido district (Figure 2c). In Kaabong district, a widespread beginning from around Lobunyet to the northeasttrending parts of Nakimoru, Napararo, Kamion, Oropoi,Morungole and towards Pirre. In Moroto district, bushlandcan be observed after the Moroto River in the northeasttrending to Lokisile, Ilokapel and after River Acholchol andtowards the airstrip in Amudat district
Land with >15% to 20% bush or shrub cover and plantheight ranging on average between 3 and 6 m. In theKaramoja case, some bush and shrub vegetation form aV-shape spreading canopy (Figure 2c). It is dominated byAcacia oerfota, A. mellifera, and A. nilotica, and aroundLorengdwat in Nakapiripirit district and Lokisile in Morotodistrict, there is a mix of Euphorbia prostrate, E. candlebrumand E. tirucalli. A slight variation exists in the southernbushlands which are relatively stable and even becomingwoodlands in places, while the bushlands in Moroto andparts of Kotido are relatively young with aggressive treespecies of Acacia oerfota and A. mellifera. These were mainlyidentified by the key informants as formerly heavily grazedareas with some having occurred in former croplands
Egeru et al. Pastoralism: Research, Policy and Practice Page 6 of 212014, 4:6http://www.pastoralismjournal.com/content/4/1/6
cover classes are not in excess of 10. After operationalizingthe map algebraic function, a land cover change map is ob-tained. Thus, Ci�j becomes the output that represents thetype of land cover variation from time A to time B withthe associated spatial dispersion. In this study, there arefive land covers (i.e. grasslands, woodlands, thickets andshrublands, croplands and bushlands).
Ci�j ¼ Ai�j � 5þ Bi�j ð1Þ
Determination land cover change rateThe rate of land cover change was computed followingPeng et al. (2008) (Equation 2).K1 ¼ Ub−Ua
Ua� 1T� 100% ð2Þ
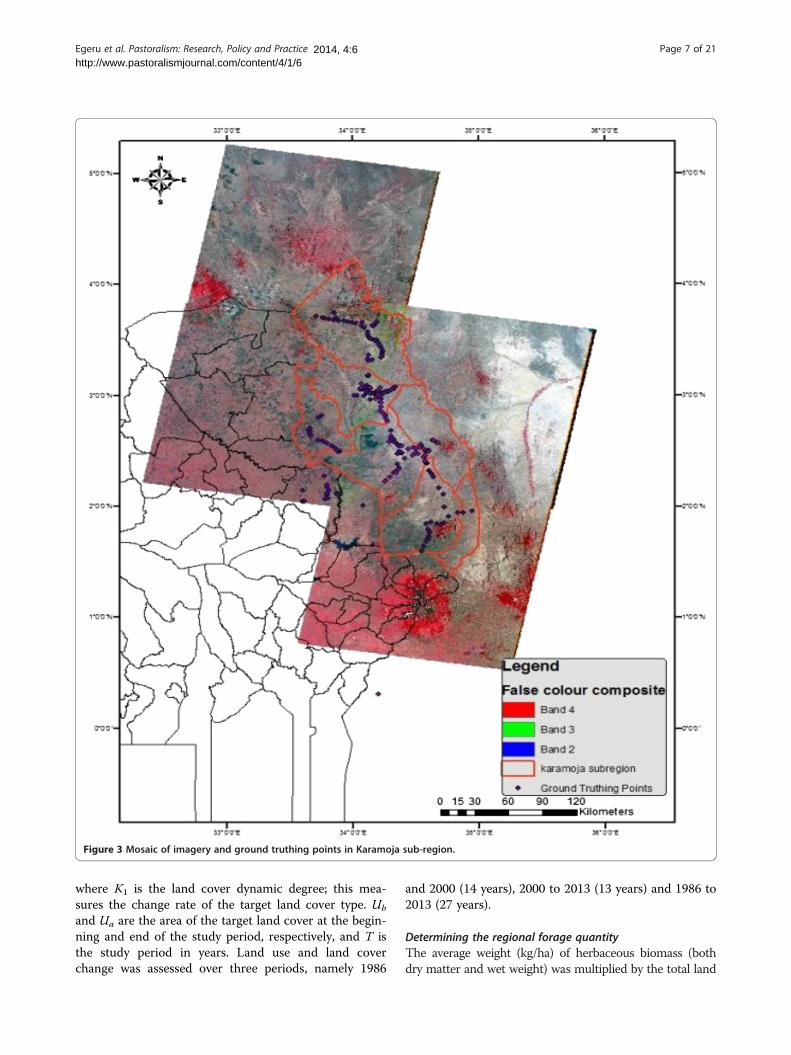
Figure 3 Mosaic of imagery and ground truthing points in Karamoja sub-region.
Egeru et al. Pastoralism: Research, Policy and Practice Page 7 of 212014, 4:6http://www.pastoralismjournal.com/content/4/1/6
where K1 is the land cover dynamic degree; this mea-sures the change rate of the target land cover type. Ub
and Ua are the area of the target land cover at the begin-ning and end of the study period, respectively, and T isthe study period in years. Land use and land coverchange was assessed over three periods, namely 1986
and 2000 (14 years), 2000 to 2013 (13 years) and 1986 to2013 (27 years).
Determining the regional forage quantityThe average weight (kg/ha) of herbaceous biomass (bothdry matter and wet weight) was multiplied by the total land
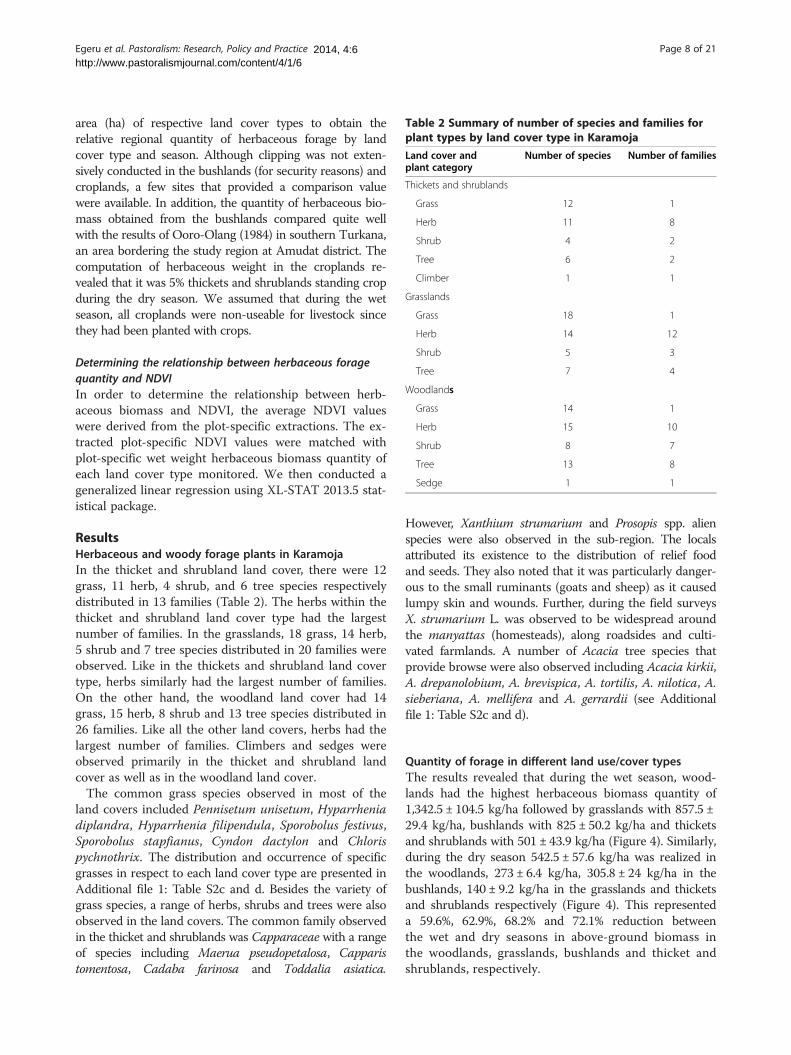
Table 2 Summary of number of species and families forplant types by land cover type in Karamoja
Land cover andplant category
Number of species Number of families
Thickets and shrublands
Grass 12 1
Herb 11 8
Shrub 4 2
Tree 6 2
Climber 1 1
Grasslands
Grass 18 1
Herb 14 12
Shrub 5 3
Tree 7 4
Woodlands
Grass 14 1
Herb 15 10
Shrub 8 7
Tree 13 8
Sedge 1 1
Egeru et al. Pastoralism: Research, Policy and Practice Page 8 of 212014, 4:6http://www.pastoralismjournal.com/content/4/1/6
area (ha) of respective land cover types to obtain therelative regional quantity of herbaceous forage by landcover type and season. Although clipping was not exten-sively conducted in the bushlands (for security reasons) andcroplands, a few sites that provided a comparison valuewere available. In addition, the quantity of herbaceous bio-mass obtained from the bushlands compared quite wellwith the results of Ooro-Olang (1984) in southern Turkana,an area bordering the study region at Amudat district. Thecomputation of herbaceous weight in the croplands re-vealed that it was 5% thickets and shrublands standing cropduring the dry season. We assumed that during the wetseason, all croplands were non-useable for livestock sincethey had been planted with crops.
Determining the relationship between herbaceous foragequantity and NDVIIn order to determine the relationship between herb-aceous biomass and NDVI, the average NDVI valueswere derived from the plot-specific extractions. The ex-tracted plot-specific NDVI values were matched withplot-specific wet weight herbaceous biomass quantity ofeach land cover type monitored. We then conducted ageneralized linear regression using XL-STAT 2013.5 stat-istical package.
ResultsHerbaceous and woody forage plants in KaramojaIn the thicket and shrubland land cover, there were 12grass, 11 herb, 4 shrub, and 6 tree species respectivelydistributed in 13 families (Table 2). The herbs within thethicket and shrubland land cover type had the largestnumber of families. In the grasslands, 18 grass, 14 herb,5 shrub and 7 tree species distributed in 20 families wereobserved. Like in the thickets and shrubland land covertype, herbs similarly had the largest number of families.On the other hand, the woodland land cover had 14grass, 15 herb, 8 shrub and 13 tree species distributed in26 families. Like all the other land covers, herbs had thelargest number of families. Climbers and sedges wereobserved primarily in the thicket and shrubland landcover as well as in the woodland land cover.The common grass species observed in most of the
land covers included Pennisetum unisetum, Hyparrheniadiplandra, Hyparrhenia filipendula, Sporobolus festivus,Sporobolus stapfianus, Cyndon dactylon and Chlorispychnothrix. The distribution and occurrence of specificgrasses in respect to each land cover type are presented inAdditional file 1: Table S2c and d. Besides the variety ofgrass species, a range of herbs, shrubs and trees were alsoobserved in the land covers. The common family observedin the thicket and shrublands was Capparaceae with a rangeof species including Maerua pseudopetalosa, Capparistomentosa, Cadaba farinosa and Toddalia asiatica.
However, Xanthium strumarium and Prosopis spp. alienspecies were also observed in the sub-region. The localsattributed its existence to the distribution of relief foodand seeds. They also noted that it was particularly danger-ous to the small ruminants (goats and sheep) as it causedlumpy skin and wounds. Further, during the field surveysX. strumarium L. was observed to be widespread aroundthe manyattas (homesteads), along roadsides and culti-vated farmlands. A number of Acacia tree species thatprovide browse were also observed including Acacia kirkii,A. drepanolobium, A. brevispica, A. tortilis, A. nilotica, A.sieberiana, A. mellifera and A. gerrardii (see Additionalfile 1: Table S2c and d).
Quantity of forage in different land use/cover typesThe results revealed that during the wet season, wood-lands had the highest herbaceous biomass quantity of1,342.5 ± 104.5 kg/ha followed by grasslands with 857.5 ±29.4 kg/ha, bushlands with 825 ± 50.2 kg/ha and thicketsand shrublands with 501 ± 43.9 kg/ha (Figure 4). Similarly,during the dry season 542.5 ± 57.6 kg/ha was realized inthe woodlands, 273 ± 6.4 kg/ha, 305.8 ± 24 kg/ha in thebushlands, 140 ± 9.2 kg/ha in the grasslands and thicketsand shrublands respectively (Figure 4). This representeda 59.6%, 62.9%, 68.2% and 72.1% reduction betweenthe wet and dry seasons in above-ground biomass inthe woodlands, grasslands, bushlands and thicket andshrublands, respectively.
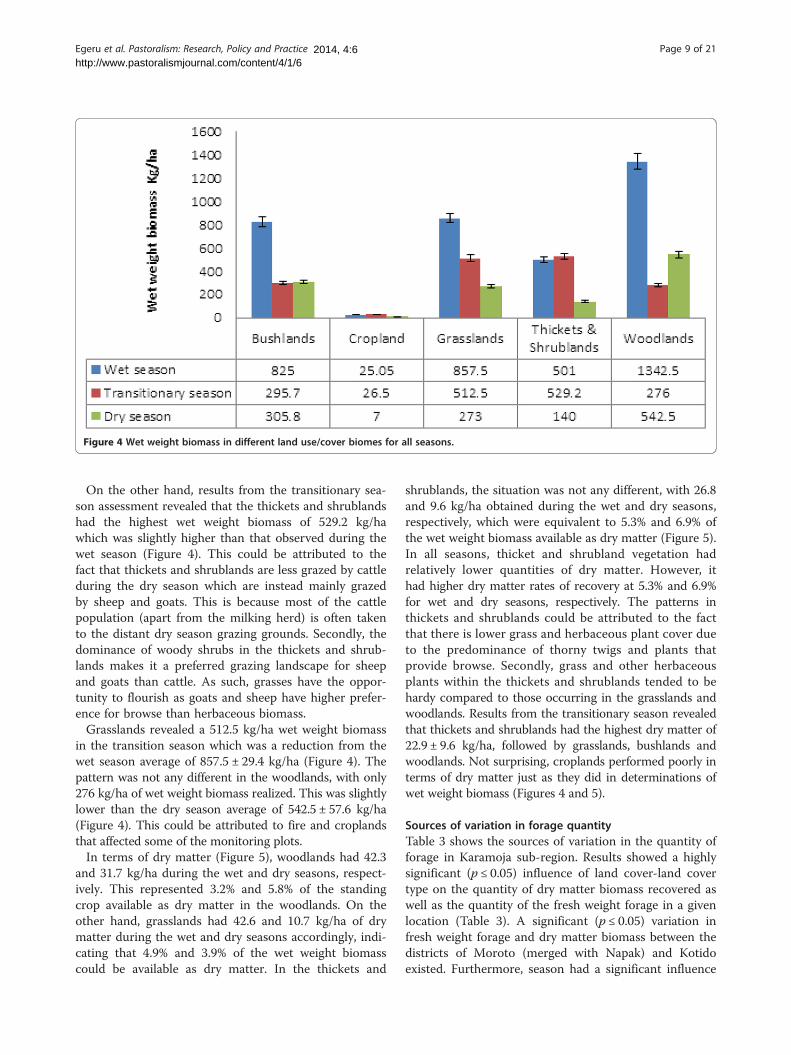
Figure 4 Wet weight biomass in different land use/cover biomes for all seasons.
Egeru et al. Pastoralism: Research, Policy and Practice Page 9 of 212014, 4:6http://www.pastoralismjournal.com/content/4/1/6
On the other hand, results from the transitionary sea-son assessment revealed that the thickets and shrublandshad the highest wet weight biomass of 529.2 kg/hawhich was slightly higher than that observed during thewet season (Figure 4). This could be attributed to thefact that thickets and shrublands are less grazed by cattleduring the dry season which are instead mainly grazedby sheep and goats. This is because most of the cattlepopulation (apart from the milking herd) is often takento the distant dry season grazing grounds. Secondly, thedominance of woody shrubs in the thickets and shrub-lands makes it a preferred grazing landscape for sheepand goats than cattle. As such, grasses have the oppor-tunity to flourish as goats and sheep have higher prefer-ence for browse than herbaceous biomass.Grasslands revealed a 512.5 kg/ha wet weight biomass
in the transition season which was a reduction from thewet season average of 857.5 ± 29.4 kg/ha (Figure 4). Thepattern was not any different in the woodlands, with only276 kg/ha of wet weight biomass realized. This was slightlylower than the dry season average of 542.5 ± 57.6 kg/ha(Figure 4). This could be attributed to fire and croplandsthat affected some of the monitoring plots.In terms of dry matter (Figure 5), woodlands had 42.3
and 31.7 kg/ha during the wet and dry seasons, respect-ively. This represented 3.2% and 5.8% of the standingcrop available as dry matter in the woodlands. On theother hand, grasslands had 42.6 and 10.7 kg/ha of drymatter during the wet and dry seasons accordingly, indi-cating that 4.9% and 3.9% of the wet weight biomasscould be available as dry matter. In the thickets and
shrublands, the situation was not any different, with 26.8and 9.6 kg/ha obtained during the wet and dry seasons,respectively, which were equivalent to 5.3% and 6.9% ofthe wet weight biomass available as dry matter (Figure 5).In all seasons, thicket and shrubland vegetation hadrelatively lower quantities of dry matter. However, ithad higher dry matter rates of recovery at 5.3% and 6.9%for wet and dry seasons, respectively. The patterns inthickets and shrublands could be attributed to the factthat there is lower grass and herbaceous plant cover dueto the predominance of thorny twigs and plants thatprovide browse. Secondly, grass and other herbaceousplants within the thickets and shrublands tended to behardy compared to those occurring in the grasslands andwoodlands. Results from the transitionary season revealedthat thickets and shrublands had the highest dry matter of22.9 ± 9.6 kg/ha, followed by grasslands, bushlands andwoodlands. Not surprising, croplands performed poorly interms of dry matter just as they did in determinations ofwet weight biomass (Figures 4 and 5).
Sources of variation in forage quantityTable 3 shows the sources of variation in the quantity offorage in Karamoja sub-region. Results showed a highlysignificant (p ≤ 0.05) influence of land cover-land covertype on the quantity of dry matter biomass recovered aswell as the quantity of the fresh weight forage in a givenlocation (Table 3). A significant (p ≤ 0.05) variation infresh weight forage and dry matter biomass between thedistricts of Moroto (merged with Napak) and Kotidoexisted. Furthermore, season had a significant influence
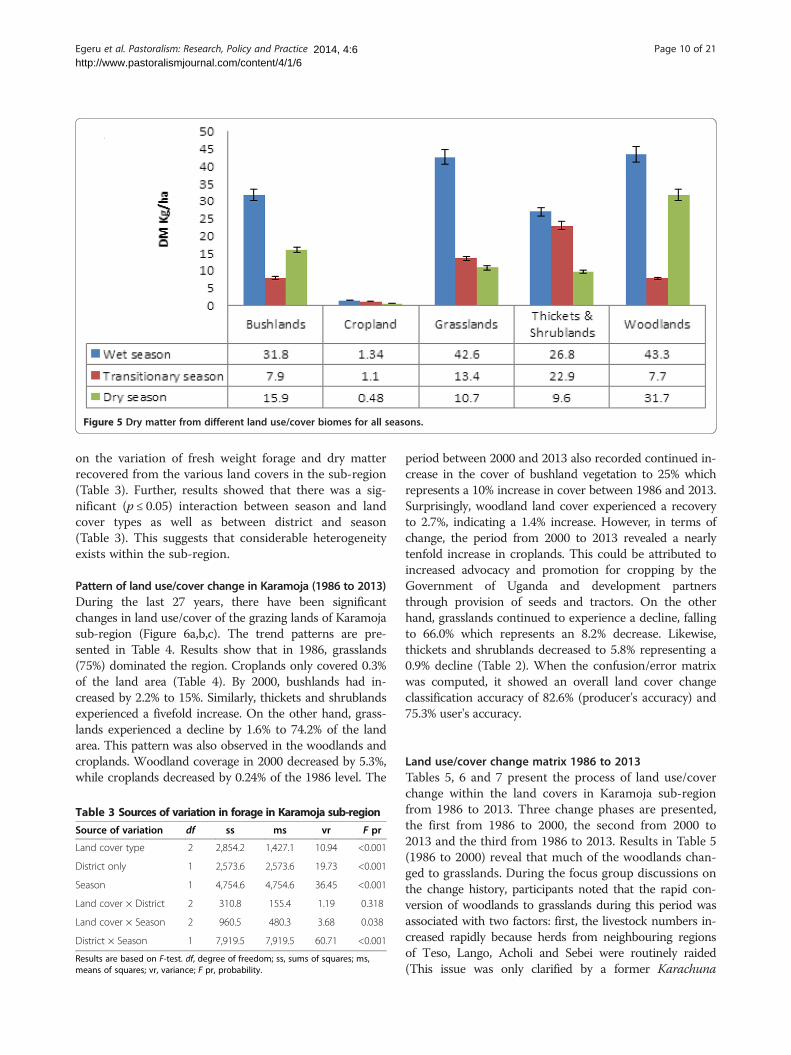
Figure 5 Dry matter from different land use/cover biomes for all seasons.
Egeru et al. Pastoralism: Research, Policy and Practice Page 10 of 212014, 4:6http://www.pastoralismjournal.com/content/4/1/6
on the variation of fresh weight forage and dry matterrecovered from the various land covers in the sub-region(Table 3). Further, results showed that there was a sig-nificant (p ≤ 0.05) interaction between season and landcover types as well as between district and season(Table 3). This suggests that considerable heterogeneityexists within the sub-region.
Pattern of land use/cover change in Karamoja (1986 to 2013)During the last 27 years, there have been significantchanges in land use/cover of the grazing lands of Karamojasub-region (Figure 6a,b,c). The trend patterns are pre-sented in Table 4. Results show that in 1986, grasslands(75%) dominated the region. Croplands only covered 0.3%of the land area (Table 4). By 2000, bushlands had in-creased by 2.2% to 15%. Similarly, thickets and shrublandsexperienced a fivefold increase. On the other hand, grass-lands experienced a decline by 1.6% to 74.2% of the landarea. This pattern was also observed in the woodlands andcroplands. Woodland coverage in 2000 decreased by 5.3%,while croplands decreased by 0.24% of the 1986 level. The
Table 3 Sources of variation in forage in Karamoja sub-region
Source of variation df ss ms vr F pr
Land cover type 2 2,854.2 1,427.1 10.94 <0.001
District only 1 2,573.6 2,573.6 19.73 <0.001
Season 1 4,754.6 4,754.6 36.45 <0.001
Land cover × District 2 310.8 155.4 1.19 0.318
Land cover × Season 2 960.5 480.3 3.68 0.038
District × Season 1 7,919.5 7,919.5 60.71 <0.001
Results are based on F-test. df, degree of freedom; ss, sums of squares; ms,means of squares; vr, variance; F pr, probability.
period between 2000 and 2013 also recorded continued in-crease in the cover of bushland vegetation to 25% whichrepresents a 10% increase in cover between 1986 and 2013.Surprisingly, woodland land cover experienced a recoveryto 2.7%, indicating a 1.4% increase. However, in terms ofchange, the period from 2000 to 2013 revealed a nearlytenfold increase in croplands. This could be attributed toincreased advocacy and promotion for cropping by theGovernment of Uganda and development partnersthrough provision of seeds and tractors. On the otherhand, grasslands continued to experience a decline, fallingto 66.0% which represents an 8.2% decrease. Likewise,thickets and shrublands decreased to 5.8% representing a0.9% decline (Table 2). When the confusion/error matrixwas computed, it showed an overall land cover changeclassification accuracy of 82.6% (producer's accuracy) and75.3% user's accuracy.
Land use/cover change matrix 1986 to 2013Tables 5, 6 and 7 present the process of land use/coverchange within the land covers in Karamoja sub-regionfrom 1986 to 2013. Three change phases are presented,the first from 1986 to 2000, the second from 2000 to2013 and the third from 1986 to 2013. Results in Table 5(1986 to 2000) reveal that much of the woodlands chan-ged to grasslands. During the focus group discussions onthe change history, participants noted that the rapid con-version of woodlands to grasslands during this period wasassociated with two factors: first, the livestock numbers in-creased rapidly because herds from neighbouring regionsof Teso, Lango, Acholi and Sebei were routinely raided(This issue was only clarified by a former Karachuna
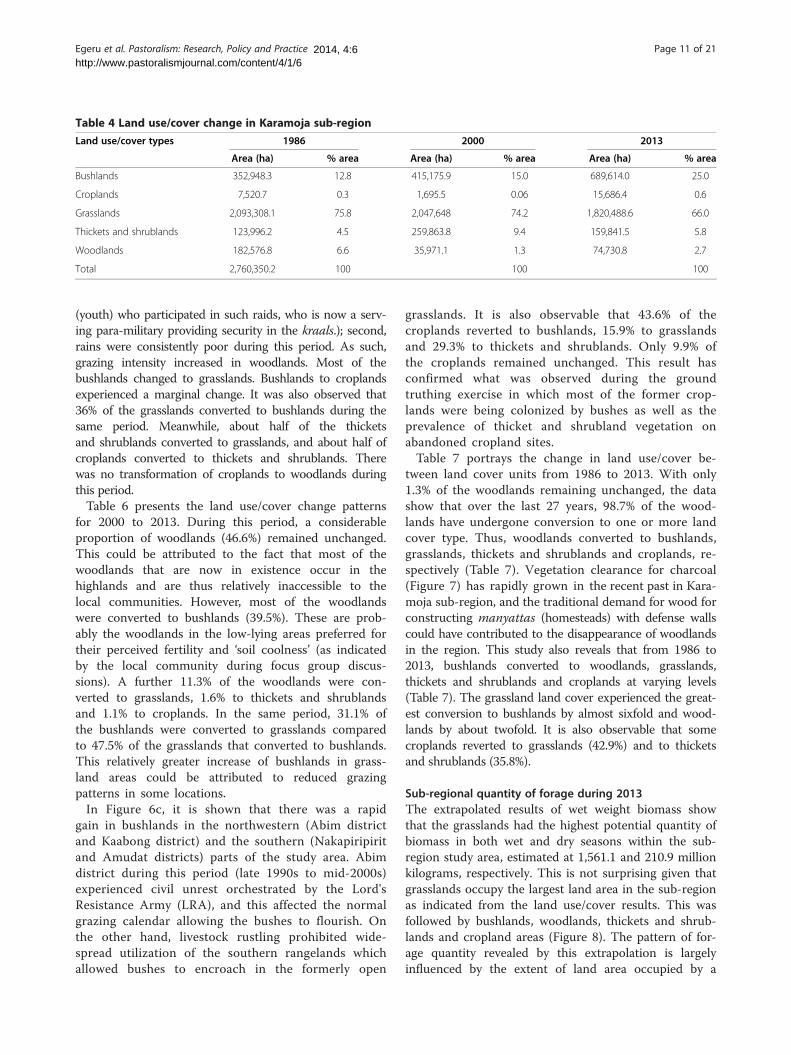
Table 4 Land use/cover change in Karamoja sub-region
Land use/cover types 1986 2000 2013
Area (ha) % area Area (ha) % area Area (ha) % area
Bushlands 352,948.3 12.8 415,175.9 15.0 689,614.0 25.0
Croplands 7,520.7 0.3 1,695.5 0.06 15,686.4 0.6
Grasslands 2,093,308.1 75.8 2,047,648 74.2 1,820,488.6 66.0
Thickets and shrublands 123,996.2 4.5 259,863.8 9.4 159,841.5 5.8
Woodlands 182,576.8 6.6 35,971.1 1.3 74,730.8 2.7
Total 2,760,350.2 100 100 100
Egeru et al. Pastoralism: Research, Policy and Practice Page 11 of 212014, 4:6http://www.pastoralismjournal.com/content/4/1/6
(youth) who participated in such raids, who is now a serv-ing para-military providing security in the kraals.); second,rains were consistently poor during this period. As such,grazing intensity increased in woodlands. Most of thebushlands changed to grasslands. Bushlands to croplandsexperienced a marginal change. It was also observed that36% of the grasslands converted to bushlands during thesame period. Meanwhile, about half of the thicketsand shrublands converted to grasslands, and about half ofcroplands converted to thickets and shrublands. Therewas no transformation of croplands to woodlands duringthis period.Table 6 presents the land use/cover change patterns
for 2000 to 2013. During this period, a considerableproportion of woodlands (46.6%) remained unchanged.This could be attributed to the fact that most of thewoodlands that are now in existence occur in thehighlands and are thus relatively inaccessible to thelocal communities. However, most of the woodlandswere converted to bushlands (39.5%). These are prob-ably the woodlands in the low-lying areas preferred fortheir perceived fertility and ‘soil coolness’ (as indicatedby the local community during focus group discus-sions). A further 11.3% of the woodlands were con-verted to grasslands, 1.6% to thickets and shrublandsand 1.1% to croplands. In the same period, 31.1% ofthe bushlands were converted to grasslands comparedto 47.5% of the grasslands that converted to bushlands.This relatively greater increase of bushlands in grass-land areas could be attributed to reduced grazingpatterns in some locations.In Figure 6c, it is shown that there was a rapid
gain in bushlands in the northwestern (Abim districtand Kaabong district) and the southern (Nakapiripiritand Amudat districts) parts of the study area. Abimdistrict during this period (late 1990s to mid-2000s)experienced civil unrest orchestrated by the Lord'sResistance Army (LRA), and this affected the normalgrazing calendar allowing the bushes to flourish. Onthe other hand, livestock rustling prohibited wide-spread utilization of the southern rangelands whichallowed bushes to encroach in the formerly open
grasslands. It is also observable that 43.6% of thecroplands reverted to bushlands, 15.9% to grasslandsand 29.3% to thickets and shrublands. Only 9.9% ofthe croplands remained unchanged. This result hasconfirmed what was observed during the groundtruthing exercise in which most of the former crop-lands were being colonized by bushes as well as theprevalence of thicket and shrubland vegetation onabandoned cropland sites.Table 7 portrays the change in land use/cover be-
tween land cover units from 1986 to 2013. With only1.3% of the woodlands remaining unchanged, the datashow that over the last 27 years, 98.7% of the wood-lands have undergone conversion to one or more landcover type. Thus, woodlands converted to bushlands,grasslands, thickets and shrublands and croplands, re-spectively (Table 7). Vegetation clearance for charcoal(Figure 7) has rapidly grown in the recent past in Kara-moja sub-region, and the traditional demand for wood forconstructing manyattas (homesteads) with defense wallscould have contributed to the disappearance of woodlandsin the region. This study also reveals that from 1986 to2013, bushlands converted to woodlands, grasslands,thickets and shrublands and croplands at varying levels(Table 7). The grassland land cover experienced the great-est conversion to bushlands by almost sixfold and wood-lands by about twofold. It is also observable that somecroplands reverted to grasslands (42.9%) and to thicketsand shrublands (35.8%).
Sub-regional quantity of forage during 2013The extrapolated results of wet weight biomass showthat the grasslands had the highest potential quantity ofbiomass in both wet and dry seasons within the sub-region study area, estimated at 1,561.1 and 210.9 millionkilograms, respectively. This is not surprising given thatgrasslands occupy the largest land area in the sub-regionas indicated from the land use/cover results. This wasfollowed by bushlands, woodlands, thickets and shrub-lands and cropland areas (Figure 8). The pattern of for-age quantity revealed by this extrapolation is largelyinfluenced by the extent of land area occupied by a
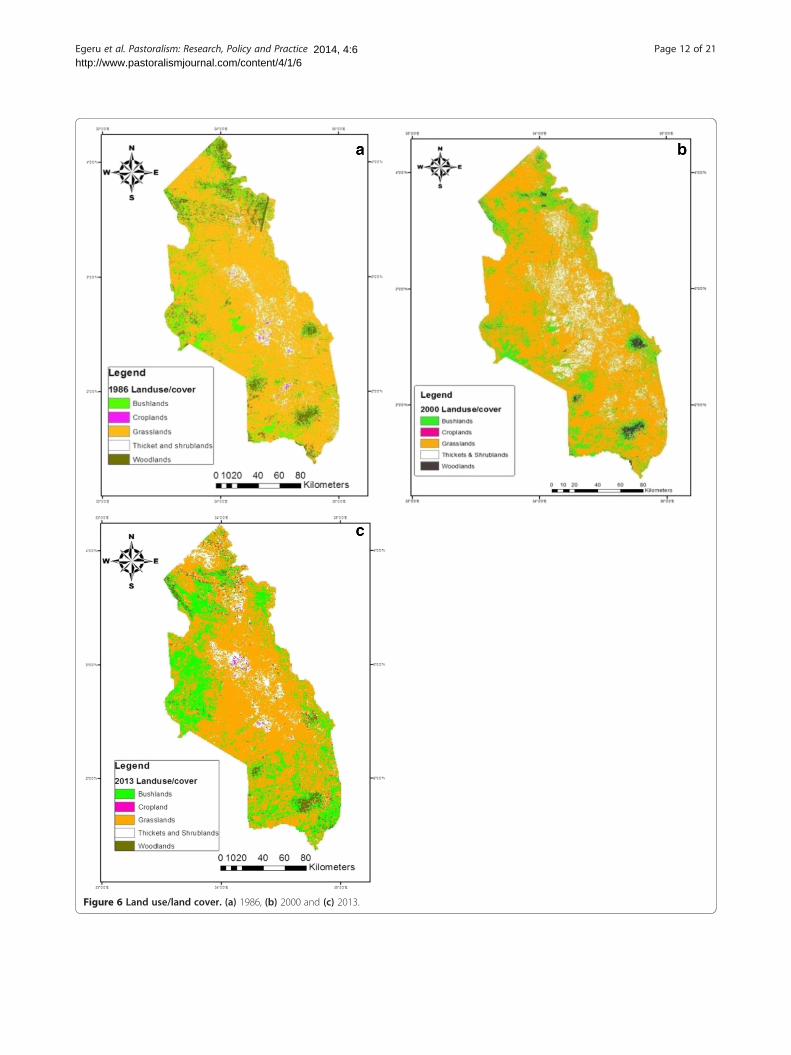
Figure 6 Land use/land cover. (a) 1986, (b) 2000 and (c) 2013.
Egeru et al. Pastoralism: Research, Policy and Practice Page 12 of 212014, 4:6http://www.pastoralismjournal.com/content/4/1/6
Table 5 Land use/cover change matrix (1986 to 2000)
Land use/cover typesin 1986
Land use/cover types in 2000
Woodlands Bushlands Grasslands Thickets and shrublands Croplands Total
Woodlands 0.2 11.9 78.5 9.4 0.0 100
Bushlands 2.0 30.2 66.2 1.5 0.1 100
Grasslands 14.0 36.0 48.1 1.5 0.4 100
Thickets and shrublands 0.1 3.4 52.6 43.7 0.2 100
Croplands 0.0 1.7 44.0 51.7 2.5 100
The figures marked in italics indicate the unchanged percent area during the period. The direction when making the table interpretation is left to right.
Egeru et al. Pastoralism: Research, Policy and Practice Page 13 of 212014, 4:6http://www.pastoralismjournal.com/content/4/1/6
particular land use/cover type. In this respect, grasslandsare the most important grazing land covers particularlyfor cattle in the sub-region in both the wet and dry sea-sons. Thickets and shrublands revealed a relatively higherquantity of wet weight biomass; however, this land coveris mainly used for grazing sheep, goats and some calves.
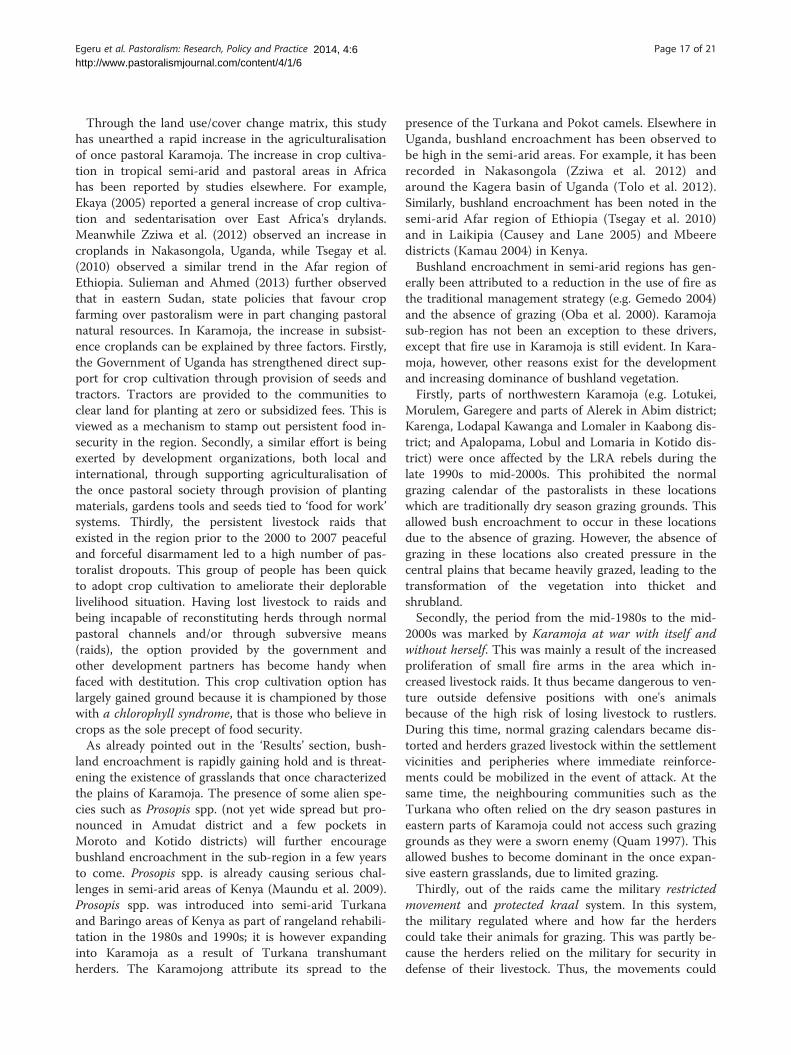
Relationship between NDVI and herbaceous forage quantityDuring the wet season, sub-regional average NDVI was0.46 ± 0.09. With regards to land cover, woodlands hadan average NDVI of 0.53 ± 0.09, grasslands 0.49 ± 0.07,thickets and shrublands 0.40 ± 0.04, croplands/crop-lands 0.30 ± 0.00 and bushlands 0.52 ± 0.08. On theother hand, the sub-regional average NDVI during thedry season was 0.41 ± 0.11. There was however slightvariation at land cover type level (Figure 9). For ex-ample, a slightly higher average NDVI was observed inbushlands (0.51 ± 0.05) during the dry season. This wasfollowed by woodlands (0.49 ± 0.08) and grasslands(0.45 ± 0.09). Further, a 0.31 ± 0.05 and 0.28 ± 0.0 aver-age NDVI was observed in the thickets and shrublandsand croplands, respectively, during the dry season. Therelatively high NDVI in the bushlands can be ex-plained by luxuriant growth of woody vegetationwithin this land cover type. A remarkably high averageNDVI (0.50 ± 0.11) was observed during the transition-ary season (Figure 9). In this season, woodlands hadan average NDVI of 0.65 ± 0.07, grasslands 0.51 ± 0.08,thickets and shrublands 0.43 ± 0.07, bushlands 052 ±0.07 and croplands 0.38 ± 0.07. Thus, as expected, allland cover types reflected a progressive improvementin vegetation greenness from 2012/2013 dry season to
Table 6 Land use/cover change matrix (2000 to 2013)
Land use/cover types2000 Woodlands Bushlands Grass
Woodlands 46.6 39.5 1
Bushlands 6.6 60.1 3
Grasslands 1.4 47.5 4
Thickets and shrublands 0.5 9.6 6
Croplands 1.3 43.6 1
The figures marked in italics indicate the unchanged percent area during the period
2013/2014 transition season (Figure 9). During themonitoring period, rainfall withdrawal occurred aroundMay before the June peak was reached. However, rain-fall later resumed intermittently between August andOctober leading to relatively high vegetation vigourobserved until early November.There is generally a strong correlation between above-
ground wet weight biomass and NDVI, with R2 varyingbetween 0.62 and 0.98 (Additional file 2: Table S8). Thestrength of the relationship varied from one location toanother, with the season and land use/cover types. Thestrength of the relationship was highest for Moroto andthe least at the sub-regional level. During the dry season,the grasslands, thickets and shrublands as well as thewoodlands of Kotido showed a very strong relationshipwith NDVI. On the other hand, the few pockets ofwoodlands in the area generally provide a distinctiveNDVI signature from the rest of the land cover typeswith a very high (R2 = 0.98) biomass/NDVI relationship.Similarly, the grasslands of Napak also showed a veryhigh biomass/NDVI relationship (R2 = 0.878). During thewet season, all land cover types (i.e. grasslands, wood-lands and thickets and shrublands) showed a very highbiomass/NDVI relationship. Grasslands and woodlandsin Moroto had relatively low rates of change during thewet season. During the transitionary season, the strengthof the relationship was relatively lower in Moroto andthe sub-region compared to other locations. Differenti-ated positive gradient of change was observed forall sites and land cover types. It ranged from 0.0015(woodland in Moroto) to 0.1422 (grassland at sub-regional level).
Land use/cover types 2013
lands Thickets and shrublands Croplands Total
1.3 1.6 1.1 100
1.1 1.7 0.5 100
5.9 4.8 0.4 100
6.7 21.4 1.8 100
5.9 29.3 9.9 100
. The direction when making the table interpretation is left to right.
Table 7 Land use/cover change matrix (1986 to 2013)
Land use/cover types1986
Land use/cover types 2013
Woodlands Bushlands Grasslands Thickets and shrublands Croplands Total
Woodlands 1.3 44.1 49.1 5.3 0.3 100
Bushlands 5.3 60.6 31.4 2.1 0.6 100
Grasslands 16.1 59.3 21.1 2.4 1.0 100
Thickets and shrublands 0.3 12.6 53.2 30.3 3.6 100
Croplands 0.1 7.2 42.9 35.8 14.0 100
The figures marked in italics indicate the unchanged percent area during the period. The direction when making the table interpretation is left to right.
Egeru et al. Pastoralism: Research, Policy and Practice Page 14 of 212014, 4:6http://www.pastoralismjournal.com/content/4/1/6
DiscussionHerbaceous and woody forage plant speciesThe Karamoja land cover types are dominated by annualgrasses that provide a diversity of forage for livestock inthe sub-region. The relatively large number of herb-aceous and woody browse forage species observed in thesub-region can be explained by the mobile livestock herd-ing practiced by the Karamoja cluster (e.g. Karamojong,Uganda; Toposa, South Sudan; Turkana, Kenya; andNyangatom, Ethiopia). Some of the grasses (e.g. Digitariaspp. and Eragrostis spp.) that were observed in thisstudy have previously been documented in neighbour-ing Turkana as preferred species (Lusigi et al. 1984).The presence of such species could perhaps explain thecontinued grazing by the Turkana in the Uganda terri-tory, besides their search for water during the dry sea-son. Herbivore grazing in the rangeland ecosystemspromotes growth of grasses, as well as dispersal andfecundity of seeds (Crawley 1983; Jeltsch et al. 1998;Best and Arcese 2009; Notenbaert et al. 2012); thisappears to be the case in the current study area. Add-itionally, some of the browse species such as Acaciamellifera, A. brevispica, Euphorbia tirucalli and Prosopisjuliflora were attributed by Karamojong pastoralists tothe Turkana as responsible for their dispersal such as inKayelein in Kotido district and Lokisile and Kobebeareas in Moroto district. These woody plants are import-ant forage plants among the Turkana (Ooro-Olang 1984;Barrow 1988); however, A. mellifera is notorious for bush en-croachment. It is vital to note that a considerable numberof grass species documented in this study have also beenobserved in other semi-arid and savannah ecosystems, forexample in Kaliro, Uganda (Tabuti and Lye 2009), inSenegal (Fensholt et al. 2004) and generally in the Sahel(Le Houerou 1980). This indicates the adaptability of suchspecies to semi-arid ecosystems. However, there was aconspicuous absence of leguminous plants in most of theland cover types. Limited availability of leguminous forageplants in the rangelands has been observed to limit live-stock growth, meat and milk yield from cattle, owing tocrude protein and mineral limitations (Dzowela et al.1997). This could therefore explain the outcry by the
locals that there is no longer enough milk in the manyat-tas (homesteads).
Quantity of forage at land use/land cover andsub-regional levelThe quantity of forage in the land covers of Karamojadocumented in this study is generally within the rangeof those observed in other studies in tropical Africa suchas over east and the Horn of Africa, (Angerer 2008), inTurkana, Kenya (Ooro-Olang 1984) and in the Sahelian range-lands of Senegal (Miehe et al. 2010. However, this study'sresults are considerably lower than those observed incommercially managed temperate climate grassland pas-tures such as in western Canada (Iwaasa et al. 2012).This study has also been able to document inherentvariation in the quantity of forage that exists betweendifferent land covers, seasons and locations in Karamojasub-region. The differences between wet and dry seasonforage quantity are attributable to variation in rainfallover the seasons. In semi-arid areas of Chad andCameroon, Awa et al. (2002) noted that forage quantity isdirectly related to rainfall. This appears to be a similarsituation in the Karamoja rangelands. However, this pat-tern reveals the major reason for mobile livestock grazingpractices practised in the sub-region. In fact, the decline inwet weight forage quantity around the transitionary season(between August and November) provides a good ration-ale for pastoral mobility. Informal interviews with herdersduring the monitoring period revealed that these patternsin vegetation performance trigger scouting for grazinggrounds and preparation for dry season movement. Thisstudy has also shown that grasslands have relatively loweryields compared to woodlands. However, because of theirexpansive nature in the region, they form the major graz-ing grounds. Secondly, grasslands in the region limited en-cumbrances to livestock during grazing because they havea relatively high grass cover compared to the tree cover(see Figure 2a). Thirdly, grasslands have generally been ob-served to have more nutritious and palatable forage(Ooro-Olang 1984; Reid et al. 2005), though some treespecies can provide browse for livestock, including nutri-tious pods (Gambiza et al. 2010).
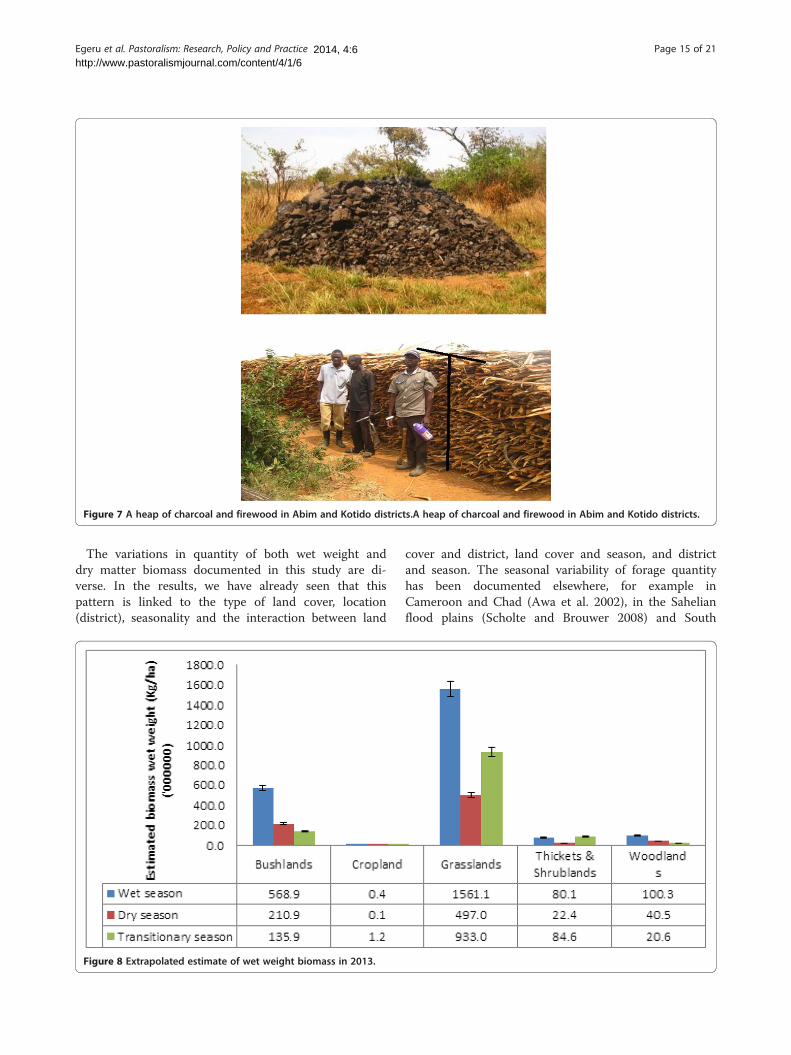
Figure 7 A heap of charcoal and firewood in Abim and Kotido districts.A heap of charcoal and firewood in Abim and Kotido districts.
Egeru et al. Pastoralism: Research, Policy and Practice Page 15 of 212014, 4:6http://www.pastoralismjournal.com/content/4/1/6
The variations in quantity of both wet weight anddry matter biomass documented in this study are di-verse. In the results, we have already seen that thispattern is linked to the type of land cover, location(district), seasonality and the interaction between land
Figure 8 Extrapolated estimate of wet weight biomass in 2013.
cover and district, land cover and season, and districtand season. The seasonal variability of forage quantityhas been documented elsewhere, for example inCameroon and Chad (Awa et al. 2002), in the Sahelianflood plains (Scholte and Brouwer 2008) and South
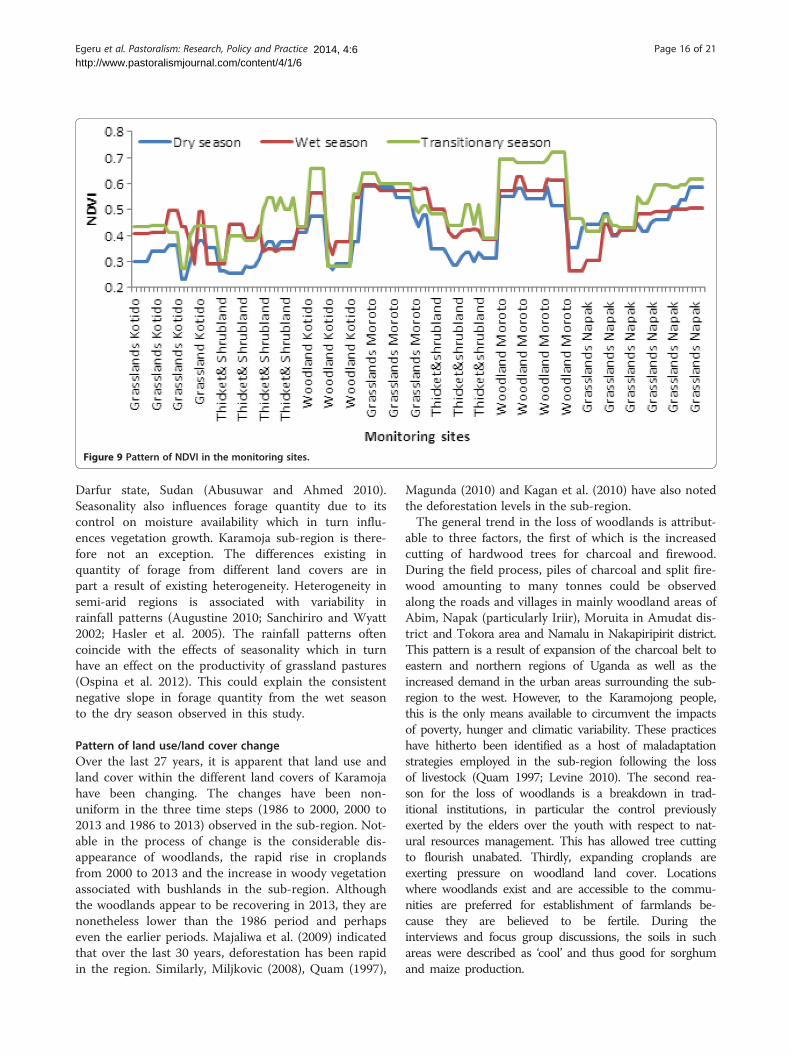
Figure 9 Pattern of NDVI in the monitoring sites.
Egeru et al. Pastoralism: Research, Policy and Practice Page 16 of 212014, 4:6http://www.pastoralismjournal.com/content/4/1/6
Darfur state, Sudan (Abusuwar and Ahmed 2010).Seasonality also influences forage quantity due to itscontrol on moisture availability which in turn influ-ences vegetation growth. Karamoja sub-region is there-fore not an exception. The differences existing inquantity of forage from different land covers are inpart a result of existing heterogeneity. Heterogeneity insemi-arid regions is associated with variability inrainfall patterns (Augustine 2010; Sanchiriro and Wyatt2002; Hasler et al. 2005). The rainfall patterns oftencoincide with the effects of seasonality which in turnhave an effect on the productivity of grassland pastures(Ospina et al. 2012). This could explain the consistentnegative slope in forage quantity from the wet seasonto the dry season observed in this study.
Pattern of land use/land cover changeOver the last 27 years, it is apparent that land use andland cover within the different land covers of Karamojahave been changing. The changes have been non-uniform in the three time steps (1986 to 2000, 2000 to2013 and 1986 to 2013) observed in the sub-region. Not-able in the process of change is the considerable dis-appearance of woodlands, the rapid rise in croplandsfrom 2000 to 2013 and the increase in woody vegetationassociated with bushlands in the sub-region. Althoughthe woodlands appear to be recovering in 2013, they arenonetheless lower than the 1986 period and perhapseven the earlier periods. Majaliwa et al. (2009) indicatedthat over the last 30 years, deforestation has been rapidin the region. Similarly, Miljkovic (2008), Quam (1997),
Magunda (2010) and Kagan et al. (2010) have also notedthe deforestation levels in the sub-region.The general trend in the loss of woodlands is attribut-
able to three factors, the first of which is the increasedcutting of hardwood trees for charcoal and firewood.During the field process, piles of charcoal and split fire-wood amounting to many tonnes could be observedalong the roads and villages in mainly woodland areas ofAbim, Napak (particularly Iriir), Moruita in Amudat dis-trict and Tokora area and Namalu in Nakapiripirit district.This pattern is a result of expansion of the charcoal belt toeastern and northern regions of Uganda as well as theincreased demand in the urban areas surrounding the sub-region to the west. However, to the Karamojong people,this is the only means available to circumvent the impactsof poverty, hunger and climatic variability. These practiceshave hitherto been identified as a host of maladaptationstrategies employed in the sub-region following the lossof livestock (Quam 1997; Levine 2010). The second rea-son for the loss of woodlands is a breakdown in trad-itional institutions, in particular the control previouslyexerted by the elders over the youth with respect to nat-ural resources management. This has allowed tree cuttingto flourish unabated. Thirdly, expanding croplands areexerting pressure on woodland land cover. Locationswhere woodlands exist and are accessible to the commu-nities are preferred for establishment of farmlands be-cause they are believed to be fertile. During theinterviews and focus group discussions, the soils in suchareas were described as ‘cool’ and thus good for sorghumand maize production.
Egeru et al. Pastoralism: Research, Policy and Practice Page 17 of 212014, 4:6http://www.pastoralismjournal.com/content/4/1/6
Through the land use/cover change matrix, this studyhas unearthed a rapid increase in the agriculturalisationof once pastoral Karamoja. The increase in crop cultiva-tion in tropical semi-arid and pastoral areas in Africahas been reported by studies elsewhere. For example,Ekaya (2005) reported a general increase of crop cultiva-tion and sedentarisation over East Africa's drylands.Meanwhile Zziwa et al. (2012) observed an increase incroplands in Nakasongola, Uganda, while Tsegay et al.(2010) observed a similar trend in the Afar region ofEthiopia. Sulieman and Ahmed (2013) further observedthat in eastern Sudan, state policies that favour cropfarming over pastoralism were in part changing pastoralnatural resources. In Karamoja, the increase in subsist-ence croplands can be explained by three factors. Firstly,the Government of Uganda has strengthened direct sup-port for crop cultivation through provision of seeds andtractors. Tractors are provided to the communities toclear land for planting at zero or subsidized fees. This isviewed as a mechanism to stamp out persistent food in-security in the region. Secondly, a similar effort is beingexerted by development organizations, both local andinternational, through supporting agriculturalisation ofthe once pastoral society through provision of plantingmaterials, gardens tools and seeds tied to ‘food for work’systems. Thirdly, the persistent livestock raids thatexisted in the region prior to the 2000 to 2007 peacefuland forceful disarmament led to a high number of pas-toralist dropouts. This group of people has been quickto adopt crop cultivation to ameliorate their deplorablelivelihood situation. Having lost livestock to raids andbeing incapable of reconstituting herds through normalpastoral channels and/or through subversive means(raids), the option provided by the government andother development partners has become handy whenfaced with destitution. This crop cultivation option haslargely gained ground because it is championed by thosewith a chlorophyll syndrome, that is those who believe incrops as the sole precept of food security.As already pointed out in the ‘Results’ section, bush-
land encroachment is rapidly gaining hold and is threat-ening the existence of grasslands that once characterizedthe plains of Karamoja. The presence of some alien spe-cies such as Prosopis spp. (not yet wide spread but pro-nounced in Amudat district and a few pockets inMoroto and Kotido districts) will further encouragebushland encroachment in the sub-region in a few yearsto come. Prosopis spp. is already causing serious chal-lenges in semi-arid areas of Kenya (Maundu et al. 2009).Prosopis spp. was introduced into semi-arid Turkanaand Baringo areas of Kenya as part of rangeland rehabili-tation in the 1980s and 1990s; it is however expandinginto Karamoja as a result of Turkana transhumantherders. The Karamojong attribute its spread to the
presence of the Turkana and Pokot camels. Elsewhere inUganda, bushland encroachment has been observed tobe high in the semi-arid areas. For example, it has beenrecorded in Nakasongola (Zziwa et al. 2012) andaround the Kagera basin of Uganda (Tolo et al. 2012).Similarly, bushland encroachment has been noted in thesemi-arid Afar region of Ethiopia (Tsegay et al. 2010)and in Laikipia (Causey and Lane 2005) and Mbeeredistricts (Kamau 2004) in Kenya.Bushland encroachment in semi-arid regions has gen-
erally been attributed to a reduction in the use of fire asthe traditional management strategy (e.g. Gemedo 2004)and the absence of grazing (Oba et al. 2000). Karamojasub-region has not been an exception to these drivers,except that fire use in Karamoja is still evident. In Kara-moja, however, other reasons exist for the developmentand increasing dominance of bushland vegetation.Firstly, parts of northwestern Karamoja (e.g. Lotukei,
Morulem, Garegere and parts of Alerek in Abim district;Karenga, Lodapal Kawanga and Lomaler in Kaabong dis-trict; and Apalopama, Lobul and Lomaria in Kotido dis-trict) were once affected by the LRA rebels during thelate 1990s to mid-2000s. This prohibited the normalgrazing calendar of the pastoralists in these locationswhich are traditionally dry season grazing grounds. Thisallowed bush encroachment to occur in these locationsdue to the absence of grazing. However, the absence ofgrazing in these locations also created pressure in thecentral plains that became heavily grazed, leading to thetransformation of the vegetation into thicket andshrubland.Secondly, the period from the mid-1980s to the mid-
2000s was marked by Karamoja at war with itself andwithout herself. This was mainly a result of the increasedproliferation of small fire arms in the area which in-creased livestock raids. It thus became dangerous to ven-ture outside defensive positions with one's animalsbecause of the high risk of losing livestock to rustlers.During this time, normal grazing calendars became dis-torted and herders grazed livestock within the settlementvicinities and peripheries where immediate reinforce-ments could be mobilized in the event of attack. At thesame time, the neighbouring communities such as theTurkana who often relied on the dry season pastures ineastern parts of Karamoja could not access such grazinggrounds as they were a sworn enemy (Quam 1997). Thisallowed bushes to become dominant in the once expan-sive eastern grasslands, due to limited grazing.Thirdly, out of the raids came the military restricted
movement and protected kraal system. In this system,the military regulated where and how far the herderscould take their animals for grazing. This was partly be-cause the herders relied on the military for security indefense of their livestock. Thus, the movements could
Egeru et al. Pastoralism: Research, Policy and Practice Page 18 of 212014, 4:6http://www.pastoralismjournal.com/content/4/1/6
barely exceed 5 km from the manyattas (homesteads)and/or protected kraals, since going beyond this dis-tance increased the vulnerability of both the herders andthe military to attack from raiders. This, therefore, leftlarge parts of the region inaccessible for grazing whilethe used areas were slowly encroached by bushlands,and heavily grazed areas were transformed into thicketsand shrublands.Finally, areas that had been croplands were rapidly
encroached by bushlands because communities abandonsuch croplands once productivity declines. What is evi-dent however is that bushland encroachment is affectingmost of the dry season pastures in southeastern areas(e.g. parts of Karita, Lokales, Loporokocho and aroundMorunyang in Amudat district), in central to easternareas (e.g. parts of Katekile, Lokwakipi, Lokisile, Mogos,Losagam, Kothoniok and Kobebe in Moroto district), innortheastern areas (e.g. Risai, Kamion, Oropoi, Kalapataand Pirre in Kaabong district) and in the parts of thesouthern rangelands in Nakapiripirit district amongothers.
Relationship between NDVI and herbaceous forage quantityThe significant relationship observed between NDVI andconventionally clipped above-ground biomass is a goodindication that remote sensing data can be applied in es-timating forage quantity in the sub-region. The estima-tion equations obtained for both wet weight and drymatter biomass can thus be applied in a remote sensingenvironment. In a pilot study conducted in Kenya aspart of a global assessment of land degradation and im-provement, Bai and Dent (2006) also applied remotesensing successfully to quantify green biomass and netprimary production. According to Bozkurt et al. (2011),remote sensing techniques provide greater flexibility andaccuracy for grassland assessment, and the integrationperformed in this study has provided evidence in thisdirection. Further, Dwyer (2011) conducted a spatial es-timation of herbaceous biomass using remote sensing insouthern African savannas with great detail and success.Such assessments have been limited and/or virtuallynon-existent for Karamoja. This has been due to the lackof baseline information regarding forage quantity in dif-ferent land covers. Also, for a considerable period oftime (over three decades), the sub-region was plungedinto civil strife exacerbated by the high proliferation ofsmall arms. This made ground-based assessments in-volving forage clipping impossible in the sub-region.The situation has improved marginally, although theTurkana and Pokot of Kenya remain a security challengebecause they are still armed and occasionally conductarmed livestock raids in the sub-region. Despite thesechallenges, this study has addressed the lack of ground-based assessments of forage quantity in the sub-region.
ConclusionThis study was commissioned with the main objectivesof quantifying forage in the different grazing land use/cover types in Karamoja and providing a long-term por-trait of how these grazing land use/cover types havechanged. This study has successfully bridged the infor-mation gap on forage quantity at seasonal and regionallevels, thus fulfilling one of the recommendations madein the 10th EU/KALIP project document seeking for afull forage assessment on seasonal and location basis inthe sub-region. We have not only provided a wet anddry season perspective, but have also provided a transi-tionary season view point which is critical in providingwarning signals on the likely challenges that the pasto-ralists may face during the dry season.It is hoped that this information should be able to trig-
ger early preparation and early response to the plight ofpastoralists and agro-pastoralists. This study has alsohighlighted the existence of spatial heterogeneity in dif-ferent grazing land covers as well as districts in the re-gion. Thus, mobile grazing practices as used in theregion are likely to continue and may offer the best op-tion for coping and adapting to the heterogeneity in thegrazing landscapes as observed in this study. Further-more, this study has shown that the grasslands, whichrepresent the most important grazing land cover in thesub-region, are under threat from bushland encroach-ment. In particular, the proliferation of alien speciessuch as Prosopis spp. will pose an even greater risk in afew years. This requires immediate management atten-tion to reduce the evident bushland invasion.Uniquely, this study has shown that while other graz-
ing land covers decline in forage quantity during the dryseason, the thickets and shrublands have their peak pro-duction during the transitionary season. The growth incropping in the last 13 years is unprecedented. It istherefore imperative that while supporting intensifica-tion and increases in crop cultivation, efforts are alsogeared towards integrated livestock-crop production sys-tems in the sub-region. Therefore, the sustainability oflivestock grazing in the sub-region will depend on thehealth of the grasslands for continued mobile grazingpractices in order to overcome the low forage quantityper hectare. This study has also shown that it is possibleto estimate above-ground biomass using remote sensingtechnologies. The estimation equations developed in thisstudy offer baseline information that could be utilised bydecision-makers to rapidly obtain forage informationstatus. The varied response rates of land covers at differ-ent locations demonstrate the heterogeneity within theland covers and locations in the sub-region. Werecommend that long-term monitoring studies beconducted in the sub-region within three main treatments:no grazing, controlled grazing and open-access grazing.
Egeru et al. Pastoralism: Research, Policy and Practice Page 19 of 212014, 4:6http://www.pastoralismjournal.com/content/4/1/6
Additional files
: Herbaceous and woody plant species inKaramoja. Tables showing a list of herbaceous and woody plant speciesobserved in grassland land cover (Table S2c) and list of herbaceous andwoody plant species in woodland land cover (Table S2d).
: Correlation between above-ground wet weightbiomass and NDVI. A table showing the relationship of NDVI andherbaceous forage quantity (g/m2) in Karamoja sub-region (Table S8).
Competing interestsThe authors declare that they have no competing interests.
Authors' contributionsAE conducted field data collection and structured the manuscript, OW, LM,and JM Provided technical guidance on methodology and article structure.GJMM and JK provided technical guidance in GIS and remote sensingincluding assistance in image processing.
Author's informationAE is a PhD student at University of Nairobi and an Assistant Lecturer atMakerere University, Uganda. OW (PhD), LM (PhD) and JM (PhD) areLecturers at University of Nairobi. JK is an MSc. student at MakerereUniversity, Uganda, and GJMM is an Associate Professor at MakerereUniversity, Uganda.
AcknowledgementsThis study was funded in part by a grant to Makerere University by theCarnegie Corporation of New York and Makerere University. Additionalfunding was provided by Regional Universities Forum for Capacity Buildingin Agriculture (RUFORUM). We are grateful to the Uganda People's DefenseForces (UPDF) for the provision of security at various locations in the region.
Author details1Department of Land Resource Management and Agricultural Technology,University of Nairobi, P.O. Box 29053-00625, Nairobi, Kenya. 2German Institutefor Tropical and Subtropical Agriculture (DITSL), University of Kassel,Steinstraße 19, Witzenhausen 37213, Germany. 3Department of AgriculturalEngineering, Makerere University, P.O. Box 7062, Kampala, Uganda.4Department of Geography, Geo-informatics and Climatic Sciences, MakerereUniversity, P.O. Box 7062, Kampala, Uganda. 5Department of AgriculturalEconomics, University of Nairobi, P.O. Box 29053-00625, Nairobi, Kenya.
Received: 28 February 2014 Revised: 1 March 2014Accepted: 30 April 2014Published:
ReferencesAbusuwar, AO, and EO Ahmed. 2010. Seasonal variability in nutritive value of
ruminant diets under open grazing system in the semi-arid rangeland ofSudan (South Darfur State). Agriculture and Biology Journal of North America1(3):243–249.
Ahmed, AGM. 2009. Transforming pastoralism: A case study of the Rufa'a Al Hoiethnic group in the Blue Nile State, Sudan. Nomadic Peoples 13(1):113–133.
Allen, VG, C Batello, EJ Berretta, J Hodgson, M Kothmann, X Li, J McIvor, J Milne,C Morris, A Peeters, and M Sanderson. 2011. An international terminology forgrazing lands and grazing animals. Grass and Forage Science 66:2–28.
Anderson, M, and WI Robinson. 2009. The 10th EDF Karamoja LivelihoodsProgramme (KALIP). Technical reference guide submitted to EU, Governmentof Uganda and FAO, Kampala.. Available from: www.opm.nulep.org/about…/436_f6ec429c540744f00d64b5ce83770ca. Accessed on 5th January, 2014.
Angerer, JP. 2008. Technologies, tools and methodologies for forage evaluationin grasslands and rangelands. Texas: A & M University.
Ashley, S, and W Nanyeenya. 2002. More than income: Pro-poor livestockdevelopment policy in Uganda. Livelihoods and Diversity DirectionsExplored by Research (LADDER) Working Paper No. 8. UK: UK Departmentfor International Development (DFID).
Augustine, DJ. 2010. Spatial versus temporal variation in precipitation in asemi-arid ecosystem. Landscape Ecology 25: 913–925. doi: 10.1007/s10980-010-9469-y.
Additional file 1
Additional file 2
30 May 2014
Avery, S. 2014. Water development and irrigation in Karamoja, Uganda. A reviewreport submitted to Dan Church Aid.. Available from: www.opm.nulep.org/buds.
Awa, DN, A Njoya, YM Logtene, JA Ndomadji, J Onana, A Asongwed-Awa, CANTama, M Djoumessi, B Loko, AB Bechir, A Delafosse, and A Maho. 2002.Livestock production systems in the semi-arid savannah of the CentralAfrican sub-region. Actes du Colloque, 27–31 mai 2002. Garoua: Cameroun.Available from: http://hal.archives-ouvertes.fr/hal-00137977/. Accessed on 7th
December, 2013.Bai, ZG, and DL Dent. 2006. Global assessment of land degradation and
improvement: A pilot study in Kenya. World Soil Information. Report 2006/1;Available from: http://www.isric.org/isric/webdocs/docs/ISRIC_Report_2006_01.pdf. Accessed on 2nd August, 2013.
Barrow, E. 1988. Trees and pastoralists: The case of Pokot and Turkana. SocialForestry Network Network Paper 6b:1–27.
Bassett, TJ, and D Crumney. 2003. Contested images, contested realities:Environment and society in African savannas. In African savannas: Globalnarratives and local knowledge of environmental change, ed. TJ Bassett andD Crumney, 1–30. Oxford: James Currey Ltd.
Behnke, R, and M Nakirya. 2012. The contribution of livestock to the Ugandaneconomy. IGAD Livestock Policy Initiative Working Paper No. 02–12. Availablefrom: http://cgspace.cgiar.org/bitstream/handle/10568/24970/IGAD_LPI_WP_02-12.pdf. Accessed on 27th April, 2014.
Best, RJ, and P Arcese. 2009. Exotic herbivores directly facilitate the exotic grassesthey graze: Mechanisms for an unexpected positive feedback betweeninvaders. Oecologia 159(1):139–150.
Bozkurt, Y, N Uzun, and C Dogan. 2011. Grassland evaluation based on GIS modeland remote sensing data for beef cattle grazing. Grassland Science in Europe16:490–492.
Campbell, DJ, DP Lusch, T Smucker, and EE Wangui. 2003. Root causes of landuse change in the Loitokitok Area, Kajiado District, Kenya.. LUCID WorkingPaper Series No. 19.
Causey, M, and P Lane. 2005. GIS and landscape archaeology: Delineating thepossible long-term environmental effects of pastoralism on the LaikipiaPlateau, Kenya. Nyame Akuma, No. 64:24–32. Available from: www.safa.rice.edu/Nyame_Akuma/NA…/Nyame_Akuma_Issue_064-Causey. Accessedon 3rd February, 2014.
Crawley, MJ. 1983. Herbivory: The dynamics of animal-plant interactions (vol. 10).Berkley, California: University of California Press.
Dwyer, PC. 2011. Spatial estimation of herbaceous biomass using remote sensingin Southern African savannas, MSc. Thesis. Johannesburg: University ofWitwatersrand.
Dzowela, BH, L Hove, BV Maasdorp, and PL Mafongoya. 1997. Recent work onthe establishment, production and utilization of multipurpose trees as a feedresource in Zimbabwe. Animal Feed Science and Technology69(97):1–15.
Ekaya, W. 2005. The shift from mobile pastoralism to sedentary crop-livestockfarming in the drylands of eastern Africa: Some issues and challenges for re-search. African Crop Science Conference Proceedings7:1513–1519.
FAO. 2005. Uganda: Livestock sector brief. Rome: FAO.Feng, Y, Q Lu, T Tokola, H Liu, and X Wang. 2009. Assessment of grassland
degradation in Guinan county, Qinghai Province, China, in the past 30 years.Land Degradation Development 20:55–68.
Fensholt, R, I Sandholt, and MS Rasmussen. 2004. Evaluation of MODIS LAI, fAPARand the relation between fAPAR and NDVI in a semi-arid environment usingin situ measurements. Remote Sensing of Environment 91:490–507. 10.1016/j.rse.2004.04.009.
Gambiza, J, E Chidumayo, H Prins, H Fritz, and P Nyathi. 2010. Livestock andwildlife. In The dry forests and woodlands of Africa, ed. EN Chidumayo andDJ Gumbo. London: Earthscan Ltd.
Gemedo, D. 2004. Vegetation ecology, rangeland condition and forage resourcesevaluation in the Borana lowlands, southern Oromia, Ethiopia. PhD, Thesis,Georg-August Universität Göttingen, Göttingen, Germany. Göttingen:Cuvillier.
Gintzburger, G, and S Saïdi. 2009. From inventory to monitoring in semi-arid andarid rangelands. In Range and animal sciences and resources management.Encyclopaedia of life support systems, ed. VR Squires. Oxford: EOLSS,UNESCO. Available at: www.eolss.net.
Grade, JT, JRS Tabuti, and P van Damme. 2009. Ethnoveterinary knowledge inpastoral Karamoja, Uganda. Journal of Ethnopharmacology 122:273–293.doi:10.1016/j.jep.2009.01.005.
Egeru et al. Pastoralism: Research, Policy and Practice Page 20 of 212014, 4:6http://www.pastoralismjournal.com/content/4/1/6
Hasler, N, R Avissar, and GE Liston. 2005. Issues in simulating the annualprecipitation of a semi-arid region in Central Spain. American MetrologicalSociety 6:409–422.
Iwaasa, AD, MP Schellenberg, and B McConkey. 2012. Re-establishment of nativemixed grassland species into annual cropping land. Prairie Soils and CropsJournal 5:85–95.
Jeltsch, F, SJ Milton, WRJ Dean, N van Rooyen, and KA Moloney. 1998. Modellingthe impact of small-scale heterogeneities on tree-grass coexistence insemi-arid savannas. Journal of Ecology 86:780–793.
Kagan, S, L Pedersen, S Ollech, and D Knaute. 2010. The Karamojasyndrome: transdisciplinary systems research informing policy andadvocacy. www.cultura21.net/karamoja/docs/Karamoja_syndrome.Accessed 21 Jan 2014.
Kamau, P. 2004. Forage diversity and impact of grazing management onrangeland ecosystems in Mbeere District, Kenya. LUCID Working Paper SeriesNo. 36. International Livestock Research Institute (ILRI). Available from: www.lucideastafrica.org/publications/Kamau_LUCID_WP36.pdf. Accessed on 14th
March, 2013.Kawamura, K, and T Akiyama. 2010. Simultaneous monitoring of livestock
distribution and desertification. Global Environmental Research 14/2010:29–36.
Kirwa, EC, MM Nyangito, DM Nyariki, and RK Kimitei. 2012. Effect of land usechanges on adaptive strategies for smallholder agro-pastoralists in Kenya.Livestock Research for Rural Development 24(8):2012.
Lambin, EF, HJ Geist, and E Lepers. 2003. Dynamics of land use and land coverchange in tropical regions. Annual Review of Environment and Resources28: 205–241.
Le Houerou, HN. 1980. The rangelands of the Sahel. Journal of RangeManagement 33(1): 41–45.
Lesorogol, CK. 2005. Privatizing pastoral lands: Economic and normativeoutcomes in Kenya. World Development 33(11): 1959–1978.
Levine, S. 2010. What to do about Karamoja: Why pastoralism is not the problembut the solution. A food security analysis of Karamoja. Uganda: FAO/ECHOAvailable from: www.celep.info/wp-content/uploads/.../what-to-do-about-Karamoja.pdf. Accessed on 8th December, 2013.
Lusigi, WJ, ER Nkurunziza, and S Masheti. 1984. Forage preferences in of livestockin the arid lands of Northern Kenya. Journal of Range Management37(6): 542–548.
Madu, A. 2012. Spatial vulnerability of rural households to climate change inNigeria: Implications for internal security. The Robert S. Strauss CenterWorking Paper No. 2.
Magunda, MK. 2010. Study on disaster risk management and environment for theKaramoja sub-region. Kampala, Uganda: European Commission and Foodand Agriculture Organisation of the United Nations (FAO). Available from:www.fao.org/.../user.../Karamoja%20Disaster%20Risk%20Reduction.pdf.Accessed on 5th January, 2014).
Majaliwa, MGJ, E Nkonya, F Place, J Pender, and P Lubega. 2009. Case studies ofsustainable land management approaches to mitigate and reducevulnerability to climate change in sub Saharan Africa: The case study ofUganda. Uganda: International Food Policy Research Institute (IFPRI) andMakerere University Institute of Environment and Natural Resources(MUIENR). 1-55.
Maundu, P, S Kibet, Y Morimoto, M Imbumi, and R Adeka. 2009. Impact ofProsopis juliflora on Kenya's semi-arid and arid ecosystems and locallivelihoods. Biodiversity 10(2–3): 33–50.
Miehe, S, J Kluge, H von Wehrden, and V Retzer. 2010. Long-term degradationof the Sahelian rangeland detected by 27 years of field study in Senegal.Journal of Applied Ecology 47:692–700. doi:10.1111/j.1365-2664.2010.01815.x.
Miljkovic, A. 2008. Environment, security, and conflict: Exploring the linkage witha close up of Uganda's region of Karamoja. Lille: Sciences Po.
Ministry of Agriculture Animal Industry and Fisheries (MAAIF) and Uganda Bureauof Statistics (UBOS). 2010. National Livestock Census Report 2008. Kampala:MAIF and UBOS.
Nakalembe, CL. 2013. Estimating agricultural land use change in Karamoja, NE.Uganda using very high resolution satellite data. In AGU Fall MeetingAbstracts vol. 1, 0369. Available from: http://adsabs.harvard.edu/abs/2013AGUFM.B41A0369N. Accessed on 13th December, 2013.
Nalule, AS. 2010. Social management of rangelands and settlements in Karamoja.Uganda, Kampala: FAO and EU, Uganda. Available from: www.fao.org/.../1_Social%20Management%20of%20Rangelands%20in. Accessed on 5th November, 2013.
Nelson, F. 2012. Natural conservationists? Evaluating the impact of pastoralistland use practices on Tanzania's wildlife economy. Pastoralism: Research,Policy and Practice 2:15.
Notenbaert, AM, J Davies, J De Leeuw, M Said, M Herrero, P Manzano,M Waithaka, A Aboudi, and S Omondi. 2012. Policies in support of pastoralismand biodiversity in the heterogeneous drylands of East Africa. Pastoralism:Research, Policy and Practice 2:14.
Nyariki, DM, AW Mwang'ombe, and DM Thompson. 2009. Land-use change andlivestock production challenges in an integrated system: The Masai-Maraecosystem, Kenya. Human Ecology 26(3):163–173.
Oba, G. 2012. Harnessing pastoralists' indigenous knowledge for rangelandmanagement: Three African case studies. Pastoralism: Research, Policy andPractice 2:1.
Oba, G, E Post, PO Syvertsen, and NC Stenseth. 2000. Bush cover and rangecondition assessments in relation to landscape and grazing in Ethiopia.Landscape Ecology 15:535–546.
Ooro-Olang, MO. 1984. Vegetation cover assessment in Turkana District, Kenya,183–206.. Available from: www.content.alterra.wur.nl/…/Proceeding%20of%20the%20workshop%20leeg. Accessed on 3rd February, 2014.
Ospina, S, GM Rusch, D Pezo, F Casanoves, and FL Sinclair. 2012. More stableproductivity of semi-natural grasslands than sown pastures in a seasonallydry climate. PloS One 7(5): e35555. doi: 10.1371/journal.pone.0035555.
Peng, J, J Wu, H Yin, Q Chang, and T Mu. 2008. Rural land use change during1986–2002 in Lijiang, China, based on remote sensing and GIS data. Sensors8: 8201–8223. doi:10.3390/s8128201.
Quam, D. 1997. Creating peace in an armed society: Karamoja, Uganda, 1996.African Quarterly Studies 1(1):33–46.
Quam, MD. 1999. A bibliography of Karamoja, Uganda: Books and articlespublished in English. Electronic Journal of Africana Bibliography 5(1).Available from: www.ir.uiowa.edu/ejab/vol5/iss1/. Accessed on 3rd February,2014.
Reid, RS, S Serneels, M Nyabenge, and J Hanson. 2005. The changing face ofpastoral systems in grass-dominated ecosystems of eastern Africa. In Grasslandsof the world, no. 34, ed. JM Suttie, SG Reynolds, C Batello, JM Suttie, SG Reynolds,and C Batello. Food and Agriculture Organisation of the United Nations, FAO.
Ruelland, D, F Levavasseur, and A Tribotte. 2010. Patterns and dynamics of land-coverchanges since the 1960s over three experimental areas in Mali. InternationalJournal of Applied Earth Observation and Geoinformation 12:11–17.
Sanchiriro, JN, and TJ Wyatt. 2002. Spatial heterogeneity, mobility and access: Thecase of range management in the Sahel, Quality of the EnvironmentDivision, Resources of the Future, Washington DC.. Available from: www.researchgate.net. Accessed on 31st January, 2014.
Scholte, P, and J Brouwer. 2008. Relevance of key resource areas for large-scalemovements in livestock. In Resource ecology: Spatial and temporal dynamicsof foraging, ed. HHT Prins and F van Langevelde, 211–232. Dordrecht:Springer.
Scott-Villiers, P. 2013. Ekoi and Etem in Karamoja - A study of decision-making ina post-conflict society. A Report submitted to Karamoja Action ResearchTeam.. Available from: www.restlessdevelopment.org/file/ekoi-and-etem-in-karamoja-dec-13-pdf. Accessed on 25th February, 2014.
Sulieman, HM, and AHM Ahmed. 2013. Monitoring changes in pastoral resourcesin eastern Sudan: a synthesis of remote sensing and local knowledge.Pastoralism: Research, Policy and Practice 3:22.
Tabuti, JRS, and KA Lye. 2009. Fodder plants for cattle in Kaliro District, Uganda.African Study Monographs 30(3):161–170.
Tenuche, MS, and OO Ifatimehin. 2009. Resource conflict among farmers andFulani herdsmen: Implications for resource sustainability. African Journal ofPolitical Science and International Relations 3(9):360–364.
Thomas, AS. 1943. The vegetation of the Karamoja district, Uganda: An illustrationof biological factors in tropical ecology. Journal of Ecology 31(2):149–177.
Tolo, CU, EA Majule, and J Perfect. 2012. Changing trends of natural resourcesdegradation in Kagera basin: Case study of Kagera sub-basin, Uganda. NaturalResources 3:95–106.
Tsegay, D, SR Moe, P Vedeld, and E Aynekulu. 2010. Land use/cover dynamics innorthern Afar rangelands, Ethiopia. Agriculture, Ecosystems and Environment139: 174–180. doi:10.1016/j.agee.2010.07.017.
Undersander, D, DR Mertens, and N Thiex. 1993. Forage analyses procedures.Omaha: National Forage Testing Association.
Wamani, H, and A Bagonza. 2013. Nutrition and food security assessment in Karamoja.A Report submitted to UNICEF-Uganda. Available from: www.klikuganda.com/downloads/Karamoja_Dec_2012_report.pdf. Accessed on 25th February, 2014.
Egeru et al. Pastoralism: Research, Policy and Practice Page 21 of 212014, 4:6http://www.pastoralismjournal.com/content/4/1/6
Weber, KT, and S Horst. 2011. Desertification and livestock grazing: The roles ofsedentarisation, mobility and rest. Pastoralism: Research, Policy and Practice 1:19.
Xie, Y, Z Sha, and M Yu. 2008. Remote sensing imagery in vegetation mapping: Areview. Journal of Plant Ecology 1(1):9–23.
Zziwa, E, G Kironchi, C Gachene, S Mugerwa, and D Mpairwe. 2012. The dynamicsof land use and land cover change in Nakasongola district. Journal ofBiodiversity and Environmental Sciences 2(5):61–73.
Cite this article as: Egeru et al.: Spatio-temporal dynamics of forage andland cover changes in Karamoja sub-region, Uganda. Pastoralism: Re-search, Policy and Practice
10.1186/2041-7136-4-6
2014, 4:6
Submit your manuscript to a journal and benefi t from:
7 Convenient online submission
7 Rigorous peer review
7 Immediate publication on acceptance
7 Open access: articles freely available online
7 High visibility within the fi eld
7 Retaining the copyright to your article
Submit your next manuscript at 7 springeropen.com
Related Documents