Spatio-temporal foraging patterns of a giant zooplanktivore, the leatherback turtle Sabrina Fossette a, ⁎, Victoria J. Hobson a , Charlotte Girard b , Beatriz Calmettes b , Philippe Gaspar b , Jean-Yves Georges c , Graeme C. Hays a a Institute of Environmental Sustainability, Swansea University, Singleton Park, Swansea SA2 8PP, United Kingdom b Collecte Localisation Satellites, Satellite Oceanography Division, Marine Ecosystem Modeling and Monitoring by Satellites, 8-10 rue Hermès, 31520 Ramonville St Agne, France c Institut Pluridiciplinaire Hubert Curien, Université Louis Pasteur, CNRS, 23 rue Becquerel, 67087 Strasbourg, France abstract article info Article history: Received 18 August 2009 Received in revised form 30 November 2009 Accepted 9 December 2009 Available online 21 December 2009 Keywords: Leatherback turtle Migration strategy Foraging behavior Zooplankton distribution Diving pattern North Atlantic Ocean Understanding food web functioning through the study of natural bio-indicators may constitute a valuable and original approach. In the context of jellyfish proliferation in many overexploited marine ecosystems studying the spatio-temporal foraging patterns of the giant “jellyvore” leatherback turtle turns out to be particularly relevant. Here we analyzed long-term tracking data to assess spatio-temporal foraging patterns in 21 leatherback turtles during their pluri-annual migration in the Northern Atlantic. Through an analytical approach based on the animal's own motion (independent of currents) and diving behavior distinct zones of high and low foraging success were identified. High foraging success occurred in a sub-equatorial zone spanning the width of the Atlantic and at high (>30°N) latitudes. Between these zones in the centre of North Atlantic gyre there was low foraging success. This “ocean desert” area was traversed at high speed by leatherbacks on their way to more productive areas at higher latitudes. Animals traveled slowly in high foraging success areas and dived shallower (17.2 ± 8.0 km day -1 and 53.6 ± 33.1 m mean ± SD respectively) than in low foraging success areas (51.0 ± 13.1 km day -1 and 81.8 ± 56.2 m mean ± SD respectively). These spatio-temporal foraging patterns seem to relatively closely match the main features of the integrated meso- zooplankton distribution in the North Atlantic. Our method of defining high foraging success areas is intuitive and relatively easy to implement but also takes into account the impact of oceanic currents on animal's behavior. © 2009 Elsevier B.V. All rights reserved. 1. Introduction With climate change, overfishing and fisheries bycatch currently jeopardizing the sustainability of marine environments and natural resources worldwide (Pauly et al., 1998), there is a growing need for better understanding of marine food webs (e.g. Frank et al., 2007; Travers et al., 2009). A topical worrying example is notably the jellyfish proliferation to the detriment of other marine organisms in overexploited marine ecosystems which may have high ecological and economical consequences (Lynam et al., 2006). In view of the complexity of ecosystem functioning, an original approach is the use of natural bio-indicators (e.g. Boyd and Murray, 2001). The spatio- temporal distribution pattern of resources indeed drives the spatio- temporal behavioral patterns of specialist predators (e.g. Weimers- kirch et al., 2005). High-trophic level predators notably integrate and amplify the effects of environmental forcing on lower levels throughout food chains while migrants are integrators of global processes as they may feed in some parts of the world and reproduce in others. The “jellyvore” migrant leatherback turtle may therefore be a particularly relevant bio-indicator of short- and long-term changes in food webs and resource availability in overexploited marine ecosystems (e.g. Saba et al., 2008). We thus surmise that the leatherback's spatio-temporal foraging patterns will match the gelatinous zooplankton global distribution with a lot of time spent successfully foraging on continental shelves which are known to be highly overexploited areas where gelatinous zooplankton may be abundant (Pauly et al., 2002). In order to test this prediction, one of the first steps is to clearly identify the foraging strategies of leatherback turtles and objective methods of quantifying the time spent foraging are thus needed. Yet for highly migratory marine species, data on foraging success are difficult to obtain. Arguably the best approach might be to record prey ingestion over long periods using internal temperature sensor or sensors that record mouth opening (i.e. IMASEN, Wilson et al., 2002) as has been done for some other groups such as marine birds (e.g. Wilson et al., 2002), pinnipeds (Liebsch et al., 2007; Kuhn et al., 2009) and fish (e.g. Itoh et al., 2003; Bestley et al., 2008). However, to date successful studies using IMASEN to directly measure prey ingestion by leatherbacks have been limited to a few days only (Myers and Hays, 2006; Fossette et al., 2008a) due to the difficulty of long-term deployment of any loggers on this species. So for leatherback turtles a Journal of Marine Systems 81 (2010) 225–234 ⁎ Corresponding author. Adr: Institute of Environmental Sustainability, School of the Environment & Society, Swansea University, Singleton Park, Swansea SA2 8PP, United Kingdom. Tel.: +44 1792 205678x4614. E-mail address: [email protected] (S. Fossette). 0924-7963/$ – see front matter © 2009 Elsevier B.V. All rights reserved. doi:10.1016/j.jmarsys.2009.12.002 Contents lists available at ScienceDirect Journal of Marine Systems journal homepage: www.elsevier.com/locate/jmarsys

Welcome message from author
This document is posted to help you gain knowledge. Please leave a comment to let me know what you think about it! Share it to your friends and learn new things together.
Transcript

Journal of Marine Systems 81 (2010) 225–234
Contents lists available at ScienceDirect
Journal of Marine Systems
j ourna l homepage: www.e lsev ie r.com/ locate / jmarsys
Spatio-temporal foraging patterns of a giant zooplanktivore, the leatherback turtle
Sabrina Fossette a,⁎, Victoria J. Hobson a, Charlotte Girard b, Beatriz Calmettes b, Philippe Gaspar b,Jean-Yves Georges c, Graeme C. Hays a
a Institute of Environmental Sustainability, Swansea University, Singleton Park, Swansea SA2 8PP, United Kingdomb Collecte Localisation Satellites, Satellite Oceanography Division, Marine Ecosystem Modeling and Monitoring by Satellites, 8-10 rue Hermès, 31520 Ramonville St Agne, Francec Institut Pluridiciplinaire Hubert Curien, Université Louis Pasteur, CNRS, 23 rue Becquerel, 67087 Strasbourg, France
⁎ Corresponding author. Adr: Institute of EnvironmenEnvironment & Society, Swansea University, Singleton PKingdom. Tel.: +44 1792 205678x4614.
E-mail address: [email protected] (S. Foss
0924-7963/$ – see front matter © 2009 Elsevier B.V. Aldoi:10.1016/j.jmarsys.2009.12.002
a b s t r a c t
a r t i c l e i n f oArticle history:Received 18 August 2009Received in revised form 30 November 2009Accepted 9 December 2009Available online 21 December 2009
Keywords:Leatherback turtleMigration strategyForaging behaviorZooplankton distributionDiving patternNorth Atlantic Ocean
Understanding food web functioning through the study of natural bio-indicators may constitute a valuableand original approach. In the context of jellyfish proliferation in many overexploited marine ecosystemsstudying the spatio-temporal foraging patterns of the giant “jellyvore” leatherback turtle turns out to beparticularly relevant. Here we analyzed long-term tracking data to assess spatio-temporal foraging patternsin 21 leatherback turtles during their pluri-annual migration in the Northern Atlantic. Through an analyticalapproach based on the animal's own motion (independent of currents) and diving behavior distinct zones ofhigh and low foraging success were identified. High foraging success occurred in a sub-equatorial zonespanning the width of the Atlantic and at high (>30°N) latitudes. Between these zones in the centre of NorthAtlantic gyre there was low foraging success. This “ocean desert” area was traversed at high speed byleatherbacks on their way to more productive areas at higher latitudes. Animals traveled slowly in highforaging success areas and dived shallower (17.2±8.0 kmday−1 and 53.6±33.1 m mean±SD respectively)than in low foraging success areas (51.0±13.1 kmday−1 and 81.8±56.2 m mean±SD respectively). Thesespatio-temporal foraging patterns seem to relatively closely match the main features of the integrated meso-zooplankton distribution in the North Atlantic. Our method of defining high foraging success areas isintuitive and relatively easy to implement but also takes into account the impact of oceanic currents onanimal's behavior.
tal Sustainability, School of theark, Swansea SA2 8PP, United
ette).
l rights reserved.
© 2009 Elsevier B.V. All rights reserved.
1. Introduction
With climate change, overfishing and fisheries bycatch currentlyjeopardizing the sustainability of marine environments and naturalresources worldwide (Pauly et al., 1998), there is a growing need forbetter understanding of marine food webs (e.g. Frank et al., 2007;Travers et al., 2009). A topical worrying example is notably thejellyfish proliferation to the detriment of other marine organisms inoverexploited marine ecosystems which may have high ecologicaland economical consequences (Lynam et al., 2006). In view of thecomplexity of ecosystem functioning, an original approach is the useof natural bio-indicators (e.g. Boyd and Murray, 2001). The spatio-temporal distribution pattern of resources indeed drives the spatio-temporal behavioral patterns of specialist predators (e.g. Weimers-kirch et al., 2005). High-trophic level predators notably integrate andamplify the effects of environmental forcing on lower levelsthroughout food chains while migrants are integrators of globalprocesses as they may feed in some parts of the world and reproduce
in others. The “jellyvore”migrant leatherback turtle may therefore bea particularly relevant bio-indicator of short- and long-term changesin food webs and resource availability in overexploited marineecosystems (e.g. Saba et al., 2008). We thus surmise that theleatherback's spatio-temporal foraging patterns will match thegelatinous zooplankton global distribution with a lot of time spentsuccessfully foraging on continental shelves which are known to behighly overexploited areas where gelatinous zooplankton may beabundant (Pauly et al., 2002).
In order to test this prediction, one of the first steps is to clearlyidentify the foraging strategies of leatherback turtles and objectivemethods of quantifying the time spent foraging are thus needed. Yetfor highly migratory marine species, data on foraging success aredifficult to obtain. Arguably the best approach might be to record preyingestion over long periods using internal temperature sensor orsensors that record mouth opening (i.e. IMASEN, Wilson et al., 2002)as has been done for some other groups such as marine birds (e.g.Wilson et al., 2002), pinnipeds (Liebsch et al., 2007; Kuhn et al., 2009)and fish (e.g. Itoh et al., 2003; Bestley et al., 2008). However, to datesuccessful studies using IMASEN to directlymeasure prey ingestion byleatherbacks have been limited to a few days only (Myers and Hays,2006; Fossette et al., 2008a) due to the difficulty of long-termdeployment of any loggers on this species. So for leatherback turtles a
226 S. Fossette et al. / Journal of Marine Systems 81 (2010) 225–234
more sensible approach for delineating when and how foragingactually occurs remains for the moment through the analysis of long-term tracking data. To this end various approaches have been used,based on simultaneous changes in traveling rate and diving behavior(James et al., 2005; Hays et al., 2006), on movement patterns (i.e.using a switching state space model, Jonsen et al., 2005; Shillingeret al., 2008) or on changes in the animal's own motion (i.e. withoutthe influence of oceanic currents, Gaspar et al., 2006). As demon-strated by Robinson et al. (2007), these approaches are all proxies forforaging and assume that animals will spend more time in areas ofhigh foraging success and that travel rate decreases during foragingcompared to transiting from one feeding area to another. The linkbetween slower travel rate and increased foraging success has beendirectly shown in king penguins (Aptenodytes patagonicus, Bost et al.,1997) and bottlenose dolphins (Tursiops truncatus; Bailey andThompson, 2006) and more recently in northern elephant seals(Mirounga angustirostris; Kuhn et al., 2009). But for many species theextent of successful feeding that occurs when animals are in inferredforaging areas when compared to periods defined as transit is stillunknown. Nevertheless, while the different approaches of definingforaging success each has limitations (e.g. White and Sjöberg, 2002),importantly these techniques may be internally consistent, allowingobjective delineation of temporal and spatial differences in foraging.
Gaspar et al. (2006), based on the analysis of the travel rate and thetrajectory straightness of an Argos-tracked leatherback, suggestedthat the influence of oceanic currents on an animal's own motionshould be taken into account for properly assessing where and howanimals forage. The necessity of a current correction has also beenacknowledged in several other species (e.g. king penguins: Cotté et al.,2007; Wandering Albatrosses Diomedea exulans gibsoni: Murray et al.,2002; northern fur seals Callorhinus ursinus: Ream et al., 2005;loggerhead turtles Caretta caretta: Girard et al., 2009). Here we im-plemented this approach of correcting animal movements by contem-poraneous currents on a large sample size to calculate the time spentachieving high foraging success in the leatherback turtle. We then usethe technique, combined with information about diving behavior,to identify the temporal and spatial patterns of leatherback turtleforaging in the Atlantic, identify zones of high foraging success andcompare these zones with the distribution of zooplankton.
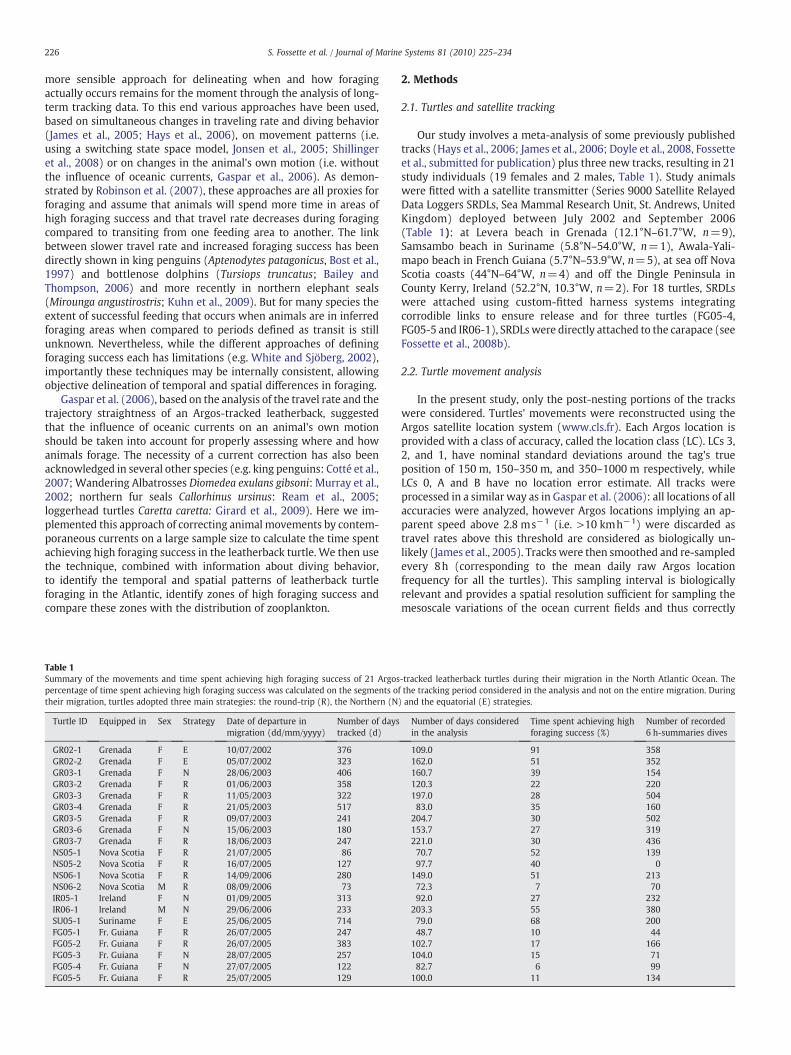
Table 1Summary of the movements and time spent achieving high foraging success of 21 Argospercentage of time spent achieving high foraging success was calculated on the segments otheir migration, turtles adopted three main strategies: the round-trip (R), the Northern (N
Turtle ID Equipped in Sex Strategy Date of departure inmigration (dd/mm/yyyy)
Number of daystracked (d)
GR02-1 Grenada F E 10/07/2002 376GR02-2 Grenada F E 05/07/2002 323GR03-1 Grenada F N 28/06/2003 406GR03-2 Grenada F R 01/06/2003 358GR03-3 Grenada F R 11/05/2003 322GR03-4 Grenada F R 21/05/2003 517GR03-5 Grenada F R 09/07/2003 241GR03-6 Grenada F N 15/06/2003 180GR03-7 Grenada F R 18/06/2003 247NS05-1 Nova Scotia F R 21/07/2005 86NS05-2 Nova Scotia F R 16/07/2005 127NS06-1 Nova Scotia F R 14/09/2006 280NS06-2 Nova Scotia M R 08/09/2006 73IR05-1 Ireland F N 01/09/2005 313IR06-1 Ireland M N 29/06/2006 233SU05-1 Suriname F E 25/06/2005 714FG05-1 Fr. Guiana F R 26/07/2005 247FG05-2 Fr. Guiana F R 26/07/2005 383FG05-3 Fr. Guiana F N 28/07/2005 257FG05-4 Fr. Guiana F N 27/07/2005 122FG05-5 Fr. Guiana F R 25/07/2005 129
2. Methods
2.1. Turtles and satellite tracking
Our study involves a meta-analysis of some previously publishedtracks (Hays et al., 2006; James et al., 2006; Doyle et al., 2008, Fossetteet al., submitted for publication) plus three new tracks, resulting in 21study individuals (19 females and 2 males, Table 1). Study animalswere fitted with a satellite transmitter (Series 9000 Satellite RelayedData Loggers SRDLs, Sea Mammal Research Unit, St. Andrews, UnitedKingdom) deployed between July 2002 and September 2006(Table 1): at Levera beach in Grenada (12.1°N–61.7°W, n=9),Samsambo beach in Suriname (5.8°N–54.0°W, n=1), Awala-Yali-mapo beach in French Guiana (5.7°N–53.9°W, n=5), at sea off NovaScotia coasts (44°N–64°W, n=4) and off the Dingle Peninsula inCounty Kerry, Ireland (52.2°N, 10.3°W, n=2). For 18 turtles, SRDLswere attached using custom-fitted harness systems integratingcorrodible links to ensure release and for three turtles (FG05-4,FG05-5 and IR06-1), SRDLswere directly attached to the carapace (seeFossette et al., 2008b).
2.2. Turtle movement analysis
In the present study, only the post-nesting portions of the trackswere considered. Turtles' movements were reconstructed using theArgos satellite location system (www.cls.fr). Each Argos location isprovided with a class of accuracy, called the location class (LC). LCs 3,2, and 1, have nominal standard deviations around the tag's trueposition of 150 m, 150–350 m, and 350–1000 m respectively, whileLCs 0, A and B have no location error estimate. All tracks wereprocessed in a similar way as in Gaspar et al. (2006): all locations of allaccuracies were analyzed, however Argos locations implying an ap-parent speed above 2.8 ms−1 (i.e. >10 kmh−1) were discarded astravel rates above this threshold are considered as biologically un-likely (James et al., 2005). Trackswere then smoothed and re-sampledevery 8h (corresponding to the mean daily raw Argos locationfrequency for all the turtles). This sampling interval is biologicallyrelevant and provides a spatial resolution sufficient for sampling themesoscale variations of the ocean current fields and thus correctly
-tracked leatherback turtles during their migration in the North Atlantic Ocean. Thef the tracking period considered in the analysis and not on the entire migration. During) and the equatorial (E) strategies.
Number of days consideredin the analysis
Time spent achieving highforaging success (%)
Number of recorded6 h-summaries dives
109.0 91 358162.0 51 352160.7 39 154120.3 22 220197.0 28 50483.0 35 160
204.7 30 502153.7 27 319221.0 30 43670.7 52 13997.7 40 0
149.0 51 21372.3 7 7092.0 27 232
203.3 55 38079.0 68 20048.7 10 44
102.7 17 166104.0 15 7182.7 6 99
100.0 11 134

227S. Fossette et al. / Journal of Marine Systems 81 (2010) 225–234
estimating the currents along the tracks (see below). A local linearregression with a time window of one day was used to re-sample thetracks. Epanechnikov kernel was used to weight observations in thatwindow. The size of the window should be adjusted according to thequality of the data in order to avoid over-smoothing the tracks.When there were less than 5 positions available in one time window,positions at 8-hourly intervals were obtained by simple linear inter-polation between adjacent fixes. Linearly interpolated track's seg-ments longer than 3 days were not taken into account in thesubsequent analysis as travel rate and straightness index calculatedfrom linearly interpolated locations were, respectively, underesti-mated and overestimated.
The observed track of an animal at any given time results from theanimal's own movement (swimming) and its displacement due toocean currents (drift). Thus by removing the influence of currents onthe animal's trajectory, the ‘true’ locomotion behavior (the “motortrack”) of an animal can be obtained (Gaspar et al., 2006; Girard et al.,2006). In short, for each 8-h re-sampled location, we calculated theapparent turtle velocity (i.e. the velocity over the ground) andsubtracted from it an estimate of the surface current velocity. Theturtle swimming velocity is then simply obtained as the vectordifference between the apparent and the current velocities. FollowingGaspar et al. (2006), the surface current velocity is estimated to be thesum of the surface geostrophic current deduced from altimetricmeasurements (available from www.aviso.oceanobs.com) and thewind-induced Ekman current computed using the Rio and Hernandez(2003) model. Details concerning the computation and validity ofthese current estimates can be found in Pascual et al. (2006) andGaspar et al. (2006). Note that this current correction was not per-formed for track segments located in the equatorial band (i.e. between0° and 5°N) where both the geostrophic and Ekman approximationsbreak down.
The straightness of an animal's path can be calculated as the ratio ofthe beeline distance D between the first and the last points, and thetraveled path length L (Batschelet, 1981). Eachmotor trackwas thus re-sampled in a form of a sequence of n steps with a constant length l(l=15 km corresponding to the average distance between our suc-cessive Argos locations), and the ratio Di/L was successively calculatedfor each location (xi,yi) at the centre of a 10-steps (L=150 km)window.
Fig. 1. Movements of 21 Argos-tracked leatherback turtles during their pluri-annual migraGrenada, in French Guiana and Suriname while six were deployed on individuals capturedmigration, turtles adopted three main strategies: the round-trip (in green), the Northern (portions of the tracks not considered in the subsequent analysis, see methods for details.
2.3. Turtle diving behavior
Modifications in the horizontal and vertical behaviors are oftenconcurrent (e.g. James et al., 2005). In addition, diving patterns mayprovide information on the distribution of the prey in the watercolumn. Therefore, the diving behavior was analyzed during leather-back's migrations. SRDLs provided measurements of diving behaviorfrom a pressure sensor, which sampled depth every 4s with anaccuracy of 0.33 m. Data were statistically summarized onboard over6-h collection periods providing the number of individual divesperformed during the period, their mean (±SD) duration and mean(±SD) maximum depth (see McMahon et al., 2005 for details).
The point location values for high foraging success (Fig. 3) and themean dive depth (Fig. 4) were imported into ArcMap 9.1 (ESRI,Redlands, California) and interpolated using inverse distance weight-ing to predict values for area where there was no data coverage on a2°×2° and 1°×1° scale, respectively.
3. Results
3.1. General migration pattern
The 21 turtles were followed for between 73 and 714 days(Table 1, Fig. 1), but at different periods of their migration. Amongthe females of this study, the earliest date of departure from thenesting site was on the 11th of May. Accordingly, we considered thatwhen females started their migration from Grenada, French Guiana orSuriname, they were in year 1 of migration starting on the 1st of May(noted May Year 1) and finishing on the 30th of April (noted AprilYear 1) one year later. We then assumed that turtles caught at theirhigh-latitude sites in Nova Scotia in September were in year 1 ofmigration whereas turtles caught in Nova Scotia in July or in Ireland inJune and September were in year 2 of migration beginning in Mayyear 2 and finishing in April year 2. Indeed, as turtles need on averagebetween 3 to 6 months to travel from their nesting beaches to thesehigh-latitude summering sites, turtles should have left their nestingsites as early as March–April in order to arrive in Nova Scotia in July orin Ireland in June which is unlikely as March–April corresponds tothe beginning of the nesting season for leatherbacks in the North
tion in the North Atlantic Ocean. Fifteen SRDLs were deployed on females nesting inin waters off Nova Scotia and off the west coast of Ireland, close to Dingle. During theirin blue) and the equatorial (in orange) strategies. Thinner lines: linearly interpolated
228 S. Fossette et al. / Journal of Marine Systems 81 (2010) 225–234
hemisphere. Two turtles (IR05-1; SU05-1) were tracked until year 3 ofmigration beginning in May year 3 and finishing in April year 3.
Turtles moved across the entire North Atlantic Ocean basin be-tween 4.3°N (Turtle GR02-2) and 52.0°N (Turtle GR03-3) and 7.5°W(Turtle SU05-1) and 75.5°W (Turtle FG05-5). According to (1) theirinitial direction of migration, i.e. North or East, (2) the dates of arrivaland departure at and from the high-latitude sites taking into accountthe distance from the nesting sites and (3) the fact that they headsouth or not at the end of the autumn, three main migrating strategiesadopted by the turtles during their pluri-annual migration weredefined (Fig. 1). The first strategy (hereafter called the “round-trip”strategy, 12 individuals) consisted in reaching high latitudes (35–50°N) at the end of summer/beginning of autumn before heading
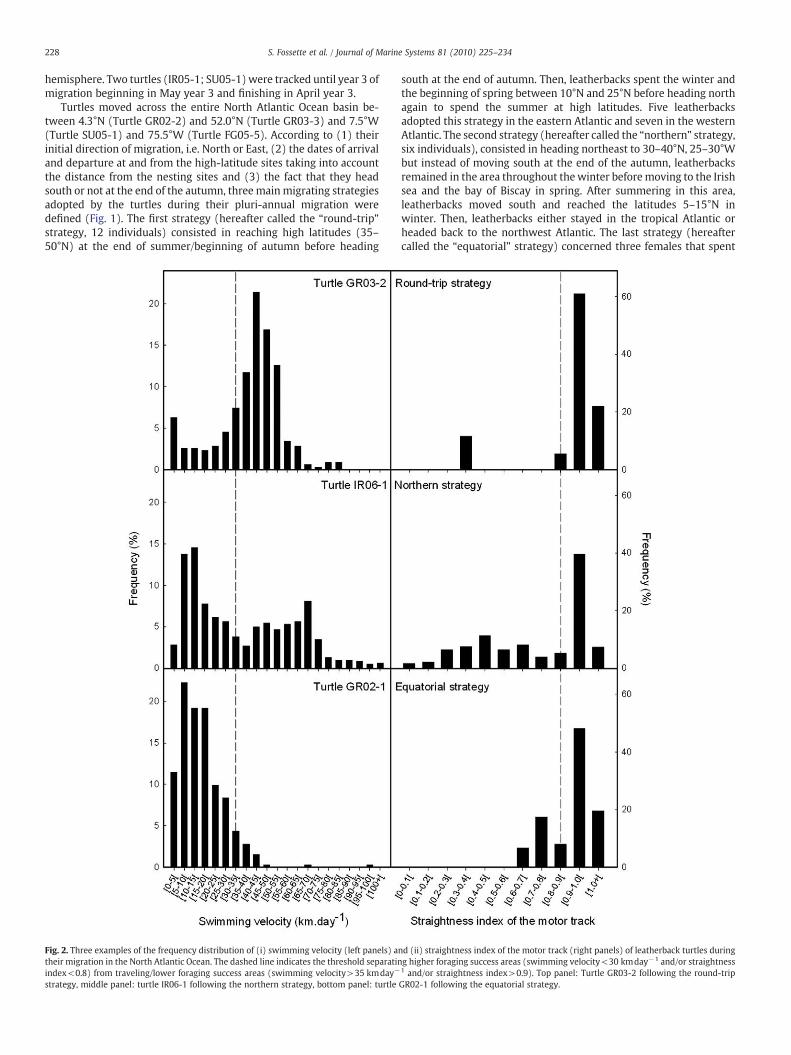
Fig. 2. Three examples of the frequency distribution of (i) swimming velocity (left panels) atheir migration in the North Atlantic Ocean. The dashed line indicates the threshold separatinindex<0.8) from traveling/lower foraging success areas (swimming velocity>35 kmday−
strategy, middle panel: turtle IR06-1 following the northern strategy, bottom panel: turtle
south at the end of autumn. Then, leatherbacks spent the winter andthe beginning of spring between 10°N and 25°N before heading northagain to spend the summer at high latitudes. Five leatherbacksadopted this strategy in the eastern Atlantic and seven in the westernAtlantic. The second strategy (hereafter called the “northern” strategy,six individuals), consisted in heading northeast to 30–40°N, 25–30°Wbut instead of moving south at the end of the autumn, leatherbacksremained in the area throughout thewinter beforemoving to the Irishsea and the bay of Biscay in spring. After summering in this area,leatherbacks moved south and reached the latitudes 5–15°N inwinter. Then, leatherbacks either stayed in the tropical Atlantic orheaded back to the northwest Atlantic. The last strategy (hereaftercalled the “equatorial” strategy) concerned three females that spent
nd (ii) straightness index of the motor track (right panels) of leatherback turtles duringg higher foraging success areas (swimming velocity<30 kmday−1 and/or straightness1 and/or straightness index>0.9). Top panel: Turtle GR03-2 following the round-tripGR02-1 following the equatorial strategy.

229S. Fossette et al. / Journal of Marine Systems 81 (2010) 225–234
the first year after the nesting season in the tropical Atlantic beforeheading north at the beginning of the summer to reach high latitudesin autumn. The winter and the following spring were then spentbetween 40 and 50°N in the eastern Atlantic.
3.2. Foraging behavior
For highlighting higher foraging success areas from lower foragingsuccess areas, we fixed threshold values for the swimming velocityand the straightness index (S) based on the assumption that de-creasing velocity and/or motor track straightness indicate increasingforaging success. It has not been proven yet that a turtle may be ableto detect a current and its directionwhen traveling in open sea (whichis almost impossible for a moving animal without any stationaryreference points) and thus adjust its swimming behavior accordinglyto take advantage of this current. Therefore we assume that a turtlewill decrease its own swimming velocity and/or motor track straight-ness under a certain threshold when foraging only. We based ourdefinition of the thresholds on the analysis of the individual frequencydistributions for each parameter. Individual frequency distributionsof the swimming velocity were of three types: (1) swimming ve-locities mostly distributed between 5 to 30 kmday−1, (2) swimmingvelocities mostly distributed between 35 and 70 kmday−1 and(3) swimming velocities showing both distributions (Fig. 2). A similarthreshold value around 30–35 kmday−1 has also been highlighted byFossette et al. (submitted for publication). Similarly, the frequencydistributions of the straightness index of the 21 motor tracks showeda threshold value of 0.8 separating two distinct patterns (Fig. 2). Asimilar threshold value has been previously highlighted by Gasparet al. (2006). Accordingly, we decided to classify as “high-successforaging”, animal positionswhere the velocitywas below30 kmday−1
and S<0.8. Positions with velocities above 35 km.day−1 and S>0.8were classified as “low success foraging”. To remain in a givenrestricted area, animals may either reduce their swimming velocity ormodify their trajectory straightness or do both concurrently. Conse-
Fig. 3. High-success foraging areas of 21 Argos-tracked leatherback turtles during their migraachieving high foraging success per pixel of 2°×2°, see methods for details).
quently, areaswhere swimming velocity and straightness index gave acontradictory classification were still considered as high foraging suc-cess areas. After having identified the “high-success foraging” po-sitions along the motor tracks, these positions were converted backfrom the current-corrected positions to the actual geopositions. Thesubsequent analyses, computing and mapping the percentage of highand low success foraging positions in 2°×2° boxes (Fig. 3), werecarried out on the apparent tracks.
As a general rule, areas of high foraging success were located athigh latitudes (between 35°N and 50°N: along the North Americancoasts, in Nova Scotia waters, in the Gulf of Saint-Laurent, in thewestern and northern part of the Gulf Stream, in the NortheastAtlantic, along the Azores front and northeast of the Azores Islands,north of the Canary Islands) and in the sub-Equatorial region(between 5°N and 15°N: in the region of the Mauritania upwelling,south of the Cape Verde islands, in the Guinea Dome area, in thewestward flow of the North Atlantic Equatorial Current, off the coastsof Venezuela, Guyana and Suriname) and were almost absent in theNorth Atlantic Gyre and the Sargasso Sea (Fig. 3).
The time spent achieving high foraging success by the 21individuals varied from 5.6% to 91.4% during the tracking period(Table 1). Since these percentages depended on both the duration ofthe different tracks and the specific period of the post-nestingmigration, we calculatedmonthly percentages of time spent achievinghigh foraging success throughout the migration for each individual.By using these individual monthly values, we then looked at theevolution of the percentage of time spent achieving high foragingsuccess throughout the migration for the three strategies (Fig. 4). Forthe “round-trip” strategy, the mean monthly percentage of timespent achieving high foraging success was 39.8±22.01% (mean±SD,n=24 values, 12 turtles considered) varying between 37.3±21.2%(mean±SD, n=12 values, 10 turtles considered) the first year afterthe nesting season to 44.1±24.4% (mean±SD, n=7 values, 4 turtlesconsidered) the following years (Fig. 4). Leatherbacks following thisstrategy showed relatively high foraging success at high latitudes (35–
tion in the North Atlantic Ocean (the scale indicates the mean percentage of time spent
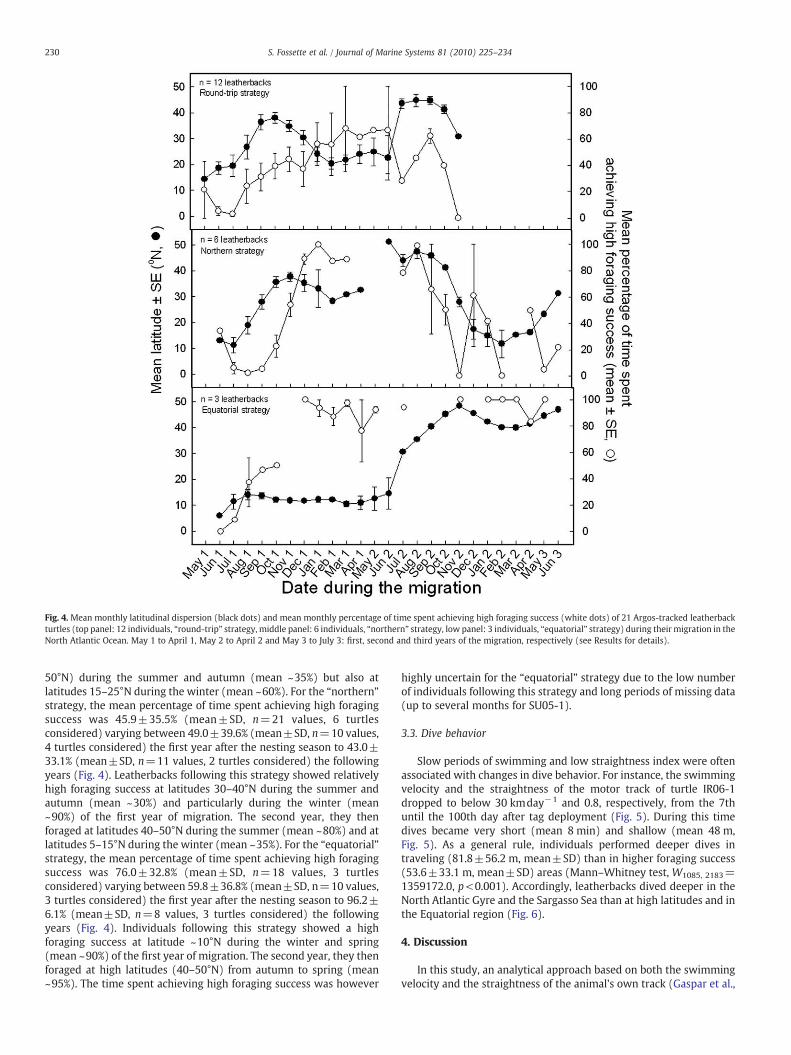
Fig. 4. Mean monthly latitudinal dispersion (black dots) and mean monthly percentage of time spent achieving high foraging success (white dots) of 21 Argos-tracked leatherbackturtles (top panel: 12 individuals, “round-trip” strategy, middle panel: 6 individuals, “northern” strategy, low panel: 3 individuals, “equatorial” strategy) during theirmigration in theNorth Atlantic Ocean. May 1 to April 1, May 2 to April 2 and May 3 to July 3: first, second and third years of the migration, respectively (see Results for details).
230 S. Fossette et al. / Journal of Marine Systems 81 (2010) 225–234
50°N) during the summer and autumn (mean ~35%) but also atlatitudes 15–25°N during the winter (mean ~60%). For the “northern”strategy, the mean percentage of time spent achieving high foragingsuccess was 45.9±35.5% (mean±SD, n=21 values, 6 turtlesconsidered) varying between 49.0±39.6% (mean±SD, n=10 values,4 turtles considered) the first year after the nesting season to 43.0±33.1% (mean±SD, n=11 values, 2 turtles considered) the followingyears (Fig. 4). Leatherbacks following this strategy showed relativelyhigh foraging success at latitudes 30–40°N during the summer andautumn (mean ~30%) and particularly during the winter (mean~90%) of the first year of migration. The second year, they thenforaged at latitudes 40–50°N during the summer (mean ~80%) and atlatitudes 5–15°N during the winter (mean ~35%). For the “equatorial”strategy, the mean percentage of time spent achieving high foragingsuccess was 76.0±32.8% (mean±SD, n=18 values, 3 turtlesconsidered) varying between 59.8±36.8% (mean±SD, n=10 values,3 turtles considered) the first year after the nesting season to 96.2±6.1% (mean±SD, n=8 values, 3 turtles considered) the followingyears (Fig. 4). Individuals following this strategy showed a highforaging success at latitude ~10°N during the winter and spring(mean ~90%) of the first year of migration. The second year, they thenforaged at high latitudes (40–50°N) from autumn to spring (mean~95%). The time spent achieving high foraging success was however
highly uncertain for the “equatorial” strategy due to the low numberof individuals following this strategy and long periods of missing data(up to several months for SU05-1).
3.3. Dive behavior
Slow periods of swimming and low straightness index were oftenassociated with changes in dive behavior. For instance, the swimmingvelocity and the straightness of the motor track of turtle IR06-1dropped to below 30 kmday−1 and 0.8, respectively, from the 7thuntil the 100th day after tag deployment (Fig. 5). During this timedives became very short (mean 8 min) and shallow (mean 48 m,Fig. 5). As a general rule, individuals performed deeper dives intraveling (81.8±56.2 m, mean±SD) than in higher foraging success(53.6±33.1 m, mean±SD) areas (Mann–Whitney test, W1085, 2183=1359172.0, p<0.001). Accordingly, leatherbacks dived deeper in theNorth Atlantic Gyre and the Sargasso Sea than at high latitudes and inthe Equatorial region (Fig. 6).
4. Discussion
In this study, an analytical approach based on both the swimmingvelocity and the straightness of the animal's own track (Gaspar et al.,
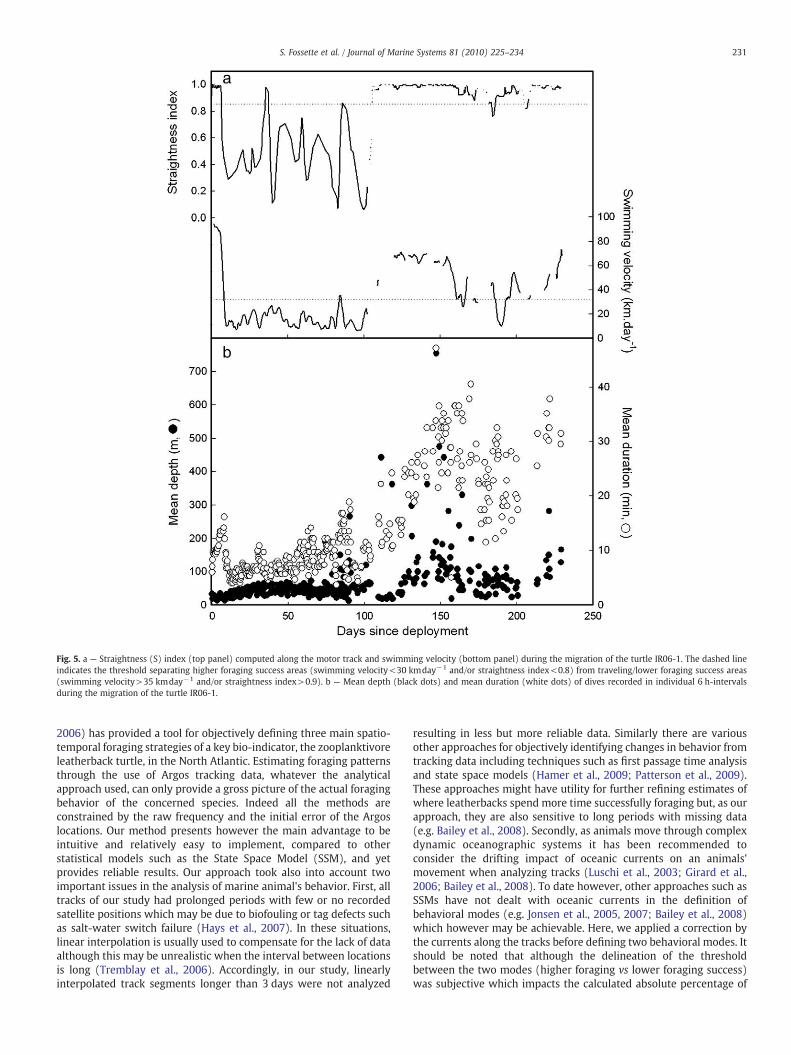
Fig. 5. a — Straightness (S) index (top panel) computed along the motor track and swimming velocity (bottom panel) during the migration of the turtle IR06-1. The dashed lineindicates the threshold separating higher foraging success areas (swimming velocity<30 kmday−1 and/or straightness index<0.8) from traveling/lower foraging success areas(swimming velocity>35 kmday−1 and/or straightness index>0.9). b — Mean depth (black dots) and mean duration (white dots) of dives recorded in individual 6 h-intervalsduring the migration of the turtle IR06-1.
231S. Fossette et al. / Journal of Marine Systems 81 (2010) 225–234
2006) has provided a tool for objectively defining three main spatio-temporal foraging strategies of a key bio-indicator, the zooplanktivoreleatherback turtle, in the North Atlantic. Estimating foraging patternsthrough the use of Argos tracking data, whatever the analyticalapproach used, can only provide a gross picture of the actual foragingbehavior of the concerned species. Indeed all the methods areconstrained by the raw frequency and the initial error of the Argoslocations. Our method presents however the main advantage to beintuitive and relatively easy to implement, compared to otherstatistical models such as the State Space Model (SSM), and yetprovides reliable results. Our approach took also into account twoimportant issues in the analysis of marine animal's behavior. First, alltracks of our study had prolonged periods with few or no recordedsatellite positions which may be due to biofouling or tag defects suchas salt-water switch failure (Hays et al., 2007). In these situations,linear interpolation is usually used to compensate for the lack of dataalthough this may be unrealistic when the interval between locationsis long (Tremblay et al., 2006). Accordingly, in our study, linearlyinterpolated track segments longer than 3 days were not analyzed
resulting in less but more reliable data. Similarly there are variousother approaches for objectively identifying changes in behavior fromtracking data including techniques such as first passage time analysisand state space models (Hamer et al., 2009; Patterson et al., 2009).These approaches might have utility for further refining estimates ofwhere leatherbacks spend more time successfully foraging but, as ourapproach, they are also sensitive to long periods with missing data(e.g. Bailey et al., 2008). Secondly, as animals move through complexdynamic oceanographic systems it has been recommended toconsider the drifting impact of oceanic currents on an animals'movement when analyzing tracks (Luschi et al., 2003; Girard et al.,2006; Bailey et al., 2008). To date however, other approaches such asSSMs have not dealt with oceanic currents in the definition ofbehavioral modes (e.g. Jonsen et al., 2005, 2007; Bailey et al., 2008)which however may be achievable. Here, we applied a correction bythe currents along the tracks before defining two behavioral modes. Itshould be noted that although the delineation of the thresholdbetween the two modes (higher foraging vs lower foraging success)was subjective which impacts the calculated absolute percentage of
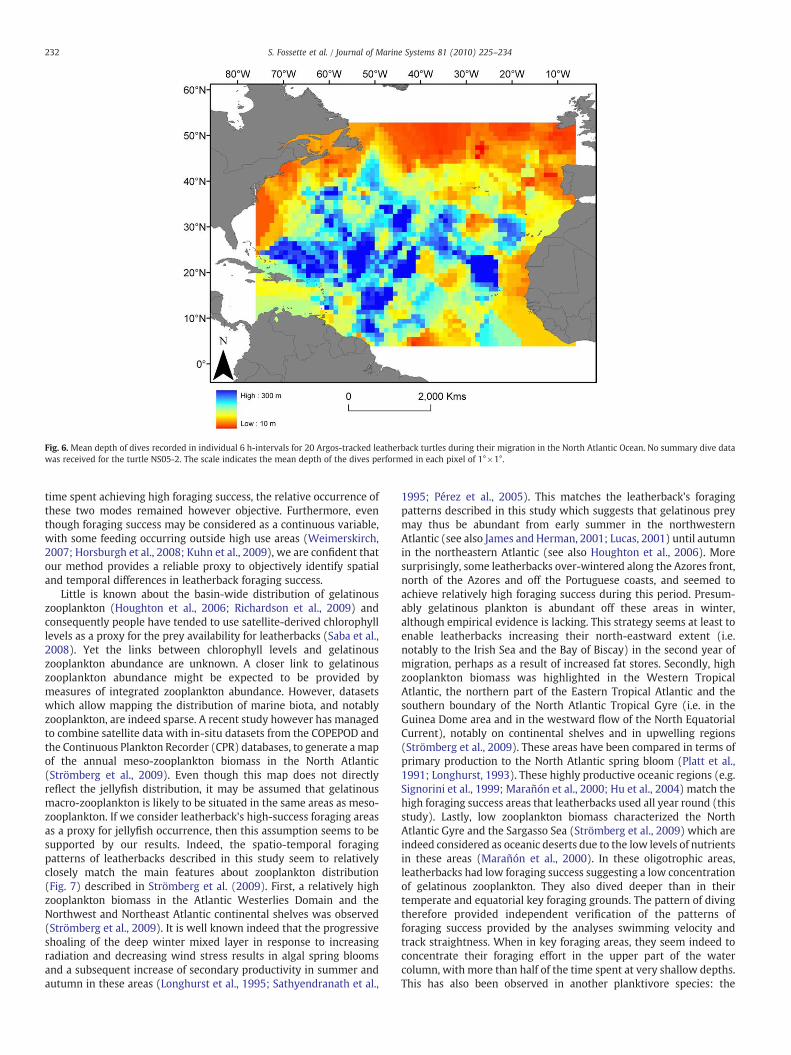
Fig. 6. Mean depth of dives recorded in individual 6 h-intervals for 20 Argos-tracked leatherback turtles during their migration in the North Atlantic Ocean. No summary dive datawas received for the turtle NS05-2. The scale indicates the mean depth of the dives performed in each pixel of 1°×1°.
232 S. Fossette et al. / Journal of Marine Systems 81 (2010) 225–234
time spent achieving high foraging success, the relative occurrence ofthese two modes remained however objective. Furthermore, eventhough foraging success may be considered as a continuous variable,with some feeding occurring outside high use areas (Weimerskirch,2007; Horsburgh et al., 2008; Kuhn et al., 2009), we are confident thatour method provides a reliable proxy to objectively identify spatialand temporal differences in leatherback foraging success.
Little is known about the basin-wide distribution of gelatinouszooplankton (Houghton et al., 2006; Richardson et al., 2009) andconsequently people have tended to use satellite-derived chlorophylllevels as a proxy for the prey availability for leatherbacks (Saba et al.,2008). Yet the links between chlorophyll levels and gelatinouszooplankton abundance are unknown. A closer link to gelatinouszooplankton abundance might be expected to be provided bymeasures of integrated zooplankton abundance. However, datasetswhich allow mapping the distribution of marine biota, and notablyzooplankton, are indeed sparse. A recent study however has managedto combine satellite data with in-situ datasets from the COPEPOD andthe Continuous Plankton Recorder (CPR) databases, to generate a mapof the annual meso-zooplankton biomass in the North Atlantic(Strömberg et al., 2009). Even though this map does not directlyreflect the jellyfish distribution, it may be assumed that gelatinousmacro-zooplankton is likely to be situated in the same areas as meso-zooplankton. If we consider leatherback's high-success foraging areasas a proxy for jellyfish occurrence, then this assumption seems to besupported by our results. Indeed, the spatio-temporal foragingpatterns of leatherbacks described in this study seem to relativelyclosely match the main features about zooplankton distribution(Fig. 7) described in Strömberg et al. (2009). First, a relatively highzooplankton biomass in the Atlantic Westerlies Domain and theNorthwest and Northeast Atlantic continental shelves was observed(Strömberg et al., 2009). It is well known indeed that the progressiveshoaling of the deep winter mixed layer in response to increasingradiation and decreasing wind stress results in algal spring bloomsand a subsequent increase of secondary productivity in summer andautumn in these areas (Longhurst et al., 1995; Sathyendranath et al.,
1995; Pérez et al., 2005). This matches the leatherback's foragingpatterns described in this study which suggests that gelatinous preymay thus be abundant from early summer in the northwesternAtlantic (see also James and Herman, 2001; Lucas, 2001) until autumnin the northeastern Atlantic (see also Houghton et al., 2006). Moresurprisingly, some leatherbacks over-wintered along the Azores front,north of the Azores and off the Portuguese coasts, and seemed toachieve relatively high foraging success during this period. Presum-ably gelatinous plankton is abundant off these areas in winter,although empirical evidence is lacking. This strategy seems at least toenable leatherbacks increasing their north-eastward extent (i.e.notably to the Irish Sea and the Bay of Biscay) in the second year ofmigration, perhaps as a result of increased fat stores. Secondly, highzooplankton biomass was highlighted in the Western TropicalAtlantic, the northern part of the Eastern Tropical Atlantic and thesouthern boundary of the North Atlantic Tropical Gyre (i.e. in theGuinea Dome area and in the westward flow of the North EquatorialCurrent), notably on continental shelves and in upwelling regions(Strömberg et al., 2009). These areas have been compared in terms ofprimary production to the North Atlantic spring bloom (Platt et al.,1991; Longhurst, 1993). These highly productive oceanic regions (e.g.Signorini et al., 1999; Marañón et al., 2000; Hu et al., 2004) match thehigh foraging success areas that leatherbacks used all year round (thisstudy). Lastly, low zooplankton biomass characterized the NorthAtlantic Gyre and the Sargasso Sea (Strömberg et al., 2009) which areindeed considered as oceanic deserts due to the low levels of nutrientsin these areas (Marañón et al., 2000). In these oligotrophic areas,leatherbacks had low foraging success suggesting a low concentrationof gelatinous zooplankton. They also dived deeper than in theirtemperate and equatorial key foraging grounds. The pattern of divingtherefore provided independent verification of the patterns offoraging success provided by the analyses swimming velocity andtrack straightness. When in key foraging areas, they seem indeed toconcentrate their foraging effort in the upper part of the watercolumn, with more than half of the time spent at very shallow depths.This has also been observed in another planktivore species: the
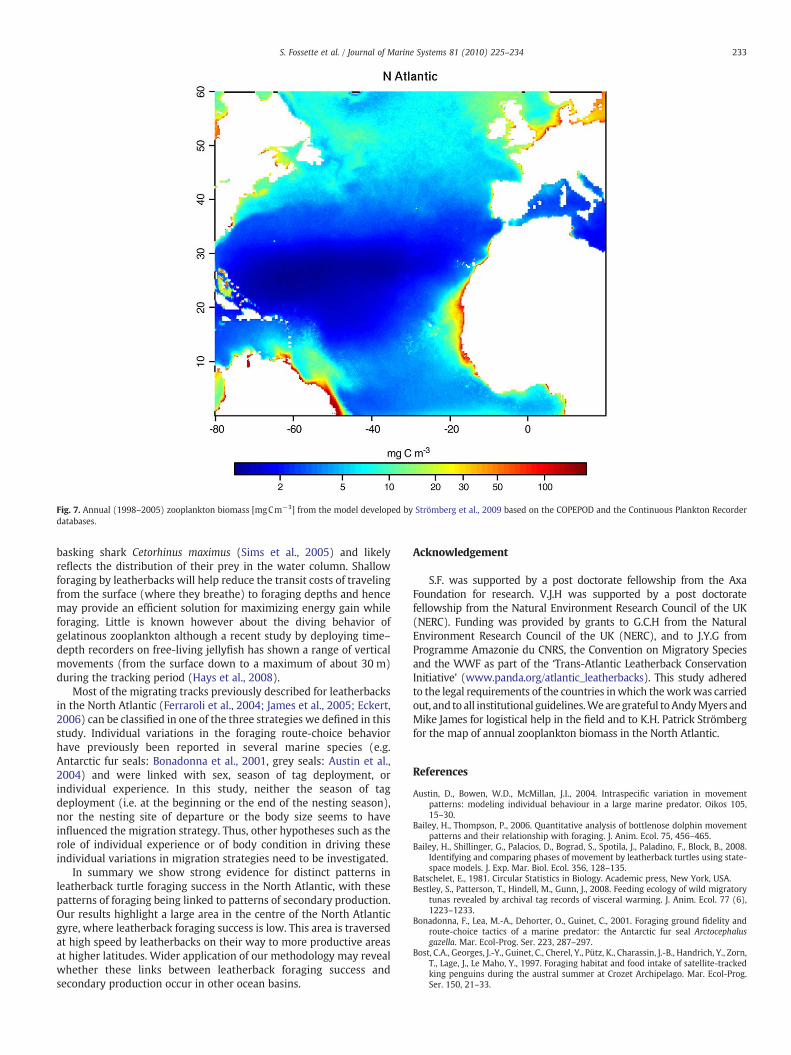
Fig. 7. Annual (1998–2005) zooplankton biomass [mgCm−3] from the model developed by Strömberg et al., 2009 based on the COPEPOD and the Continuous Plankton Recorderdatabases.
233S. Fossette et al. / Journal of Marine Systems 81 (2010) 225–234
basking shark Cetorhinus maximus (Sims et al., 2005) and likelyreflects the distribution of their prey in the water column. Shallowforaging by leatherbacks will help reduce the transit costs of travelingfrom the surface (where they breathe) to foraging depths and hencemay provide an efficient solution for maximizing energy gain whileforaging. Little is known however about the diving behavior ofgelatinous zooplankton although a recent study by deploying time–depth recorders on free-living jellyfish has shown a range of verticalmovements (from the surface down to a maximum of about 30 m)during the tracking period (Hays et al., 2008).
Most of the migrating tracks previously described for leatherbacksin the North Atlantic (Ferraroli et al., 2004; James et al., 2005; Eckert,2006) can be classified in one of the three strategies we defined in thisstudy. Individual variations in the foraging route-choice behaviorhave previously been reported in several marine species (e.g.Antarctic fur seals: Bonadonna et al., 2001, grey seals: Austin et al.,2004) and were linked with sex, season of tag deployment, orindividual experience. In this study, neither the season of tagdeployment (i.e. at the beginning or the end of the nesting season),nor the nesting site of departure or the body size seems to haveinfluenced the migration strategy. Thus, other hypotheses such as therole of individual experience or of body condition in driving theseindividual variations in migration strategies need to be investigated.
In summary we show strong evidence for distinct patterns inleatherback turtle foraging success in the North Atlantic, with thesepatterns of foraging being linked to patterns of secondary production.Our results highlight a large area in the centre of the North Atlanticgyre, where leatherback foraging success is low. This area is traversedat high speed by leatherbacks on their way to more productive areasat higher latitudes. Wider application of our methodology may revealwhether these links between leatherback foraging success andsecondary production occur in other ocean basins.
Acknowledgement
S.F. was supported by a post doctorate fellowship from the AxaFoundation for research. V.J.H was supported by a post doctoratefellowship from the Natural Environment Research Council of the UK(NERC). Funding was provided by grants to G.C.H from the NaturalEnvironment Research Council of the UK (NERC), and to J.Y.G fromProgramme Amazonie du CNRS, the Convention on Migratory Speciesand the WWF as part of the ‘Trans-Atlantic Leatherback ConservationInitiative’ (www.panda.org/atlantic_leatherbacks). This study adheredto the legal requirements of the countries inwhich theworkwas carriedout, and to all institutional guidelines.Weare grateful toAndyMyers andMike James for logistical help in the field and to K.H. Patrick Strömbergfor the map of annual zooplankton biomass in the North Atlantic.
References
Austin, D., Bowen, W.D., McMillan, J.I., 2004. Intraspecific variation in movementpatterns: modeling individual behaviour in a large marine predator. Oikos 105,15–30.
Bailey, H., Thompson, P., 2006. Quantitative analysis of bottlenose dolphin movementpatterns and their relationship with foraging. J. Anim. Ecol. 75, 456–465.
Bailey, H., Shillinger, G., Palacios, D., Bograd, S., Spotila, J., Paladino, F., Block, B., 2008.Identifying and comparing phases of movement by leatherback turtles using state-space models. J. Exp. Mar. Biol. Ecol. 356, 128–135.
Batschelet, E., 1981. Circular Statistics in Biology. Academic press, New York, USA.Bestley, S., Patterson, T., Hindell, M., Gunn, J., 2008. Feeding ecology of wild migratory
tunas revealed by archival tag records of visceral warming. J. Anim. Ecol. 77 (6),1223–1233.
Bonadonna, F., Lea, M.-A., Dehorter, O., Guinet, C., 2001. Foraging ground fidelity androute-choice tactics of a marine predator: the Antarctic fur seal Arctocephalusgazella. Mar. Ecol-Prog. Ser. 223, 287–297.
Bost, C.A., Georges, J.-Y., Guinet, C., Cherel, Y., Pütz, K., Charassin, J.-B., Handrich, Y., Zorn,T., Lage, J., Le Maho, Y., 1997. Foraging habitat and food intake of satellite-trackedking penguins during the austral summer at Crozet Archipelago. Mar. Ecol-Prog.Ser. 150, 21–33.
234 S. Fossette et al. / Journal of Marine Systems 81 (2010) 225–234
Boyd, I.L., Murray, A.W.A., 2001. Monitoring a marine ecosystem using responses ofupper trophic level predators. J. Anim. Ecol. 70, 747–760.
Cotté, C., Park, Y.-H., Guinet, C., Bost, C.-A., 2007. Movements of foraging king penguinsthrough marine mesoscale eddies. P. Roy. Soc. B-Biol. Sci. 274 (1624), 2385–2391.
Doyle, T.K., Houghton, J.D.R., Davenport, J., Hays, G.C., 2008. Leatherback turtles satellitetagged in European waters. Endang. Species. Res. 4, 23–31.
Eckert, S., 2006. High-use oceanic areas for Atlantic leatherback sea turtles(Dermochelys coriacea) as identified using satellite telemetered location and diveinformation. Mar. Biol. 149, 1257–1267.
Ferraroli, S., Georges, J.-Y., Gaspar, P., Le Maho, Y., 2004. Where leatherback turtles meetfisheries. Nature 429, 521–522.
Fossette, S., Gaspar, P., Handrich, Y., Le Maho, Y., Georges, J.-Y., 2008a. Dive and beakmovement patterns in leatherback turtles Dermochelys coriacea during internestingintervals in French Guiana. J. Anim. Ecol. 77, 236–246.
Fossette, S., Corbel, H., Gaspar, P., Le Maho, Y., Georges, J.-Y., 2008b. An alternativetechnique for the long-term satellite tracking of leatherback turtles. Endang.Species. Res. 4, 33–41.
Fossette, S., Girard, C., Lopez-Mendilaharsu, M., Miller, P., Domingo, A., Evans, D., Kelle,L., Plot, V., Prosdocimi, L., Verhage, B., Gaspar, P., Georges, J.-Y., submitted forpublication. Characterizing leatherback's high-use areas from satellite-derivedbehavioural and oceanographic data: a meta-analysis at the Atlantic Ocean scale.Continental Shelf Research.
Frank, K.T., Petrie, B., Shackell, N.L., 2007. The ups and downs of trophic control incontinental shelf ecosystems. Trends Ecol. Evol. 22 (5), 236–242.
Gaspar, P., Georges, J.-Y., Fossette, S., Lenoble, A., Ferraroli, S., Le Maho, Y., 2006. Marineanimal behaviour: neglecting ocean currents can lead us up the wrong track. P. Roy.Soc. B-Biol. Sci. 273, 2697–2702.
Girard, C., Sudre, J., Benhamou, S., Roos, D., Luschi, P., 2006. Homing in green turtlesChelonia mydas: oceanic currents act as a constraint rather than as an informationsource. Mar. Ecol-Prog. Ser. 322, 281–289.
Girard, C., Tucker, A.D., Calmettes, B., 2009. Post-nesting migrations of loggerhead seaturtles in the Gulf of Mexico: dispersal in highly dynamic conditions. Mar. Biol. 156,1827–1839.
Hamer, K.C., Humphreys, E.M., Magalhaes, M.C., Garthe, S., Hennicke, J., Peters, G.,Gremillet, D., Skov, H., Wanless, S., 2009. Fine-scale foraging behaviour of amedium-ranging marine predator. J. Anim. Ecol. 78 (4), 880–889.
Hays, G.C., Hobson, V.J., Metcalfe, J.D., Righton, D., Sims, D.W., 2006. Flexible foragingmovements of leatherback turtles across the North Atlantic Ocean. Ecology 87,2647–2656.
Hays, G.C., Bradshaw, C.J.A., James, M.C., Lovell, P., Sims, D.W., 2007. Why do Argossatellite tags deployed on marine animals stop transmitting? J. Exp. Mar. Biol. Ecol.349, 52–60.
Hays, G.C., Doyle, T.K., Houghton, J.D.R., Lilley, M.K.S., Metcalfe, J.D., Righton, D., 2008.Diving behaviour of jellyfish equipped with electronic tags. J. Plank. Res. 30,325–331.
Horsburgh, J., Morrice, M., Lea, M.A., Hindell, M., 2008. Determining feeding events andprey encounter rates in a southern elephant seal: a method using swim speed andstomach temperature. Mar. Mammal Sci. 24, 207–217.
Houghton, J.D.R., Doyle, T.K., Wilson, M.W., Davenport, J., Hays, G.C., 2006. Jellyfishaggregations and leatherback turtle foraging patterns in a temperate coastalenvironment. Ecology 87, 1967–1972.
Hu, C., Montgomery, E.T., Schmitt, R.W., Muller-Karger, F.E., 2004. The dispersal of theAmazon and Orinoco River water in the tropical Atlantic and Caribbean Sea:Observation from space and S-PALACE floats. Deep-Sea Res. PT. II. 51, 1151–1171.
Itoh, T., Tsuji, S., Nitta, A., 2003. Swimming depth, ambient water temperaturepreference, and feeding frequency of young Pacific bluefin tuna (Thunnus orientalis)determined with archival tags. Fish B-NOAA 101, 535–544.
James, M.C., Herman, T.B., 2001. Feeding of Dermochelys coriacea on Medusae in theNorthwest Atlantic. Chelo. Conserv. Biol. 4, 202–205.
James, M.C., Myers, R.A., Ottensmeyer, C.A., 2005. Behaviour of leatherback sea turtles,Dermochelys coriacea, during the migratory cycle. P. Roy. Soc. B-Biol. Sci. 272,1547–1555.
James, M.C., Davenport, J., Hays, G.C., 2006. Expanded thermal niche for a divingvertebrate: a leatherback turtle diving into near-freezing water. J. Exp. Mar. Biol.Ecol. 335 (2), 221–226.
Jonsen, I.D., Fleming, J.M., Myers, R.A., 2005. Robust state-space modeling of animalmovement data. Ecology 86, 2874–2880.
Jonsen, I.D., Myers, R.A., James, M.C., 2007. Identifying leatherback turtle foragingbehaviour from satellite telemetry using a switching state-space model. Mar. Ecol.-Prog. Ser. 337, 255–264.
Kuhn, C.E., Crocker, D.E., Tremblay, Y., Costa, D.P., 2009. Time to eat: measurements offeeding behaviour in a large marine predator, the northern elephant seal Miroungaangustirostris. J. Anim. Ecol. 78, 513–523.
Liebsch, N.S., Wilson, R.P., Bornemann, H., Adelung, D., Plötz, J., 2007. Mouthing offabout fish capture: jawmovements in pinnipeds reveal the real secrets of ingestion.Deep-Sea Res. PT. II. 54, 256–269.
Longhurst, A., 1993. Seasonal cooling and blooming in tropical oceans. Deep-Sea Res.PT. I. 40, 2145–2165.
Longhurst, A., Sathyendranath, S., Platt, T., Caverhill, C., 1995. An estimate of globalprimary production in the ocean from satellite radiometer data. J. Plank. Res. 17,1245–1271.
Lucas, C.H., 2001. Reproduction and life history strategies of the common jellyfish,Aurelia aurita, in relation to its ambient environment. Hydrobiol. 451, 229–246.
Luschi, P., Hays, G.C., Papi, F., 2003. A review of long-distance movements by marineturtles, and the possible role of ocean currents. Oikos 103, 293–302.
Lynam, C.P., Gibbons, M.J., Axelsen, B.E., Sparks, C.A.J., Coetzee, J., Heywood, B.G.,Brierley, A.S., 2006. Jellyfish overtake fish in a heavily fished ecosystem. Curr. Biol.16, 492–493.
Marañón, E., Holligan, P.M., Varela, M., Mouriño, B., Bale, A.J., 2000. Basin-scalevariability of phytoplankton biomass, production and growth in the Atlantic Ocean.Deep-Sea Res. PT. I. 47, 825–857.
McMahon, C.R., Autret, E., Houghton, J.D.R., Lovell, P., Myers, A.E., Hays, G.C., 2005.Animal borne sensors successfully capture the real-time thermal properties ofocean basins. Limnol. Oceanogr.-Meth. 3, 392–398.
Murray, M.D., Nicholls, D.G., Butcher, E., Moors, P.J., 2002. How wandering albatrossesuse weather systems to fly long distances. 1. An analytical method and itsapplication to flights in the Tasman Sea. Emu 102, 377–385.
Myers, A.E., Hays, G.C., 2006. Do leatherback turtles Dermochelys coriacea forage duringthe breeding season? A combination of novel and traditional data-logging devicesprovide next insights. Mar. Ecol-Prog. Ser. 322, 259–267.
Pascual, A., Faugère, Y., Larnicol, G., Le Traon, P.Y., 2006. Improved description of theocean mesoscale variability by combining four satellite altimeter missions.Geophys. Res. Let. 33, L02611. doi:10.1029/2005GL024633.
Patterson, T.A., Basson, M., Bravington, M.V., Gunn, J.S., 2009. Classifying movementbehaviour in relation to environmental conditions using hidden Markov models.J. Anim. Ecol. 78 (6), 1113–1123.
Pauly, D., Christensen, V., Dalsgaard, J., Froese, R., Torres Jr, F., 1998. Fishing downmarine food webs. Science 279, 860–863.
Pauly, D., Christensen, V., Guénette, S., Pitcher, T.J., Sumaila, U.R., Walters, C.J., Watson,R., Zeller, D., 2002. Towards sustainability in world fisheries. Nature 418, 689–697.
Pérez, V., Fernandez, E., Marañón, E., Serret, P., Garcia-Soto, C., 2005. Seasonal andinterannual variability of chlorophyll a and primary production in the EquatorialAtlantic: in situ and remote sensing observations. J. Plank. Res. 27 (2), 189–197.
Platt, T., Caverhill, C., Sathyendranath, S., 1991. Basin-scale estimates of oceanic primaryproduction by remote sensing: the North Atlantic. J. Geophys. Res. 96,15147–15159.
Ream, R.R., Sterling, J.T., Loughlin, T.R., 2005. Oceanographic features related tonorthern fur seal migratory movements. Deep-Sea Res. PT. II. 52, 823–843.
Richardson, A.J., Bakun, A., Hays, G.C., Gibbons, M.J., 2009. The jellyfish joyride: causes,consequences and management responses to a more gelatinous future. TREE 24,312–322. doi:10.1016/j.tree.2009.01.010.
Rio, M.-H., Hernandez, F., 2003. High-frequency response of wind-driven currentsmeasured by drifting buoys and altimetry over the world ocean. J. Geophys. Res.108, 3283. doi:10.1029/2002JC001655.
Robinson, P.W., Tremblay, Y., Crocker, D.E., Kappes, M.A., Kuhn, C.E., Shaffer, S.A.,Simmons, S.E., Costa, D.P., 2007. Comparison of indirect measures of feedingbehaviour based on ARGOS tracking data. Deep-Sea Res. PT. II. 54, 356–368.
Saba, V.S., Spotila, J.R., Chavez, F.P., Musik, J.A., 2008. Bottom-up and climatic forcing onthe worldwide population of leatherback turtles. Ecology 89 (5), 1414–1427.
Sathyendranath, S., Longhurst, A.R., Caverhill, C.M., Platt, T., 1995. Regionally andseasonally differentiated primary production in the North Atlantic. Deep-Sea Res.PT. II. 42 (10), 1773–1802.
Shillinger, G.L., Palacios, D.M., Bailey, H., Bograd, S.J., Swithenbank, A.M., Gaspar, P.,Wallace, B.P., Spotila, J.R., Paladino, F.V., Piedra, R., Eckert, S.A., Block, B.A., 2008.Persistent leatherback turtle migrations present opportunities for conservation.PloS Biol. 6 (7), 1408–1416.
Signorini, S.R., Murtugudde, R.G., McClain, C.R., Christian, J.R., Picaut, J., Busalacchi, A.J.,1999. Biological and physical signatures in the tropical and subtropical Atlantic.J. Geophys. Res. 104, 18367–18382.
Sims, D.W., Southall, E.J., Tarling, G.A., Metcalfe, J.D., 2005. Habitat-specific normal andreverse diel vertical migration in the plankton-feeding basking shark. J. Anim. Ecol.74, 755–761.
Strömberg, K.H.P., Smyth, T.J., Allen, J.I., Pitois, S., O'Brien, T.D., 2009. Estimation ofglobal zooplankton biomass from satellite ocean colour. J. Mar. Syst. 78, 18–27.
Travers, M., Watermeyer, K., Shannon, L.J., Shin, Y.-J., 2010. Changes in food webstructure under scenarios of overfishing in the southern Benguela: comparison ofthe Ecosim and OSMOSE modelling approaches. J. Mar. Syst. 79, 101–111.
Tremblay, Y., Shaffer, S.A., Fowler, S.L., Kuhn, C.E., McDonald, B.I., Weise, M.J., Bost, C.A.,Weimerskirch, H., Crocker, D.E., Goebel, M.E., Costa, D.P., 2006. Interpolation ofanimal tracking data in a fluid environment. J. Exp. Biol. 209, 128–140.
Weimerskirch, H., 2007. Are seabirds foraging for unpredictable resources? Deep-SeaRes. PT. II. 54, 211–223.
Weimerskirch, H., Gault, A., Cherel, Y., 2005. Prey distribution and patchiness: factors inforaging success and efficiency of wandering albatrosses. Ecology 86, 2611–2622.
White, N.A., Sjöberg, M., 2002. Accuracy of satellite positions from free-ranging greyseals using ARGOS. Pol. Biol. 25, 629–631.
Wilson, R.P., Steinfurth, A., Ropert-Coudret, Y., Kato, A., Kurita, M., 2002. Lip-reading inremote subjects: an attempt to quantify and separate ingestion, breathing andvocalisation in free-living animals using penguins as a model. Mar. Biol. 140, 17–27.
Related Documents