Spatially and Temporally Varying Associations between Temporary Outmigration and Natural Resource Availability in Resource-Dependent Rural Communities in South Africa: A Modeling Framework Stefan Leyk 1,* , Galen J. Maclaurin 1 , Lori M. Hunter 2,4 , Raphael Nawrotzki 2 , Wayne Twine 3 , Mark Collinson 4 , and Barend Erasmus 3 1 Department of Geography, University of Colorado Boulder, Boulder, CO, USA 2 Department of Sociology/Institute of Behavioral Science, CU Population Center, University of Colorado, Boulder, CO, USA 3 School of Animal, Plant and Environmental Sciences, University of the Witwatersrand, South Africa 4 MRC/Rural Public Health and Transitions Research Unit (Agincourt), School of Public Health, University of the Witwatersrand, South Africa Abstract Migration-environment models tend to be aspatial within chosen study regions, although associations between temporary outmigration and environmental explanatory variables likely vary across the study space. This research extends current approaches by developing migration models considering spatial non-stationarity and temporal variation – through examination of the migration-environment association at nested geographic scales (i.e. whole-population, village, and subvillage) within a specific study site. Demographic survey data from rural South Africa, combined with indicators of natural resource availability from satellite imagery, are employed in a nested modeling approach that brings out distinct patterns of spatial variation in model associations derived at finer geographic scales. Given recent heightened public and policy concern with the human migratory implications of climate change, we argue that consideration of spatial variability adds important nuance to scientific understanding of the migration-environment association. Keywords migration models; outmigration-environment associations; spatial non-stationarity; scale; Agincourt; demographic surveillance © 2012 Elsevier Ltd. All rights reserved. * corresponding author: Department of Geography, University of Colorado Boulder, UCB 260, Boulder, CO, USA; [email protected]. Publisher's Disclaimer: This is a PDF file of an unedited manuscript that has been accepted for publication. As a service to our customers we are providing this early version of the manuscript. The manuscript will undergo copyediting, typesetting, and review of the resulting proof before it is published in its final citable form. Please note that during the production process errors may be discovered which could affect the content, and all legal disclaimers that apply to the journal pertain. NIH Public Access Author Manuscript Appl Geogr. Author manuscript; available in PMC 2013 May 01. Published in final edited form as: Appl Geogr. 2012 May ; 34: 559–568. doi:10.1016/j.apgeog.2012.02.009. NIH-PA Author Manuscript NIH-PA Author Manuscript NIH-PA Author Manuscript

Welcome message from author
This document is posted to help you gain knowledge. Please leave a comment to let me know what you think about it! Share it to your friends and learn new things together.
Transcript
Spatially and Temporally Varying Associations betweenTemporary Outmigration and Natural Resource Availability inResource-Dependent Rural Communities in South Africa: AModeling Framework
Stefan Leyk1,*, Galen J. Maclaurin1, Lori M. Hunter2,4, Raphael Nawrotzki2, Wayne Twine3,Mark Collinson4, and Barend Erasmus3
1Department of Geography, University of Colorado Boulder, Boulder, CO, USA2Department of Sociology/Institute of Behavioral Science, CU Population Center, University ofColorado, Boulder, CO, USA3School of Animal, Plant and Environmental Sciences, University of the Witwatersrand, SouthAfrica4MRC/Rural Public Health and Transitions Research Unit (Agincourt), School of Public Health,University of the Witwatersrand, South Africa
AbstractMigration-environment models tend to be aspatial within chosen study regions, althoughassociations between temporary outmigration and environmental explanatory variables likely varyacross the study space. This research extends current approaches by developing migration modelsconsidering spatial non-stationarity and temporal variation – through examination of themigration-environment association at nested geographic scales (i.e. whole-population, village, andsubvillage) within a specific study site. Demographic survey data from rural South Africa,combined with indicators of natural resource availability from satellite imagery, are employed in anested modeling approach that brings out distinct patterns of spatial variation in modelassociations derived at finer geographic scales. Given recent heightened public and policy concernwith the human migratory implications of climate change, we argue that consideration of spatialvariability adds important nuance to scientific understanding of the migration-environmentassociation.
Keywordsmigration models; outmigration-environment associations; spatial non-stationarity; scale;Agincourt; demographic surveillance
© 2012 Elsevier Ltd. All rights reserved.*corresponding author: Department of Geography, University of Colorado Boulder, UCB 260, Boulder, CO, USA;[email protected].
Publisher's Disclaimer: This is a PDF file of an unedited manuscript that has been accepted for publication. As a service to ourcustomers we are providing this early version of the manuscript. The manuscript will undergo copyediting, typesetting, and review ofthe resulting proof before it is published in its final citable form. Please note that during the production process errors may bediscovered which could affect the content, and all legal disclaimers that apply to the journal pertain.
NIH Public AccessAuthor ManuscriptAppl Geogr. Author manuscript; available in PMC 2013 May 01.
Published in final edited form as:Appl Geogr. 2012 May ; 34: 559–568. doi:10.1016/j.apgeog.2012.02.009.
NIH
-PA Author Manuscript
NIH
-PA Author Manuscript
NIH
-PA Author Manuscript
1 IntroductionFueled by recognition of the world’s changing climate (IPCC, 2007 and 2012), the pastseveral years have seen burgeoning academic interest in the environmental dimensions ofhuman migration. The connection is logical, particularly in rural regions where daily livesare dependent on proximate natural resources, since environmental change portendsdramatic shifts in livelihood options. In the face of livelihood decline, migration can be seenas an adaptive strategy (McLeman and Hunter, 2010) and, therefore, methodologicaladvancements in the study of migration-environment associations are particularly timely.
This paper offers substantial methodological advancement in this context through systematicexamination of the robustness of migration-environment associations across different spatialscales (whole-population, village, and subvillage). Since migrationenvironment associationsare expected to vary under different socio-ecological conditions, models not accounting forsuch variations (i.e. ‘global’ statistical models) are limited in that they provide only anaveraged estimation of this association across a predefined space. How to methodologicallyassess the robustness of such associations across different scales, and to explore the effectsof inherent spatial variation of such associations with statistical rigor, remain openquestions. We explore these questions here.
1.1 Environmental Dependence in Rural RegionsRecent studies document widespread use of natural resources and natural resource-basedproducts in rural regions across the globe. Millions of households make direct use of wildresources for dietary and other household uses (Crookes, 2003), while some engage in directtrade of collected products such as fruit, mushrooms, worms (e.g. Wynberg et al., 2003).Resource-based craft trades are also common, for example producing and selling twigbrooms and reed mats, represent important livelihood strategies in parts of rural SouthAfrica (Botha et al., 2004; Gyan and Shackleton, 2005; Shackleton et al., 2008). Althoughcash returns to resource-based livelihoods are often quite low, many households devote timeand energy to these activities to enhance livelihood security and lessen the need to seekdemoralizing, insecure casual labor (Shackleton and Shackleton, 2011).
Proximate natural resources also often serve as “safety nets” for vulnerable rural householdsin less developed settings (Hunter et al., 2011; McSweeny, 2004). A recent study in ruralSouth Africa found that, in the wake of a shock such as job loss or mortality, a majority ofhouseholds increased use of locally-collected resources such as wild foods, fuelwood andmedicinal plants (Paumgarten and Shackleton, 2011). In the wake of environmental change,the availability and variability of such natural “safety nets” may shift and households mayadapt alternative strategies such as migration.
1.2 Migration as AdaptationHuman migration as an adaptive strategy is certainly nothing new, and historical analogs,such as investigation of migration from the Great Plains’ Dust Bowl, have informed recentunderstandings of migration potential (McLeman and Smit, 2006). Yet, what is new is thesheer number of households potentially impacted by contemporary environmental change,the magnitude of vulnerability due to widespread impoverishment, and the security concernsbeing articulated by policymakers and the public (Scheffran and Battaglini, 2011). Further,recent methodological advancements have provided the basis for improved scientificexamination of the migration-environment association.
Aspatial empirical models have taken two key forms. First, aggregated data (such asinformation at the state, county or village levels) are used as units of analysis in order toestimate associations between migration rates and relevant socio-economic and
Leyk et al. Page 2
Appl Geogr. Author manuscript; available in PMC 2013 May 01.
NIH
-PA Author Manuscript
NIH
-PA Author Manuscript
NIH
-PA Author Manuscript
environmental characteristics (e.g. Hunter, 1998 and 2000; Feng et al., 2010). Within suchmodels, environmental factors are included as general spatially undifferentiated measures.As a logical consequence, spatial dependence and clustering effects are rarely considered,and variation in the migration-environment association within the broader study region arenot explored. Second, individual- and household-level predictive models of migration havebeen extended to add environmental measures to the set of typical cross-sectional predictorsat the individual-level such as gender, age, and education, or at the household level, such assize and compositional indicators (Findley, 1994; Meze-Hausken, 2000). Within these‘global’ statistical approaches, factors such as estimated (regional) rainfall or generalundifferentiated measures of natural resource availability can represent local or evenregional environmental pressures at a particular point in time, or they can be used to analyzechange within a recent temporal window (e.g., Gray, 2009; Henry et al., 2004). As aconsequence, results tend to reveal that environmental factors act in concert with othermigration pressures and thus differential effects within the study region, net of incorporatedcontrols, cannot be estimated.
1.3 Needs in Modeling Migration-Environment AssociationsWithin the past several years, models of the migration-environment association in resource-dependent regions have become increasingly sophisticated through the use of, for example,longitudinal and/or multi-level models. These often integrate random effects (e.g., Henry etal., 2004; Barbieri and Carr, 2005; Yabiku et al., 2009; Gray, 2011) and have, therefore,advanced inclusion of general spatial effects. However, rarely has spatial variation in themigration-environment association itself nor the role of scale in the modeling approach beenthe content of substantive query. Exploring spatial variation raises two importantconnotations of scale. Geographic scale refers to the spatial extent within which thephenomenon or association is being studied (Lam and Quattrochi, 1992), and analysis scale(or resolution) refers to the size of the units at which observations were recorded oraggregated (Montello, 2001). In this study we vary the geographic scale used for modeling(i.e. the population size, or n, in the statistical model) while holding the analysis scale (i.e.the household unit) fixed. This approach allows to explore how associations (regressioncoefficients) change at different spatial extents of analysis (whole-population, village andsubvillage). We argue that much can be learned from how migration propensity varies withchanging geographic scale of the modeling approach.
Although methods to investigate spatial non-stationarity are routinely employed in the fieldof geography, migration-environment connections have not been studied in this context.These existing approaches usually rely on local estimations such as varying coefficientmodels (Cleveland et al., 1991; Hastie and Tibshirani, 1993) or geographically weightedregression (GWR) models (Brunsdon et al., 1996; Fotheringham et al., 2002) which havesignificant limitations that result in a lack in robustness for statistical inference (O’Sullivanand Unwin, 2010). For instance, models can suffer from local over-fitting as a result ofreduced degrees of freedom and the spatial weighting of observations in each localregression can lead to patterns of induced spatial heterogeneity (Cho et al., 2010).Furthermore, the instability of coefficient estimates as a function of bandwidth (Farber andPáez, 2007) and multicollinearity of the local coefficient estimates have been identified asserious hindrances with the GWR method (Wheeler, 2007; Griffith, 2008). For modelingPoisson distributed migration data, local estimation models have not been readily extendedinto a Generalized Linear Model (GLM) framework. In order to improve our ability tounderstand existing associations between migration and environmental factors on thehousehold level and thus improve program and policy recommendations, these limitationsmust be addressed. Particularly, the sensitivity of statistical models to changes in geographicscale and the variation of target associations across space (non-stationarity) have to be
Leyk et al. Page 3
Appl Geogr. Author manuscript; available in PMC 2013 May 01.
NIH
-PA Author Manuscript
NIH
-PA Author Manuscript
NIH
-PA Author Manuscript
evaluated. Identifying sub-regions experiencing heightened vulnerability to environmentalchange could greatly enhance targeted interventions.
This research taps into the potential of spatially explicit demographic surveillance data froma remote rural region of South Africa, combined with indicators of both spatial and temporalvariation in natural resource availability across the study site. We make use of theNormalized Difference Vegetation Index (NDVI) derived from MODIS remote sensingimagery as an indicator of natural resource availability and variability. An analyticalframework is developed that overcomes the above limitations by using traditional regressionapproaches on nested geographic scales generated by random simulation (spatialpermutation). This allows for:
i. comparison of models across (nested) geographic scales (i.e., whole-population,village and subvillage scales) in order to systematically examine the sensitivity ofthe migration-environment association to changing (sub)populations used formodeling;
ii. investigation of the spatial non-stationarity of migration-environment associationsestimated on a set of sub-populations (i.e. villages) at the same geographic scalewithin the study site. In contrast to common local estimators, each modelassociation is estimated from an entire subpopulation and has sufficient statisticalrigor without induced effects of over-fitting or multicollinearity;
iii. comparison of models for two different points in time (2002 and 2007) in order toestimate the effect of changing environmental conditions on the migration-environment models.
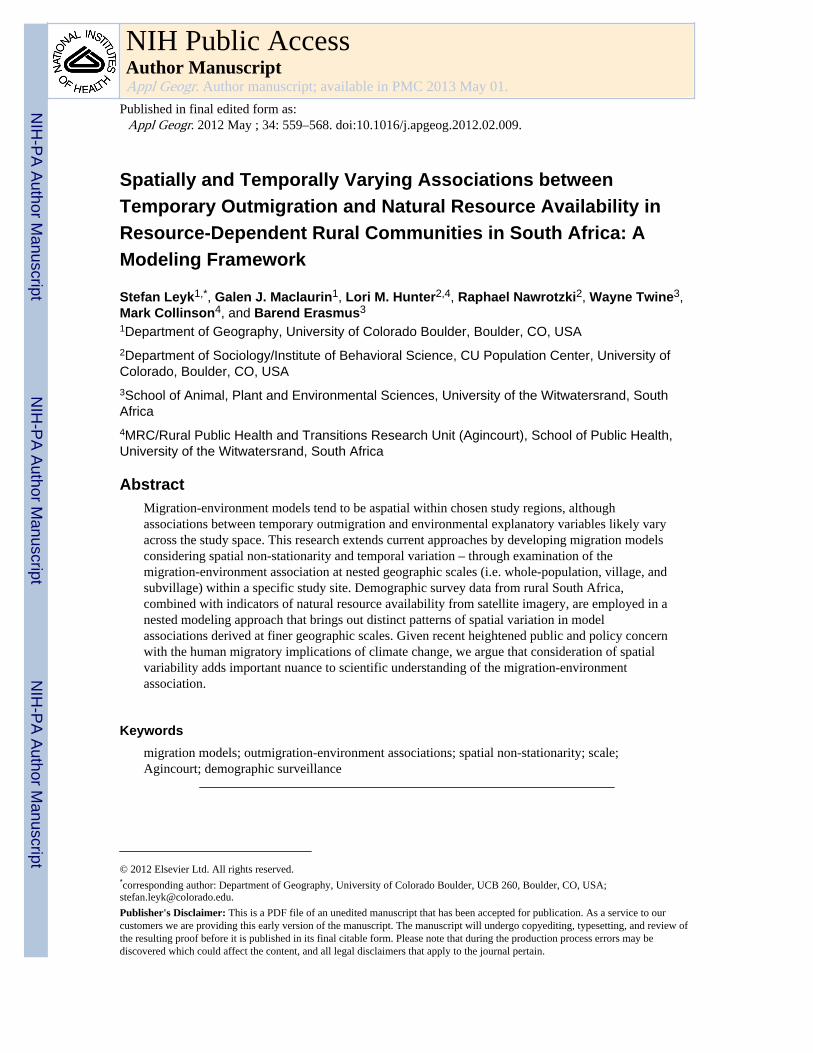
2 Data and data processingThe Agincourt Health and Demographic Surveillance System (AHDSS) site is located in arural region of northeastern South Africa (Fig. 1).1 Since 1992, the AHDSS has conductedan annual census, today encompassing 24 villages including approximately 84,000 residentsand 14,000 households. The area is characterized by high population densities, high levels ofpoverty and long standing lack of development and access to state services.
Our dataset consists of 9,374 households that were sampled in both 2002 and 2007 from the21 villages. The latitude and longitude of each household has been recorded in the dataset,and thus provides the unique opportunity to undertake spatial analyses at the householdlevel.
Our response variable is the number of temporary migrants, older than 15 years, at thehousehold level. A temporary migrant is defined as a person leaving a household with atemporary intention and spending at least six months of a year away from home, althoughstill linked to the rural household. As an independent variable, we employ an additive indexof household socio-economic status (SES) that combines measures of modern assets,livestock assets and information about power supply, access to water and sanitation, anddwelling structure. Household SES was identified as an important explanatory variable formigration in our preliminary analysis as well as in recent research (e.g., Mberu, 2006).
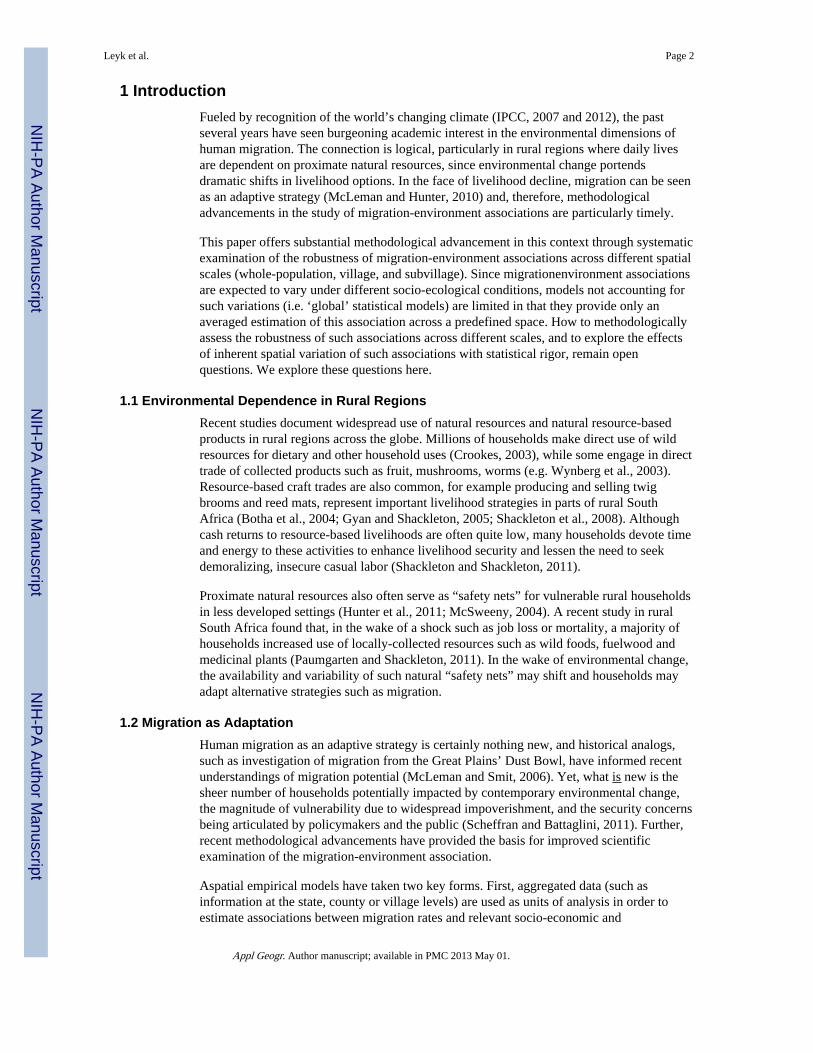
In order to incorporate an environmental independent variable, we use the NormalizedDifference Vegetation Index (NDVI) to calculate a greenness metric as a surrogate fornatural resource availability at the household level (Fig. 2). NDVI has been used to monitor
1The AHDSS is operated by the Rural Public Health and Health Transitions Research Unit of the South African Medical ResearchCouncil and University of the Witwatersrand.
Leyk et al. Page 4
Appl Geogr. Author manuscript; available in PMC 2013 May 01.
NIH
-PA Author Manuscript
NIH
-PA Author Manuscript
NIH
-PA Author Manuscript
plant growth (vigor), density of vegetation cover and biomass production (Foody et al.,2001; Wang et al., 2004) and is therefore an effective indicator of the natural resourceslocally used in livelihood strategies (e.g. firewood, seeds, wild foods, fencing materials,etc.).
Yearly NDVI values were calculated by taking the annual mean of 16-day composites fromMODIS satellite imagery (250 meter resolution). We took the mean of the year of analysisand the two years prior to create greenness grids for 2002 and 2007 (Fig. 2a). By includingthe two years prior to the outcome years, we take into account the availability of naturalresources leading up to 2002 and 2007.
The first time period is characterized by relatively high but slightly decreasing greennessvalues from 2000 to 2002 (NDVI between 0.55 – 0.49 on average); the latter period showssimilar mean greenness but higher variation across the years with an increasing trend from2005 to 2007 (NDVI between 0.45 – 0.53). Thus, on average, mean greenness values weresimilar in both time periods with some visible differences in the spatial distributions due todifferent resource availability “histories”. Investigation into the effect of refined temporaltrends in resource availability will be left to future research.
From the two greenness grids, areas within village boundaries were excluded since these arenot communal lands and are therefore not used for resource collection. We next created2000-meter buffer zones around each household (top panel inset, Fig. 2b) based on thedistance within which residents tend to travel to access natural resources (Giannecchini etal., 2007; Fisher et al., 2011). Finally, the sum of NDVI values within this buffer zone wascalculated by household, then divided by the number of households in the buffer. Theresulting metric serves as a surrogate for per household resource availability. To illustrate,the top panel inset of Fig. 2 shows the shaded within-village area on the bottom of the insetand the colored region towards the top of the buffer containing available and accessiblenatural resources. Fig. 2b illustrates household resource availability based on thiscalculation. Note that households toward village centers have lower resource availability.
In addition to SES and the NDVI greenness metric, we include control variables thatattained statistical significance in the analysis at the whole-population scale. The totalnumber of independent variables was restricted in this way in order to facilitate localizedanalyses while maintaining sufficient degrees of freedom. Control variables includehousehold size, proportion working age male, gender and marital status of household head,mean educational level within household, and proportion household members currentlyworking. Additional household-level resource variables were not available for the currentstudy; however, prior migration work has, indeed, demonstrated the predictive value of thehousehold-level characteristics in our model (e.g., Kok et al., 2003; White and Lindstrom,2006; Mberu, 2006; Lindstrom and Ramirez, 2010; Massey et al., 2010).
3 Methods3.1 Understanding the role of geographic scale: Nested regions of varying sizes
Three nested geographic scales are examined by subdividing the set of surveyed householdlocations. First, the migration-environment association is modeled for the whole population,making use of all 9,374 households. Next, the model is fit to each of the 21 villagesseparately, and finally, spatial variation within each village is examined through randomgeneration of spatially contiguous subvillage regions which is repeated in 1000 permutationsto test the stability of subvillage model associations. This repeated random regionalization isdone in order to test whether the subvillage models show more robust “local” target
Leyk et al. Page 5
Appl Geogr. Author manuscript; available in PMC 2013 May 01.
NIH
-PA Author Manuscript
NIH
-PA Author Manuscript
NIH
-PA Author Manuscript
associations and thus indicate a geographic scale at which spatial non-stationarity in suchassociations could be reduced or even removed.
As such, increasingly “localized” outmigration models are estimated, still based onunderlying (sub-)populations of sufficient size and variability to develop relatively robuststatistical models. The strength of this approach is that it fits a simple Poisson (GLM)regression model to the households of each spatially contiguous region within each villageand repeats the random simulation of subvillage regions. It thus allows the use of establisheddiagnostic techniques such as the likelihood ratio test and the variance inflation factor whileobjectively assessing spatial variation in the relationships of interest. The approach thusovercomes limitations of common local estimators (e.g., GWR) as described earlier and canbe applied to count data.
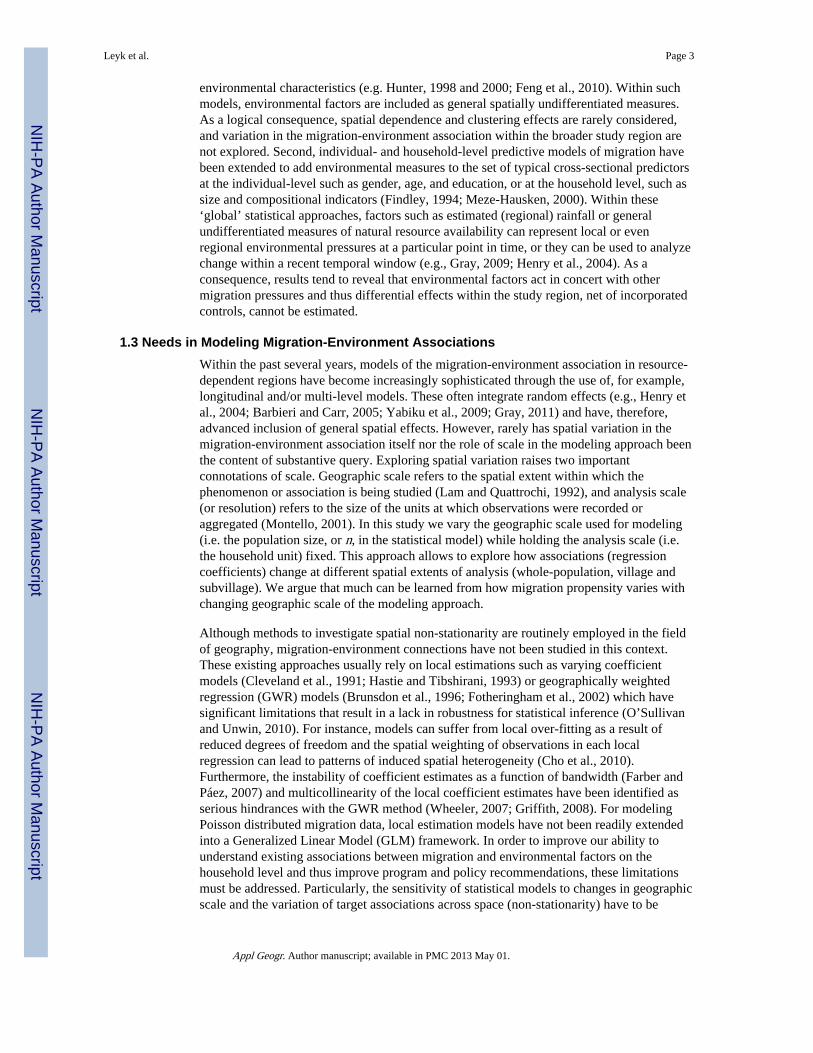
Nested subvillage regions were randomly generated such that they subdivide villages intosmaller exclusive (non overlapping), contiguous areas. Essentially, this technique constitutesa spatially constrained random permutation method. Our approach generates subvillageregions that contain a minimum of 47 and a maximum of 94 households in order to ensurethat the smallest village is divided into two regions while all other subvillage regions cannotbecome larger than the smallest village. Thus villages are divided into subregions with asimilar number of households (randomly varying between the two thresholds) whilemaintaining statistically acceptable sample sizes. Spatial contiguity in this regionalizationprocess was achieved by randomly selecting two seed points (households) within eachvillage. Regions were then generated by joining all remaining households with the closestseed point. This process was repeated until the size of all regions was between the twothresholds, creating the subvillage units (Fig. 3). We assessed the average model structureand performance over all 1000 regionalization runs in the subsequent modeling process. Thesame analysis was undertaken for 2002 and 2007 with the same simulated sets of subregionsin order to ensure identical degrees of freedom for all models. This allows for comparison ofsignificance levels and diagnostics between the two years.
3.2 Modeling, coefficient estimation and mappingAt each geographic scale (i.e., whole-population, village and sub-village), regressions(GLM) were fit for Poisson-distributed household-level temporary outmigration counts. Foreach model, coefficient estimates and their corresponding p-values were derived andresiduals were tested for spatial autocorrelation using Global Moran’s I (Moran, 1950) aswell as for spatial clustering using Local Moran’s I, a class of Local Indicators of SpatialAssociation (LISA) (Anselin, 1995).
At the subvillage scale, models were fit for random regions across the 1000 simulations and,for each subvillage model from each simulation, the coefficient estimates and p-values werestored. Thus, for each household, coefficient estimates were stored from model runs on 1000different configurations of random subvillage regions. Finally, we took the mean coefficientestimates for each household across all simulations and calculated the proportion ofsimulations where those coefficients were significant (p < 0.05). Thus, spatial distributionsof varying mean model coefficients, and proportion of significant coefficients at thehousehold level could be created based on a series of statistical sub-village models asdescribed below.
As for the mapping process, at the village scale we created maps of coefficient values andtheir statistical significance using village boundaries (polygon feature data). At thesubvillage scale, we mapped mean coefficient estimates and the proportion of significanttests over 1000 model runs for each household location (point feature data). This mappingallowed us to visualize (1) changes in model structure across different geographic scales
Leyk et al. Page 6
Appl Geogr. Author manuscript; available in PMC 2013 May 01.
NIH
-PA Author Manuscript
NIH
-PA Author Manuscript
NIH
-PA Author Manuscript
within the whole study area, (2) at each geographic scale, the spatial variation or spatialheterogeneity in the two target associations of interest (i.e., outmigration-SES andoutmigration-NDVI), and (3) given the two time points (2002 and 2007), a temporalcomparison of model coefficients and spatial distributions. In order to better understand thespatial structure of model performance, and thus to identify regions of potential clusters ofunder and over prediction, maps of LISA clusters (Anselin, 1995) on the model residualswere also created.
3.3 Diagnostics for models at different geographic scalesFinally, the goodness-of-fit is assessed at each geographic scale using the AkaikeInformation Criterion (AIC). Traditionally, AIC is used to compare models fit to the samepopulation with different sets of predictor variables. Here, we compare the goodness-of-fitof two models with the same set of predictor variables but originally fit to differentgeographic scales (e.g., whole-population and village). AIC is generally calculated as:
(1)
where L is the maximum likelihood estimate and k is the number of model parameters(Akaike, 1974). For n independent observations of a Poisson model, the log-likelihoodfunction for the model with parameters β is:
(2)
where μi is the fitted response value from the Poisson regression model for the observationyi (Rodríguez, 2007). As mentioned, AIC only allows a valid comparison between modelswhen models are fit to the same population. Therefore, in order to compare the goodness-of-fit of models estimated on different geographic scales, we took the fitted response values μfor the subset of observations from the coarser scale regression model which correspondedto the same observations used for fitting the finer scale regression model. For example, tocompare the model for village number 1 (with 971 households) to the whole-populationscale model, we took the 971 corresponding fitted values of μ from the whole-populationmodel and calculated the maximum likelihood estimate L. The AIC is then calculated usingthis value of L and compared to the AIC from the village model, computed with thetraditional approach (Akaike, 1974). Decomposing the likelihood function of the coarserscale model in this way allows cross-scale comparisons of goodness-of-fit. This comparisonwas done between each village and the whole-population scale, and between each randomsubvillage region and the village scale for each of the 1000 simulations.
Yet, a decrease in AIC of the more ‘localized’ model does not show whether theimprovement (i.e., reduction in AIC) is statistically significant since the value has nointrinsic meaning (Sayyareh et al., 2010). For this reason, we employed the Vuonglikelihood ratio test (Vuong, 1989) to reliably identify where the finer scale of analysisperforms more robust. Here, the comparison is between models considered overlapping i.e.,(i) the two models have common distributional properties (Poisson) and (ii) neither modelhas a subset of parameters from the other (i.e. both models have the same independentvariables) (Vuong, 1989, p. 320). In an empirical study, Genius and Strazzera (2002)showed that the Vuong test is more robust for comparing overlapping models than othertests (such as AIC or Cox test) for small sample sizes (recall that the subvillage regions havebetween 47 to 94 households). The Vuong test statistic for models f and g is:
Leyk et al. Page 7
Appl Geogr. Author manuscript; available in PMC 2013 May 01.
NIH
-PA Author Manuscript
NIH
-PA Author Manuscript
NIH
-PA Author Manuscript
(3)
where LRn(θn,γn) is the log-likelihood ratio of the models f and g, and ωn is the square rootof the variance (i.e. standard deviation) of their point-wise log-likelihood ratios. That is:
(4)
A two-sided test is conducted where a critical value c from a standard normal distribution isselected based on the desired significance level, 0.05 in this case. If the test statistic v isgreater than c, then model f performs better than model g. If v is less than -c, then g ispreferred over f. In the case that |v| ≤ c, then the two models cannot be discriminated(Vuong, 1989, p. 318).
4 Results and Discussion4.1 Whole-population scale models
Whole-population scale model diagnostics indicate that both explanatory variables ofinterest, SES and NDVI, are highly significant in 2002 and 2007 (p < 0.01) (Table 1). Atincreasingly localized geographic scales, however, the estimates show increasing spatialvariation and increasing variance across regions (as discussed below). This suggests that thewhole-population scale obscures considerable spatial variation in these associations acrossthe study area.
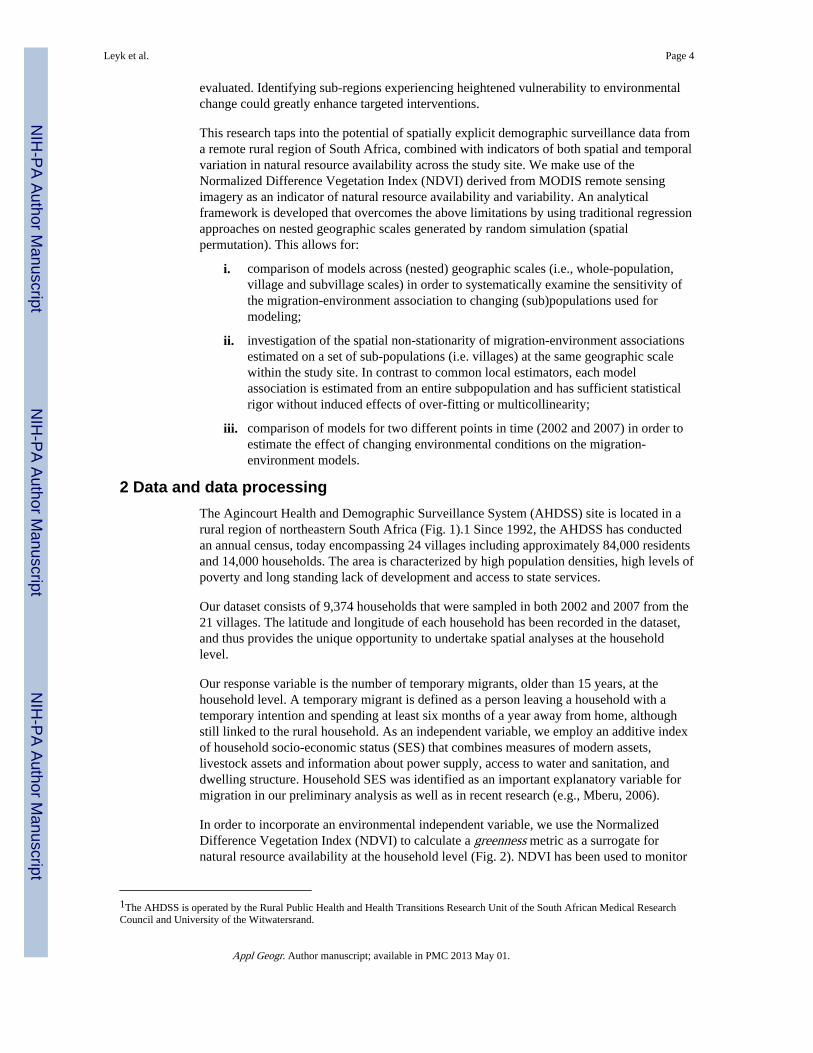
The whole-population model’s residuals reveal significant spatial autocorrelation based onglobal Moran’s I (p < 0.05), suggesting a non-random error structure due to spatialdependence. In both years, significant local clusters based on LISA measures of low andhigh residual values are well separated from each other and do not vary considerablybetween 2002 and 2007 (Fig. 4). Substantively, this translates to spatially clustered overandunder-predictions, respectively, and suggests the need for approaches accounting for spatialnon-stationarity to better understand the target associations.
4.2 Village scale modelsAt the village scale, considerable variation emerged in coefficient estimates across villages,as well as interesting patterns of change between the two years (Fig. 5). The overalloutmigration-SES association on the village scale was stronger in 2007 compared to 2002and showed higher spatial variation in 2002 (i.e., more stable in the later time period) (Fig.5a). This indicates that households with higher SES were more likely to send migrants in2007 relative to 2002.
As for the NDVI greenness metric, there are high degrees of spatial variation that result inpositive and negative relationships in both years with a slight trend of decreasing coefficientvalues (2002 to 2007). As such, no generalized statement as to the migration-environmentassociation accurately characterizes the Agincourt study site as a whole.
4.3 Sub-village scale modelsThe subvillage scale reveals more refined spatial patterns of associations (Fig. 6). Withinvillage boundaries, considerable spatial variation exists in both SES and NDVI coefficientestimates, indicating considerable local variation in their association with outmigration notreflected by village scale models.
Leyk et al. Page 8
Appl Geogr. Author manuscript; available in PMC 2013 May 01.
NIH
-PA Author Manuscript
NIH
-PA Author Manuscript
NIH
-PA Author Manuscript
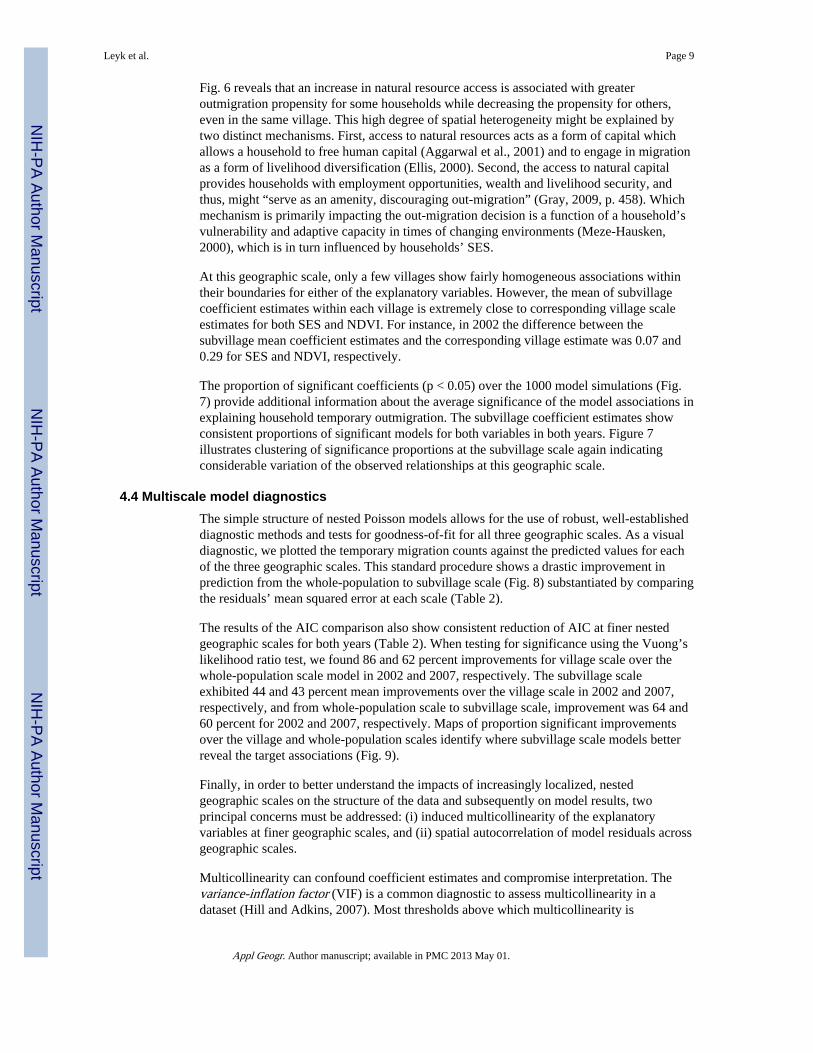
Fig. 6 reveals that an increase in natural resource access is associated with greateroutmigration propensity for some households while decreasing the propensity for others,even in the same village. This high degree of spatial heterogeneity might be explained bytwo distinct mechanisms. First, access to natural resources acts as a form of capital whichallows a household to free human capital (Aggarwal et al., 2001) and to engage in migrationas a form of livelihood diversification (Ellis, 2000). Second, the access to natural capitalprovides households with employment opportunities, wealth and livelihood security, andthus, might “serve as an amenity, discouraging out-migration” (Gray, 2009, p. 458). Whichmechanism is primarily impacting the out-migration decision is a function of a household’svulnerability and adaptive capacity in times of changing environments (Meze-Hausken,2000), which is in turn influenced by households’ SES.
At this geographic scale, only a few villages show fairly homogeneous associations withintheir boundaries for either of the explanatory variables. However, the mean of subvillagecoefficient estimates within each village is extremely close to corresponding village scaleestimates for both SES and NDVI. For instance, in 2002 the difference between thesubvillage mean coefficient estimates and the corresponding village estimate was 0.07 and0.29 for SES and NDVI, respectively.
The proportion of significant coefficients (p < 0.05) over the 1000 model simulations (Fig.7) provide additional information about the average significance of the model associations inexplaining household temporary outmigration. The subvillage coefficient estimates showconsistent proportions of significant models for both variables in both years. Figure 7illustrates clustering of significance proportions at the subvillage scale again indicatingconsiderable variation of the observed relationships at this geographic scale.
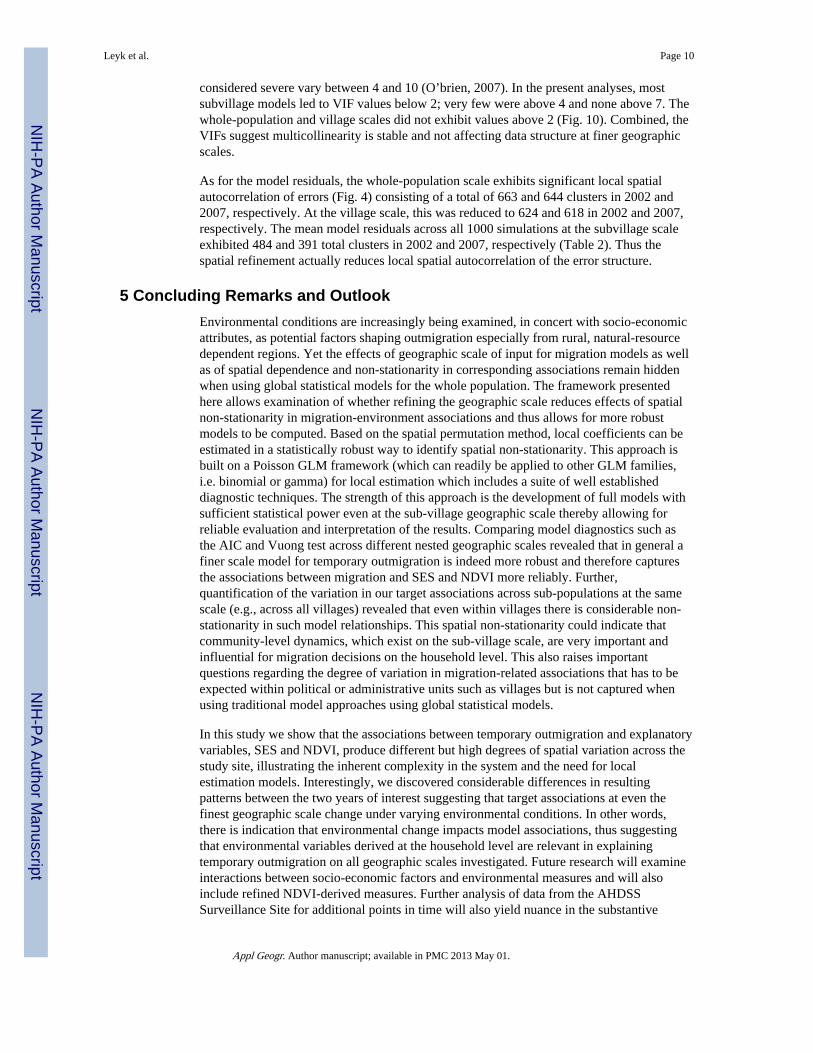
4.4 Multiscale model diagnosticsThe simple structure of nested Poisson models allows for the use of robust, well-establisheddiagnostic methods and tests for goodness-of-fit for all three geographic scales. As a visualdiagnostic, we plotted the temporary migration counts against the predicted values for eachof the three geographic scales. This standard procedure shows a drastic improvement inprediction from the whole-population to subvillage scale (Fig. 8) substantiated by comparingthe residuals’ mean squared error at each scale (Table 2).
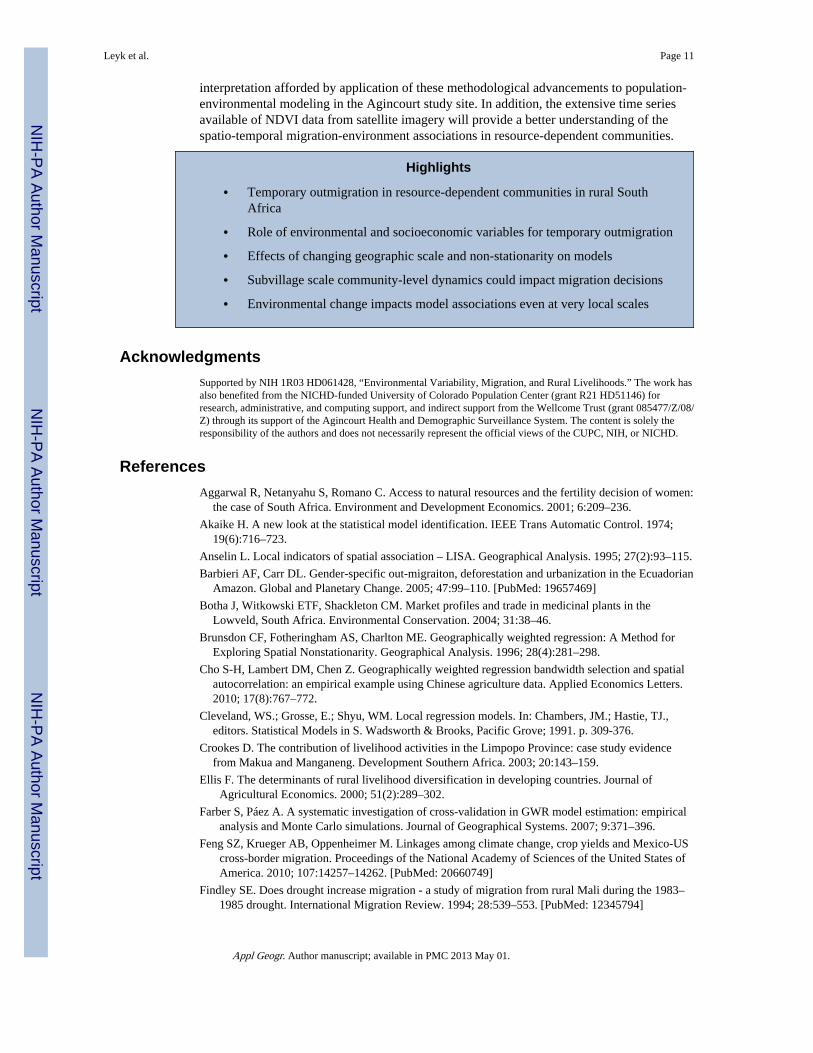
The results of the AIC comparison also show consistent reduction of AIC at finer nestedgeographic scales for both years (Table 2). When testing for significance using the Vuong’slikelihood ratio test, we found 86 and 62 percent improvements for village scale over thewhole-population scale model in 2002 and 2007, respectively. The subvillage scaleexhibited 44 and 43 percent mean improvements over the village scale in 2002 and 2007,respectively, and from whole-population scale to subvillage scale, improvement was 64 and60 percent for 2002 and 2007, respectively. Maps of proportion significant improvementsover the village and whole-population scales identify where subvillage scale models betterreveal the target associations (Fig. 9).
Finally, in order to better understand the impacts of increasingly localized, nestedgeographic scales on the structure of the data and subsequently on model results, twoprincipal concerns must be addressed: (i) induced multicollinearity of the explanatoryvariables at finer geographic scales, and (ii) spatial autocorrelation of model residuals acrossgeographic scales.
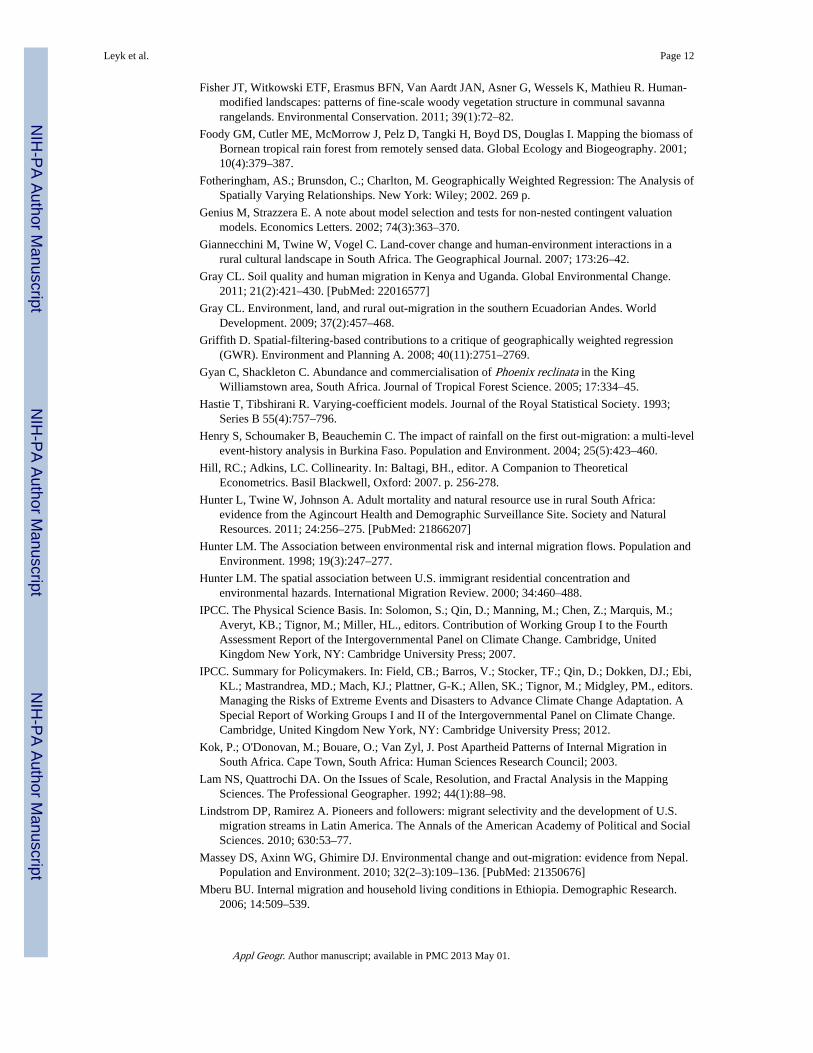
Multicollinearity can confound coefficient estimates and compromise interpretation. Thevariance-inflation factor (VIF) is a common diagnostic to assess multicollinearity in adataset (Hill and Adkins, 2007). Most thresholds above which multicollinearity is
Leyk et al. Page 9
Appl Geogr. Author manuscript; available in PMC 2013 May 01.
NIH
-PA Author Manuscript
NIH
-PA Author Manuscript
NIH
-PA Author Manuscript
considered severe vary between 4 and 10 (O’brien, 2007). In the present analyses, mostsubvillage models led to VIF values below 2; very few were above 4 and none above 7. Thewhole-population and village scales did not exhibit values above 2 (Fig. 10). Combined, theVIFs suggest multicollinearity is stable and not affecting data structure at finer geographicscales.
As for the model residuals, the whole-population scale exhibits significant local spatialautocorrelation of errors (Fig. 4) consisting of a total of 663 and 644 clusters in 2002 and2007, respectively. At the village scale, this was reduced to 624 and 618 in 2002 and 2007,respectively. The mean model residuals across all 1000 simulations at the subvillage scaleexhibited 484 and 391 total clusters in 2002 and 2007, respectively (Table 2). Thus thespatial refinement actually reduces local spatial autocorrelation of the error structure.
5 Concluding Remarks and OutlookEnvironmental conditions are increasingly being examined, in concert with socio-economicattributes, as potential factors shaping outmigration especially from rural, natural-resourcedependent regions. Yet the effects of geographic scale of input for migration models as wellas of spatial dependence and non-stationarity in corresponding associations remain hiddenwhen using global statistical models for the whole population. The framework presentedhere allows examination of whether refining the geographic scale reduces effects of spatialnon-stationarity in migration-environment associations and thus allows for more robustmodels to be computed. Based on the spatial permutation method, local coefficients can beestimated in a statistically robust way to identify spatial non-stationarity. This approach isbuilt on a Poisson GLM framework (which can readily be applied to other GLM families,i.e. binomial or gamma) for local estimation which includes a suite of well establisheddiagnostic techniques. The strength of this approach is the development of full models withsufficient statistical power even at the sub-village geographic scale thereby allowing forreliable evaluation and interpretation of the results. Comparing model diagnostics such asthe AIC and Vuong test across different nested geographic scales revealed that in general afiner scale model for temporary outmigration is indeed more robust and therefore capturesthe associations between migration and SES and NDVI more reliably. Further,quantification of the variation in our target associations across sub-populations at the samescale (e.g., across all villages) revealed that even within villages there is considerable non-stationarity in such model relationships. This spatial non-stationarity could indicate thatcommunity-level dynamics, which exist on the sub-village scale, are very important andinfluential for migration decisions on the household level. This also raises importantquestions regarding the degree of variation in migration-related associations that has to beexpected within political or administrative units such as villages but is not captured whenusing traditional model approaches using global statistical models.
In this study we show that the associations between temporary outmigration and explanatoryvariables, SES and NDVI, produce different but high degrees of spatial variation across thestudy site, illustrating the inherent complexity in the system and the need for localestimation models. Interestingly, we discovered considerable differences in resultingpatterns between the two years of interest suggesting that target associations at even thefinest geographic scale change under varying environmental conditions. In other words,there is indication that environmental change impacts model associations, thus suggestingthat environmental variables derived at the household level are relevant in explainingtemporary outmigration on all geographic scales investigated. Future research will examineinteractions between socio-economic factors and environmental measures and will alsoinclude refined NDVI-derived measures. Further analysis of data from the AHDSSSurveillance Site for additional points in time will also yield nuance in the substantive
Leyk et al. Page 10
Appl Geogr. Author manuscript; available in PMC 2013 May 01.
NIH
-PA Author Manuscript
NIH
-PA Author Manuscript
NIH
-PA Author Manuscript
interpretation afforded by application of these methodological advancements to population-environmental modeling in the Agincourt study site. In addition, the extensive time seriesavailable of NDVI data from satellite imagery will provide a better understanding of thespatio-temporal migration-environment associations in resource-dependent communities.
Highlights
• Temporary outmigration in resource-dependent communities in rural SouthAfrica
• Role of environmental and socioeconomic variables for temporary outmigration
• Effects of changing geographic scale and non-stationarity on models
• Subvillage scale community-level dynamics could impact migration decisions
• Environmental change impacts model associations even at very local scales
AcknowledgmentsSupported by NIH 1R03 HD061428, “Environmental Variability, Migration, and Rural Livelihoods.” The work hasalso benefited from the NICHD-funded University of Colorado Population Center (grant R21 HD51146) forresearch, administrative, and computing support, and indirect support from the Wellcome Trust (grant 085477/Z/08/Z) through its support of the Agincourt Health and Demographic Surveillance System. The content is solely theresponsibility of the authors and does not necessarily represent the official views of the CUPC, NIH, or NICHD.
ReferencesAggarwal R, Netanyahu S, Romano C. Access to natural resources and the fertility decision of women:
the case of South Africa. Environment and Development Economics. 2001; 6:209–236.
Akaike H. A new look at the statistical model identification. IEEE Trans Automatic Control. 1974;19(6):716–723.
Anselin L. Local indicators of spatial association – LISA. Geographical Analysis. 1995; 27(2):93–115.
Barbieri AF, Carr DL. Gender-specific out-migraiton, deforestation and urbanization in the EcuadorianAmazon. Global and Planetary Change. 2005; 47:99–110. [PubMed: 19657469]
Botha J, Witkowski ETF, Shackleton CM. Market profiles and trade in medicinal plants in theLowveld, South Africa. Environmental Conservation. 2004; 31:38–46.
Brunsdon CF, Fotheringham AS, Charlton ME. Geographically weighted regression: A Method forExploring Spatial Nonstationarity. Geographical Analysis. 1996; 28(4):281–298.
Cho S-H, Lambert DM, Chen Z. Geographically weighted regression bandwidth selection and spatialautocorrelation: an empirical example using Chinese agriculture data. Applied Economics Letters.2010; 17(8):767–772.
Cleveland, WS.; Grosse, E.; Shyu, WM. Local regression models. In: Chambers, JM.; Hastie, TJ.,editors. Statistical Models in S. Wadsworth & Brooks, Pacific Grove; 1991. p. 309-376.
Crookes D. The contribution of livelihood activities in the Limpopo Province: case study evidencefrom Makua and Manganeng. Development Southern Africa. 2003; 20:143–159.
Ellis F. The determinants of rural livelihood diversification in developing countries. Journal ofAgricultural Economics. 2000; 51(2):289–302.
Farber S, Páez A. A systematic investigation of cross-validation in GWR model estimation: empiricalanalysis and Monte Carlo simulations. Journal of Geographical Systems. 2007; 9:371–396.
Feng SZ, Krueger AB, Oppenheimer M. Linkages among climate change, crop yields and Mexico-UScross-border migration. Proceedings of the National Academy of Sciences of the United States ofAmerica. 2010; 107:14257–14262. [PubMed: 20660749]
Findley SE. Does drought increase migration - a study of migration from rural Mali during the 1983–1985 drought. International Migration Review. 1994; 28:539–553. [PubMed: 12345794]
Leyk et al. Page 11
Appl Geogr. Author manuscript; available in PMC 2013 May 01.
NIH
-PA Author Manuscript
NIH
-PA Author Manuscript
NIH
-PA Author Manuscript
Fisher JT, Witkowski ETF, Erasmus BFN, Van Aardt JAN, Asner G, Wessels K, Mathieu R. Human-modified landscapes: patterns of fine-scale woody vegetation structure in communal savannarangelands. Environmental Conservation. 2011; 39(1):72–82.
Foody GM, Cutler ME, McMorrow J, Pelz D, Tangki H, Boyd DS, Douglas I. Mapping the biomass ofBornean tropical rain forest from remotely sensed data. Global Ecology and Biogeography. 2001;10(4):379–387.
Fotheringham, AS.; Brunsdon, C.; Charlton, M. Geographically Weighted Regression: The Analysis ofSpatially Varying Relationships. New York: Wiley; 2002. 269 p.
Genius M, Strazzera E. A note about model selection and tests for non-nested contingent valuationmodels. Economics Letters. 2002; 74(3):363–370.
Giannecchini M, Twine W, Vogel C. Land-cover change and human-environment interactions in arural cultural landscape in South Africa. The Geographical Journal. 2007; 173:26–42.
Gray CL. Soil quality and human migration in Kenya and Uganda. Global Environmental Change.2011; 21(2):421–430. [PubMed: 22016577]
Gray CL. Environment, land, and rural out-migration in the southern Ecuadorian Andes. WorldDevelopment. 2009; 37(2):457–468.
Griffith D. Spatial-filtering-based contributions to a critique of geographically weighted regression(GWR). Environment and Planning A. 2008; 40(11):2751–2769.
Gyan C, Shackleton C. Abundance and commercialisation of Phoenix reclinata in the KingWilliamstown area, South Africa. Journal of Tropical Forest Science. 2005; 17:334–45.
Hastie T, Tibshirani R. Varying-coefficient models. Journal of the Royal Statistical Society. 1993;Series B 55(4):757–796.
Henry S, Schoumaker B, Beauchemin C. The impact of rainfall on the first out-migration: a multi-levelevent-history analysis in Burkina Faso. Population and Environment. 2004; 25(5):423–460.
Hill, RC.; Adkins, LC. Collinearity. In: Baltagi, BH., editor. A Companion to TheoreticalEconometrics. Basil Blackwell, Oxford: 2007. p. 256-278.
Hunter L, Twine W, Johnson A. Adult mortality and natural resource use in rural South Africa:evidence from the Agincourt Health and Demographic Surveillance Site. Society and NaturalResources. 2011; 24:256–275. [PubMed: 21866207]
Hunter LM. The Association between environmental risk and internal migration flows. Population andEnvironment. 1998; 19(3):247–277.
Hunter LM. The spatial association between U.S. immigrant residential concentration andenvironmental hazards. International Migration Review. 2000; 34:460–488.
IPCC. The Physical Science Basis. In: Solomon, S.; Qin, D.; Manning, M.; Chen, Z.; Marquis, M.;Averyt, KB.; Tignor, M.; Miller, HL., editors. Contribution of Working Group I to the FourthAssessment Report of the Intergovernmental Panel on Climate Change. Cambridge, UnitedKingdom New York, NY: Cambridge University Press; 2007.
IPCC. Summary for Policymakers. In: Field, CB.; Barros, V.; Stocker, TF.; Qin, D.; Dokken, DJ.; Ebi,KL.; Mastrandrea, MD.; Mach, KJ.; Plattner, G-K.; Allen, SK.; Tignor, M.; Midgley, PM., editors.Managing the Risks of Extreme Events and Disasters to Advance Climate Change Adaptation. ASpecial Report of Working Groups I and II of the Intergovernmental Panel on Climate Change.Cambridge, United Kingdom New York, NY: Cambridge University Press; 2012.
Kok, P.; O'Donovan, M.; Bouare, O.; Van Zyl, J. Post Apartheid Patterns of Internal Migration inSouth Africa. Cape Town, South Africa: Human Sciences Research Council; 2003.
Lam NS, Quattrochi DA. On the Issues of Scale, Resolution, and Fractal Analysis in the MappingSciences. The Professional Geographer. 1992; 44(1):88–98.
Lindstrom DP, Ramirez A. Pioneers and followers: migrant selectivity and the development of U.S.migration streams in Latin America. The Annals of the American Academy of Political and SocialSciences. 2010; 630:53–77.
Massey DS, Axinn WG, Ghimire DJ. Environmental change and out-migration: evidence from Nepal.Population and Environment. 2010; 32(2–3):109–136. [PubMed: 21350676]
Mberu BU. Internal migration and household living conditions in Ethiopia. Demographic Research.2006; 14:509–539.
Leyk et al. Page 12
Appl Geogr. Author manuscript; available in PMC 2013 May 01.
NIH
-PA Author Manuscript
NIH
-PA Author Manuscript
NIH
-PA Author Manuscript
McLeman R, Smit B. Migration as adaptation to climate change. Climatic Change. 2005; 76:31–53.
McLeman RA, Hunter LM. Migration in the context of vulnerability and adaptation to climate change:insights from analogues. Wiley Interdisciplinary Reviews-Climate Change. 2010; 1(3):450–461.[PubMed: 22022342]
McSweeny K. Tropical forests product sale as natural insurance: the effects of householdcharacteristics and the nature of shock in Eastern Honduras. Society and Natural Resources. 2004;17:39–56.
Meze-Hausken E. Migration caused by climate change: how vulnerable are people in dryland areas.Migration and Adaptation Strategies for Global Change. 2000; 5:379–406.
Montello, DR. Scale in geography. In: Smelser, NJ.; Baltes, PB., editors. International Encyclopedia ofthe Social & Behavioral Sciences. Pergamon, Oxford: 2001. p. 13501-13504.
Moran PAP. Notes on continuous stochastic phenomena. Biometrika. 1950; 37:17–33. [PubMed:15420245]
O'Sullivan, D.; Unwin, D. Geographic information analysis. Wiley, Hoboken; 2010.
O’brien RM. A caution regarding rules of thumb for variance inflation factors. Quality & Quantity.2007; 41:673–690.
Paumgarten F, Shackleton C. The role of non-timber forest products in household coping strategies inSouth Africa: the influence of household wealth and gender. Population and Environment. 2011;33:108–131.
Rodríguez, G. [Accessed December 16, 2011] Lecture Notes on Generalized Linear Models. 2007.http://data.princeton.edu/wws509/notes/.
Sayyareh A, Obeidi R, Bar-Hen A. Empiricial comparison between some model selection criteria.Communications in Statistics - Simulation and Computation. 2010; 40:72–86.
Scheffran J, Battaglini A. Climate and conflicts: the security risks of global warming. RegionalEnvironmental Change. 2011; 11:S27–S39.
Shackleton S, Campbell B, Lotz-Sisitka H, Shackleton C. Links between the local trade in naturalproducts, livelihoods and poverty alleviation in a semi-arid region of South Africa. WorldDevelopment. 2008; 36(3):505–526.
Shackleton, S.; Shackleton, C. Exploring the role of wild natural resources in poverty alleviation withan emphasis on South Africa. In: Hebinck, P.; Shackleton, C., editors. Reforming Land andResource Use in South Africa: Impact on Livelihoods. Routledge, New York: 2011. p. 209-234.
Vuong QH. Likelihood ratio tests for model selection and non-nested hypotheses. Econometrica. 1989;57(2):307–333.
Wang J, Rich PM, Price KP, Kettle WD. Relations between NDVI and tree productivity in the centralGreat Plains. International Journal of Remote Sensing. 2004; 25(16):3127–3138.
Wheeler DC. Diagnostic tools and a remedial method for collinearity in geographically weightedregression. Environment & Planning A. 2007; 39(10):2464–2481.
White, MJ.; Lindstrom, DP. Internal migration. In: Poston, D.; Micklin, M., editors. Handbook ofPopulation. Kluwer, New York: 2006. p. 311-346.
Wynberg RP, Laird SA, Shackleton SE, Mander M, Shackleton CM, du Plessis P, den Adel S, LeakeyRRB, Botelle A, Lombard C, Sullivan C, Cunningham AB, O’Regan DP. Marulacommercialisation for sustainable and equitable livelihoods. Forests Trees and Livelihoods. 2003;13:203–215.
Yabiku S, Glick JE, Wentz EA, Haas SA, Zhu L. Migration, health, and environment in the desertsouthwest. Population and Environment. 2009; 30(4–5):131–158.
Leyk et al. Page 13
Appl Geogr. Author manuscript; available in PMC 2013 May 01.
NIH
-PA Author Manuscript
NIH
-PA Author Manuscript
NIH
-PA Author Manuscript

Figure 1.Bushbuckridge and Agincourt Field Site, South Africa.
Leyk et al. Page 14
Appl Geogr. Author manuscript; available in PMC 2013 May 01.
NIH
-PA Author Manuscript
NIH
-PA Author Manuscript
NIH
-PA Author Manuscript

Figure 2.Mean relative greenness for periods leading up to 2002 and 2007, for (a) the Agincourtstudy area; (b) extracted within household collection zones (displayed at household levelwithin the original village polygons). Inset (b) shows an example of how natural resourceavailability was calculated for each household.
Leyk et al. Page 15
Appl Geogr. Author manuscript; available in PMC 2013 May 01.
NIH
-PA Author Manuscript
NIH
-PA Author Manuscript
NIH
-PA Author Manuscript
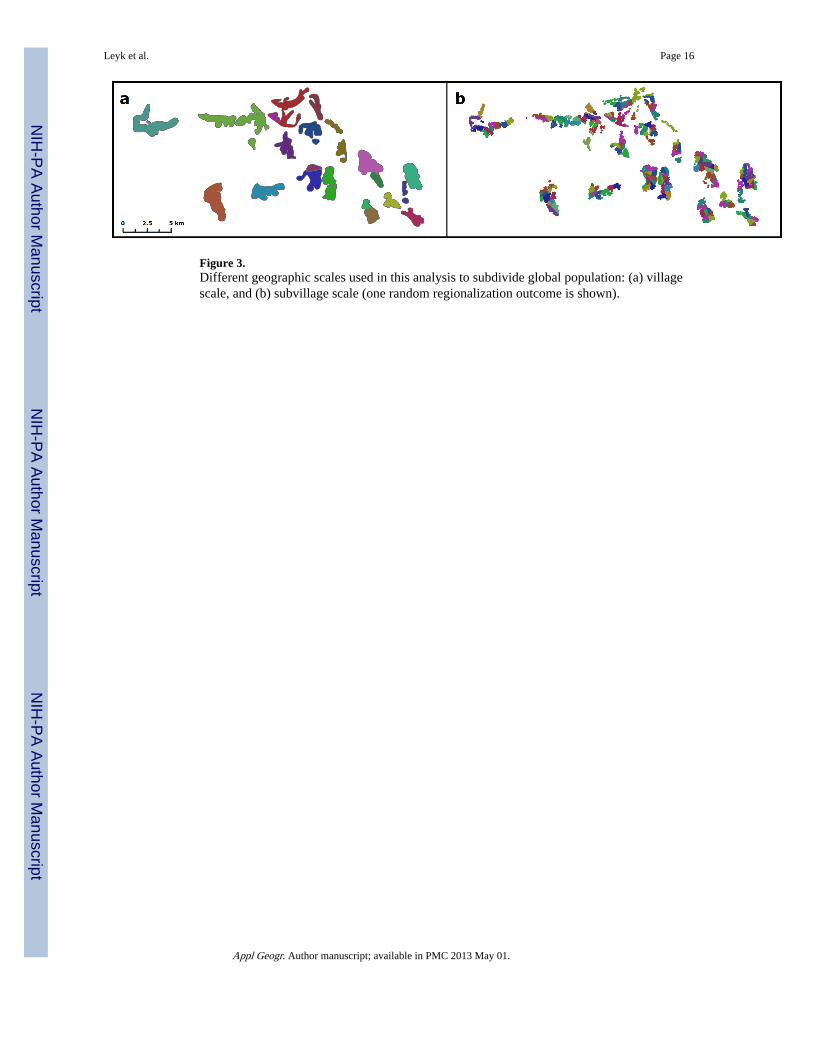
Figure 3.Different geographic scales used in this analysis to subdivide global population: (a) villagescale, and (b) subvillage scale (one random regionalization outcome is shown).
Leyk et al. Page 16
Appl Geogr. Author manuscript; available in PMC 2013 May 01.
NIH
-PA Author Manuscript
NIH
-PA Author Manuscript
NIH
-PA Author Manuscript
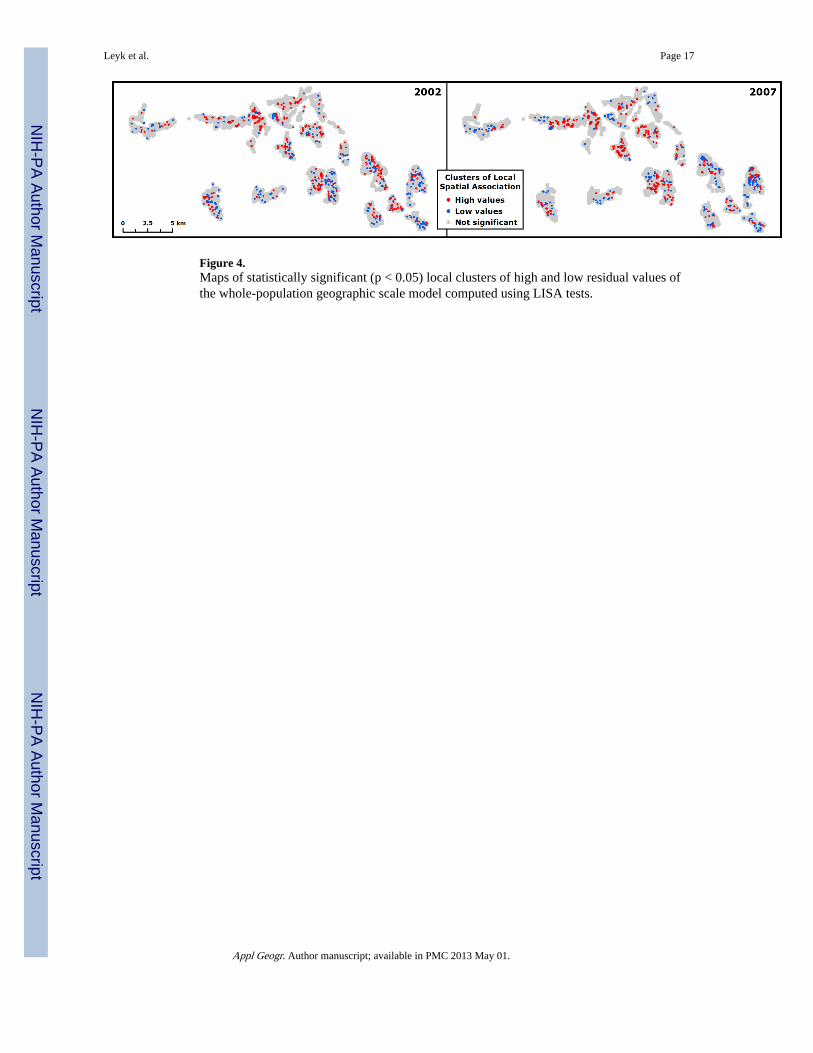
Figure 4.Maps of statistically significant (p < 0.05) local clusters of high and low residual values ofthe whole-population geographic scale model computed using LISA tests.
Leyk et al. Page 17
Appl Geogr. Author manuscript; available in PMC 2013 May 01.
NIH
-PA Author Manuscript
NIH
-PA Author Manuscript
NIH
-PA Author Manuscript
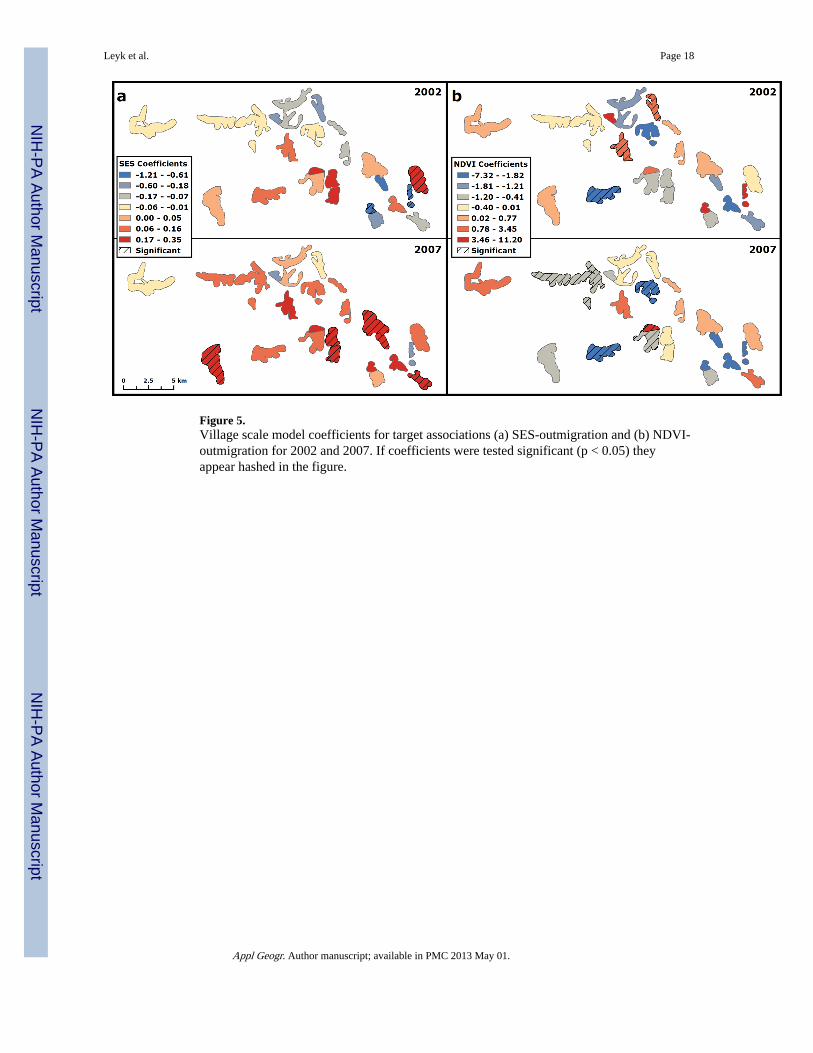
Figure 5.Village scale model coefficients for target associations (a) SES-outmigration and (b) NDVI-outmigration for 2002 and 2007. If coefficients were tested significant (p < 0.05) theyappear hashed in the figure.
Leyk et al. Page 18
Appl Geogr. Author manuscript; available in PMC 2013 May 01.
NIH
-PA Author Manuscript
NIH
-PA Author Manuscript
NIH
-PA Author Manuscript
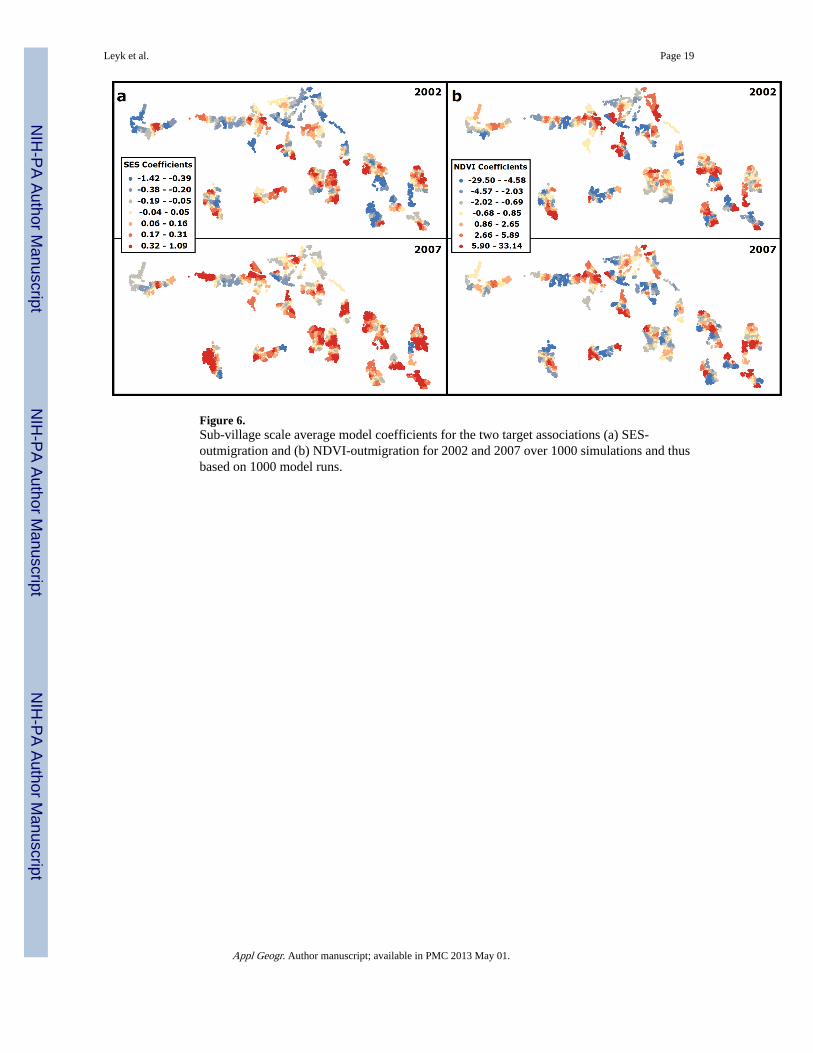
Figure 6.Sub-village scale average model coefficients for the two target associations (a) SES-outmigration and (b) NDVI-outmigration for 2002 and 2007 over 1000 simulations and thusbased on 1000 model runs.
Leyk et al. Page 19
Appl Geogr. Author manuscript; available in PMC 2013 May 01.
NIH
-PA Author Manuscript
NIH
-PA Author Manuscript
NIH
-PA Author Manuscript

Figure 7.Sub-village scale proportions of model coefficients tested significant over 1000 simulationsand thus based on 1000 model runs for the two target associations (a) outmigration-SES and(b) outmigration-NDVI for 2002 and 2007.
Leyk et al. Page 20
Appl Geogr. Author manuscript; available in PMC 2013 May 01.
NIH
-PA Author Manuscript
NIH
-PA Author Manuscript
NIH
-PA Author Manuscript
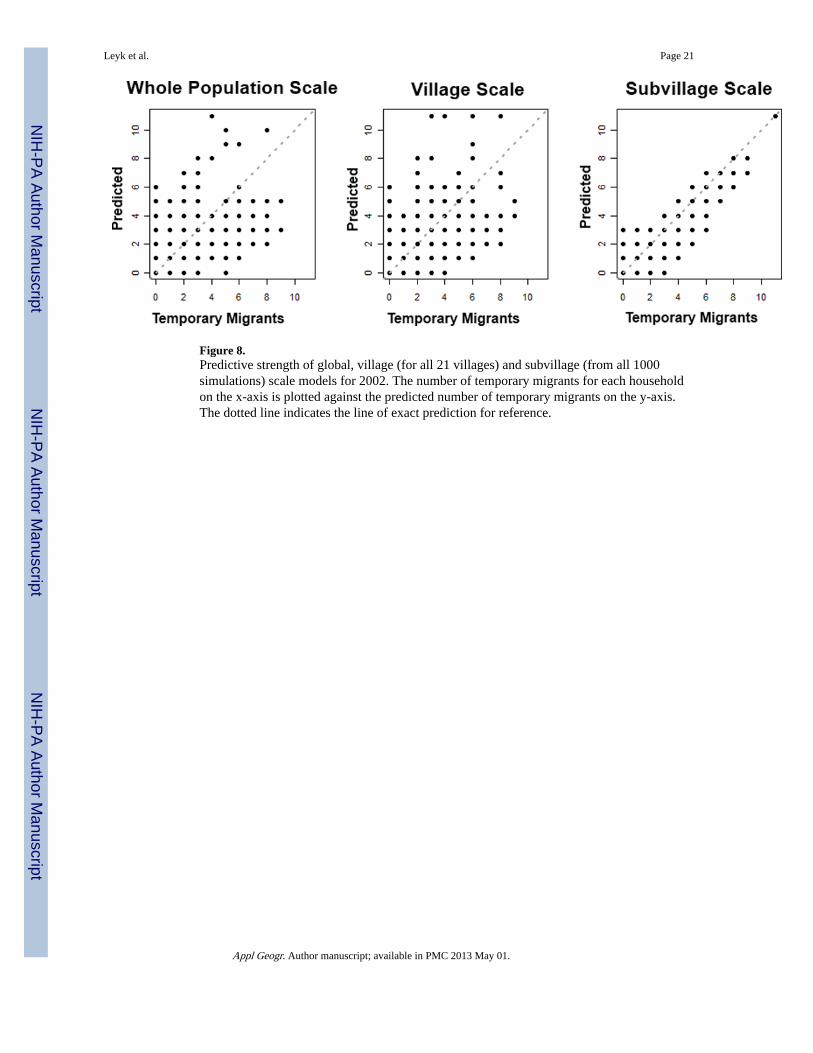
Figure 8.Predictive strength of global, village (for all 21 villages) and subvillage (from all 1000simulations) scale models for 2002. The number of temporary migrants for each householdon the x-axis is plotted against the predicted number of temporary migrants on the y-axis.The dotted line indicates the line of exact prediction for reference.
Leyk et al. Page 21
Appl Geogr. Author manuscript; available in PMC 2013 May 01.
NIH
-PA Author Manuscript
NIH
-PA Author Manuscript
NIH
-PA Author Manuscript
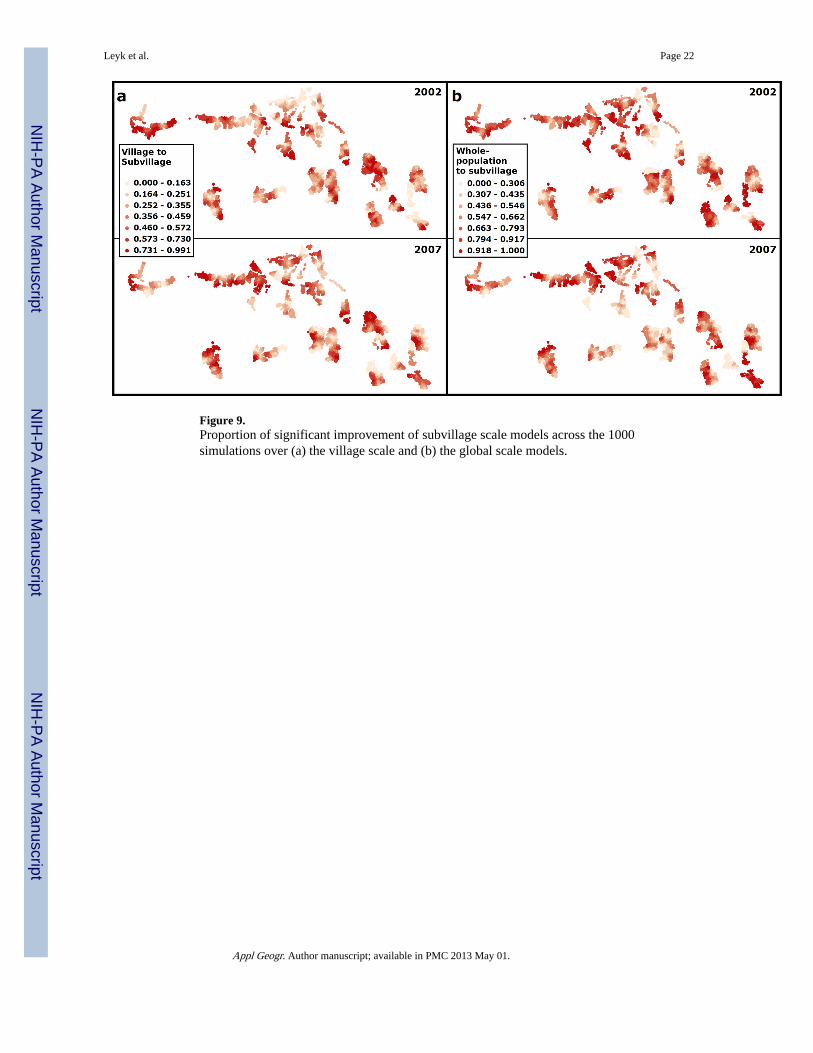
Figure 9.Proportion of significant improvement of subvillage scale models across the 1000simulations over (a) the village scale and (b) the global scale models.
Leyk et al. Page 22
Appl Geogr. Author manuscript; available in PMC 2013 May 01.
NIH
-PA Author Manuscript
NIH
-PA Author Manuscript
NIH
-PA Author Manuscript

Figure 10.Multicollinearity of various explanatory variables. Village scale VIF is displayed as medianvalues across all villages. Subvillage scale values are shown as boxplots across all 1000simulations.
Leyk et al. Page 23
Appl Geogr. Author manuscript; available in PMC 2013 May 01.
NIH
-PA Author Manuscript
NIH
-PA Author Manuscript
NIH
-PA Author Manuscript

NIH
-PA Author Manuscript
NIH
-PA Author Manuscript
NIH
-PA Author Manuscript
Leyk et al. Page 24
Tabl
e 1
Sum
mar
y of
who
le-p
opul
atio
n sc
ale
mod
el c
oeff
icie
nt e
stim
ates
(SE
S an
d N
DV
I).
Who
le-p
opul
atio
n Sc
ale
SES
Coe
ffic
ient
sN
DV
I C
oeff
icie
nts
Yea
rE
st.
Std.
Err
orp-
valu
eE
stSt
d. E
rror
p-va
lue
2002
0.06
80.
024
0.00
50.
280
0.08
00.
001
2007
0.16
20.
025
~0.0
00.
304
0.07
3~0
.00
Appl Geogr. Author manuscript; available in PMC 2013 May 01.

NIH
-PA Author Manuscript
NIH
-PA Author Manuscript
NIH
-PA Author Manuscript
Leyk et al. Page 25
Tabl
e 2
Sum
mar
y of
mod
el d
iagn
ostic
s an
d cl
uste
ring
of
mod
el r
esid
uals
bas
ed o
n L
ISA
. Vill
age
and
sub-
villa
ge s
cale
mea
sure
s ar
e m
eans
acr
oss
all r
egio
n-sp
ecif
ic r
egre
ssio
ns. L
ISA
bas
ed H
igh-
Hig
h an
d L
ow-L
ow c
lust
ers
can
be in
terp
rete
d as
spa
tial g
roup
ing
of o
ver-
and
und
erpr
edic
tion,
res
pect
ivel
y.
Who
le-p
opul
atio
n Sc
ale
Vill
age
Scal
eSu
bvill
age
Scal
e
Reg
ress
ion
Dia
gnos
tics
LIS
A C
lust
ers
Reg
ress
ion
Dia
gnos
tics
LIS
A C
lust
ers
Reg
ress
ion
Dia
gnos
tics
LIS
A C
lust
ers
Yea
rM
SEA
ICH
igh-
Hig
hL
ow-
Low
Mea
nM
SEA
ICH
igh-
Hig
hL
ow-
Low
Mea
nM
SEA
ICH
igh-
Hig
hL
ow-
Low
2002
1.02
116
3.8
361
302
0.98
415
8.2
288
336
0.78
415
0.7
256
228
2007
1.13
218
1.9
383
261
1.07
617
6.9
324
294
0.86
516
8.3
218
173
Appl Geogr. Author manuscript; available in PMC 2013 May 01.
Related Documents