This article was downloaded by: [b-on: Biblioteca do conhecimento online UAlgarve] On: 31 July 2014, At: 07:33 Publisher: Taylor & Francis Informa Ltd Registered in England and Wales Registered Number: 1072954 Registered office: Mortimer House, 37-41 Mortimer Street, London W1T 3JH, UK Communications in Soil Science and Plant Analysis Publication details, including instructions for authors and subscription information: http://www.tandfonline.com/loi/lcss20 Spatial Variability of Durum Wheat Yield as Related to Soil Parameters in an Organic Field Thomas Panagopoulos a , Jorge de Jesus b , Dan Blumberg c & Jiftah Ben-Asher c a Faculty of Science and Technology, CIEO, University of Algarve, Campus Gambelas, Faro, Portugal b Plymouth Marine Laboratory, PML Applications Ltd., Plymouth, UK c Ben-Gurion University of the Negev, Beer Sheva, Israel Accepted author version posted online: 23 Jun 2014.Published online: 29 Jul 2014. To cite this article: Thomas Panagopoulos, Jorge de Jesus, Dan Blumberg & Jiftah Ben-Asher (2014): Spatial Variability of Durum Wheat Yield as Related to Soil Parameters in an Organic Field, Communications in Soil Science and Plant Analysis, DOI: 10.1080/00103624.2014.919311 To link to this article: http://dx.doi.org/10.1080/00103624.2014.919311 PLEASE SCROLL DOWN FOR ARTICLE Taylor & Francis makes every effort to ensure the accuracy of all the information (the “Content”) contained in the publications on our platform. However, Taylor & Francis, our agents, and our licensors make no representations or warranties whatsoever as to the accuracy, completeness, or suitability for any purpose of the Content. Any opinions and views expressed in this publication are the opinions and views of the authors, and are not the views of or endorsed by Taylor & Francis. The accuracy of the Content should not be relied upon and should be independently verified with primary sources of information. Taylor and Francis shall not be liable for any losses, actions, claims, proceedings, demands, costs, expenses, damages, and other liabilities whatsoever or howsoever caused arising directly or indirectly in connection with, in relation to or arising out of the use of the Content. This article may be used for research, teaching, and private study purposes. Any substantial or systematic reproduction, redistribution, reselling, loan, sub-licensing, systematic supply, or distribution in any form to anyone is expressly forbidden. Terms &

Welcome message from author
This document is posted to help you gain knowledge. Please leave a comment to let me know what you think about it! Share it to your friends and learn new things together.
Transcript
This article was downloaded by: [b-on: Biblioteca do conhecimento online UAlgarve]On: 31 July 2014, At: 07:33Publisher: Taylor & FrancisInforma Ltd Registered in England and Wales Registered Number: 1072954 Registeredoffice: Mortimer House, 37-41 Mortimer Street, London W1T 3JH, UK
Communications in Soil Science andPlant AnalysisPublication details, including instructions for authors andsubscription information:http://www.tandfonline.com/loi/lcss20
Spatial Variability of Durum Wheat Yieldas Related to Soil Parameters in anOrganic FieldThomas Panagopoulosa, Jorge de Jesusb, Dan Blumbergc & JiftahBen-Asherc
a Faculty of Science and Technology, CIEO, University of Algarve,Campus Gambelas, Faro, Portugalb Plymouth Marine Laboratory, PML Applications Ltd., Plymouth, UKc Ben-Gurion University of the Negev, Beer Sheva, IsraelAccepted author version posted online: 23 Jun 2014.Publishedonline: 29 Jul 2014.
To cite this article: Thomas Panagopoulos, Jorge de Jesus, Dan Blumberg & Jiftah Ben-Asher(2014): Spatial Variability of Durum Wheat Yield as Related to Soil Parameters in an Organic Field,Communications in Soil Science and Plant Analysis, DOI: 10.1080/00103624.2014.919311
To link to this article: http://dx.doi.org/10.1080/00103624.2014.919311
PLEASE SCROLL DOWN FOR ARTICLE
Taylor & Francis makes every effort to ensure the accuracy of all the information (the“Content”) contained in the publications on our platform. However, Taylor & Francis,our agents, and our licensors make no representations or warranties whatsoever as tothe accuracy, completeness, or suitability for any purpose of the Content. Any opinionsand views expressed in this publication are the opinions and views of the authors,and are not the views of or endorsed by Taylor & Francis. The accuracy of the Contentshould not be relied upon and should be independently verified with primary sourcesof information. Taylor and Francis shall not be liable for any losses, actions, claims,proceedings, demands, costs, expenses, damages, and other liabilities whatsoever orhowsoever caused arising directly or indirectly in connection with, in relation to or arisingout of the use of the Content.
This article may be used for research, teaching, and private study purposes. Anysubstantial or systematic reproduction, redistribution, reselling, loan, sub-licensing,systematic supply, or distribution in any form to anyone is expressly forbidden. Terms &

Conditions of access and use can be found at http://www.tandfonline.com/page/terms-and-conditions
Dow
nloa
ded
by [
b-on
: Bib
liote
ca d
o co
nhec
imen
to o
nlin
e U
Alg
arve
] at
07:
33 3
1 Ju
ly 2
014
Communications in Soil Science and Plant Analysis, 00:1–14, 2014Copyright © Taylor & Francis Group, LLCISSN: 0010-3624 print / 1532-2416 onlineDOI: 10.1080/00103624.2014.919311
Spatial Variability of Durum Wheat Yield as Relatedto Soil Parameters in an Organic Field
THOMAS PANAGOPOULOS,1 JORGE DE JESUS,2
DAN BLUMBERG,3 AND JIFTAH BEN-ASHER3
1Faculty of Science and Technology, CIEO, University of Algarve, CampusGambelas, Faro, Portugal2Plymouth Marine Laboratory, PML Applications Ltd., Plymouth, UK3Ben-Gurion University of the Negev, Beer Sheva, Israel
The yield in organic farming is generally much lower than its potential, which is dueto its specificity. The objective of the present study was to quantify the yield spatialvariation of wheat and relate it to soil parameters in an organic farm located in thenorth of the Negev Desert. Soil samples were gathered in a triangular grid at three timeintervals. Yields were measured at 73 georeferenced points before the actual harvest.Several thematic maps of soil and yield parameters were produced using geographicinformation system and geostatistical methods. The strongest spatial correlation wasfound in the weight of 1000 grains and the weakest was in carbon flow. Temporal rela-tionships were found between soil nitrate concentration, soil water content, and leafarea index. Wheat yield varied from 1.11 to 2.84 Mg ha−1 and this remarkable vari-ation indicates that the spatial analysis of soil and yield parameters is significant inorganic agriculture.
Keywords Geostatistics, organic agriculture, precision agriculture, site-specific anal-ysis, soil management, wheat, yield
Introduction
Wheat (Triticum turgidum var. durum) is cultivated over more than 13 million hectaresworldwide and traditionally grown under rainfed conditions in the Mediterranean regionand other marginal environments of semi-arid areas. Wheat yield and protein content arespatially variable because of inherent spatial variability of factors affecting the yield atfield scale (Basso et al. 2009). There are no available reports in the literature of studieson durum wheat yield variation within a small organic field and its possible relationshipwith soil spatial variability. There are a lot of experiments aimed at assessing the influ-ence of one or few agronomic factors on wheat yield (Flink, Pettersson, and Andrén 1995;Abad, Lloveras, and Michelena 2004; Ferrise et al. 2010), but they generally referred toconventional plot experiments.
Until recently, the spatial variability in agricultural fields has not been taken into con-sideration. The lack of tools for spatial analysis has been one of the reasons for it. The
Received 18 April 2012; accepted 29 January 2014.Address correspondence to Thomas Panagopoulos, Faculty of Science and Technology, CIEO,
University of Algarve, Campus Gambelas, 8005-139 Faro, Portugal. E-mail: [email protected] versions of one or more of the figures in the article can be found online at www.
tandfonline.com/lcss.
1
Dow
nloa
ded
by [
b-on
: Bib
liote
ca d
o co
nhec
imen
to o
nlin
e U
Alg
arve
] at
07:
33 3
1 Ju
ly 2
014
2 T. Panagopoulos et al.
assumption that variability is something unwelcome is wrong when making spatial studiesin any discipline that uses data collected in different spatial locations (Cressie 1993);one such discipline is precision agriculture, where variability is considered in a spatial–temporal scale and can be subdivided into six groups: yield variability, soil variability,field variability, crop variability, variability in anomalous factors, and management vari-ability (Zhang, Maohua, and Wang 2002). The yield variability is of the most importance,because it is the parameter most related to the economic benefit of the crop and it hasbeen studied in several studies of different crops types, managements, and soil conditions(Bresler, Dagan, and Hanks 1982; Bresler 1989; Roel and Plant 2004; Virgilio, Monti, andVenturi 2007). The yield variability is not an independent phenomenon, and in theory itshould be influenced by the soil variability and by the scarcest resource that controls thegrowth and not the sum of all resources available.
The analysis of variability has always been done in common agricultural fields, over-looking other types of agriculture such as organic farming, which is the field of agriculturewith the fastest growth rate in the European Union (Vogl, Kilcher, and Schmidt 2005). Thearea of organically cultivated crops in the European Union increased at a rate of 21% peryear between 1998 and 2002, with a total area dedicated to organic farming of 4.9 millionha, representing 4% of the total European farmland (Rohner-Thielen 2005). An organicfarming field has 31% to 51% less need for nutrients and also a 20% lower yield than aconventional field, making it more efficient in nutrient use than conventional agriculture(Mader et al. 2002); therefore there is need to do a closer analysis of actual producing fieldof organic farming and the internal relationship between plant producing factors and yield.In the field many production factors conjointly act and positive effects may somewhat hidethe negative ones.
Precision agriculture is an emerging agricultural management concept that embodiesthe convergence of agricultural technologies with space and informatics. Although it isincreasingly applied in conventional agriculture, it is uncommon in organic agriculture.The yield in organic farming is generally much less than its potential, which is due to itsspecificity. Precision agriculture, dealing with spatial variability, can be applied to organicfarming to improve productivity. By analyzing a small plot of organic farms and using theprecision agriculture methodologies it should be possible to explain and predict the cropsdevelopment/yield from several production factors.
Therefore, the present research had the following objectives: (i) to estimate the spatialvariation of durum wheat yield under organic agriculture field conditions; (ii) to assessthe spatial variation of soil properties; (iii) to produce thematic maps of yield and soilparameters using geostatistical kriging approaches to find possible relationships betweensoil parameters and yield; (iv) to optimize yield, reduce cost of cultivation, and minimizeenvironmental impacts through location-specific management.
Materials and Methods
Experimental Site
The study area is located in the organic farm of Kibbutz Nirim (34◦ 35′ N/31◦ 20′ E)in the north of the Negev Desert in Israel where average temperature varies between 16◦C in January and 27 ◦C in August. The average annual rain is 250 mm and the annualevaporation from class A pan was 155 cm. Soil was classified as Loess Calcic haploxeralfsandy loam, with average bulk density of 1320 kg m−3 pore volume of 0.5 m3 m−3. Clay,silt, and sand were 150, 300, and 550 g kg−1, respectively. The cation exchange capacitywas 18 cmol kg−1.
Dow
nloa
ded
by [
b-on
: Bib
liote
ca d
o co
nhec
imen
to o
nlin
e U
Alg
arve
] at
07:
33 3
1 Ju
ly 2
014
Spatial Variability in an Organic Field 3
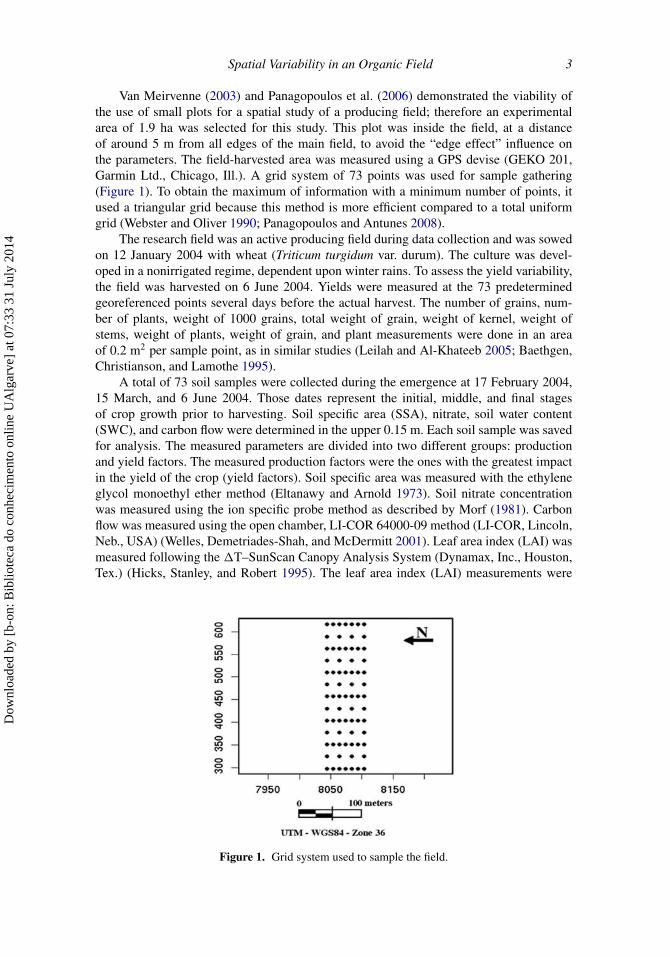
Van Meirvenne (2003) and Panagopoulos et al. (2006) demonstrated the viability ofthe use of small plots for a spatial study of a producing field; therefore an experimentalarea of 1.9 ha was selected for this study. This plot was inside the field, at a distanceof around 5 m from all edges of the main field, to avoid the “edge effect” influence onthe parameters. The field-harvested area was measured using a GPS devise (GEKO 201,Garmin Ltd., Chicago, Ill.). A grid system of 73 points was used for sample gathering(Figure 1). To obtain the maximum of information with a minimum number of points, itused a triangular grid because this method is more efficient compared to a total uniformgrid (Webster and Oliver 1990; Panagopoulos and Antunes 2008).
The research field was an active producing field during data collection and was sowedon 12 January 2004 with wheat (Triticum turgidum var. durum). The culture was devel-oped in a nonirrigated regime, dependent upon winter rains. To assess the yield variability,the field was harvested on 6 June 2004. Yields were measured at the 73 predeterminedgeoreferenced points several days before the actual harvest. The number of grains, num-ber of plants, weight of 1000 grains, total weight of grain, weight of kernel, weight ofstems, weight of plants, weight of grain, and plant measurements were done in an areaof 0.2 m2 per sample point, as in similar studies (Leilah and Al-Khateeb 2005; Baethgen,Christianson, and Lamothe 1995).
A total of 73 soil samples were collected during the emergence at 17 February 2004,15 March, and 6 June 2004. Those dates represent the initial, middle, and final stagesof crop growth prior to harvesting. Soil specific area (SSA), nitrate, soil water content(SWC), and carbon flow were determined in the upper 0.15 m. Each soil sample was savedfor analysis. The measured parameters are divided into two different groups: productionand yield factors. The measured production factors were the ones with the greatest impactin the yield of the crop (yield factors). Soil specific area was measured with the ethyleneglycol monoethyl ether method (Eltanawy and Arnold 1973). Soil nitrate concentrationwas measured using the ion specific probe method as described by Morf (1981). Carbonflow was measured using the open chamber, LI-COR 64000-09 method (LI-COR, Lincoln,Neb., USA) (Welles, Demetriades-Shah, and McDermitt 2001). Leaf area index (LAI) wasmeasured following the �T–SunScan Canopy Analysis System (Dynamax, Inc., Houston,Tex.) (Hicks, Stanley, and Robert 1995). The leaf area index (LAI) measurements were
Figure 1. Grid system used to sample the field.
Dow
nloa
ded
by [
b-on
: Bib
liote
ca d
o co
nhec
imen
to o
nlin
e U
Alg
arve
] at
07:
33 3
1 Ju
ly 2
014
4 T. Panagopoulos et al.
done only at the two initial dates and were not measured on the last date since the crop wascompletely dry (there was no use for LAI).
To produce thematic maps of yield and soil characteristics, the kriging methodwas used as an advanced interpolation procedure generating estimated surfaces viasemivariograms, which represent and characterize the spatial variation set against thedistance (lag) (Isaaks and Srivastava 1989).
Skewness, Stationarity, and Trend
The skewness indicates how close the data distribution is to normal Gaussian behavior(Dalgaard 2002). The normal distribution was estimated on skewness base: for a skewnessrange between –1 and 1, data were considered normally distributed. To bring the skewvalues closer to zero the data were transformed using functions such as log or square root.All data were standardized by subtracting the mean to each value then dividing for standarddeviation. The functions used for data transformation were x0.5, x2, x−1, log (x) (Websterand Oliver 1990). After testing the skew values for each function, the one closest to zerowas chosen for data transformation.
Stationarity requires that the value of any variable Z(x) to be independent of its locationx; therefore a random collection of points of the spatial domain should result on a constantaverage (Goovaerts 2000). If this does not occur and there is a large scale variation ofvalues in a specific direction, then the data are nonstationary and referred to as trended.
To check the trend of the data we used the mean-polish trend removal (Cressie 1993);this technique divides the values Z(x) into a summation of the overall (m), row (r), andcolumn (c) median, and a residual term (Rkl) as demonstrated in Eq. (1):
Z (x) = m + rk + cl + Rkl Eq. [1]
where k and l are the row and the column numbers of the grid. This equation by itself isnot sufficient to determine if there is a trend in the measured data. It was necessary to plotthe residual Rkl [Eq. (2)] versus (k − k)(l−l), where k,l are the average number of row andcolumns, and then to fit a trend line:
Rkl = Z (x) − m − rk − cl Eq. [2]
To prove that the data have a trend, the slope of the scatterplot was statistically checkedusing an analysis of variance (ANOVA) analysis using the F table (Roel and Plant 2004).If there was a trend in the data, the values used for the semivariogram where Rkl (theresiduals) and not Z(x). For the skewness and trend analysis we used the R-Cran software(R Foundation for Statistical Computing, Vienna, Austria) run in the openSUSE 10 Linuxoperating system (Attachmate Group, Houston, Tex.).
Semivariogram Model Fitting
The classic semivariogram (SV) determines how samples are related to each other in space;this description is based in Eq. (3):
γ (h) = 1
2N(h)
∑[Zi − Zi+h
] 2 (3)
Dow
nloa
ded
by [
b-on
: Bib
liote
ca d
o co
nhec
imen
to o
nlin
e U
Alg
arve
] at
07:
33 3
1 Ju
ly 2
014
Spatial Variability in an Organic Field 5
The most related samples have lower values of variance (γ(h)). N(h) is the number ofsamples that can be grouped using vector h; Zi represents the value of the sample; Zi+his the value of another sample located at a distance ||h|| from the initial sample Zi. Thesemivariogram is the graphical representation of the spatial relation between the samples,where the Y axis accommodates values of variance [γ(h)] calculated in Eq. (3), and the Xaxis holds the distance values of the grouping vector h. The SV was calculated for all themeasured parameters.
The spatial structure of each variable has been defined from semivariogram param-eters: nugget, sill (or total semivariance), and range. Nugget is the variance at distancezero and represents the sampling error. Sill is the semivariance value at which thesemivariogram reaches the upper bound after its initial increase; it is the variance inwhich the samples are no longer spatially related at the study area. The range is the dis-tance at which the sill is reached, which is the lag distance at which the semivariogramflattens; it is the value at which one variable becomes spatially independent. Thenugget-to-sill ratio quantifies the importance of the random component and provides aquantitative estimation of the spatial dependence of a measured parameter (Cambardellaet al. 1994).
The semivariogram is a point graphic, and for modeling the spatial behavior it wasfit to standard models using the lowest possible root square error (RSE). Spatial vari-ation has been characterized using different models (spherical, circular, etc.) fitting thesemivariograms. Choice of the best fitting model was based on the lowest root mean squareerror (RMSE) and confirmed by a visual inspection. Cross validation and ordinary kriginghave been applied to interpolate the values of unsampled field parts. For the spatial analysisand semivariogram creation we used the sgeostat package software (Iowa State University,Ames, Iowa) run in the openSUSE 10 Linux operating system (Attachmate Group, Inc.,Houston, Tex.).
Results
Descriptive Statistics and Trend Analysis
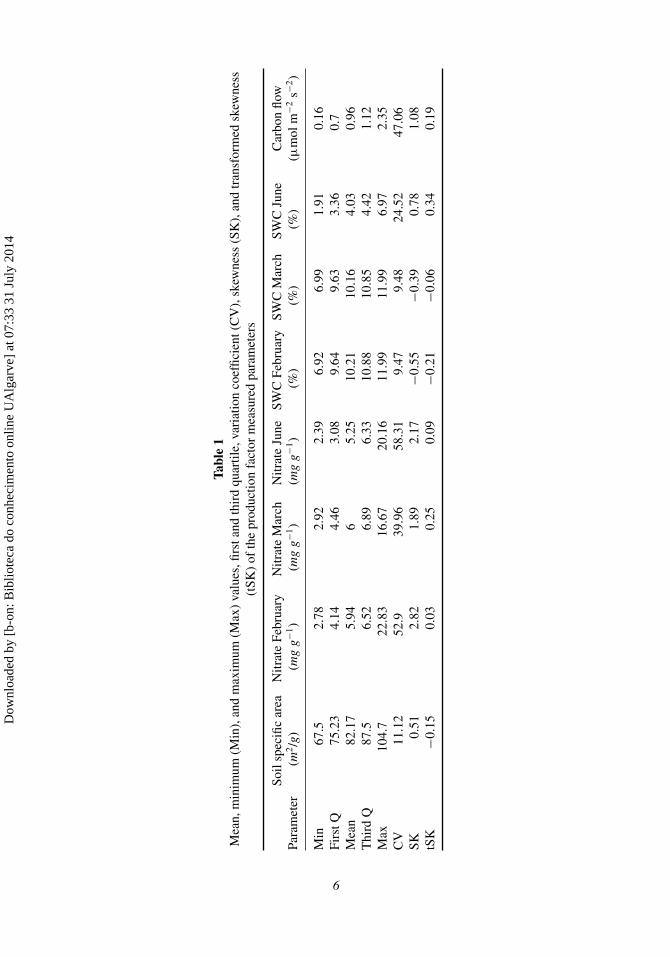
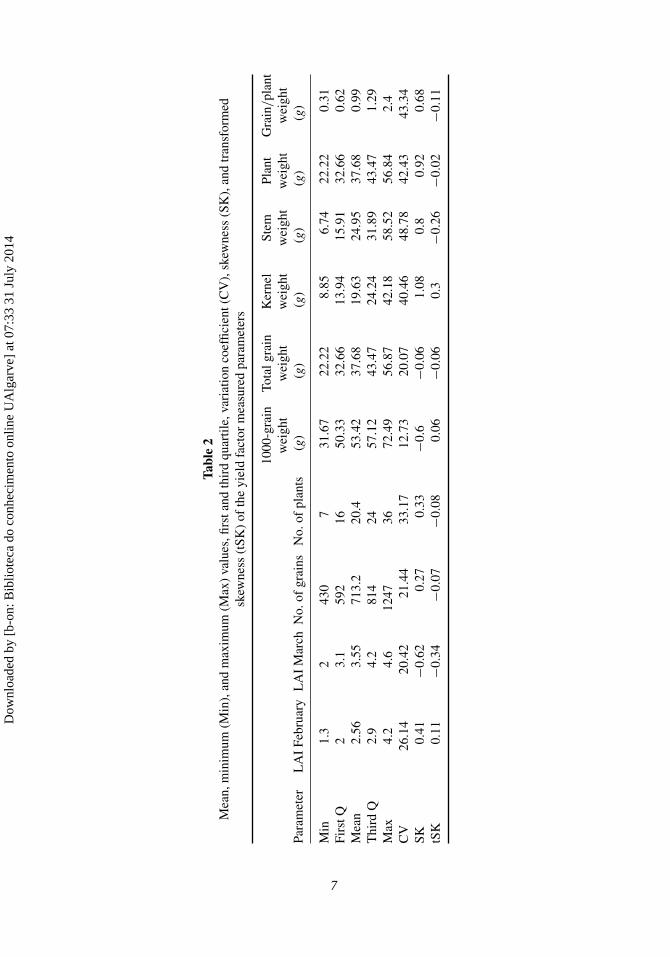
Descriptive statistics for the production factors are summarized in Table 1 and for yieldfactors in Table 2. Basing on skewness value, all variables were normally distributed. Theapplication of transformation functions had the most positive effect on the soil nitrate con-centration data, which was the most skewed data, and that became more normal (Table 1).The nitrate recorded 17 February had the greatest value of skew of 2.82, which was reducedto 0.03 using an inverse function; all the parameters benefitted from the application of thetransformation functions except for the total weight of grains, which had a skew of –0.06(very close to zero), and therefore no transformation functions could bring the skew evencloser to zero for this parameter. Yield of total grain varied from 1.11 to more than 2.84 Mgha−1.
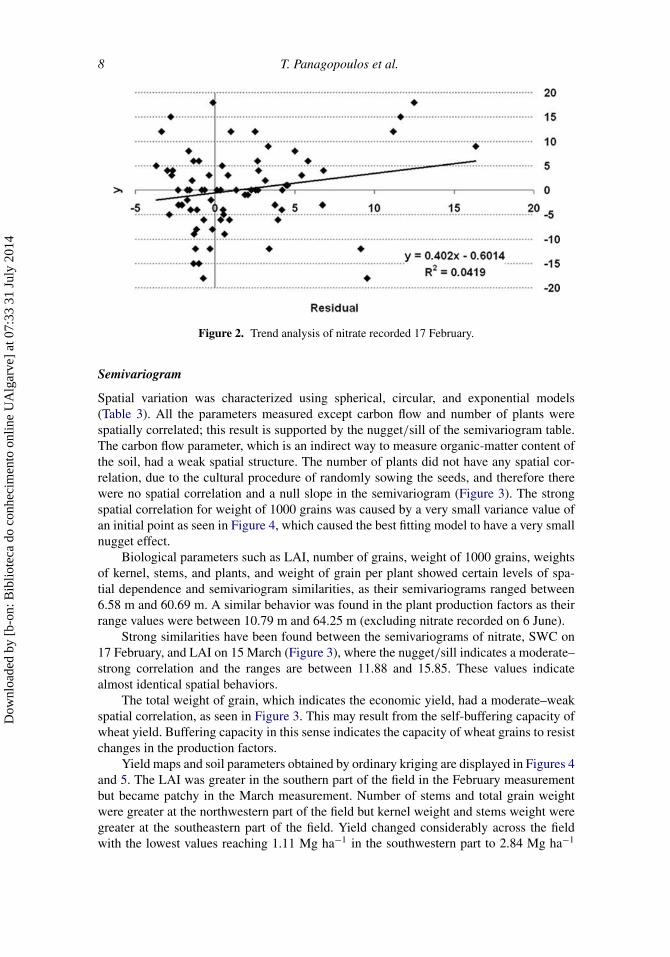
Nitrate measured on 17 February was the only parameter with trend behavior(Figure 2), where the plotting of the residual and the (k − k)(l−l) and the consequent trend-line calculation produced an equation with a slope of 0.402. The ANOVA proved that theslope was different from zero (∗∗P < 0.1), which indicates that the data are nonstationary.Therefore the nitrate recorded on 17 February was detrended and only the residual datawere used in the next analysis.
Dow
nloa
ded
by [
b-on
: Bib
liote
ca d
o co
nhec
imen
to o
nlin
e U
Alg
arve
] at
07:
33 3
1 Ju
ly 2
014
Tabl
e1
Mea
n,m
inim
um(M
in),
and
max
imum
(Max
)va
lues
,firs
tand
thir
dqu
artil
e,va
riat
ion
coef
ficie
nt(C
V),
skew
ness
(SK
),an
dtr
ansf
orm
edsk
ewne
ss(t
SK)
ofth
epr
oduc
tion
fact
orm
easu
red
para
met
ers
Soil
spec
ific
area
Nitr
ate
Febr
uary
Nitr
ate
Mar
chN
itrat
eJu
neSW
CFe
brua
rySW
CM
arch
SWC
June
Car
bon
flow
Para
met
er(m
2/g
)(m
gg−1
)(m
gg−1
)(m
gg−1
)(%
)(%
)(%
)(µ
mol
m−2
s−2)
Min
67.5
2.78
2.92
2.39
6.92
6.99
1.91
0.16
Firs
tQ75
.23
4.14
4.46
3.08
9.64
9.63
3.36
0.7
Mea
n82
.17
5.94
65.
2510
.21
10.1
64.
030.
96T
hird
Q87
.56.
526.
896.
3310
.88
10.8
54.
421.
12M
ax10
4.7
22.8
316
.67
20.1
611
.99
11.9
96.
972.
35C
V11
.12
52.9
39.9
658
.31
9.47
9.48
24.5
247
.06
SK0.
512.
821.
892.
17−0
.55
−0.3
90.
781.
08tS
K−0
.15
0.03
0.25
0.09
−0.2
1−0
.06
0.34
0.19
6
Dow
nloa
ded
by [
b-on
: Bib
liote
ca d
o co
nhec
imen
to o
nlin
e U
Alg
arve
] at
07:
33 3
1 Ju
ly 2
014
Tabl
e2
Mea
n,m
inim
um(M
in),
and
max
imum
(Max
)va
lues
,firs
tand
thir
dqu
artil
e,va
riat
ion
coef
ficie
nt(C
V),
skew
ness
(SK
),an
dtr
ansf
orm
edsk
ewne
ss(t
SK)
ofth
eyi
eld
fact
orm
easu
red
para
met
ers
1000
-gra
inw
eigh
tTo
talg
rain
wei
ght
Ker
nel
wei
ght
Stem
wei
ght
Plan
tw
eigh
tG
rain
/pl
ant
wei
ght
Para
met
erL
AI
Febr
uary
LA
IM
arch
No.
ofgr
ains
No.
ofpl
ants
(g)
(g)
(g)
(g)
(g)
(g)
Min
1.3
243
07
31.6
722
.22
8.85
6.74
22.2
20.
31Fi
rstQ
23.
159
216
50.3
332
.66
13.9
415
.91
32.6
60.
62M
ean
2.56
3.55
713.
220
.453
.42
37.6
819
.63
24.9
537
.68
0.99
Thi
rdQ
2.9
4.2
814
2457
.12
43.4
724
.24
31.8
943
.47
1.29
Max
4.2
4.6
1247
3672
.49
56.8
742
.18
58.5
256
.84
2.4
CV
26.1
420
.42
21.4
433
.17
12.7
320
.07
40.4
648
.78
42.4
343
.34
SK0.
41−0
.62
0.27
0.33
−0.6
−0.0
61.
080.
80.
920.
68tS
K0.
11−0
.34
−0.0
7−0
.08
0.06
−0.0
60.
3−0
.26
−0.0
2−0
.11
7
Dow
nloa
ded
by [
b-on
: Bib
liote
ca d
o co
nhec
imen
to o
nlin
e U
Alg
arve
] at
07:
33 3
1 Ju
ly 2
014
8 T. Panagopoulos et al.
Figure 2. Trend analysis of nitrate recorded 17 February.
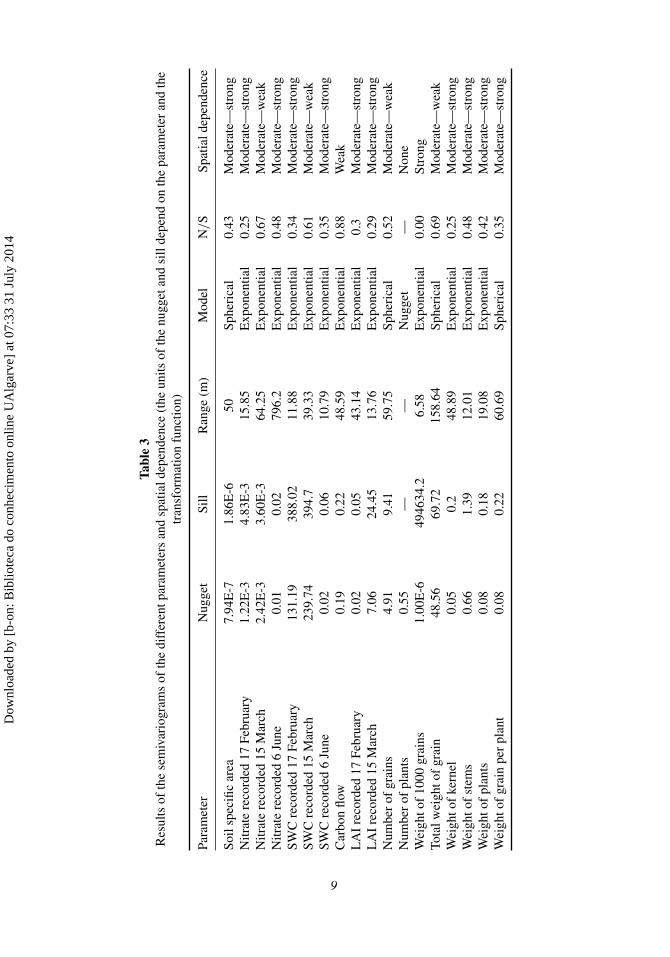
Semivariogram
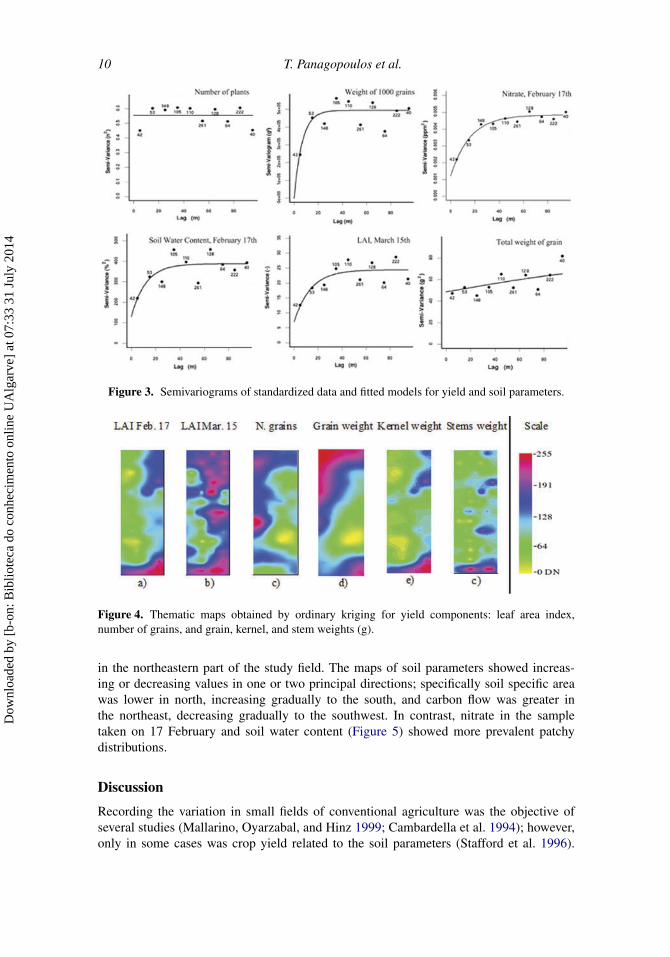
Spatial variation was characterized using spherical, circular, and exponential models(Table 3). All the parameters measured except carbon flow and number of plants werespatially correlated; this result is supported by the nugget/sill of the semivariogram table.The carbon flow parameter, which is an indirect way to measure organic-matter content ofthe soil, had a weak spatial structure. The number of plants did not have any spatial cor-relation, due to the cultural procedure of randomly sowing the seeds, and therefore therewere no spatial correlation and a null slope in the semivariogram (Figure 3). The strongspatial correlation for weight of 1000 grains was caused by a very small variance value ofan initial point as seen in Figure 4, which caused the best fitting model to have a very smallnugget effect.
Biological parameters such as LAI, number of grains, weight of 1000 grains, weightsof kernel, stems, and plants, and weight of grain per plant showed certain levels of spa-tial dependence and semivariogram similarities, as their semivariograms ranged between6.58 m and 60.69 m. A similar behavior was found in the plant production factors as theirrange values were between 10.79 m and 64.25 m (excluding nitrate recorded on 6 June).
Strong similarities have been found between the semivariograms of nitrate, SWC on17 February, and LAI on 15 March (Figure 3), where the nugget/sill indicates a moderate–strong correlation and the ranges are between 11.88 and 15.85. These values indicatealmost identical spatial behaviors.
The total weight of grain, which indicates the economic yield, had a moderate–weakspatial correlation, as seen in Figure 3. This may result from the self-buffering capacity ofwheat yield. Buffering capacity in this sense indicates the capacity of wheat grains to resistchanges in the production factors.
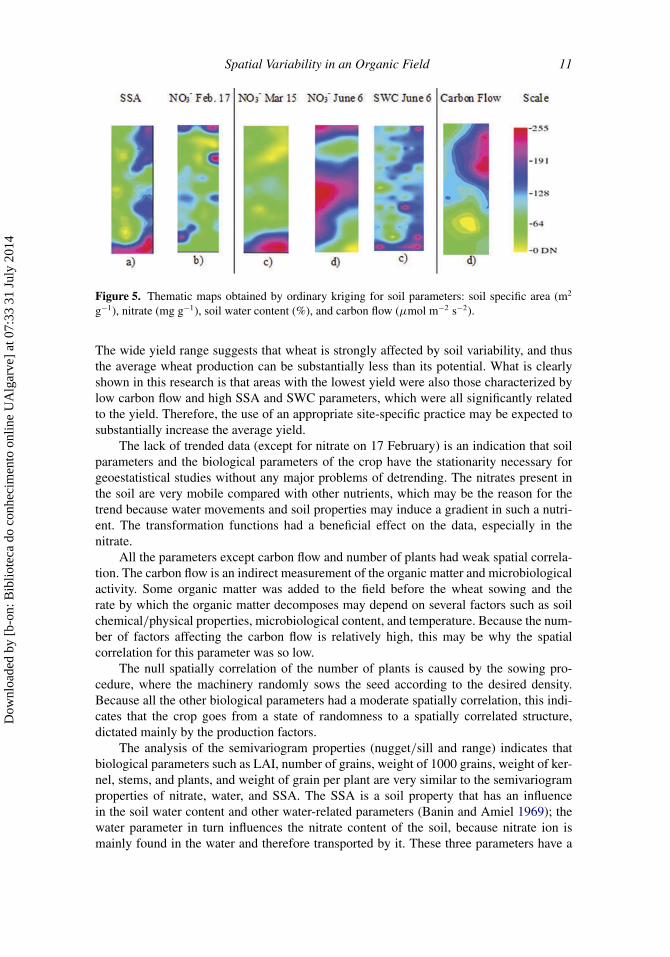
Yield maps and soil parameters obtained by ordinary kriging are displayed in Figures 4and 5. The LAI was greater in the southern part of the field in the February measurementbut became patchy in the March measurement. Number of stems and total grain weightwere greater at the northwestern part of the field but kernel weight and stems weight weregreater at the southeastern part of the field. Yield changed considerably across the fieldwith the lowest values reaching 1.11 Mg ha−1 in the southwestern part to 2.84 Mg ha−1
Dow
nloa
ded
by [
b-on
: Bib
liote
ca d
o co
nhec
imen
to o
nlin
e U
Alg
arve
] at
07:
33 3
1 Ju
ly 2
014
Tabl
e3
Res
ults
ofth
ese
miv
ario
gram
sof
the
diff
eren
tpar
amet
ers
and
spat
iald
epen
denc
e(t
heun
itsof
the
nugg
etan
dsi
llde
pend
onth
epa
ram
eter
and
the
tran
sfor
mat
ion
func
tion)
Para
met
erN
ugge
tSi
llR
ange
(m)
Mod
elN
/S
Spat
iald
epen
denc
e
Soil
spec
ific
area
7.94
E-7
1.86
E-6
50Sp
heri
cal
0.43
Mod
erat
e—st
rong
Nitr
ate
reco
rded
17Fe
brua
ry1.
22E
-34.
83E
-315
.85
Exp
onen
tial
0.25
Mod
erat
e—st
rong
Nitr
ate
reco
rded
15M
arch
2.42
E-3
3.60
E-3
64.2
5E
xpon
entia
l0.
67M
oder
ate—
wea
kN
itrat
ere
cord
ed6
June
0.01
0.02
796.
2E
xpon
entia
l0.
48M
oder
ate—
stro
ngSW
Cre
cord
ed17
Febr
uary
131.
1938
8.02
11.8
8E
xpon
entia
l0.
34M
oder
ate—
stro
ngSW
Cre
cord
ed15
Mar
ch23
9.74
394.
739
.33
Exp
onen
tial
0.61
Mod
erat
e—w
eak
SWC
reco
rded
6Ju
ne0.
020.
0610
.79
Exp
onen
tial
0.35
Mod
erat
e—st
rong
Car
bon
flow
0.19
0.22
48.5
9E
xpon
entia
l0.
88W
eak
LA
Ire
cord
ed17
Febr
uary
0.02
0.05
43.1
4E
xpon
entia
l0.
3M
oder
ate—
stro
ngL
AI
reco
rded
15M
arch
7.06
24.4
513
.76
Exp
onen
tial
0.29
Mod
erat
e—st
rong
Num
ber
ofgr
ains
4.91
9.41
59.7
5Sp
heri
cal
0.52
Mod
erat
e—w
eak
Num
ber
ofpl
ants
0.55
——
Nug
get
—N
one
Wei
ghto
f10
00gr
ains
1.00
E-6
4946
34.2
6.58
Exp
onen
tial
0.00
Stro
ngTo
talw
eigh
tof
grai
n48
.56
69.7
215
8.64
Sphe
rica
l0.
69M
oder
ate—
wea
kW
eigh
tof
kern
el0.
050.
248
.89
Exp
onen
tial
0.25
Mod
erat
e—st
rong
Wei
ghto
fst
ems
0.66
1.39
12.0
1E
xpon
entia
l0.
48M
oder
ate—
stro
ngW
eigh
tof
plan
ts0.
080.
1819
.08
Exp
onen
tial
0.42
Mod
erat
e—st
rong
Wei
ghto
fgr
ain
per
plan
t0.
080.
2260
.69
Sphe
rica
l0.
35M
oder
ate—
stro
ng
9
Dow
nloa
ded
by [
b-on
: Bib
liote
ca d
o co
nhec
imen
to o
nlin
e U
Alg
arve
] at
07:
33 3
1 Ju
ly 2
014
10 T. Panagopoulos et al.
Figure 3. Semivariograms of standardized data and fitted models for yield and soil parameters.
Figure 4. Thematic maps obtained by ordinary kriging for yield components: leaf area index,number of grains, and grain, kernel, and stem weights (g).
in the northeastern part of the study field. The maps of soil parameters showed increas-ing or decreasing values in one or two principal directions; specifically soil specific areawas lower in north, increasing gradually to the south, and carbon flow was greater inthe northeast, decreasing gradually to the southwest. In contrast, nitrate in the sampletaken on 17 February and soil water content (Figure 5) showed more prevalent patchydistributions.
Discussion
Recording the variation in small fields of conventional agriculture was the objective ofseveral studies (Mallarino, Oyarzabal, and Hinz 1999; Cambardella et al. 1994); however,only in some cases was crop yield related to the soil parameters (Stafford et al. 1996).
Dow
nloa
ded
by [
b-on
: Bib
liote
ca d
o co
nhec
imen
to o
nlin
e U
Alg
arve
] at
07:
33 3
1 Ju
ly 2
014
Spatial Variability in an Organic Field 11
Figure 5. Thematic maps obtained by ordinary kriging for soil parameters: soil specific area (m2
g−1), nitrate (mg g−1), soil water content (%), and carbon flow (μmol m−2 s−2).
The wide yield range suggests that wheat is strongly affected by soil variability, and thusthe average wheat production can be substantially less than its potential. What is clearlyshown in this research is that areas with the lowest yield were also those characterized bylow carbon flow and high SSA and SWC parameters, which were all significantly relatedto the yield. Therefore, the use of an appropriate site-specific practice may be expected tosubstantially increase the average yield.
The lack of trended data (except for nitrate on 17 February) is an indication that soilparameters and the biological parameters of the crop have the stationarity necessary forgeoestatistical studies without any major problems of detrending. The nitrates present inthe soil are very mobile compared with other nutrients, which may be the reason for thetrend because water movements and soil properties may induce a gradient in such a nutri-ent. The transformation functions had a beneficial effect on the data, especially in thenitrate.
All the parameters except carbon flow and number of plants had weak spatial correla-tion. The carbon flow is an indirect measurement of the organic matter and microbiologicalactivity. Some organic matter was added to the field before the wheat sowing and therate by which the organic matter decomposes may depend on several factors such as soilchemical/physical properties, microbiological content, and temperature. Because the num-ber of factors affecting the carbon flow is relatively high, this may be why the spatialcorrelation for this parameter was so low.
The null spatially correlation of the number of plants is caused by the sowing pro-cedure, where the machinery randomly sows the seed according to the desired density.Because all the other biological parameters had a moderate spatially correlation, this indi-cates that the crop goes from a state of randomness to a spatially correlated structure,dictated mainly by the production factors.
The analysis of the semivariogram properties (nugget/sill and range) indicates thatbiological parameters such as LAI, number of grains, weight of 1000 grains, weight of ker-nel, stems, and plants, and weight of grain per plant are very similar to the semivariogramproperties of nitrate, water, and SSA. The SSA is a soil property that has an influencein the soil water content and other water-related parameters (Banin and Amiel 1969); thewater parameter in turn influences the nitrate content of the soil, because nitrate ion ismainly found in the water and therefore transported by it. These three parameters have a
Dow
nloa
ded
by [
b-on
: Bib
liote
ca d
o co
nhec
imen
to o
nlin
e U
Alg
arve
] at
07:
33 3
1 Ju
ly 2
014
12 T. Panagopoulos et al.
considerable influence in the biological development of the crop and therefore the spatialsimilarities between the two groups of parameters.
Aside from the space relation there was also a temporal relation between thesemivariogram; for example, the spatial variances of water and nitrate on 17 Februaryare later reflected in the LAI (biomass and development of the crop) on 15 March. Oneimportant parameter that does not have an important spatial correlation and relation toother parameters is the total weight of grain, which indicates that there is a strong buffereffect on the seed production on the behavior of the plant. This indicates a genetic abil-ity for a standardization of the quantity of grain produced but not its quality because theparameter weight of 1000 grains was spatially correlated. Some parameters change gradu-ally across the field (such as nitrate and carbon flow in Figure 5), whereas others showeda patchy distribution (such as SWC in Figure 5). This can only be partly revealed usingstandard deviation; however, semivariograms enable assessment of spatial dependencesand development of an accurate site-specific application scheme (Lopez-Granados et al.2002). Therefore, the feasibility of precision farming applications may increase with thedegree of spatial dependence. In this research, some soil parameters such as SSA, SWC,and nitrate were determined to be strongly or moderately spatially dependent except car-bon flow, whereas the yield factors showed strong spatial dependence except of number ofgrains and total weight of grain (Table 3). The easiest ways to increase wheat yield wouldbe site-specific applications of manure and homogenization and improvement of SWC.
The spatial analysis of production factors and yield parameters is significant in organicagriculture as shown by the semivariogram analysis of the measured parameters and theirrelations. The semivariograms and properties can be used to determine the actual variabilityand spatial correlation of several production and yield parameters and future behavior ofthe crop. Yield variation was considered very relevant in a similar case study of winterwheat (Vrindts et al. 2003). In this case, yield was affected by chemical components andparticularly phosphorus. In the present research the considerable variation in biomass yieldacross the field was associated with a parallel variation of various soil components andparticularly SWC. Soil nitrate has been shown to not be the main determinant of spatialvariation of yield in annual crops, as it was in other studies (Ferrise et al. 2010; Vrindtset al. 2003). The results of our study showed that soil water content was the most limitingfactor, affecting spatial variation of yield and therefore reducing the effect of nitrate on thecrop, which confirms previous studies in Mediterranean environment (Basso et al. 2009).
Conclusions
Kriging methodology was useful in describing the spatial distribution pattern of variance,which can only be roughly understood by descriptive statistics. The present study provedthat spatial analysis of production factors and yield parameters is significant in organicagriculture. Consequently, some site-specific applications could be expected to improve theyield, without excessively increasing the cost for farmers and at the same time enhancingenvironmental and economic benefits.
This research on wheat yield spatial variation showed that yield may considerablyvary in organic farming, even within a small field. Wheat yield varied from 1.11 to morethan 2.84 Mg ha−1. This remarkable variation indicates that the potential for increasingwheat productivity is a real prospect. This study showed that soil water content was themain factor affecting spatial variation of yield. The range of yield varied between 6.58 mand 60.69 m and in the production factors varied between 10.79 m and 64.25 m. Soilparameters varied greatly across the field and yield was significantly related to nearly all of
Dow
nloa
ded
by [
b-on
: Bib
liote
ca d
o co
nhec
imen
to o
nlin
e U
Alg
arve
] at
07:
33 3
1 Ju
ly 2
014
Spatial Variability in an Organic Field 13
them. Temporal relations were found among soil nitrate concentration, soil water content,and LAI. The spatial dependence of carbon flow could not be clearly identified at thissampling level, and further research is needed to define more reliable semivariograms.
References
Abad, A., J. Lloveras, and A. Michelena. 2004. Nitrogen fertilization and foliar urea effects on durumwheat yield and quality and on residual soil nitrate in irrigated Mediterranean conditions. FieldCrops Research 87:257–269.
Baethgen, W., C. Christianson, and A. Lamothe. 1995, Nitrogen fertilizer effects on growth, grainyield, and yield components of malting barley. Fields Crops Research 43:87–99.
Banin, A., and A. Amiel. 1969. A Correlative study of the chemical and physical properties of agroup of natural soils of Israel. Geoderma 3:185–198.
Basso, B., D. Cammarano, D. Chen, G. Cafiero, M. Amato, G. Bitella, R. Rossi, and F. Basso.2009. Landscape position and precipitation effects on spatial variability of wheat yield andgrain protein in southern Italy. Journal of Agronomy and Crop Science 195:301–312.
Bresler, E. 1989. Estimation of statistical moments of spatial fields averages for soil properties andcrop yields. Soil Science Society of America Journal 53:1645–1643.
Bresler, E., G. Dagan, and R. Hanks. 1982. Statistical analysis of crop yield under controlled line-source irrigation. Soil Science Society of America Journal 46:841–847.
Cambardella, C., T. Moorman, J. Novak, T. Parkin, D. Karlen, R. Turco, and A. Konopka. 1994.Field-scale variability of soil properties in central Iowa soils. Soil Science Society of AmericaJournal 58:1501–1511.
Cressie, N. 1993. Statistics for spatial data. Hoboken, N.J.: John Wiley & Sons.Dalgaard, P. 2002. Introductory statistics. New York: Springer-VerlagEltanawy, I., and P. Arnold. 1973. Reappraisal of ethylene glycol mono-ethyl ether (EGME) method
for surface area estimations of clays. Journal of Soil Science 24:232–238.Ferrise, R. A. Triossi, P. Stratonovitch, M. Bindia, and P. Martre. 2010. Sowing date and nitrogen
fertilisation effects on dry matter and nitrogen dynamics for durum wheat: An experimental andsimulation study. Field Crops Research 117:245–257.
Flink, M., P. Pettersson, and O. Andrén. 1995. Growth dynamics of winter wheat in the field withdaily fertilization and irrigation. Journal of Agronomy and Crop Science 174:239–252.
Goovaerts, P. 2000. Geostatistical approaches for incorporating elevation into the spatial interpolationof rainfall. Journal of Hydrology 228:113–129.
Hicks, H., K. Stanley, and J. Robert. 1995. Estimation of leaf area index for cotton canopies usingthe LI-COR LAI-2000 Plant Canopy Analyzer. Agrnomy Journal 87:458–464.
Isaaks, E., R. Srivastava. 1989. An introduction to applied geostatistics. New York: Oxford UniversityPress.
Leilah, A., and S. Al-Khateeb. 2005. Statistical analysis of wheat yield under drought conditions.Journal of Arid Environments 61:483–496.
Lopez-Granados, F., M. Jurado-Exposito, S. Atenciano, A. GarcıaFerrer, M. Sanchez de la Orden,and L. Garcıa-Torres. 2002. Spatial variability of agricultural soil parameters in southern Spain.Plant and Soil 246:97–105.
Mader, P., A. Fliessbach, D. Dubois, L. Gunst, P. Fried, and U. Niggli. 2002. Soil fertility andbiodiversity in organic farming. Science 296 (5573): 1694–1697.
Mallarino, A. P., E. S. Oyarzabal, and P. N. Hinz. 1999. Interpreting within-field relationshipsbetween crop yields and soil and plant variables using factor analysis. Precision Agriculture1:15–26.
Morf, W. 1981. The principles of ion-selective electrodes and of membrane transport. Amsterdam,the Netherlands: Elsevier.
Panagopoulos, T., and M. D. C. Antunes. 2008. Integrating geostatistics and GIS for assessment oferosion risk on low density Quercus suber woodlands of South Portugal. Arid Land ResearchManagement 22:159–177.
Dow
nloa
ded
by [
b-on
: Bib
liote
ca d
o co
nhec
imen
to o
nlin
e U
Alg
arve
] at
07:
33 3
1 Ju
ly 2
014
14 T. Panagopoulos et al.
Panagopoulos, T., J. Jesus, M. D. C. Antunes, and J. Beltrão. 2006 Analysis of spatial interpolationfor optimising management of a salinized field cultivated with lettuce. European Journal ofAgronomy 24:1–10.
Roel, A., and R. Plant. 2004. Spatial analysis of rice yield variability in two California fields.Agronomy Journal 96:77–90.
Rohner-Thielen, E. 2005. Organic farming in Europe: Statistics in focus (Agriculture and Fisheries31/2005). Luxembourg: Eurostat.
Stafford, J. V., B. Ambler, R. M. Lark, and J. Catt. 1996. Mapping and interpreting the yield variationin cereal crops. Computers and Electronics in Agriculture 14:101–119.
Van Meirvenne, M. 2003. Is the soil variability within small fields of Flanders structured enough toallow precision agriculture? Precision Agriculture 4:193–201.
Virgilio, N., A. Monti, and G. Venturi. 2007. Spatial variability of switchgrass (Panicum virgatumL.) yield as related to soil parameters in a small field. Field Crops Research 101:232–239.
Vogl, C., L. Kilcher, and H. Schmidt. 2005. Are standards and regulations of organic farming movingaway from small farmers’ knowledge? Journal of Sustainable Agriculture 26:5–26.
Vrindts, E., M. Reyniers, P. Darius, J. De Baerdemaeker, M. Gilot, Y. Sadaoui, M. Frankinet, B.Hanquet, and M. F. Destain. 2003. Analysis of soil and crop properties for precision agriculturefor winter wheat. Biosystems Engineering 85:141–152.
Webster, R., and M. Oliver. 1990. Statistical methods in soil and land resource survey. New York:Oxford University Press.
Welles, J., T. Demetriades-Shah, and D. McDermitt. 2001. Considerations for measuring ground CO2
effluxes with chambers. Chemical Geology 177:3–13.Zhang, N., W. Maohua, and N. Wang. 2002. Precision agriculture: A worldwide overview. Computers
and Electronics in Agriculture 36:113–132.
Dow
nloa
ded
by [
b-on
: Bib
liote
ca d
o co
nhec
imen
to o
nlin
e U
Alg
arve
] at
07:
33 3
1 Ju
ly 2
014
Related Documents


