PLEASE SCROLL DOWN FOR ARTICLE This article was downloaded by: [CEH Wallingford] On: 26 April 2010 Access details: Access Details: [subscription number 919035460] Publisher Taylor & Francis Informa Ltd Registered in England and Wales Registered Number: 1072954 Registered office: Mortimer House, 37- 41 Mortimer Street, London W1T 3JH, UK Hydrological Sciences Journal Publication details, including instructions for authors and subscription information: http://www.informaworld.com/smpp/title~content=t911751996 Spatial variability of precipitation regimes over Turkey Faize Sariş ab ; David M. Hannah a ;Warren J. Eastwood a a School of Geography, Earth and Environmental Sciences, University of Birmingham, Edgbaston, Birmingham, UK b Department of Geography, Faculty of Sciences and Arts, Çanakkale Onsekiz Mart University, Çanakkale, Turkey Online publication date: 24 March 2010 To cite this Article Sariş, Faize , Hannah, David M. andEastwood, Warren J.(2010) 'Spatial variability of precipitation regimes over Turkey', Hydrological Sciences Journal, 55: 2, 234 — 249 To link to this Article: DOI: 10.1080/02626660903546142 URL: http://dx.doi.org/10.1080/02626660903546142 Full terms and conditions of use: http://www.informaworld.com/terms-and-conditions-of-access.pdf This article may be used for research, teaching and private study purposes. Any substantial or systematic reproduction, re-distribution, re-selling, loan or sub-licensing, systematic supply or distribution in any form to anyone is expressly forbidden. The publisher does not give any warranty express or implied or make any representation that the contents will be complete or accurate or up to date. The accuracy of any instructions, formulae and drug doses should be independently verified with primary sources. The publisher shall not be liable for any loss, actions, claims, proceedings, demand or costs or damages whatsoever or howsoever caused arising directly or indirectly in connection with or arising out of the use of this material.

Welcome message from author
This document is posted to help you gain knowledge. Please leave a comment to let me know what you think about it! Share it to your friends and learn new things together.
Transcript
PLEASE SCROLL DOWN FOR ARTICLE
This article was downloaded by: [CEH Wallingford]On: 26 April 2010Access details: Access Details: [subscription number 919035460]Publisher Taylor & FrancisInforma Ltd Registered in England and Wales Registered Number: 1072954 Registered office: Mortimer House, 37-41 Mortimer Street, London W1T 3JH, UK
Hydrological Sciences JournalPublication details, including instructions for authors and subscription information:http://www.informaworld.com/smpp/title~content=t911751996
Spatial variability of precipitation regimes over TurkeyFaize Sariş ab; David M. Hannah a;Warren J. Eastwood a
a School of Geography, Earth and Environmental Sciences, University of Birmingham, Edgbaston,Birmingham, UK b Department of Geography, Faculty of Sciences and Arts, Çanakkale Onsekiz MartUniversity, Çanakkale, Turkey
Online publication date: 24 March 2010
To cite this Article Sariş, Faize , Hannah, David M. andEastwood, Warren J.(2010) 'Spatial variability of precipitationregimes over Turkey', Hydrological Sciences Journal, 55: 2, 234 — 249To link to this Article: DOI: 10.1080/02626660903546142URL: http://dx.doi.org/10.1080/02626660903546142
Full terms and conditions of use: http://www.informaworld.com/terms-and-conditions-of-access.pdf
This article may be used for research, teaching and private study purposes. Any substantial orsystematic reproduction, re-distribution, re-selling, loan or sub-licensing, systematic supply ordistribution in any form to anyone is expressly forbidden.
The publisher does not give any warranty express or implied or make any representation that the contentswill be complete or accurate or up to date. The accuracy of any instructions, formulae and drug dosesshould be independently verified with primary sources. The publisher shall not be liable for any loss,actions, claims, proceedings, demand or costs or damages whatsoever or howsoever caused arising directlyor indirectly in connection with or arising out of the use of this material.
234 Hydrological Sciences Journal – Journal des Sciences Hydrologiques, 55(2) 2010
ISSN 0262-6667 print/ISSN 2150-3435 online© 2010 IAHS Pressdoi:10.1080/02626660903546142http://www.informaworld.com
THSJ
Spatial variability of precipitation regimes over Turkey
Spatial variability of precipitation regimes over TurkeyFaize Saris1,2, David M. Hannah1 & Warren J. Eastwood1
1School of Geography, Earth and Environmental Sciences, University of Birmingham, Edgbaston, Birmingham B15 2TT, [email protected] of Geography, Faculty of Sciences and Arts, Çanakkale Onsekiz Mart University, Çanakkale 17020, Turkey
Received 20 March 2009; accepted 13 August 2009; Open for discussion until 1 September 2010
Citation Saris, F., Hannah, D. M. & Eastwood, W. J. (2010) Spatial variability of precipitation regimes over Turkey. Hydrol. Sci. J.55(2), 234–249.
Abstract Turkish annual precipitation regimes are analysed to provide a large-scale perspective and redefineprecipitation regions. Monthly total precipitation data are employed for 107 stations (1963–2002). Precipitationregime shape (seasonality) and magnitude (size) are classified using a novel multivariate methodology. Six shapeand five magnitude classes are identified, which exhibit clear spatial structure. A composite (shape andmagnitude) regime classification reveals dominant controls on spatial variability of precipitation. Intra-annualtiming and magnitude of precipitation is highly variable due to seasonal shifts in Polar and sub-Tropical zonesand physiographic factors. Nonetheless, the classification methodology is shown to be a powerful tool thatidentifies physically-interpretable precipitation regions: (1) coastal regimes for Marmara, coastal Aegean,Mediterranean and Black Sea; (2) transitional regimes in continental Aegean and Southeast Anatolia; and(3) inland regimes across Central and Eastern Anatolia. This research has practical implications forunderstanding water resources, which are under ever growing pressure in Turkey.Key words precipitation climatology; rainfall; regimes; regionalization; classification; Turkey
Variabilité spatiale des régimes de précipitation en TurquieRésumé Les régimes de précipitation annuelle de Turquie sont analysés dans le but d’avoir une perspective àgrande échelle et de redéfinir les régions de précipitation. Les données de précipitation mensuelle cumulée de107 stations (1963–2002) sont utilisées. La forme (saisonnalité) et la magnitude (taille) du régime deprécipitation sont classifiées à l’aide d’une nouvelle méthodologie multivariée. Six classes de forme et cinqclasses de magnitude sont identifiées, ce qui met en évidence une structure spatiale nette. Une classificationdu régime composite (forme et magnitude) révèle les contrôles dominants de la variabilité spatiale desprécipitations. La temporalité intra-annuelle et la magnitude des précipitations sont hautement variables enraison de changements saisonniers dans les zones Polaire et sub-Tropicale et de facteurs physiographiques.Néanmoins, la méthodologie de classification apparaît être un puissant outil pour identifier des régions deprécipitation permettant une interprétation physique: (1) les régimes côtiers des Mers de Marmara, Egée,Méditerranée et Noire; (2) des régimes transitoires dans la zone Egéenne continentale et dans le sud-est del’Anatolie; et (3) des régimes continentaux en Anatolie centrale et orientale. Cette recherche a desimplications pratiques pour la compréhension des ressources en eau, qui sont de plus en plus sollicitées enTurquie.Mots clefs climatologie des précipitations; pluie; régimes; régionalisation; classification; Turquie
1 INTRODUCTION
Spatial variability of precipitation regimes hasprofound effects on water resources, aridity anddesertification conditions (e.g. Frederick & Major,1997; Kansakar et al., 2004; Xoplaki et al., 2004).The spatial structure of precipitation requires robustanalysis to elucidate dominant patterns of variability,to regionalize areas with similar precipitation pat-terns, and to understand the factors and processes
driving emergent distributions. Therefore, the currentunderstanding of precipitation variability should beimproved by new research and development of ana-lytical methods for large countries/regions, such asTurkey, which are characterized by climatic andphysiographic complexity.
For Turkey, Türkes (1996) explored the seasonalvariability in spatial patterns of mean annual rainfalltotals and identified geographical factors influencingthese distributions. That work divided Turkey into
Downloaded By: [CEH Wallingford] At: 09:05 26 April 2010
Spatial variability of precipitation regimes over Turkey 235
seven rainfall regions, based primarily on an index ofseasonality (i.e. calendar season percentage of annualtotal rainfall). Türkes (1998) refined the rainfall cli-matology of Turkey, showing: (a) the Mediterraneancoast with a marked seasonal regime and peak winterrainfall; (b) the Black Sea coast with rainfall rela-tively uniform across the year; (c) the continentalinterior with spring rainfall maxima; and (d) northeastAnatolia with peak rainfall in spring–summer.Kadioglu et al. (1999) and Kadioglu (2000) investi-gated precipitation patterns across Turkey usingharmonic and principal component analyses, respec-tively. Kadioglu et al. (1999) found the first andsecond harmonics explained >90% of the variation inprecipitation, and suggested maximum precipitationoccurs in December or January, and minimum inAugust or July, across all of Turkey (cf. Türkes,1996, 1998). Kadioglu (2000) used principal compo-nents (PCs) to identify spatial patterns and controlsof precipitation. Retained PCs were interpreted torepresent: (PC1) synoptic weather systems influenc-ing all of Turkey; (PC2) continentality in Anatoliaand the effect of mountains in eastern Turkey; and(PC3) maritime influence around the coasts. Sen &Habib (2000) developed an optimum spatial interpo-lation method for monthly precipitation data acrossTurkey, which detected two regional trends not iden-tified previously: (1) maxima in the southwest duringNovember to April, and (2) maxima in the north andnortheast during May–October. Most recently, Ünalet al. (2003) applied cluster analysis to monthly aver-age, maximum and minimum temperature andmonthly total precipitation records to define homo-geneous climate regions of Turkey. Their researchcompared five clustering algorithms; each algorithmyielded seven climate zones, but with considerabledifferences in regional boundaries between algo-rithms. However, no physical interpretation of theseregions was provided by Ünal et al. (2003).
Hence, previous research on pan-Turkey precip-itation patterns has yielded somewhat inconsistentfindings, due, at least in part, to the application of arange of methods to different data sets (in terms ofspatial coverage and time span). To date, analysis ofspatial patterns has focused on year-to-year variationin annual totals or seasonal indices, or used monthlydata to identify timing of precipitation maxima orminima. Thus, there is a need for detailed study ofthe intra-annual cycle (regime) of precipitationacross Turkey, which investigates systematically(and jointly) the spatial variation in both magnitude
and timing of precipitation. Such research is neces-sary to provide finer-scale information of onset andcessation of wet and dry periods and a basis for morerobust regionalization of spatial structure in precipi-tation regime, which in turn will advance understand-ing of the complexity in, and processes driving, theprecipitation climatology of Turkey.
This paper aims to characterize the nature anddynamics of precipitation regimes across Turkeyand, thus, to elucidate the key controlling factorsupon spatial patterns in intra-annual precipitationbehaviour. This aim is achieved through the follow-ing specific objectives: (a) to test a classificationscheme that identifies the shape (timing) and magni-tude (size) of annual precipitation regimes; (b) toidentify precipitation regime regions across Turkey;and (c) to interpret the emergent precipitation regimeregions based on regional atmospheric circulationand the main physiographic features modifying pre-cipitation climatology.
2 STUDY AREA
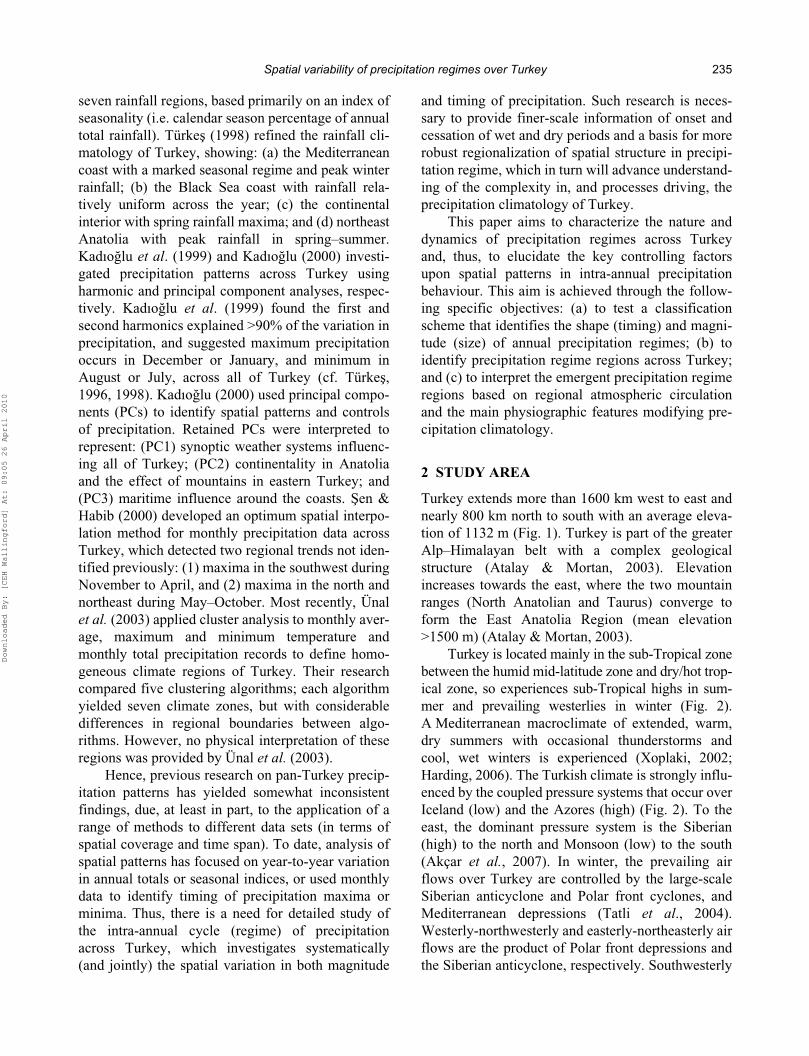
Turkey extends more than 1600 km west to east andnearly 800 km north to south with an average eleva-tion of 1132 m (Fig. 1). Turkey is part of the greaterAlp–Himalayan belt with a complex geologicalstructure (Atalay & Mortan, 2003). Elevationincreases towards the east, where the two mountainranges (North Anatolian and Taurus) converge toform the East Anatolia Region (mean elevation>1500 m) (Atalay & Mortan, 2003).
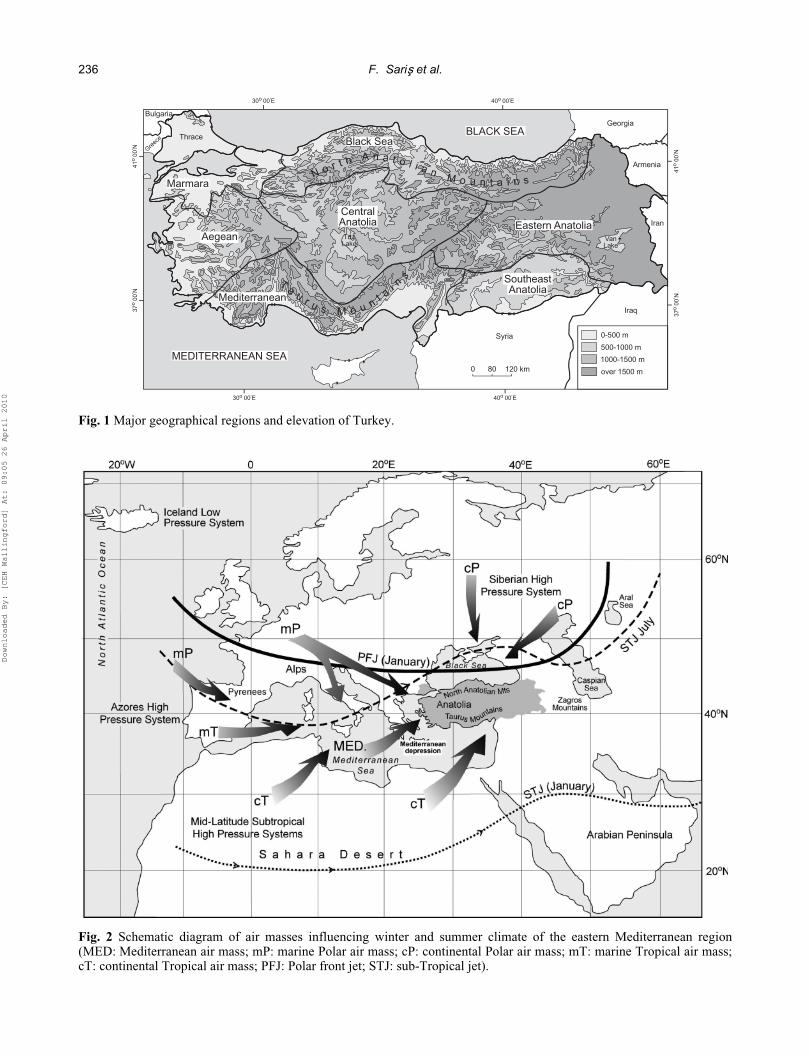
Turkey is located mainly in the sub-Tropical zonebetween the humid mid-latitude zone and dry/hot trop-ical zone, so experiences sub-Tropical highs in sum-mer and prevailing westerlies in winter (Fig. 2).A Mediterranean macroclimate of extended, warm,dry summers with occasional thunderstorms andcool, wet winters is experienced (Xoplaki, 2002;Harding, 2006). The Turkish climate is strongly influ-enced by the coupled pressure systems that occur overIceland (low) and the Azores (high) (Fig. 2). To theeast, the dominant pressure system is the Siberian(high) to the north and Monsoon (low) to the south(Akçar et al., 2007). In winter, the prevailing airflows over Turkey are controlled by the large-scaleSiberian anticyclone and Polar front cyclones, andMediterranean depressions (Tatli et al., 2004).Westerly-northwesterly and easterly-northeasterly airflows are the product of Polar front depressions andthe Siberian anticyclone, respectively. Southwesterly
Downloaded By: [CEH Wallingford] At: 09:05 26 April 2010
236 F. Saris et al.
Fig. 1 Major geographical regions and elevation of Turkey.
BLACK SEA
MEDITERRANEAN SEA
0-500 m
500-1000 m
1000-1500 m
over 1500 m0 80 120 km
tMarmara
Aegean
CentralAnatolia
Mediterranean
Black Sea
Eastern Anatolia
SoutheastAnatolia
Thrace
Bulgaria
Armenia
Iraq
Syria
TuzLake
VanLake
40o 00’E30o 00’E
30o 00’E 40o 00’E
Georgia
Iran
Fig. 2 Schematic diagram of air masses influencing winter and summer climate of the eastern Mediterranean region(MED: Mediterranean air mass; mP: marine Polar air mass; cP: continental Polar air mass; mT: marine Tropical air mass;cT: continental Tropical air mass; PFJ: Polar front jet; STJ: sub-Tropical jet).
Downloaded By: [CEH Wallingford] At: 09:05 26 April 2010
Spatial variability of precipitation regimes over Turkey 237
and southerly air flows are the product of Mediterra-nean frontal depressions (Tatli et al., 2004).
Turkey is affected by Polar and Tropical airmasses in winter and summer, respectively. The cP(continental Polar) is a continental, cold and dry airmass that originates from Siberia (Fig. 2), and whichcauses orographic rains if it becomes saturated whilecrossing the Black Sea (Akçar et al., 2007). The mP(marine Polar) air mass originates from the AtlanticOcean and travels across Europe and the Balkans. Itbecomes unstable over Turkey and causes rainfall incoastal areas (Black Sea and Marmara), and snowfallat higher elevations and in the interior. The transportof mP air into the Mediterranean basin by the Polarjet-stream, its lifting (by changes in relief) and subse-quent warming (by the Mediterranean Sea) is a majorunderlying mechanism of both Mediterranean cyclo-genesis and the creation of the “Mediterranean airmass”. The Mediterranean trajectory of mP is moreeffective than the Atlantic trajectory in terms of gen-erating rainfall (Tatli et al., 2004).
3 DATA AND METHODOLOGY
3.1 Precipitation data
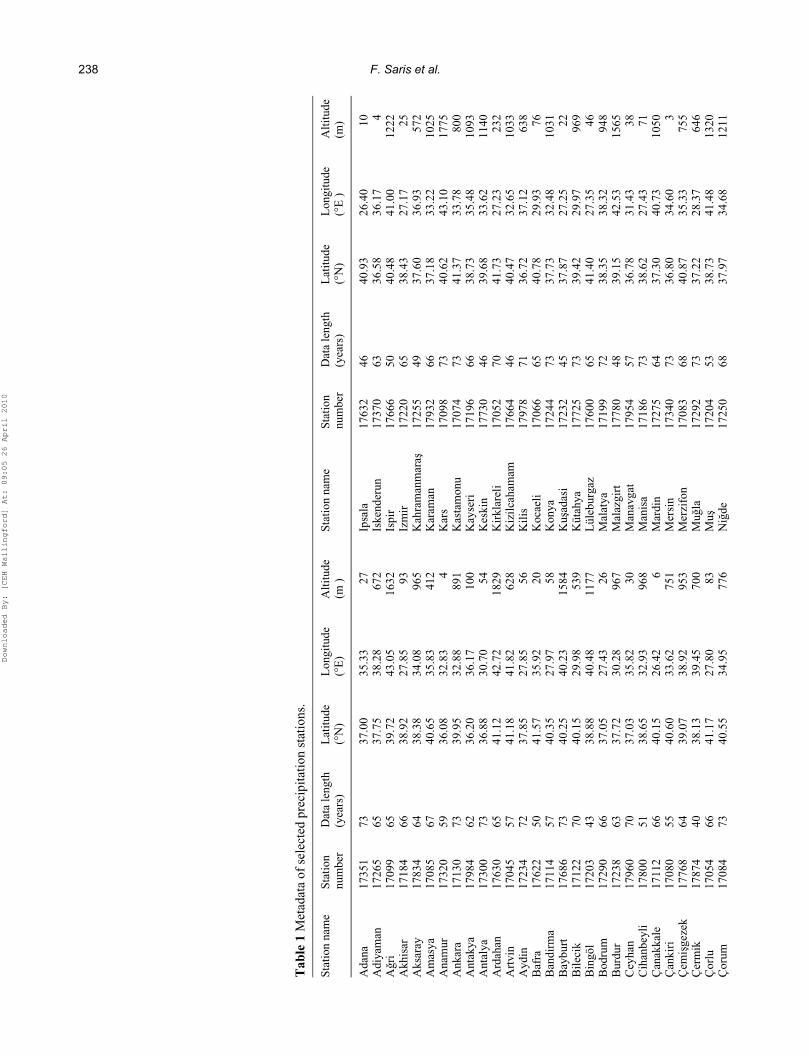
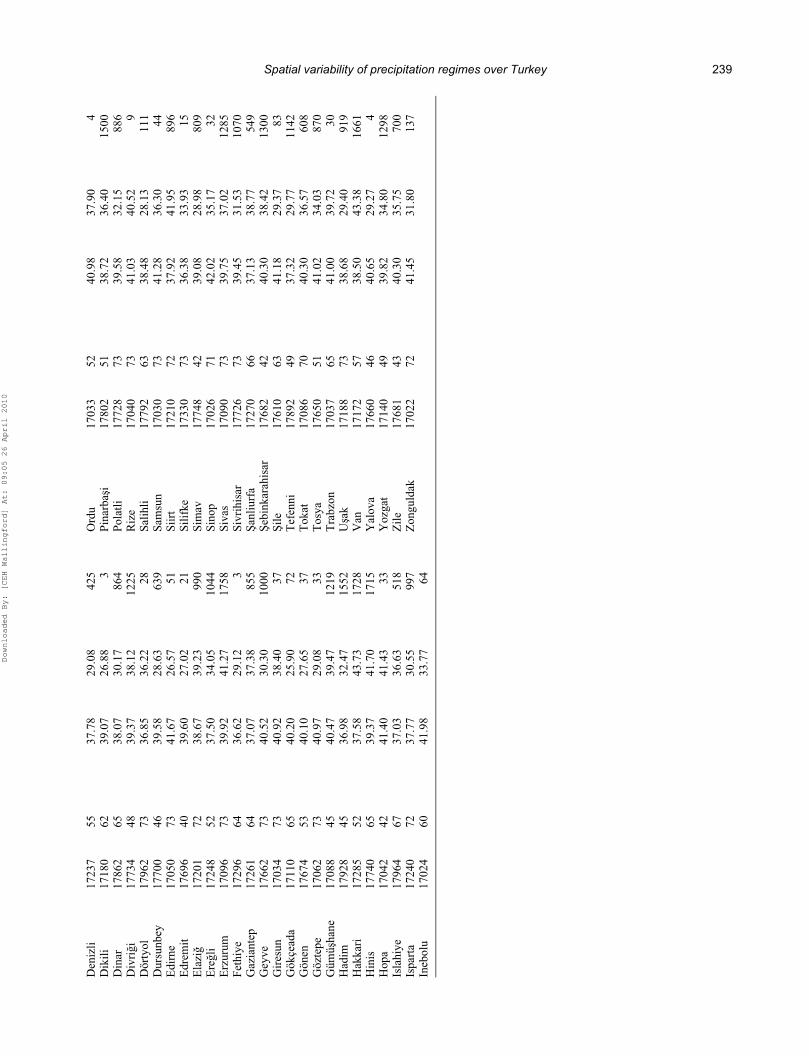
Monthly precipitation totals for 107 Turkish StateMeteorological Service (TSMS) stations are used.Table 1 provides basic metadata for stations. Thesestations were selected based on record length, and forproviding optimum spatial coverage across the coun-try. Records range from 40 to 72 years; the averagetime span is 64 years, with the earliest record startingin 1930. A 40-year overlapping record period wasidentified as 1963–2002. Homogeneity of time-serieswas checked for all 107 stations using the Kruskal-Wallis (K-W) test. For 107 stations, statistical inho-mogeneities were identified in precipitation for win-ter months. However, these statistically significantinhomogeneities are related to long-term variationsand significant trends, not step changes in the time-series (Saris, 2006; Türkes et al., 2008).
3.2 Regime classification methodology
Since it is important to assess the timing and size ofannual precipitation regimes, a methodology isadopted that uses hierarchical, agglomerative clusteranalysis to separately classify regimes according totheir “shape” and “magnitude” (devised by Hannahet al., 2000; adapted by Harris et al., 2000; evaluated
by Bower et al., 2004; Kansakar et al., 2004; andHannah et al., 2005).
The shape classification identifies stations with asimilar form of annual regime, regardless of the abso-lute magnitude. In this application, the magnitudeclassification is based upon four indices (i.e. the mean,minimum, maximum and standard deviation ofmonthly values across the 40-year record) for each sta-tion, regardless of their timing. This approach has theadvantage that these two important regime attributesmay be interpreted separately as well as jointly bysimply combining shape and magnitude classes foreach station to yield a “composite” classification.
To classify precipitation regime shape independ-ently of magnitude, the 12 long-term mean monthlyobservations were standardized on a station-by-sta-tion basis using z scores (mean = 0, standard devia-tion = 1) prior to clustering. The four magnitudeindices were derived for the long-term regime foreach station; it was necessary to standardize betweenindices (to control for differences in their relativevalues) by expressing each index as z scores acrossthe 107 stations.
For both shape and magnitude, classificationwas achieved by hierarchical, agglomerative clusteranalysis using Ward’s method. No single clusteringalgorithm is deemed universally “best”; and differentalgorithms identify different groupings. Ward’smethod was selected because it typically outperformsother algorithms in terms of separation to give rela-tively dense clusters with small within-group vari-ance (Yarnal, 1992; Griffith & Amrhein, 1997;Bower et al., 2004). Ward’s method has been widelyand successfully used in climatological studies (e.g.Stone, 1989). The structure of the cluster dendro-gram and breaks of slope in the agglomeration sched-ule (scree) plot were used to determine theappropriate number of clusters (Griffith & Amrhein,1997). Thus, each of the 107 stations was grouped byboth regime shape and magnitude, which also per-mitted composite shape and magnitude classification.The spatial distribution of the shape, magnitude andcomposite classes allowed precipitation regimeregions to be identified.
4 RESULTS AND DISCUSSION
4.1 Precipitation regime shape
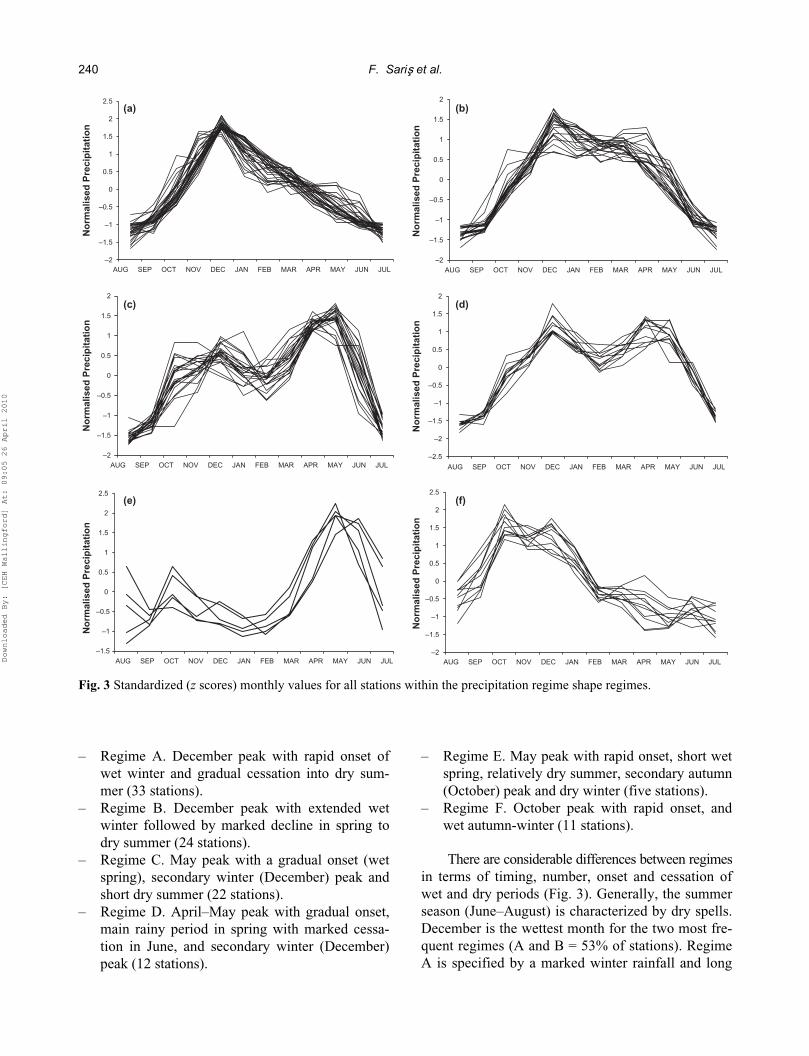
Six precipitation regime shape classes were identi-fied (Fig. 3):
Downloaded By: [CEH Wallingford] At: 09:05 26 April 2010
238 F. Saris et al.
Tab
le 1
Met
adat
a of
sel
ecte
d pr
ecip
itatio
n st
atio
ns.
Stat
ion
nam
eSt
atio
n nu
mbe
rD
ata
leng
th
(yea
rs)
Lat
itude
(°
N)
Lon
gitu
de
(°E
)A
ltitu
de
(m )
Stat
ion
nam
eSt
atio
n nu
mbe
rD
ata
leng
th
(yea
rs)
Lat
itude
(°
N)
Lon
gitu
de
(°E
)A
ltitu
de
(m)
Ada
na17
351
7337
.00
35.3
327
Ipsa
la17
632
4640
.93
26.4
010
Adi
yam
an17
265
6537
.75
38.2
867
2Is
kend
erun
1737
063
36.5
836
.17
4A
gri
1709
965
39.7
243
.05
1632
Ispi
r17
666
5040
.48
41.0
012
22A
khis
ar17
184
6638
.92
27.8
593
Izm
ir17
220
6538
.43
27.1
725
Aks
aray
1783
464
38.3
834
.08
965
Kah
ram
anm
aras
1725
549
37.6
036
.93
572
Am
asya
1708
567
40.6
535
.83
412
Kar
aman
1793
266
37.1
833
.22
1025
Ana
mur
1732
059
36.0
832
.83
4K
ars
1709
873
40.6
243
.10
1775
Ank
ara
1713
073
39.9
532
.88
891
Kas
tam
onu
1707
473
41.3
733
.78
800
Ant
akya
1798
462
36.2
036
.17
100
Kay
seri
1719
666
38.7
335
.48
1093
Ant
alya
1730
073
36.8
830
.70
54K
eski
n17
730
4639
.68
33.6
211
40A
rdah
an17
630
6541
.12
42.7
218
29K
irkl
arel
i17
052
7041
.73
27.2
323
2A
rtvi
n17
045
5741
.18
41.8
262
8K
izilc
aham
am17
664
4640
.47
32.6
510
33A
ydin
1723
472
37.8
527
.85
56K
ilis
1797
871
36.7
237
.12
638
Baf
ra17
622
5041
.57
35.9
220
Koc
aeli
1706
665
40.7
829
.93
76B
andi
rma
1711
457
40.3
527
.97
58K
onya
1724
473
37.7
332
.48
1031
Bay
burt
1768
673
40.2
540
.23
1584
Kus
adas
i17
232
4537
.87
27.2
522
Bile
cik
1712
270
40.1
529
.98
539
Küt
ahya
1772
573
39.4
229
.97
969
Bin
göl
1720
343
38.8
840
.48
1177
Lül
ebur
gaz
1760
065
41.4
027
.35
46B
odru
m17
290
6637
.05
27.4
326
Mal
atya
1719
972
38.3
538
.32
948
Bur
dur
1723
863
37.7
230
.28
967
Mal
azgi
rt17
780
4839
.15
42.5
315
65C
eyha
n17
960
7037
.03
35.8
230
Man
avga
t17
954
5736
.78
31.4
338
Cih
anbe
yli
1780
051
38.6
532
.93
968
Man
isa
1718
673
38.6
227
.43
71Ç
anak
kale
1711
266
40.1
526
.42
6M
ardi
n17
275
6437
.30
40.7
310
50Ç
anki
ri17
080
5540
.60
33.6
275
1M
ersi
n17
340
7336
.80
34.6
03
Çem
isge
zek
1776
864
39.0
738
.92
953
Mer
zifo
n17
083
6840
.87
35.3
375
5Ç
erm
ik17
874
4038
.13
39.4
570
0M
ugla
1729
273
37.2
228
.37
646
Çor
lu17
054
6641
.17
27.8
083
Mus
1720
453
38.7
341
.48
1320
Çor
um17
084
7340
.55
34.9
577
6N
igde
1725
068
37.9
734
.68
1211
Downloaded By: [CEH Wallingford] At: 09:05 26 April 2010
Spatial variability of precipitation regimes over Turkey 239
Den
izli
1723
755
37.7
829
.08
425
Ord
u17
033
5240
.98
37.9
04
Dik
ili17
180
6239
.07
26.8
83
Pina
rbas
i17
802
5138
.72
36.4
015
00D
inar
1786
265
38.0
730
.17
864
Pola
tli17
728
7339
.58
32.1
588
6D
ivri
gi17
734
4839
.37
38.1
212
25R
ize
1704
073
41.0
340
.52
9D
örty
ol17
962
7336
.85
36.2
228
Salih
li17
792
6338
.48
28.1
311
1D
ursu
nbey
1770
046
39.5
828
.63
639
Sam
sun
1703
073
41.2
836
.30
44E
dirn
e17
050
7341
.67
26.5
751
Siir
t17
210
7237
.92
41.9
589
6E
drem
it17
696
4039
.60
27.0
221
Silif
ke17
330
7336
.38
33.9
315
Ela
zig
1720
172
38.6
739
.23
990
Sim
av17
748
4239
.08
28.9
880
9E
regl
i17
248
5237
.50
34.0
510
44Si
nop
1702
671
42.0
235
.17
32E
rzur
um17
096
7339
.92
41.2
717
58Si
vas
1709
073
39.7
537
.02
1285
Feth
iye
1729
664
36.6
229
.12
3Si
vrih
isar
1772
673
39.4
531
.53
1070
Gaz
iant
ep17
261
6437
.07
37.3
885
5Sa
nliu
rfa
1727
066
37.1
338
.77
549
Gey
ve17
662
7340
.52
30.3
010
00Se
bink
arah
isar
1768
242
40.3
038
.42
1300
Gir
esun
1703
473
40.9
238
.40
37Si
le17
610
6341
.18
29.3
783
Gök
çead
a17
110
6540
.20
25.9
072
Tef
enni
1789
249
37.3
229
.77
1142
Gön
en17
674
5340
.10
27.6
537
Tok
at17
086
7040
.30
36.5
760
8G
özte
pe17
062
7340
.97
29.0
833
Tos
ya17
650
5141
.02
34.0
387
0G
ümüs
hane
1708
845
40.4
739
.47
1219
Tra
bzon
1703
765
41.0
039
.72
30H
adim
1792
845
36.9
832
.47
1552
Usa
k17
188
7338
.68
29.4
091
9H
akka
ri17
285
5237
.58
43.7
317
28V
an17
172
5738
.50
43.3
816
61H
inis
1774
065
39.3
741
.70
1715
Yal
ova
1766
046
40.6
529
.27
4H
opa
1704
242
41.4
041
.43
33Y
ozga
t17
140
4939
.82
34.8
012
98Is
lahi
ye17
964
6737
.03
36.6
351
8Z
ile17
681
4340
.30
35.7
570
0Is
part
a17
240
7237
.77
30.5
599
7Z
ongu
ldak
1702
272
41.4
531
.80
137
Ineb
olu
1702
460
41.9
833
.77
64
Downloaded By: [CEH Wallingford] At: 09:05 26 April 2010
240 F. Saris et al.
– Regime A. December peak with rapid onset ofwet winter and gradual cessation into dry sum-mer (33 stations).
– Regime B. December peak with extended wetwinter followed by marked decline in spring todry summer (24 stations).
– Regime C. May peak with a gradual onset (wetspring), secondary winter (December) peak andshort dry summer (22 stations).
– Regime D. April–May peak with gradual onset,main rainy period in spring with marked cessa-tion in June, and secondary winter (December)peak (12 stations).
– Regime E. May peak with rapid onset, short wetspring, relatively dry summer, secondary autumn(October) peak and dry winter (five stations).
– Regime F. October peak with rapid onset, andwet autumn-winter (11 stations).
There are considerable differences between regimesin terms of timing, number, onset and cessation ofwet and dry periods (Fig. 3). Generally, the summerseason (June–August) is characterized by dry spells.December is the wettest month for the two most fre-quent regimes (A and B = 53% of stations). RegimeA is specified by a marked winter rainfall and long
Fig. 3 Standardized (z scores) monthly values for all stations within the precipitation regime shape regimes.
(a)
–2
–1.5
–1
–0.5
0
0.5
1
1.5
2
2.5
No
rmal
ised
Pre
cip
itat
ion
(b)
–2
–1.5
–1
–0.5
0
0.5
1
1.5
2
AUG SEP OCT NOV DEC JAN FEB MAR APR MAY JUN JULAUG SEP OCT NOV DEC JAN FEB MAR APR MAY JUN JUL
AUG SEP OCT NOV DEC JAN FEB MAR APR MAY JUN JUL AUG SEP OCT NOV DEC JAN FEB MAR APR MAY JUN JUL
AUG SEP OCT NOV DEC JAN FEB MAR APR MAY JUN JULAUG SEP OCT NOV DEC JAN FEB MAR APR MAY JUN JUL
No
rmal
ised
Pre
cip
itat
ion
(c)
–2
–1.5
–1
–0.5
0
0.5
1
1.5
2
No
rmal
ised
Pre
cip
itat
ion
(d)
–2.5
–2
–1.5
–1
–0.5
0
0.5
1
1.5
2
No
rmal
ised
Pre
cip
itat
ion
(e)
–1.5
–1
–0.5
0
0.5
1
1.5
2
2.5
No
rmal
ised
Pre
cip
itat
ion
(f)
–2
–1.5
–1
–0.5
0
0.5
1
1.5
2
2.5
No
rmal
ised
Pre
cip
itat
ion
Downloaded By: [CEH Wallingford] At: 09:05 26 April 2010
Spatial variability of precipitation regimes over Turkey 241
dry period. Similarly, Regime B has a wet winter butrainfall extends into spring. Regime C has a wetspring with a May peak and a relatively rainy winter;with a clear decline of rainfall in June. Regime D hastwo wet periods: April–May and December. RegimeE is distinctive due to a May peak and long dryspells, especially in winter. Regime F is differentfrom other shape classes, largely because of the rainyautumn, October peak and relatively dry spring.
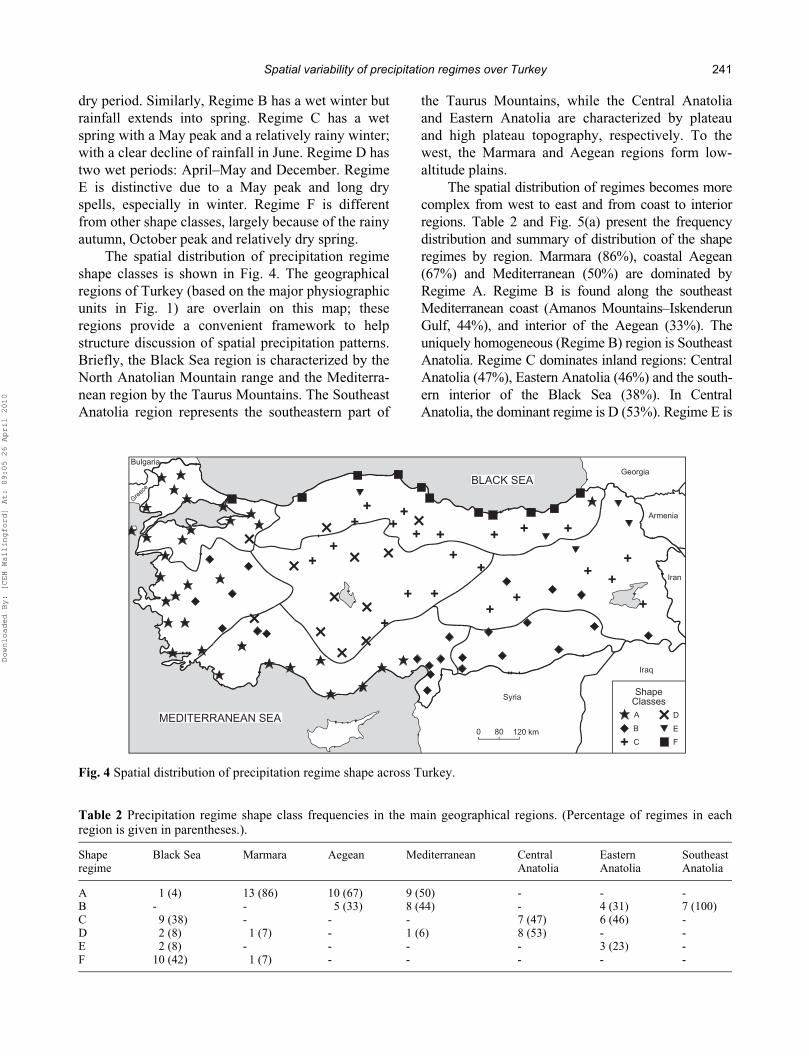
The spatial distribution of precipitation regimeshape classes is shown in Fig. 4. The geographicalregions of Turkey (based on the major physiographicunits in Fig. 1) are overlain on this map; theseregions provide a convenient framework to helpstructure discussion of spatial precipitation patterns.Briefly, the Black Sea region is characterized by theNorth Anatolian Mountain range and the Mediterra-nean region by the Taurus Mountains. The SoutheastAnatolia region represents the southeastern part of
the Taurus Mountains, while the Central Anatoliaand Eastern Anatolia are characterized by plateauand high plateau topography, respectively. To thewest, the Marmara and Aegean regions form low-altitude plains.
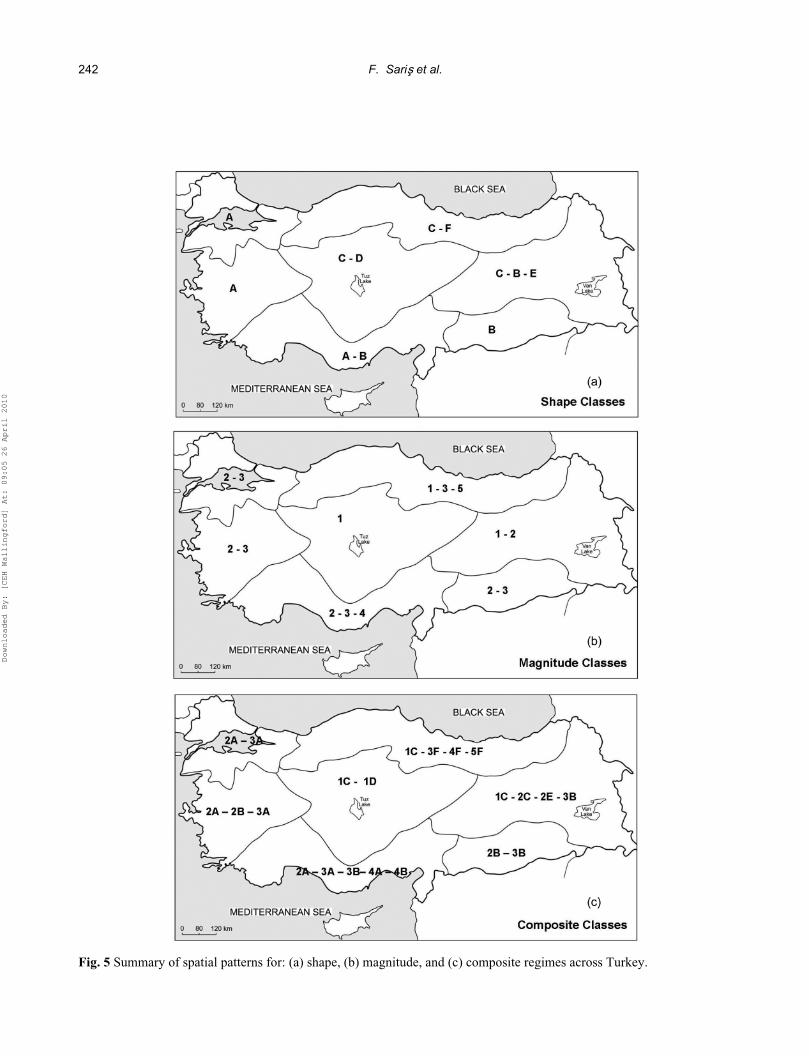
The spatial distribution of regimes becomes morecomplex from west to east and from coast to interiorregions. Table 2 and Fig. 5(a) present the frequencydistribution and summary of distribution of the shaperegimes by region. Marmara (86%), coastal Aegean(67%) and Mediterranean (50%) are dominated byRegime A. Regime B is found along the southeastMediterranean coast (Amanos Mountains–IskenderunGulf, 44%), and interior of the Aegean (33%). Theuniquely homogeneous (Regime B) region is SoutheastAnatolia. Regime C dominates inland regions: CentralAnatolia (47%), Eastern Anatolia (46%) and the south-ern interior of the Black Sea (38%). In CentralAnatolia, the dominant regime is D (53%). Regime E is
Fig. 4 Spatial distribution of precipitation regime shape across Turkey.
+ +++
++
+
++
+
+
++
++
+
+ +
++
+
+
A
B
C
D
E
F
ShapeClasses
0 80 120 km
Bulgaria
Armenia
Iraq
Syria
+
BLACK SEA
MEDITERRANEAN SEA
Georgia
Iran
Table 2 Precipitation regime shape class frequencies in the main geographical regions. (Percentage of regimes in eachregion is given in parentheses.).
Shape regime
Black Sea Marmara Aegean Mediterranean Central Anatolia
Eastern Anatolia
Southeast Anatolia
A 1 (4) 13 (86) 10 (67) 9 (50) - - -B - - 5 (33) 8 (44) - 4 (31) 7 (100)C 9 (38) - - - 7 (47) 6 (46) -D 2 (8) 1 (7) - 1 (6) 8 (53) - -E 2 (8) - - - - 3 (23) -F 10 (42) 1 (7) - - - - -
Downloaded By: [CEH Wallingford] At: 09:05 26 April 2010
242 F. Saris et al.
Fig. 5 Summary of spatial patterns for: (a) shape, (b) magnitude, and (c) composite regimes across Turkey.
Downloaded By: [CEH Wallingford] At: 09:05 26 April 2010
Spatial variability of precipitation regimes over Turkey 243
observed only for a few stations in the northeast part ofthe Eastern Anatolia region, while Regime F is con-fined to the coastal zone of the Black Sea (42%).
The distribution of precipitation regimes with aDecember peak (A and B) may be explained by win-ter rainfall supplied from mid-latitude (northeastAtlantic) and Mediterranean depressions which aremost active during winter (Türkes, 1998; Kostopoulou& Jones, 2007). The interior of the Aegean, southeastMediterranean and southwest Anatolia regions(Regime B) are differentiated from coastal regionsby an extended period of winter–spring precipitation.For Regime B, the rainier spring most probablyreflects convective activity (Türkes, 1998). Winter isthe wettest period across Turkey, except in Easternand Central Anatolia where spring is rainiest. Mayand April–May peaks (regimes C and D) are mostprobably caused by convective rainfall rather thanfrontal systems. Precipitation formation is modifiedby local topography in continental Anatolia (i.e. Cen-tral Anatolia, Eastern Anatolia and the southern partof the Black Sea region) (Kutiel & Türkes 2005). TheApril–May rainfall peak in Central Anatolia is com-monly referred to as the “Kirkikindi yagmurlari” (40-afternoon rains), which indicates its convective ori-gins. The timing of precipitation peaks for regimes Cand D are similar; but there are clear differences inthe length of the rainy season. Central Anatolia (D) isinfluenced by frontal systems during winter, whereasEastern Anatolia and the southern Black Sea (C)experience drier winters due to small-scale high-pressure centres caused by localized thermal effects.The occurrence of Regime E (dry winter, and markedMay peak) in the northeast of Eastern Anatolia is dueto the combined effect of high topography and conti-nentality and the Siberian High to the east, whichtends to reduce winter precipitation. Indeed, the east-ern part of Turkey receives much less precipitation in
winter than other parts of the country (Türkes, 1998).The occurrence of an October peak precipitationregime (Regime F) along the Black Sea coast can beexplained by the frequent northeastern Atlantic-orig-inating depressions in autumn (Karaca et al., 2000;Trigo et al., 1999). In comparison, southern regionsof Turkey do not receive much autumn rain becausethe dominant atmospheric systems are located atnortherly latitudes and the Mediterranean depressionis relatively weak at this time.
In summary, intra-annual variability in the tim-ing of precipitation (i.e. regime shape) over Turkey iscontrolled mainly by the North Atlantic and Mediter-ranean depressions which are influential in winter.However, local factors cause modification of cyclonetrajectory and, hence, the timing of precipitation(peak in spring) especially for interior and high ele-vation regions. The October rainfall peak for thenorthern Black Sea coast may be explained by pre-frontal depression systems, which are only effectivein northern Anatolia during the autumn.
4.2 Precipitation regime magnitude
Five regime magnitude classes can be identified thatmay be ordered with respect to the four precipitationmagnitude indices (Table 3):
– Regime 1. Low with the lowest values for allindices (32 stations).
– Regime 2. Intermediate with the second lowestvalues for all indices (32 stations).
– Regime 3. Moderately-high with third highestvalues for all indices (35 stations).
– Regime 4. High with the second highest valuesfor all indices (six stations).
– Regime 5. Very-high with the highest values forall indices (two stations).
Table 3 Average values of precipitation indices for stations within the five regime magnitude classes (1: low; 2: intermedi-ate; 3: moderately high; 4: high; 5: very high).
Precipitation Regime average Average
Magnitude index 1 2 3 4 5 (All stations)
Mean (mm month−1) 33.97 46.81 64.40 96.62 183.57 54.07Max (mm month−1) 49.11 71.99 100.35 150.83 251.66 82.20Min. (mm month−1) 0.00 0.00 0.01 0.01 0.35 0.01Std dev. (mm month−1) 8.77 12.32 16.98 25.70 46.12 14.17No. of stations 32 32 35 6 2 107
Downloaded By: [CEH Wallingford] At: 09:05 26 April 2010
244 F. Saris et al.
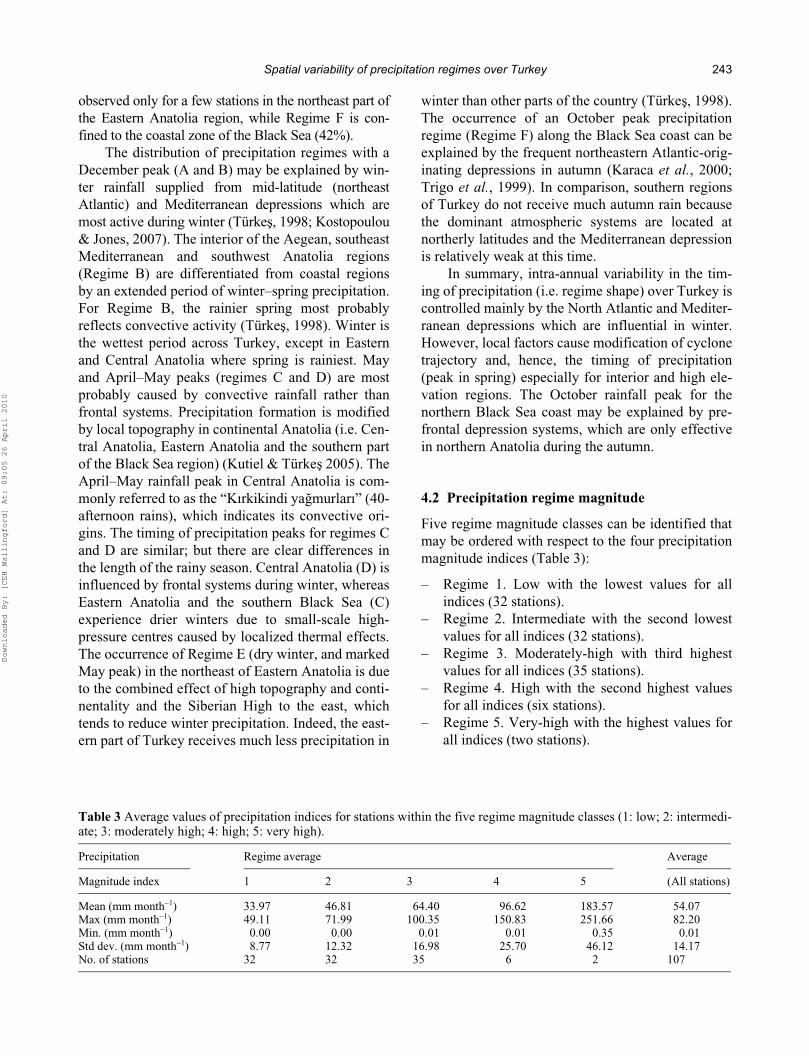
Figure 6 illustrates the spatial distribution ofmagnitude regimes based on a simplified scheme, asshown in Fig. 5(b). The frequency distribution ofregimes is summarized in Table 4. Regime 1 clearlydominates in Central Anatolia (93%), but also pre-dominates in Eastern Anatolia (39%) and the inlandparts of the Black Sea region (42%). Thrace (47%),the Aegean (60%), Southeast Anatolia (43%) andEastern Anatolia (39%) are mainly characterized byintermediate regimes (Regime 2). Regime 3 is dis-tributed across Anatolia (Table 4). The Anatolianpart of the Marmara region (also known as SouthMarmara, 47%), the Black Sea coast (29%) andMediterranean coast (50%) also have high occur-rence of moderately-high regimes. Regime 4 is onlydetected for six stations. Southwest Turkey (17%) isrepresented by Regime 4. Antakya (southeast Medi-terranean coast), Zonguldak and Giresun (Black Sea
coast, 8%) also experience high precipitationregimes. Very-high precipitation regimes (Regime 5)are only recorded for Rize and Hopa (northeast BlackSea region, 8%).
The Central Anatolia region is characterized bythe lowest magnitude regime. Dry sub-humid cli-matic conditions prevail here, with the Konya Plainhaving a semi-arid climate (Türkes, 1999). CentralAnatolia is a formation area for thermal lows andexperiences continentality, thus the region has pro-pensity for precipitation deficits (Spanos et al.,2003). The transition zone between Central and East-ern Anatolia are also dominated by Regime 1. Thesouthwest part of the Black Sea region is in a rainshadow of the western Black Sea Mountains and soreceives limited rainfall. The Aegean region has anintermediate regime due to a combination of mari-time influence and topography. The predominantly
Fig. 6 Spatial distribution of precipitation magnitude regimes across Turkey.
+
MagnitudeClasses
+
+
++
++
+++
+++
++++
++
+
+
+++
+
++
+++ +++
+
+
1
+2
3
4
50 80 120 km
Bulgaria
Armenia
Iraq
Syria
BLACK SEA
MEDITERRANEAN SEA
Georgia
Iran
Table 4 Precipitation regime magnitude class frequencies in the main geographical regions. (Percentage of regimes in eachregion is given in parentheses.).
Magnitude Regime
Black Sea
Marmara Aegean Mediterranean Central Anatolia
Eastern Anatolia
Southeast Anatolia
1 10 (42) 1 (6) - 2 (11) 14 (93) 5 (39) -2 3 (13) 7 (47) 9 (60) 4 (22) 1 (7) 5 (39) 3 (43)3 7 (29) 7 (47) 5 (33) 9 (50) - 3 (22) 4 (57)4 2 (8) - 1 (7) 3 (17) - - -5 2 (8) - - - - - -
Downloaded By: [CEH Wallingford] At: 09:05 26 April 2010
Spatial variability of precipitation regimes over Turkey 245
horst and graben topography of western Turkey, ori-ented perpendicular to the coast, does not obstructairflow, while the Aegean Sea is the major winter–spring cyclone source area at the sub-synoptic scale(Trigo et al., 1999). Regime 2 also dominatesThrace; this area is influenced by Polar front andBalkan-originated air flows (Kutiel et al., 2001).Moderately-high regimes are observed for SouthMarmara, and coastal regions of the Aegean, Medi-terranean, Southeast Anatolia and Black Sea regions(Fig. 5(b)). Relatively high precipitation for thesecoastal locations is the combined result of frontal andorographic rains. For example, the Taurus Mountainstrim the Mediterranean coast and form a barrier tomoist air. One of the most notable features of ournew precipitation regionalization is the extension ofmoderately-high regimes toward Southeast Anatolia(previously defined as dry, semi-arid, e.g. Türkes,1999). Regime 3 is concentrated along the physio-graphic transition between the Mediterranean andSoutheast Anatolia region; this zone is influenced bythe Mediterranean cyclones. These weather systemsare sourced from the Cyprus Low, which is animportant driver of eastern Mediterranean cyclogene-sis (Trigo et al., 1999). The highest precipitationregimes are divided into two regimes (4 and 5) with alimited number of stations (Table 4).
In summary, precipitation regime magnitudeacross Turkey appears to depend on the strength ofinfluence of mid-latitude and Mediterraneancyclones, and probably local factors. Interior regions
are characterized by low (mainly convective, seeSection 4.1) rainfall while coastal regions are pre-dominantly affected by frontal and orographic pre-cipitation. Local topography appears to be a modifierof regime magnitude: enhancing precipitation onwindward slopes and reducing precipitation penetra-tion to cause rain shadows.
4.3 Composite (shape and magnitude) precipitation regimes
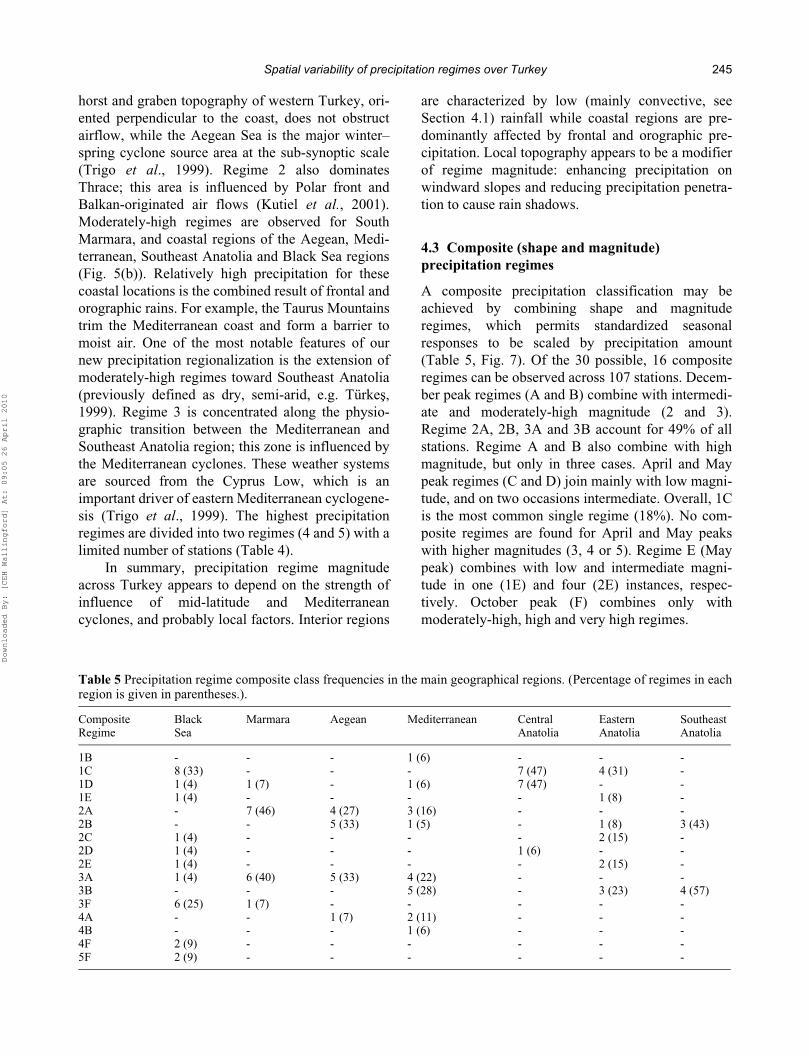
A composite precipitation classification may beachieved by combining shape and magnituderegimes, which permits standardized seasonalresponses to be scaled by precipitation amount(Table 5, Fig. 7). Of the 30 possible, 16 compositeregimes can be observed across 107 stations. Decem-ber peak regimes (A and B) combine with intermedi-ate and moderately-high magnitude (2 and 3).Regime 2A, 2B, 3A and 3B account for 49% of allstations. Regime A and B also combine with highmagnitude, but only in three cases. April and Maypeak regimes (C and D) join mainly with low magni-tude, and on two occasions intermediate. Overall, 1Cis the most common single regime (18%). No com-posite regimes are found for April and May peakswith higher magnitudes (3, 4 or 5). Regime E (Maypeak) combines with low and intermediate magni-tude in one (1E) and four (2E) instances, respec-tively. October peak (F) combines only withmoderately-high, high and very high regimes.
Table 5 Precipitation regime composite class frequencies in the main geographical regions. (Percentage of regimes in eachregion is given in parentheses.).
Composite Regime
Black Sea
Marmara Aegean Mediterranean Central Anatolia
Eastern Anatolia
Southeast Anatolia
1B - - - 1 (6) - - -1C 8 (33) - - - 7 (47) 4 (31) -1D 1 (4) 1 (7) - 1 (6) 7 (47) - -1E 1 (4) - - - - 1 (8) -2A - 7 (46) 4 (27) 3 (16) - - -2B - - 5 (33) 1 (5) - 1 (8) 3 (43)2C 1 (4) - - - - 2 (15) -2D 1 (4) - - - 1 (6) - -2E 1 (4) - - - - 2 (15) -3A 1 (4) 6 (40) 5 (33) 4 (22) - - -3B - - - 5 (28) - 3 (23) 4 (57)3F 6 (25) 1 (7) - - - - -4A - - 1 (7) 2 (11) - - -4B - - - 1 (6) - - -4F 2 (9) - - - - - -5F 2 (9) - - - - - -
Downloaded By: [CEH Wallingford] At: 09:05 26 April 2010
246 F. Saris et al.
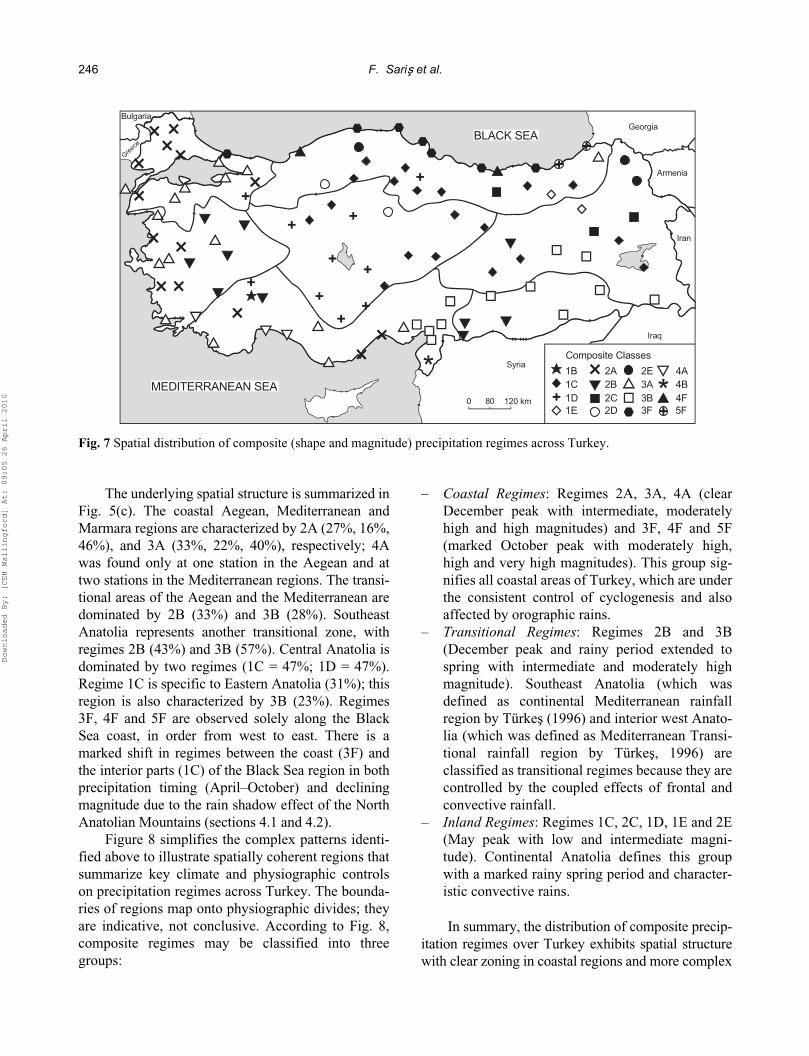
The underlying spatial structure is summarized inFig. 5(c). The coastal Aegean, Mediterranean andMarmara regions are characterized by 2A (27%, 16%,46%), and 3A (33%, 22%, 40%), respectively; 4Awas found only at one station in the Aegean and attwo stations in the Mediterranean regions. The transi-tional areas of the Aegean and the Mediterranean aredominated by 2B (33%) and 3B (28%). SoutheastAnatolia represents another transitional zone, withregimes 2B (43%) and 3B (57%). Central Anatolia isdominated by two regimes (1C = 47%; 1D = 47%).Regime 1C is specific to Eastern Anatolia (31%); thisregion is also characterized by 3B (23%). Regimes3F, 4F and 5F are observed solely along the BlackSea coast, in order from west to east. There is amarked shift in regimes between the coast (3F) andthe interior parts (1C) of the Black Sea region in bothprecipitation timing (April–October) and decliningmagnitude due to the rain shadow effect of the NorthAnatolian Mountains (sections 4.1 and 4.2).
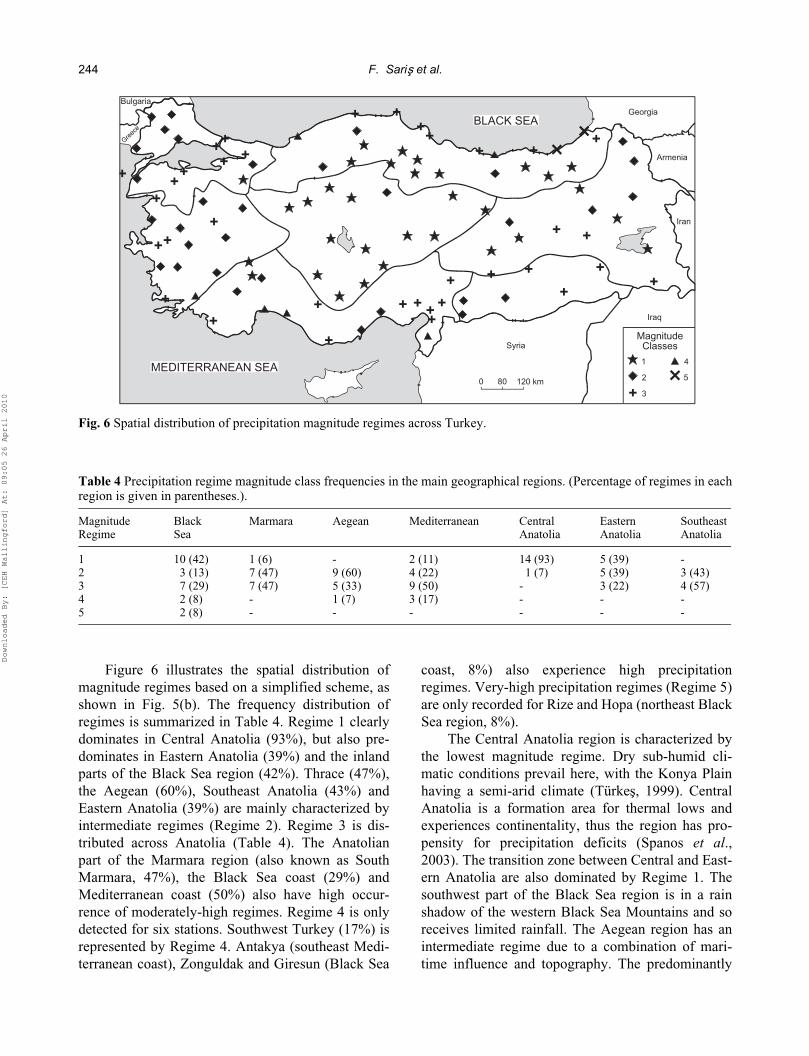
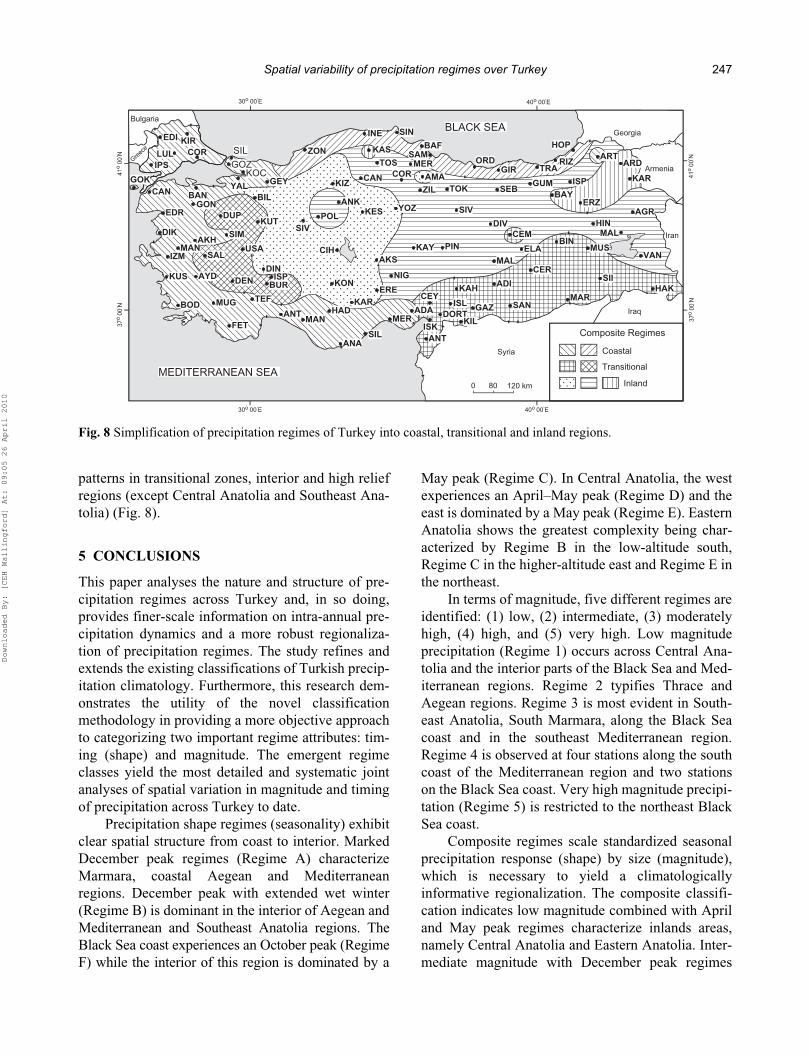
Figure 8 simplifies the complex patterns identi-fied above to illustrate spatially coherent regions thatsummarize key climate and physiographic controlson precipitation regimes across Turkey. The bounda-ries of regions map onto physiographic divides; theyare indicative, not conclusive. According to Fig. 8,composite regimes may be classified into threegroups:
– Coastal Regimes: Regimes 2A, 3A, 4A (clearDecember peak with intermediate, moderatelyhigh and high magnitudes) and 3F, 4F and 5F(marked October peak with moderately high,high and very high magnitudes). This group sig-nifies all coastal areas of Turkey, which are underthe consistent control of cyclogenesis and alsoaffected by orographic rains.
– Transitional Regimes: Regimes 2B and 3B(December peak and rainy period extended tospring with intermediate and moderately highmagnitude). Southeast Anatolia (which wasdefined as continental Mediterranean rainfallregion by Türkes (1996) and interior west Anato-lia (which was defined as Mediterranean Transi-tional rainfall region by Türkes, 1996) areclassified as transitional regimes because they arecontrolled by the coupled effects of frontal andconvective rainfall.
– Inland Regimes: Regimes 1C, 2C, 1D, 1E and 2E(May peak with low and intermediate magni-tude). Continental Anatolia defines this groupwith a marked rainy spring period and character-istic convective rains.
In summary, the distribution of composite precip-itation regimes over Turkey exhibits spatial structurewith clear zoning in coastal regions and more complex
Fig. 7 Spatial distribution of composite (shape and magnitude) precipitation regimes across Turkey.
++
+
+
+
+
+
++
+
+
+
*+
+ *1B1C1D1E
2A2B2C2D
2E3A3B3F 5F
4F4B4A
Composite Classes
0 80 120 km
Bulgaria
Armenia
Iraq
Syria
BLACK SEA
MEDITERRANEAN SEA
Georgia
Iran
Downloaded By: [CEH Wallingford] At: 09:05 26 April 2010
Spatial variability of precipitation regimes over Turkey 247
patterns in transitional zones, interior and high reliefregions (except Central Anatolia and Southeast Ana-tolia) (Fig. 8).
5 CONCLUSIONS
This paper analyses the nature and structure of pre-cipitation regimes across Turkey and, in so doing,provides finer-scale information on intra-annual pre-cipitation dynamics and a more robust regionaliza-tion of precipitation regimes. The study refines andextends the existing classifications of Turkish precip-itation climatology. Furthermore, this research dem-onstrates the utility of the novel classificationmethodology in providing a more objective approachto categorizing two important regime attributes: tim-ing (shape) and magnitude. The emergent regimeclasses yield the most detailed and systematic jointanalyses of spatial variation in magnitude and timingof precipitation across Turkey to date.
Precipitation shape regimes (seasonality) exhibitclear spatial structure from coast to interior. MarkedDecember peak regimes (Regime A) characterizeMarmara, coastal Aegean and Mediterraneanregions. December peak with extended wet winter(Regime B) is dominant in the interior of Aegean andMediterranean and Southeast Anatolia regions. TheBlack Sea coast experiences an October peak (RegimeF) while the interior of this region is dominated by a
May peak (Regime C). In Central Anatolia, the westexperiences an April–May peak (Regime D) and theeast is dominated by a May peak (Regime E). EasternAnatolia shows the greatest complexity being char-acterized by Regime B in the low-altitude south,Regime C in the higher-altitude east and Regime E inthe northeast.
In terms of magnitude, five different regimes areidentified: (1) low, (2) intermediate, (3) moderatelyhigh, (4) high, and (5) very high. Low magnitudeprecipitation (Regime 1) occurs across Central Ana-tolia and the interior parts of the Black Sea and Med-iterranean regions. Regime 2 typifies Thrace andAegean regions. Regime 3 is most evident in South-east Anatolia, South Marmara, along the Black Seacoast and in the southeast Mediterranean region.Regime 4 is observed at four stations along the southcoast of the Mediterranean region and two stationson the Black Sea coast. Very high magnitude precipi-tation (Regime 5) is restricted to the northeast BlackSea coast.
Composite regimes scale standardized seasonalprecipitation response (shape) by size (magnitude),which is necessary to yield a climatologicallyinformative regionalization. The composite classifi-cation indicates low magnitude combined with Apriland May peak regimes characterize inlands areas,namely Central Anatolia and Eastern Anatolia. Inter-mediate magnitude with December peak regimes
Fig. 8 Simplification of precipitation regimes of Turkey into coastal, transitional and inland regions.
40o 00’E30o 00’E
30o 00’E 40o 00’E
Georgia
Iran
BLACK SEA
MEDITERRANEAN SEA0 80 120 km
Bulgaria
Armenia
Iraq
Syria
INE
ZON KAS
KIZ
TOS
CAN
SIN
ANKKES YOZ
POLSIV
GEY
GOZ
YALBAN
EDI KIRCORLUL
CAN
EDR
DIK
IZM
DUP
AKHSIM
BIL
KUT
SALUSA
AYD DENDIN
BUR
BOD MUG TEF
FETANT
MAN
ANA
HADKAR
KON
CIHAKS
NIG
ERE
SIL
MERADA DORT
ANT
KIL
KAY PIN
GAZ
KAH ADI
MAL
SAN
CER
MAR
SIIHAK
VAN
CEM
ELA
DIV
BIN
BAF
COR AMA
ZIL TOK
SIV
GIR
SEBGUM
TRARIZ
BAY
ISP
ERZ
ARTARD
KAR
AGRHINMAL
MUS
Composite Regimes
Inland
ISPKUS
MAN
GOK
SIL
KOCMER
SAMORD
HOP
CEYISL
ISK
IPS
GON
Coastal
Transitional
Downloaded By: [CEH Wallingford] At: 09:05 26 April 2010
248 F. Saris et al.
dominate in Thrace, the interior Aegean and South-east Anatolia. These areas may be defined as transi-tional zones and specify the modified Mediterraneanclimate regime. Moderately high to very high magni-tude precipitation occurs only for Marmara, Aegeanand Mediterranean coasts (December peak) andBlack Sea coast (October peak) regimes.
These intra-annual regime classificationsindicate the key controls upon spatial patterns inTurkish precipitation to be: (1) large-scale atmos-pheric circulation during the winter months forcoastal regions of Marmara, Black Sea, Aegeanand Mediterranean regions and (2) convectionalrainfall for interior regions that experience a rainyspring. The physiography of Turkey has a majorinfluence on precipitation regimes. High relief andcontinentality play an important role in causingrainfall deficit for interior regions; and, wheremountains are located along the coast, high precip-itation occurs, particularly in winter. Eastern Ana-tolia experiences the most intricate precipitationpatterns of any region, which is linked to the com-plex mountainous terrain. The number of gaugesfor the Eastern Anatolia region is not adequate tofully determine the spatial pattern in precipitationover this region. Likewise, precipitation data forthe mountainous regions of the Black Sea andMediterranean are restricted, since long-term sta-tions are located at <700 m.
This study has refined and extended our under-standing of the spatial structure in precipitationregimes over Turkey. These findings are not only ofclimatological interest; they have practical implica-tions for the assessment and prediction of waterresources, particularly given the growing popula-tion of Turkey. Indeed, potable water scarcity hasbeen a significant problem for Turkey’s major citiesin recent years (Beler Baykal et al., 2000). Theregimes identified herein show clear spatiality inintra-annual timing and amount of precipitationdelivery, which could be used as a basis to informsustainable water resource management. Moreover,given present concerns about future climate change/variability, it is important to extend this research onlong-term average conditions to understand theyear-to-year variability in precipitation and riverflows to assess current and potential future waterresource stress. Thus, hydroclimatological researchis in progress by the authors to identify inter-annualprecipitation regime variability and links to riverflows across Turkey.
Acknowledgements The precipitation data wereprovided from the Department of Geography,Çanakkale Onsekiz Mart University (Turkey).F. Saris is supported by the Higher Education Coun-cil of Turkey. Kevin Burkhill and Anne Ankcorn(University of Birmingham) are thanked for carto-graphic assistance.
REFERENCES
Akçar, N., Yavuz, V., Ivy-Ochs, S., Kubik, P. W., Vardar, M. &Schlüchter, C. (2007) Palaeoglacial records from KavronValley, NE Turkey: Field and cosmogenic exposure datingevidence. Quaternary Int. 164–165, 170–183.
Atalay, I. & Mortan, K. (2003) Regional Geography of Turkey. Inki-lap Kitabevi, Ankara, Turkey.
Beler Baykal, B., Tanik, A. & Gönenç, I. E. (2000) Water quality inthe drinking water reservoirs of a megacity, Istanbul. Environ.Manage. 26, 607–614.
Bower, D., Hannah, D. M. & McGregor, G. R. (2004) Techniquesfor assessing the climatic sensitivity of river flow regimes.Hydrol. Processes 18, 2515–2543.
Frederick, K. D. & Major, D. C. (1997) Climate change and waterresources. Climatic Change 37, 7–23.
Hannah, D. M., Smith, B. P. G., Gurnell, A. M. & McGregor, G. R.(2000) An approach to hydrograph classification. Hydrol.Processes 14, 317–338.
Hannah, D. M., Kansakar, S. R., Gerrard, A. J. & Rees, G. (2005)Flow regimes of Himalayan rivers of Nepal: their nature andspatial patterns. J. Hydrol. 308, 18–32.
Harding, A. E. (2006) Changes in Mediterranean climate extremes:patterns, causes, and impacts of change. PhD Thesis, Univer-sity of East Anglia, Norwich, UK.
Harris, N. M., Gurnell, A. M., Hannah, D. M. & Petts, G. E. (2000)Classification of river regimes: a context for hydroecology.Hydrol. Processes 14, 2831–2848.
Griffith, D. A. & Amrhein, C. G. (1997) Multivariate Statistics forGeographers. Prentice-Hall, New Jersey, USA.
Kadioglu, M., Öztürk, N., Erdun, H. & Sen Z. (1999) On the precipi-tation climatology of Turkey by harmonic analysis. Int. J.Climatol. 19, 1717–1728.
Kadioglu, M. (2000) Regional variability of seasonal precipitationover Turkey. Int. J. Climatol. 20, 1743–1760.
Kansakar, S. R., Hannah, D. M., Gerrard, A. J. & Rees, G. (2004)Spatial pattern in the precipitation regime of Nepal. Int. J.Climatol. 24, 1645–1659.
Karaca, M., Deniz, A. & Tayanç, M. (2000) Cyclone track variabil-ity over Turkey in association with regional climate. Int. J.Climatol. 20, 1225–1236.
Kostopoulou, E. & Jones, P. D. (2007) Comprehensive analysis ofthe climate variability in the eastern Mediterranean. Part II:relationships between atmospheric circulation patterns and sur-face climatic elements. Int. J. Climatol. 27, 1351–1371.
Kutiel, H., Hirsch-Eshkol, T. R. & Türkes, M. (2001) Sea level pres-sure patterns associated with dry or wet monthly rainfall condi-tions in Turkey. Theor. Appl. Climatol. 69, 39–67.
Kutiel, H. & Türkes, M. (2005) New evidence for the role of theNorth Sea – Caspian Pattern on the temperature and precipita-tion regimes in continental central Turkey. GeographiskaAnnaler 87 A(4), 501–513.
Saris, F. (2006) Spatial and temporal variation of precipitation inten-sity over Turkey. MSc Thesis, Department of Geography,Çanakkale Onsekiz Mart University, Çanakkale, Turkey.
Downloaded By: [CEH Wallingford] At: 09:05 26 April 2010
Spatial variability of precipitation regimes over Turkey 249
Spanos, S., Maheras, P., Karacostas, T. & Pennas, P. (2003) Objec-tive climatology of 500-hPa cyclones in central and east Medi-terranean region during warm-dry period of the year. Theor.Appl. Climatol. 75, 167–178.
Stone, R. C. (1989) Weather types at Brisbane, Queensland: anexample of the use of principal components and cluster ana-lysis. Int. J. Climatol. 9, 3–32.
Sen, Z. & Habib, Z. (2000) Spatial analysis of monthly precipitationin Turkey. Theor. Appl. Climatol. 67, 81–96.
Tatli, H., Dalfes, N. H. & Mentes, S. (2004) A statistical downscal-ing method for monthly total precipitation over Turkey. Int. J.Climatol. 24, 161–180.
Trigo, I. F., Davies, T. D. & Bigg, G. R. (1999) Objective climatology ofcyclones in the Mediterranean region. J. Climate 12, 1685–1696.
Türkes, M. (1996) Spatial and temporal analysis of annual rainfallvariations in Turkey. Int. J. Climatol. 16, 1057–1076.
Türkes, M. (1998) Influence of geopotential heights, cyclone fre-quency and Southern Oscillation on rainfall variations inTurkey. Int. J. Climatol. 18, 649–680.
Türkes, M. (1999) Vulnerability of Turkey to desertification withrespect to precipitation and aridity conditions. Turkish J.Engng Environ. Sci. 23, 363–380.
Türkes, M., Koç, T. & Saris, F. (2008) Spatiotemporal variability ofprecipitation total series over Turkey. Int. J. Climatol. 29(8),1056–1074.
Ünal, Y., Kindap, T. & Karaca, M. (2003) Redefining the climatezones of Turkey using cluster analysis. Int. J. Climatol. 23,1045–1055.
Xoplaki, E. (2002) Climate variability over the Mediterranean.PhD Thesis, Inauguraldissertation der Philosopisch-natur-wisswnschaftlichen Fakultät der Universität Bern, Bern,Switzerland.
Xoplaki, E., González-Rouco, J. F. & Luterbacher, J. (2004) Wetseason Mediterranean precipitation variability: influence oflarge-scale dynamics and trends. Climate Dynamics 23,63–78.
Yarnal, B. (1992) Synoptic Climatology in Environmental Analysis:A Primer. Belhaven Press, London, UK.
Downloaded By: [CEH Wallingford] At: 09:05 26 April 2010
Related Documents