Soil & Tillage Research 72 (2003) 31–41 Spatial variability in soil properties on slow-forming terraces in the Andes region of Ecuador Gerd Dercon a,b,∗ , Jozef Deckers b , Gerard Govers c , Jean Poesen c , Henrry Sánchez a , Raúl Vanegas a , Marco Ram´ ırez a , George Loaiza a a Programa para el Manejo del Agua y del Suelo (PROMAS), Universidad de Cuenca, Av. 12 de Abril s/n, Cuenca, Casilla 01.01.1198, Ecuador b Institute for Land and Water Management, Katholieke Universiteit Leuven, Vital Decosterstraat 102, Leuven, Belgium c Laboratory for Experimental Geomorphology, Katholieke Universiteit Leuven, Redingenstraat 16, Leuven, Belgium Received 4 May 2001; received in revised form 28 January 2003; accepted 4 February 2003 Abstract Due to severe land degradation problems, soil conservation is a matter of major concern in the Ecuadorian Andes. Slow-forming terraces, a variation of hedgerow agro-forestry systems composed by contour grass barrier strips, can be considered as the most frequently used technique in Andean rural communities of Ecuador. However, due to shallow soils, terrace development often has the disadvantage causing gradients in soil properties from the upper to the lower elevations within the terrace. The main objectives of this study were to assess (i) spatial variability in soil properties on slow-forming terraces in the Andes and (ii) implications of variability for the management of this soil conservation technique. In order to measure spatial variability, soil sampling (0–15cm) was carried out in bands following the contour, which were located every 1m beginning at the highest point of elevation and including the lowest point on the terrace. Soil properties, such as pH(H 2 O), pH(NaF), organic carbon, total nitrogen, NO 3 − , P, K, exchangeable aluminium, P fixation, exchangeable bases, cationic exchange capacity, base saturation and texture, were monitored on eight terraces, having slopes from 15 to 30%, a length of 4–8 m and soils ranging from Cambisols to Phaeozems, in the Ecuadorian Andes (Gima, Azuay). Terraces, which were 2–4 years, were managed in a traditional or more intensified way (i.e. without or with the application of organic ma- nure). Bufferstrips were composed by (i) Pennisetum clandestinum and Lolium multiflorum or (ii) Phalaris tuberosa. Spatial variability was analysed by stepwise multiple regression analysis, where position on the terrace was the independent variable and soil property was the dependent variable. Factor analysis was carried out in order to compare spatial variability patterns of the terraces and formulate management strategies. High spatial variability in soil properties was found. Although spatial variation was site dependent, it was clear that soil fertility increased from the upper to the lower part of the terraces. The present study shows that management strategy could influence the pattern and magnitude of spatial variation. Site-specific soil fertility improvement is suggested as means to combat variation caused by tillage erosion in slow-forming terraces. © 2003 Elsevier Science B.V. All rights reserved. Keywords: Slow-forming terraces; Spatial variability; Soil quality; Site-specific management; Andes; Ecuador ∗ Corresponding author. Present address: International Institute for Tropical Agriculture, PMB 5320, Ibadan, Oyo State, Nigeria. Tel.: +234-22-412626; fax: +234-22-412221. E-mail address: [email protected] (G. Dercon). 1. Introduction In the southern Andes region of Ecuador farm land has relatively steep slopes and is thus highly 0167-1987/03/$ – see front matter © 2003 Elsevier Science B.V. All rights reserved. doi:10.1016/S0167-1987(03)00049-7

Welcome message from author
This document is posted to help you gain knowledge. Please leave a comment to let me know what you think about it! Share it to your friends and learn new things together.
Transcript
Soil & Tillage Research 72 (2003) 31–41
Spatial variability in soil properties on slow-formingterraces in the Andes region of Ecuador
Gerd Dercona,b,∗, Jozef Deckersb, Gerard Goversc, Jean Poesenc,Henrry Sáncheza, Raúl Vanegasa, Marco Ramıreza, George Loaizaa
a Programa para el Manejo del Agua y del Suelo (PROMAS), Universidad de Cuenca, Av. 12 de Abril s/n,Cuenca, Casilla 01.01.1198, Ecuador
b Institute for Land and Water Management, Katholieke Universiteit Leuven, Vital Decosterstraat 102, Leuven, Belgiumc Laboratory for Experimental Geomorphology, Katholieke Universiteit Leuven, Redingenstraat 16, Leuven, Belgium
Received 4 May 2001; received in revised form 28 January 2003; accepted 4 February 2003
Abstract
Due to severe land degradation problems, soil conservation is a matter of major concern in the Ecuadorian Andes.Slow-forming terraces, a variation of hedgerow agro-forestry systems composed by contour grass barrier strips, can beconsidered as the most frequently used technique in Andean rural communities of Ecuador. However, due to shallow soils,terrace development often has the disadvantage causing gradients in soil properties from the upper to the lower elevationswithin the terrace. The main objectives of this study were to assess (i) spatial variability in soil properties on slow-formingterraces in the Andes and (ii) implications of variability for the management of this soil conservation technique. In orderto measure spatial variability, soil sampling (0–15 cm) was carried out in bands following the contour, which were locatedevery 1 m beginning at the highest point of elevation and including the lowest point on the terrace. Soil properties, such aspH(H2O), pH(NaF), organic carbon, total nitrogen, NO3
−, P, K, exchangeable aluminium, P fixation, exchangeable bases,cationic exchange capacity, base saturation and texture, were monitored on eight terraces, having slopes from 15 to 30%, alength of 4–8 m and soils ranging from Cambisols to Phaeozems, in the Ecuadorian Andes (Gima, Azuay). Terraces, whichwere 2–4 years, were managed in a traditional or more intensified way (i.e. without or with the application of organic ma-nure). Bufferstrips were composed by (i)Pennisetum clandestinum andLolium multiflorum or (ii) Phalaris tuberosa. Spatialvariability was analysed by stepwise multiple regression analysis, where position on the terrace was the independent variableand soil property was the dependent variable. Factor analysis was carried out in order to compare spatial variability patternsof the terraces and formulate management strategies. High spatial variability in soil properties was found. Although spatialvariation was site dependent, it was clear that soil fertility increased from the upper to the lower part of the terraces. Thepresent study shows that management strategy could influence the pattern and magnitude of spatial variation. Site-specificsoil fertility improvement is suggested as means to combat variation caused by tillage erosion in slow-forming terraces.© 2003 Elsevier Science B.V. All rights reserved.
Keywords: Slow-forming terraces; Spatial variability; Soil quality; Site-specific management; Andes; Ecuador
∗ Corresponding author. Present address: International Institutefor Tropical Agriculture, PMB 5320, Ibadan, Oyo State, Nigeria.Tel.: +234-22-412626; fax:+234-22-412221.E-mail address: [email protected] (G. Dercon).
1. Introduction
In the southern Andes region of Ecuador farmland has relatively steep slopes and is thus highly
0167-1987/03/$ – see front matter © 2003 Elsevier Science B.V. All rights reserved.doi:10.1016/S0167-1987(03)00049-7
32 G. Dercon et al. / Soil & Tillage Research 72 (2003) 31–41
susceptible to land degradation by soil erosion. Con-sequently, development and local farmer organisa-tions promote soil conservation structures at the farmlevel. The soil conservation structures commonlyused are terraces and can be classified into (i) benchterraces and (ii) slow-forming terraces. Bench ter-races are mainly constructed with sods of Kikuyu(Pennisetum clandestinum), which is the most com-mon grass in the region and is known for its strengthand drought resistance. Slow-forming terraces are avariation of a contour hedgerow agro-forestry system.They are characterised by narrow strips composedof grass species, such as Milın (Phalaris tuberosa),Ryegrass (Lolium multiflorum) and Kikuyu, and/orapple trees (Malus hybrid). The grass strips areplanted on the contour and are spaced at 1–2 m ver-tical intervals across cropped fields. Annual cropsare grown in the ‘alleys’. Slow-forming terracesare the most commonly used type of terrace be-cause they require relatively low inputs of labourand materials. However, due to the limited soil depthin the Southern Andes region of Ecuador (in con-trast to the deep soils of the Northern Sierra ofEcuador), this type of terrace is often associatedwith a high spatial variability in soil fertility andcrop response. This is attributed to topsoil removalfrom the upper part to accumulation near the buffer-strips of the terraces, which exposes infertile subsoilnear the upper part of the terrace (Dercon et al.,1999).
Hillslopes have been the subject of numerous re-search and development programs to combat soilerosion and propose technologies to benefit the liveli-hoods of smallholders (Stocking and Clark, 1999).Slow-forming terraces are formed because of tillagetranslocation (Turkelboom et al., 1997; Quine et al.,1999; Dercon et al., 1999). Terrace development of-ten has the disadvantage causing gradients in soilphysical, chemical, biological and hydrological prop-erties from the upper to the lower elevations withinthe terrace (Sutikto and Chikamori, 1993; Aase andPikul, 1995; Agus et al., 1997; Thapa, 1997;Turkelboom et al., 1997; Dabney et al., 1999;Quine et al., 1999). Due to the exposure of low qualitysoil on the upper elevations the long-term productiv-ity of these systems can be undermined (Turkelboomet al., 1996, 1997). Thus a practice that conservessoil, may also reduce overall production. This prob-
lem remains a dominant issue in the debate about thesustainability of slow-forming terraces (Thapa et al.,1999). Clearly, improved agronomic and soil manage-ment practices have to be integrated within terracedfarming practices. Thus it is important to understandspatial variability of soil properties on slow-formingterraces in order to develop integrated husbandrypractices to improve performance of this commonlyused soil conservation technique in tropical mountainareas.
The purpose of this study was to evaluate the spatialvariability in soil properties on slow-forming terracesand its implications for the management of this soilconservation technique in the Southern Andes regionof Ecuador.
2. Materials and methods
2.1. Site selection
The assessment was carried out in Gima, a typicalvillage of the southern Ecuadorian Andes, located at2700 m. Annual precipitation is ca. 800–1000 mm.There is rainfall throughout the year, but August andSeptember are relatively dry months. The village ischaracterised by a cool temperature regime and agrowing period of 10 months (Dercon et al., 1998).According to the WRB classification (Deckers et al.,1998) soil types vary from Andosols and Umbrisolsof low bulk density in the higher and steeper partsto Cambisols of higher bulk density in the lower andgentler parts of the area (Dercon, 2001). Gima ischaracterised by (i) a traditional subsistence agricul-ture system based on maize (Zea mays) and climbingbeans (Phaseolus vulgaris) in mixed cropping andin rotation with peas (Pisum sativum) to completethe 12-month cycle (Dercon et al., 1998), (ii) a highpressure for production from the land and (iii) awidespread adoption of slow-forming terraces. As afarming community it is typical of the region but alsosomewhat progressive.
2.2. Experimental sites
Eight slow-forming terraces were selected in twosettlements of Gima. Four sites were located in Tun-zhún, where terraces were 4 years and where farmers
G. Dercon et al. / Soil & Tillage Research 72 (2003) 31–41 33
had applied chicken manure (2–4 t ha−1) prior toplanting. Four sites were located in Zhamar, where ter-races were 2 years, and were managed in the traditionalway, i.e. without any input of organic or mineral fer-tilisers. An important difference between the terracesof Tunzhún and Zhamar was the bufferstrip compo-sition. In Tunzhún farmers grewP. clandestinum andL. multiflorum along with apple trees in order to formthe bufferstrip. In Zhamar strips were composed ofP.tuberosa, a grass very popular with development orga-nizations in the construction of slow-forming terraces.The crop rotation at both Tunzhún and Zhamar wasmaize and climbing beans in mixed cropping, fromOctober to July, and in rotation with peas, from July toSeptember. Tillage was with an animal-powered ardplough.
Slopes ranged from 25 to 40% at Tunzhún and from15 to 30% at Zhamar. Distance between terraces var-ied from 4 to 8 m. All the soils were classified as shal-low Dystri-Vertic Cambisols, formed on clay-rich par-ent material of volcanic tuff, except for two terracesat Zhamar where the soil was classified as a HaplicPhaeozem.
2.3. Soil properties
Soil was sampled in bands following the contour,which were located every 1 m beginning at the high-est point of elevation and including the lowest pointon the terrace. One sample for each band was taken,which was composed of two sub-samples. The soildepth for all samples was 0–15 cm. According to thewidth of the terrace, five to nine bands per terracecould be sampled. In total 51 samples were taken.Eighteen soil properties were analysed by the Na-tional Institute for Agricultural Research of Ecuadorusing standard methods (INIAP, 1999), i.e. pH(H2O),pH(NaF), COrg., NTotal, NO3
−, P, K, AlEx., P fixa-tion, exchangeable bases (K+, Ca2+, Mg2+ and Na+),CEC, base saturation, and texture (sand, clay, silt).Means, minima, maxima and standard deviation werecalculated using SAS 6.12 (Cody and Smith, 1997).The Shapiro–WilkW-test was used to test for nor-mality and the Pearson correlation was calculated toexamine the relationships between pairs of variables.Statistical significance was tested at 0.01 and 0.05level.
2.4. Spatial variability in soil properties
Crop growth showed a clear pattern of increase withincreasing distance from the top of the terrace, hencesoil properties were expected to be linked with posi-tion on the terraces (Dercon, 2001). Stepwise multipleregression analysis was used to test this hypothesis oneach experimental site at a significance level of 0.1.Position on the terrace was the independent variableand soil property was the dependent variable (Codyand Smith, 1997).
Position on the terrace could be expressed as thedistance in metre, perpendicular to the contour lines,considering the beginning or upper part of the terraceas reference site or distance 0. However, although theeight terraces had a length of the same order of mag-nitude, their lengths ranged from 4 to 8 m. Therefore,the parameter “relative distance” was created, allow-ing comparison of spatial variability among the eightslow-forming terraces. The “relative distance” orDrwas defined as:
Dr = Li
L(1)
whereDr is the relative distance (dimensionless),Li
the slope position at sampling sitei with the upper partof the terrace as reference (m), andL the total slopewidth of slow-forming terrace (m). For instance,Drvalues of 0 and 1 indicate the upper and lower part,respectively, of the terraces. In addition, logarithmicand second-order transformations forDr were carriedout in order to better represent spatial variability acrossthe terraces.
In order to improve the understanding of spatial soilvariability on terraces and to come to a first selection ofone or more key indicators that could be the main soilproperties to measure to guide farmers, a factor analy-sis was carried out on the entire dataset. Relationshipsof soil properties to relative distance were further anal-ysed using the resulting principal factors and scorescoefficients. Before carrying out a factor analysis onthe entire dataset, a normally distributed dataset wasneeded (Moulin et al., 1993). Therefore, if necessary,soil properties were log-transformed. Finally only thefollowing 13 non-transformed or log-transformed soilparameters, which were normally distributed, were se-lected for factor analysis: COrg., NTotal, pH(NaF), PRet.,KEx., CaEx., base saturation, P, NO3−, K, AlEx., NaEx.
34 G. Dercon et al. / Soil & Tillage Research 72 (2003) 31–41
and CEC. Neither total concentration of bases, norC/N, although normally distributed, were considereddue to their similarity with other selected variables.
3. Results and discussion
3.1. Exploratory analysis of the soil properties
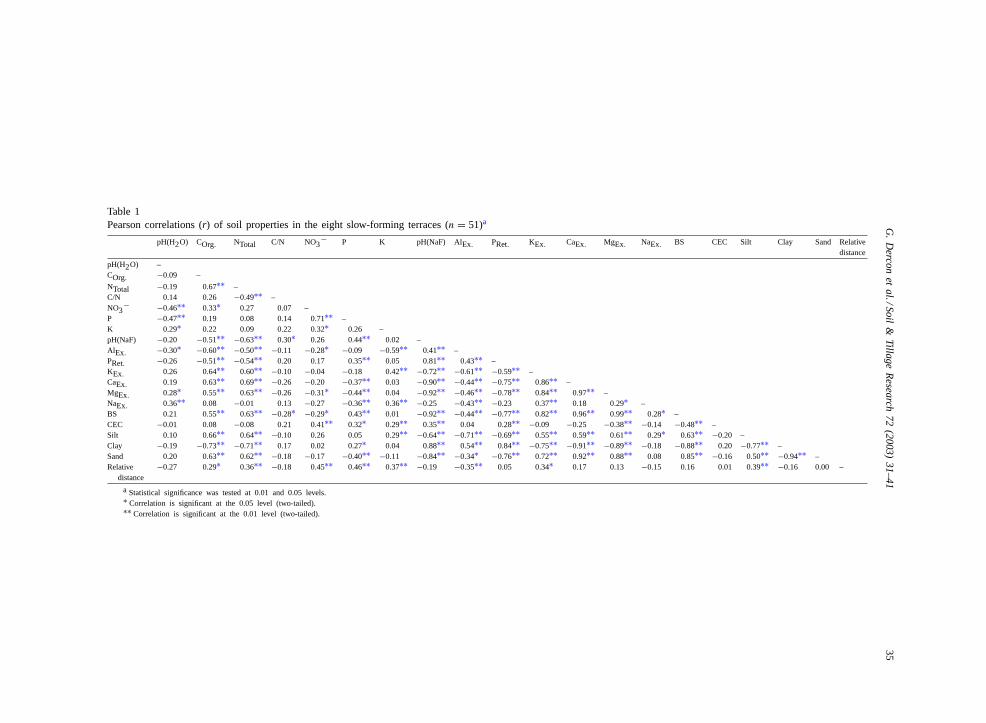
Pearson correlations were calculated for each pairof variables of the entire dataset of 51 sampling sites,which made clear the high interdependence of the soilproperties (Table 1). Clay content was significantly(P ≤ 0.01) positively correlated with characteristicssuch as PRet. (r = 0.84), pH(NaF) (r = 0.88) andAlEx. (r = 0.54), but negatively with base satura-tion (r = −0.88) and COrg. (r = −0.73). Normally,soil fertility is positively correlated with clay content(Scholes et al., 1994), however, in the higher andhumid regions of the Andes region increasing claycontent is often associated with the presence of oldvolcanic tuff having high Al toxicity and high P fixa-tion. Other significant (P ≤ 0.01) negative correlationwas found for the soil properties COrg. and AlEx.(r = −0.60), which could be explained by the capac-ity of humus to form aluminium humus complexes,thereby immobilising Al (Shoji et al., 1993).
3.2. Description of spatial variability
In spite of the significant correlations found be-tween soil properties (Table 1), relative distance andsoil properties were not highly correlated in the en-tire dataset. Low correlation between relative distanceand other soil properties may be explained in severalways: (i) that soil properties did not show a logicalpattern of spatial variability or a gradient in the di-rection of slope of the terraces; (ii) the gradient washighly site dependent; (iii) the gradient was not lin-ear. In order to verify these possible explanations, itwas necessary to investigate the spatial variability sep-arately for each experimental site and explore logicalpatterns other than linear relationships.
Correlations were significant when consideringeach slow-forming terrace separately, indicating thatspatial variability was site dependent. In total, 84out of 144 assessed relationships (18 soil proper-
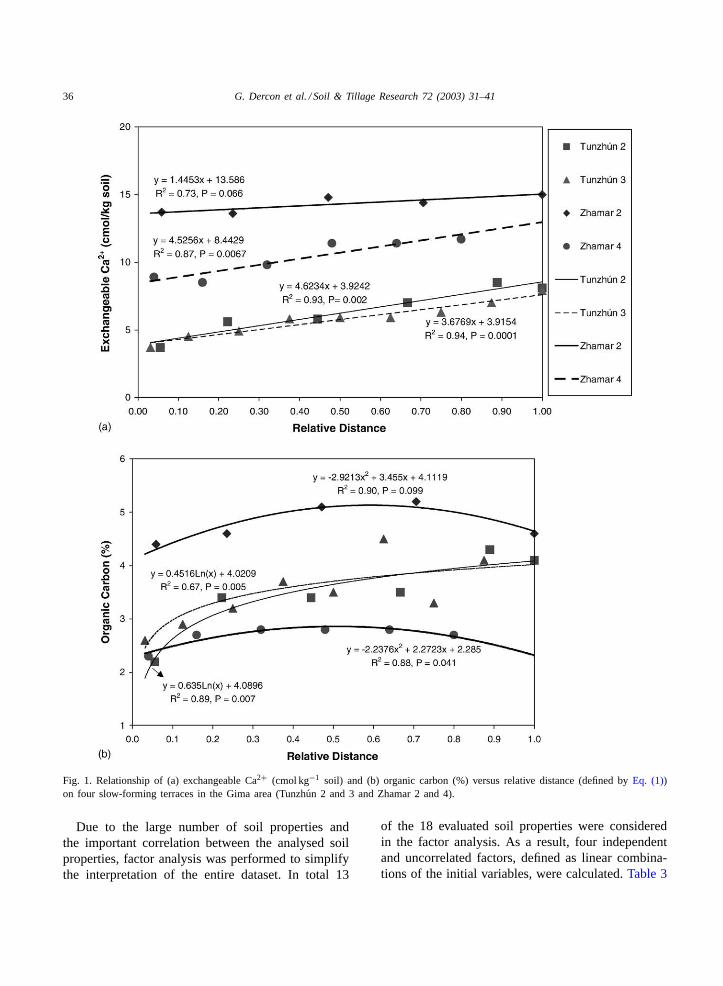
ties on eight experimental sites) were found to besignificant at the 0.10 level, and were characterisedby R2 ≥ 0.50. The soil property with the highestfrequency of significance (7–8) with respect to itsrelationship to relative distance was CaEx. (Fig. 1).KEx., MgEx., pH(H2O), total concentration of bases(BTotal), P, NO3
−, COrg., AlEx., silt and clay weresignificantly related to relative distance in five to sixterraces. Finally, the variable sand was significantlycorrelated withDr on only one terrace (R2 = 0.75andP = 0.06).
The presence of a P gradient may be considered im-portant with respect to the formation of slow-formingterraces. Since P is not a very mobile element in soil,the gradient in P probably indicates the redistributionof soil by tillage translocation. In addition, NO3− washighly correlated with P (r = 0.71). This might in-dicate that the gradient of NO3− was also related tosoil redistribution by tillage translocation and not byrunoff, in spite of its high solubility. In addition, the Pand NO3
− gradient could be the reason for the strongspatial variability in crop response along the terraces.
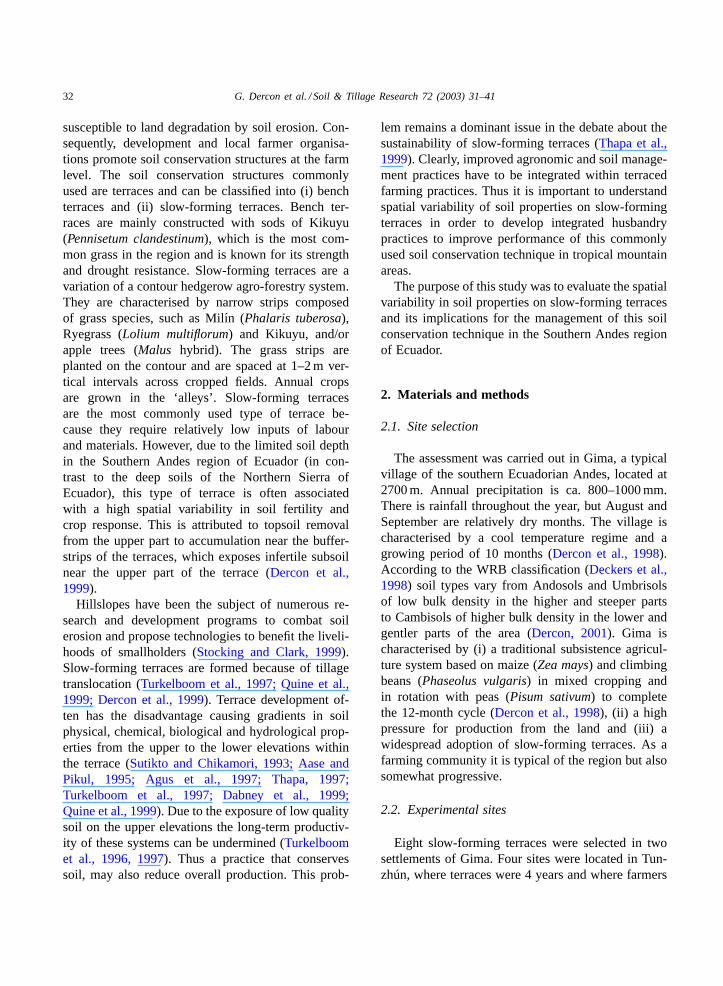
The relationships of relative distance to soil proper-ties were linear, logarithmic and parabolic, as shownin Fig. 1a and b for CaEx. and COrg., respectively. Thelogarithmic relation between relative distance and or-ganic carbon, on the experimental sites of Tunzhún,shows that the terrace has a large part where it hasalmost high constant values. On the other hand, thesecond order relationships with regards to the Zhamarterraces, indicated the presence of maximum values inthe middle of the terrace.
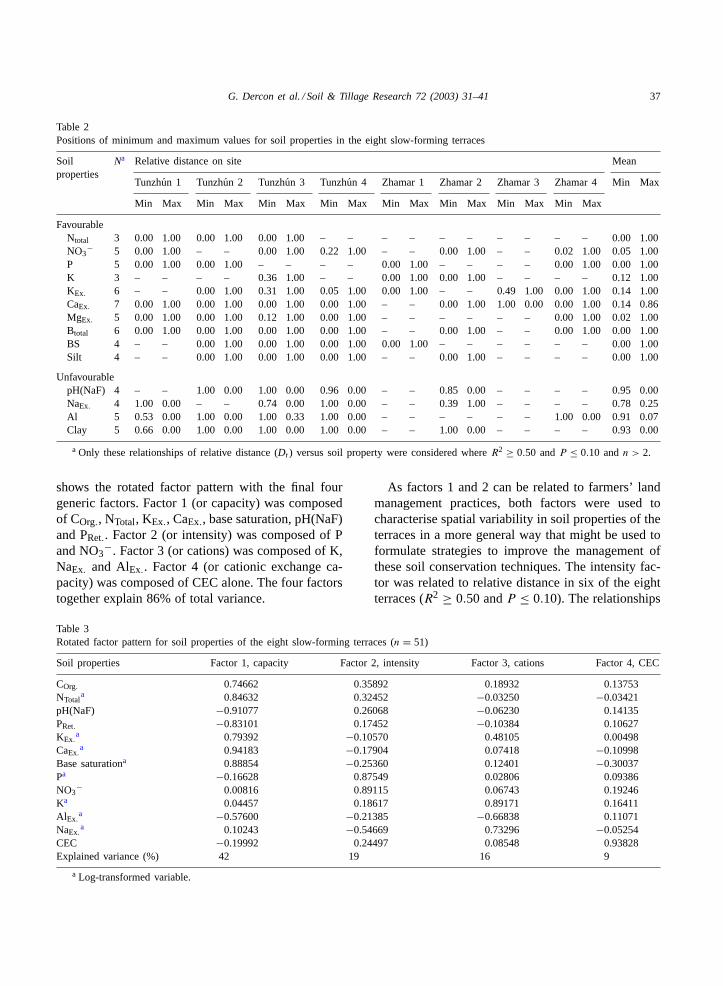
In spite of a high diversity regarding the rela-tionships, i.e. either linear, parabolic or logarithmic,Table 2 shows maximum values for favourable soilproperties, such as NTotal, NO3
−, P, K, CaEx., KEx.,MgEx., total concentration of bases and base satura-tion, on the lower part of the terraces. The oppositewas true for unfavourable soil characteristics likehigh AlEx., pH(NaF), NaEx. and clay (Table 2). Withrespect to the soil properties pH(H2O), COrg., PRet.and CEC, positions for maximum and minimum val-ues were more variable. The clear difference in soilfertility between the lower and higher part of theterraces can be explained by the low quality of thesubsoil, mainly composed by old clay-rich volcanictuff, which comes to the surface on the higher erodedzone of the slow-forming terraces.
G.
Dercon
etal./Soil
&Tillage
Research
72(2003)
31–4135
Table 1Pearson correlations (r) of soil properties in the eight slow-forming terraces (n = 51)a
pH(H2O) COrg. NTotal C/N NO3− P K pH(NaF) AlEx. PRet. KEx. CaEx. MgEx. NaEx. BS CEC Silt Clay Sand Relative
distance
pH(H2O) –COrg. −0.09 –
NTotal −0.19 0.67∗∗ –C/N 0.14 0.26 −0.49∗∗ –NO3
− −0.46∗∗ 0.33∗ 0.27 0.07 –P −0.47∗∗ 0.19 0.08 0.14 0.71∗∗ –K 0.29∗ 0.22 0.09 0.22 0.32∗ 0.26 –pH(NaF) −0.20 −0.51∗∗ −0.63∗∗ 0.30∗ 0.26 0.44∗∗ 0.02 –AlEx. −0.30∗ −0.60∗∗ −0.50∗∗ −0.11 −0.28∗ −0.09 −0.59∗∗ 0.41∗∗ –PRet. −0.26 −0.51∗∗ −0.54∗∗ 0.20 0.17 0.35∗∗ 0.05 0.81∗∗ 0.43∗∗ –KEx. 0.26 0.64∗∗ 0.60∗∗ −0.10 −0.04 −0.18 0.42∗∗ −0.72∗∗ −0.61∗∗ −0.59∗∗ –CaEx. 0.19 0.63∗∗ 0.69∗∗ −0.26 −0.20 −0.37∗∗ 0.03 −0.90∗∗ −0.44∗∗ −0.75∗∗ 0.86∗∗ –MgEx. 0.28∗ 0.55∗∗ 0.63∗∗ −0.26 −0.31∗ −0.44∗∗ 0.04 −0.92∗∗ −0.46∗∗ −0.78∗∗ 0.84∗∗ 0.97∗∗ –NaEx. 0.36∗∗ 0.08 −0.01 0.13 −0.27 −0.36∗∗ 0.36∗∗ −0.25 −0.43∗∗ −0.23 0.37∗∗ 0.18 0.29∗ –BS 0.21 0.55∗∗ 0.63∗∗ −0.28∗ −0.29∗ 0.43∗∗ 0.01 −0.92∗∗ −0.44∗∗ −0.77∗∗ 0.82∗∗ 0.96∗∗ 0.99∗∗ 0.28∗ –CEC −0.01 0.08 −0.08 0.21 0.41∗∗ 0.32∗ 0.29∗∗ 0.35∗∗ 0.04 0.28∗∗ −0.09 −0.25 −0.38∗∗ −0.14 −0.48∗∗ –Silt 0.10 0.66∗∗ 0.64∗∗ −0.10 0.26 0.05 0.29∗∗ −0.64∗∗ −0.71∗∗ −0.69∗∗ 0.55∗∗ 0.59∗∗ 0.61∗∗ 0.29∗ 0.63∗∗ −0.20 –Clay −0.19 −0.73∗∗ −0.71∗∗ 0.17 0.02 0.27∗ 0.04 0.88∗∗ 0.54∗∗ 0.84∗∗ −0.75∗∗ −0.91∗∗ −0.89∗∗ −0.18 −0.88∗∗ 0.20 −0.77∗∗ –Sand 0.20 0.63∗∗ 0.62∗∗ −0.18 −0.17 −0.40∗∗ −0.11 −0.84∗∗ −0.34∗ −0.76∗∗ 0.72∗∗ 0.92∗∗ 0.88∗∗ 0.08 0.85∗∗ −0.16 0.50∗∗ −0.94∗∗ –Relative
distance−0.27 0.29∗ 0.36∗∗ −0.18 0.45∗∗ 0.46∗∗ 0.37∗∗ −0.19 −0.35∗∗ 0.05 0.34∗ 0.17 0.13 −0.15 0.16 0.01 0.39∗∗ −0.16 0.00 –
a Statistical significance was tested at 0.01 and 0.05 levels.∗ Correlation is significant at the 0.05 level (two-tailed).∗∗ Correlation is significant at the 0.01 level (two-tailed).
36 G. Dercon et al. / Soil & Tillage Research 72 (2003) 31–41
Fig. 1. Relationship of (a) exchangeable Ca2+ (cmol kg−1 soil) and (b) organic carbon (%) versus relative distance (defined byEq. (1))on four slow-forming terraces in the Gima area (Tunzhun 2 and 3 and Zhamar 2 and 4).
Due to the large number of soil properties andthe important correlation between the analysed soilproperties, factor analysis was performed to simplifythe interpretation of the entire dataset. In total 13
of the 18 evaluated soil properties were consideredin the factor analysis. As a result, four independentand uncorrelated factors, defined as linear combina-tions of the initial variables, were calculated.Table 3
G. Dercon et al. / Soil & Tillage Research 72 (2003) 31–41 37
Table 2Positions of minimum and maximum values for soil properties in the eight slow-forming terraces
Soilproperties
Na Relative distance on site Mean
Tunzhun 1 Tunzhun 2 Tunzhun 3 Tunzhun 4 Zhamar 1 Zhamar 2 Zhamar 3 Zhamar 4 Min Max
Min Max Min Max Min Max Min Max Min Max Min Max Min Max Min Max
FavourableNtotal 3 0.00 1.00 0.00 1.00 0.00 1.00 – – – – – – – – – – 0.00 1.00NO3
− 5 0.00 1.00 – – 0.00 1.00 0.22 1.00 – – 0.00 1.00 – – 0.02 1.00 0.05 1.00P 5 0.00 1.00 0.00 1.00 – – – – 0.00 1.00 – – – – 0.00 1.00 0.00 1.00K 3 – – – – 0.36 1.00 – – 0.00 1.00 0.00 1.00 – – – – 0.12 1.00KEx. 6 – – 0.00 1.00 0.31 1.00 0.05 1.00 0.00 1.00 – – 0.49 1.00 0.00 1.00 0.14 1.00CaEx. 7 0.00 1.00 0.00 1.00 0.00 1.00 0.00 1.00 – – 0.00 1.00 1.00 0.00 0.00 1.00 0.14 0.86MgEx. 5 0.00 1.00 0.00 1.00 0.12 1.00 0.00 1.00 – – – – – – 0.00 1.00 0.02 1.00Btotal 6 0.00 1.00 0.00 1.00 0.00 1.00 0.00 1.00 – – 0.00 1.00 – – 0.00 1.00 0.00 1.00BS 4 – – 0.00 1.00 0.00 1.00 0.00 1.00 0.00 1.00 – – – – – – 0.00 1.00Silt 4 – – 0.00 1.00 0.00 1.00 0.00 1.00 – – 0.00 1.00 – – – – 0.00 1.00
UnfavourablepH(NaF) 4 – – 1.00 0.00 1.00 0.00 0.96 0.00 – – 0.85 0.00 – – – – 0.95 0.00NaEx. 4 1.00 0.00 – – 0.74 0.00 1.00 0.00 – – 0.39 1.00 – – – – 0.78 0.25Al 5 0.53 0.00 1.00 0.00 1.00 0.33 1.00 0.00 – – – – – – 1.00 0.00 0.91 0.07Clay 5 0.66 0.00 1.00 0.00 1.00 0.00 1.00 0.00 – – 1.00 0.00 – – – – 0.93 0.00
a Only these relationships of relative distance (Dr) versus soil property were considered whereR2 ≥ 0.50 andP ≤ 0.10 andn > 2.
shows the rotated factor pattern with the final fourgeneric factors. Factor 1 (or capacity) was composedof COrg., NTotal, KEx., CaEx., base saturation, pH(NaF)and PRet.. Factor 2 (or intensity) was composed of Pand NO3
−. Factor 3 (or cations) was composed of K,NaEx. and AlEx.. Factor 4 (or cationic exchange ca-pacity) was composed of CEC alone. The four factorstogether explain 86% of total variance.
Table 3Rotated factor pattern for soil properties of the eight slow-forming terraces (n = 51)
Soil properties Factor 1, capacity Factor 2, intensity Factor 3, cations Factor 4, CEC
COrg. 0.74662 0.35892 0.18932 0.13753NTotal
a 0.84632 0.32452 −0.03250 −0.03421pH(NaF) −0.91077 0.26068 −0.06230 0.14135PRet. −0.83101 0.17452 −0.10384 0.10627KEx.
a 0.79392 −0.10570 0.48105 0.00498CaEx.
a 0.94183 −0.17904 0.07418 −0.10998Base saturationa 0.88854 −0.25360 0.12401 −0.30037Pa −0.16628 0.87549 0.02806 0.09386NO3
− 0.00816 0.89115 0.06743 0.19246Ka 0.04457 0.18617 0.89171 0.16411AlEx.
a −0.57600 −0.21385 −0.66838 0.11071NaEx.
a 0.10243 −0.54669 0.73296 −0.05254CEC −0.19992 0.24497 0.08548 0.93828Explained variance (%) 42 19 16 9
a Log-transformed variable.
As factors 1 and 2 can be related to farmers’ landmanagement practices, both factors were used tocharacterise spatial variability in soil properties of theterraces in a more general way that might be used toformulate strategies to improve the management ofthese soil conservation techniques. The intensity fac-tor was related to relative distance in six of the eightterraces (R2 ≥ 0.50 andP ≤ 0.10). The relationships
38 G. Dercon et al. / Soil & Tillage Research 72 (2003) 31–41
for factor 2 followed a positive logarithmic or linearpattern on four terraces of Tunzhún, where ryegrassand Kikuyu were used for the formation of the buffer-strip. On two of the experimental sites at Zhamar,which were terraces with Milın-grass as bufferstrip, aclear parabolic pattern was found, with a maximumin the middle of the terraces, at a relative distanceof 0.70. This pattern suggests that nearby the stripthere may have been some competition of Milın withthe crops on the terrace for P and NO3
−. However,further research is needed. Finally, factor 1 (COrg.,NTotal, KEx., CaEx., base saturation, pH(NaF) andPRet.) showed significant positive logarithmic relation-ships to relative distance on five terraces (R2 ≥ 0.50andP ≤ 0.10).
3.3. Assessment of chemical soil degradationon terraces
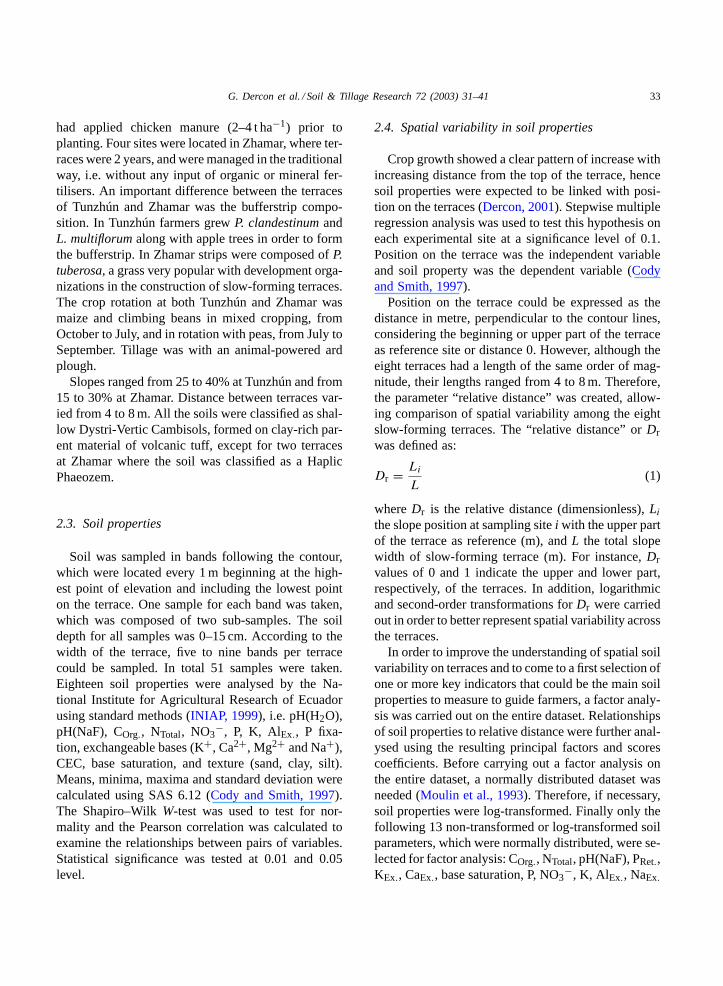
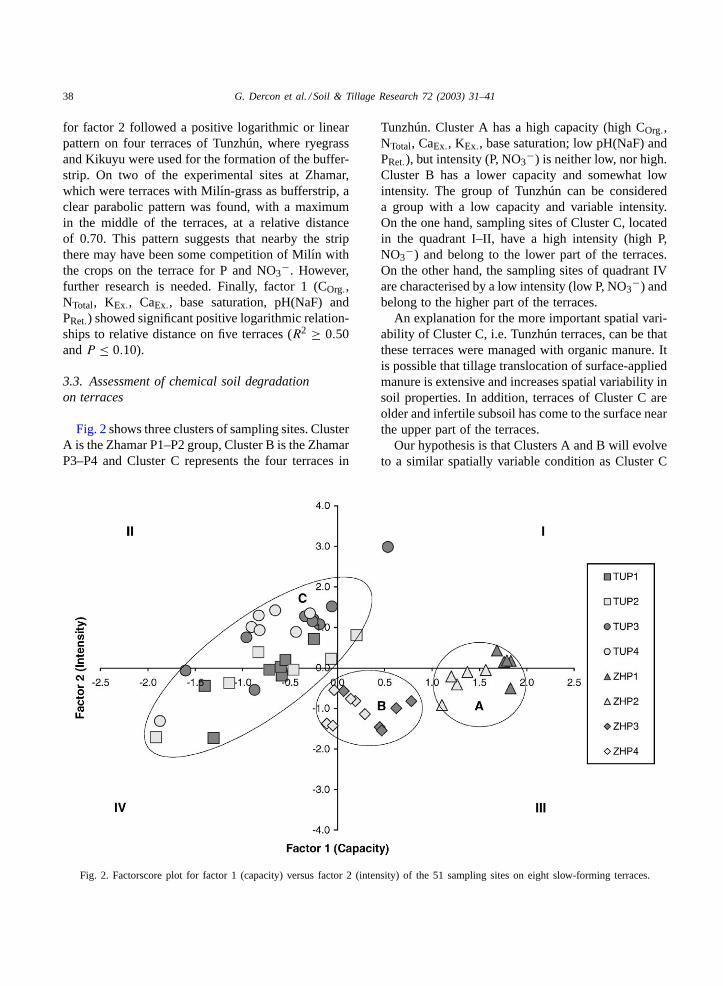
Fig. 2shows three clusters of sampling sites. ClusterA is the Zhamar P1–P2 group, Cluster B is the ZhamarP3–P4 and Cluster C represents the four terraces in
Fig. 2. Factorscore plot for factor 1 (capacity) versus factor 2 (intensity) of the 51 sampling sites on eight slow-forming terraces.
Tunzhún. Cluster A has a high capacity (high COrg.,NTotal, CaEx., KEx., base saturation; low pH(NaF) andPRet.), but intensity (P, NO3−) is neither low, nor high.Cluster B has a lower capacity and somewhat lowintensity. The group of Tunzhún can be considereda group with a low capacity and variable intensity.On the one hand, sampling sites of Cluster C, locatedin the quadrant I–II, have a high intensity (high P,NO3
−) and belong to the lower part of the terraces.On the other hand, the sampling sites of quadrant IVare characterised by a low intensity (low P, NO3
−) andbelong to the higher part of the terraces.
An explanation for the more important spatial vari-ability of Cluster C, i.e. Tunzhún terraces, can be thatthese terraces were managed with organic manure. Itis possible that tillage translocation of surface-appliedmanure is extensive and increases spatial variability insoil properties. In addition, terraces of Cluster C areolder and infertile subsoil has come to the surface nearthe upper part of the terraces.
Our hypothesis is that Clusters A and B will evolveto a similar spatially variable condition as Cluster C
G. Dercon et al. / Soil & Tillage Research 72 (2003) 31–41 39
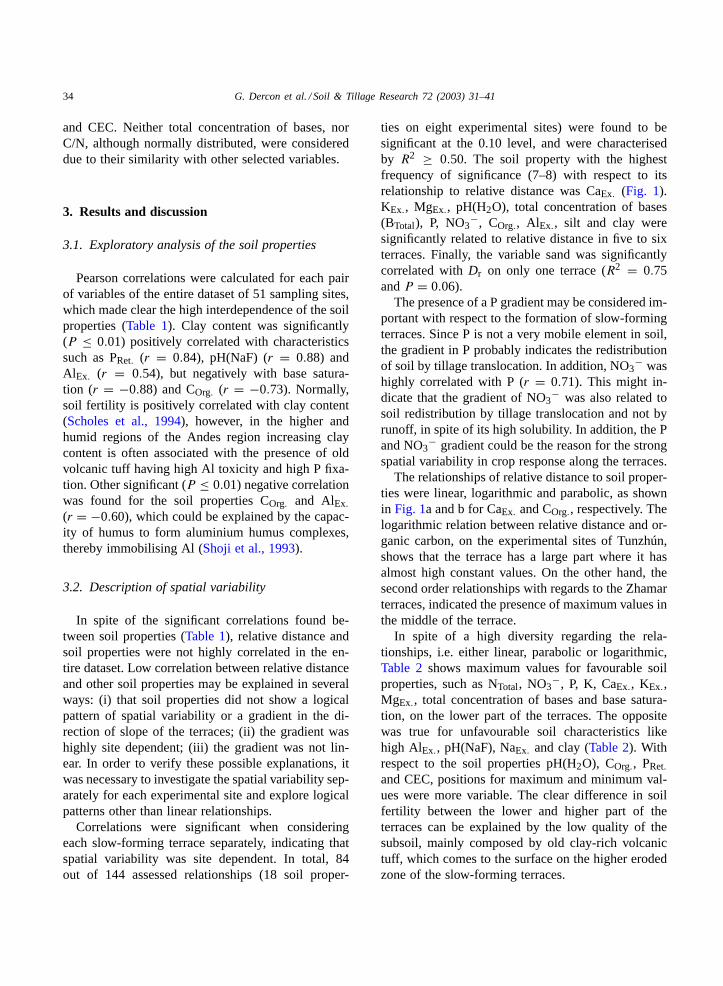
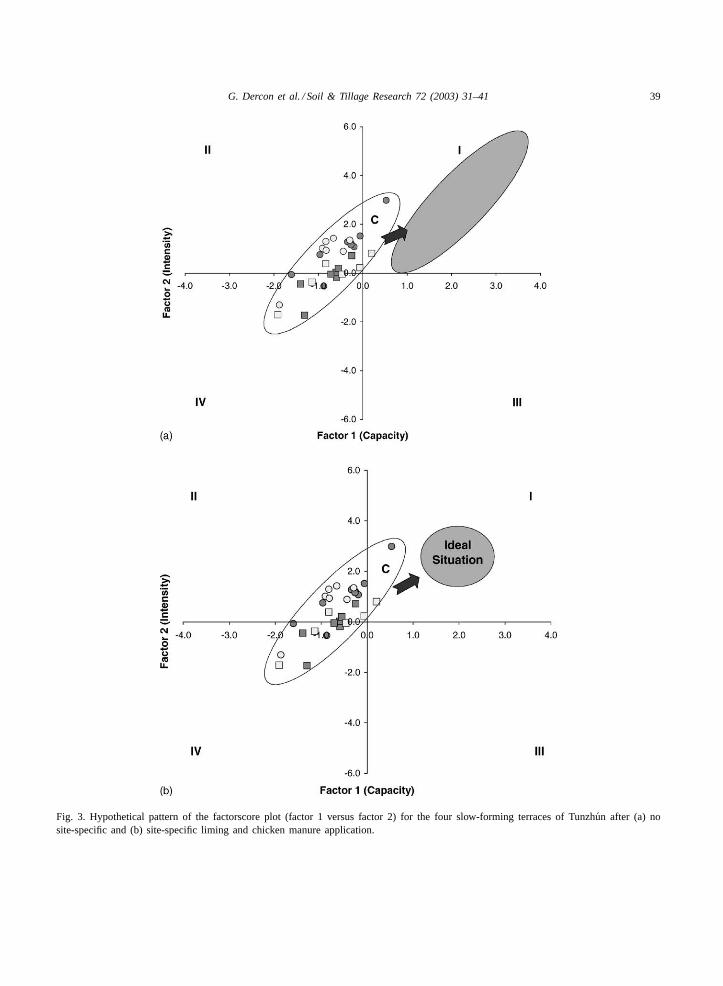
Fig. 3. Hypothetical pattern of the factorscore plot (factor 1 versus factor 2) for the four slow-forming terraces of Tunzhun after (a) nosite-specific and (b) site-specific liming and chicken manure application.
40 G. Dercon et al. / Soil & Tillage Research 72 (2003) 31–41
having low capacity and variable intensity. Once inthe quadrant IV, crop production will come to zero,and farmers will be obliged to start to use manure,such as, for instance, chicken manure, the best optionfor the farmer in the region. Nevertheless, throughtillage translocation and the absence of site-specificfertility management, spatial variability will likelyincrease.
3.4. Site-specific management on terraces
Because of the high spatial variability in soilproperties on the slow-forming terraces site-specificmanagement should be considered a part of improvedsoil management on terraces. Hypothetical patternsor scenarios for the rehabilitation of soil fertilityon terraces such as Cluster C of Tunzhún are out-lined in the following. If site-specific application oflime and manure were not employed, then a shift tohigher capacity and intensity, but with no change invariability might be expected (Fig. 3a). If lime andmanure were applied differently based on need, thencapacity and intensity might also increase, but spatialvariability would be reduced (Fig. 3b). Scenario Awould have no site-specific management, consideringthe same dose of lime and chicken manure over thewhole terrace. The problem of this type of fertilisa-tion is that on the one hand not enough is added inthe upper part and on the other hand too much isadded in the lower part. This excess could be lostfor plants because of leaching. In addition, the lowerpart would likely receive a part of the applied dosein the upper part with the next tillage operations,which would further increase spatial variability in soilproperties.
In Scenario B, an optimal situation would be toapply more fertiliser in the upper part than near thebufferstrip in order to try to homogenise soil fertilityof the terrace and hence crop productivity. In addition,because of the high spatial variability on the terracesand the low fertility of the upper part, this type ofmanagement would probably obtain higher crop pro-duction than with no site-specific management. Ofcourse, too detailed off site-specific management isnot feasible, but a compromise between the technicallyfeasible and the economically sound will be a worth-while goal for sustainable land management in thisregion.
4. Conclusions
High spatial variability in soil properties on terraceswas found. In spite of the fact that the pattern and themagnitude of spatial variation were site dependent, itwas clear that soil fertility increased from the upperto the lower part of the terraces.
In addition, the present study suggests that manage-ment strategy could influence the pattern and magni-tude of the spatial variation. As the basic formationprocess of the slow-forming terraces, i.e. soil translo-cation by tillage, induces the soil fertility gradient, areduction of the variation in soil quality and thereforecrop response along the terraces will be achieved withdifficulty, unless a site-specific soil fertility improve-ment is started. Site-specific management is dependenton having extensive reliable data. The gap betweenacquiring information and using it effectively in mak-ing agricultural management decisions has widened(Atherton et al., 1999). The present study indicates amethodology of how the data sampling by develop-ment organisations might be simplified by taking justa few key properties related to the factors, which ex-plained the highest amount of total variance, such asfactors 1 (capacity) and 2 (intensity). For instance,CaEx. for factor 1 and P for factor 2 could be the prop-erties measured.
An integrated soil management based on the appli-cation of lime and organic manure was proposed inorder to increase soil fertility of the higher parts ofthe terraces. However, as tillage erosion will not ceaseimmediately, the improved management practices willprobably not immediately offset the yield reductionsdue to tillage erosion. Another solution is reducingtillage, but this also results in decelerated formation ofthe terraces. A last possibility can be cultivating sev-eral crops of different tolerance to fertility stress alongthe terraces, which support farmers’ efforts to main-tain flexibility in the face of uncertainty rather thanprescribe farmers’ actions or provide broad packagesof recommendations aimed at intensification (Carterand Murwira, 1995). Of course, farmers will only con-sider new land management techniques if they can berelated to improved crop response, minimising risksand equal costs strategies (Dercon et al., 2001). There-fore, further research is needed on alternative strate-gies to reduce spatial variability in these high-sloperegions.
G. Dercon et al. / Soil & Tillage Research 72 (2003) 31–41 41
Acknowledgements
This study was funded by the research project‘Diagnosis and Remediation of Land Degradation inthe Austro Ecuatoriano’ of the Belgian Administra-tion for Development Corporation and the FlemishInter-University Council. The authors wish to ac-knowledge the community of Gima. A special expres-sion of gratitude goes to the different counterparts fortheir support such as Desarrollo Campesino (FAO),CREA, Plan International and ETAPA.
References
Aase, J.K., Pikul, J.L., 1995. Terrace formation in cropping stripsprotected by tall wheatgrass barriers. J. Soil Water Conserv.50, 110–112.
Agus, F., Cassel, D.K., Garrity, D.P., 1997. Soil-water and soilphysical properties under contour hedgerow systems on slopingOxisols. Soil Till. Res. 40, 185–199.
Atherton, B.C., Morgan, M.T., Shearer, S.A., Stombaugh, T.S.,Ward, A.D., 1999. Site-specific farming: a perspective oninformation needs, benefits and limitations. J. Soil WaterConserv. 54, 455–461.
Carter, S.E., Murwira, H.K., 1995. Spatial variability in soil fertilitymanagement and crop response in Mutoko communal area,Zimbabwe. Ambio 24, 77–84.
Cody, R.P., Smith, J.K., 1997. Applied Statistics and the SASProgramming Language, 4th ed. Prentice-Hall, EnglewoodCliffs, NJ.
Dabney, S.M., Liu, Z., Lane, M., Douglas, J., Zhu, J., Flanagan,D.C., 1999. Landscape benching from tillage erosion betweengrass hedges. Soil Till. Res. 51, 219–231.
Deckers, J.A., Nachtergaele, F.O., Spaargaren, O.C., 1998.World Reference Base for Soil Resources. Introduction. Acco,Belgium.
Dercon, G., 2001. Tillage erosion assessment in the AustroEcuatoriano. Ph.D. Dissertation. Katholieke UniversiteitLeuven, Belgium.
Dercon, G., Bossuyt, B., De Bièvre, B., Cisneros, F., Deckers,J., 1998. Zonificación agroecológica del Austro Ecuatoriano.Uediciones, Universidad de Cuenca, Ecuador, 148 pp.
Dercon, G., Rombaut, K., Van den Broeck, E., Govers, G., Poesen,J., Deckers, J., 1999. Tillage erosion experiments in Ecuador.Paper Presented at the Second International Symposium on
Tillage Erosion and Tillage Translocation, Leuven, Belgium,April 12–14, 1999.
Dercon, G., Loaiza, G., Tacuri, E., Sánchez, H., Tenorio, P.,Zenteno, M., Poesen, J., Govers, G., Deckers J., 2001.Paradigma de la adopción de la conservación de suelos enel Austro Ecuatoriano. In: Proceedings of the InternationalWorkshop on Estrategias para lograr la adopción de prácticasde conservación de suelos y aguas por parte de pequeñosproductores, Sucre, Bolivia, February 18–23, 2001.
INIAP, 1999. Manual de Laboratorio de Suelos INIAP EstaciónSanta Catalina: Análisis Quımico de Suelos. InstitutoNacional Autónomo de Investigaciones Agropecuarias EstaciónExperimental Santa Catalina.
Moulin, A.P., Anderson, D.W., Mellinger, M., 1993. Spatialvariability of wheat yield, soil properties and erosion inhummocky terrain. Can. J. Soil Sci. 74, 219–228.
Quine, T.A., Walling, D.E., Zhang, X., 1999. Tillage erosion,water erosion and soil quality on cultivated terraces near Xifengin the Loess Plateau, China. Land Degrad. Dev. 10, 251–274.
Scholes, R.J., Dalal, R., Singer, S., 1994. Soil physics and fertility:the effects of water, temperature and texture. In: Woomer, P.L.,Swift, M.J. (Eds.), The Biological Management of Tropical SoilFertility. Wiley, New York, pp. 117–136.
Shoji, S., Nanzyo, M., Dahlgren, R.A., 1993. Volcanic AshSoils. Genesis, Properties and Utilization. Developments in SoilScience 21. Elsevier, Amsterdam.
Stocking, M., Clark, R., 1999. Soil productivity and erosion:biophysical and farmer-perspective assessment for hillslopes.Mt. Res. Dev. 19, 191–202.
Sutikto, T., Chikamori, K., 1993. Evaluation of Philips infiltrationequation for cultivated upland terraces in Indonesia. J. Hydrol.143, 279–295.
Thapa, B.B., 1997. Contour ridge tillage and natural grass barrierstrip effects on soil erosion, soil fertility, and corn production onsloping Oxisols in the humid tropics. Ph.D. Dissertation (SoilScience). North Carolina State University, Raleigh, NC, USA.
Thapa, B.B., Cassel, D.K., Garrity, D.P., 1999. Assessment oftillage erosion rates on steepland Oxisols in the humid tropicsusing granite rocks. Soil Till. Res. 51, 233–243.
Turkelboom, F., Ongprasert, S., Taejajai, U., 1996. Soil fertilitydynamics in steep land alley farming. In: Sajjapongse, A. (Ed.),Proceedings of the Seventh Annual Meeting on the Managementof Sloping Lands for Sustainable Agriculture in Asia, DLD andIBSRAM, Chiang Mai, Thailand, October 16–20, 1995.
Turkelboom, F., Poesen, J., Ohler, I., Van Keer, K., Ongprassert,S., Vlassak, K., 1997. Assessment of tillage erosion rates onsteep slopes in northern Thailand. Catena 29, 29–44.
Related Documents


