Diversity 2010, 2, 932-945; doi:10.3390/d2060932 diversity ISSN 1424-2818 www.mdpi.com/journal/diversity Article Spatial Trends of Genetic Variation of Domestic Ruminants in Europe Denis Laloë 1, *, Katayoun Moazami-Goudarzi 1 , Johannes A. Lenstra 2 , Paolo Ajmone Marsan 3 , Pedro Azor 4 , Roswitha Baumung 5 , Daniel G. Bradley 6 , Michael W. Bruford 7 , Javier Cañón 8 , Gaudenz Dolf 9 , Susana Dunner 8 , Georg Erhardt 10 , Godfrey Hewitt 11 , Juha Kantanen 12 , Gabriela Obexer-Ruff 9 , Ingrid Olsaker 13 , Clemen Rodellar 14 , Alessio Valentini 15 , Pamela Wiener 16 , European Cattle Genetic Diversity Consortium and Econogene Consortium † 1 Génétique animale et biologie intégrative, UMR 1313, Inra, 78352 Jouy-en-Josas, France; E-Mail: [email protected] 2 Utrecht University, Utrecht, The Netherlands; E-Mail: [email protected] 3 Università Cattolica del S. Cuore, Piacenza, Italy; E-Mail: [email protected] 4 University of Córdoba, Spain; E-Mail: [email protected] 5 University of Natural Resources and Applied Life Sciences, Vienna, Austria; E-Mail: [email protected] 6 Trinity College, Dublin, Ireland; E-Mail: [email protected] 7 University of Wales, Cardiff, UK; E-Mail: [email protected] 8 Universidad Complutense de Madrid, Spain; E-Mails: [email protected] (J.C.); [email protected] (S.D.) 9 University of Berne, Switzerland; E-Mails: [email protected] (G.D.); [email protected] (G.O.-R.) 10 Justus-Liebig Universität, Giessen, Germany; E-Mail: [email protected] 11 University of East Anglia, Norwich, UK; E-Mail: [email protected] 12 MTT, Jokioinen, Finland; E-Mail: [email protected] 13 Norwegian School of Veterinary Science, Oslo, Norway; E-Mail: [email protected] 14 Universitat Autonoma de Barcelona, Spain; E-Mail: [email protected] 15 Università degli Studi di Milano, Italy; E-Mail: [email protected] 16 The Roslin Institute, University of Edinburgh, UK; E-Mail: [email protected] † The following participants of the European Cattle Genetic Diversity Consortium and the Econogene contributed to this study: P. Dobi, A. Hoda, Faculty of Agriculture, Tirana, Albania; S. Matraninon, F. Fischerleitner, BOKU University, Vienna, Austria; G. Mommens, Dr. Van Haeringen Polygen, Malle; P. Baret, A. Fadlaoui, Université Catholique, Louvain, Belgium; L.E. Holm, Danish Institute of Agricultural Sciences, Tjele, Denmark; M.A.A. El-Barody, Minia University, Egypt; P. OPEN ACCESS

Welcome message from author
This document is posted to help you gain knowledge. Please leave a comment to let me know what you think about it! Share it to your friends and learn new things together.
Transcript
Diversity 2010, 2, 932-945; doi:10.3390/d2060932
diversity ISSN 1424-2818
www.mdpi.com/journal/diversity
Article
Spatial Trends of Genetic Variation of Domestic Ruminants in
Europe
Denis Laloë 1,
*, Katayoun Moazami-Goudarzi 1, Johannes A. Lenstra
2, Paolo Ajmone Marsan
3,
Pedro Azor 4, Roswitha Baumung
5, Daniel G. Bradley
6, Michael W. Bruford
7, Javier Cañón
8,
Gaudenz Dolf 9, Susana Dunner
8, Georg Erhardt
10, Godfrey Hewitt
11, Juha Kantanen
12,
Gabriela Obexer-Ruff 9, Ingrid Olsaker
13, Clemen Rodellar
14, Alessio Valentini
15,
Pamela Wiener 16
, European Cattle Genetic Diversity Consortium and Econogene Consortium †
1 Génétique animale et biologie intégrative, UMR 1313, Inra, 78352 Jouy-en-Josas, France;
E-Mail: [email protected] 2 Utrecht University, Utrecht, The Netherlands; E-Mail: [email protected]
3 Università Cattolica del S. Cuore, Piacenza, Italy; E-Mail: [email protected]
4 University of Córdoba, Spain; E-Mail: [email protected]
5 University of Natural Resources and Applied Life Sciences, Vienna, Austria;
E-Mail: [email protected] 6 Trinity College, Dublin, Ireland; E-Mail: [email protected]
7 University of Wales, Cardiff, UK; E-Mail: [email protected]
8 Universidad Complutense de Madrid, Spain; E-Mails: [email protected] (J.C.);
[email protected] (S.D.) 9 University of Berne, Switzerland; E-Mails: [email protected] (G.D.);
[email protected] (G.O.-R.) 10
Justus-Liebig Universität, Giessen, Germany; E-Mail: [email protected] 11
University of East Anglia, Norwich, UK; E-Mail: [email protected] 12
MTT, Jokioinen, Finland; E-Mail: [email protected] 13
Norwegian School of Veterinary Science, Oslo, Norway; E-Mail: [email protected] 14
Universitat Autonoma de Barcelona, Spain; E-Mail: [email protected] 15
Università degli Studi di Milano, Italy; E-Mail: [email protected] 16
The Roslin Institute, University of Edinburgh, UK; E-Mail: [email protected]
† The following participants of the European Cattle Genetic Diversity Consortium and the Econogene
contributed to this study: P. Dobi, A. Hoda, Faculty of Agriculture, Tirana, Albania; S. Matraninon,
F. Fischerleitner, BOKU University, Vienna, Austria; G. Mommens, Dr. Van Haeringen Polygen,
Malle; P. Baret, A. Fadlaoui, Université Catholique, Louvain, Belgium; L.E. Holm, Danish Institute
of Agricultural Sciences, Tjele, Denmark; M.A.A. El-Barody, Minia University, Egypt; P.
OPEN ACCESS
Diversity 2010, 2
933
Taberlet, G. Luikart, A. Beja-Pereira, P. England, Université Joseph Fourier et Centre National de
la Recherche Scientifique, Grenoble; M. Trommetter, Université Pierre Mendes, Grenoble; A.
Oulmouden, H. Levéziel, INRA, Limoges, France; O. Jann, C. Weimann, E.-M. Prinzenberg, C.
Peter, Justus-Liebig Universität, Giessen; B. Harlizius, School of Veterinary Medicine, Hannover;
C. Looft, E.Kalm, J. Roosen, Christian-Albrechts-Universität, Kiel, Germany; A. Georgoudis,
Aristotle University, Thessaloniki; C. Ligda, National Agricultural Research Foundation,
Thessaloniki, Greece; L. Fésüs, Research Institute for Animal Breeding and Nutrition,
Herceghalom, Hungary; D.E. MacHugh, A.R. Freeman, Trinity College, Dublin, Ireland; R.
Negrini, E. Milanesi, G. Canali, Università Cattolica del S. Cuore, Piacenza, M.C. Savarese, C.
Marchitelli, L. Pariset, I. Cappuccio, Università della Tuscia, Viterbo; M. Zanotti, G. Ceriotti, M.
Cicogna, P. Crepaldi, Università degli Studi di Milano; F. Pilla, A. Bruzzone, D. Iamartino,
Università del Molise, Campobasso; A. Carta, T. Sechi, Istituto Zootecnico e Caseario per la
Sardegna, Olmedo; G. D'Urso, S. Bordonaro, D. Marletta, Università degli Studi di Catania, Italy;
M. Abo-Shehada, Jordan University of Science and Technology, Ibid, Jordan; I.J. Nijman, Utrecht
University, Utrecht; M. Felius, Rotterdam, Netherlands; Norwegian School of Veterinary Science,
Oslo, Norway; R. Niznikowski, Warsaw Agricultural University, Poland; A. Vlaic, University of
Cluj-Napoca, Romania; T. Kiselyova, All-Russian Research Institute for Farm Animals and
Breeding, St. Petersburgh-Pushkin; N. Marzanov, All-Russian Research Institute of Animal
Husbandry, Dubrovitsy; Z. Ivanova, R. Popov and I. Ammosov, Yakutian Research Institute of
Agricultural Sciences, Yakutsk, Sakha; M. Ćinkulov, University of Novi Sad, Russia; P. Zaragoza,
I. Martín-Burriel, Veterinary Faculty, Zaragoza; A. Sanchez, J. Piedrafita, Universitat Autonoma de
Barcelona; E. Rodero, University of Córdoba, Spain; K. Sandberg, Swedish University of
Agricultural Sciences, Uppsala, Sweden; G. Obexer-Ruff, M.-L. Glowatzki, University of Berne;
R. Caloz, S. Joost, Swiss Federal Institute of Technology, Lausanne, Switzerland; O. Ertugrul,
Ankara University, Ankara; I. Togan, Middle East Technical University, Ankara, Turkey; J.L.
Williams, D. Burton, Roslin Institute, UK; T. Perez, University of Wales, Cardiff; S. Dalamitra,
University of East Anglia, Norwich, UK.
* Author to whom correspondence should be addressed; E-Mail: [email protected];
Tel.: +33-1-34-65-22-00; Fax: +33-1-34-65-22-11.
Received: 14 May 2010; in revised form: 1 June 2010 / accepted: 8 June 2010 /
Published: 17 June 2010
Abstract: The introduction of livestock species in Europe has been followed by various
genetic events, which created a complex spatial pattern of genetic differentiation. Spatial
principal component (sPCA) analysis and spatial metric multidimensional scaling (sMDS)
incorporate geography in multivariate analysis. This method was applied to three
microsatellite data sets for 45 goat breeds, 46 sheep breeds, and 101 cattle breeds from
Europe, Southwest Asia, and India. The first two sPCA coordinates for goat and cattle, and
the first sPCA coordinate of sheep, correspond to the coordinates of ordinary PCA
Diversity 2010, 2
934
analysis. However, higher sPCA coordinates suggest, for all three species, additional
spatial structuring. The goat is the most geographically structured species, followed by
cattle. For all three species, the main genetic cline is from southeast to northwest, but other
geographic patterns depend on the species. We propose sPCA and sMDS to be useful tools
for describing the correlation of genetic variation with geography.
Keywords: cattle; sheep; goat; diversity; spatial structure; PCA; sPCA; Multidimensional
scaling; Moran’s I
1. Introduction
Livestock breeds have been shaped by centuries of human selection and adaptation to different
environments. Various demographic events have created geographic patterns of genetic diversity [1],
such as domestication, migration, selection, isolation, and expansion of successful breeds. Several
techniques have been developed to analyze spatial patterns of genetic variation among
populations [2,3]. One widely used approach is the analysis of spatial auto-correlation [4-6], which is
detected if proximate individuals or populations are, for a given variable, more similar or dissimilar
than expected for a random distribution.
An alternative method for the detection of spatial patterns is based on multivariate analysis of
genetic variation, and in particular, upon the Principal Components Analysis (PCA) [7,8]. The
technique, of plotting the values of the synthetic coordinates of a factorial map onto a geographic map,
has been pioneered by Cavalli-Sforza for the reconstruction of the early history of human
populations [9]. For African cattle, different Principal Components (PC) were proposed to correspond
to migrations of taurine and indicine ancestral populations [10]. PCA has several attractive features:
(1) It is exploratory, since no genetic model is assumed, such as the Hardy-Weinberg equilibrium or
the models that assume the absence of linkage disequilibrium [11]; (2) Different forms of genetic
structuring can be revealed, as clines, local contrasts, or relationships of distant populations [12]; (3)
Alleles and markers may be classified on the basis of their contributions to the different factors [11];
(4) It is not computer intensive and can be applied to large data sets. The power of PCA with large
SNP data sets was demonstrated by Novembre et al. [13], who observed a very high correlation
between the positions in a PCA plot and human geographic origin.
However, multivariate methods may fail to detect spatial structuring if this is not associated with the
most pronounced genetic differentiation. For a more complete characterization of spatial structures, the
analysis has to focus on the part of the variance that is spatially structured [14]. This can be
accomplished by using spatial information as a component of the optimized criterion. Therefore,
Thioulouse et al. [15] built on the work of Wartenberg [16] in order to explicitly integrate geography
into multivariate factorial methods. Jombart [14,17] specifically developed a spatial Principal
Component Analysis (sPCA) suitable for genetic allelic frequencies data. It was shown that sPCA
retrieves simple structures as well as more complex patterns of genotypes or populations, and
performs, in this respect, better than PCA.
Diversity 2010, 2
935
Many European livestock breeds have been analyzed with molecular markers [18]. Most studies
used the polymorphic microsatellites, but so far, multivariate analysis has only been carried out for
regional panels of breeds [11]. In this paper, we apply sPCA and spatial multidimensional scaling
(sMDS) to the analysis of comprehensive microsatellite data sets for goat [19], cattle [20,21], and
sheep [22]. We show that spatial methods detect significant geographic trends, which partially depend
on the species.
2. Material and Methods
2.1. Spatial “Principal Components Analysis” (sPCA)
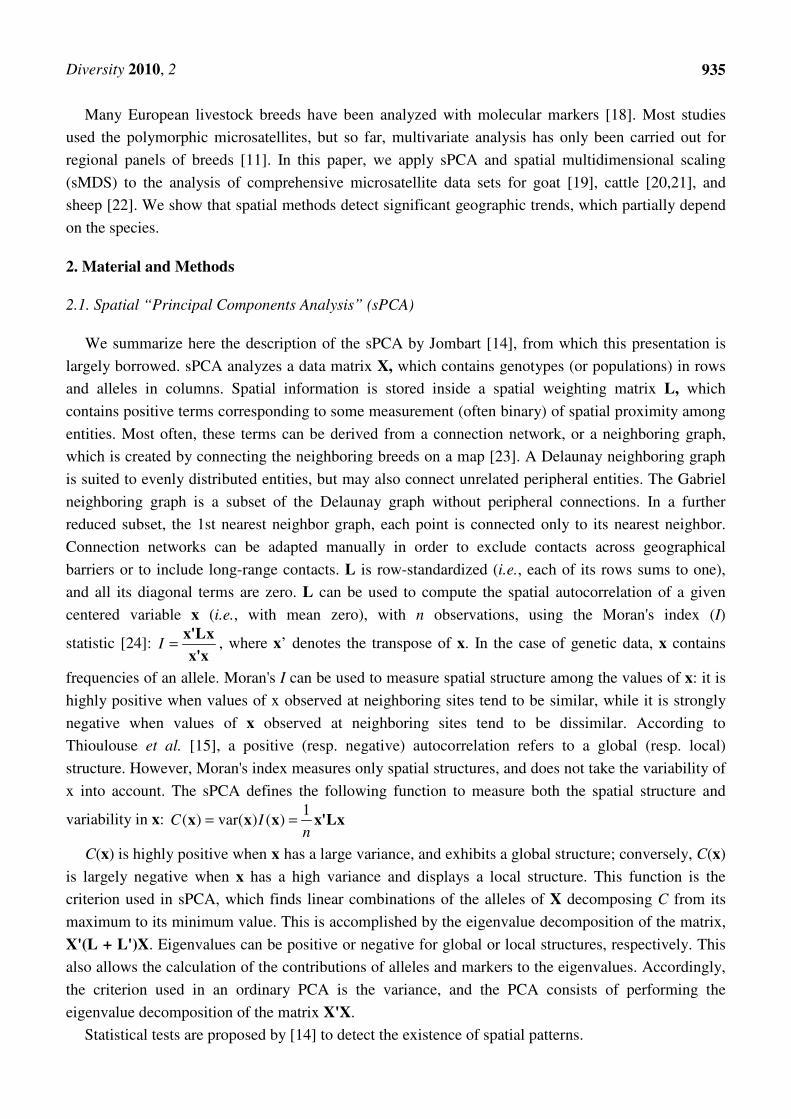
We summarize here the description of the sPCA by Jombart [14], from which this presentation is
largely borrowed. sPCA analyzes a data matrix X, which contains genotypes (or populations) in rows
and alleles in columns. Spatial information is stored inside a spatial weighting matrix L, which
contains positive terms corresponding to some measurement (often binary) of spatial proximity among
entities. Most often, these terms can be derived from a connection network, or a neighboring graph,
which is created by connecting the neighboring breeds on a map [23]. A Delaunay neighboring graph
is suited to evenly distributed entities, but may also connect unrelated peripheral entities. The Gabriel
neighboring graph is a subset of the Delaunay graph without peripheral connections. In a further
reduced subset, the 1st nearest neighbor graph, each point is connected only to its nearest neighbor.
Connection networks can be adapted manually in order to exclude contacts across geographical
barriers or to include long-range contacts. L is row-standardized (i.e., each of its rows sums to one),
and all its diagonal terms are zero. L can be used to compute the spatial autocorrelation of a given
centered variable x (i.e., with mean zero), with n observations, using the Moran's index (I)
statistic [24]: I =x'Lx
x'x, where x’ denotes the transpose of x. In the case of genetic data, x contains
frequencies of an allele. Moran's I can be used to measure spatial structure among the values of x: it is
highly positive when values of x observed at neighboring sites tend to be similar, while it is strongly
negative when values of x observed at neighboring sites tend to be dissimilar. According to
Thioulouse et al. [15], a positive (resp. negative) autocorrelation refers to a global (resp. local)
structure. However, Moran's index measures only spatial structures, and does not take the variability of
x into account. The sPCA defines the following function to measure both the spatial structure and
variability in x: 1
( ) var( ) ( )C In
= =x x x x'Lx
C(x) is highly positive when x has a large variance, and exhibits a global structure; conversely, C(x)
is largely negative when x has a high variance and displays a local structure. This function is the
criterion used in sPCA, which finds linear combinations of the alleles of X decomposing C from its
maximum to its minimum value. This is accomplished by the eigenvalue decomposition of the matrix,
X'(L + L')X. Eigenvalues can be positive or negative for global or local structures, respectively. This
also allows the calculation of the contributions of alleles and markers to the eigenvalues. Accordingly,
the criterion used in an ordinary PCA is the variance, and the PCA consists of performing the
eigenvalue decomposition of the matrix X'X.
Statistical tests are proposed by [14] to detect the existence of spatial patterns.
Diversity 2010, 2
936
A geographic map, in which component scores each correspond to a different color, may give a
synthetic representation of the spatial structures. These plots can show up to three scores at the same
time by translating each score into a channel of colors (first, red; second, green; third, blue) [24].
2.2. Spatial Analysis on metric Multidimensional Scaling (Principal Coordinates Analysis)
The use of neighboring relationships can be extended to other types of multivariate analyses [15].
Among them, the Principal Coordinates Analysis or metric Multidimensional Scaling (MDS) [25], is
commonly used to infer genetic structuring among genotypes or populations by summarizing a matrix
of genetic distances.
Like PCA, MDS produces a set of orthogonal axes, which are ranked according to their
eigenvalues. In the case of Euclidean distances, MDS behaves in a Euclidean manner. Running an
MDS on the canonical Euclidean distance yields the same results as a PCA would. MDS on non-
Euclidean distances generates negative eigenvalues, meaning that some of the dimensions are not in
real space. In most cases, this does not affect the representation of objects on the first axes, but this can
also be problematic. Functions exist to test whether distances are Euclidean [26]. Although any non-
Euclidean distances can be converted into Euclidean ones [27,28], it seems sensible to choose a
distance which is not too far from being Euclidean.
Two commonly used genetic distances, the Roger's distance [29], and the pairwise Fst [30], are
Euclidean. The Reynold’s distance is considered to be either Euclidean [31] or non-Euclidean [32],
while its calculation formula also varies, according to the authors [33-35].
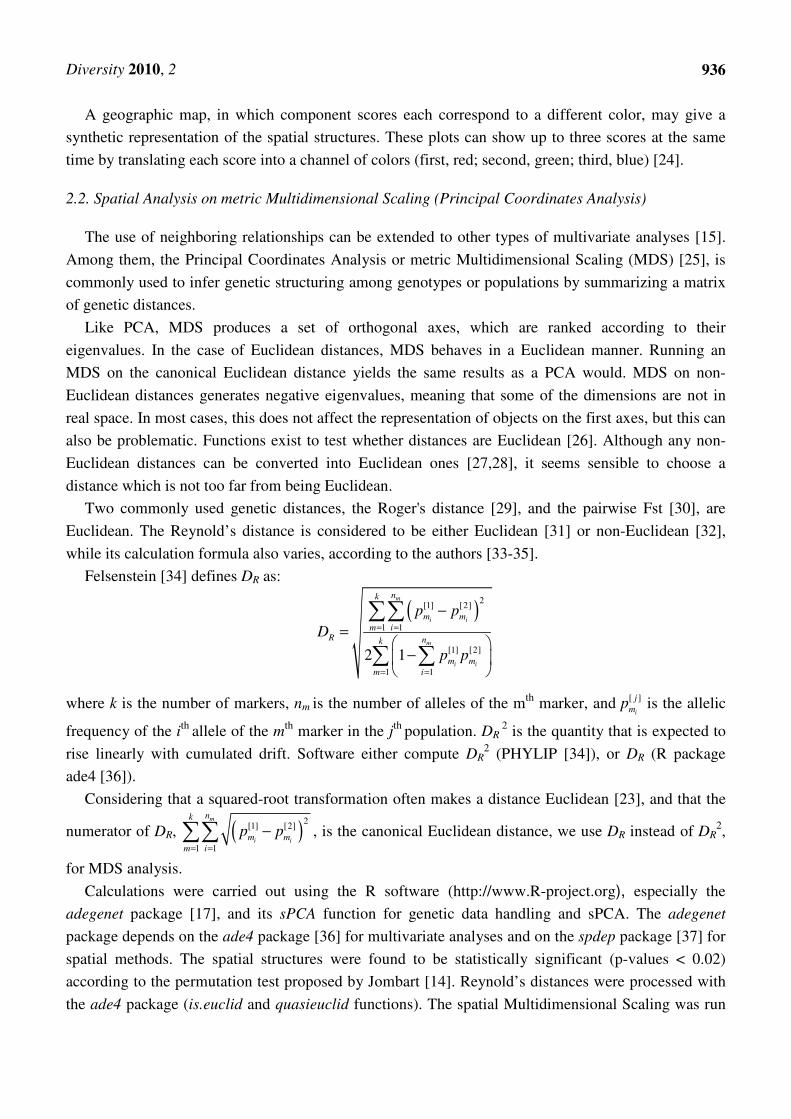
Felsenstein [34] defines DR as:
( )2
[1] [2]
1 1
[1] [2]
1 1
2 1
m
i i
m
i i
nk
m m
m iR nk
m m
m i
p p
D
p p
= =
= =
−
=
−
∑∑
∑ ∑
where k is the number of markers, nm is the number of alleles of the mth
marker, and[ ]
i
j
mp is the allelic
frequency of the ith
allele of the mth
marker in the jth
population. DR 2 is the quantity that is expected to
rise linearly with cumulated drift. Software either compute DR2 (PHYLIP [34]), or DR (R package
ade4 [36]).
Considering that a squared-root transformation often makes a distance Euclidean [23], and that the
numerator of DR, ( )2
[1] [2]
1 1
m
i i
nk
m m
m i
p p= =
−∑∑ , is the canonical Euclidean distance, we use DR instead of DR2,
for MDS analysis.
Calculations were carried out using the R software (http://www.R-project.org), especially the
adegenet package [17], and its sPCA function for genetic data handling and sPCA. The adegenet
package depends on the ade4 package [36] for multivariate analyses and on the spdep package [37] for
spatial methods. The spatial structures were found to be statistically significant (p-values < 0.02)
according to the permutation test proposed by Jombart [14]. Reynold’s distances were processed with
the ade4 package (is.euclid and quasieuclid functions). The spatial Multidimensional Scaling was run
Diversity 2010, 2
937
with the ade4 package (multispati and dudi.co function). An R script for the calculation is listed in the
supplementary material.
2.3. Data Sets
Genotypes of 30 microsatellites in 45 goat breeds [19] and of 31 microsatellites in 46 sheep
breeds [22] (after the removal of Merino-derived breeds), were generated during the EU Econogene
project (www.econogene.eu). The cattle data set with the genotypes of 19 microsatellites in 101 breeds
combined data generated during the EU project, ResGEN 98-118 [20], with data from Southwestern-
Asian and Indian [38], Scandinavian [39], Northern Asian [39], Andalusian [40], and Austrian (R.
Baumung, unpublished data) breeds. All the genotypes have been standardized with common reference
samples. Breed names, countries of origin, codes, and geographical coordinates of breeds are in the
supplementary tables S1 through S3 (supplementary section). The locations of the breeds are
visualized in Figure S1.
3. Results and Discussion
3.1. Comparison of Methods of Analyses
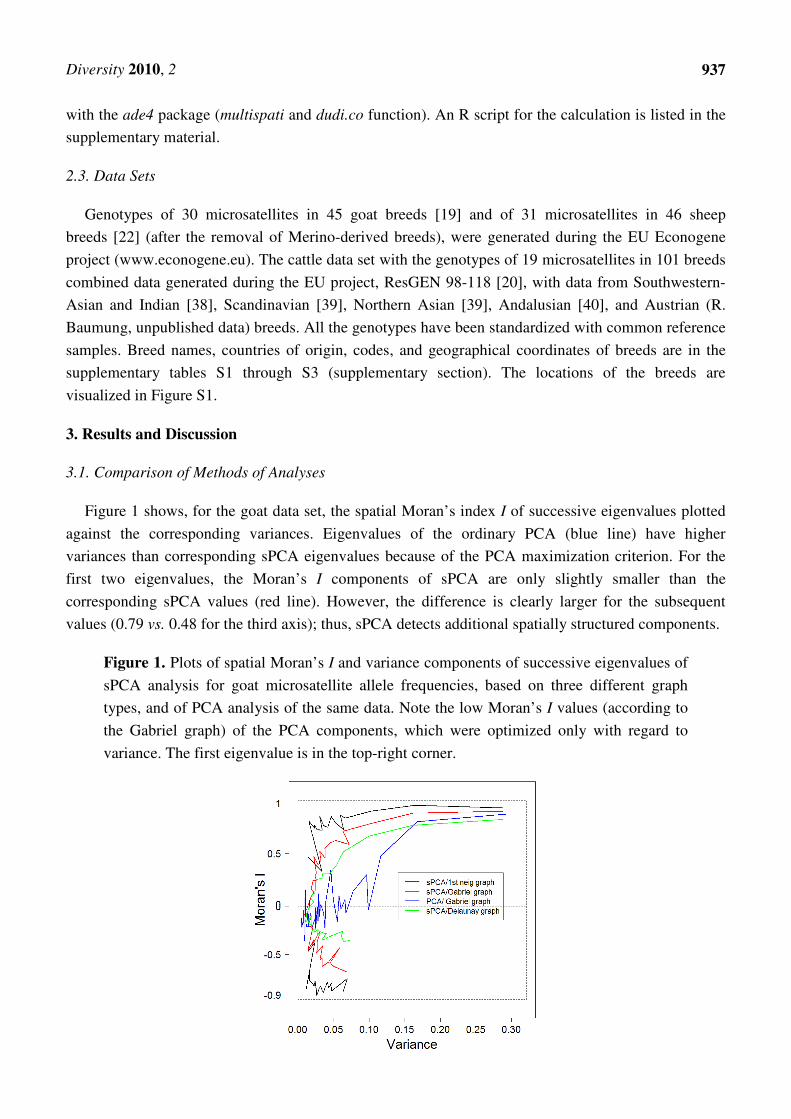
Figure 1 shows, for the goat data set, the spatial Moran’s index I of successive eigenvalues plotted
against the corresponding variances. Eigenvalues of the ordinary PCA (blue line) have higher
variances than corresponding sPCA eigenvalues because of the PCA maximization criterion. For the
first two eigenvalues, the Moran’s I components of sPCA are only slightly smaller than the
corresponding sPCA values (red line). However, the difference is clearly larger for the subsequent
values (0.79 vs. 0.48 for the third axis); thus, sPCA detects additional spatially structured components.
Figure 1. Plots of spatial Moran’s I and variance components of successive eigenvalues of
sPCA analysis for goat microsatellite allele frequencies, based on three different graph
types, and of PCA analysis of the same data. Note the low Moran’s I values (according to
the Gabriel graph) of the PCA components, which were optimized only with regard to
variance. The first eigenvalue is in the top-right corner.
Diversity 2010, 2
938
In order to optimize the sPCA, we compared the performance of the Delaunay, Gabriel, and 1st
neighbor graphs of the goat breeds (Figure 1 and Figure S2). The shapes of sPCA lines are similar for
the first three eigenvalues, showing a slight decrease of I values and a larger decrease of the variances.
The 1st neighbor graph connects each breed only to its closest neighbor, resulting in high I values, but
neglects other geographic information. The Delaunay graph connects very distant breeds, such as
southern Spanish and Saudian breeds. The Gabriel graph appears to be a good compromise between
the 1st neighbor graph and the Delaunay neighbor graph, and is used for subsequent sPCA analyses.
However, correlations of the breed scores obtained by the different graph types are close to one
(Table S4), so results are robust with respect to the choice of the graph.
A spatial multidimensional scaling was performed based on Reynold’s genetic distances, DR, and
the Gabriel neighboring graph. Reynold’s distances were empirically checked for euclideanarity and
shown to be almost Euclidean.
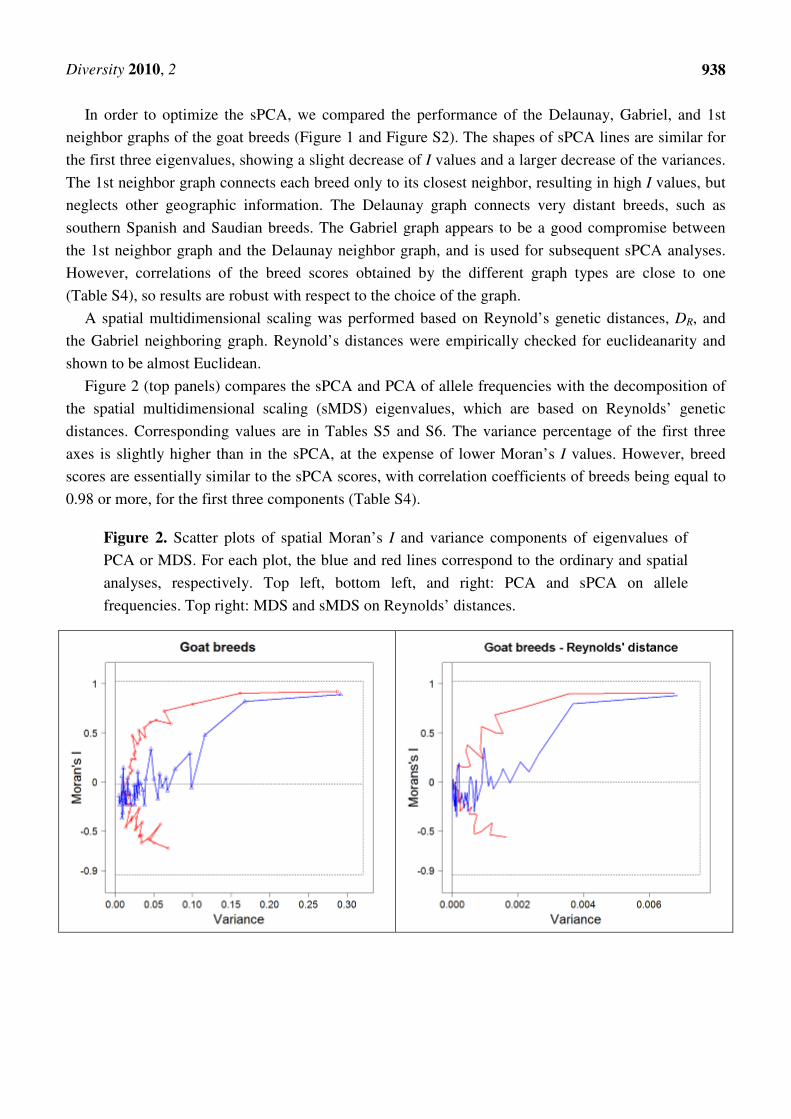
Figure 2 (top panels) compares the sPCA and PCA of allele frequencies with the decomposition of
the spatial multidimensional scaling (sMDS) eigenvalues, which are based on Reynolds’ genetic
distances. Corresponding values are in Tables S5 and S6. The variance percentage of the first three
axes is slightly higher than in the sPCA, at the expense of lower Moran’s I values. However, breed
scores are essentially similar to the sPCA scores, with correlation coefficients of breeds being equal to
0.98 or more, for the first three components (Table S4).
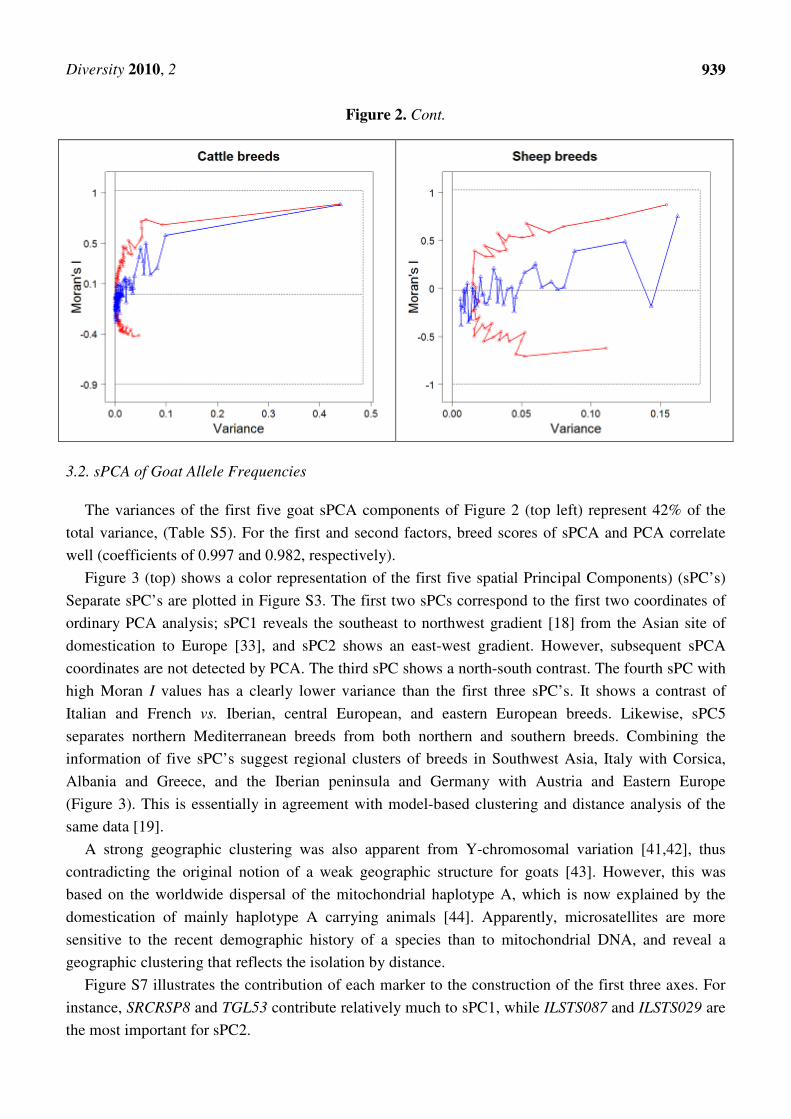
Figure 2. Scatter plots of spatial Moran’s I and variance components of eigenvalues of
PCA or MDS. For each plot, the blue and red lines correspond to the ordinary and spatial
analyses, respectively. Top left, bottom left, and right: PCA and sPCA on allele
frequencies. Top right: MDS and sMDS on Reynolds’ distances.
Diversity 2010, 2
939
Figure 2. Cont.
3.2. sPCA of Goat Allele Frequencies
The variances of the first five goat sPCA components of Figure 2 (top left) represent 42% of the
total variance, (Table S5). For the first and second factors, breed scores of sPCA and PCA correlate
well (coefficients of 0.997 and 0.982, respectively).
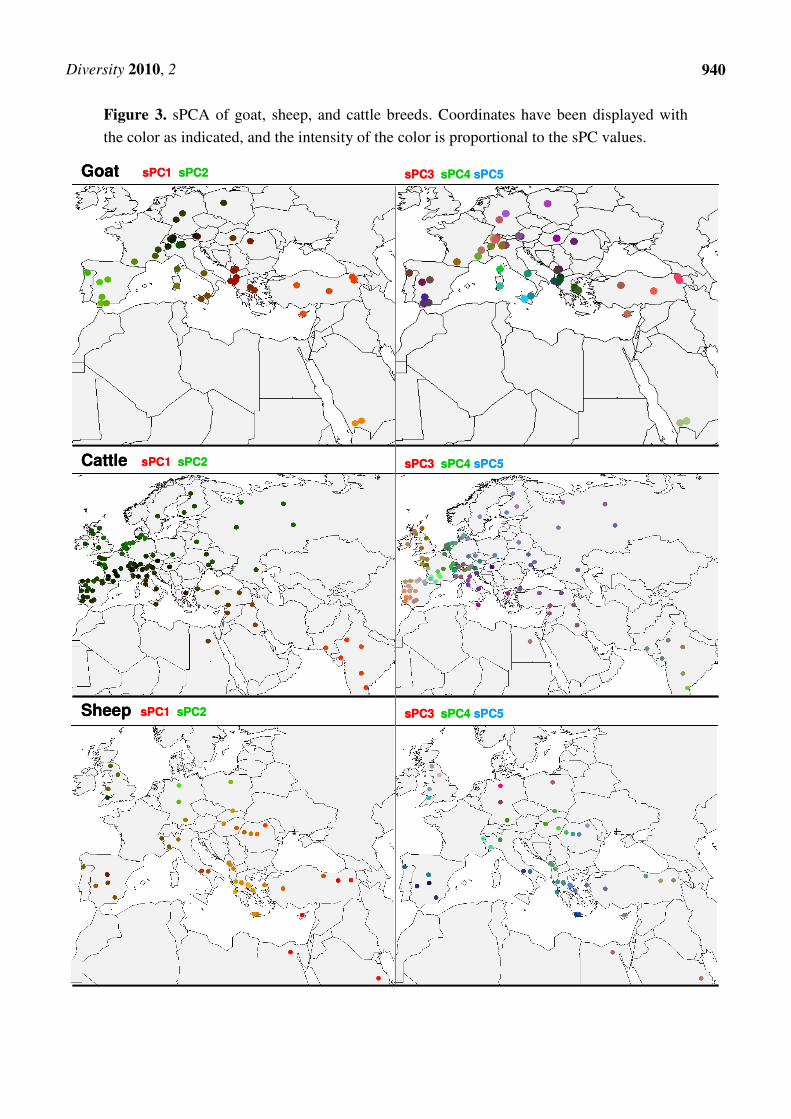
Figure 3 (top) shows a color representation of the first five spatial Principal Components) (sPC’s)
Separate sPC’s are plotted in Figure S3. The first two sPCs correspond to the first two coordinates of
ordinary PCA analysis; sPC1 reveals the southeast to northwest gradient [18] from the Asian site of
domestication to Europe [33], and sPC2 shows an east-west gradient. However, subsequent sPCA
coordinates are not detected by PCA. The third sPC shows a north-south contrast. The fourth sPC with
high Moran I values has a clearly lower variance than the first three sPC’s. It shows a contrast of
Italian and French vs. Iberian, central European, and eastern European breeds. Likewise, sPC5
separates northern Mediterranean breeds from both northern and southern breeds. Combining the
information of five sPC’s suggest regional clusters of breeds in Southwest Asia, Italy with Corsica,
Albania and Greece, and the Iberian peninsula and Germany with Austria and Eastern Europe
(Figure 3). This is essentially in agreement with model-based clustering and distance analysis of the
same data [19].
A strong geographic clustering was also apparent from Y-chromosomal variation [41,42], thus
contradicting the original notion of a weak geographic structure for goats [43]. However, this was
based on the worldwide dispersal of the mitochondrial haplotype A, which is now explained by the
domestication of mainly haplotype A carrying animals [44]. Apparently, microsatellites are more
sensitive to the recent demographic history of a species than to mitochondrial DNA, and reveal a
geographic clustering that reflects the isolation by distance.
Figure S7 illustrates the contribution of each marker to the construction of the first three axes. For
instance, SRCRSP8 and TGL53 contribute relatively much to sPC1, while ILSTS087 and ILSTS029 are
the most important for sPC2.
Diversity 2010, 2
940
Figure 3. sPCA of goat, sheep, and cattle breeds. Coordinates have been displayed with
the color as indicated, and the intensity of the color is proportional to the sPC values.
Goat sPC1 sPC2 sPC3 sPC4 sPC5
Cattle sPC1 sPC2 sPC3 sPC4 sPC5
Sheep sPC1 sPC2 sPC3 sPC4 sPC5
Goat sPC1 sPC2 sPC3 sPC4 sPC5
Cattle sPC1 sPC2 sPC3 sPC4 sPC5
Sheep sPC1 sPC2 sPC3 sPC4 sPC5
Diversity 2010, 2
941
3.3. sPCA of Cattle Allelic Frequencies
For cattle, the first five components of sPCA represent 41% of the total variance (Figure 2,
Table S7). Again, the two components of sPCA and PCA have similar variances and Moran’s I.
However, sPCA detects additional geographical structuring. The first sPC (Figures 3, S4) shows a
strong structuring along a southeast to northwest cline, and corresponds to a gradient from Indian zebu
to European taurine cattle [38,45]. The second sPC separates northern from southern European breeds.
These results agree with archeological data [46], which reveal that farmers spread from the Fertile
Crescent to Northwestern Europe, following two main colonization routes, along the river Danube and
along the Mediterranean coasts. A north-south contrast was also apparent from previous microsatellite
data [47], AFLP genotypes [21], and Y-chromosomal variation [48]. The third sPC is not detected by
ordinary PCA and mainly emphasizes breeds near the Atlantic coast. In combination with sPC4 and
sPC5, this generates a pattern that differentiates mainly Central-European breeds from the surrounding
Atlantic, Mediterranean, and Nordic breeds. The first five sPC’s together show a pronounced
geographic structure of the genetic variation in European and Southwest-Asian cattle.
The first component has a large contribution of HEL13 (14%, Figure S3), which has zebu-specific
alleles [49]. The third component is dominated by the microsatellite ETH10 (13%), which is linked to
the Silver gene [50] and to another QTL affecting a growth trait, possibly the myf 5 gene [51].
3.4. sPCA of Sheep Allelic Frequencies
The first five sheep sPCs (Figures 2, 3, Figure S5, and Table S8) represent only 33.8% of the total
variation. However, sheep shares, with cattle and goat, the southwest to northwest cline represented by
sPC1. This is also the only component that corresponds to a PCA component. The second and third
sPCs differentiate mainly in the north-south direction, and sPC4 and sPC5 highlight central European
breeds. As for cattle and goat, the subsequent sPCs represent less than 3% of the variation with the
exception of sPC45 (Figure 2), which has an appreciable variance (6.5% of the total variance) and a
strongly negative auto-correlation -0.62. This clear local structure corresponds to the genetic contrast
between the German breeds DEGGH and DERHO, and to a lesser extent, to the difference between the
English breeds UKEXH and UKSDL (Figure S6). Since these breeds also have low allelic richness and
expected heterozygosity [22] (see Figure S6), this can be explained by genetic drift in relatively small
and isolated populations.
The relatively strong north-south contrast of the first three components may be explained by the
effect of climate, but also to the contrasts of the English and Merino-types of breeds, which both have
been used frequently for crossbreeding. Relatively weak geographic structuring was also indicated by
model-based clustering and may be caused by a higher level of crossbreeding. Presumably, this reflects
a more economically oriented style of husbandry for sheep than for goats [18], but may have eroded
geographic structures of older origin.
Diversity 2010, 2
942
4. Conclusion
We conclude that the sPCA allows for a more sensitive detection of geographic structuring than
ordinary PCA would, and provides both quantitative and qualitative comparisons of species inhabiting
the same region. Geographic trends are strong for goat, intermediate for cattle, and relatively weak for
sheep. Our analysis reveals for all three ruminant livestock species a major cline from the southeast to
the northwest. In addition, the analysis shows the differences between the species’ genetic patterns in
Europe: for goats, a genetic compartmentalization of Central European and Mediterranean regions; for
cattle, a contrast between the central continent and the peripheral isles or peninsulas; and for sheep, the
most clear north-south contrast, and a local structure mainly due to genetic drift.
For goat and cattle (not shown), we found a good agreement of sPCA and sMDS. Although slightly
lower Moran I values show that sMDS is slightly less sensitive for the detection of geographic
structure, sMDS extends the spatial analysis to distance data sets, provided that distances are Euclidean
or almost Euclidean, which seems to be the case for the Reynold’s distance. These may be particularly
useful for meta-analysis of data sets with overlapping marker panels, for which it has been shown that
the Reynolds’ distance is relatively insensitive to the category or panel of markers (unpublished
results; [21]).
Differential contributions of markers to the coordinates may be suggestive of the effects of
selection. An interesting perspective is the localization of functional traits by spatial analysis of
high-density genotyping data [52,53].
Acknowledgements
This work has been partially supported by the European Commission (projects ResGEN 09-118 and
Econogene QLK5-CT2001-2641). We thank the reviewers for their useful suggestions.
References
1. Novembre, J.; Di Rienzo, A. Spatial patterns of variation due to natural selection in humans. Nat.
Rev. Genet. 2009, 10, 745-755.
2. Diniz-Filho, J.A.F.; Nabout, J.C.; Telles, M.P.d.C.; Soares, T.N.; Rangel, T.F.L.V.B. A review of
techniques for spatial modeling in geographical, conservation and landscape genetics. Genet. Mol.
Biol. 2009, 32, 203-211.
3. Manel, S.; Schwartz, M.K.; Luikart, G.; Taberlet, P. Landscape genetics: combining landscape
ecology and population genetics. Trends Ecol. Evol. 2003, 18, 189-197.
4. Sokal, R.R.; Wartenberg, D.E. A test of spatial autocorrelation analysis using an
isolation-by-distance model. Genetics 1983, 105, 219-237.
5. Bertorelle, G.; Barbujani, G. Analysis of DNA diversity by spatial autocorrelation. Genetics 1995,
140, 811-819.
6. Smouse, P.E.; Peakall, R. Spatial autocorrelation analysis of individual multiallele and multilocus
genetic structure. Heredity 1999, 82, 561-573.
Diversity 2010, 2
943
7. Pearson, K. On lines and planes of closest fit to systems of points in space. Philos. Mag. 1901, 2,
559-572.
8. Patterson, N.; Price, A.L.; Reich, D. Population structure and eigenanalysis. PLoS Genet. 2006, 2,
2074-2093.
9. Cavalli-Sforza, L.L. Population structure and human evolution. Proc. R. Soc. B 1966, 164,
362-379.
10. Hanotte, O.; Bradley, D.G.; Ochieng, J.W.; Verjee, Y.; Hill, E.W.; Rege, J.E.O. African
pastoralism: Genetic imprints of origins and migrations. Science 2002, 296, 336-339.
11. Moazami-Goudarzi, K.; Laloe, D. Is a multivariate consensus representation of genetic
relationships among populations always meaningful? Genetics 2002, 162, 473-484.
12. Jombart, T.; Pontier, D.; Dufour, A.B. Genetic markers in the playground of multivariate analysis.
Heredity 2009, 102, 330-341.
13. Novembre, J.; Johnson, T.; Bryc, K.; Kutalik, Z.; Boyko, A.R.; Auton, A.; Indap, A.; King, K.S.;
Bergmann, S.; Nelson, M.R.; Stephens, M.; Bustamante, C.D. Genes mirror geography within
Europe. Nature 2008, 456, 98-101.
14. Jombart, T.; Devillard, S.; Dufour, A.B.; Pontier, D. Revealing cryptic spatial patterns in genetic
variability by a new multivariate method. Heredity 2008, 101, 92-103.
15. Thioulouse, J.; Chessel, D.; Champely, S. Multivariate analysis of spatial patterns: a unified
approach to local and global structures. Environ. Ecol. Stat. 1995, 2, 1-14.
16. Wartenberg, D. Spatial autocorrelation as a criterion for retaining factors in ordinations of
geographic data. Math. Geol. 1985, 17, 665-682.
17. Jombart, T. Adegenet: a R package for the multivariate analysis of genetic markers.
Bioinformatics 2008, 24, 1403-1405.
18. Groeneveld, L.F.; Lenstra, J.A.; Eding, H.; Toro, M.A.; Scherf, B.; Pilling, D.; Negrini, R.;
Finlay, E.K.; Jianlin, H.; Groeneveld, E.; Weigend, S. GLOBALDIV Consortium. Genetic
diversity in farm animals - a review. Anim. Genet. 2010, 41, 6-31.
19. Canon, J.; Garcia, D.; Garcia-Atance, M.A.; Obexer-Ruff, G.; Lenstra, J.A.; Ajmone-Marsan, P.;
Dunner, S. ECONOGENE Consortium. Geographical partitioning of goat diversity in Europe and
the Middle East. Anim. Genet. 2006, 37, 327-334.
20. Lenstra, J.A. European Cattle Genetic Diversity Consortium. Marker-assisted conservation of
European cattle breeds: an evaluation. Anim. Genet. 2006, 37, 475-481.
21. Negrini, R.; Nijman, I.J.; Milanesi, E.; Moazami-Goudarzi, K.; Williams, J.L.; Erhardt, G.;
Dunner, S.; Rodellar, C.; Valentini, A.; Bradley, D.G.; Olsaker, I.; Kantanen, J.; Ajmone-Marsan,
P.; Lenstra, J.A. European Cattle Genetic Diversity Consortium. Differentiation of european cattle
by AFLP fingerprinting. Anim. Genet. 2007, 38, 60-66.
22. Peter, C.; Bruford, M.; Perez, T.; Dalamitra, S.; Hewitt, G.; Erhardt, G. ECONOGENE
Consortium. Genetic diversity and subdivision of 57 European and Middle-Eastern sheep breeds.
Anim. Genet. 2007, 38, 37-44.
23. Legendre, P.; Legendre, L. Numerical Ecology, 2nd English ed.; Elsevier Science BV:
Amsterdam, The Netherlands, 1998.
24. Piazza, A.; Menozzi, P.; Cavallisforza, L.L. Synthetic gene-frequency maps of man and selective
effects of climate. Proc. Natl. Acad. Sci. USA. 1981, 78, 2638-2642.
Diversity 2010, 2
944
25. Gower, J. Some distance properties of latent root and vector methods used in multivariate
analysis. Biometrika 1966, 53, 325-338.
26. Gower, J.C.; Legendre, P. Metric and Euclidean properties of dissimilarity coefficients. J. Classif.
1986, 3, 5-48.
27. Lingoes, J. Some boundary conditions for a monotone analysis of symmetric matrices.
Psychometrika 1971, 36, 195-203.
28. Cailliez, F. The analytic solution of the additive constant. Psychometrika 1983, 48, 305-310.
29. Baker, A.J.; Moeed, A. Rapid genetic differentiation and founder effect in colonizing populations
of common mynas (acridotheres-tristis). Evolution 1987, 41, 525-538.
30. Zhivotovsky, L.A.; Rosenberg, N.A.; Feldman, M.W. Features of evolution and expansion of
modern humans, inferred from genomewide microsatellite markers. Am. J. Hum. Genet. 2003, 72,
1171-1186.
31. Fullaondo, A.; Vicario, A.; Aguirre, A.; Barrena, I.; Salazar, A. Quantitative analysis of
two-dimensional gel electrophoresis protein patterns: a method for studying genetic relationships
among Globodera pallida populations. Heredity 2001, 87, 266-272.
32. Reif, J.C.; Melchinger, A.E.; Frisch, M. Genetical and mathematical properties of similarity and
dissimilarity coefficients applied in plant breeding and seed bank management. Crop Sci. 2005,
45, 1-7.
33. Reynolds, J.; Weir, B.S.; Cockerham, C.C. Estimation of the Coancestry Coefficient: Basis for a
Short-Term Genetic Distance. Genetics 1983, 105, 767-779.
34. Felsenstein, J. PHYLIP—Phylogeny Inference Package (Version 3.2). Cladistics 1989, 5,
164-166.
35. Weir, B.S. Genetic Data Analysis; Sinauer Associates: Sunderland, MA, USA, 1990.
36. Chessel, D.; Dufour, A.B.; Thioulouse, J. The ade4 package. I. One-table methods. R News 2004,
4, 5-10.
37. Bivand, R. Implementing Spatial Data Analysis Software Tools in R. Geogr. Anal. 2006, 38,
23-40.
38. Loftus, R.T.; Ertugrul, O.; Harba, A.H.; El-Barody, M.A.A.; Machugh, D.E.; Park, S.D.E.;
Bradley, D.G. A microsatellite survey of cattle from a center of origin: the Near East. Mol. Ecol.
1999, 8, 2015-2022.
39. Li, M.H.;Tapio, I.; Vilkki, J.; Ivanova, Z.; Kiselyova, T.; Marzanov, N.; Cinkulov, M.;
Stojanovic, S.; Ammosov, I.; Popov, R.; Kantanen, J. The genetic structure of cattle populations
(Bos taurus) in northern Eurasia and the neighboring Near Eastern regions: implications for
breeding strategies and conservation. Mol. Ecol. 2007, 16, 3839-3853.
40. Luque, A.; Valera, M.; Azor, P.J.; Goyache, F.; Rodero, E.; Molina, A. La raza bovina autóctona
española Pajuna: Situación actual y programa de recuperación. Anim. Genet. Resour. Inf. 2006,
39, 1-14.
41. Lenstra, J.A. ECONOGENE Consortium. Evolutionary and demographic history of sheep and
goats suggested by nuclear, mtDNA and Y chromosome markers. In Proceedings of the
International Workshop on the Role of Biotechnology for the Characterization and Conservation
of Crop, Forestry, Animal and Fishery Genetic Resources, Torino, Italy, 5–7 March 2005;
pp. 97-100.
Diversity 2010, 2
945
42. Pereira, F.; Queiros, S.; Gusmao, L.; Nijman, I.J.; Cuppen, E.; Lenstra, J.A.; Davis, S.J.M.;
Nejmeddine, F.; Amorim, A. ECONOGENE Consortium. Tracing the History of Goat
Pastoralism: New Clues from Mitochondrial and Y Chromosome DNA in North Africa. Mol. Biol.
Evol. 2009, 26, 2765-2773.
43. Luikart, G.; Gielly, L.; Excoffier, L.; Vigne, J.D.; Bouvet, J.; Taberlet, P. Multiple maternal
origins and weak phylogeographic structure in domestic goats. Proc. Natl. Acad. Sci. USA 2001,
98, 5927-5932.
44. Naderi, S.; Rezaei, H.R.; Taberlet, P.; Zundel, S.; Rafat, S.A.; Naghash, H.R.; El-Barody, M.A.A.;
Ertugrul, O.; Pompanon, F. Large-scale mitochondrial DNA analysis of the domestic goat reveals
six haplogroups with high diversity. PLoS ONE 2007, 2, e1012.
45. Kumar, P.; Freeman, A.R.; Loftus, R.T.; Gaillard, C.; Fuller, D.Q.; Bradley, D.G. Admixture
analysis of South Asian cattle. Heredity 2003, 91, 43-50.
46. Payne , W.J.A.; Hodges, J. Tropical Cattle. Origins, Breeds and Breeding Policies; Blackwell
Science: London, UK, 1997.
47. Cymbron, T.; Freeman, A.R.; Malheiro, M.I.; Vigne, J.D.; Bradley, D.G. Microsatellite diversity
suggests different histories for Mediterranean and Northern European cattle populations. Proc. R.
Soc. B 2005, 272, 1837-1843.
48. Gotherstrom, A.; Anderung, C.; Hellborg, L.; Elburg, R.; Smith, C.; Bradley, D.G.; Ellegren, H.
Cattle domestication in the Near East was followed by hybridization with aurochs bulls in Europe.
Proc. R. Soc. B 2005, 272, 2345-2350.
49. Ibeagha-Awemu, E.M.; Jann, O.C.; Weimann, C.; Erhardt, G. Genetic diversity, introgression and
relationships among West/Central African cattle breeds. Genet. Sel. Evol. 2004, 36, 673-690.
50. Gutierrez-Gil, B.; Wiener, P.; Williams, J.L. Genetic effects on coat colour in cattle: dilution of
eumelanin and phaeomelanin pigments in an F2-Backcross Charolais x Holstein population. BMC
Genet. 2007, 8, 56.
51. Li, C.; Basarab, J.; Snelling, W.M.; Benkel, B.; Murdoch, B.; Hansen, C.; Moore, S.S.
Assessment of positional candidate genes myf5 and igf1 for growth on bovine chromosome 5 in
commercial lines of Bos taurus. J. Anim. Sci. 2004, 82, 1-7.
52. Pariset, L.; Joost, S.; Marsan, P.A.; Valentini, A.; Ec Landscape genomics and biased FST
approaches reveal single nucleotide polymorphisms under selection in goat breeds of North-East
Mediterranean. BMC Genet. 2009, 10, 7.
53. Manel, S.; Segelbacher, G. Perspectives and challenges in landscape genetics. Mol. Ecol. 2009,
18, 1821-1822.
© 2010 by the authors; licensee MDPI, Basel, Switzerland. This article is an Open Access article
distributed under the terms and conditions of the Creative Commons Attribution license
(http://creativecommons.org/licenses/by/3.0/)
Related Documents