Spatial Thinking and the GIS User Interface Michael F. Goodchild University of California Santa Barbara

Spatial Thinking and the GIS User Interface Michael F. Goodchild University of California Santa Barbara.
Dec 22, 2015
Welcome message from author
This document is posted to help you gain knowledge. Please leave a comment to let me know what you think about it! Share it to your friends and learn new things together.
Transcript
Spatial Thinking and the GIS User Interface
Michael F. Goodchild
University of California
Santa Barbara
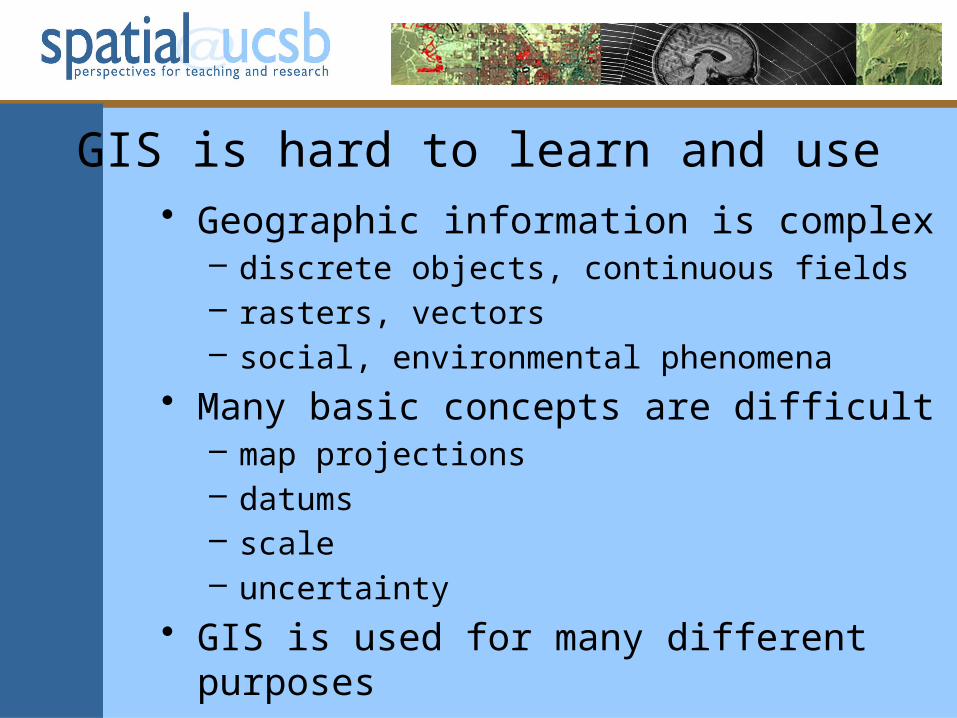
GIS is hard to learn and use• Geographic information is complex
– discrete objects, continuous fields– rasters, vectors– social, environmental phenomena
• Many basic concepts are difficult– map projections– datums– scale– uncertainty
• GIS is used for many different purposes
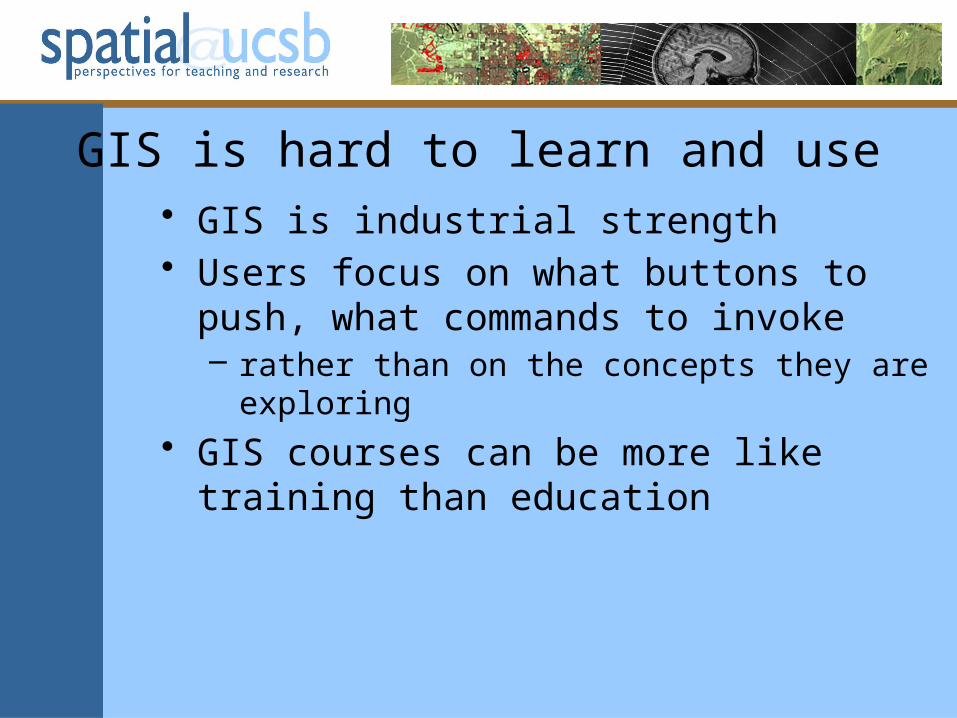
GIS is hard to learn and use• GIS is industrial strength• Users focus on what buttons to push, what
commands to invoke– rather than on the concepts they are exploring
• GIS courses can be more like training than education


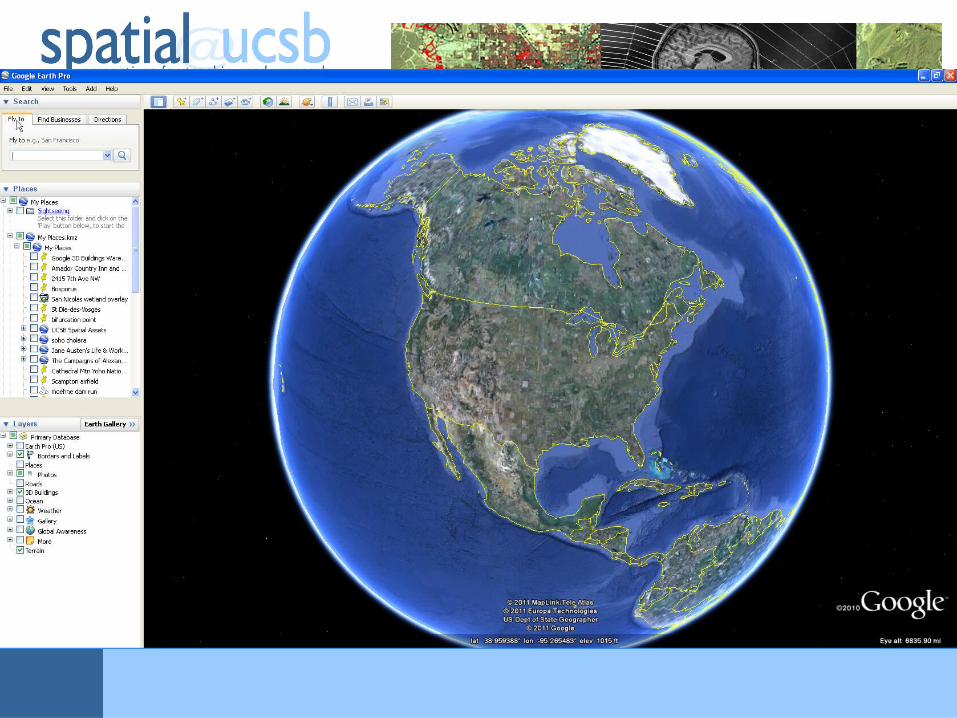
Google Earth is easy to use• Massive adoption by the general public• A child of 10 can do something useful in 10
minutes• Generating a fly-by
– complex, difficult in GIS– trivially easy in Google Earth
• Why is this?– what does it mean for GIS?
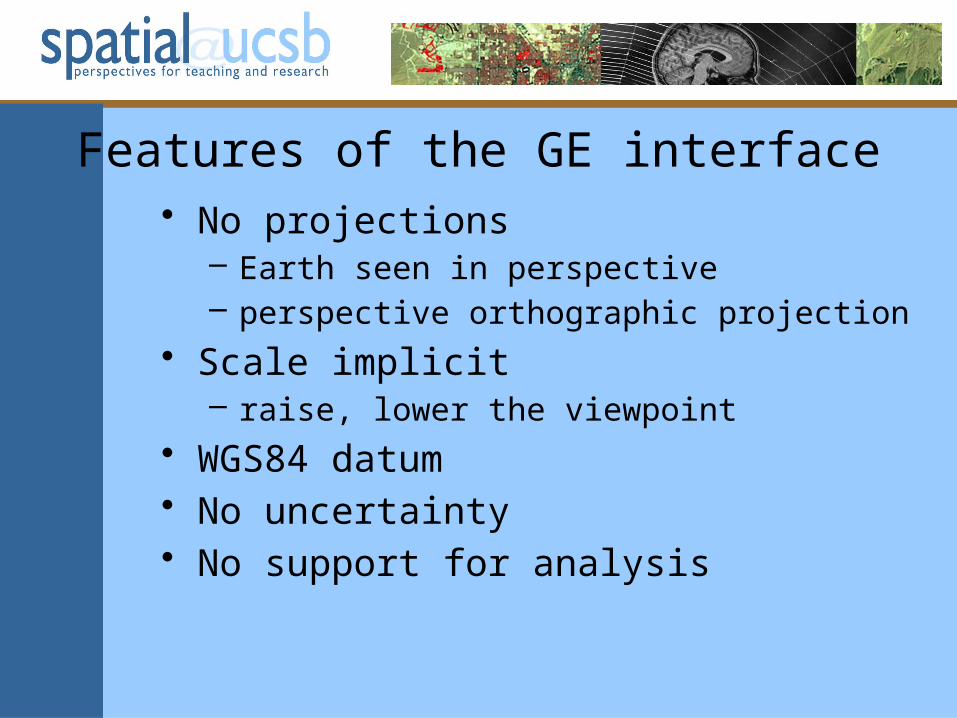
Features of the GE interface• No projections
– Earth seen in perspective– perspective orthographic projection
• Scale implicit– raise, lower the viewpoint
• WGS84 datum• No uncertainty• No support for analysis
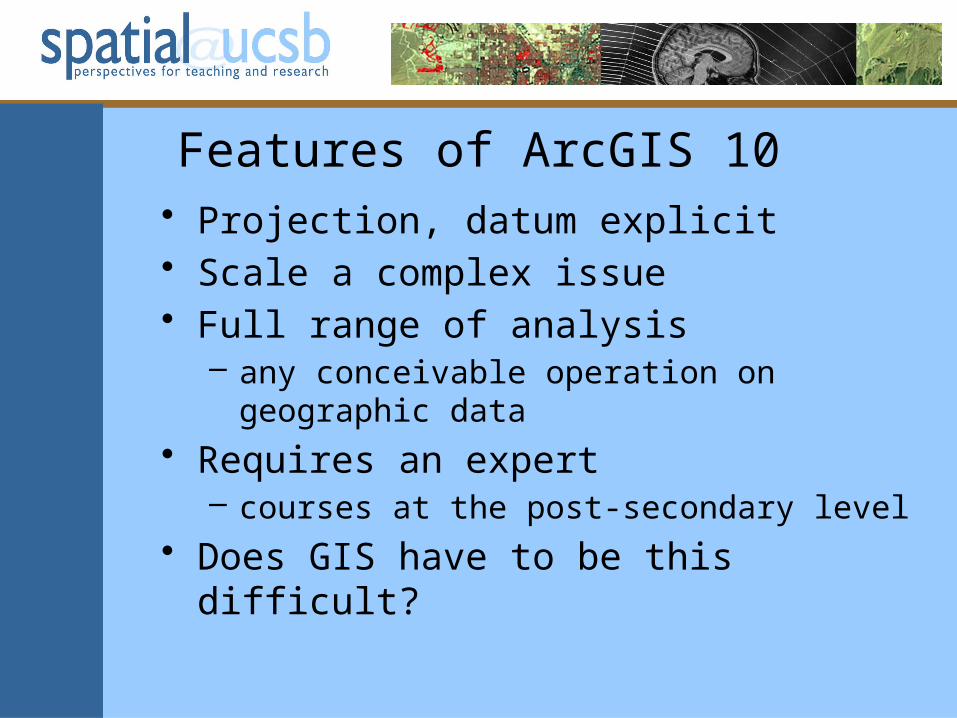
Features of ArcGIS 10• Projection, datum explicit• Scale a complex issue• Full range of analysis
– any conceivable operation on geographic data
• Requires an expert– courses at the post-secondary level
• Does GIS have to be this difficult?
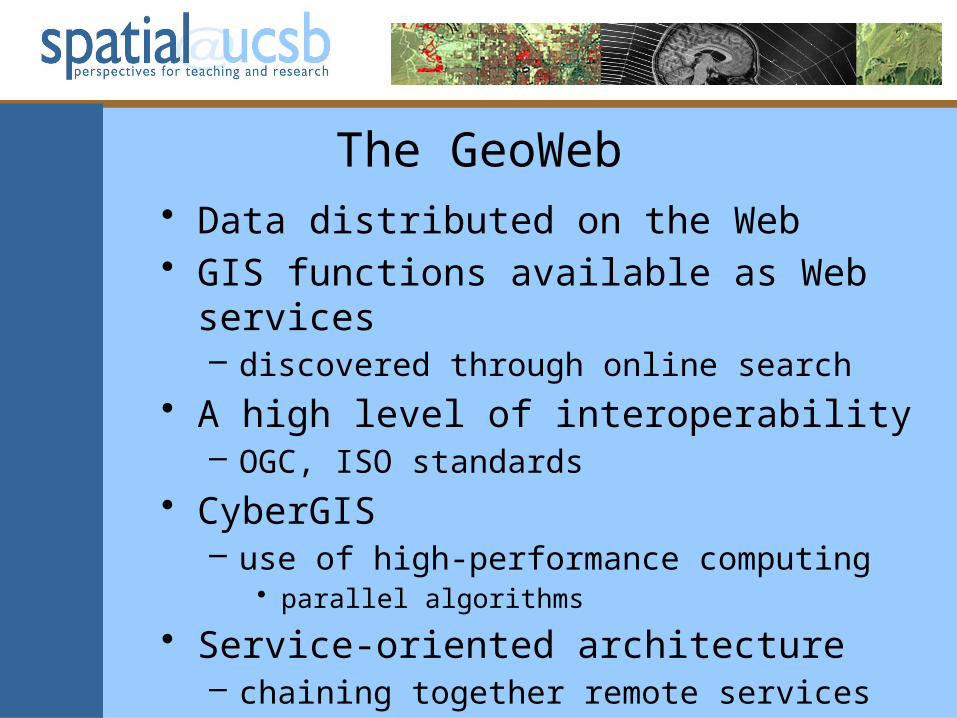
The GeoWeb• Data distributed on the Web• GIS functions available as Web services
– discovered through online search
• A high level of interoperability– OGC, ISO standards
• CyberGIS– use of high-performance computing
• parallel algorithms
• Service-oriented architecture– chaining together remote services
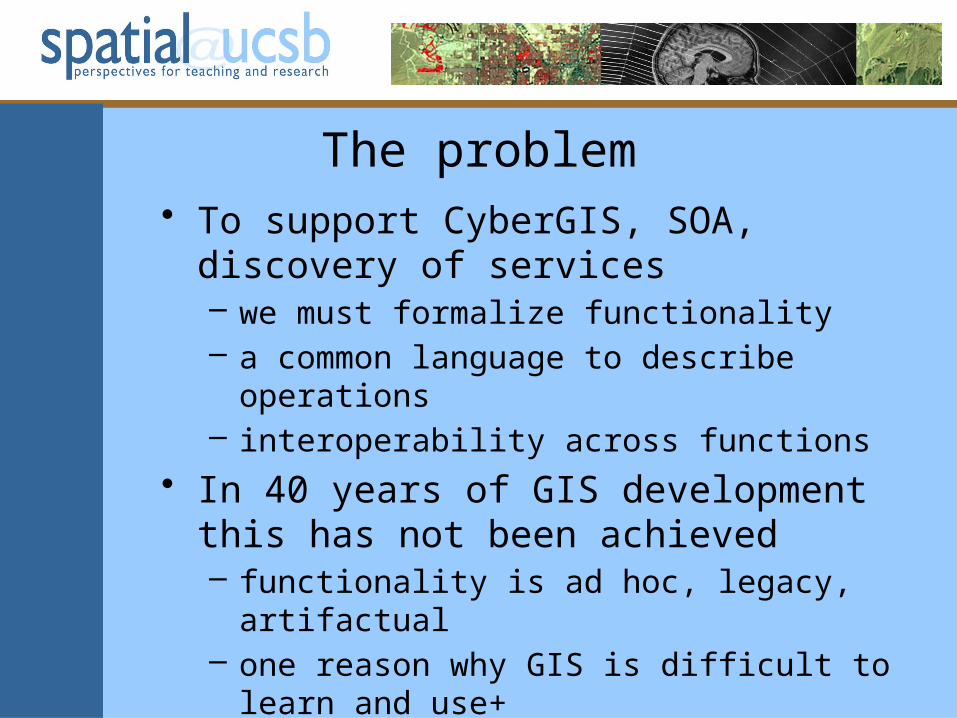
The problem• To support CyberGIS, SOA, discovery of
services– we must formalize functionality– a common language to describe operations– interoperability across functions
• In 40 years of GIS development this has not been achieved– functionality is ad hoc, legacy, artifactual– one reason why GIS is difficult to learn and use+

Title Count of functions
3D Analyst Tools 34
Analysis Tools 19
Cartography Tools 43
Conversion Tools 46
Data Interoperability Tools 2
Data Management Tools 178
Editing Tools 7
Geocoding Tools 7
Geostatistical Analyst Tools 22
Linear Referencing Tools 7
Multidimension Tools 7
Network Analyst Tools 21
Parcel Fabric Tools 4
Schematics Tools 5
Server Tools 14
Spatial Analyst Tools 171
Spatial Statistics Tools 26
Tracking Analyst Tools 2
Total 615
Organization of the ArcGIS 10 Toolbox
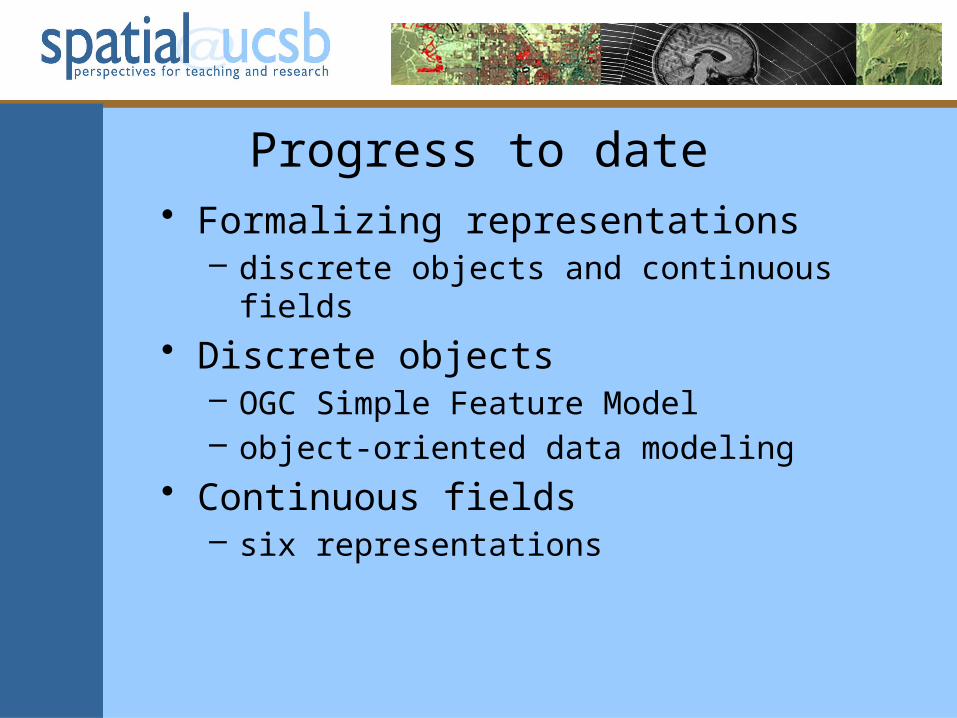
Progress to date• Formalizing representations
– discrete objects and continuous fields
• Discrete objects– OGC Simple Feature Model– object-oriented data modeling
• Continuous fields– six representations

The OGC Simple Feature Model (from MySQL 4.1)

The six discretizations of continuous fields that are commonly available in GIS
Point sampling on a raster Irregular point sampling Triangulated irregular network
Raster of cells Irregular polygons Digitized isolines

Approaches to formalizing functions: Taxonomies
• Berry JK. Fundamental operations in computer-assisted map analysis. International Journal of Geographical Information Systems 1987;1:119–136.
• Dangermond J. A classification of software components commonly used in geographic information systems. In: Peuquet DJ, O’Callaghan J, editors, Design and implementation of computer-based geographic information systems. Amherst, NY: International Geographical Union, Commission on Geographical Data Sensing and Processing; 1983, p. 70–91.
• Maguire DJ, Dangermond J. The functionality of GIS. In: Maguire DJ, Goodchild MF, Rhind DW, editors, Geographical Information Systems: Principles and Applications 1: 319-335. Harlow, UK: Longman Scientific & Technical.
• Rhind DW, Green NPA. Design of a geographical information system for a heterogeneous scientific community. International Journal of Geographical Information Systems 1988; 2(2):171–190.

The physical metaphor• Tasks that could be performed by hand
– using paper maps
• Topological overlay– McHarg’s landscape architecture
• Limitations of 2D metaphors
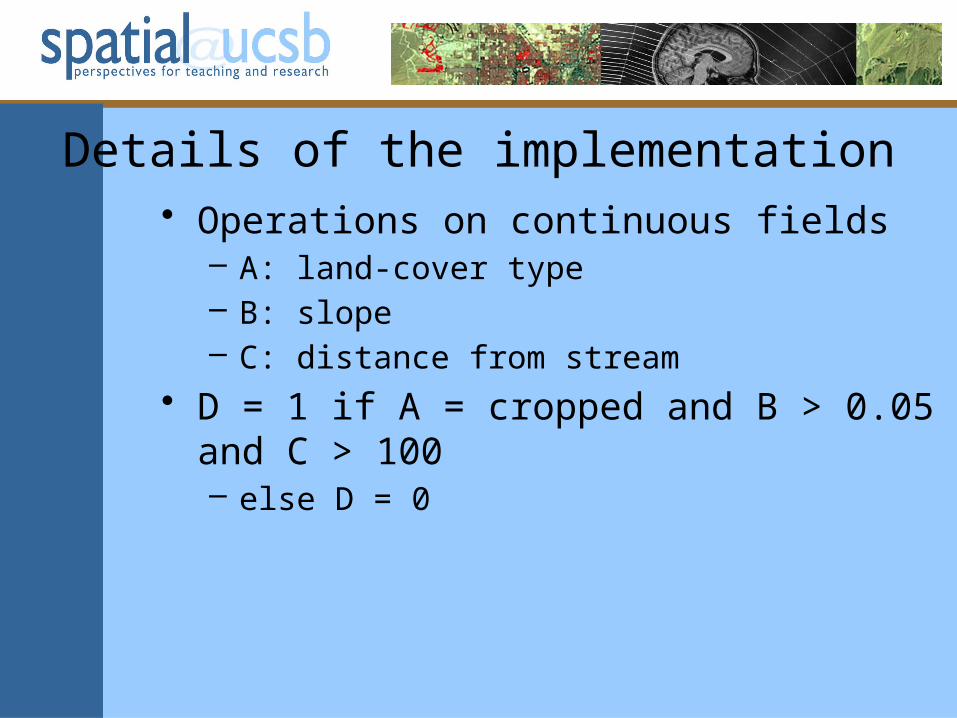
Details of the implementation• Operations on continuous fields
– A: land-cover type– B: slope– C: distance from stream
• D = 1 if A = cropped and B > 0.05 and C > 100– else D = 0

• Which of the 6 representations is used?– A uses vector polygons (a land-cover map)– B uses raster points with a spacing of 10m– C uses digitized contours
• The user must explicitly engage with the representations– Tomlin’s Map Algebra requires co-registered rasters
• Why can’t the user simply address A, B, C as fields– without being concerned with the representation?
• Kemp KK. Fields as a framework for integrating GIS and environmental process models. Part one: Representing spatial continuity. Transactions in GIS 1997; 1(3):219–234.
• Kemp KK. Fields as a framework for integrating GIS and environmental process models. Part two: Specifying field variables. Transactions in GIS 1997; 1(3):235–246.
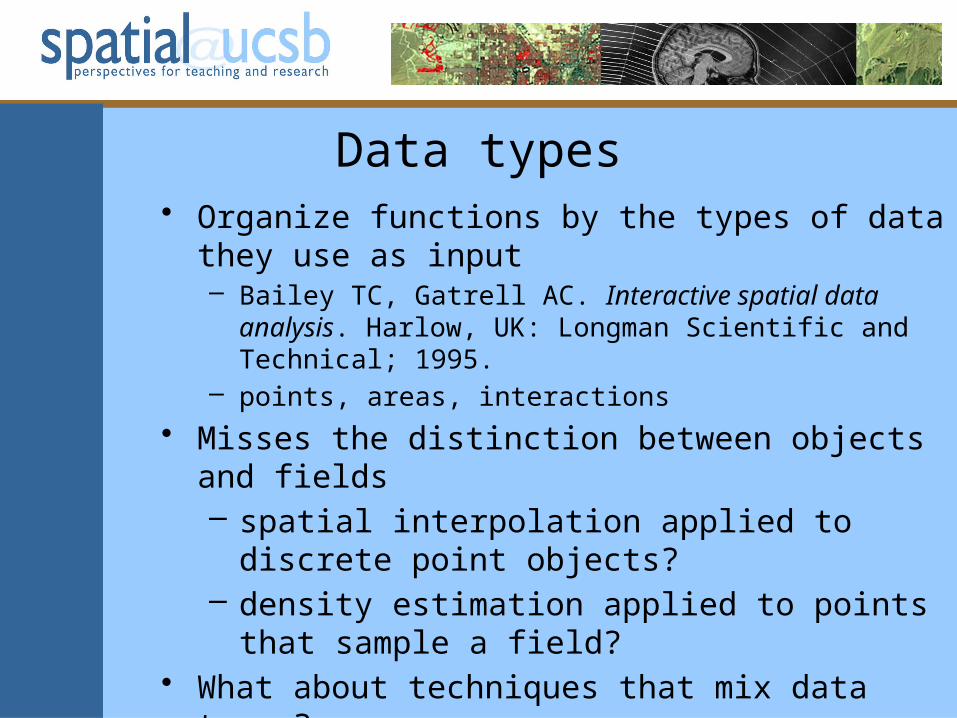
Data types• Organize functions by the types of data they use as
input– Bailey TC, Gatrell AC. Interactive spatial data analysis.
Harlow, UK: Longman Scientific and Technical; 1995.– points, areas, interactions
• Misses the distinction between objects and fields– spatial interpolation applied to discrete point
objects?– density estimation applied to points that sample a
field?• What about techniques that mix data types?• What about functions other than analysis?

Three strategies• 1. Eliminate redundancy in operations
– can the need for an operation be anticipated?
• Comparing two variables across space– are they both attributes of the same class of
objects?– if not a spatial join will be required
• topological overlay
– the join can be invoked automatically
• Regression{x,y}• Differenceofmeans{x,c}
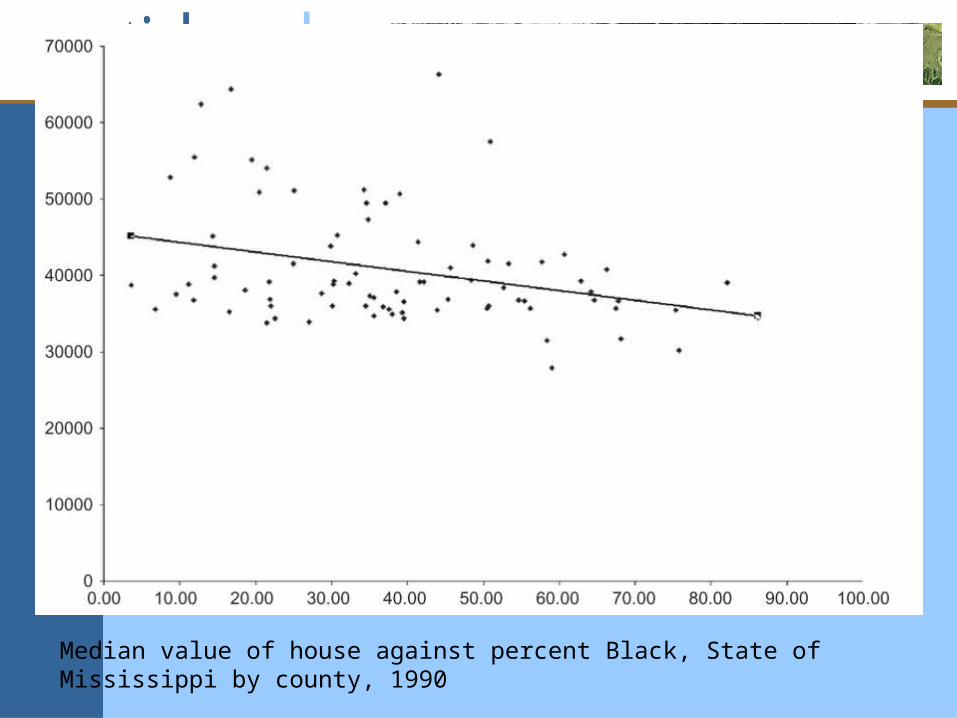
Median value of house against percent Black, State of Mississippi by county, 1990

Vegetation cover type and elevation, Santa Barbara County, California. Vegetation cover type by polygon, elevation by raster points.

2. Operations on fields• Avoid engagement with details of the
representation– refer to entire fields
• Except when necessary– when resampling is needed– when representation of the output is not clearly
defined• adding a 10m raster variable to a 30m raster variable• should it produce a 10m raster, a 30m raster, or what?
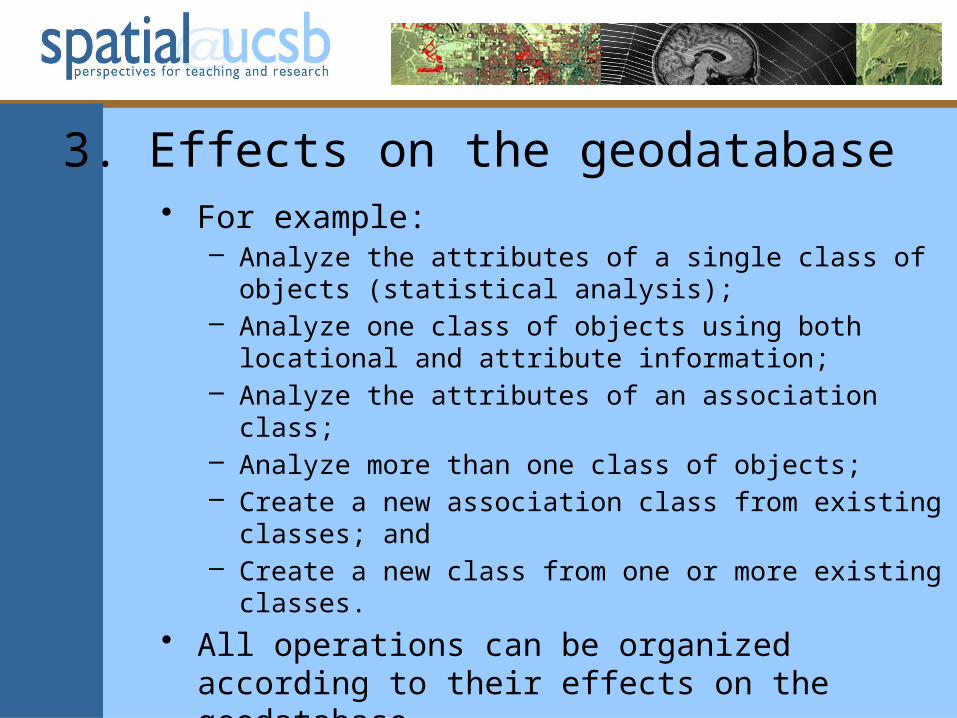
3. Effects on the geodatabase• For example:
– Analyze the attributes of a single class of objects (statistical analysis);
– Analyze one class of objects using both locational and attribute information;
– Analyze the attributes of an association class;– Analyze more than one class of objects;– Create a new association class from existing classes; and– Create a new class from one or more existing classes.
• All operations can be organized according to their effects on the geodatabase– ties functionality to the structure of the geodatabase– assumes the structure is standard

What other options?• Fundamental spatial concepts
– all functions seek to explore some basic concept• e.g., relationship between layers• e.g., Tobler’s First Law
– to evaluate the concept– to explore its expression in a given data set
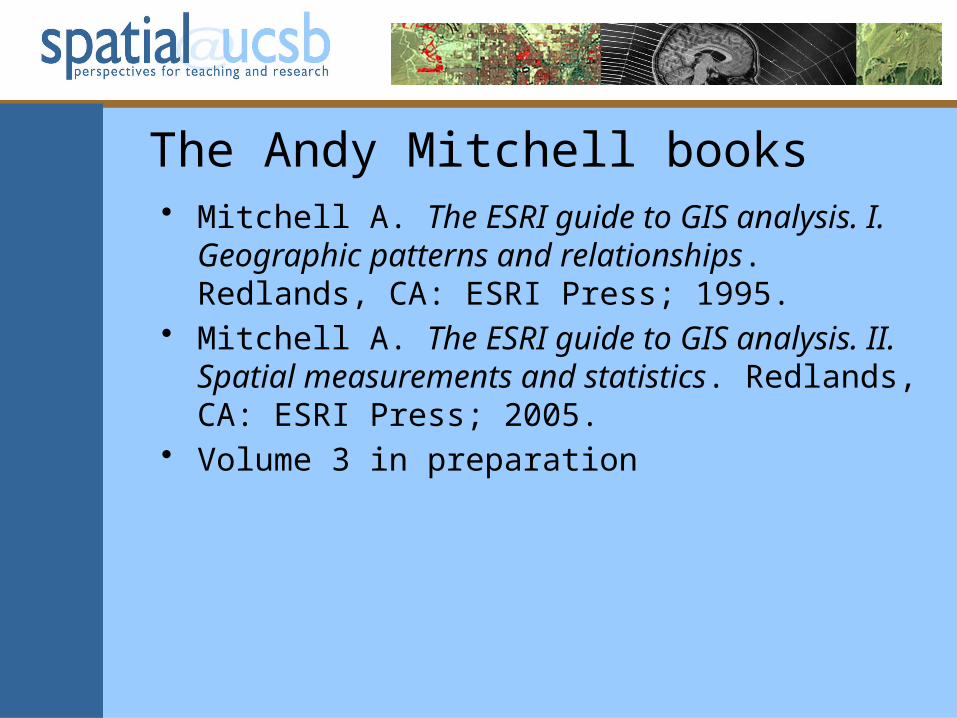
The Andy Mitchell books• Mitchell A. The ESRI guide to GIS analysis. I.
Geographic patterns and relationships. Redlands, CA: ESRI Press; 1995.
• Mitchell A. The ESRI guide to GIS analysis. II. Spatial measurements and statistics. Redlands, CA: ESRI Press; 2005.
• Volume 3 in preparation
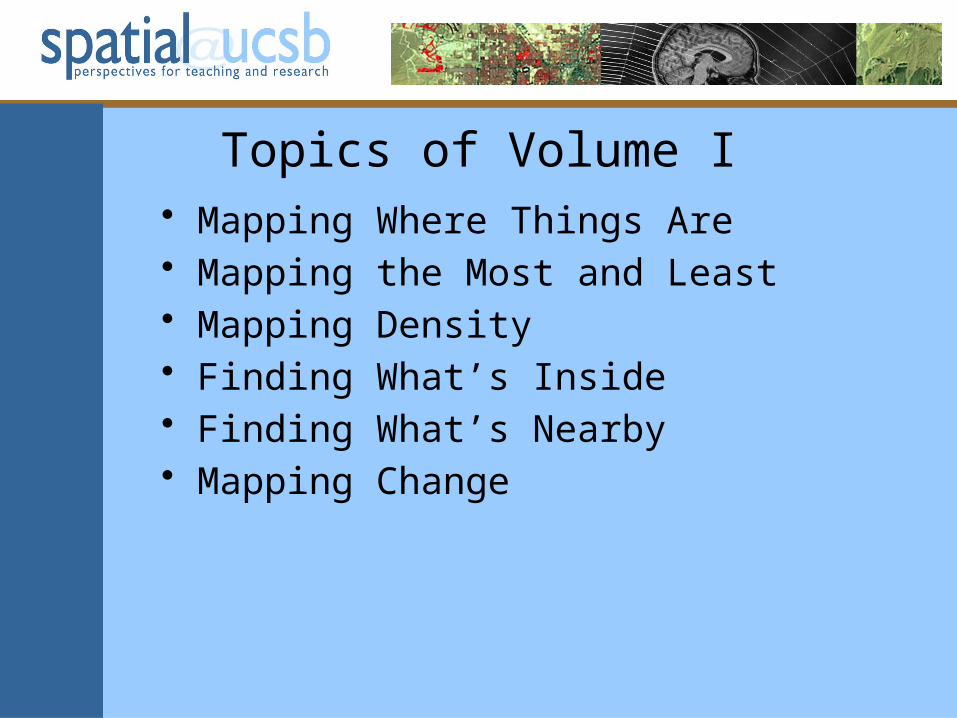
Topics of Volume I• Mapping Where Things Are• Mapping the Most and Least• Mapping Density• Finding What’s Inside• Finding What’s Nearby• Mapping Change

Center for Spatial Studies, UC Santa Barbarateachspatial.org

185 concepts mined from the literatures of many disciplinesReferences and links to the key sources

Organizational schemasAlphabetical, by discipline, by similarity, by part-whole relationships

Two types of functions• Those that modify the representation• Those that evaluate, report, visualize• Type I:
– transform a database G into a new database G’– from the formalization of databases we know the
complete set of options
• Type II:– based on exploring spatial concepts

Spatial thinking and GIS interface design
• As the technology becomes easier to use– there can be greater focus on what goes on in the
mind of the user– what does a spatially intelligent user think about
while using GIS?– not which button to push next– but what the results mean
• A radically different approach to the user interface
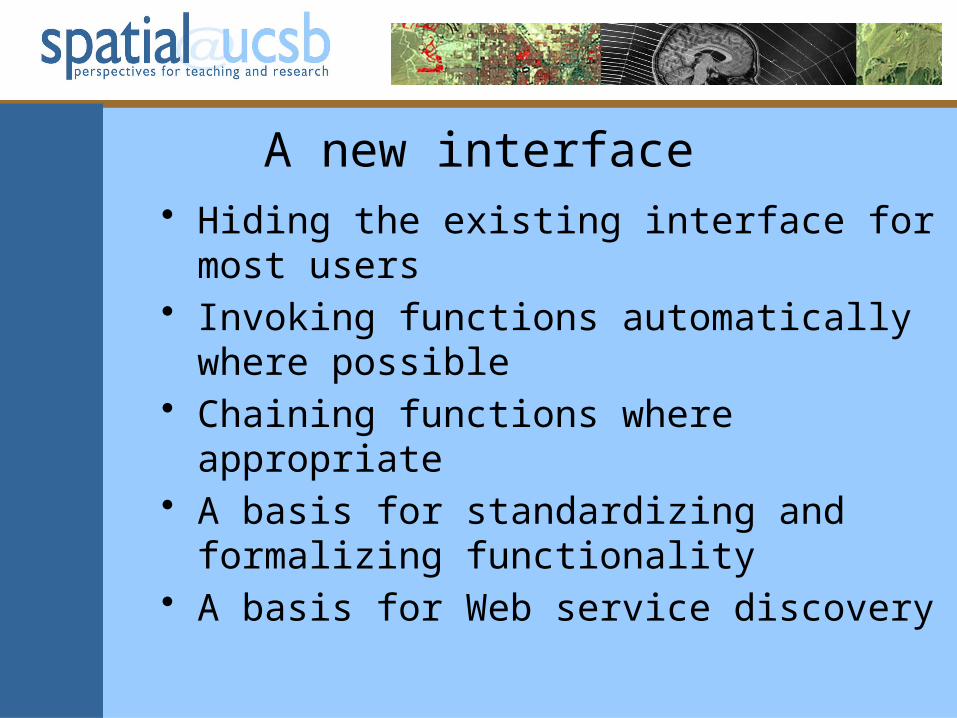
A new interface• Hiding the existing interface for most users• Invoking functions automatically where
possible• Chaining functions where appropriate• A basis for standardizing and formalizing
functionality• A basis for Web service discovery
Related Documents