O. Defeo M. Rueda Spatial structure, sampling design and abundance estimates in sandy beach macroinfauna: some warnings and new perspectives Received: 21 September 2001 / Accepted: 10 December 2001 / Published online: 19 February 2002 ȑ Springer-Verlag 2002 Abstract We discuss methodological aspects directed to quantify the across-shore population structure and abundance of sandy beach macroinfauna. The reliability of estimates derived from design-based (stratified ran- dom sampling) and model-based (geostatistics, kriging) approaches is discussed. Our analysis also addresses potential biases arising from environmentally driven designs that consider a priori fixed strata for sampling macroinfauna, as opposed to species-driven sampling designs, in which the entire range of across-shore dis- tribution is covered. Model-based approaches showed, spatially, highly autocorrelated and persistent structures in two intertidal populations of the Uruguayan coast: the isopod Excirolana armata and the yellow clam Mesodesma mactroides. Both populations presented zo- nation patterns that ranged from the base of the dunes to upper levels of the subtidal. The Gaussian model consistently explained the spatial distribution of species and population components (clam recruits and adults), with a minor contribution ( £ 5%) of unresolved, small- scale variability. The consistent structure of spatial dependence in annual data strongly suggests an across- shore-structured process covering close to 35 m. Kriging predictions through cross-validation corroborated the appropriateness of the models fitted through vario- graphic analysis, and the derived abundance estimates were very similar (maximum difference=7%) to those obtained from linear interpolation. Monthly analysis of E. armata data showed marked variations in its zonation and an unstable spatial structure according to the Gaussian model. The clear spatial structure resulting from species-driven sampling was not observed when data was truncated to simulate an environmentally driven sampling design. In this case, the linear semi- variogram indicated a spatial gradient, suggesting that sampling was not performed at the appropriate spatial scale. Further, the cross-validation procedure was not significant, and both density and total abundance were underestimated. We conclude that: (1) geostatistics provides useful additional information about population structure and aids in direct abundance estimation; thus we suggest it as a powerful tool for further applications in the study of sandy beach macroinfauna; and that (2) environmentally driven sampling strategies fail to pro- vide conclusive results about population structure and abundance, and should be avoided in studies of sandy beach populations. This is especially true for microtidal beaches, where unpredictable swash strength precludes a priori stratification through environmental reference points. The need to use adaptive sampling designs and avoid snapshot sampling is also stressed. Methodologi- cal implications for the detection of macroecological patterns in sandy beach macroinfauna are also dis- cussed. Introduction Knowledge about variations in abundance and under- lying processes influencing the distribution of organisms in space and time are critical in ecology. Errors in esti- mating abundance or the spatio-temporal structure of animal populations can induce an erroneous interpre- tations of and answers to research questions. For in- vertebrate macroinfauna of sandy beaches, quantitative estimates of abundance are usually straightforward to obtain, because of easy access to beaches and the rela- tively simple materials used for sampling: no more than a quadrat or a sheet-metal cylinder, a screen and a shovel are needed. Abundance estimates on sandy shores Marine Biology (2002) 140: 1215–1225 DOI 10.1007/s00227-002-0783-z Communicated by O. Kinne, Oldendorf/Luhe O. Defeo (&) M. Rueda Centro de Investigacio´n y de Estudios Avanzados del IPN, A.P. 73 Cordemex, 97310 Me´rida, Yucata´n, Me´xico E-mail: [email protected] Fax: +5299-99-812334 O. Defeo UNDECIMAR, Facultad de Ciencias, Igua´ 4225, Montevideo 11400, Uruguay

Welcome message from author
This document is posted to help you gain knowledge. Please leave a comment to let me know what you think about it! Share it to your friends and learn new things together.
Transcript
O. Defeo Æ M. Rueda
Spatial structure, sampling design and abundance estimates in sandybeach macroinfauna: some warnings and new perspectives
Received: 21 September 2001 /Accepted: 10 December 2001 / Published online: 19 February 2002� Springer-Verlag 2002
Abstract We discuss methodological aspects directed toquantify the across-shore population structure andabundance of sandy beach macroinfauna. The reliabilityof estimates derived from design-based (stratified ran-dom sampling) and model-based (geostatistics, kriging)approaches is discussed. Our analysis also addressespotential biases arising from environmentally drivendesigns that consider a priori fixed strata for samplingmacroinfauna, as opposed to species-driven samplingdesigns, in which the entire range of across-shore dis-tribution is covered. Model-based approaches showed,spatially, highly autocorrelated and persistent structuresin two intertidal populations of the Uruguayan coast:the isopod Excirolana armata and the yellow clamMesodesma mactroides. Both populations presented zo-nation patterns that ranged from the base of the dunesto upper levels of the subtidal. The Gaussian modelconsistently explained the spatial distribution of speciesand population components (clam recruits and adults),with a minor contribution ( £ 5%) of unresolved, small-scale variability. The consistent structure of spatialdependence in annual data strongly suggests an across-shore-structured process covering close to 35 m. Krigingpredictions through cross-validation corroborated theappropriateness of the models fitted through vario-graphic analysis, and the derived abundance estimateswere very similar (maximum difference=7%) to thoseobtained from linear interpolation. Monthly analysis ofE. armata data showed marked variations in its zonationand an unstable spatial structure according to the
Gaussian model. The clear spatial structure resultingfrom species-driven sampling was not observed whendata was truncated to simulate an environmentallydriven sampling design. In this case, the linear semi-variogram indicated a spatial gradient, suggesting thatsampling was not performed at the appropriate spatialscale. Further, the cross-validation procedure was notsignificant, and both density and total abundance wereunderestimated. We conclude that: (1) geostatisticsprovides useful additional information about populationstructure and aids in direct abundance estimation; thuswe suggest it as a powerful tool for further applicationsin the study of sandy beach macroinfauna; and that (2)environmentally driven sampling strategies fail to pro-vide conclusive results about population structure andabundance, and should be avoided in studies of sandybeach populations. This is especially true for microtidalbeaches, where unpredictable swash strength precludes apriori stratification through environmental referencepoints. The need to use adaptive sampling designs andavoid snapshot sampling is also stressed. Methodologi-cal implications for the detection of macroecologicalpatterns in sandy beach macroinfauna are also dis-cussed.
Introduction
Knowledge about variations in abundance and under-lying processes influencing the distribution of organismsin space and time are critical in ecology. Errors in esti-mating abundance or the spatio-temporal structure ofanimal populations can induce an erroneous interpre-tations of and answers to research questions. For in-vertebrate macroinfauna of sandy beaches, quantitativeestimates of abundance are usually straightforward toobtain, because of easy access to beaches and the rela-tively simple materials used for sampling: no more thana quadrat or a sheet-metal cylinder, a screen and ashovel are needed. Abundance estimates on sandy shores
Marine Biology (2002) 140: 1215–1225DOI 10.1007/s00227-002-0783-z
Communicated by O. Kinne, Oldendorf/Luhe
O. Defeo (&) Æ M. RuedaCentro de Investigacion y de Estudios Avanzados del IPN,A.P. 73 Cordemex, 97310 Merida, Yucatan, Mexico
E-mail: [email protected]: +5299-99-812334
O. DefeoUNDECIMAR, Facultad de Ciencias, Igua 4225,Montevideo 11400, Uruguay
are usually presented in two ways: (1) as mean densitiesand (2) as individuals per running meter or strip transect(IST: ind m–1). In the former, the number (or biomass)of individuals per quadrat is averaged by the number ofquadrats sampled on the beach, whereas IST estimatesthe number (or biomass) from each quadrat summedover meters of shoreline by simple linear interpolation,using the following equation (Defeo 1996):
ISTr ¼
Pn
i¼1
qi
nrwr ð1Þ
where the mean density q (ind m–2 or g m–2) of all nsamples pertaining to transect r is multiplied by thecorresponding width (w) of the species distributionacross the beach. Eq. 1 is used to avoid biased resultsfrom using mean density per quadrat (ind m–2) as anabundance estimate, after beach profiles have been im-pacted during either rough or calm conditions. Thesevariable environmental conditions can result in dramaticcontraction/expansion of the across-shore distributionof macroinfauna, implying that density should be con-sidered a biased index of abundance (Brazeiro and De-feo 1996). This emphasizes the need to examine thewhole transect, rather than individual sampling quad-rats, as the appropriate unit for estimating populationabundance (McLachlan 1983; Defeo 1996, 1998;McLachlan et al. 1996).
Abundance estimates of macroinfauna need to beexpressed as a total quantity, with some measure of theassociated variance. The two calculation methods de-tailed above are based on variance estimates, which as-sume that the error terms of the samples arestochastically independent of one another (Simard et al.1992). This approach, which relies on random samplingtheory, allows calculations to be done ignoring spatialautocorrelation (small-scale dependence between con-secutive sampling units, SUs: Legendre 1993). Thiscondition is not met by sandy beach macroinfauna,which are spatially autocorrelated (Defeo 1993;Gimenez and Yannicelli 2000). Indeed, most sandybeach populations present strong and persistent (sensuOrensanz and Jamieson 1998) spatial distribution pat-terns in response to an environment that is spatially andtemporally structured by sharp, small-scale gradients.Aggregations persist in time, but, in contrast to sessilespecies, the relative positions of patches across the beachvary according to the different susceptibilities of eachspecies to variations in environmental conditions(Brazeiro and Defeo 1996, and references therein). Inspite of the above, the spatial dimension of populationprocesses and patterns has received little attention insandy beach ecology, thus overlooking the paradigm ofspatial structuring, a critical determinant of how eco-systems function (Legendre 1993).
Given the strongly aggregated patterns among sandybeach macroinfauna (Brazeiro 1999a), model-basedestimates (e.g. geostatistics) should be relevant when
interpolating abundance between SUs across a beach.Indeed, geostatistics explicitly consider the shape of thespatial autocorrelation in density of consecutive SUs,together with their spatial organization and location onregular grids (surface or volume) or at fixed stations (e.g.single-dimensional transects) (Petitgas 1993; Legendreand Legendre 1998). The fact that mean abundance es-timates and their variances are expressed in terms of thisstructure has made model-based approaches very rele-vant for crustaceans (Conan 1985; Simard et al. 1992;Maynou et al. 1998), bivalves (see e.g. Thrush et al.1989; Hewitt et al. 1997) and fishes (Petitgas 1993;Rueda 2001; Rueda and Defeo 2001).
Two different sampling designs are usually con-ducted on sandy beaches: (1) species-driven and (2)environmentally driven. In the former, sampling pointsare systematically allocated along each of n transectsperpendicularly fixed to the shoreline. Transects coverthe entire across-shore distribution of the species andat least two or more quadrats in which abundances ofzero are sampled in both the upshore and downshoredirections before terminating the transect (Defeo 1993,1998; Gomez and Defeo 1999; Lercari and Defeo1999). The second sampling procedure, which is by farthe most commonly used, is based on one (Jaramilloet al. 1993) or more (Cardoso and Veloso 1996) shore-normal transects, with SUs randomly allocated atfixed beach levels defined by the position of referencepoints, such as tidal marks (meso-/macrotidal beach-es), swash levels (microtidal beaches), or drift and ef-fluent lines. The validity of this sampling design hasbeen severely questioned (James and Fairweather1996). Indeed, sandy beach macroinfauna undergoesdrastic short-term variations in zonation, associatedwith the unpredictable intensity of tidal levels gener-ated by onshore winds, storm surges and barometrictides (Brazeiro and Defeo 1996). Considerable changeshave also been observed between spring and neap tides(McLachlan 1983). Moreover, sandy beach speciestend to occupy different beach levels, according to theseason of the year. These short (days) and medium(seasons) term variations in macroinfauna distributionare not always reflecting swash levels or effluent ordrift line positions (Brazeiro and Defeo 1996; Gimenezand Yannicelli 1997). This diminishes the applicabilityof an environmentally driven sampling design definedby a priori fixed strata, because it does not necessarilycover the entire across-shore species distribution,underestimating the parameter w and, therefore, IST(Eq. 1).
The present paper addresses the relative merits ofdesign-based and model-based approaches for estimat-ing abundance in sandy beach populations. This analysisis also discussed in the light of the species- versus envi-ronmentally driven sampling designs detailed above.Implications for these methodological approaches in theestimation of population structure and abundance andin the detection of large-scale patterns in sandy beachmacroinfauna are also discussed.
1216
Materials and methods
Spatial structure and annual abundance estimates
To examine the possibility that macroinfauna abundance estimateson sandy beaches may be affected by either the estimation proce-dure or the sampling design, we used information contained in twodatabases collected by de Alava and Defeo (1991) and Defeo(1996). In the first case the data was gathered to quantify the in-tertidal distributional patterns of Excirolana armata (Isopoda:Cirolanidae); sampling was carried out for 1-year (monthly inter-vals) between May 1988 and April 1989. The second was a long-term study of the yellow clam Mesodesma mactroides, conductedbetween 1983 and 1990. However, in this paper we used the 12monthly samplings carried out in 1984 to estimate recruit(<10 mm length) and adult (>43 mm length) densities, averagedfor each across-shore level over the entire beach. Both studies wereconducted at Barra del Chuy (33�40¢S; 53�29¢W) in Uruguay, usinga systematic sampling design, with 3 (isopods) or 22 (clams) tran-sects perpendicular to the shoreline. No significant differences wereever observed between transects and months, in beach slope, meangrain size, sorting or organic matter of the sediment (two-wayANOVA: P>0.05), so we assume that longshore gradients do notaffect across-shore distributions of organisms, as shown elsewhere(Defeo et al. 1986; de Alava and Defeo 1991; Defeo 1993). SUswere spaced every 4 m, from the base of the sand dunes to the sea,until two successive SUs without organisms were recorded. EachSU was sampled with a cylinder (28.2 cm diameter, 40 cm deep),and sediment collected in this manner was sieved through 0.5 mmmesh. All isopods and clams were counted, measured and weighed.The upper (USL) and lower (LSL) limits of the swash zone weredetermined, respectively, by the maximum and minimum tide ad-vance during sampling time.
The across-shore spatial structure of both populations was de-termined by variographic analysis. Each spatial process consisted ofobservations measured at a location x defined with respect to itsrelative position to the upper swash limit (USL=0 m), with nega-tive values indicating a downshore direction. Following the mainquestion addressed in the paper, only one dimension was considered(transects perpendicular to the shoreline), explicitly discarding an-isotropic analysis (differential spatial continuity in the across- andlongshore directions). We tested for departures from second-orderstationarity (sensu Cressie 1991), which require a certain degree ofregional homogeneity of abundance and absence of trends (Simardet al. 1992). In this sense, density variations of neither E. armata norM. mactroides were correlated in the across-shore direction (r be-tween –0.26 and 0.13; P>>0.05). In order to perform variographicanalysis, we used a percentage of the maximum lag close to 60% asthe default active lag distance. Two reasons induced us to do this: (1)variograms decompose at large lag intervals close to the maximumlag interval (Robertson 2000) and (2) the limited area sampled(average beach width�80 m) and the usually normal distribution ofindividuals across the dune–sea axis (Defeo et al. 1986, 1997;de Alava and Defeo 1991) produce: (a) few pairs of points availablethat preclude the obtention of robust estimates and (b) a consistentsmall variance at large lag intervals, which contradicts the generalpattern of constant variance with increasing lags (Fletcher andSumner 1999). We consistently used a uniform interval of 4 m forvariographic analysis, i.e. the minimum distance between two con-secutive SUs. A non-directional experimental semivariogram c(h)was estimated by pooling pairs of observations in the downshoredirection using Matheron’s (1965) estimator:
c hð Þ ¼
PNh
i¼1
Z xi þ hð Þ � Z xið Þ½ �2
2N hð Þ ð2Þ
where Z(xi) is abundance at station xi, Z(xi+h) is another abun-dance value separated from xi by a distance h (measured in meters)and N(h) is the number of pairs of observations separated by h.Several theoretical models (spherical, exponential, Gaussian, linear)
were fitted to the experimental semivariograms, and the model thatbest explained the spatial structure was selected according to twogoodness-of-fit criteria: the coefficient of determination (r2) andthe reduced sumof squares (RSS) (Cressie 1991). Themodels providethe following parameter estimates: (1) the nugget effect (C0), whichreflects variation at distances less than the smallest attained in thedataset (i.e. 4 m in this case), (2) the sill (C0+C), which defines theasymptotic value of semivariance and (3) the range (A0), defined asthe distance at which the abundance ceases to be autocorrelated. Theabove models allow the proportion of sample variance explained byspatially structured variance [C/(C0+C)] to be estimated.
To produce transect images we employed point kriging. For thispurpose, the expected density among stations ZZ X0ð Þ was estimatedusing the observed values Z(Xi) in the surrounding neighborhoodas follows (Matheron 1965):
ZZ X0ð Þ ¼Xn
i
kiZ Xið Þ ð3Þ
where ki is the vector of observed densities that minimizes theprediction error (Cressie 1991). Kriging interpolations were eval-uated using a jackknife cross-validation. To this end, the observed(O) and estimated (E) densities were plotted and fitted to a linearregression in the form O=a+bE (Cressie 1991). Departures from a45� line through the origin indicate model inadequacy, and thus thesignificance of a and b was tested (t-test) under the null hypothesesa=0 and b=1 (Power 1993). Cross-validation was also used forevaluating the appropriateness of the models fitted in the vario-graphic analysis.
Abundance of isopods and clams was estimated by: (1) linearinterpolation (Eq. 1) and (2) block kriging (Matheron 1965). Thelatter was used to produce global estimates of average density (indm–2) and abundance (ind m–1) in discrete areas (blocks) of 1·1 m,over the dune–sea axis. Global abundance estimates were thusobtained through a discrete summation of estimates of interpolatedkriging densities (ind m–2) along each entire transect. Standarddeviations were obtained following the same reasoning (Simardet al. 1992; Maynou et al. 1998).
Zonation dynamics, and environmentally versus species-drivensampling procedures
Monthly analyses were performed to test the recurrence of annualpatterns. For this purpose we used the database for E. armata, andselected 3 months (May and August 1988 and April 1989) to carryout all calculations detailed for annual data (see ‘‘Results’’ for adetailed explanation of this selection).
To compare the spatial structure and abundance estimates be-tween environmentally and species-driven designs, we used E. ar-mata information collected in May 1988, considering: (1) the entirespecies distribution and (2) only the stations sampled below theUSL. This artificially partitioned dataset was used for simulating apriori expected distribution of this typical intertidal species alongthe Atlantic coast of South America (de Alava and Defeo 1991;Veloso and Cardoso 2001). As Barra del Chuy is a microtidal beach(semidiel tide <0.3 m), we used swash levels as analogous to thetidemarks commonly employed as sampling limits on meso-mac-rotidal beaches (Contreras et al. 1999). Cutoff estimates of densityand abundance, obtained as for annual analysis, only consideredthe portion of the beach from the USL downshore.
Results
Spatial structure and annual abundance estimates
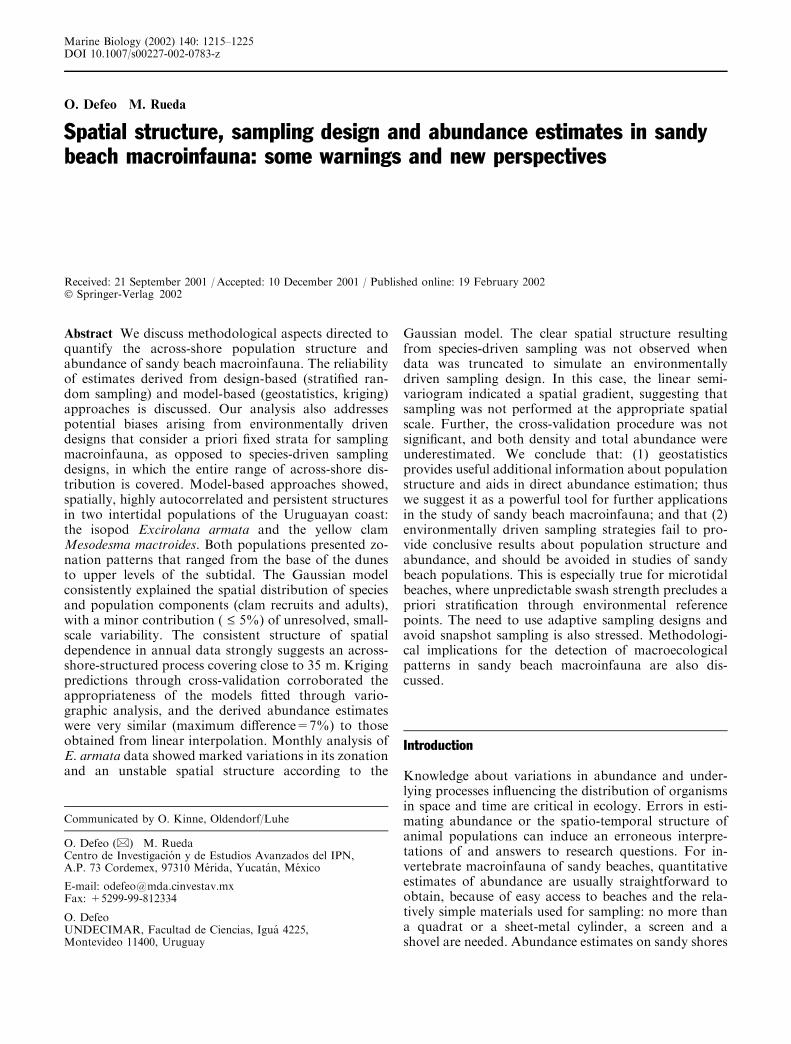
The across-shore distribution of Excirolana armata ex-tended from 60 m above the USL (base of the dunes) to28 m below the USL (Fig. 1a). The same holds true for
1217
the intertidal suspension feeder Mesodesma mactroides:adults inhabited from 36 m above to 32 m below theUSL (Fig. 1b) and recruits from 40 m above to 24 mbelow the USL (Fig. 1c). In all cases, maximum densitiesoccurred close to the USL, decreasing smoothly towardsboth extremes of the beach.
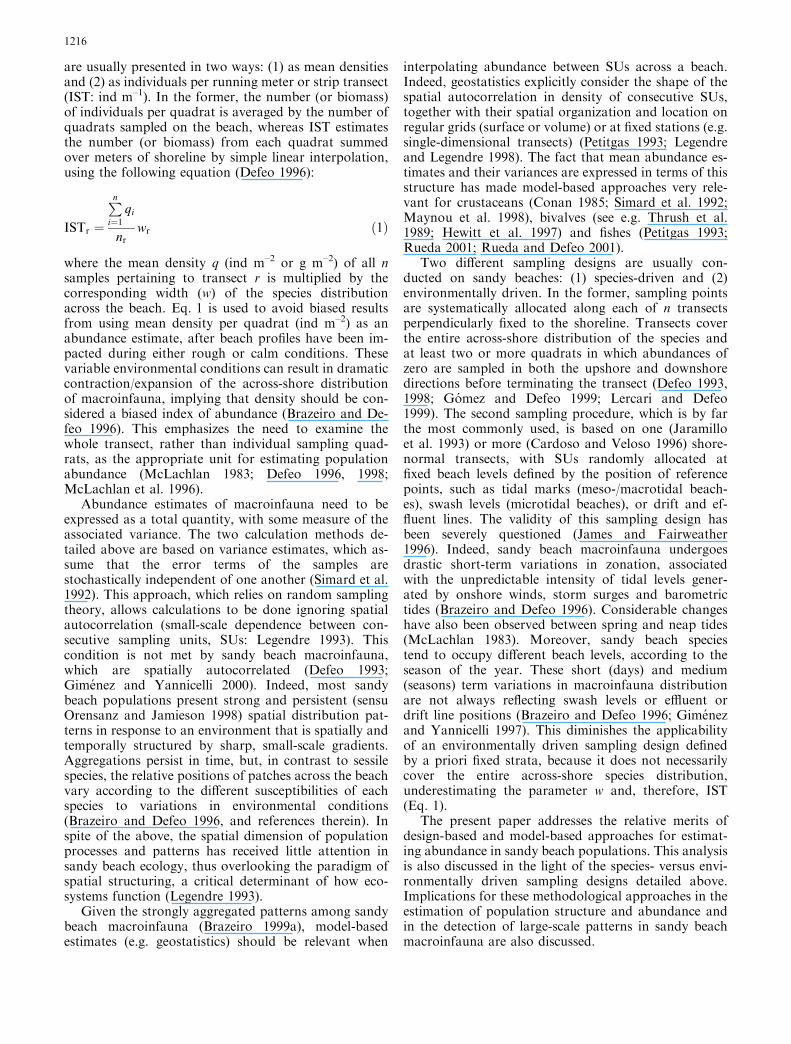
Variographic analyses revealed that in all cases themacroinfauna was spatially structured. The Gaussianmodel consistently provided the lowest RSS and thehighest r2 of all analyzed models, successfully explainingthe spatial population structure of E. armata andM. mactroides (Fig. 2; Table 1). The well-defined struc-ture determined a variance explained by the spatialmodels [C/(C0+C)] that ranged from 95% to 99%, and,thus, the unresolved small-scale variability (nuggeteffect) represented a maximum of 5% (Table 1). Therange parameter A0, which describes how differences in
abundance between SUs are spatially dependent, wasremarkably similar for E. armata (32 m) and adults(39 m) and recruits (34 m) of M. mactroides. The simi-larity of this structure of spatial dependence betweenspecies and population components strongly suggests aconsistent, spatially structured process in the across-shore distribution over a distance of �35 m.
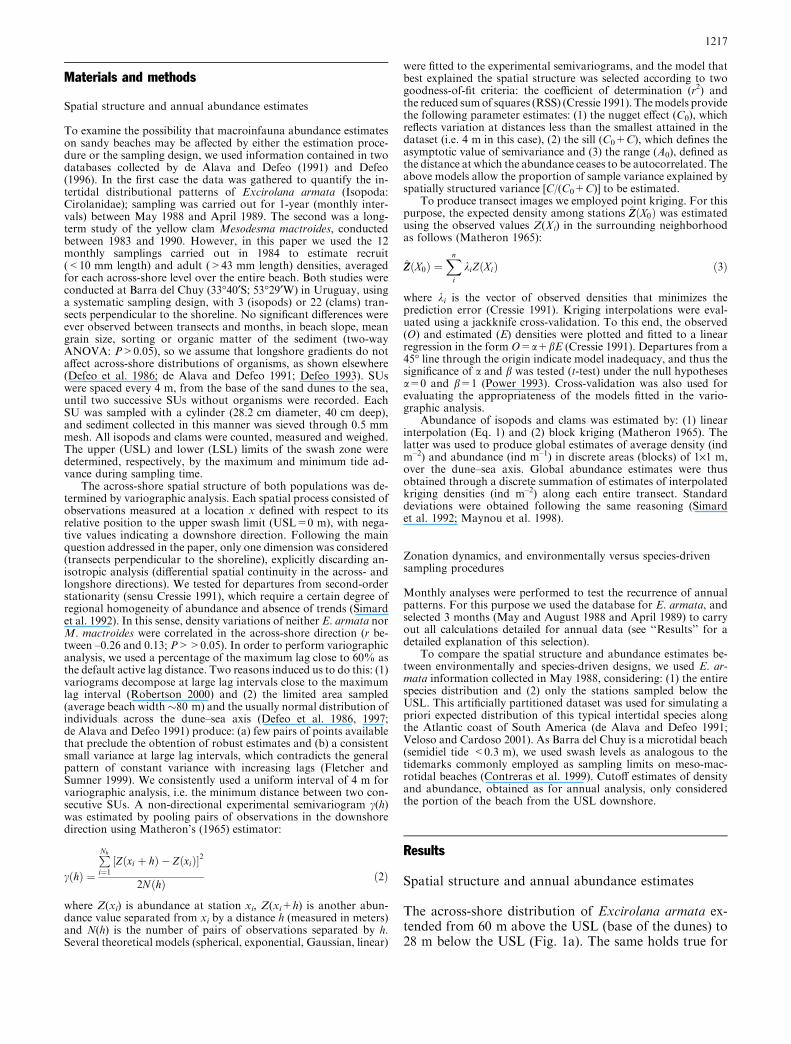
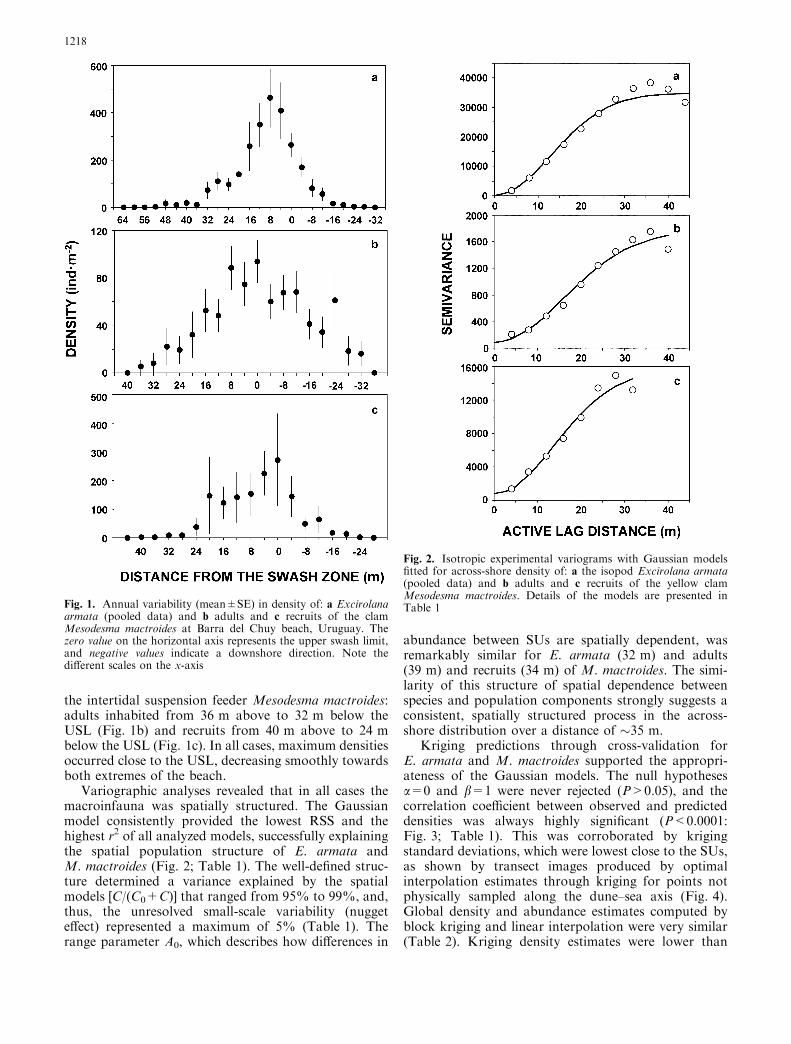
Kriging predictions through cross-validation forE. armata and M. mactroides supported the appropri-ateness of the Gaussian models. The null hypothesesa=0 and b=1 were never rejected (P>0.05), and thecorrelation coefficient between observed and predicteddensities was always highly significant (P<0.0001:Fig. 3; Table 1). This was corroborated by krigingstandard deviations, which were lowest close to the SUs,as shown by transect images produced by optimalinterpolation estimates through kriging for points notphysically sampled along the dune–sea axis (Fig. 4).Global density and abundance estimates computed byblock kriging and linear interpolation were very similar(Table 2). Kriging density estimates were lower than
Fig. 1. Annual variability (mean±SE) in density of: a Excirolanaarmata (pooled data) and b adults and c recruits of the clamMesodesma mactroides at Barra del Chuy beach, Uruguay. Thezero value on the horizontal axis represents the upper swash limit,and negative values indicate a downshore direction. Note thedifferent scales on the x-axis
Fig. 2. Isotropic experimental variograms with Gaussian modelsfitted for across-shore density of: a the isopod Excirolana armata(pooled data) and b adults and c recruits of the yellow clamMesodesma mactroides. Details of the models are presented inTable 1
1218
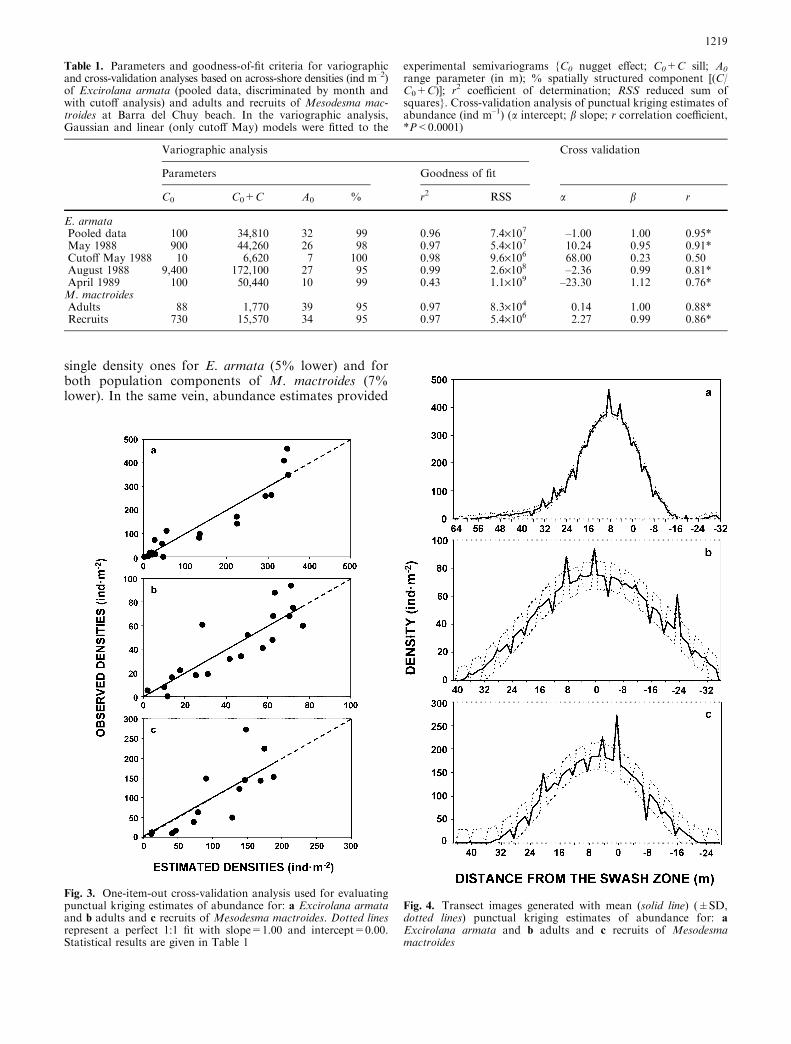
single density ones for E. armata (5% lower) and forboth population components of M. mactroides (7%lower). In the same vein, abundance estimates provided
Table 1. Parameters and goodness-of-fit criteria for variographicand cross-validation analyses based on across-shore densities (ind m–2)of Excirolana armata (pooled data, discriminated by month andwith cutoff analysis) and adults and recruits of Mesodesma mac-troides at Barra del Chuy beach. In the variographic analysis,Gaussian and linear (only cutoff May) models were fitted to the
experimental semivariograms {C0 nugget effect; C0+C sill; A0range parameter (in m); % spatially structured component [(C/C0+C)]; r2 coefficient of determination; RSS reduced sum ofsquares}. Cross-validation analysis of punctual kriging estimates ofabundance (ind m–1) (a intercept; b slope; r correlation coefficient,*P<0.0001)
Variographic analysis Cross validation
Parameters Goodness of fit
C0 C0+C A0 % r2 RSS a b r
E. armataPooled data 100 34,810 32 99 0.96 7.4·107 –1.00 1.00 0.95*May 1988 900 44,260 26 98 0.97 5.4·107 10.24 0.95 0.91*Cutoff May 1988 10 6,620 7 100 0.98 9.6·106 68.00 0.23 0.50August 1988 9,400 172,100 27 95 0.99 2.6·108 –2.36 0.99 0.81*April 1989 100 50,440 10 99 0.43 1.1·109 –23.30 1.12 0.76*M. mactroidesAdults 88 1,770 39 95 0.97 8.3·104 0.14 1.00 0.88*Recruits 730 15,570 34 95 0.97 5.4·106 2.27 0.99 0.86*
Fig. 3. One-item-out cross-validation analysis used for evaluatingpunctual kriging estimates of abundance for: a Excirolana armataand b adults and c recruits of Mesodesma mactroides. Dotted linesrepresent a perfect 1:1 fit with slope=1.00 and intercept=0.00.Statistical results are given in Table 1
Fig. 4. Transect images generated with mean (solid line) (±SD,dotted lines) punctual kriging estimates of abundance for: aExcirolana armata and b adults and c recruits of Mesodesmamactroides
1219
by Eq. 1 and block kriging were almost identical forE. armata and differed only by 0.5% and 0.3% foryellow clam adults and recruits, respectively.
Zonation dynamics and environmentally versusspecies-driven sampling procedures
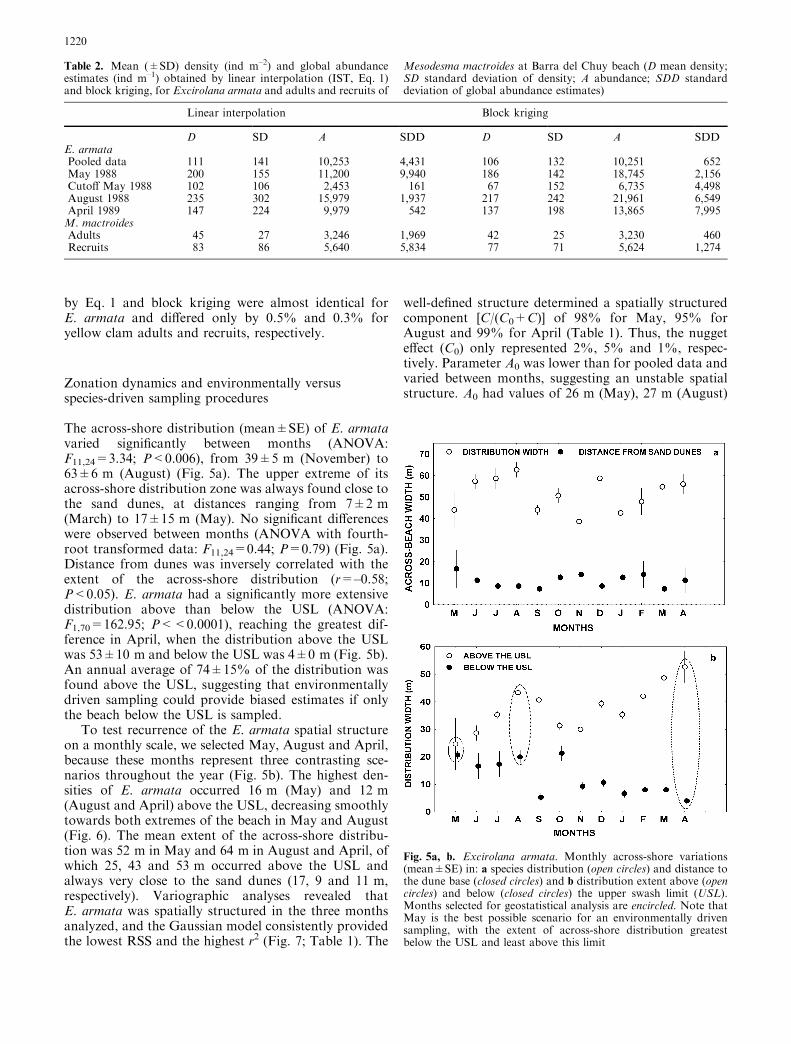
The across-shore distribution (mean±SE) of E. armatavaried significantly between months (ANOVA:F11,24=3.34; P<0.006), from 39±5 m (November) to63±6 m (August) (Fig. 5a). The upper extreme of itsacross-shore distribution zone was always found close tothe sand dunes, at distances ranging from 7±2 m(March) to 17±15 m (May). No significant differenceswere observed between months (ANOVA with fourth-root transformed data: F11,24=0.44; P=0.79) (Fig. 5a).Distance from dunes was inversely correlated with theextent of the across-shore distribution (r=–0.58;P<0.05). E. armata had a significantly more extensivedistribution above than below the USL (ANOVA:F1,70=162.95; P<<0.0001), reaching the greatest dif-ference in April, when the distribution above the USLwas 53±10 m and below the USL was 4±0 m (Fig. 5b).An annual average of 74±15% of the distribution wasfound above the USL, suggesting that environmentallydriven sampling could provide biased estimates if onlythe beach below the USL is sampled.
To test recurrence of the E. armata spatial structureon a monthly scale, we selected May, August and April,because these months represent three contrasting sce-narios throughout the year (Fig. 5b). The highest den-sities of E. armata occurred 16 m (May) and 12 m(August and April) above the USL, decreasing smoothlytowards both extremes of the beach in May and August(Fig. 6). The mean extent of the across-shore distribu-tion was 52 m in May and 64 m in August and April, ofwhich 25, 43 and 53 m occurred above the USL andalways very close to the sand dunes (17, 9 and 11 m,respectively). Variographic analyses revealed thatE. armata was spatially structured in the three monthsanalyzed, and the Gaussian model consistently providedthe lowest RSS and the highest r2 (Fig. 7; Table 1). The
well-defined structure determined a spatially structuredcomponent [C/(C0+C)] of 98% for May, 95% forAugust and 99% for April (Table 1). Thus, the nuggeteffect (C0) only represented 2%, 5% and 1%, respec-tively. Parameter A0 was lower than for pooled data andvaried between months, suggesting an unstable spatialstructure. A0 had values of 26 m (May), 27 m (August)
Table 2. Mean (±SD) density (ind m–2) and global abundanceestimates (ind m–1) obtained by linear interpolation (IST, Eq. 1)and block kriging, for Excirolana armata and adults and recruits of
Mesodesma mactroides at Barra del Chuy beach (D mean density;SD standard deviation of density; A abundance; SDD standarddeviation of global abundance estimates)
Linear interpolation Block kriging
D SD A SDD D SD A SDDE. armataPooled data 111 141 10,253 4,431 106 132 10,251 652May 1988 200 155 11,200 9,940 186 142 18,745 2,156Cutoff May 1988 102 106 2,453 161 67 152 6,735 4,498August 1988 235 302 15,979 1,937 217 242 21,961 6,549April 1989 147 224 9,979 542 137 198 13,865 7,995M. mactroidesAdults 45 27 3,246 1,969 42 25 3,230 460Recruits 83 86 5,640 5,834 77 71 5,624 1,274
Fig. 5a, b. Excirolana armata. Monthly across-shore variations(mean±SE) in: a species distribution (open circles) and distance tothe dune base (closed circles) and b distribution extent above (opencircles) and below (closed circles) the upper swash limit (USL).Months selected for geostatistical analysis are encircled. Note thatMay is the best possible scenario for an environmentally drivensampling, with the extent of across-shore distribution greatestbelow the USL and least above this limit
1220
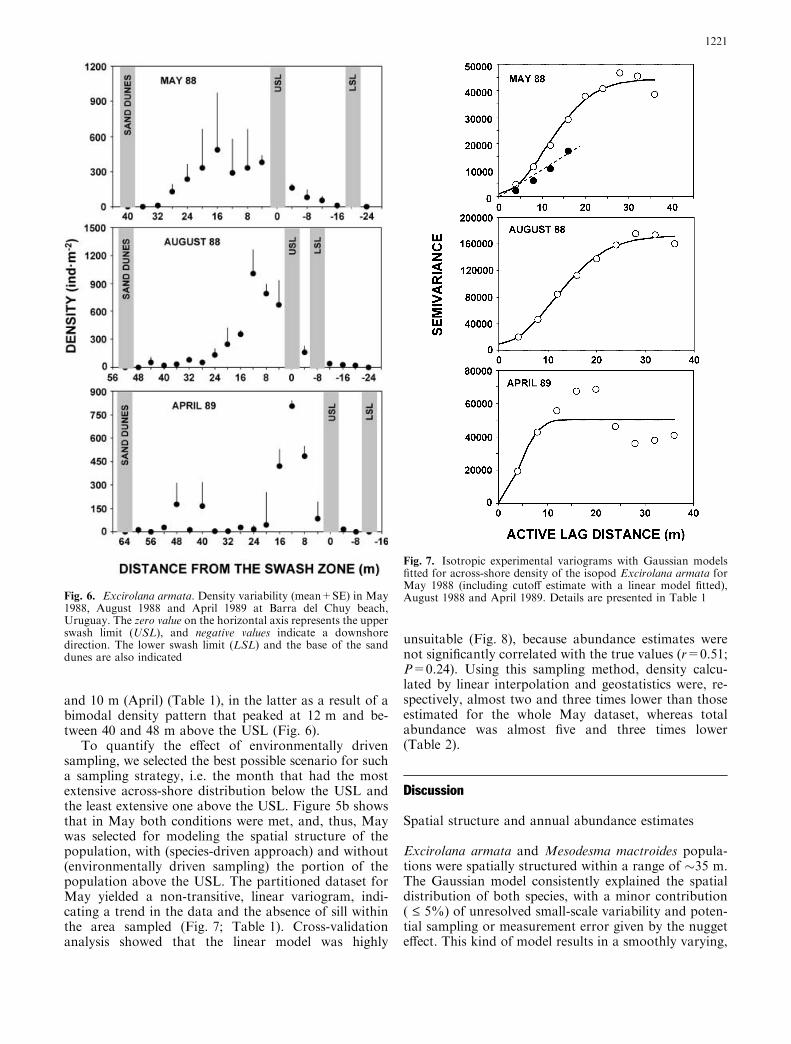
and 10 m (April) (Table 1), in the latter as a result of abimodal density pattern that peaked at 12 m and be-tween 40 and 48 m above the USL (Fig. 6).
To quantify the effect of environmentally drivensampling, we selected the best possible scenario for sucha sampling strategy, i.e. the month that had the mostextensive across-shore distribution below the USL andthe least extensive one above the USL. Figure 5b showsthat in May both conditions were met, and, thus, Maywas selected for modeling the spatial structure of thepopulation, with (species-driven approach) and without(environmentally driven sampling) the portion of thepopulation above the USL. The partitioned dataset forMay yielded a non-transitive, linear variogram, indi-cating a trend in the data and the absence of sill withinthe area sampled (Fig. 7; Table 1). Cross-validationanalysis showed that the linear model was highly
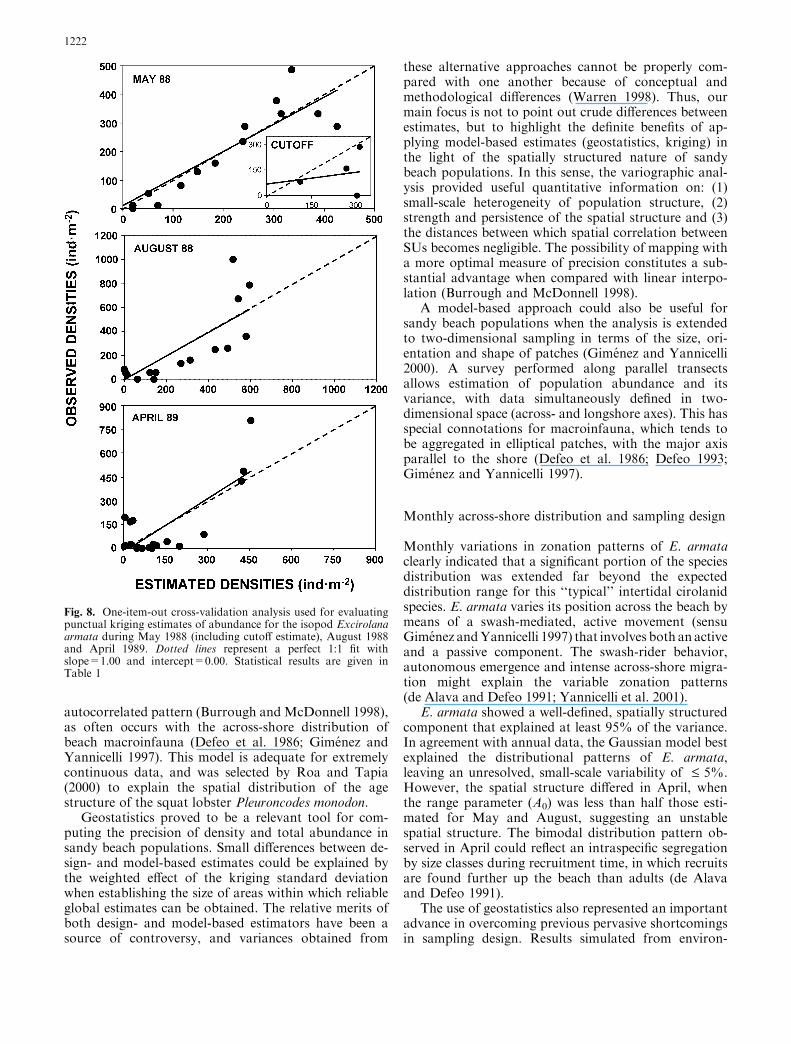
unsuitable (Fig. 8), because abundance estimates werenot significantly correlated with the true values (r=0.51;P=0.24). Using this sampling method, density calcu-lated by linear interpolation and geostatistics were, re-spectively, almost two and three times lower than thoseestimated for the whole May dataset, whereas totalabundance was almost five and three times lower(Table 2).
Discussion
Spatial structure and annual abundance estimates
Excirolana armata and Mesodesma mactroides popula-tions were spatially structured within a range of �35 m.The Gaussian model consistently explained the spatialdistribution of both species, with a minor contribution( £ 5%) of unresolved small-scale variability and poten-tial sampling or measurement error given by the nuggeteffect. This kind of model results in a smoothly varying,
Fig. 6. Excirolana armata. Density variability (mean+SE) in May1988, August 1988 and April 1989 at Barra del Chuy beach,Uruguay. The zero value on the horizontal axis represents the upperswash limit (USL), and negative values indicate a downshoredirection. The lower swash limit (LSL) and the base of the sanddunes are also indicated
Fig. 7. Isotropic experimental variograms with Gaussian modelsfitted for across-shore density of the isopod Excirolana armata forMay 1988 (including cutoff estimate with a linear model fitted),August 1988 and April 1989. Details are presented in Table 1
1221
autocorrelated pattern (Burrough and McDonnell 1998),as often occurs with the across-shore distribution ofbeach macroinfauna (Defeo et al. 1986; Gimenez andYannicelli 1997). This model is adequate for extremelycontinuous data, and was selected by Roa and Tapia(2000) to explain the spatial distribution of the agestructure of the squat lobster Pleuroncodes monodon.
Geostatistics proved to be a relevant tool for com-puting the precision of density and total abundance insandy beach populations. Small differences between de-sign- and model-based estimates could be explained bythe weighted effect of the kriging standard deviationwhen establishing the size of areas within which reliableglobal estimates can be obtained. The relative merits ofboth design- and model-based estimators have been asource of controversy, and variances obtained from
these alternative approaches cannot be properly com-pared with one another because of conceptual andmethodological differences (Warren 1998). Thus, ourmain focus is not to point out crude differences betweenestimates, but to highlight the definite benefits of ap-plying model-based estimates (geostatistics, kriging) inthe light of the spatially structured nature of sandybeach populations. In this sense, the variographic anal-ysis provided useful quantitative information on: (1)small-scale heterogeneity of population structure, (2)strength and persistence of the spatial structure and (3)the distances between which spatial correlation betweenSUs becomes negligible. The possibility of mapping witha more optimal measure of precision constitutes a sub-stantial advantage when compared with linear interpo-lation (Burrough and McDonnell 1998).
A model-based approach could also be useful forsandy beach populations when the analysis is extendedto two-dimensional sampling in terms of the size, ori-entation and shape of patches (Gimenez and Yannicelli2000). A survey performed along parallel transectsallows estimation of population abundance and itsvariance, with data simultaneously defined in two-dimensional space (across- and longshore axes). This hasspecial connotations for macroinfauna, which tends tobe aggregated in elliptical patches, with the major axisparallel to the shore (Defeo et al. 1986; Defeo 1993;Gimenez and Yannicelli 1997).
Monthly across-shore distribution and sampling design
Monthly variations in zonation patterns of E. armataclearly indicated that a significant portion of the speciesdistribution was extended far beyond the expecteddistribution range for this ‘‘typical’’ intertidal cirolanidspecies. E. armata varies its position across the beach bymeans of a swash-mediated, active movement (sensuGimenez andYannicelli 1997) that involves both an activeand a passive component. The swash-rider behavior,autonomous emergence and intense across-shore migra-tion might explain the variable zonation patterns(de Alava and Defeo 1991; Yannicelli et al. 2001).E. armata showed a well-defined, spatially structured
component that explained at least 95% of the variance.In agreement with annual data, the Gaussian model bestexplained the distributional patterns of E. armata,leaving an unresolved, small-scale variability of £ 5%.However, the spatial structure differed in April, whenthe range parameter (A0) was less than half those esti-mated for May and August, suggesting an unstablespatial structure. The bimodal distribution pattern ob-served in April could reflect an intraspecific segregationby size classes during recruitment time, in which recruitsare found further up the beach than adults (de Alavaand Defeo 1991).
The use of geostatistics also represented an importantadvance in overcoming previous pervasive shortcomingsin sampling design. Results simulated from environ-
Fig. 8. One-item-out cross-validation analysis used for evaluatingpunctual kriging estimates of abundance for the isopod Excirolanaarmata during May 1988 (including cutoff estimate), August 1988and April 1989. Dotted lines represent a perfect 1:1 fit withslope=1.00 and intercept=0.00. Statistical results are given inTable 1
1222
mentally driven sampling directed to cover a specificbeach fringe showed the drastic effect that a prioristratified sampling designs could have when estimatingabundance in sandy beach macroinfauna. Contrary tothe recurrent Gaussian models fitted to the experimentalsemivariograms, the cutoff distribution for May resultedin a linear semivariogram, indicating a spatial gradientwith no sill within the area sampled (Legendre andFortin 1989), and thus precluding the estimation ofpopulation structure. More importantly, the linearsemivariogram strongly suggests that sampling has notbeen performed at the correct spatial scale, and, thus,the cross-validation procedure was unsuitable for pre-dictive purposes. Finally, density and abundance wereunderestimated by linear interpolation and kriging, afact expected for the latter but not clearly foreseen in thecase of density estimates.
The intensive systematic sampling used here, withserially correlated location of samples, makes suitablethe application of geostatistics in order to quantify theacross-shore characteristics of population structure. Thefine scale used (4 m between consecutive SUs) contrib-uted to the accurate abundance estimates, as indicatedby the quasi-imperceptible nugget effect. The species-driven sampling design, with regular placement of SUsalong transects, offers the additional advantage ofmodel-based approaches. Semivariograms explicitly takeaccount of the spatial autocorrelation of SUs during theinterpolation process. On the other hand, surveys thatfollow random sampling schemes among a priori fixedstrata, such as in environmentally driven sampling de-signs, while they are devised to satisfy the assumptionsof random sampling theory, are suboptimal for a geo-statistical approach. Even though geostatistics does notrequire a special sampling design, a regular placement ofstations improves results in terms of prediction error(Cressie 1991; Pelletier and Parma 1994).
A priori delimitation of strata could be a potentialsource of bias when estimating abundance, because ofthe uncertainty in the across-shore position and distri-bution extent of a species. In this context, parameter win Eq. 1 is critical: if stochastic variations in wind-driventides lead to across-shore distribution beyond the ref-erence points used as stratum limits, partial samplingwill lead to biased abundance estimates. Powerful evi-dence supports the above arguments: Brazeiro andDefeo (1996) demonstrated short-term, unpredictablevariations in swash levels on a microtidal, dissipativebeach, which determined large, short-term variations inthe across-shore distribution of several species, even wellbeyond the beach fringes where, a priori, one wouldexpect to find them. The authors showed that zonationdynamics of most species in a microtidal environment,rather than stability, revealed great temporal variabilityfor typical bioindicators of the supralittoral (the talitridamphipod Pseudorchestoidea brasiliensis) and intertidal(Excirolana armata and the suspension feeders Donaxhanleyanus and Mesodesma mactroides) zones. Baro-metric tides, storm surges and wind-driven surf off the
ocean strand clams of all sizes far above the drift lineand even close to the sand dunes (Olivier et al. 1971;Defeo et al. 1986; de Alava 1993). These drastic varia-tions call for adaptive strategies in the sampling design,by which the extent of the across-shore distribution canbe defined once in the field, covering the entire speciesdistribution (see also Borzone et al. 1996). James andFairweather (1996) also showed significant across-shorevariation for nearly all species and highlighted the needto formally assess variation within a priori selectedstrata in order to determine a meaningful samplingstratification for sandy beaches. However, due to thehigh between-beach variability, the number of strataappears to be relevant for individual beaches in specificenvironmental circumstances, whereas application toseveral beaches and even to the same beach through timeis highly problematic.
Macroecological implications
Results derived from environmentally driven samplingspoorly replicated in space and time (i.e. one transect, onesampling date) have been employed to detect macroscalepatterns in community (e.g. diversity, species richness)and population (body size) attributes (McLachlan 1990;Jaramillo and McLachlan 1993; McLachlan et al. 1993;Brazeiro 1999b). These studies have also been used tosubstantiate empirical relations between biological(abundance, individual sizes, diversity, species richness)and environmental (e.g. mean grain size, slope, Dean’sparameter) variables. These weaknesses surely imply aloss of information that inhibits our ability to detect large-scale community and population patterns (James andFairweather 1996). Indeed, since many data points used inthe ‘‘validation’’ of macroecological patterns or empiricalrelations have potential biases in abundance estimates,they should be considered with caution. For example,Jaramillo et al. (1993) reported zonation patterns, withonly one sampling level above the drift line (exact positionunknown, see critiques also by James and Fairweather1996, p. 101). This could certainly bias the abundance ofsupralittoral talitrid amphipods that characterize thiszone and likely provides misleading results. The lack ofsignificant relationships between abundance, biomass,body size and physical features in the amphipodOrchestoidea tuberculata (Jaramillo and McLachlan1993: see their Figs. 3, 4 and 5) could partly reflect theconfounding effect caused by inadequate and unclearcriteria of allocation of SUs at upper beach levels. It iswidely known that supralittoral amphipods performintense upshore migrations both daily (before sunrise)and seasonally (in winter); they migrate well beyond thestrandline, into the dunes, up to seaside cottages andacross roads (Scapini et al. 1995; Brown 1996; Naylor andRejeki 1996; Scapini 1997). This certainly precludes rigiduse of the drift line as the uppermost sampling limit (e.g.Jaramillo et al. 1993; Jaramillo and McLachlan 1993).Moreover, physical data actually reveal that around the
1223
effluent and drift lines drastic environmental gradientsdetermine clumps of distributional boundaries associatedwith species turnovers (Brazeiro 1999a). The same holdstrue for intertidal species inadequately sampled onlybetween the tidemarks or swash levels (e.g. Contreras etal. 1999), leading to non-significant patterns in the rela-tionship between population and physical descriptors(Jaramillo and McLachlan 1993). This lack of statisticalsignificance could not be entirely attributed to failures insampling design, but this would certainly contribute tomisleading results.
Additional problems and weaknesses arise withbackground noise in sampling data collected withouttemporal replication (e.g. McLachlan 1990; Defeo et al.1992; Jaramillo and McLachlan 1993; Jaramillo et al.1993; Brazeiro 1999b), which could lead to dubious in-terpretations at coarser spatial resolutions. The abovepapers report an absence of significant results in manyempirical relationships at both community and popula-tion levels (Jaramillo and McLachlan 1993), a very lowpercentage of variance is explained (McLachlan et al.1993) and distinct outliers are present (Brazeiro 1999b).Given the poor replication in time, it is impossible todiscern whether the lack of significance actually reflectstemporal and spatial global patterns or merely situationswhen the species were particularly abundant or scarceat the beach fringe on the day sampled (James andFairweather 1996; Defeo et al. 2001). Biases of this typemay be widespread in empirical approaches that arerelatively common in sandy beach ecology.
In summary, we showed that: (1) geostatistics pro-vided key information on spatial organization and forabundance estimation, and, thus, it is suggested as apowerful tool for further application in studies of sandybeach macroinfauna. (2) Environmentally driven sam-pling strategies are prone to distorting reality concerningthe nature of spatial structures, thereby provide biasedabundance estimates and, thus, should be avoided insandy beach population studies. This is especially truefor microtidal beaches, where unpredictable swashstrength precludes a priori stratification through envi-ronmental reference points. We are continuing this workby comparing the different sampling designs using in-dependent datasets obtained during different seasons ofthe year and under dissimilar environmental conditions.
Acknowledgements This paper was written during the Ph.D. ofM.R. at CINVESTAV IPN Unidad Merida. A. Condal (UniversiteLaval), C.H. Peterson (University of North Carolina at ChapelHill) and three anonymous referees provided very useful comments.Financial support from the Uruguayan institutions INAPE,CONICYT (project nos. 1018 and 4034), CSIC and PEDECIBAare acknowledged. This research was conducted under the laws andcodes of ethics of Uruguay.
References
Borzone CA, Souza JRB, Soares AG (1996) Morphodynamic in-fluence on the structure of inter- and subtidal macrofaunal
communities of subtropical sandy beaches. Rev Chil Hist Nat69:565–577
Brazeiro A (1999a) Detection of non-random zonation patterns insandy intertidal communities. J Coast Res 15:121–127
Brazeiro A (1999b) Community patterns in sandy beaches of Chile:richness, composition, distribution and abundance of species.Rev Chil Hist Nat 72:93–105
Brazeiro A, Defeo O (1996) Macroinfauna zonation in microtidalsandy beaches: is it possible to identify patterns in such variableenvironments? Estuar Coast Shelf Sci 42:523–536
Brown AC (1996) Behavioural plasticity as a key factor in thesurvival and evolution of the macrofauna on exposed sandybeaches. Rev Chil Hist Nat 69:469–474
Burrough PA, McDonnell RA (1998) Principles of geographicalinformation systems. Oxford University Press, New York
Cardoso RS, Veloso VG (1996) Population biology and secondaryproduction of the sandhopper Pseudorchestoidea brasiliensis(Amphipoda: Talitridae) at Prainha Beach, Brazil. Mar EcolProg Ser 142:111–119
Contreras H, Defeo O, Jaramillo E (1999) Life history of Emeritaanaloga (Stimpson) (Anomura, Hippidae) in a sandy beach ofsouth central Chile. Estuar Coast Shelf Sci 48:101–112
Conan GY (1985) Assessment of shellfish stocks by geostatisticaltechniques. Int Counc Explor Sea Comm Meet (Shellfish andBenthos Comm) K:30:1–19
Cressie N (1991) Statistics for spatial data. Wiley, New Yorkde Alava A (1993) Interdependencias ecologicas entre dos bivalvos
simpatricos en una playa arenosa de la costa atlantica uru-guaya. MSc thesis, CINVESTAV-IPN, Merida, Mexico
de Alava A, Defeo O (1991) Distributional pattern and populationdynamics of Excirolana armata (Isopoda: Cirolanidae) in aUruguayan sandy beach. Estuar Coast Shelf Sci 33:433–444
Defeo O (1993) The effect of spatial scales in population dynamicsand modelling of sedentary fisheries: the yellow clamMesodesma mactroides of an Uruguayan exposed sandy beach.PhD thesis, CINVESTAV-IPN, Merida, Mexico
Defeo O (1996) Experimental management of an exploited sandybeach bivalve population. Rev Chil Hist Nat 69:605–614
Defeo O (1998) Testing hypotheses on recruitment, growth andmortality in exploited bivalves: an experimental perspective.Can Spec Publ Fish Aquat Sci 125:257–264
Defeo O, Layerle C, Masello A (1986) Spatial and temporalstructure of the yellow clam Mesodesma mactroides (Deshayes,1854) in Uruguay. Medio Ambiente 8:48–57
Defeo O, Jaramillo E, Lyonnet A (1992) Community structure andintertidal zonation of the macroinfauna in the Atlantic coast ofUruguay. J Coast Res 8:830–839
Defeo O, Brazeiro A, de Alava A, Riestra G (1997) Is sandy beachmacroinfauna only physically controlled? Role of substrate andcompetition in isopods. Estuar Coast Shelf Sci 45:453–462
Defeo O, Gomez J, Lercari D (2001) Testing the swash exclusionhypothesis in sandy beach populations: the mole crab Emeritabrasiliensis in Uruguay. Mar Ecol Prog Ser 212:159–170
Fletcher WJ, Sumner NR (1999) Spatial distribution of sardine(Sardinops sagax) eggs and larvae: an application of geostatis-tics and resampling to survey data. Can J Fish Aquat Sci56:907–914
Gimenez L, Yannicelli B (1997) Variability of zonation patterns intemperate microtidal Uruguayan beaches with different mor-phodynamic types. Mar Ecol Prog Ser 160:197–207
Gimenez L, Yannicelli B (2000) Longshore patterns of distributionof macroinfauna on a Uruguayan sandy beach: an analysis atdifferent spatial scales and of their potential causes. Mar EcolProg Ser 199:111–125
Gomez J, Defeo O (1999) Life history of the sandhopperPseudorchestoidea brasiliensis (Amphipoda) in sandy beacheswith contrasting morphodynamics. Mar Ecol Prog Ser 182:209–220
Hewitt JE, Legendre P, McArdle BH, Thrush SF, Bellehumeur C,Lawrie SM (1997) Identifying relationships between adult andjuvenile bivalves at different spatial scales. J Exp Mar Biol Ecol216:77–98
1224
James RJ, Fairweather PG (1996) Spatial variation of intertidalmacrofauna on a sandy ocean beach in Australia. Estuar CoastShelf Sci 43:81–107
Jaramillo E, McLachlan A (1993) Community and population re-sponses of the macroinfauna to physical factors over a range ofexposed sandy beaches in south-central Chile. Estuar CoastShelf Sci 37:615–624
Jaramillo E, McLachlan A, Coetzee P (1993) Intertidal zonationpatterns of macrofauna over a range of exposed sandy beachesin south-central Chile. Mar Ecol Prog Ser 101:105–118
Legendre P (1993) Spatial autocorrelation: trouble or new para-digm? Ecology 74:1659–1673
Legendre P, Fortin MJ (1989) Spatial pattern and ecologicalanalysis. Vegetatio 80:107–138
Legendre P, Legendre L (1998) Numerical ecology. Developmentsin environmental modelling. Elsevier, Amsterdam
Lercari D, Defeo O (1999) Effects of freshwater discharge in sandybeach populations: the mole crab Emerita brasiliensis inUruguay. Estuar Coast Shelf Sci 49:457–468
Matheron G (1965) La theorie des variables regionalisees et sesapplications. Masson et Cie, Paris
Maynou FX, Sarda F, Conan GY (1998) Assessment of the spatialstructure and biomass evaluation of Nephrops norvegicus (L.)populations in the northwestern Mediterranean by geostatistics.ICES J Mar Sci 55:102–120
McLachlan A (1983) Sandy beach ecology: a review. In:McLachlan A, Erasmus T (eds) Sandy beaches as ecosystems.Junk, The Hague, pp 321–380
McLachlan A (1990) Dissipative beaches and macrofauna com-munities on exposed intertidal sands. J Coast Res 6:57–71
McLachlan A, Jaramillo E, Donn TE, Wessels F (1993) Sand beachmacrofauna communities: a geographical comparison. J CoastRes 15:27–38
McLachlan A, Dugan JE, Defeo O, Ansell AD, Hubbard DM,Jaramillo E, Penchaszadeh P (1996) Beach clam fisheries.Oceanogr Mar Biol Annu Rev 34:163–232
Naylor E, Rejeki S (1996) Tidal migrations and rhythmicbehaviour of sandbeach Crustacea. Rev Chil Hist Nat 69:475–484
Olivier S, Capezzani D, Carreto J, Christiansen H, Moreno V, deMoreno JA, Penchaszadeh P (1971) Estructura de la comuni-dad, dinamica de la poblacion y biologıa de la almeja amarilla(Mesodesma mactroides) Proy Des Pesq FAO, Serv Inf Tec27:1–90
Orensanz J, Jamieson G (1998) The assessment and management ofspatially structured stocks. Can Spec Publ Fish Aquat Sci125:441–459
Pelletier D, Parma A (1994) Spatial distribution of Pacific halibut(Hippoglossus stenolepis): an application of geostatistics tolongline survey data. Can J Fish Aquat Sci 51:1506–1518
Petitgas P (1993) Geostatistics for fish stock assessments: a reviewand an acoustic application. ICES J Mar Sci 50:285–298
Power M (1993) The predictive validation of ecological and envi-ronmental models. Ecol Model 68:33–50
Roa R, Tapia F (2000) Cohorts in space: geostatistical mapping ofthe age structure of the squat lobster Pleuroncodes monodonpopulation off central Chile. Mar Ecol Prog Ser 196:239–251
Robertson GP (2000) GS+: geostatistics for the environmentalsciences. Gamma Design Software, Plainwell, Mich.
Rueda M (2001) Spatial distribution of fish species in a tropicalestuarine lagoon: a geostatistical appraisal. Mar Ecol Prog Ser222:217–226
Rueda M, Defeo O (2001) Survey abundance indices in a tropicalestuarine lagoon and their management implications: a spa-tially-explicit approach. ICES J Mar Sci 58:1219–1231
Scapini F (1997) Variation in scototaxis and orientation adaptationof Talitrus saltator populations subjected to different ecologicalconstraints. Estuar Coast Shelf Sci 44:139–146
Scapini F, Buiatti M, De Matthaeis E, Mattoccia M (1995) Ori-entation behaviour and heterozygosity of sandhopper popula-tions in relation to stability of beach environments. J Evol Biol8:43–52
Simard Y, Legendre P, Lavoie G, Marcotte D (1992) Mapping,estimating biomass, and optimizing sampling programs forspatially autocorrelated data: case study of the northern shrimp(Pansalus borealis). Can J Fish Aquat Sci 49:32–45
Thrush SF, Hewitt JE, Pridmore RD (1989) Patterns in the spatialarrangements of polychaetes and bivalves in intertidal sandflats.Mar Biol 102:529–535
Veloso VG, Cardoso RS (2001) The effect of morphodynamics onthe spatial and temporal variation of the macrofauna of threesandy beaches on the Rio de Janeiro state, Brazil. J Mar BiolAssoc UK 81:369–375
Warren W (1998) Spatial analysis for marine populations: factorsto be considered. Can Spec Publ Fish Aquat Sci 125:21–28
Yannicelli B, Palacios R, Gimenez L (2001) Activity rhythms oftwo cirolanid isopods from an exposed microtidal sandy beachin Uruguay. Mar Biol 138:187–197
1225
Related Documents