vol. 176, no. 1 the american naturalist july 2010 E-Article Spatial Self-Organization on Intertidal Mudflats through Biophysical Stress Divergence Ellen J. Weerman, 1,2,* Johan van de Koppel, 1 Maarten B. Eppinga, 3 Francesc Montserrat, 1,4 Quan-Xing Liu, 1 and Peter M. J. Herman 1 1. Centre for Estuarine and Marine Ecology, Netherlands Institute of Ecology (NIOO-KNAW), P.O. Box 40, 4400 AC Yerseke, The Netherlands; 2. Aquatic Ecology and Ecotoxicology, Institute for Biodiversity and Ecosystem Dynamics, University of Amsterdam, P.O. Box 94240, 1090 GE Amsterdam, The Netherlands; 3. Department of Plant Biology, University of Vermont, Burlington, Vermont 05405; 4. Delft University of Technology, Faculty of Civil Engineering and Geosciences, Hydraulics Section, P.O. Box 5048, 2600 GA Delft, The Netherlands Submitted September 4, 2009; Accepted January 8, 2010; Electronically published May 24, 2010 Online enhancement: video. abstract: In this study, we investigated the emergence of spatial self-organized patterns on intertidal flats, resulting from the inter- action between biological and geomorphological processes. Auto- correlation analysis of aerial photographs revealed that diatoms occur in regularly spaced patterns consisting of elevated hummocks alter- nating with water-filled hollows. Hummocks were characterized by high diatom content and a high sediment erosion threshold, while both were low in hollows. These results highlight the interaction between diatom growth and sedimentary processes as a potential mechanism for spatial patterning. Several alternative mechanisms could be excluded as important mechanisms in the formation of spatial patterns. We developed a spatially explicit mathematical model that revealed that scale-dependent interactions between sedimenta- tion, diatom growth, and water redistribution explain the observed patterns. The model predicts that areas exhibiting spatially self- organized patterns have increased sediment accretion and diatom biomass compared with areas lacking spatial patterns, a prediction confirmed by empirical evidence. Our study on intertidal mudflats provides a simple but clear-cut example of how the interaction be- tween biological and sedimentary processes, through the process of self-organization, induces spatial patterns at a landscape level. Keywords: biogeomorphology, diatom, sediment, ecosystem func- tioning, Westerschelde, scale-dependent feedback mechanisms. Introduction In the past decade, a large number of studies have reported on regular pattern formation in a wide range of ecosystems (for a review, see Rietkerk and van de Koppel 2008). The- oretical studies proposed that regular pattern formation is induced by feedback mechanisms acting on different scales * Corresponding author; e-mail: [email protected]. Am. Nat. 2010. Vol. 176, pp. 000–000. 2010 by The University of Chicago. 0003-0147/2010/17601-51577$15.00. All rights reserved. DOI: 10.1086/652991 (Levin and Segel 1985). Here, facilitation processes locally improve living conditions through, for instance, the ac- cumulation of nutrients (oligotrophic peatlands) or water (arid ecosystems), causing a small-scale positive feedback. This is countered by larger-scale inhibitory processes—for instance, through depletion of resources—that cause a negative feedback (Couteron and Lejeune 2001; Rietkerk et al. 2002, 2004a; Eppinga et al. 2008). This scale-depen- dent feedback mechanism can explain the formation of regular spatial patterns in many ecosystems and is pre- dicted to have important implications for ecosystem func- tioning in terms of increased production or resilience (Rietkerk and van de Koppel 2008). Theoretical studies have mainly focused on concentra- tion of limiting resources when explaining regular pattern formation in ecosystems. However, field studies have pointed to possible alternative mechanisms for explaining regular patterns in ecosystems that are based on divergence of physical stresses, for example, the divergence of water flow or snow (Temmerman et al. 2005; Hiemstra et al. 2006; Larsen et al. 2007; van Wesenbeeck et al. 2008). On salt marshes, for instance, clumps of vegetation obstruct water flow, which locally improves growth conditions. Di- vergence of water flow around vegetation clumps increases erosion, which limits plant growth just outside the clump and hence induces a scale-dependent feedback. This mech- anism has been suggested to trigger the development of spatial structure in salt marshes and even affect landscape formation in this ecosystem (D’Alpaos et al. 2007; Tem- merman et al. 2007; van Wesenbeeck et al. 2008). Whether it can explain the formation of regular, self-organized spa- tial patterns has remained unstudied. In this study, we describe how redistribution of hydro- dynamic stress by diatoms can explain the formation of regular patterns on intertidal mudflats. Here, elevated

Welcome message from author
This document is posted to help you gain knowledge. Please leave a comment to let me know what you think about it! Share it to your friends and learn new things together.
Transcript

vol. 176, no. 1 the american naturalist july 2010 �
E-Article
Spatial Self-Organization on Intertidal Mudflats
through Biophysical Stress Divergence
Ellen J. Weerman,1,2,* Johan van de Koppel,1 Maarten B. Eppinga,3 Francesc Montserrat,1,4
Quan-Xing Liu,1 and Peter M. J. Herman1
1. Centre for Estuarine and Marine Ecology, Netherlands Institute of Ecology (NIOO-KNAW), P.O. Box 40, 4400 AC Yerseke, TheNetherlands; 2. Aquatic Ecology and Ecotoxicology, Institute for Biodiversity and Ecosystem Dynamics, University of Amsterdam, P.O.Box 94240, 1090 GE Amsterdam, The Netherlands; 3. Department of Plant Biology, University of Vermont, Burlington, Vermont05405; 4. Delft University of Technology, Faculty of Civil Engineering and Geosciences, Hydraulics Section, P.O. Box 5048, 2600 GADelft, The Netherlands
Submitted September 4, 2009; Accepted January 8, 2010; Electronically published May 24, 2010
Online enhancement: video.
abstract: In this study, we investigated the emergence of spatialself-organized patterns on intertidal flats, resulting from the inter-action between biological and geomorphological processes. Auto-correlation analysis of aerial photographs revealed that diatoms occurin regularly spaced patterns consisting of elevated hummocks alter-nating with water-filled hollows. Hummocks were characterized byhigh diatom content and a high sediment erosion threshold, whileboth were low in hollows. These results highlight the interactionbetween diatom growth and sedimentary processes as a potentialmechanism for spatial patterning. Several alternative mechanismscould be excluded as important mechanisms in the formation ofspatial patterns. We developed a spatially explicit mathematical modelthat revealed that scale-dependent interactions between sedimenta-tion, diatom growth, and water redistribution explain the observedpatterns. The model predicts that areas exhibiting spatially self-organized patterns have increased sediment accretion and diatombiomass compared with areas lacking spatial patterns, a predictionconfirmed by empirical evidence. Our study on intertidal mudflatsprovides a simple but clear-cut example of how the interaction be-tween biological and sedimentary processes, through the process ofself-organization, induces spatial patterns at a landscape level.
Keywords: biogeomorphology, diatom, sediment, ecosystem func-tioning, Westerschelde, scale-dependent feedback mechanisms.
Introduction
In the past decade, a large number of studies have reportedon regular pattern formation in a wide range of ecosystems(for a review, see Rietkerk and van de Koppel 2008). The-oretical studies proposed that regular pattern formation isinduced by feedback mechanisms acting on different scales
* Corresponding author; e-mail: [email protected].
Am. Nat. 2010. Vol. 176, pp. 000–000. � 2010 by The University of Chicago.0003-0147/2010/17601-51577$15.00. All rights reserved.DOI: 10.1086/652991
(Levin and Segel 1985). Here, facilitation processes locallyimprove living conditions through, for instance, the ac-cumulation of nutrients (oligotrophic peatlands) or water(arid ecosystems), causing a small-scale positive feedback.This is countered by larger-scale inhibitory processes—forinstance, through depletion of resources—that cause anegative feedback (Couteron and Lejeune 2001; Rietkerket al. 2002, 2004a; Eppinga et al. 2008). This scale-depen-dent feedback mechanism can explain the formation ofregular spatial patterns in many ecosystems and is pre-dicted to have important implications for ecosystem func-tioning in terms of increased production or resilience(Rietkerk and van de Koppel 2008).
Theoretical studies have mainly focused on concentra-tion of limiting resources when explaining regular patternformation in ecosystems. However, field studies havepointed to possible alternative mechanisms for explainingregular patterns in ecosystems that are based on divergenceof physical stresses, for example, the divergence of waterflow or snow (Temmerman et al. 2005; Hiemstra et al.2006; Larsen et al. 2007; van Wesenbeeck et al. 2008). Onsalt marshes, for instance, clumps of vegetation obstructwater flow, which locally improves growth conditions. Di-vergence of water flow around vegetation clumps increaseserosion, which limits plant growth just outside the clumpand hence induces a scale-dependent feedback. This mech-anism has been suggested to trigger the development ofspatial structure in salt marshes and even affect landscapeformation in this ecosystem (D’Alpaos et al. 2007; Tem-merman et al. 2007; van Wesenbeeck et al. 2008). Whetherit can explain the formation of regular, self-organized spa-tial patterns has remained unstudied.
In this study, we describe how redistribution of hydro-dynamic stress by diatoms can explain the formation ofregular patterns on intertidal mudflats. Here, elevated

E000 The American Naturalist
Figure 1: Photograph of a spatial diatom-sediment pattern taken at the intertidal flat on the Kapellebank, The Netherlands.
hummocks, covered with diatoms, alternate with water-filled hollows with few diatoms (fig. 1). Spatial patterningon muddy intertidal flats has been observed in a numberof studies (Blanchard et al. 2000; de Brouwer et al. 2000;Gouleau et al. 2000; Whitehouse et al. 2000; Lanuru et al.2007). They range from banded patterns aligned parallelto the flow direction (ridge-runnel systems) in areas wheretidal currents are high (Bassoullet et al. 2000; Blanchardet al. 2000; Le Hir et al. 2000; Whitehouse et al. 2000) toround-shaped patterns where water currents are lower (deBrouwer et al. 2000). The linear ridge-runnel patterns arepresent during all the seasons (Lanuru et al. 2007), whilethe round-shaped patterns are a seasonal phenomenon (deBrouwer et al. 2000). Here, a spatial pattern of elevatedhummocks alternating with water-filled hollows developsfrom a homogeneous mudflat in early spring and disap-pears again in summer (de Brouwer et al. 2000). On topof the hummocks, diatoms accumulate, forming a visiblebrown biofilm, which in turn is strengthened by the ex-cretion of extracellular polymeric substances (EPS; Neu-
mann et al. 1970). EPS inhibits erosion by increasing sed-iment cohesion and decreasing bottom roughness(Paterson 1989; Sutherland et al. 1998a, 1998b), resultingin increased sedimentation of fine-grained particles (deBrouwer et al. 2000; Montserrat et al. 2009), which sub-sequently stimulate growth of diatoms (van de Koppel etal. 2001). In the hollows, water accumulates during lowtide, which will inhibit the buildup of EPS, as EPS dissolvesin the overlying water (Blanchard et al. 2000; Paterson etal. 2000). This in turn leads to increased vulnerability toerosion during inundation and subsequently leads to ero-sion of diatoms and sediment. The interaction betweenaccumulation of sediment on the hummocks and drainageof water toward the hollows is hypothesized to generate ascale-dependent feedback of short-scale facilitation andlarger-scale inhibition of diatom growth and was put for-ward as a possible explanation for the observed spatialpatterning (Rietkerk and van de Koppel 2008). However,this putative stress divergence mechanism has been neitherstudied mathematically nor tested empirically. Confir-

Spatial Patterning on Intertidal Flats E000
mation of stress divergence as a mechanism for the for-mation of regular self-organized spatial patterns inecosystems would broaden the conceptual basis of scale-dependent feedback as a structuring process in ecologicalsystems.
Here, we investigated the hypothesis that pattern for-mation on intertidal mudflats results from spatial self-organization that is caused by scale-dependent feedbackbetween diatom growth, sediment dynamics, and waterdrainage processes. We developed a mathematical modelof this feedback interaction to study stress divergence asa mechanism for the observed spatial pattern and its effecton the functioning of intertidal flats ecosystems. Aerialphotographs were analyzed to establish the regularity ofspatial patterns observed in the field. Subsequently, weinvestigated whether diatom biomass and sediment char-acteristics varied between the hummocks and the hollowsto verify model assumptions and to exclude possible al-ternative mechanisms that could explain the observed spa-tial patterns. We furthermore tested in the field the model’sprediction that patterned tidal flats accumulate more sed-iment and are more productive than homogeneous flats.This would solidify the concept that self-organized patternformation affects ecosystem functioning.
A Simple Model of Pattern Formationon Intertidal Mudflats
Description
We developed a simple mathematical model to investigatewhether the proposed scale-dependent feedback betweendiatom growth, sediment dynamics, and water drainagecould result in regular spatial patterns on intertidal mud-flats (fig. 1). Observations in the field revealed that thepattern is aligned parallel to the primary drainage directionof the intertidal mudflat. We therefore modeled a one-dimensional cross section of the intertidal mudflat alignedperpendicular to the drainage direction. The patterns inthe field were dissected by larger drainage channels (app.B). We chose to ignore the large-scale drainage structure,since we were mostly interested in explaining the for-mation of patches. This simplifying approach allowed usto model small-scale pattern formation without explicitlytaking into account large-scale hydrodynamic processes.
We modeled changes in sediment elevation (S; cm), wa-ter level (W; cm), and diatom biomass (D; g chlorophylla m�2) as a function of the interaction between diatomgrowth, sediment dynamics, and water flow from the hum-mocks toward the hollows. Diatom growth is described asthe balance between growth and losses due to erosion bythe overlaying water:
�D D Wp rD 1 � � ECD . (1)( )�t k q � W
Here, growth of diatoms is described using the logisticgrowth equation, where r is the intrinsic growth rate ofthe diatoms and k is the diatom carrying capacity. Fur-thermore, E is the maximal sediment erosion rate in theabsence of diatoms, C translates sediment erosion to therate of diatom losses, and q is the water level at whichdiatom losses are half maximal. Diatom losses by otherprocesses—for example, grazing—are ignored since theseare fairly low during development of spatial patterns earlyin the season.
Changes in sediment level are determined by the balancebetween deposition and erosion of sediment particles fromthe overlying water during tidal submergence. Depositionof sediment occurs each high tide as a small amount ofsediment settles down from the water column. Erosiondepends on diatom biomass since diatoms decrease ero-sion through the exudation of EPS (Paterson 1989; Suth-erland et al. 1998a, 1998b):
2�S k � Dp � SEp S � E S � A , (2)in 2( )�t k �x
where Sin is the sediment deposition rate and pE is theextent to which sediment erosion is reduced when diatomsare at carrying capacity. In the last term in the equation,A represents the diffusion constant describing slow, grav-ity-induced dispersion of wet sediment from the hummockto the hollows to avoid the generation of steep hummockedges.
In our model, changes in water level are determined bythe residual amount of water left after each tide (Win), thewater drainage rate (F) in the direction perpendicular toour cross section, and the lateral flux of water:
�W � �(W � S)p W FWF � K(W )W . (3)in [ ]�t �x �x
Lateral water flow is modeled as a function of waterdepth and slope of the water surface ( ),�(S � W )/�xroughly following the Manning formula for open-channelflow, except for assuming a linear relation between waterflow and water surface slope. By doing this, we could avoidthe complexity of the shallow-water equations and main-tain a simple model. Hydraulic conductivity (K(W)) isassumed to be a decreasing function of the water level,reflecting the reduced water flow rate in very thin waterlayers:
E000 The American Naturalist
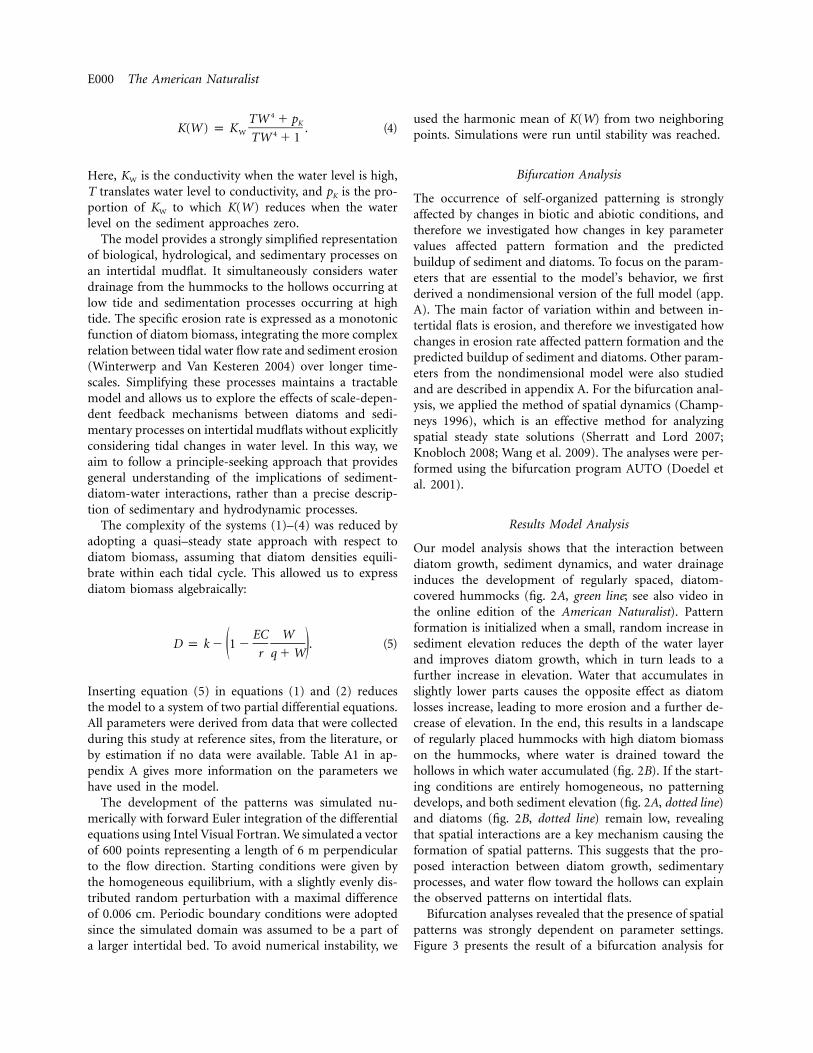
4TW � pKK(W ) p K . (4)W 4TW � 1
Here, KW is the conductivity when the water level is high,T translates water level to conductivity, and pK is the pro-portion of KW to which K(W) reduces when the waterlevel on the sediment approaches zero.
The model provides a strongly simplified representationof biological, hydrological, and sedimentary processes onan intertidal mudflat. It simultaneously considers waterdrainage from the hummocks to the hollows occurring atlow tide and sedimentation processes occurring at hightide. The specific erosion rate is expressed as a monotonicfunction of diatom biomass, integrating the more complexrelation between tidal water flow rate and sediment erosion(Winterwerp and Van Kesteren 2004) over longer time-scales. Simplifying these processes maintains a tractablemodel and allows us to explore the effects of scale-depen-dent feedback mechanisms between diatoms and sedi-mentary processes on intertidal mudflats without explicitlyconsidering tidal changes in water level. In this way, weaim to follow a principle-seeking approach that providesgeneral understanding of the implications of sediment-diatom-water interactions, rather than a precise descrip-tion of sedimentary and hydrodynamic processes.
The complexity of the systems (1)–(4) was reduced byadopting a quasi–steady state approach with respect todiatom biomass, assuming that diatom densities equili-brate within each tidal cycle. This allowed us to expressdiatom biomass algebraically:
EC WD p k � 1 � . (5)( )r q � W
Inserting equation (5) in equations (1) and (2) reducesthe model to a system of two partial differential equations.All parameters were derived from data that were collectedduring this study at reference sites, from the literature, orby estimation if no data were available. Table A1 in ap-pendix A gives more information on the parameters wehave used in the model.
The development of the patterns was simulated nu-merically with forward Euler integration of the differentialequations using Intel Visual Fortran. We simulated a vectorof 600 points representing a length of 6 m perpendicularto the flow direction. Starting conditions were given bythe homogeneous equilibrium, with a slightly evenly dis-tributed random perturbation with a maximal differenceof 0.006 cm. Periodic boundary conditions were adoptedsince the simulated domain was assumed to be a part ofa larger intertidal bed. To avoid numerical instability, we
used the harmonic mean of K(W) from two neighboringpoints. Simulations were run until stability was reached.
Bifurcation Analysis
The occurrence of self-organized patterning is stronglyaffected by changes in biotic and abiotic conditions, andtherefore we investigated how changes in key parametervalues affected pattern formation and the predictedbuildup of sediment and diatoms. To focus on the param-eters that are essential to the model’s behavior, we firstderived a nondimensional version of the full model (app.A). The main factor of variation within and between in-tertidal flats is erosion, and therefore we investigated howchanges in erosion rate affected pattern formation and thepredicted buildup of sediment and diatoms. Other param-eters from the nondimensional model were also studiedand are described in appendix A. For the bifurcation anal-ysis, we applied the method of spatial dynamics (Champ-neys 1996), which is an effective method for analyzingspatial steady state solutions (Sherratt and Lord 2007;Knobloch 2008; Wang et al. 2009). The analyses were per-formed using the bifurcation program AUTO (Doedel etal. 2001).
Results Model Analysis
Our model analysis shows that the interaction betweendiatom growth, sediment dynamics, and water drainageinduces the development of regularly spaced, diatom-covered hummocks (fig. 2A, green line; see also video inthe online edition of the American Naturalist). Patternformation is initialized when a small, random increase insediment elevation reduces the depth of the water layerand improves diatom growth, which in turn leads to afurther increase in elevation. Water that accumulates inslightly lower parts causes the opposite effect as diatomlosses increase, leading to more erosion and a further de-crease of elevation. In the end, this results in a landscapeof regularly placed hummocks with high diatom biomasson the hummocks, where water is drained toward thehollows in which water accumulated (fig. 2B). If the start-ing conditions are entirely homogeneous, no patterningdevelops, and both sediment elevation (fig. 2A, dotted line)and diatoms (fig. 2B, dotted line) remain low, revealingthat spatial interactions are a key mechanism causing theformation of spatial patterns. This suggests that the pro-posed interaction between diatom growth, sedimentaryprocesses, and water flow toward the hollows can explainthe observed patterns on intertidal flats.
Bifurcation analyses revealed that the presence of spatialpatterns was strongly dependent on parameter settings.Figure 3 presents the result of a bifurcation analysis for

Spatial Patterning on Intertidal Flats E000
Figure 2: Simulated spatial patterns of sediment (solid red line), water level (solid blue line), and diatom biomass (solid green line) and the simulatedhomogeneous equilibrium for sediment (dotted red line), water level (dotted blue line), and diatom biomass (dotted green line). Parameters used asin appendix B. This figure is also available as a model simulation (QuickTime video, 1.94 MB) simulating the emergence of spatial patterns fromsmall random differences in sediment bed level.
changes in the erosion rate E, which is the parameter thatmost clearly defines differences between intertidal habitats.In the homogeneous equilibrium, sediment level and di-atom biomass decrease linearly with increasing erosion rateuntil diatoms cannot maintain themselves on the intertidalmudflat. This homogeneous equilibrium is unstable tosmall heterogeneous perturbations when . Here,E 1 T2
small perturbations are inflated and cause the formationof regular spatial patterns (fig. 3, solid blue line). The pat-terned system is globally stable up to erosion rates of
. Within , the system has two attractingE p T T ! E ! LP1 1 1
states, where one state is characterized by spatial patterns(solid blue line; represents maximal algal biomass or sed-iment levels in the patterned solution), while the other isa homogeneous state with few diatoms (dashed black line).Beyond a last threshold, the patterned state becomes un-stable, and only a homogeneous state without diatoms isfound ( ; solid black line). The bifurcation analysesE 1 LP1
with respect to other parameters reveal qualitatively similarpatterns. Pattern formation was found to be most sensitiveto changes in the effects of diatoms on sediment erosion(app. A).
Our model allows us to investigate the implications of
spatial pattern formation on ecosystem functioning. Forall parameter values where stable patterns are predicted,average diatom biomass and sediment level are higher inthe patterned equilibrium compared with the homoge-neous equilibrium (fig. 3, green lines vs. black lines). Hence,in the patterned state, the intertidal mudflat is predictedto be more productive and accumulate more sedimentcompared with a homogeneous intertidal mudflat, re-vealing that spatial patterning has important emergent ef-fects on the functioning of intertidal mudflats that exceedbeyond simple generation of heterogeneity and empha-sizing the importance of diatom-induced spatial patternsfor productivity and sediment capture on intertidalmudflats.
Testing Model Assumptions and Predictions
Description and Field Site
We conducted a field study to test a number of the as-sumptions and predictions of the model described in “ASimple Model of Pattern Formation on Intertidal Mud-flats.” First, we investigated, using aerial photographs,

E000 The American Naturalist
whether the observed patterns were indeed regular, as pre-dicted by the model. Second, we investigated the differ-ences in chlorophyll a content (a proxy for diatom bio-mass), sediment erosion thresholds, and sedimentcharacteristics between the hummocks and the hollows.This was done to test the assumptions that underlie themodel and to exclude possible alternative mechanisms forthe observed spatial patterns. The model analysis identifiestwo important predictions: (1) self-organized patterns de-velop even in the absence of underlying environmentalheterogeneity and (2) both diatom biomass and sedimentaccumulation at the scale of the tidal flat ecosystem (e.g.,averaged over extensive areas) are higher in the patternedstate compared with the homogeneous mudflat state. Allexperiments and measurements were done on the Kapel-lebank, an intertidal mudflat situated along the edges ofthe Westerschelde, The Netherlands (coordinates:51.458521�N, 3.971685�E; fig. 1). Spatial patterns areabundant on approximately 75% of the total surface ofthe intertidal mudflat; they develop each year in springand disappear at the onset of summer when benthic her-bivore abundance increases.
Material and Methods
Pattern Observations
We analyzed aerial photographs of spatial patterns to testwhether the observed patterns are regular. Aerial photo-graphs were taken with a digital camera (Sony CybershotDSC-V3) attached to a helium-inflated, blimp-shaped bal-loon (http://www.floatograph.com), which was attachedto a tether line. Photographs were obtained from approx-imately 50 m height, covering an area of approximately
( ; app. B). Gen-50 m # 40 m 3,072 pixels # 2,304 pixelserally, two types of patterns were detected on the Kapelle-bank: banded elongated patterns aligned parallel to theflow direction at the sloping sides of the mudflat, and morerounded patterns on the top of the intertidal flat wherethe slope is less pronounced. From both pattern types, twosubsections of ( ) were300 pixels # 300 pixels 5 m # 5 mselected randomly for analysis, avoiding the larger drainagechannels. In the extracted images, dark areas correspondto high diatom concentrations, and light areas correspondto bare sediment (fig. 4A, 4D). Visual inspection showedthat the intensity of the blue channel within the RGBimages reflected diatom biomass most closely, and there-fore these pixel values were used for subsequent analysis.From the images, 3,000 pixels were sampled randomly,since the -pixel images were too large to be300 # 300analyzed entirely. We tested for the spatial autocorrelationby calculating Moran’s I using R (http://www.R-project.org). High positive autocorrelation corresponds to more
similar diatom biomass at a specific distance, while dis-similarity results in negative autocorrelation (Legendre andLegendre 1998). Since on the sloping sides patterns seemedaligned along the general direction of water drainage, weanalyzed the images in two directions: parallel and per-pendicular to the average direction of the flow, using cat-egories of 90�.
Underlying Heterogeneity
Our model predicts that self-organized patterns could de-velop in the near absence of underlying heterogeneity, forexample, even on flat sediment. We tested this hypothesisin the field by removing both underlying heterogeneityand benthic diatoms in -m plots, while spatial pat-2 # 2terns and diatoms remained untouched in the controlplots. We added two additional procedural control treat-ments. In the first, called diatom removal only, diatomswere scraped from the sediment. In the second, labeledhummock removal only, the sediment was flattened, andthe slurry of diatoms that was removed a priori was re-turned on the experimental plot. This block of four treat-ments was repeated 10 times following a randomized blockdesign (Sokal and Rohlf 1995). The degree of recovery wasdetermined after 14 days and expressed as the maximalelevation difference on the plot. A detailed description ofthis experiment is described in appendix B.
Testing for Model Assumptions
A crucial assumption for the proposed scale-dependentfeedback mechanism is that erosion rates are high in thewater-covered hollows compared with the emerged hum-mocks. In the field, we tested this assumption by deter-mining the differences in diatom biomass, sediment prop-erties, and the sensitivity of the sediment to erosionbetween the hummocks and the hollows. Therefore, chlo-rophyll a, silt content, and erosion threshold were mea-sured at hummocks and adjacent hollows. A detailed de-scription of these measurements is described in appendixA.
The mathematical model predicts higher sediment ac-cretion and diatom biomass for a self-organized patternedintertidal flat compared with a homogeneous intertidalflat. We tested these model predictions in the field bymeasuring sediment accretion in plots where spatial pat-terns were present and in plots where spatial patterns wereabsent. Sediment bed level measurements were done inApril 2009, when patterns were visible, and June 2009,when patterns had disappeared and the homogeneous bedlevel was stable, using the sediment erosion bar (SEB)method (Austen et al. 1999). We measured chlorophyll acontent in April in both the spatially patterned plots and

Spatial Patterning on Intertidal Flats E000
Figure 3: Bifurcation diagram of diatom biomass (A) and sediment accumulation (B) based on a single-peak solution. Black lines represent thehomogeneous equilibrium, blue lines represent maximum diatom biomass in the patterned equilibrium, and green lines represent average diatombiomass of the whole domain in the patterned equilibrium. Solid and dotted lines represent the stable and unstable equilibria, respectively. T1
( ) and T2 ( ) are Turing instability points, and LP1 ( ) is a limit point.E p 0.039 E p 0.012 E p 0.0505
the homogeneous plots. A detailed description of thesemeasurements is given in appendix A.
Statistical Analysis
Biotic and abiotic differences between hummocks and ad-jacent hollows were analyzed using Student’s paired t-tests(one-tailed). To further analyze the influence of silt andchlorophyll a content on the variability in the erosionthreshold for hummocks and hollows, we used a generallinear model (GLM) with landscape position (hummockor hollows) as a fixed factor and silt content and chlo-rophyll a content as covariates. Using stepwise reductionfrom the saturated model (Crawley 2005), all nonsignifi-cant factors could be removed, resulting in the best modelfor explaining differences in erosion threshold. Similarly,a GLM was used to analyze erosion threshold differencesas a function of physical characteristics. The influence ofspatial patterns on sediment accretion and chlorophyll acontent were analyzed using Student’s paired t-tests (one-tailed), testing the increase in elevation between April andJune. All statistics were computed using R (http://www.R-project.org).
Results
Pattern Observation Data and Measurements
Spatial analysis of the aerial photographs revealed regularspatial patterning in diatom reflectance that was strongestperpendicular to the tidal flow direction. Patterns closerto the shoreline showed significant positive autocorrelationup to 20-cm lag distance, followed by significant negativeautocorrelation from 20 to 80 cm (fig. 4C). This relationwas not repeated in the flow direction, where autocorre-lation was significantly positive up to 1.5-m distance (fig.4B), but no negative correlation was found at any distance.This confirms that bands of high diatom biomass wereregularly distributed in the direction perpendicular to theflow direction with a wavelength of roughly 1 m. Theround-shaped patterns on the top of the intertidal mudflatrevealed a similar relation (fig. 4E, 4F); these patterns werefound to be regular in the direction perpendicular to thetidal flow direction, but no significant negative autocor-relation was observed in the opposite direction (0�), in-dicating the absence of regularity in this direction. Hence,we found regular patterning on both the sloping sides andthe more flat top of the intertidal mudflat, mainly ori-entated perpendicular to the general direction of waterdrainage.

E000 The American Naturalist
Figure 4: Autocorrelation (Moran’s I) for benthic diatom patterns with their 95% confidence intervals (gray lines). Pictures represent a -m5 # 5surface generated by two directional analyses, indicated by an arrow in the top right-hand corner. Two different patterns were chosen for thisanalysis: a banded pattern (A) and a more round-shaped pattern (D). Two directions correspond to 0� (B, E), which are parallel with the waterline, and two correspond to 90� (C, F), perpendicular to the water line.
Analysis of the field measurements revealed that, inagreement with our hypothesis, higher chlorophyll a con-tent ( ; fig. 5A) and higher erosion thresholdsP ! .01( ; fig. 5B) were found on the hummocks comparedP ! .001with in the hollows. No significant differences in silt con-tent were found (mean � SEM: hummocks, 59.4% �
, ; hollows, , ), indicat-2.3% P 1 .05 57.5% � 2.9% P p .05ing that variation in silt content was not the most im-portant factor in determining the patchiness. Differencesin chlorophyll a concentration and erosion threshold wereto a large part explained by position on either hummocksor hollows. The GLM analysis revealed a model in whichthe factor landscape (e.g., in a hollow or on a hummock)gave the best fit (on the basis of Akaike information cri-teria) to measured erosion thresholds compared with mod-els that included chlorophyll a and silt content and theirinteraction. Stepwise reduction from the saturated model(Crawley 2005), removing any nonsignificant factors, re-sulted in a model with only landscape position as theexplanatory variable ( ). This is probably causedP ! .001by a strong correlation between landscape position andchlorophyll a content, combined with limited variability
of chlorophyll a content within either the hollows or thehummocks.
We found a strong effect of spatial patterns on sedimentaccretion during the spring season. Sediment bed level inpatterned plots increased by cm (mean �2.02 � 0.31SEM), which is significantly higher than in homogeneousplots, which increased by cm ( ; fig. 6).0.71 � 0.76 P ! .05Likewise, chlorophyll a was significantly higher in spatiallypatterned plots compared with homogeneous plots( and mg g�1; ; fig. 6).135.61 � 2.04 81.38 � 10.74 P ! .01Hence, these results support the prediction of our math-ematical model that self-organized spatial patterns increasethe overall sedimentation rate and diatom biomass.
Testing for Spatial Self-Organization
Experimental removal of heterogeneity did not affect theformation of hummock and hollows in the experimentalplots. Two weeks after treatment application, no differ-ences were found in bed level between control plots( cm), treatment plots with hummock and di-3.12 � 0.48atom removal ( cm), or procedural controls2.50 � 0.29

Spatial Patterning on Intertidal Flats E000
Figure 5: Differences in diatom biomass (A) and sediment stability (B)on the hummocks (gray bars) and hollows (white bars); , error barsn p 7denote �1 SEM.
(diatom removal only: cm; hummock removal2.82 � 0.31only: cm; fig. B2A in app. A; ). Sim-2.58 � 0.38 P 1 .05ilarly, no differences in chlorophyll a content were mea-sured on hummocks between the control plots (130.8 �
mg g�1), treatment plots with hummock and diatom10.8removal ( mg g�1), and procedural controls131.4 � 13.81(diatom removal only: mg g�1; hummock127.26 � 11.3removal only: mg g�1). Similarly, no differ-136.3 � 13.8ences in chlorophyll a content were found in the hollows(control plots: mg g�1; treatment plots:51.7 � 9.7
mg g�1) and procedural controls (diatom re-40.8 � 8.0moval only: mg g�1; hummock removal only:44.3 � 4.32
mg g�1; fig. B2B; ). This, in combination48.2 � 7.29 P 1 .05with the seasonal disappearance of patterning that wasobserved each year, makes it unlikely that underlying het-erogeneity is a possible alternative mechanism for the for-mation of self-organized spatial patterns on intertidal flats.
Our results indicate that sediment consolidation, a pos-sible alternative abiotic mechanism for pattern formation,did not differ between the hummocks and hollows. Nodifferences were found for bulk density ( kg1.21 � 0.10m�3 in hummocks vs. kg m�3 in hollows;1.13 � 0.07
). Similarly, no differences in water content wereP 1 .05found between hummocks and hollows, as both showed
water content. A GLM analysis, which in-50% � 3%cluded sediment consolidation variables as independentfactors to explain differences in erosion threshold, iden-tified that landscape position (e.g., hummock or hollow)was the main explanatory variable for the variation inerosion rate. Adding other factors such as bulk densityand water content did not improve the explanatory powerof the model.
Discussion
The formation of regular, self-organized spatial patternshas mainly been described in communities driven by re-source limitation, where spatial redistribution of resourcessuch as water or phosphate is the driving factor behindspatial self-organization (Rietkerk and van de Koppel2008). This study presents an alternative mechanism forthe formation of regular patterns: divergence of physicalstress by organisms, creating local positive feedback butnegative feedback at larger spatial scales. On intertidalmudflats, interactions between diatom growth and geo-morphological processes locally improve living conditionsfor diatoms by increasing the elevation of diatom-coveredhummocks. Consequently, increased elevation causes thehollows between hummocks to remain inundated at lowwater, decreasing diatom cover due to higher vulnerabilityto erosion and generating a scale-dependent feedback.Model analysis showed that this divergence of hydrody-namic stress induces a regular, self-organized spatial pat-tern on intertidal mudflats, resulting in a landscape ofregularly spaced hummocks and hollows. Field measure-ments revealed a clear difference in both diatom biomassand erosion threshold between the hollows and the hum-mocks. This is in line with studies on other intertidalmudflats where regular patterning occurs (de Brouwer etal. 2000; Paterson et al. 2000; Lanuru et al. 2007). Fur-thermore, our model analyses as well as our experimentalresults reveal that self-organized patterns increased diatomdensities and sediment capture, thereby increasing averageelevation by about 2 cm. Hence, spatial pattern formationinduced by stress divergence significantly affects the func-tioning of intertidal mudflat ecosystems.
Stress divergence mechanisms have been proposed inother studies to induce spatial structure in ecosystems(Hiemstra et al. 2002; Larsen et al. 2007; Saco et al. 2007;Temmerman et al. 2007; van Wesenbeeck et al. 2008). In

E000 The American Naturalist
Figure 6: Diatom biomass (A) and sediment accretion (B) for the pat-terned stations (gray bars) and homogeneous stations (white bars). Di-atom biomass is expressed as average chlorophyll a content, and sedimentaccretion is expressed as the difference in bed level between April andJune; , error bars denote �1 SEM.n p 3
salt marsh ecosystems, tussocks of Spartina anglica im-prove growth conditions within the tussocks as a result ofincreased sedimentation but strongly decrease growth po-tential outside of the tussock. This mechanism induces theformation of creeks during salt marsh development (Tem-merman et al. 2007). Stress divergence can be inferredfrom other studies in patterned ecosystems, such as duringthe formation of parallel tree lines in the Rocky Mountains(Hiemstra et al. 2006) or ridge and sloughs landscapes inthe Everglades (Larsen et al. 2007). These studies, com-bined with ours, show that stress divergence might be awidely occurring mechanism causing spatial self-organi-zation in ecosystems, broadening the application of spatialself-organization to a wider range of ecosystems.
Testing for Alternative Mechanisms
Our hypothesis that diatom-sediment interactions couldexplain the formation of the regular landscape of hum-mocks and hollows was tested against potential alternativemechanisms that could lead to spatial pattern formation.Possible alternative mechanisms include (1) underlyingspatial heterogeneity, (2) increased sediment consolidationreducing sediment erosion on the hummocks, and (3)mechanical disturbance by water rushing through the hol-lows before submergence of the hummocks; these are allpossible physical causes of patterning. We tested the effectsof underlying heterogeneity by removing both diatoms andelevational differences in experimental plots. After 2 weeks,both diatom patterning and hummock development reap-peared in these plots and were statistically indistinguish-able from the control plots. This suggests that the patterns,at least in our experimental plots, are not the result ofunderlying heterogeneity. We did not observe differencesin sediment bulk density or water content between thehummocks and the hollows, typical characteristics of con-solidation. These results indicate that consolidation couldnot explain the observed differences in the sediment ero-sion threshold, and the diatom-sediment interactions area more likely cause of the observed spatial patterns. Finally,two lines of reasoning point out that increased mechanicaldisturbance by water flow alone cannot explain the ob-served patterns. First, mechanical disturbance would leadto increased erosion in any low location and hence cannotexplain the observed regularity. Second, water velocity hasbeen found to be higher on hummocks compared withhollows (Williams et al. 2008), which would result inhigher erosion on hummocks, which is opposite of whatwe found. This leads us to conclude that mechanical dis-turbance alone is an unlikely mechanism for the observedspatial patterns.
The importance of diatoms in stabilizing the sedimenthas been well established in the literature (Stal 2009),which also includes studies on spatially patterned intertidalflats (Paterson et al. 2000; Lanuru et al. 2007). Removalof benthic algae using biocide can result in extensive sed-iment erosion, affecting landscape formation (de Boer1981; Underwood and Paterson 1993). These studies, incombination with other studies, point at the importanceof diatom-sediment feedbacks in generating landscape het-erogeneity (van de Koppel et al. 2001; Montserrat et al.2008). Our own experiments suggest that stress divergence,caused by a local positive feedback between diatom growthand sediment accumulation, is the most likely cause of theobserved regular patterns.

Spatial Patterning on Intertidal Flats E000
Biogeomorphological Feedback and Ecosystem Functioning
Our study reveals a clear effect of self-organized patternson the functioning of intertidal mudflat ecosystems, sinceboth the model and field data showed that patterned in-tertidal mudflats have significantly higher diatom densitiesand accumulation of sediment (fig. 6). The effect of thisincrease in diatom densities on overall intertidal mudflatproductivity has hardly been investigated. Intertidal mud-flats account for up to 50% of the primary production inestuaries (Underwood et al. 1999) and are therefore animportant component of estuarine ecosystems. Increasedbenthic diatom biomass will significantly influence foodavailability, since diatoms are a major food source for ben-thic macrofauna (Herman et al. 2000; van Oevelen et al.2006) and for the planktonic food web (de Jonge and vanBeusekom 1992). Therefore, both benthic and planktonicfaunal biomass is expected to increase with the presenceof patterned intertidal mudflats within estuaries.
Our model analysis predicts increased sediment accu-mulation in self-organized intertidal mudflats. Althoughcurrent models describing the morphology of intertidalmudflats have incorporated the effects of seasonal changesin diatom abundance on sediment surface texture (Paarl-berg et al. 2005; Le Hir et al. 2007; Borsje et al. 2008),they lack the effects of self-organization induced bydiatom-sediment feedbacks. Moreover, the increase in bedlevel can have important effects on water turbidity in theestuary on scales that far exceed that of a single intertidalmudflat. A back-of-the-envelope calculation reveals that 2cm m�2 of diatom-induced accumulation of silt on anintertidal mudflat is roughly equivalent to the silt contentof about 40 m2 of open water (assuming an average depthof 10 m in the estuary; Herman et al. 2001). Similarly,benthic diatoms capture, although to a lesser extent, or-ganic particulates from the water column, which can havea substantial effect on the particulate organic matter con-centration within estuarine waters (Herman et al. 2001;Staats et al. 2001). In this way, self-organized spatial pat-terns not only locally affect the functioning of intertidalmudflats but also affect pelagic processes at the estuarinescale.
The bifurcation analysis uncovers two interesting pos-sible implications of self-organization on patterned inter-tidal mudflats: the occurrence of alternative stable statesand the vulnerability to catastrophic shifts. These impli-cations limit our ability to predict how intertidal flats willrespond to changes in forcing factors, such as increasedflow rates, with respect to both sedimentary dynamics andtheir biological communities (van de Koppel et al. 2001).It is known that self-organized patterns may indicate thepresence of alternative stable states and, as a consequence,a potential for catastrophic shifts, since both phenomena
are, in part, the result of similar positive feedbacks (Schef-fer and Carpenter 2003; Rietkerk et al. 2004b). On inter-tidal mudflats, this may result in sudden changes in diatombiomass and subsequent release of fine-grained sedimentin response to gradually changing hydrodynamic condi-tions, which often are difficult to reverse. Addressing suchnonlinear dynamics in estuarine systems will be an im-portant future challenge in the study of biogeomorphologyto provide more accurate predictions for management andconservation policies.
Our study emphasizes the need to integrate the fieldsof ecology and geomorphology to come to a general theoryof the processes that underlie the formation of naturallandscapes. So far, both fields have developed separatebodies of theory (Stallins 2006). Ecology has focused onthe concept of spatial self-organization to explain patternformation of vegetation and other organisms in homo-geneous, flat landscapes (Rietkerk and van de Koppel2008). Geomorphologists often use a static or linear de-scription of the relation between organisms and physicalprocesses to understand landscape formation, although theeffects of vegetation on hydrodynamic and morphologicalprocesses are increasingly considered (Le Hir et al. 2000;Paarlberg et al. 2005; Hiemstra et al. 2006; Larsen et al.2007; Saco et al. 2007; Temmerman et al. 2007; Borsje etal. 2008; van Wesenbeeck et al. 2008). Mudflat ecosystemsprovide a unique window on how integration of both fieldscan lead to detailed understanding of the importance ofbiogeomorphological interactions and the resulting spatialself-organization on the formation of natural landscapes.
Acknowledgments
We would like to thank J. Sherratt for help on the modelanalysis and K. den Hartogh for help in the field. We arealso grateful to M. Rietkerk, B. R. Silliman, L. Stal, S.Temmerman, M. Vos, and two anonymous reviewers forvaluable comments on earlier versions of this manuscript.
APPENDIX A
Model Parameters, Analysis, andTesting Model Assumptions
We present a table of the symbols, interpretation, units,values, and sources used in the model (table A1). Fur-thermore, we present the results of a detailed bifurcationanalysis of equations (1)–(5) (“Model Analysis”) to focuson the parameters that are essential to the model’s be-havior. We also present the detailed methods of the fieldmeasurements that were used for testing the model as-sumptions (“Testing for Model Assumptions”).

E000 The American Naturalist
Table A1: Symbols, interpretation, units, values, and sources used in the model
Symbol Interpretation Unit Value Source
Sin Sediment input cm tide�1 .2 Woods and Widdows 2002E Maximal erosion rate tide�1 .03 EstimatedpE Proportion of algae that erode … .90 Estimatedk Carrying capacity of diatoms g m�2 1 E. J. Weerman, unpublished dataC Maximum algal erosion tide�1 15 Estimatedr Intrinsic growth rate diatoms tide�1 .4 Morris 2005A Diffusion factor lateral sediment transport cm2 t�1 5 Estimatedq Half-saturation constant diatoms cm .6 EstimatedF Drainage factor tide�1 .2 EstimatedHin Water level left each tide cm tide�1 .2 EstimatedKW Conductivity when water level is high cm t�1 10 EstimatedpK Proportion of KW … .1 EstimatedT Translates water level to conductivity … 200 Estimated
Model Analysis
Here, we present the results of a detailed bifurcation anal-ysis of equations (1)–(5). To focus on the parameters thatare essential to the model’s behavior, we first derived anondimensional model from the full model described inequations (1)–(3):
dd qp d(1 � d) � �dC , (A1)
dt g � q
2dd � jp 1 � �(1 � p d)j � , (A2)E 2dt �w
�q d � S inp 1 � qf � K(q)q q � j . (A3)[ ( )]�t dw �w H in
Here , , and . The spa-�1 �1 �1d p Dk j p rSS q p rWHin in
tial dimension is rescaled to , and time1/2 �1/2 �1/2w p r A Xis rescaled to the intrinsic growth rate of the diatoms( ). The model has seven rescaled parameters:t p r � p
, , , ,�1 �1 �1 �1 �1Er g p qrH f p Fr k p K(W )H A r h pin in
, , and . From this nondimensional�1S H L p C r p pin in E
model, we have selected four parameters that were mostdirectly related to habitat characteristics; for example, theywould vary in space on tidal flats. These parameters wereerosion rate (�), the water level at which diatom losses ishalf maximal (g), drainage factor (f), and r, which de-scribes to what extent sediment erosion is reduced whendiatoms are in carrying capacity. For these four parame-ters, we conducted a bifurcation analysis using the bifur-cation program AUTO (Doedel et al. 2001). We appliedthe method of spatial dynamics (Champneys 1996), whichis an effective method in analyzing spatial steady statesolutions (Sherratt and Lord 2007; Knobloch 2008; Wanget al. 2009). The bifurcation analysis shows that spatialpatterns occur for a wide range of parameter values of theerosion rate E and drainage rate F (fig. A1, gray area).
Pattern formation was found to be particularly sensitiveto changes in the effects of diatoms on sediment erosion;pattern formation was observed only when pE was largerthan 0.5.
Testing for Model Assumptions
Here, we present the detailed methods of the field mea-surements that were used for testing the model assump-tions. A crucial assumption for the model is that erosionrates are high in the water-covered hollows compared withthe emerged hummocks. We tested this assumption bydetermining the differences in diatom biomass, sedimentproperties, and the sensitivity of the sediment to erosionbetween the hummocks and the hollows.
Material and Methods. Chlorophyll a content in the toplayer of the sediment was used as a measure of diatombiomass, which is the main determinant of the EPS contentin the sediment (Paterson et al. 2000) and was measuredaccording to Jeffrey and Humphrey (1975). In April 2007,samples were taken in hollows and on adjacent hummocksduring low tide. Surface sediment samples (top 2 mm,inner diameter 36 mm) were taken for chlorophyll a con-tent using a cut-off syringe, and the samples were kept onice during the fieldwork. Pigment extraction was done byadding 10 mL 90% acetone to extract the chlorophyll acontent, after which this was analyzed using high perfor-mance liquid chromatography of the supernatant. Next tothe chlorophyll a samples, sediment samples (top 10 mm,diameter 36 mm) for grain size and bulk density analysiswere taken using a cut-off syringe. All samples were re-peated sevenfold and were kept on ice during the field-work. In the laboratory, samples were weighed wet, freeze-dried, and weighed again. After this, the silt and claycontent was determined as the fraction of the sedimentthat is smaller than 63 mm using laser diffraction (Malvern

Spatial Patterning on Intertidal Flats E000
Figure A1: Bifurcation diagram of the sensitivity for changes in erosion rate and drainage factor on spatial patterns (A) and diatom sensitivity anddiatom erosion on spatial patterns (B). Gray areas correspond to parameter values where spatial patterns are present, and white areas correspondto parameter values where spatial patterns are absent.
Particle Sizer 2000). We refer to this fraction as silt contentin the rest of the article. Differences in sediment shearstrength were quantified by using a cohesive strengthmeter, which provides a measure of the surface normalshear stress threshold beyond which sediment starts toerode, which we refer to as eroding threshold (Tolhurst etal. 1999, 2000). The eroding pressure values measured inthis study should not be confused with horizontal bottomshear stress values reported in other studies. The methodsthat are in use express the eroding threshold in the sameunits (kPa) but differ in the way the pressure is imposedon the sediment and hence can lead to an order of mag-nitude difference in threshold values (Tolhurst et al. 1999).
The mathematical model predicts higher sediment ac-
cretion and diatom biomass for a self-organized patternedintertidal flat compared with a homogeneous intertidalflat. We tested these model predictions in the field wheresediment accumulation was determined as the differencein bed level between April 2009, when patterns were vis-ible, and June 2009, when the patterns had disappeared.The sediment bed level differences were compared betweenplots exhibiting spatial patterns ( ) and plots lackingn p 3clear spatial patterning ( ); both were present on then p 3Kapellebank, The Netherlands. Bed level measurementswere carried out using the sediment erosion bar method,adapted from Austen et al. (1999), where two metal polesof 200 cm length were pushed into the sediment at adistance of 1.5 m away from each other. During the mea-
E000 The American Naturalist
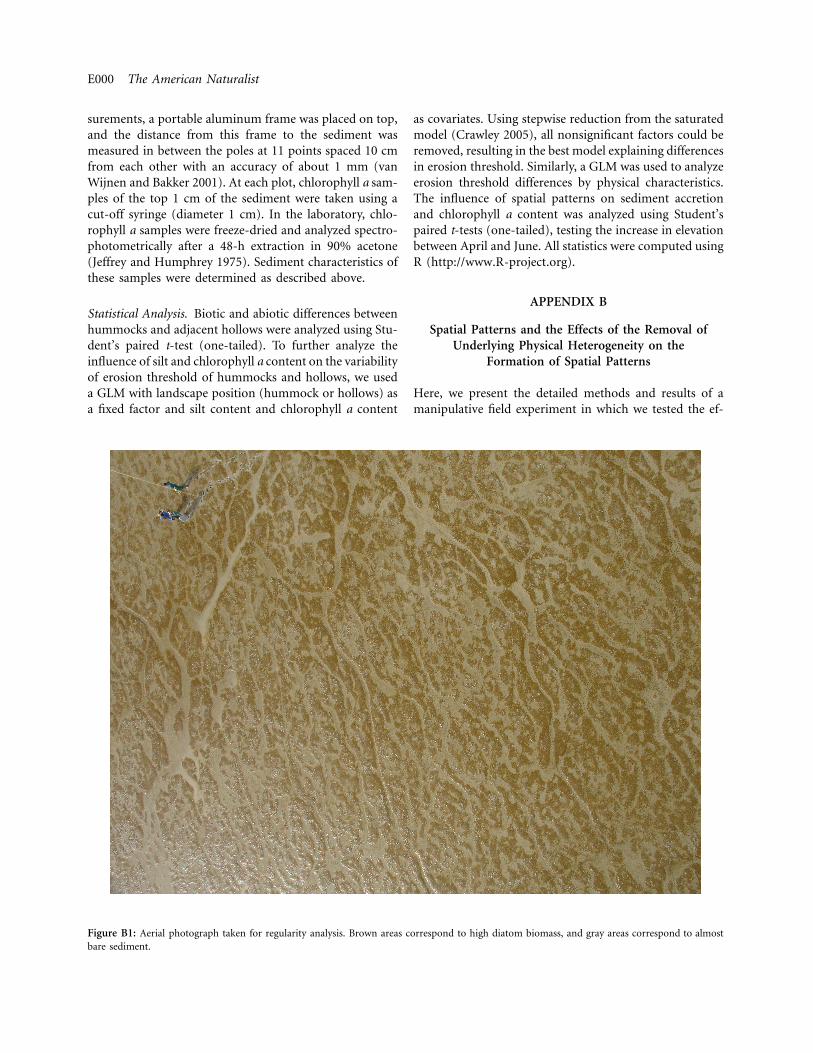
Figure B1: Aerial photograph taken for regularity analysis. Brown areas correspond to high diatom biomass, and gray areas correspond to almostbare sediment.
surements, a portable aluminum frame was placed on top,and the distance from this frame to the sediment wasmeasured in between the poles at 11 points spaced 10 cmfrom each other with an accuracy of about 1 mm (vanWijnen and Bakker 2001). At each plot, chlorophyll a sam-ples of the top 1 cm of the sediment were taken using acut-off syringe (diameter 1 cm). In the laboratory, chlo-rophyll a samples were freeze-dried and analyzed spectro-photometrically after a 48-h extraction in 90% acetone(Jeffrey and Humphrey 1975). Sediment characteristics ofthese samples were determined as described above.
Statistical Analysis. Biotic and abiotic differences betweenhummocks and adjacent hollows were analyzed using Stu-dent’s paired t-test (one-tailed). To further analyze theinfluence of silt and chlorophyll a content on the variabilityof erosion threshold of hummocks and hollows, we useda GLM with landscape position (hummock or hollows) asa fixed factor and silt content and chlorophyll a content
as covariates. Using stepwise reduction from the saturatedmodel (Crawley 2005), all nonsignificant factors could beremoved, resulting in the best model explaining differencesin erosion threshold. Similarly, a GLM was used to analyzeerosion threshold differences by physical characteristics.The influence of spatial patterns on sediment accretionand chlorophyll a content was analyzed using Student’spaired t-tests (one-tailed), testing the increase in elevationbetween April and June. All statistics were computed usingR (http://www.R-project.org).
APPENDIX B
Spatial Patterns and the Effects of the Removal ofUnderlying Physical Heterogeneity on the
Formation of Spatial Patterns
Here, we present the detailed methods and results of amanipulative field experiment in which we tested the ef-

Spatial Patterning on Intertidal Flats E000
Figure B2: Bed level differences (A) and chlorophyll a content (B) of the different treatments after 14 days of treatment application. Gray bars inB represent hummocks, and white bars represent hollows ( , standard bars denote SEM).n p 10
fects of removal of underlying heterogeneity on spatialpattern development.
Photograph Taken for Analysis of Spatial Patterns
Figure B1 is an example of an aerial photograph that wasused for the regularity analysis (fig. 4). The photographwas taken from a blimp at about 50 m height; brown areascorrespond to high diatom biomass patches, and gray col-ors correspond to almost bare sediment patches.
The Effects of the Removal of Underlying PhysicalHeterogeneity on the Formation of Spatial Patterns
To test the prediction that self-organized patterns coulddevelop in the absence of underlying heterogeneity—forexample, even on flat sediment—we removed variation insediment elevation and diatom biomass.
Methods. On the Kapellebank tidal flat, we located 20 plotsof in sets of four. We collected the diatoms2 m # 2 mfrom the sediment surface using floor sweepers. The toplayer of the sediment was then leveled, again using floorsweepers. The recovery of diatom biomass and patchinesswithin a 2-week period was compared with a control plot,where natural patterning was kept intact. To account fordifferential effects of diatom removal and sediment lev-eling, we added two procedural control treatments. In thefirst procedural control treatment, we removed only the
diatoms. In the second, we initially removed diatoms, afterwhich the sediment was leveled and diatoms were smearedback on top of the leveled sediment. All treatments weregrouped and replicated five times over the entire intertidalflat following a randomized block design (Sokal and Rohlf1995). We measured average diatom biomass and bed leveldifferences after 14 days of treatment application. To ac-count for changes in time, we replicated this whole ex-periment two times within a month. Repeated measure-ments during the experiment were not possible sinceentering the plots would disturb the buildup of the spatialstructure. At each plot, chlorophyll a samples of the top1 cm of the sediment were taken using a cut-off syringe(diameter 1 cm). In the laboratory, chlorophyll a sampleswere freeze-dried and analyzed spectrophotometrically af-ter 48-h extraction in 90% acetone (Jeffrey and Humphrey1975). Bed level differences were measured using a whiteboard (0.85 m # 0.50 m) on which a grid was drawn thatwas placed vertically into the sediment in such a way thata hummock and a hollow were included in the pictures.Digital photographs of the grid board (about 2,560 pixels# 1,920 pixels) were geocorrected using Leica image pro-cessing software, following the procedure by van der Walet al. (2005). Hummock development at each location wasexpressed as the difference between maximum and min-imum bed level.
Statistical Analysis. The effect of the removal of underlyingheterogeneity was determined using a univariate analysis

E000 The American Naturalist
with treatment and sample date as fixed factors and blockas a covariate. Normal distribution of the data was checkedby visual inspection of Q-Q plots, and Levene’s test wasused for testing homogeneity of variances.
Results. Treatment application was successful, since after1 day patterns were still lacking on plots where patternswere removed (fig. B2A). Time and block did not have asignificant effect on chlorophyll a content or bed leveldifferences (ANOVA, ). Therefore, all the data fromP ! .05different dates and blocks were pooled and analyzed fortreatments effects 14 days after the treatment application.We found that for all treatments, the patterns had fullyrecovered. No differences were found in bed level betweenthe control plots ( cm), treatment plots3.12 � 0.34( cm), and procedural controls (diatom re-2.50 � 0.26moval only: cm; hummock removal only:2.82 � 0.28
cm; fig. B2A; ). Similarly, no differ-2.58 � 0.34 P 1 .05ences in chlorophyll a content were measured on hum-mocks between the control plots ( mg g�1),133.1 � 37.5treatment plots ( mg g�1), and procedural con-133.1 � 37.5trols (diatom removal: mg g�1; hummock re-124.6 � 40.5moval: mg g�1) or in the hollows (control133.1 � 37.5plots: mg g�1; treatment plots: 38.0 � 17.1 mg55.8 � 19.3g�1) and procedural controls (diatom removal: 46.6 �
mg g�1; hummock removal: mg g�1; fig.18.6 45.9 � 11.6B2A; ).P ! .05
Literature Cited Only in Appendixes A and B
Jeffrey, S. W., and G. F. Humphrey. 1975. New spectrophotometricequations for determining chlorophylls a, b, c1 and c2 in higherplants, algae and natural phytoplankton. Biochemie und Physiol-ogie der Pflanzen 167:191–194.
Morris, E. P. 2005. Quantifying primary production of microphy-tobenthos: application of optical methods. PhD thesis. Universityof Groningen.
Tolhurst, T. J., K. S. Black, S. A. Shayler, S. Mather, I. Black, K. Baker,and D. M. Paterson. 1999. Measuring the in situ erosion shearstress of intertidal sediments with the cohesive strength meter(CSM). Estuarine, Coastal, and Shelf Science 49:281–294.
Tolhurst, T. J., K. S. Black, D. M. Paterson, H. J. Mitchener, G. R.Termaat, and S. A. Shayler. 2000. A comparison and measurementstandardization of four in situ devices for determining the erosionshear stress of intertidal sediments. Continental Shelf Research 20:1397–1418.
van der Wal, D., P. M. J. Herman, and A. Wielemaker-van den Dool.2005. Characterisation of surface roughness and sediment textureof intertidal flats using ERS SAR imagery. Remote Sensing of En-vironment 98:96–109.
van Wijnen, H. J., and J. P. Bakker. 2001. Long-term surface elevationchange in salt marshes: a prediction of marsh response to futuresea-level rise. Estuarine, Coastal, and Shelf Science 52:381–390.
Wood, R., and J. Widdows. 2002. A model of sediment transportover an intertidal transect, comparing the influences of biologicaland physical factors. Limnology and Oceanography 47:848–855.
Literature Cited
Austen, I., T. J. Andersen, and K. Edelvang. 1999. The influence ofbenthic diatoms and invertebrates on the erodibility of an inter-tidal mudflat, the Danish Wadden Sea. Estuarine, Coastal, andShelf Science 49:99–111.
Bassoullet, P., P. Le Hir, D. Gouleau, and S. Robert. 2000. Sedimenttransport over an intertidal mudflat: field investigations and es-timation of fluxes within the “Baie de Marennes-Oleron” (France).Continental Shelf Research 20:1635–1653.
Blanchard, G. F., D. M. Paterson, L. J. Stal, P. Richard, R. Galois, V.Huet, J. Kelly, et al. 2000. The effect of geomorphological structureson potential biostabilisation by microphytobenthos on intertidalmudflats. Continental Shelf Research 20:1243–1256.
Borsje, B. W., M. B. de Vries, S. Huscher, and G. J. de Boer. 2008.Modeling large-scale cohesive sediment transport affected bysmall-scale biological activity. Estuarine, Coastal, and Shelf Science78:468–480.
Champneys, A. R. 1996. Homoclinic orbits in reversible systems andtheir applications in mechanics, fluids and optics. Physica D 112:158–186.
Couteron, P., and O. Lejeune. 2001. Periodic spotted patterns in semi-arid vegetation explained by a propagation-inhibition model. Jour-nal of Ecology 89:616–628.
Crawley, M. J. 2005. The R book. Wiley, Chichester.D’Alpaos, A., S. Lanzoni, M. Marani, and A. Rinaldo. 2007. Land-
scape evolution in tidal embayments: modeling the interplay oferosion, sedimentation, and vegetation dynamics. Journal of Geo-physical Research 112:F01008.
de Boer, P. L. 1981. Mechanical effects of micro-organisms on in-tertidal bedform migration. Sedimentology 28:129–132.
de Brouwer, J. F. C., S. Bjelic, E. de Deckere, and L. J. Stal. 2000.Interplay between biology and sedimentology in a mudflat (Bie-zelingse Ham, Westerschelde, The Netherlands). Continental ShelfResearch 20:1159–1177.
de Jonge, V. N., and J. E. E. van Beusekom. 1992. Contribution ofresuspended microphytobenthos to total phytoplankton in theEMS estuary and its possible role for grazers. Netherlands Journalof Sea Research 30:91–105.
Doedel, E. J., R. C. Paffenroth, A. Champneys, T. F. Fairgrieve, Y. A.Kuznetsov, B. E. Oldman, B. Sandstede, and X. Wang. 2001. AUTO2000: continuation and bifurcation software for ordinary differ-ential equations (with HOMCONT). Technical report. ConcordiaUniversity, Montreal. http://indy.cs.concordia.ca/auto/.
Eppinga, M. B., M. Rietkerk, W. Borren, E. D. Lapshina, W. Bleuten,and M. J. Wassen. 2008. Regular surface patterning of peatlands:confronting theory with field data. Ecosystems 11:520–536.
Gouleau, D., J. M. Jouanneau, O. Weber, and P. G. Sauriau. 2000.Short- and long-term sedimentation on Montportail-Brouage in-tertidal mudflat, Marennes-Oleron Bay (France). Continental ShelfResearch 20:1513–1530.
Herman, P. M. J., J. J. Middelburg, J. Widdows, C. H. Lucas, and C.H. R. Heip. 2000. Stable isotopes’ as trophic tracers: combiningfield sampling and manipulative labelling of food resources formacrobenthos. Marine Ecology Progress Series 204:79–92.
Herman, P. M. J., J. J. Middelburg, and C. H. R. Heip. 2001. Benthiccommunity structure and sediment processes on an intertidal flat:results from the ECOFLAT project. Continental Shelf Research 21:2055–2071.
Hiemstra, C. A., G. E. Liston, and W. A. Reiners. 2002. Snow re-

Spatial Patterning on Intertidal Flats E000
distribution by wind and interactions with vegetation at uppertreeline in the Medicine Bow Mountains, Wyoming, USA. Arctic,Antarctic, and Alpine Research 34:262–273.
———. 2006. Observing, modelling, and validating snow redistri-bution by wind in a Wyoming upper treeline landscape. EcologicalModelling 197:35–51.
Knobloch, E. 2008. Spatially localized structures in dissipative sys-tems: open problems. Nonlinearity 21:T45–T60.
Lanuru, M., R. Riethmuller, C. van Bernem, and K. Heymann. 2007.The effect of bedforms (crest and trough systems) on sedimenterodibility on a back-barrier tidal flat of the East Frisian WaddenSea, Germany. Estuarine, Coastal, and Shelf Science 72:603–614.
Larsen, L. G., J. W. Harvey, and J. P. Crimaldi. 2007. A delicatebalance: ecohydrological feedbacks governing landscape mor-phology in a lotic peatland. Ecological Monographs 77:591–614.
Legendre, P., and L. Legendre. 1998. Numerical ecology. 2nd ed.Elsevier Science, Amsterdam.
Le Hir, P., W. Roberts, O. Cazaillet, M. Christie, P. Bassoullet, andC. Bacher. 2000. Characterization of intertidal flat hydrodynamics.Continental Shelf Research 20:1433–1459.
Le Hir, P., Y. Monbet, and F. Orvain. 2007. Sediment erodability insediment transport modelling: can we account for biota effects?Continental Shelf Research 27:1116–1142.
Levin, S. A., and L. A. Segel. 1985. Pattern generation in space andaspect. SIAM Review 27:45–67.
Montserrat, F., C. Van Colen, S. Degraer, T. Ysebaert, and P. M. J.Herman. 2008. Benthic community-mediated sediment dynamics.Marine Ecology Progress Series 372:43–59.
Montserrat, F., C. Van Colen, P. Provoost, M. Milla, M. Ponti, K.Van den Meersche, T. Ysebaert, and P. M. J. Herman. 2009. Sed-iment segregation by biodiffusing bivalves. Estuarine, Coastal, andShelf Science 83:379–391.
Neumann, A. C., C. D. Gebelein, and T. P. Scoffin. 1970. Compo-sition, structure and erodability of subtidal mats, Abaco, Bahamas.Journal of Sedimentary Petrology 40:274–297.
Paarlberg, A. J., M. A. F. Knaapen, M. B. de Vries, S. Huscher, andZ. B. Wang. 2005. Biological influences on morphology and bedcomposition of an intertidal flat. Estuarine, Coastal, and ShelfScience 64:577–590.
Paterson, D. M. 1989. Short-term changes in the erodibility of in-tertidal cohesive sediments related to the migratory behavior ofepipelic diatoms. Limnology and Oceanography 34:223–234.
Paterson, D. M., T. J. Tolhurst, J. A. Kelly, C. Honeywill, E. de Deck-ere, V. Huet, S. A. Shayler, K. S. Black, J. de Brouwer, and I.Davidson. 2000. Variations in sediment properties, Skeffling mud-flat, Humber Estuary, UK. Continental Shelf Research 20:1373–1396.
Rietkerk, M., and J. van de Koppel. 2008. Regular pattern formationin real ecosystems. Trends in Ecology & Evolution 23:169–175.
Rietkerk, M., M. C. Boerlijst, F. van Langevelde, R. HilleRisLambers,J. van de Koppel, L. Kumar, H. H. T. Prins, and A. M. de Roos.2002. Self-organization of vegetation in arid ecosystems. AmericanNaturalist 160:524–530.
Rietkerk, M., S. C. Dekker, M. J. Wassen, A. W. M. Verkroost, andM. F. P. Bierkens. 2004a. A putative mechanism for bog patterning.American Naturalist 163:699–708.
Rietkerk, M., S. C. Dekker, P. C. de Ruiter, and J. van de Koppel.2004b. Self-organized patchiness and catastrophic shifts in eco-systems. Science 305:1926–1929.
Saco, P. M., G. R. Willgoose, and G. R. Hancock. 2007. Eco-geo-
morphology of banded vegetation patterns in arid and semi-aridregions. Hydrology and Earth System Sciences 11:1717–1730.
Scheffer, M., and S. R. Carpenter. 2003. Catastrophic regime shiftsin ecosystems: linking theory to observation. Trends in Ecology &Evolution 18:648–656.
Sherratt, J. A., and G. J. Lord. 2007. Nonlinear dynamics and patternbifurcations in a model for vegetation stripes in semi-arid envi-ronments. Theoretical Population Biology 71:1–11.
Sokal, R. R., and F. J. Rohlf. 1995. Biometry: the principles andpractice of statistics in biological research. 3rd ed. W. H. Freeman,New York.
Staats, N., E. de Deckere, B. Kornman, W. van der Lee, R. Termaat,J. Terwindt, and B. de Winder. 2001. Observations on suspendedparticulate matter (SPM) and microalgae in the Dollard Estuary,The Netherlands: importance of late winter ice cover of the in-tertidal flats. Estuarine, Coastal, and Shelf Science 53:297–306.
Stal, L. J. 2009. Microphytobenthos as a biogeomorphological forcein intertidal sediment stabilization. Ecological Engineering 36:236–245, doi:10.1016/j.ecoleng.2008.12.032.
Stallins, J. A. 2006. Geomorphology and ecology: unifying themesfor complex systems in biogeomorphology. Geomorphology 77:207–216.
Sutherland, T. F., C. L. Amos, and J. Grant. 1998a. The effect ofbuoyant biofilms on the erodibility of sublittoral sediments of atemperate microtidal estuary. Limnology and Oceanography 43:225–235.
Sutherland, T. F., J. Grant, and C. L. Amos. 1998b. The effect of car-bohydrate production by the diatom Nitzschia curvilineata on theerodibility of sediment. Limnology and Oceanography 43:65–72.
Temmerman, S., T. J. Bouma, G. Govers, Z. B. Wang, M. B. De Vries,and P. M. J. Herman. 2005. Impact of vegetation on flow routingand sedimentation patterns: three-dimensional modeling for atidal marsh. Journal of Geophysical Research 110:F04019.
Temmerman, S., T. J. Bouma, J. van de Koppel, D. D. Van der Wal,M. B. De Vries, and P. M. J. Herman. 2007. Vegetation causeschannel erosion in a tidal landscape. Geology 35:631–634.
Underwood, G. J. C., and D. M. Paterson. 1993. Recovery of intertidalbenthic diatoms after biocide treatment and associated sedimentdynamics. Journal of the Marine Biological Association of theUnited Kingdom 73:25–45.
Underwood, G. J. C., C. Nilsson, K. Sundback, and A. Wulff. 1999.Short-term effects of UVB radiation on chlorophyll fluorescence,biomass, pigments, and carbohydrate fractions in a benthic diatommat. Journal of Phycology 35:656–666.
van de Koppel, J., P. M. J. Herman, P. Thoolen, and C. H. R. Heip.2001. Do alternate stable states occur in natural ecosystems? evi-dence from a tidal flat. Ecology 82:3449–3461.
van Oevelen, D., K. Soetaert, J. J. Middelburg, P. M. J. Herman, L.Moodley, I. Hamels, T. Moens, and C. H. R. Heip. 2006. Carbonflows through a benthic food web: integrating biomass, isotopeand tracer data. Journal of Marine Research 64:453–482.
van Wesenbeeck, B. K., J. van de Koppel, P. M. J. Herman, and T.J. Bouma. 2008. Does scale-dependent feedback explain spatialcomplexity in salt-marsh ecosystems? Oikos 117:152–159.
Wang, R. H., Q. X. Liu, G. Q. Sun, Z. Jin, and J. van de Koppel.2009. Nonlinear dynamic and pattern bifurcations in a model forspatial patterns in young mussel beds. Journal of the Royal SocietyInterface 6:705–718.
Whitehouse, R. J. S., P. Bassoullet, K. R. Dyer, H. J. Mitchener, andW. Roberts. 2000. The influence of bedforms on flow and sediment

E000 The American Naturalist
transport over intertidal mudflats. Continental Shelf Research 20:1099–1124.
Williams, J. J., P. A. Carling, C. L. Amos, and C. Thompson. 2008.Field investigation of ridge-runnel dynamics on an intertidal mud-flat. Estuarine, Coastal, and Shelf Science 79:213–229.
Winterwerp, J. C., and W. G. M. Van Kesteren. 2004. Introductionto the physics of cohesive sediment in the marine environment.Elsevier, Amsterdam.
Associate Editor: Christopher A. KlausmeierEditor: Donald L. DeAngelis
Related Documents