European Geothermal Congress 2013 Pisa, Italy, 3‐7 June 2013 1 Spatial overlay analysis as first decision-making tool for deep geothermal resources exploration: Tuscany case study (Italy) Monia Procesi 1,2 , Mauro Buttinelli 1 , Maurizio Pignone 1 , Fedora Quattrocchi 1 1 Istituto Nazionale di Geofisica e Vulcanologia, Via di Vigna Murata 605, 00143 Roma, Italy 2 UGI, Unione Geotermica Italiana, Largo Lucio Lazzarino 1, 56126 Pisa, Italy [email protected] Keywords: Spatial Analysis, Geographic Information Systems, Weighted Overlay, Geothermal Exploration, Tuscany. ABSTRACT Geothermal exploration requires the analysis of data by combining various sets of geo-information, including geochemistry, surface geology, tectonic setting, thermal survey, geomagnetic and gravity measurements and if available, previous boreholes and seismic lines. In this framework a Geographic Information Systems (GIS) and a Spatial Anlaysis can be a useful and precious tool that can permit a spatial multicriteria analysis and a multidisciplinary interpretation among different data to produce continuous thematic mapping. The present work focuses on the estimation of the GIS techniques’s potential for “medium-high temperature geothermal exploration”, during the early stages of a regional survey. The proposed analysis is based on the consideration both of favorable geological factors for geothermal field identification (e.g. thermal and natural gas manifestation, surface geology, tectonic setting, gravity measurements) and geological hazard (e.g. seismicity and volcanism) which potentially can limit the exploitation of a geothermal field. The validation of the model has been done on the Tuscany Region (Italy), where in addition to natural indicators of geothermal activity, two geothermal fields are already in operation: Larderello-Travale/Radicondoli and Monte Amiata. The proposed analysis shows that the most promising areas in Tuscany for geothermal exploration, are exactly recognized where nowadays geothermal power plants are in operation. The results suggest a good efficiency of the model, so it could be useful to evaluate potential geothermal areas in not much explored sectors giving primary information about the real exploitation perspectives. 1. INTRODUCTION A geothermal exploration program is usually carried out throughout a step-by-step analysis, starting from regional to sub-regional surveys before proceed to more detailed studies (Goldstein, 1988; Wright et al., 1989). During each stage of the process the less interesting areas are gradually discarded, in order to concentrate further efforts on the remaining, more promising ones (Dickson and Fanelli, 2004). Geothermal exploration requires a combined analysis of various geo-information data-sets, including geochemistry, surface geology, tectonic setting, underground temperatures distribution, geomagnetic and gravity measurements and, if available, boreholes and seismic profiles data. In this framework a Geographic Information Systems (GIS) can be a useful tool that permits a multidisciplinary and multi- scale spatial interpretation of such data. Several authors applied this methodological approach as a decision making scheme for geothermal resources exploration (Noorollahi 2005 - 2007, Coolbaugh 2002, 2005a, b). Results show that the location of the areas defined by GIS-based methods strongly correlates with such areas defined by conventional methods (Noorollahi 2007). Similarly to Noorollahi et al., (2007, 2008), this work focuses on the evaluation of GIS-based techniques potentiality during the early stages of a regional-scale geothermal exploration. The innovation with respect to previous works is the consideration of both factors that help the identification of a geothermal resource, and that may limit a potential exploitation. In this framework, the proposed analysis is based on two main groups of data: - Geo-Predisposing Factors (GPF): favorable geological factors for geothermal resource identification (e.g. thermal and natural gas manifestation, surface geology, tectonic setting, gravity measurements); - Geo-Hazard Factors (GHF): geological hazard (e.g. seismicity and volcanism) which can potentially limit the exploitation of a geothermal field. The study area is the Tuscany Region (Italy), where indicators of geothermal activity have been already recognized. Two geothermal fields are here in operation (Larderello-Travale/Radicondoli and Monte Amiata). These it permits to validate the proposed methodology and to identify further promising geothermal resource areas.

Welcome message from author
This document is posted to help you gain knowledge. Please leave a comment to let me know what you think about it! Share it to your friends and learn new things together.
Transcript

European Geothermal Congress 2013 Pisa, Italy, 3‐7 June 2013
1
Spatial overlay analysis as first decision-making tool for deep geothermal resources exploration: Tuscany case study (Italy)
Monia Procesi1,2, Mauro Buttinelli1, Maurizio Pignone1, Fedora Quattrocchi1 1 Istituto Nazionale di Geofisica e Vulcanologia, Via di Vigna Murata 605, 00143 Roma, Italy
2 UGI, Unione Geotermica Italiana, Largo Lucio Lazzarino 1, 56126 Pisa, Italy [email protected]
Keywords: Spatial Analysis, Geographic Information Systems, Weighted Overlay, Geothermal Exploration, Tuscany.
ABSTRACT Geothermal exploration requires the analysis of data by combining various sets of geo-information, including geochemistry, surface geology, tectonic setting, thermal survey, geomagnetic and gravity measurements and if available, previous boreholes and seismic lines. In this framework a Geographic Information Systems (GIS) and a Spatial Anlaysis can be a useful and precious tool that can permit a spatial multicriteria analysis and a multidisciplinary interpretation among different data to produce continuous thematic mapping. The present work focuses on the estimation of the GIS techniques’s potential for “medium-high temperature geothermal exploration”, during the early stages of a regional survey. The proposed analysis is based on the consideration both of favorable geological factors for geothermal field identification (e.g. thermal and natural gas manifestation, surface geology, tectonic setting, gravity measurements) and geological hazard (e.g. seismicity and volcanism) which potentially can limit the exploitation of a geothermal field. The validation of the model has been done on the Tuscany Region (Italy), where in addition to natural indicators of geothermal activity, two geothermal fields are already in operation: Larderello-Travale/Radicondoli and Monte Amiata. The proposed analysis shows that the most promising areas in Tuscany for geothermal exploration, are exactly recognized where nowadays geothermal power plants are in operation. The results suggest a good efficiency of the model, so it could be useful to evaluate potential geothermal areas in not much explored sectors giving primary information about the real exploitation perspectives.
1. INTRODUCTION
A geothermal exploration program is usually carried out throughout a step-by-step analysis, starting from regional to sub-regional surveys before proceed to more detailed studies (Goldstein, 1988; Wright et al., 1989). During each stage of the process the less interesting areas are gradually discarded, in order to
concentrate further efforts on the remaining, more promising ones (Dickson and Fanelli, 2004). Geothermal exploration requires a combined analysis of various geo-information data-sets, including geochemistry, surface geology, tectonic setting, underground temperatures distribution, geomagnetic and gravity measurements and, if available, boreholes and seismic profiles data. In this framework a Geographic Information Systems (GIS) can be a useful tool that permits a multidisciplinary and multi-scale spatial interpretation of such data. Several authors applied this methodological approach as a decision making scheme for geothermal resources exploration (Noorollahi 2005 - 2007, Coolbaugh 2002, 2005a, b). Results show that the location of the areas defined by GIS-based methods strongly correlates with such areas defined by conventional methods (Noorollahi 2007). Similarly to Noorollahi et al., (2007, 2008), this work focuses on the evaluation of GIS-based techniques potentiality during the early stages of a regional-scale geothermal exploration.
The innovation with respect to previous works is the consideration of both factors that help the identification of a geothermal resource, and that may limit a potential exploitation. In this framework, the proposed analysis is based on two main groups of data:
- Geo-Predisposing Factors (GPF): favorable geological factors for geothermal resource identification (e.g. thermal and natural gas manifestation, surface geology, tectonic setting, gravity measurements);
- Geo-Hazard Factors (GHF): geological hazard (e.g. seismicity and volcanism) which can potentially limit the exploitation of a geothermal field.
The study area is the Tuscany Region (Italy), where indicators of geothermal activity have been already recognized. Two geothermal fields are here in operation (Larderello-Travale/Radicondoli and Monte Amiata). These it permits to validate the proposed methodology and to identify further promising geothermal resource areas.

Procesi et al.
2
2. STUDY AREA
Main Italian geothermal areas are located along the peri-Tyrrhenian coast, where anomalous thermal gradients and high heat flux (120 mW/m2 on average) are recognized. In Italy only two geothermal fields are
presently exploited (Larderello-Travale/Radicondoli and Monte Amiata, are located in the southern part of Tuscany), despite the huge potential of other Italian regions. The gross electricity generation of those fields is around 5.5 TWh (Cappetti et al., 2010) (figure1).
Figure 1: Map of the study area
3. METHODOLOGY
We used GIS-based analysis techniques to identify potential geothermal resources suitable for exploitation. The input data were organized into a dedicated Geodatabase. Then, two main tools of ESRI ArcGIS® suite were used to build and run the spatial analysis model: the ModelBuilder (MB) tool and the Weighted Overlay (WO) functions. The model was designed through the MB, whereas the WO was applied for the data processing. In order to run the model and to allow WO calculations, the input data must be grid layers.
3.1 Geodatabase construction
The input data were organized into an ESRI - ArcGIS Geodatabase, characterized by Feature Classes that were grouped into Feature Datasets. Three Feature Datasets were defined:
1) INPUT DATA 2) PROCESSED DATA 3) MODEL DATA
The Input Dataset includes all the data to be considered by the models (figure 2). The Data have different formats: Vectors, characterized by points (e.g. boreholes), lines (e.g. faults) and polygons (e.g. seismogenic sources) elements; and Raster. A no- homogeneous spatial references of the data are observed. The Processed Dataset groups grids data obtained by transformations of input data. Such transformation are requested to homogenize the input data on the territory and to make possible spatial correlations.
Finally, the Model Dataset contains the reclassified grids relative to each processed data layer. The reclassified grid are necessary for the Weighted Overlay calculations, to obtain the output models.
3.2 The ModelBuilder & the Weighted Overlay
ModelBuilder is an application of ESRI ArcGIS by which it is possible to create, edit, manage and run spatial analysis models. “To Run” a spatial analysis model means to do a series of sequential operation and/or calculations on layer’s spatial information. We created three models:
1- Model 1:identification of potential geothermal resources;
2- Model 2: identification of combined geo-hazard and areal distribution;
3- Model 3: identification of potential areas suitable for geothermal exploitation.
These models were developed using several geoprocessing functions (buffering, dissolving, density, weighted overlay). The WO tool applies one of the most used approaches for overlay analysis to solve multicriteria problems, such as site selection and suitability models for natural resource evaluations. The classified data layers were overlain using weightings that reflect the influence of each layer in the overall exploration process. A restricted value is used for areas we want to exclude from the analysis. The output model is a grid that represents the “favorability” of the study area in terms of potential geothermal exploitation.
4. INPUT DATA
Input data were collected from public archives and then divided into main categories:
- Geo-Predisposing Factors (GPF); - Geo-Hazard Factors (GHF).
4.1.1 GeoPredisposing Factors
- Tectonics Active tectonics is considered a predisposing factor for geothermal exploration, testifying a potential shallow fracturing of the crust. Fractures and faults can play an important role in controlling fluid flow, as highlighted by several authors (Hanano, 2000; Blewitt et al., 2003; Noorollahi et al., 2007). In particular normal stress faults and extensional stress regime are

Procesi et al.
3
promising factors for a potential easier exploitation of a deep hot fluid. Such phenomenon often occur simultaneously in back-arc domains. The data relative to tectonic setting were extracted by the Italian Stress Map (Montone et al., 2012). It contains a complete collection of present-day stress regime orientations along Italian territory. The stress field is classified in extensional, strike slip and compressive.
- Underground Data High underground temperatures (>200°C) and relevant heat flux (>60 mW/m2) as well as a top reservoir depth lower than 2000 m and a high exploration density (number of wells and seismic profiles >4/km2) represent a good conditions for geothermal resource identification, also considering the economic convenience. The underground data were collected from Cataldi et al., 1995, CNR (http://geothopica.igg.cnr.it/) and UNMIG (http://unmig.sviluppoeconomico.gov.it) and include: deep temperatures distribution along Italy (at 1000, 2000 and 3000 meters of depth), heat flux, depth and temperature of the potential geothermal reservoir top and exploration density, computed starting from the number of available boreholes and seismic lines per square kilometer.
- Geochemistry The geochemistry plays an important role in any investigation of geothermal resources, since it helps in the identification and characterization of thermal anomalies and fractured geological systems, especially when underground fluids circulation is present. The geochemical data used in this work include the distribution of geothermal manifestations (as thermal spring, bubbling pools and fumaroles from Cataldi et al., 1995; http://geothopica.igg.cnr.it/) and hydrocarbon manifestation (mud volcanoes, gas seeps and oil seeps, from Martinelli et al., 2012). 4.1.2 GeoHazard Factors Italy is located in an active geodynamical domain characterized by a diffuse seismicity and active volcanism. The innovation proposed by this work is to take also into account the distribution of the main geo-hazard factors, which could limit or hamper a realistic exploitation of a geothermal resource. Such phenomenon represent the main GHF to be considered for the identification of potential areas suitable for geothermal exploitation.
- Seismicity and Seismogenic sources Several seismic catalogues were taken into account for this analysis, including seismic events from 1981 to 2012, seismogenic sources distribution, seismic zonation and the expected peak ground acceleration (PGA) map. ISIDE, CSI and CPTI catalogues (http://iside.rm.ingv.it/iside/standard/index.jsp; http://csi.rm.ingv.it/; http://emidius.mi.ingv.it/CPTI11/) were considered to
estimate the events density and magnitude distributions. The DISS Database (Basili et al., 2008) for the distribution of Individual (IS) and Composite (CS) seismogenic sources. For the Seismic Zonation was considered the map developed by INGV joined to DPC (http://www.protezionecivile.gov.it/jcms/it/classificazione.wp). It shows a seismic classification of the territory in 4 zones, depending on the probability for an area to be affected, in a certain time interval (generally 50 years), by a seismic event exceeding a fixed intensity and magnitude threshold. In zone 1 fall all areas where strong earthquakes can occur, while zone 4 describes areas having less dangerousness. The seismic hazard map of Italy (http://zonesismiche.mi.ingv.it/) shows the distribution of maximum peak ground acceleration (PGA) with the 10% of exceedance probability in 50 years.
- Active Volcanism Several volcanic districts are present in Italy but the active complexes are mostly located only in southern part. The active Italian volcanism is both explosive (Vesuvius) and effusive (Etna) and may represent an hazard geological factor respect to a potential geothermal exploitation. The Tuscany Magmatic Province includes several mafic to silicic intrusive and extrusive centers, principally scattered through southern Tuscany and the Tuscan archipelago. Ages range from 14 Ma to most recent 0.2 Ma of Monte Amiata (Peccerillo, 2005). Because in Tuscany an active volcanism is not present, it was not necessary considered that for the model about the GHF.
Figure 2: List of the Input Data(GPF and GHF).
Procesi et al.
4
4.2 Processed data
The input data were processed throughout a series of transformations, in order to homogenize the information and to make possible further spatial correlations. The first step was the creation of a workspace grid constituted by more than 1.45M cells (1x1 km), in order to cover the whole Italian territory. The main performed transformations are:
- conversion from vector to grid; - spatial references homogenization; - definition of the grid classes; - reclassification of the grid classes.
Several grids were obtained and a same spatial reference was assigned (WGS84 UTM 32N). For each grid were defined two or four classes and then reclassified assigning a digital value from 1 to 4. This reclassification was necessary in order to allow further raster calculations. The value 1 was acquired by such classes which define the most favorable conditions for the geothermal exploitation (presence of an exploitable deep resource or low hazard factor concentration). Consequently the 2, 3 and 4 values were assigned to less and less promising conditions (e.g. limited underground information or high GHF concentration). NO-DATA class was defined for such layers with a non-homogeneous territorial coverage. NO-DATA class is considered non-favorable for the GPF while it is favorable for the GHF.
4.3 Model data In order to produce comparable datasets for the Weighted Overlay procedures (the model data), a
weight (numerical code) was assigned to each reclassified class. The weights range between 1 and 9. High values (e.g. 6-9) refer to favorable conditions for the geothermal exploitation, for both GPF and GHF. Therefore, low values for the GHF mean high concentration of adverse conditions (namely geo-hazards) for a reliable geothermal exploitation.
5. WORKFLOW
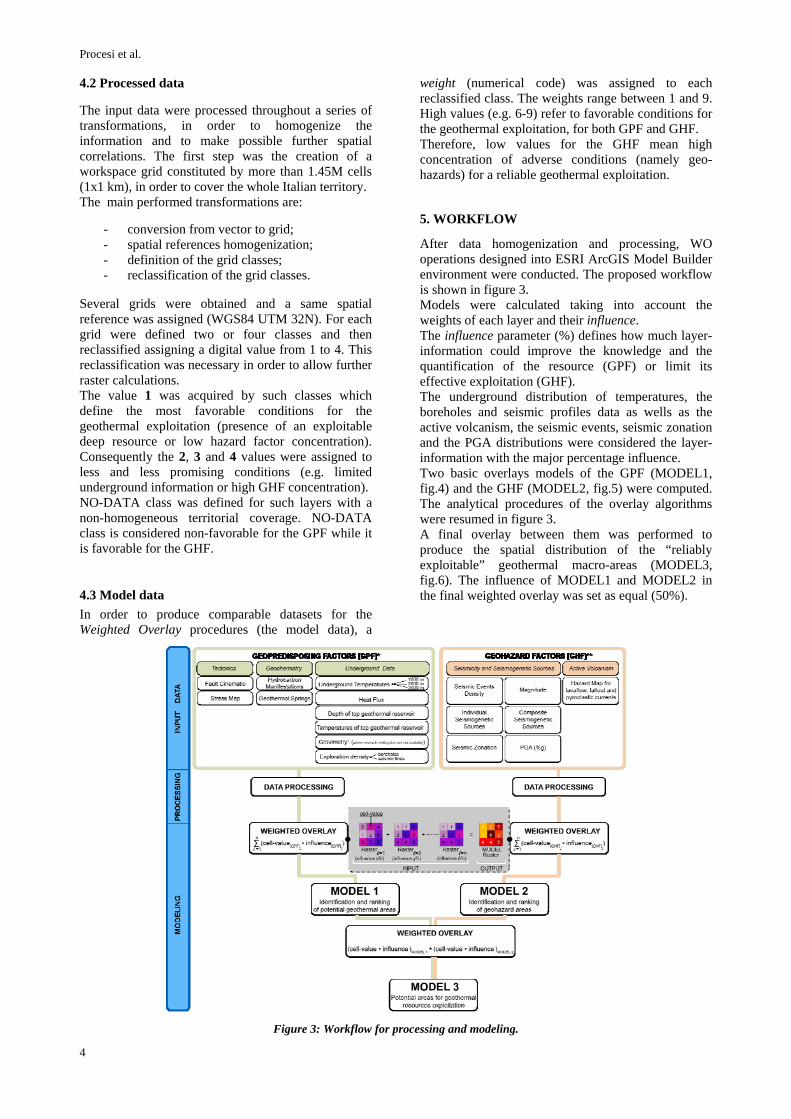
After data homogenization and processing, WO operations designed into ESRI ArcGIS Model Builder environment were conducted. The proposed workflow is shown in figure 3. Models were calculated taking into account the weights of each layer and their influence. The influence parameter (%) defines how much layer-information could improve the knowledge and the quantification of the resource (GPF) or limit its effective exploitation (GHF). The underground distribution of temperatures, the boreholes and seismic profiles data as wells as the active volcanism, the seismic events, seismic zonation and the PGA distributions were considered the layer-information with the major percentage influence. Two basic overlays models of the GPF (MODEL1, fig.4) and the GHF (MODEL2, fig.5) were computed. The analytical procedures of the overlay algorithms were resumed in figure 3. A final overlay between them was performed to produce the spatial distribution of the “reliably exploitable” geothermal macro-areas (MODEL3, fig.6). The influence of MODEL1 and MODEL2 in the final weighted overlay was set as equal (50%).
Figure 3: Workflow for processing and modeling.

Procesi et al.
5
6. RESULTS & DISCUSSIONS
Generally the result of a weighted overlay computation is a grid layer. In this three grids were obtained, one for each model, with cell values from 1 to 9, from low ranking to high ranking classes, respectively. The final result (Model 3) represent a map of potential exploitable geothermal resources, even in relatively low-data coverage areas.
6.1 MODEL 1 (geothermal resource identification and ranking)
Results of Model 1 show the areas where the geo-predisposing factors for geothermal resource identification are more concentrated. Weighted overlay classes of Model 1 ranges from 1 to 9 (fig. 4). Low values (from1 to 5) testify a low input data density or absence of a potential geothermal resource. Conversely high values (from 6 to 9) indicate high data concentration and the presence of a potential geothermal resource. It is necessary to underline that the result of this analysis is strictly conditioned by the input data distribution and data interpolation procedures. Results of this model show a good correlation between the computed extension of the potential geothermal areas and the known geothermal fields of Tuscany. Other areas can be however highlighted as a result of this analysis, which are located inMontecatini Val di Cecina, Volterra, Mazzolla, Castel del Piano, Santa Fiora, Seggano e Castel Vecchio. Even if Model 1 highlights the presence and the extension of potential deep geothermal resource, a feasible use of that necessarily passes through the evaluation of the geological hazards that characterized the study area (Model 2).
6.2 MODEL 2 (geohazards identification and ranking)
Results of Model 2 show the areas where the main geo-hazard factors are more concentrated limiting a potential exploitation of the geothermal resource (fig. 5). Weighted overlay classes of Model 2 ranges from 1 to 9. No-Data or Low values (form 1 to 5) testify a high geological hazards concentration, condition that could limit and hamper the exploitation of a geothermal resource. Conversely high values (from 6 to 9) witness for low hazard density and a favorable condition for a potential geothermal resource exploitation. Hazard concentration is basically related to the presence of active faults, seismic events clustering, high expected PGA and active volcanism. In the weighted overlay computation the active volcanism was defined as the fall-out and density currents flow expected areas. As well as for Model 1, the results of this analysis are strictly conditioned by the input data distribution and data interpolation procedures.
Principal clustering of geohazard can be located close to the Apennines chain where potential sismogenetic structures are recognized. Whereas a general low concentration is evidenced in most of Tuscanian territory. A final overlay procedure (Model 3) between Model 1 and Model 2 was performed in order to identify the areas where there is the evidence of a potential geothermal resource in addiction with a low geo-hazard concentration. Such areas could be considered for a feasible geothermal resource exploitation.
6.3 MODEL 3 (potential areas for a reliable geothermal resource exploitation)
Results of the Model 3 show the potential areas suitable for geothermal exploitation. This means: potential resource within 3 km of depth and a geo-hazard low density. Weighted overlay classes of Model 3 ranges from 1 to 9. Low values (form 1 to 5) testify a low potential exploitation of the geothermal resources whereas high values (form 6 to 9) witness for a high potential in terms of reliable geothermal exploitation (i.e. easy recoverable resource far from main geohazards, fig. 6). More in detail the values 8 and 9 indicate areas where the geothermal exploitation can be a realistic option; the cell values 6 and 7 can be considered as sites where a further data acquisition can improve the knowledge of underground setting and of potential geothermal resource. Cell values below 5 testify both the absence of a resource and a huge concentration of geohazards, or alternatively a substantial absence of underground data. The more promising areas highlighted by Model 3 are located around the exploitated areas of Larderello and Mt. Amiata. Furthermore this methodology evidences the presence of new areas, which refer to the central and southern part of Tuscany (orange color in fig.6), not yet completely defined by previous works or prior literature knowledge. As already evidenced by Model 1, the high-ranking areas of the Model 3, show a good correlation with the distribution of existing and in operation Tuscanian geothermal fields (Larderello-Travale and Mt. Amiata). This demonstrate that the proposed methodological approach is validated and can be considered reliable. We strongly feel that this kind of multidisciplinary and regional approaches can represent the first step to be followed in a geothermal exploration program. This kind of works also represent an important opportunity to link the scientific community and the decision-makers, politicians and stakeholders, giving them a concrete tool to develop strategic energy plans. It is important to point out that Site-specific analyses should be however performed in such areas identified via the proposed methodology, both to quantify the geothermal potential of the resource and to plan a realistic exploitation.

Procesi et al.
6
Figure 4: Map of the potential geothermal area resulting from the weighted overlay of the geological predisposing factors.
Figure 5: Distribution of the hazard, resulting from the weighted overlay of the main geological hazard factors. The classes from1 to 4 (high hazard) are absent

Procesi et al.
7
Figure 6: Potential areas suitable for geothermal exploitation, the most promising are associated to the classes 6 and 7.
7. CONCLUSIONS
Generally, the geothermal exploration requires the analysis of data by combining various sets of geo-information, including geochemistry, surface geology, tectonic setting, thermal survey, geomagnetic and gravity measurements and if available, previous boreholes and seismic lines. In this framework a Geographic Information Systems (GIS), can be a useful and precious tool that permits a spatial multi-criteria analysis and a multidisciplinary interpretation among different data. We used GIS-based analysis techniques to identify potential geothermal resources suitable for exploitation. The input data were organized into a Geodatabase and then two main tools were used to designed and run the model: ModelBuilder (MB) and Weighted Overlay (WO). The study area is the Tuscany Region (Italy), where indicators of geothermal activity have been already recognized. Two geothermal fields are still active there (Larderello-Travale/Radicondoli and Monte Amiata). Moreover, the analysis of this case study permits to validate the proposed methodology and to identify further promising geothermal resource areas. The analysis were carried out on two main types of geological data: GeoPredisposing Factors (GPF), namely favorable geological factors for geothermal field identification (e.g. thermal and natural gas
manifestation, surface geology, tectonic setting, gravity measurements) and GeoHazard Factors (GHF), that are geological hazard which potentially can limit the exploitation of a geothermal field (e.g. seismicity and volcanism). Two basic WO models of the GPF (MODEL 1) and the GHF (MODEL 2) were computed. A final WO between them was performed to produce the spatial distribution of the “reliably exploitable” geothermal macro-areas (MODEL 3). Results show a good correlation between the high-ranking areas computed by the Model 3 and the distribution of the active Tuscanian geothermal fields (Larderello-Travale and Mt. Amiata). This demonstrate that the proposed methodological approach is validated and can be considered reliable. This methodology also evidences the presence of new promising areas, which refer to central and southern part of Tuscany, not yet completely defined by previous works or prior literature knowledge. This approach may be used as first appraisal phase for the research of new geothermal resources both in unexplored areas and in places where an active geothermal exploitation is already ongoing. Moreover, , the research of new potential geothermal resources represents an important issue in the framework of the sustainable development and of the renewable energies growth. Moreover, this kind of works represent an important opportunity to link the scientific community and the

Procesi et al.
8
decision-makers, politicians and stakeholders, giving them a concrete tool to develop strategic energy plans. Anyway, in the identified areas by the proposed model detailed “site-specific” studies should be performed to evaluate the reliable geothermal potential in terms of thermal power, electric power and energy supply. References Basili, R., Valensise, G., Vannoli, P., Burrato, P.,
Fracassi, U., Mariano, S., Tiberti, M.M., Boschi, E.: The database of individual seismogenic sources (DISS), version 3: summarizing 20 years of research on Italy’s earthquake geology. Tectonophysics, 453, (2008), 20-43.
Blewitt, G., Coolbaugh, M., Holt, W., Kreemer, C., Davis, J., Bennett, R.: Targeting potential geothermal resources in the Great Basin from regional- to basin-scale relationships between geodetic strain and geological structures. Geothermal Resources Council Transactions, 27, (2003), 3–7.
Cappetti, G., Romagnoli, P., Sabatelli, F., , Geothermal Power Generation in Italy 2005–2009 Update Report, in: Proceedings World Geothermal Congress 2010, Bali, Indonesia, (2010).
Cataldi R., Mongelli F., Squarci P., Taffi L., Zito G., Calore C.: Geothermal ranking of Italian territory, Geothermics, 24, (1995) 115–129.
Coolbaugh, M.F., Taranik, J.V., Raines, G.L., Shevenell, L.A., Sawatzky, D.L., Minor, T.B., Bedell, R.: A geothermal GIS for Nevada: defining regional controls and favorable exploration terrains for extensional geothermal systems. In: Proceedings of the Annual Meeting, Reno, NV, September 22–25, 2002, Geothermal Resources Council Transactions, vol. 26, pp. 485–490.
Coolbaugh, M., Zehner, R., Kreemer, C., Blackwell, D., Oppliger, G., Sawatzky, D., Blewitt, G., Pancha, A., Richards, M., Helm-Clark, C., Shevenell, L., Raines, G. , Johnson, G., Minor, T., Boyd, T., 2005a, Geothermal potential map of the Great Basin, western United States: Nevada Bureau of Mines and Geology Map 151.
Coolbaugh, M.F., Zehner, R.E., Raines, G.L., Oppliger, G.L., Kreemer, C., 2005b. Regional prediction of geothermal systems in the Great Basin, USA using weights of evidence and logistic regression in a Geographic Information System (GIS). In: Cheng, Q., Bonham-Carter, G. (Eds.), GIS and Spatial Analysis: International Association of Mathematical Geology Annual Conference Proceedings, Toronto, Canada, August 21–26, 2005, pp. 505–510.
Dickson, M.H., Fanelli, M.:. What is Geothermal Energy? International Geothermal Association, 2004, http://iga.igg.cnr.it/geo/geoenergy.php.
Goldstein, N.E., 1988. Subregional and detailed exploration for geothermal–hydrothermal resoures. Geotherm. Sci. Technol. 1, 303–431.
Hanano, M.,: Two different roles of fractures in geothermal development. In: Proceedings of World Geothermal Congress 2000, Japan, (2000), pp. 2597–2602.
Martinelli G., Cremonini S. and Samonati E.: Geological and geochemical setting of natural hydrocarbon emissions in Italy. In: Edited Book, Authors, Hamid A. Al-Megren, Advances in Natural Gas Technology, ISBN 978-953-51-0507-7, (2012), Chapter 4.
Montone, P., Mariucci M.T., Pierdominici S.: The Italian present-day stress map, Geophysical Journal International, 189, 2, (2012), pages 705–716.
Noorollahi, Y., Application of GIS in exploration management and well site selection of Namafjall geothermal area, North Iceland, UNU Geothermal Training Program, report 1, Reykjavik, Iceland, (2005), 114 pp.
Noorollahi, Y., Itoi, R., Fujii, H., Tanaka, T: GIS model for geothermal resource exploration in Akita and Iwate prefectures, northern Japan. Computer & Geoscience, 33, (2007), 1008–1021.
Peccerillo, A.,: Plio-Quaternary volcanism in Italy. Petrology, Geochemistry, Geodynamics, Ed. Springer, Heidelberg, 2005.
Protezione Civile, Classificazione sismica (2003) http://www.protezionecivile.gov.it/jcms/it/classificazione.
Related Documents