University of Nebraska at Omaha University of Nebraska at Omaha DigitalCommons@UNO DigitalCommons@UNO Student Work 5-1-2005 Spatial Implications of Urban Functional Classification: A Study of Spatial Implications of Urban Functional Classification: A Study of Small Urban Places in the North-Central United States Small Urban Places in the North-Central United States Tyler A. Van Meeteren University of Nebraska at Omaha Follow this and additional works at: https://digitalcommons.unomaha.edu/studentwork Recommended Citation Recommended Citation Van Meeteren, Tyler A., "Spatial Implications of Urban Functional Classification: A Study of Small Urban Places in the North-Central United States" (2005). Student Work. 596. https://digitalcommons.unomaha.edu/studentwork/596 This Thesis is brought to you for free and open access by DigitalCommons@UNO. It has been accepted for inclusion in Student Work by an authorized administrator of DigitalCommons@UNO. For more information, please contact [email protected].

Welcome message from author
This document is posted to help you gain knowledge. Please leave a comment to let me know what you think about it! Share it to your friends and learn new things together.
Transcript

University of Nebraska at Omaha University of Nebraska at Omaha
DigitalCommons@UNO DigitalCommons@UNO
Student Work
5-1-2005
Spatial Implications of Urban Functional Classification: A Study of Spatial Implications of Urban Functional Classification: A Study of
Small Urban Places in the North-Central United States Small Urban Places in the North-Central United States
Tyler A. Van Meeteren University of Nebraska at Omaha
Follow this and additional works at: https://digitalcommons.unomaha.edu/studentwork
Recommended Citation Recommended Citation Van Meeteren, Tyler A., "Spatial Implications of Urban Functional Classification: A Study of Small Urban Places in the North-Central United States" (2005). Student Work. 596. https://digitalcommons.unomaha.edu/studentwork/596
This Thesis is brought to you for free and open access by DigitalCommons@UNO. It has been accepted for inclusion in Student Work by an authorized administrator of DigitalCommons@UNO. For more information, please contact [email protected].

Spatial Implications of Urban Functional Classification: A Study
of Small Urban Places in the North-Central United States
A Thesis
Presented to the
Department of Geography/Geology
and the
Faculty of the Graduate College
University of Nebraska
In Partial Fulfillment
of the Requirements for the Degree
Master of Arts
University of Nebraska at Omaha
by
Tyler A. Van Meeteren
May 2005

UMI Number: EP73236
All rights reserved
INFORMATION TO ALL USERS The quality of this reproduction is dependent upon the quality of the copy submitted.
In the unlikely event that the author did not send a complete manuscript and there are missing pages, these will be noted. Also, if material had to be removed,
a note will indicate the deletion.
Pisssftafen Publishing
UMI EP73236
Published by ProQuest LLC (2015). Copyright in the Dissertation held by the Author.
Microform Edition © ProQuest LLC.All rights reserved. This work is protected against
unauthorized copying under Title 17, United States Code
ProQuest LLC.789 East Eisenhower Parkway
P.O. Box 1346 Ann Arbor, Ml 48106-1346

THESIS ACCEPTANCE
Acceptance for the faculty of the Graduate College, University of Nebraska, in partial fulfillment of the
Requirements for the degree Master of Arts, University of Nebraska at Omaha.
Committee
Chairperson
Date (X a /v J I J 4 j Q q o S

Spatial Implications of Urban Functional Classification: A Study
of Small Urban Places in the North-Central United States
ABSTRACT
Tyler A. Van Meeteren, M.A.
University of Nebraska, 2005
Advisor: Dr. Charles R. Gildersleeve
The idea that cities have diverse economic structures and social
characteristics is commonly understood. Many times these differences can be
traced to historical regional growth or resource availability. Recognition and
better understanding of these different types of cities requires their classification.
Classification is way to organize complex and diverse information in order to
create a better understanding of processes and relationships. One of the ways in
which geographers have classified cities, in terms of describing the external
relations, is called functional town classification. The simplest way of classifying
cites is to identify the distinctive role they play in the city system.
The purpose of this thesis is to examine the spatial distribution of
economic functions for the small urban places in the study area using a standard
classification method for urban geography, and by utilizing nearest neighbor
analysis. This study should produce spatial patterns of distribution based on the
site and situation of the place. There may also be a strong influence of function

based upon proximity to a larger urban area. The creation of a contemporary
taxonomy of the small urban places in the study area, and subsequent
understanding of the spatial distribution of dominant economic features should
provide the base for future investigation into small urban center relationships and
classification.

V
ACKNOWLEDGEMENTS
The completion of my Masters Degree in Geography would not have been
successful without the support from numerous people at the University of
Nebraska at Omaha. I would like to thank Dr. Charles Gildersleeve for
introducing me to the realm of urban geography. As the chair of my thesis
committee, Dr. Gildersleeve did a fantastic job molding the theoretical and
methodological foundations for my research. Dr. Gildersleeve’s enthusiasm for
geography was contagious. I would also like to thank Dr. Michael Peterson for
introducing me to cartography and geographic information systems (GIS). Jerry
Deichert from the Center for Public Affairs Research was instrumental in
organizing my census data for the thesis. Dr. Larry Stephens from the Math
Department offered suggestions for statistical analysis. I thank each of these
four gentlemen for their leadership and guidance.
Last but certainly not least, I thank my family for their support both
emotionally and financially as I completed my thesis. My parents Sheila and
Alan have provided unwavering support in my pursuit of a Masters degree. I
cannot forget to thank my brother, Bryant, and sister, Alissa, for being
exceptional siblings, even though I am not sure they thought I would ever get
done! Well, I did!

CONTENTS
THESIS ACCEPTANCE............................ ii
ABSTRACT....................... iii
ACKNOWLEGDEMENTS.......................................................................................... iv
CONTENTS..................................................................................................................vi
LIST OF ILLUSTRATIONS...................................................................................... viii
LIST OF TABLES......................................................................................................... x
Chapter
1. INTRODUCTION.................................................................. 1
Nature of Problem...............................................................................4
Research Objectives.......................................................................... 5
Hypotheses and Rationale......................................... 5
Significance of Research...................................................................8
Study A rea............... 9
Definition of Terms............................................................................10
Chapter Summary..................................................... ..................... . 11
2. LITERATURE REVIEW......................................................................... ..12
Traditional Functional Classifications.......................................... 13
A Guideline for Functional Classifications................................. 20
Multivariate Statistical Analysis.....................................................22
Chapter Summary..............................................................................25

vii
3.........................METHODOLOGY........ 27
Data Characteristics and Acquisition...................... 29
Data Organization..............................................................................30
Creating the Taxonomy....................................................................32
Creating the Classification Maps...................................................34
Nearest Neighbor Analysis............................................................. 36
Chapter Summary......................................... 38
4. ANALYSIS OF RESULTS.........................................................39
Descriptive Statistics....................................................................... 39
Functional Classification................................................................ 41
Classification Location Distribution............................................. 42
Nearest Neighbor Analysis............................................................. 67
Chapter Summary...............................................................................68
5. CONCLUSION.................................................................. 70
APPENDIX......................................................................................................76
A. City Percentages by Function (population sort)................... 76
B. City Percentages by Function (alphabetical sort).................85
C. Functional Classification........................................................... 94
BIBLIOGRAPHY.............................................................................................99

LIST OF ILLUSTRATIONS
Figure Page
1. Network of Interactions in Urban Geography......................................2
2. Study Area Location M ap..................................................................... 9
3. Chauncy Harris’ Functional Classes..................................................13
4. City Functions by Support.................................................................. 16
5. Methodological Model..........................................................................28
6. MSA Cities.............. 31
7. Eliminated Cities (population 2,500-10,000).................................... 32
8. ArcGIS 9 Query by Function Example.............................................. 35
9. Nearest Neighbor ArcGIS 9 Application Output....................... 37
10. Study Area Cities...............................................................................42
11. Mining Cities: by Standard Deviation Values .................... 44
12. Construction Cities: by Standard Deviation Values...................... 46
13. Manufacturing Cities: by Standard Deviation Values.................... 48
14. Wholesale Trade Cities: by Standard Deviation Values...............50
15. Retail Trade Cities: by Standard Deviation Values....................... 52
16. Transportation Cities: by Standard Deviation Values................... 54
17. Information Technology Cities: by Standard Deviation Values.... 56
18. Finance Cities: by Standard Deviation Values............................... 58
19. Professional Service Cities: by Standard Deviation Values 60
20. Personal Service Cities: by Standard Deviation Values...............62

ix
21. Public Administration Cities by Standard Deviation Values 64
22. Diversified Cities.......................... .66

LIST OF TABLES
Table Page
1. Population Information for Study Area.............................................. 10
2. Census Data: 13 Industry Groups........................... ....29
3. Thesis Service Classes..................................................................... 30
4. Mean and Standard Deviations by Function....................................40
5. Mining Standard Deviation Cities List...............................................43
6. Construction Standard Deviation Cities L is t....................................45
7. Manufacturing Standard Deviation Cities List..................................47
8. Wholesale Standard Deviation Cities List........................................ 49
9. Retail Standard Deviation Cities L is t................................................ 51
10. Transportation Standard Deviation Cities L is t..............................53
11. Information Technology Standard Deviation Cities L ist...............55
12. Finance Standard Deviation Cities List..........................................57
13. Professional Service Standard Deviation Cities List.................... 59
14. Personal Service Standard Deviation Cities L is t......................... 61
15. Public Administration Standard Deviation Cities L ist...................63
16. Diversified Cities L ist.......................................................................65
17. Nearest Neighbor Analysis Results............................................... 67

1
Chapter 1
Introduction
The study of urban geography brings several overlapping disciplines
including economics, political science, sociology, and history together to examine
the complex system of cities. To best understand the nature of urban geography,
two important approaches should be outlined. The first is to study the
relationships in the spatial distribution and dynamic movement of goods within
the cities, or a city system approach. The examination of interaction and
distribution patterns, or internal relations, within cities are looking into the city as
a system. The second approach, and the one this study employs, is the study of
spatial distribution of cities and the complex patterns of movement, and linkages,
or external relations that tie them together. (Yeates and Garner 1980) Urban
geography can merely be described as the study of cities as systems within the
framework of cities (Berry, 1964).
The relationships not only exist amongst
other urban areas, but also between cities and
the people living in that area. These complex
interactions are of significant interest to the
urban geographer. Figure 1 illustrates the
possible relationships of importance in urbanFigure 1: Network of interactions in urban
geography. The first possibility of investigation geography adapted from Ray Northam.,Urban Geography. (New York: Wiley & Sons, 1975), 3.
Place People
Landscape
Place People

2
(A) involves the associations between a place and its population. Another (B)
area of inquiry deals with the relationships linking different places. The
relationships (C) between people in more than one location can also be
researched. The final channel of study (D) includes the associations within one
place. (Northam 1976) Each of these interactions occur within the confines of
the landscape of the earth.
The study of city patterns began to pick up steam in the first half of the
20th century as N.S.B Gras (1922), Christaller (1933), Losch (1937), and Harris
and Ullman (1945) described the nature and origin of systematic variations in the
characteristics of urban places. These geographers set the framework for more
advanced statistical analysis that future generations could build upon.
The notion that cities have diverse economic structures and social
characteristics is commonly understood. Many times these differences can be
traced to historical regional growth or resource availability. Recognition and
better understanding of these different types of cities require their classification.
Classification is a way to organize complex and diverse information in order to
create a better understanding of processes and relationships. The relevance and
usefulness of classifications in geography is wide-spread throughout the
discipline. In urban geography, “generalizations can be made concerning a
single group comprised of like items, or one group can be compared and
contrasted with one or more other groups” (Northam 1975, 13). The idea that
cities differ in terms of economic functions and social characteristics has long

3
been known. Classification in geography is undertaken in an attempt to “search
reality for hypotheses...[and]...to structure reality to test specific hypotheses that
have already been formulated” (Yeates and Garner 1980, 95).
One of the ways in which geographers have classified cities, in terms of
describing the external relations, is called functional town classification. The
simplest way of classifying cities is to identify the distinctive role they play in the
city system. These schemes are qualitative in nature and are often highly
intuitive. Of the many classifications of this sort, a good example is that
undertaken by Aurousseau in 1921. Based on general observations, he
identified six types of cities based on the dominant economic functions they
perform: administration, defense, culture, production, communications, and
recreation. (Aurousseau 1921) Although it was noted that cities may perform a
combination of these general functions, it was common to find that one of them
dominated to indicate the major role a city plays in the organization of space.
A similar type of general classification was that proposed in 1945 by Harris
and Ullman, who recognized three general types of cities: (1) central places
performing a wide range of services for local hinterlands; (2) transportation cities
performing break-of-point and allied activities for larger regions; and (3)
specialized-function cities dominated by one activity, such as manufacturing, or
recreation, and serving a wider national market. (Harris and Ullman 1945)
The results of these classifications, when mapped, provide some useful
information about the patterns of functional specialization within the city system.

4
However, there is little gained from a simple organization of facts. There must be
a purpose in the classification system because spatial recognition cannot be the
only basis for scientific analysis. Other statistical procedures should be
undertaken to shed light on possible patterns that may be unseen on a two-
dimensional representation of the data.
Nature of Problem
We as humans are continually classifying everything from the rocks
beneath our feet to the stars beyond our reach. These taxonomic models are
continually being examined and studied with appropriate changes being made.
Almost all, however, have dealt with larger cities and not urban places with fewer
than 10,000 persons. By classifying these urban centers we may be able to see
patterns at a micro-scale that could possibly be used to address problems in
larger cities.
The nature of functional classification has evolved in the past century,
beginning with a qualitative approach by Aurousseau where general observations
were the basis. The majority of the functional classifications developed by
geographers across the United States were based on cities with more than
10.000 people. Only a small number of classified small cities and towns under
10.000 people, because of the apparent difficulty of processing the grouped
employment data for small cities. Now, with the availability of electronic data and

5
faster computers, it is plausible to work with the data as presented by the U.S.
Census Bureau.
Over time, many geographers made attempts to be more objective, and
this led to several different methods including multivariate statistics being
developed. However, no one method has proven to be completely accurate, as
all are trying to rationalize an extremely complex and dynamic system.
Research Objectives
There are two principal objectives for this thesis: 1) To create a
contemporary taxonomy of the small urban places (population 2,500-10,000) in
the study area using a standard classification method for urban geography. 2) To
discover and understand the spatial distribution of the dominant economic
functions of small cities in the study area.
Hypotheses & Rationale
The five states of Iowa, Nebraska, South Dakota, North Dakota and
Minnesota should allow for a broad enough study area containing many
discernable spatial patterns of functionality. Based on previous studies, there
should be solid evidence supporting the three types of cities by support: central
places (a study by Brush in Wisconsin in 1953), special functions, and transport
cities. Based on results from other studies, retail centers and manufacturing
should be the most common functional class (Freestone et al. 2003; Harris 1943;

6
Nelson 1955). Mining, Transportation and Public Administration would likely be
some of, if not the least occurring functions due to the specialization and
necessity for resources or other special site requirements. The creation of the
taxonomy should result in finding many location specific examples, and more
than likely follow typical functional patterns. It is expected that solid evidence will
be found supporting the three types of cities by support: central places, special
functions, and transport cities. Research on the small urban places of the Great
Plains region in the late 1960’s by Charles Gildersleeve indicated that North and
South Dakota were primarily retail trade dominant. Nebraska was more
diversified, and not as trade oriented. Manufacturing has a greater influence in
the area east of the Missouri River including Iowa and portions of Minnesota.
(Gildersleeve 1969)
Using nearest neighbor analysis, spatial patterns should be found to assist
in understanding the distribution of functions throughout the region. When
attempting to understand spatial distributions and relationships, geographers
must realize that “the classification procedure that is adapted should produce
groups of towns about which the greatest number, most precise, and most
important statements can be made for the differentiating and accessory
characteristics” (Cline 1949, 82). This means that one cannot simply say that
group ‘X’ is located in area ‘Z’; we should be able to associate other
characteristics of towns in that group. With this in mind, classifications of towns
7
by function may possibly lead to generalizations about the location patterns and
the relationships with particular functions and their hinterlands.
The lack of significant data and interest has primarily been the reason for
the dearth of research on cities with less than 10,000 in population. With census
data more available today, it is possible to successfully complete this research.
Studies have occurred since the 1950’s on classifying the economic functions of
cities - at higher population centers (i.e., above 10,000). These study areas also
need to be readdressed since much has changed over the past half century, and
geographers ought to study the changes in city functionality over time. The
opportunity for a comparative temporal analysis of functionality will be achieved
through this research.
There must be a concentrated effort to not just report the results, but be
more scientific. “There is nothing inherently wrong with functional classifications
per se, yet without reference to the accessory characteristics, they have precious
little geographical relevance” (Smith 1965, 548). “The service classifications of
urban areas have often proved to be ends in themselves rather than points of
departure for further research” (Wilson 1962, 125). With this in mind, the overall
purpose of functional classifications in urban geography should be geared
towards gaining better understanding of the diverse and dynamic relationships
both vertical (function) and horizontal (countryside relationships) that make up
the true functionality of a city.

8
While analyzing the small urban center of Minnesota in 1959, John W.
Webb claimed that data are difficult to use for small urban centers. He
concluded the research by saying “work on a broad canvas should be
undertaken, despite the difficulties. Only in this way will the description of the
particular be clarified and general principles evolved” (Webb 1959, 72).
Significance of Research
Many studies conducted on classifying the economic functions of cities
were done several decades ago. These study areas should be readdressed
since much has changed over that time period. Freestone, Murphy and Jenner
recently updated a classic city classification of Australian towns, and many new
patterns and employment distributions were discovered. (Freestone et al. 2003)
Geographers also need to examine and re-evaluate the functional
changes in towns over time. Perhaps planners and city administrators can use
the results found in this study to assist them in planning the future economy in
their cities. This research will create a contemporary classification of small urban
places in the upper central United States. “This line of study might be likened to
one studying the human heart without regard for its role as a part of the
physiological system of the entire body. To study a single city without regard for
the whole urban system of which it is part is equally limited and short-sighted”
(Northam 1975, 99). There is a need to understand the small cities and towns, in
order to truly understand the larger, more complex system. This study is original

9
in the sense that it is a hybrid of the various studies done on functional city
classifications. The framework will be established for further research into
understanding the dynamic economic functionality of small urban centers.
Study Area
The area under investigation is a five state area making up the north-
central portion of the United States: Nebraska, Iowa, South Dakota, North Dakota
and Minnesota. These five states should allow for a broad enough study area
containing many discernable spatial patterns of functionality. The small urban
centers are also quite prominent in this region, which will assist in the overall
analysis of the character and nature of functional distribution (see Figure 2).
Five State Study Area
Figure 2: Five state study area location map.
10
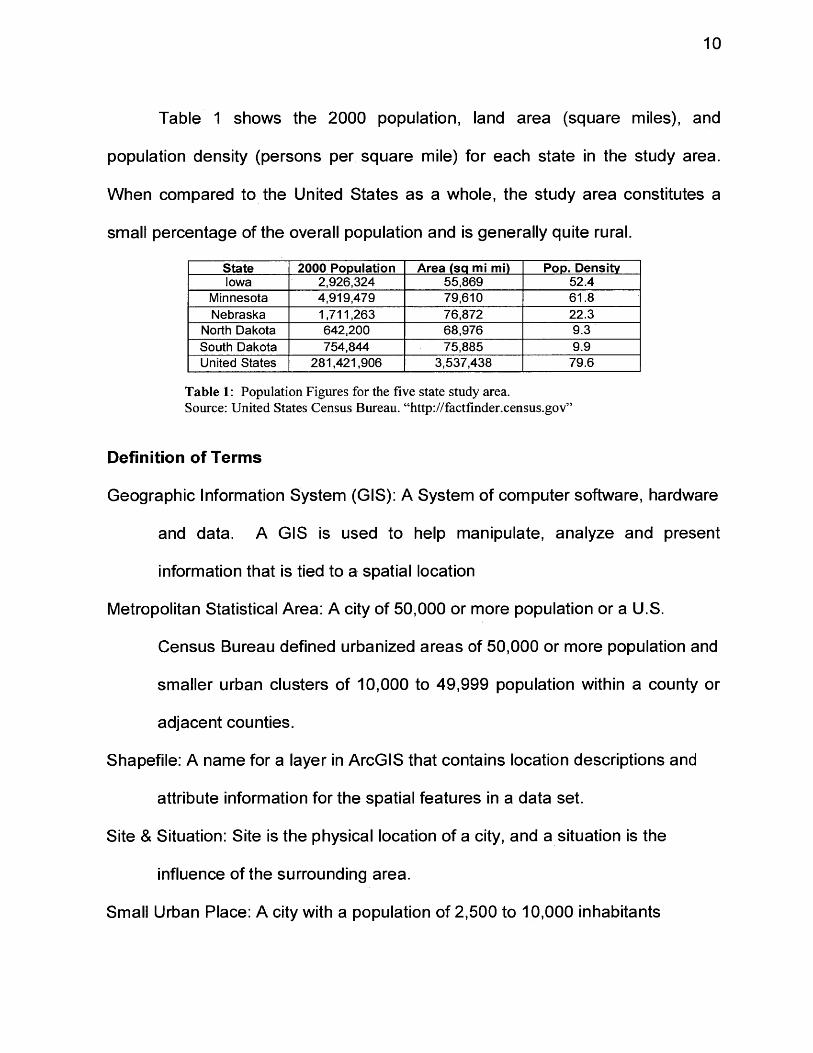
Table 1 shows the 2000 population, land area (square miles), and
population density (persons per square mile) for each state in the study area.
When compared to the United States as a whole, the study area constitutes a
small percentage of the overall population and is generally quite rural.
State 2000 Population Area (sa mi mi) Pop. DensityIowa 2,926,324 55,869 52.4
Minnesota 4,919,479 79,610 61.8Nebraska 1,711,263 76,872 22.3
North Dakota 642,200 68,976 9.3South Dakota 754,844 75,885 9.9United States 281,421,906 3,537,438 79.6
Table 1: Population Figures for the five state study area.Source: United States Census Bureau, “http://factfinder.census.gov”
Definition of Terms
Geographic Information System (GIS): A System of computer software, hardware
and data. A GIS is used to help manipulate, analyze and present
information that is tied to a spatial location
Metropolitan Statistical Area: A city of 50,000 or more population or a U.S.
Census Bureau defined urbanized areas of 50,000 or more population and
smaller urban clusters of 10,000 to 49,999 population within a county or
adjacent counties.
Shapefile: A name for a layer in ArcGIS that contains location descriptions and
attribute information for the spatial features in a data set.
Site & Situation: Site is the physical location of a city, and a situation is the
influence of the surrounding area.
Small Urban Place: A city with a population of 2,500 to 10,000 inhabitants

11
Chapter Summary
The purpose of this thesis is to examine the spatial distribution of
economic functions for the small urban places in the study area using a standard
classification method for urban geography, and to discover and understand the
spatial distribution of the dominant economic functions of these places utilizing
nearest neighbor analysis.
This study should produce spatial patterns of distribution based on the site
and situation of the place. There may also be a strong influence of function
based upon proximity to a larger urban area. The creation of a contemporary
taxonomy of the small urban places in the study area, and subsequent
understanding of the spatial distribution of dominant economic features should
provide the base for future investigation into small urban center relationships and
classification.
Chapter 2 follows with a review of the literature on urban geography that
specifically addresses varying methods and theories of functional classification.
Chapter 3 discusses the methodological design, data collection, and analyses
performed in the research study, while chapters 4 and 5 provide an extensive
discussion of the results and conclusions of the research study.

12
Chapter 2
Literature Review
With respect to the discipline of geography as a whole, urban geography
is a relatively new field of study, and this has an impact on the quantity of
literature available for functional classification. The purpose behind each of
these studies is to find relationships in the spatial distribution of economic
functions in an attempt to better understand the incredibly complex urban
structure. The nature of functional classifications has changed throughout the
course of the last 100 years, with ever more concentrated efforts made to
produce more objective results. This had led to the application of various
statistical methods including multivariate statistical analysis in an attempt to
discover relationships within the dynamic urban system.
The literature on functional classification in urban geography presented in
this chapter follows this progression described above, with a focus on the
importance of understanding the roots of functional classification theory. The
chapter is divided into three sections: (1) traditional functional classifications, (2)
a guideline for functional classification analysis, and (3) multivariate statistical
analysis. The first part examines the foundation of functional classification
through the original architects of the discipline. The second section sets the
framework for a more scientific and replicable methodological design in city
classification. The final portion of the chapter discusses more recent

13
classifications accomplished with the application of multivariate statistical
analysis approaches including regression, factor analysis, and cluster analysis.
Traditional Functional Classifications
The idea that cities differ in function has long been understood, dating
back to the earliest time of city development Chauncy Harris’ (1943) A
Functional Classification o f Cities in the United States was the first to classify
cities in the U.S. by economic functions. This classification started a whole new
wave of urban geography in the mid 20th century. Many geographers used his
model as a base for future attempts at classifying and discovering spatial
distribution. Harris studied 1930 census data, including occupation and
employment figures. His classification included 984 cities of 25,000 or more
people and was based upon the activity of greatest importance in each city (see
Figure 3). Harris used the employment figures as the principal basis for
classification chart, while the occupation figures were used to supplement the
interpretation. Arbitrary class breaks of 74%, 60%, 50%, and 25% were used.
Harris then mapped the location of the cities
based on the category he calculated. He
concluded that the central-location theory was
exemplified by wholesale centers, and retail
centers. Mining and resort centers are based
heavily on materials or climate. Industrial cities Figure3: Functional classes used byChauncy Harris (1943)
Manufacturing Cities M ’ Subtype Manufacturing Cities M Subtype Retail Centers (R)Diversified Cities (D)Wholesale Centers (W) Transportation Centers (T) Mining Towns (S)University Towns (E)Resort and Retirement Towns (X )

14
have both location factors related to markets and raw materials. The
manufacturing belt was shown by the influence of power and labor supply.
(Harris 1943) The lasting impact of this article was that Harris attempted to
create a quantitative model that could be replicated in the future. He was able to
show a spatial pattern existed with his results, which led to further studies by
other geographers.
Howard Nelson published A Service Classification of American Cities, in
1955. Nelson used employment data in 24 industry groups for 897 urban
concentrations of 10,000 or more people. The data were then arbitrarily grouped
into nine major categories of service functions. For each industry group, the
average proportion of the labor force engaged in that activity was determined.
Most cities didn’t have average employment in a given industry; therefore, a
variation from the mean existed. This was done because Nelson wanted to
create a classification based on clearly stated statistical procedures. Nelson
used a more statistical method than his predecessors - standard deviation. He
used standard deviation to establish degrees of functional specialization in a
given industry group. Nelson calculated three standard deviations above the
mean of each industry group, since he was specifically concerned with higher
levels of employment. This would allow for a degree of emphasis inside the
overall functional specialization in a city. This research discovered many
instances of geographical patterns. Manufacturing was the most common of all
functions, with more than 1/5 of the 897 cities, and was located in the traditional

15
manufacturing belt of the country. (Nelson 1955) Retail trade tended to be
located more in the central portion of the country, and wasn’t present in the
region dominated by manufacturing. Nelson’s method was a multi-functional
approach, which is a stronger method of measuring economic levels than a
simple dominant classification.
A landmark article was written by Chauncy Harris and Edward Ullman in
1945 titled The Nature of Cities. The focus is on the support and internal
structure of cities. The concept emphasizing that the services the city provides
are based upon its hinterland. The service by which the city earns its livelihood
depends on the nature of the economy of the surrounding area. The land must
produce a surplus in order to support cities. This does not necessarily mean that
every city needs to be encompassed by a productive land, since a strategic
location may be more important. Three categories of support are discussed by
Harris & Ullman: (1) cities as central places, (2) transport cities, and (3)
specialized function cities. The first category describes cities as central places
performing comprehensive services for a surrounding area. Such cities tend to
have an even spatial distribution throughout a productive area (Figure 4a). This
is a common occurrence in the study area for this thesis, particularly in the state
of Iowa. Transport cities tend to perform break of bulk and other services along
major transportation routes including rail lines, roads, and seaways (Figure 4b).
These cities are often found in linear patterns because other smaller cities play a
supporting role along the transportation route. Specialized function cities perform

16
one service such as mining, manufacturing, or
recreation for large areas, and include several smaller
cities in the immediate surrounding area that support
the dominant function (Figure 4c). Commonly, cities are
a combination (see Figure 4d) of the above mentioned
factors with the relative importance varying from
location to location. (Harris and Ullman 1945)
Also discussed with detail were the internal
structures of cities including the concentric zone theory,
sector theory, and the multiple nuclei concept. The
importance of this article is that Harris and Ullman are
providing a strong base for further research in urban
geography, within a theoretical framework prescribed in
their research. (Harris and Ullman 1945)
A look into small towns was conducted by John
Brush in 1953 with The Hierarchy of Central Places in
Southwestern Wisconsin. This article examines the
importance of population on the ability to develop larger
trade areas. The influence and character of central
places were examined. Locational patterns developed
by C.J Galpin (1915), J.H Kolb (1946), and Christaller
(1933) are examined. Also, the traffic flow as an
Cities by Support
* ♦ * #
* • •
# * *
Figure 4a: Central Places
Figure 4b: Transport Cities
Figure 4c: Specialized Function Cities
Figure 4d:Comprehensive functional cities

17
influencing factor was mapped. Brush presents a solid application of central
place theory on small towns in Wisconsin. (Brush 1953)
Basic Concepts in the Analysis o f Small Urban Centers o f Minnesota in
1959 by John W. Webb examined the functional characteristics of cities using a
different methodology than previous geographers. Webb endorsed the standard
deviation method use by Howard Nelson (1955), L.L Powell (1953), and
Steigenga (1955) as a valid method of measuring specialization of service
functions. (Webb 1959)
Webb created a method that would account for a function’s importance to
a city relative to other cities. “The functional index,” where the percentage of the
employed population in a function is divided by the mean employment in all the
towns. Using the U.S. Census data of 1950, Webb created seven categories of
functions and calculated the functional index for each category of towns with
population 2,500-10,000, and also for populations 10,000-50,000. Webb also
attempted to create a system of measuring a town’s level of specialization or the
“specialization index.” Webb concluded by calling for more research on smaller
towns to be embarked upon in the future. (Webb 1959)
Functions and Occupational Structure o f Cities o f the American South, by
John Fraser Hart in 1955 is a functional classification system based upon Harris’
design of 1943. The purpose of the study was threefold: (1) to discover cities
whose function has changed since 1930, (2) to classify cities which have passed
the 10,000 population mark since 1930, and (3) analyze the distribution, size,

18
and occupational structure of cities within each functional category. The
geographic area examined is the U.S. Census’ definition of the South. (Hart
1955)
Hart’s study was based primarily on occupational data for the cities over
10,000 in population. This method leads to a mutually exclusive classification
based on the function of the city in terms of the people who live there and what
they do (similar to what is pursued in this thesis). Hart calculated the industry
data for the cities and determine the minimal, quartile, median, and upper decile
percentage for each age group. Manufacturing, retail trade, and personal
services were found to be the dominant functional service of cities in the south.
(Hart 1955)
An examination of small towns was undertaken in an article by Howard
Stafford in 1963 titled The Functional Bases o f Small Towns. Stafford claims that
theories developed for central places should hold true for the whole spectrum of
city size, from the largest to the smallest. The purpose of Stafford’s study was to
determine the functional bases for small towns in southern Illinois and compare
the results with similar studies throughout the region. His research was based on
Thomas’ Iowa study where data are attained for each town and values are
calculated for (1) total number of establishments, (2) total number of functions,
and (3) total number of functional units. (Thomas 1960) Stafford confirmed what
was generally understood that a relationship existed between population and the
three indices by applying simple correlation and regression analysis. The final

19
results of this study found that most towns were service centers. This was
consistent to what Berry and Garrison (Berry and Garrison 1958) discovered
since small towns simply do not have sufficient threshold populations or large
enough trade areas to support a specialized function. Stafford concludes that a
whole possible realm of research could be investigated by comparing the results
from many regions around the country in an attempt to create generalizations
with regards to economic functions in small towns. (Stafford 1963)
Howard Nelson followed up his classification of cities in the United States
in 1955 with an article titled Some Characteristics o f the Population of Cities in
Similar Service Classifications in 1957. With regards to concerns over the
relevance of classifications as simply a reference tool, Nelson claimed that
classifications should be utilized for further and more in-depth analysis of the
urban configuration. Analyses have been made of population change, education,
age, and labor force, but the main focus of Nelson’s research is to investigate
possible relationships amongst different functions. Nelson simply used the
classifications of U.S. cities as a basis for the study. (Nelson 1957)
It was evident through the research that variations in economic and social
qualities of American cities are related to the function or service classes to which
a city belongs. Nelson found that variations in the rate of change in population in
the 1940 to 1950 decade were strongly affected by a city’s leading function. One
example of this is that the population in cities classified under personal service
and professional service are increasing by more than twice the typical rate.

20
Contrast that with the population change in manufacturing where little to no
growth had occurred. (Nelson 1957)
Nelson also addressed the effects of regional location on social and
economic characteristics. The regional averages of population increase,
education, female labor force, male labor force, age, unemployment, and
average earnings were examined for the geographic regions of the Northeast,
North Central, South, and West. Nelson concluded that this research indicated a
relationship between the service class and regional location on the
characteristics of a city. According to the research, the characteristics of a region
generally affected people of all classes, ages, and gender. (Nelson 1957)
A Guideline for Functional Classification Analysis
The purpose of functional classifications is to identify the spatial
regularities in the distribution and structure or urban functions. Unfortunately,
according to Roberts H. T. Smith’s Method and Purpose in Functional Town
Classification, most studies lack a clear and specific objective. Most
classifications created ended up being ends to themselves instead of a
springboard for future research. Geographers also seem to be satisfied to simply
report their findings in broad geographic terms. The overwhelming majority of
classifications were be created by urban geographers in order to develop a new
methodology and simply display their results, rather than conducting a more
detailed analysis of the data. The primary purpose of Smith’s article is to review

21
several classification methods developed in the mid 20th century and point out
flaws and offer a blueprint on how to effectively conduct scientific research.
(Smith 1965)
The classification procedure that is used should produce groups of towns
about which the greatest number, most precise, and most important statements
can be made concerning differentiating and accessory characteristics.
Furthermore, to be justified on other than pedagogic grounds, any classification
should be relevant to a well defined problem. As a result, when towns are
classified according to function (the differentiating characteristic), we not only
want to say something about the function or combination of functions typical of
that group; knowledge of membership in any one group should automatically
carry with it knowledge of additional characteristics of the towns in that group.
Smith claims it is not difficult to deduce that there are at least two spatial
characteristics associated with town functions. First, since there is some spatial
order to the distribution of economic activities in general, we can then expect to
find distributional characteristics of towns in similar functional classes that are
abnormal to those classes. Second, given the notion that function implies a
relationship between a town and its hinterland, different functional classes should
be connected with different forms of hinterland areas. (Smith 1965) With this
thought process, classification of towns by function may lead to the formalization
of generalizations about location patterns of towns and the relationships between

22
towns with particular functions and their hinterlands, which is the essence of this
thesis.
Multivariate Statistical Analysis
Hart and Salisbury’s (1965) Population Change in Middle Western
Villages: A Statistical Approach analyzed population trends in villages (places
with incorporated status and populations less than 1,000 persons outside large
urban areas) in 1960 for a nine state area of the Midwest. It discusses the
process of regression analysis and the manipulation of data to obtain a linear
relationship between the dependent (percentage of population change) and
independent variables and the need for each variable to have a normal
distribution. Scattergrams are used to help identify linear or non-linear
relationships between variables. Data that do not conform to a normal
distribution should be normalized by use of logarithms or square roots. Upon
completion of the regression analysis, the residuals of regression (villages lying
outside the standard error band of the line of regression) were then mapped and
eventually analyzed by their distance from major population centers, which
became another independent variable in the analysis. (Hart and Salisbury 1965)
Hart and Salisbury’s research supports the idea that patterns of village
growth are too complex to be satisfactorily explained by any simple set of
statistical variables. Hart and Salisbury provide a strong argument for the

23
implementation of multivariate statistical analysis in urban geography, particularly
when examining population change.
Another article discussing the statistical approach was What is a Central
City in the United States? Applying a Statistical Technique for Developing
Taxonomies in 1998 by Edward Hill, John Brennan and Harold Wolman. This
article included a detailed outline of the methodological design using cluster
analysis to group cities in the United States. The purpose of the article was to
create and discuss a methodological design using cluster analysis to group U.S.
central cities, and then employ discriminant analysis to ascertain a statistical
based validity for the groups. Overall, the article provides a solid framework by
discussing a highly technical step-by-step application of multivariate statistical
analysis including several charts and graphs describing the results. (Hill et al.
1998)
The most recent study on functional classifications was conducted by
Robert Freestone, Peter Murphy, and Alan Jenner in 2003 titled The Functions of
Australian Towns, Revisited. This inter-temporal research aimed to create a
contemporary classification of towns in Australia using principal components
analysis and cluster analysis. This article argued for continued classification of
urban areas because functionality does change over time, and through their
research, several changes had occurred since the last classification in 1965.
This article will be used as justification for this thesis project. (Freestone et al.
2003)

24
Factor analysis using varimax rotation has been commonly used in
classification research because of the ability to identify the underlying structure of
complex data sets. However, in the study conducted by Freestone et al., a clear-
cut principal components analysis (PCA) with varimax rotation was selected.
PCA has the ability to “provide an informative, low dimensional representation of
the data” (Boloton and Krzanowski, 1999). PCA was primarily used in their study
as an intermediate step towards cluster analysis. (Freestone et al. 2003)
Cluster analysis techniques have become more prominent in taxonomic
studies. Freestone, et al, chose Ward’s Method because it had been used in
other comparable studies. An advantage of using Ward’s Method is not having
fixed entries where cases cannot be removed from a cluster even though the
cluster structure may change with each new case being introduced. (Freestone
et al. 2003).
The data used were inclusive of all recognized urban centers using the
1996 census data from the Australian Bureau of Statistics (ABS). The data
contained twelve 1-digit Australian and New Zealand Standard Industry
Classification codes for all 741 cities with a minimum population of 1,000 people.
The results of the research led to an updated economic classification of
Australian urban places. (Freestone et al. 2003).
Through cluster analysis, there were found to be thirteen distinct
groupings of urban places in Australia based on economic factors. A comparison
to Smith’s (1965) classification showed many notable differences including the

25
increase in overall population, the increase in the number of cities, and the
increased functional diversification of cities, among others. It was noted that
comparisons could indeed be made even though variations in methodologies
existed between the classifications conducted by Smith and Freestone, et al.
(Freestone et al. 2003)
Summary of Literature
Although the time-scale of urban geography is relatively short, the
development of methodological techniques and conceptual blueprints as regards
to how to generalize and understand the geographic relationships cities have
with one another is quite astonishing. Harris, Ullman, Nelson, and Hart set the
framework of functional classification as the original architects of the discipline.
Smith developed a methodological outline for a more scientific and replicable
methodological design in city classifications for the future. More recent
applications of multivariate statistical analysis created other avenues for scientific
inquiry to be obtained.
Over time, many geographers made attempts to be more objective, and
this led to several different methods being developed. However, no one method
has proven to be completely satisfactory, as all are trying to rationalize an
extremely complex and dynamic system. With this in mind, an attempt to better
understand the dynamic relationships both vertical (function) and horizontal
(countryside relationships) that make up the true functionality of a city is

26
exceptionally challenging. Therefore, the necessity of understanding the
foundation of functional classification theory and methodology is critical to the
urban geographer when undertaking the complex and diverse project of creating
a taxonomy and attempting to find subsequent relationships. .With these
thoughts in mind, this study continues with a discussion of the methodology
developed and utilized to answer the questions posed by this thesis

27
Chapter 3
Methodology
In discussing the role of geography within the scope of academic
research, Haring, Lounsbury, and Frazier state that “geography is the branch
largely concerned with the attainment of spatial knowledge, and is also
concerned with the identification, analysis, and interpretation of spatial
distributions of phenomena and their locational relationships as they occur on the
planet” (Haring et al. 1992, 5). The purpose of functional classifications is to
identify the spatial regularities in the distribution and structure or urban functions,
and this is consistent with the accepted role of geography in academia. The
steps explained in this chapter are in line with the two primary objectives for this
thesis: 1) To create, a contemporary taxonomy of the small urban places
(population 2,500-10,000) in the study area using a standard classification
method for urban geography. 2) To discover and explain the spatial distribution of
the dominant economic functions of small cities in the study area.
The chapter follows the steps shown in the methodological model as seen
in Figure 5. These stages include the acquisition of data, database organization,
and evaluation of the data by creating a modern taxonomy and applying nearest
neighbor analysis in order to establish spatial distribution patterns. The process
was partially adapted from previous functional classifications in urban geography
with minor alterations in classes.

28
Methodological Design
FunctionalClassification
Nearest Neighbor Analysis
DatabaseAssembly
Data Evaluation
SpatialRelationships
Data Acquisition
Conclusions
Figure 5: Methodological model applied to the study.

29
Data Characteristics and Acquisition
Industry data obtained from the 2000 U.S. Census was used for this thesis
project. “A common assumption in functional town classification is that the city’s
labor force is the best single indicator of the structure of the urban economy”
(Yeates and Garner 1980, 97). Going with tradition, the data used will be based
on the industry of working population in each small urban place in the study area.
Other geographical classification studies have also used the industrial census
data (Harris, 1943; Webb, 1959; Nelson, 1955, Hart, 1955, Freestone et al.,
2003). The data set was obtained in electronic form via the U.S. Census Bureau
online at http://www.census.gov. Information was only collected for cities with
populations between 2,500 and 10,000 were collected. The data contained the
number of employed persons in each urban place, and are divided into 13 major
categories. The data were then broken down into more specific industries on
several occasions (see Table 2).
1 INDUSTRY EM PLO YED A ckley ,Io w a
A ckw orth ,Io w a
A d a ir,Io w a
11
2 Total 793 40 3933 Male: 43D 21 196 -4 Agriculture, forestry, fishing and hunting, and mining: 38 3 205 Agriculture, forestry, fishinq and hunting 38 3 20
*Mining □ □ 0
Construction 42 2 36 ■■■H . Manufacturing ........ ......................... ......... 112 7 34y W holesale trade ............................... 31 0 2213 Retail trade 51 E 13
| :11 Transportation and"warehousing, and utilities: □12
i11aci □ .13 Utilities 014 Information 015 F'nance, insuranceI Tedl estdfd add rehfdl and leSdihq' 016 Finance and insurance □17 ReaT estate and rental and Teasing □13 Professional, scientific, m anagement, administrative, and w aste management services: 20 □13 Professional, scientific, arid technical services 15 02U Management of companies and enterprises 0 o ::2122
Administrative and support a n d ’wasfa management services 5 oEducational, health'and social services: .4 8 3 24
S i Educational services3-r —
0 2'24 Health care and social assistance 15 325 y i i I I 16 10
Arts, entertainment, and recreation 2 o2 / Accommodation arid food services 14 in28 Either services (except public administration) 1329 Public administration 14JJ
H < ► w \s h e ir l 1 / Sheet? / S1*et3 J \ * ) j ►JrTable 2: The census data acquired breaks into 13 main categories, as are the sub-categories. The data included both male and female employment figures listed separately. Only the male data are shown here.

30
Database Organization
A vital and often times overlooked component of a thesis is the
organization of data so an effective and accurate assessment can be completed.
The initial step taken to accomplish the first objective was to group the 13
industrial categories into services classes for the new taxonomy. Using previous
models (Harris 1943 and Nelson 1955) and with consultation of the thesis
committee, eleven classes were chosen for this study (see Table 3). The
employment by industry data from the census is by place of residence, not place
of work. It is important to note the omission of agriculture, forestry, fishing and
hunting in this classification since these people are most likely performing
activities in the countryside, and this would not be considered an economic
function of the city. Also, the combination of educational, health and social
services with professional scientific, management, administrative and waste
management services was done because these occupations are considered to
be "professional" in nature.
Census Classification by Industry Groups Thesis Taxonomy Symbol
Agriculture, forestry, fishing and hunting.................................................................. ... OmittedMining................................................................................................................................ .. Mining MiConstruction.................................................................................................................... ... Construction cManufacturing................................................................................................................. .. Manufacturing MfWholesale trade.............................................................................................................. .. Wholesale WRetail trade...................................................................................................................... .. Retail RTransportation and warehousing, and utilities........................................................ .. Transportation TInformation...................................................................................................................... .. Information Technology IFinance, insurance, real estate and rental and leasing....................................... .. Finance FProfessional, scientific, management, administrative & waste management.. .. Professional Service PfEducational, health and social services:................................................................... .. Professional Service PfArts, entertainment, recreation, accommodation and food services.................. .. Personal Service PsOther services (except public administration)......................................................... .. Personal Service PsPublic administration..................................................................................................... Public Administration Pa
Table 3: The service classes for the taxonomy are shown on the right and the U.S census industry erouDS from which the data were collected are on the left.

31
Of the 280 cities in the study area, many were in close proximity of
Metropolitan Statistical Areas (MSAs). Within the study area there were 18
MSAs including Omaha, Sioux City, Waterloo-Cedar Falls, Dubuque, Cedar
Rapids, Davenport, Iowa City, Des Moines, Duluth-Superior, St. Cloud,
Minneapolis-St. Paul, Rochester, Fargo-Moorhead, Grand Forks, Lincoln,
Bismarck, Sioux Falls and Rapid City, (see Figure 7) To alleviate the influence of
these larger cities, all cities within the 2,500 to 10,000 population range that were
contained within contiguous urbanized area of the MSA cities were excluded
from the study. This led to a subtraction of 49 cities mostly in the Minneapolis-St.
Paul metropolitan area (see Figure 8). The remaining 231 cities were then
organized by the number of employed persons for each of the eleven classes
(see APPENDIX A for cities sorted by population, and APPENDIX B for cities
sorted alphabetically).
Metropolitan Statistical Areas: Cities Over 50,000 People
Omal
Figure 7: The MSA cities within the thesis study area.

32
Urban Places Removed
Figure 8: The 49 cities removed from the study because of their location inside of the contiguous area o f a MSA city. (34 in MN, 10 in IA, 3 in SD, 2 in NE, 0 in ND)
Creating the Taxonomy
Various methods have been developed and tested throughout the past
century, and no single method has been determined to be the best. When
determining a method to use for this thesis, it is important to consider the overall
objectives of the study. The purpose of this classification is to compare the
economic functions of towns within the specified population range in one
particular geographic region. With this in mind, the standard deviation method
developed by Howard Nelson provides an approach that works well for this study
because the degrees of variation lead to a classification of multi-functionality and
gives a solid relative comparison of these cities. Furthermore, for the purpose of

33
creating a classification that is both understandable and replicable, the standard
deviation method works well.
Standard deviations from the mean of each function were calculated for
each of the eleven categories. There are three degrees of variation from the
average following the standard deviation breaks. Subjective selection of class
breaks has been eliminated by the implementation of an accepted statistical tool
such as standard deviation. With regards to the taxonomy, any city over +1 SD
from the mean value in manufacturing will be given a Mf1 rating. Over +2 SD’s
receives a Mf2 rating and + 3 SD or more gets a Mf3 rating. This approach
delivers a simple rating that is easily understood. The biased formula for
standard deviation was used for this study:
l i e * - ) a
Where: X - Sample arithmetic mean
n - Sample size
Xi = ith Observation of the variable X
23^ = Summation of all X{ values in the samplei- 1
When applied to the 231 remaining cities in the study area, the method
described is not mutually exclusive because there is a possibility that a city can
exceed the requirements (i.e., + 1SD or more) in more than one service category.

34
There is also a possibility that some cities will not rank high enough in any of the
eleven service categories. These cities are placed into a “diversified” group in
the taxonomy, thus the classification has a total of twelve categories.
Creating the Classification Maps
In order to visualize the spatial distribution within a two-dimensional
framework, the results of the classification needed to be mapped. There were
multiple methods for compiling city location data to be implemented into a GIS
mapping program. Since the cities were located within a five state area, it was
most logical to use a dataset that included all the states for consistency. ESRI, a
leading distributor of GIS software and data, provides a dataset that includes all
cities in the United States. The 231 cities in the survey were selected from the
ESRI data set using a query search in ArcGIS 9. A new shapefile was created to
be used for adding standard deviation values for mapping purposes. In order to
create the maps of economic functionality, an operation called a "join" was
completed. A join simply combines the data from two databases through a
specified field name, in this case, the city name. However, when dealing with
multiple states, often times a city name was found more than once. These
duplicate names such as Glenwood (Iowa and Minnesota) created an invalid join
because the data were combined due to the lack of a unique value for each city.
An alternate naming method was established where city names were sorted

35
alphabetically and an "ID" number was established for each city. This eliminated
any problems with duplicate city names.
Once the city location and standard deviation classification datasets were
joined together, the mapping of the twelve functions was completed. Each of the
twelve economic functions was mapped by using the query search in ArcGIS. A
query search allows for the selection of values (cities) based up the attribute
data. In this case, each city was given a value of 0. 1, 2, or 3 for each economic
function in the classification The 0 was a null value, and the 1, 2, and 3
indicated the amount of standard deviations above the mean. A visual
representation of this process is show below in Figure 9.
$ tp * © m » ^□ & u a : jt % §ax io « j<+> fu&mJi 3 ;J? n o *?
$ h«|
JE □ Manufacturing
B □ Transportation
E3 O ConsdueSao
0 O WhdeKfe G S3
S 2 g g g B j
l i _ J
li •*; /
;h r —j. * ' *•. . Jt)
if " • ’I M< It - V-
J Selected Attribu tes ol 2 3 1 Cities —. l O f x i
j IOC NT j UKBAN PLAC j ST_1 J 28M.POP Mi M M l W j R T 1 f PC PSiRA♦ 16 tHie- Fourcbe ;4 £65 2 | l 0 0 1 P 0 9 0 1 0
34 Csnion :5D 3110 0 1 0 0 1 0 0 1 0 0 0165 ffetfliew SD 2897 0 0 0 a t 0 0 0 1 0 3182 Spearfirh St> <JE0& 0 11 0 0 1 0 0 0 0 2 0193 Slbrgis SO 6442 1 0 0 a i 0 0 0 tl 1 0226 wsmer ;S» 3137 0 9 0 o H 0 0 9 0 1 0
7222 0 <1 0 0 1 0 0 0 0 1 0125.M4X4AFB ND 7699 0 <1 0 a 1 :0 0 0 2 0 238 Chadron NE 5634 0 u 0 0 2 C 0 0 1 0 020;B«woo MN 3376 0 0 0 0 1 if u 3 3 & 0
147 Ogatela ;nc 4939 0 0 0 a 12 0 0 0 0 f> 0
< if*Recod n | < | _J0 JMJ At jH>H°c1pd %Ssxxds (32 out ol 231 Selected} 0p*icn-
Figure 9: Example of selecting cities in ArcGIS 9 based on Standard Deviation values in Retail Trade.

36
Nearest Neighbor Analysis
Essentially geography is concerned with distributions in space and one the
most important distributions the geographer has to consider is that of human
settlement. A primary objective of many geographic studies that begin with
locations of a variable on a dot map is to determine the form of the pattern of
points. The nature of the point pattern can reveal information about the process
that produced the geographic results. (McGrew and Monroe 1993) General
descriptions have been used in previous functional classifications that include
described patterns as "dense" or "sparse." Devising a more precise
mathematical description of areal distributions is needed to produce objective
results. (Hammond and McCullagh 1975)
Urban geographers are interested in using a method of analysis that
discerns objectively between clustered and dispersed spatial distributions, and
also distinguishes between degrees of clustering or dispersal. (Yeates 1974)
Nearest Neighbor Analysis is a common procedure for determining the spatial
arrangement of a pattern of points within a study area. The distance of each
point to its closest neighbor is measured, and the average nearest neighbor
distance for all points is determined. This method quantitatively defines a scale
which measures the degree of departure of an observed spatial distribution from
a theoretical random distribution. (Silk 1979) The maximum departure at one
end of the scale is absolute clustering, where all points are at the same place.
The other end is absolute uniformity, where all points are equidistant from other

37
points. Basically, there are three benchmarks: absolute clustering, absolute
randomness, and absolute dispersal. The index ranges from 0, indicating
clustering, to 2.15, indicating maximum dispersion. The index value, normally
written as R, is calculated by dividing the measured mean distance between
neaiest neighbor points in a given area, by the mean distance to be expected
from a similar number of points randomly distributed in the same area.
(Hammond & McCullagh 1975)
Nearest Neighbor Analys s was performed on each economic function of
the classification using a Visual Basic application in ArcGIS (Sawada 2002) The
program performed basic Nearest Neighbor Analysis (Clark and Evans 1954)
and provided summary statistics of the point distribution for each function. An
example output of the application for construction is shown below in Figure 10.
o r
f i t (p t yen Insnt ifciecuan I « * jvrdow
i r Vertonia'.ion * S5t If? R *ta r£ lM n up * - J C«8Sel»'t«e * >S3 '■%_ ’u
c^a/sSi % 8 X i n pTo,1% S72 . u :|:2. a v? » a lia iA n ^ s t - .. * i
ts te c * j *• 6 * ‘ P :■ " • ] : r “ 3 x o 1 £ 3 : a ;| m * ■?& i a £3 ® e : 4m € t t t i O # 4 » ;
fe * Layers□ Export jCUtpUt
■s □ Mring selection « □ 231 jObes
- 0 E585g§3♦- □
3 C l France
& □ MWng ♦
3 D Manufacturing •
5 Q lr/oT«ch46 D flcwoMlJjerv
- □ Prof_Serv
- O PubtcAdfnin♦3 □•
.5? D Tiansixrtatiwi 4S. Q Variesate4
& 0 studyn
PfepjeyJ " S ^ c e j Sefecbonj
Construction ____ » !
ftxnda ry in wrbidi to taiculaca the rxiex^ “ 3 1• f jt Chass* to P&u&xr- u r t -------- •{
a?* it*&jFer Szx Show extent as a graph*
I & pofcrgon ^ boundary C* none
r * Add cbtances & OTDs to feature table?
I r.~il OototeSfaohics jResi>s..............VARIABLE CORRECTED NN Index .87189 Z 1,31106Avg.dbt. 76614.06062 Exp. art}. 90164.79545 SD G610.26774Area. 9525925939? Perm. 4606455.343#p U . 35
,531573614,0608262487,773727260,3164952592533804.!4606455.34335
Add&Oo«n? Save ResultsAboUt One
*174.25 1880.04 Mes
Figure 10: Example output of the Nearest Neighbor Application in ArcGIS 9.

38
Chapter Summary
Once again, the primary focus of creating a functional classification is to
identify the spatial relationships and the distribution of specific urban functions.
This chapter followed the methodological model formulated around the two
objectives of the thesis. The process was adapted from previous functional
classifications within the accepted framework of urban geography.
Staying consistent with previous studies concerning functional
classifications, the occupational data obtained from the 2000 U.S. Census was
used. Only cities with populations between 2,500 and 10,000, and not contained
within the contiguous urbanized area of a MSA city, were collected.
When determining a method to use for this thesis, it is important to
consider the overall objectives of the study. The purpose of this classification is
to compare the economic functions of towns within the specified population range
in one particular geographic region and to discover spatial relationships. The
standard deviation method developed provides an approach that allows a multi
functional classification, and provides a firm relative assessment of these cities.
The mapping of the classification by economic functions provides a unique
insight of the spatial distribution of the cities. Nearest Neighbor analysis is a
valid statistical tool for determining spatial distribution in a two-dimensional
space.

39
Chapter 4
Analysis of Results
In this chapter an explanation is given for the results of the functional
classification. The first step is to present details of the descriptive statistics for
this study and make comparisons with previous studies. The second section
includes a detailed discussion of the spatial distribution of each service class
within the new functional classification. The final segment is dedicated to the
exploration of nearest neighbor analysis results.
Descriptive Statistics
The purpose of this classification is to compare the economic functions of
towns within the specified population range in one particular geographic region.
Keeping this in mind, the standard deviation method provides an approach that
works well for this study because the degrees of variation lead to a classification
of multi-functionality and gives a solid relative comparison of these cities.
Standard deviations from the mean of each function were calculated for
each of the eleven categories. There are three degrees of variation from the
average following the standard deviation breaks. With regards to the new
taxonomy, any city over +1 SD from the mean value in mining will be given a Mil
rating, +2 SD’s receives a Mi2 rating, and + 3 SD or more gets a Mi3 rating. This
approach delivers a simple rating that is easily understood.

40
The five state study area provided 231 cities of population 2,500 to 10,000
that were not contained within the contiguous area of city with a population of at
least 50,000. There were 91 cities in Minnesota, 84 in Iowa, 31 in Nebraska, 17
in South Dakota, and 8 in North Dakota. The average population for the cities in
the study area was 4,829.6, and the average employment per city was 2,334.8.
Standard deviations from the mean were calculated for each of the eleven
categories as discussed in detail in chapter 3. The results are shown below in
Table 4. When examining the averages per function, several numbers stick out
including the rather high portion of people engaged in professional service
industries and manufacturing, and to some extent personal service. The
importance of services that provide for the needs of the surrounding countryside
is quite evident when reviewing the results.
Several intriguing similarities and differences can be found while
comparing the average employment per function in this classification with
previous studies conducted by Nelson (1955), Atchley (1967), and Webb (1959).
Function Symbol Mean (%) SD (%) +1 SD (%) +2 SD (%) +3 SD (%)
Mining Mi 0.54 2.01 2.55 4.56 6.57
Construction C 6.41 2.20 8.61 10.81 13.01
Manufacturing Mf 17.49 8.32 25.81 34.13 42.45
Wholesale W 3.14 1.73 4.87 6.6 8.33
Retail R 12.76 2.84 15.6 18.44 21.28
Transportation T 4.81 2.78 7.59 10.37 13.15
Information Technology I 2.20 1.18 3.38 4.56 5.74
Finance F 5.17 2.87 8.04 10.91 13.78
Professional Service Pf 28.76 5.57 34.33 39.9 45.47
Personal Service Ps 12.25 4.0 16.25 20.25 24.25
Public Administration Pa 4.11 2.85 6.96 9.81 12.66
Table 4: Mean and Standard Deviation values for each function.

41
Most of the functions were relatively consistent, especially public administration,
which was between four and five percent in each of the four studies.
Manufacturing in this study was similar to Webb, but much less than the national
studies by Nelson and Atchley. Professional Service industries made up an
average of almost 29 percent in this study, compared to 11 percent (Nelson),
14.7 percent (Atchley), and 16.9 percent (Webb).
Functional Classification
The creation of a modern functional classification of small towns is the
primary objective of the thesis. The cities were classified using the standard
deviation results for the eleven economic classes. Of the 231 cities, 45 did not
meet the criteria established to be +1 SD in any of the eleven functions. These
45 cities are grouped together in the diversified group, meaning that they are not
unusually high in any single function. There were 107 cities that qualified with
only one function, 63 cities had two functions at least +1 SD, 14 cities reached
three functions, and two cities actually had four functions of at least +1 SD or
above (Belle Fourche, SD and Elkhorn, NE). Cities located in North and South
Dakota had a high degree of multi-functionality. In fact, 22 of the 25 (88%) cities
within those two states had at least two functions with a minimum of +1 SD. The
opposite was true in Iowa, where only 23 of the 84 (27%) cities had multi
functionality. The complete results of the taxonomy are located in APPENDIX C.

42
City Classification Spatial Distribution
With the second objective in mind, the following section includes a
detailed discussion of the spatial distribution for each of the eleven service
functions, plus diversified cities Focus will be placed on the explanation of site
and situation, and other possible factors that could explain the reasoning for
nclusion within a particular function. The location of the 231 cities in the study
area is shown below in Figure 11. Notice the relatively even dispersion within the
corn belt of Iowa and Minnesota and the general bareness in the Dakotas and
the sand hills of Nebraska.
231 Study Area Cities: Population 2,500 - 10,000
Figure 11: 231 cities in the study area not contained within the contiguous are of a MSA city.
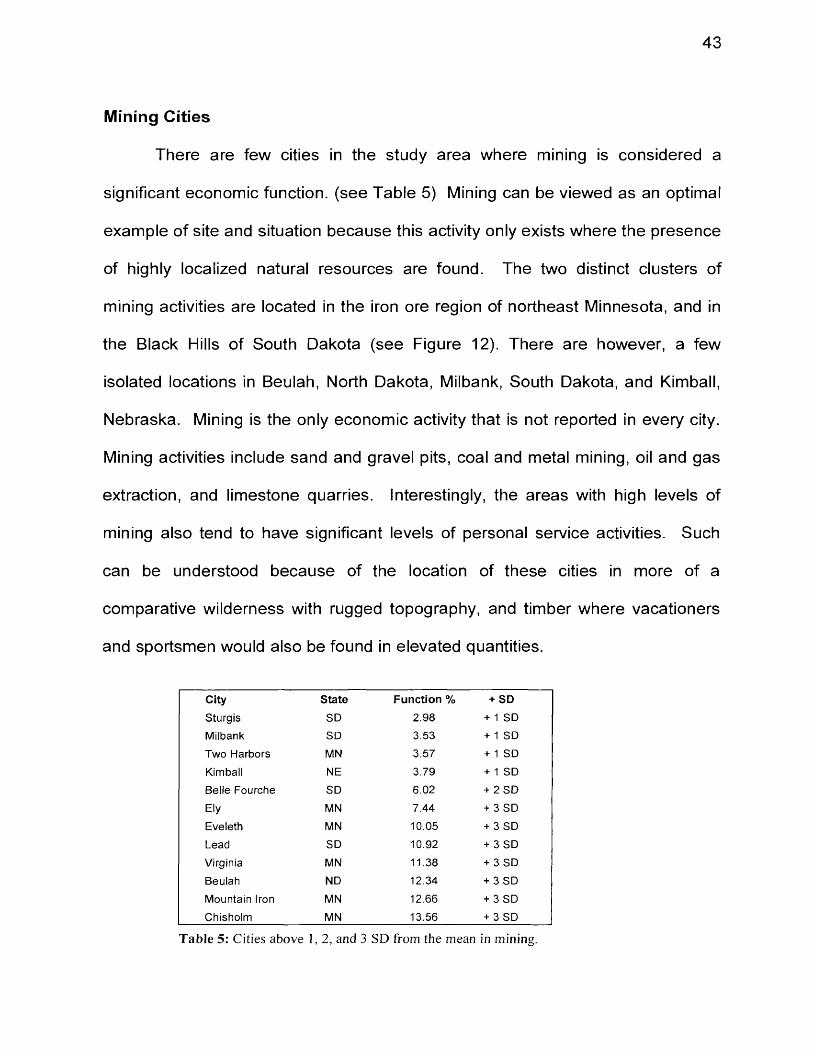
43
Mining Cities
There are few cities in the study area where mining is considered a
significant economic function, (see Table 5) Mining can be viewed as an optimal
example of site and situation because this activity only exists where the presence
of highly localized natural resources are found. The two distinct clusters of
mining activities are located in the iron ore region of northeast Minnesota, and in
the Black Hills of South Dakota (see Figure 12). There are however, a few
isolated locations in Beulah, North Dakota, Milbank, South Dakota, and Kimball,
Nebraska. Mining is the only economic activity that is not reported in every city.
Mining activities include sand and gravel pits, coal and metal mining, oil and gas
extraction, and limestone quarries. Interestingly, the areas with high levels of
mining also tend to have significant levels of personal service activities. Such
can be understood because of the location of these cities in more of a
comparative wilderness with rugged topography, and timber where vacationers
and sportsmen would also be found in elevated quantities.
City State Function % + SD
Sturgis SD 2.98 + 1 SD
Milbank SD 3.53 + 1 SD
Two Harbors MN 3.57 + 1 SD
Kimball NE 3.79 + 1 SD
Belle Fourche SD 6.02 + 2 S D
Ely MN 7.44 + 3 SD
Eveleth MN 10.05 + 3 SD
Lead SD 10.92 + 3 SD
Virginia MN 11.38 + 3 SD
Beulah ND 12.34 + 3 SD
Mountain Iron MN 12.66 + 3 SD
Chisholm MN 13.56 + 3 SD
Table 5: Cities above 1, 2, and 3 SD from the mean in mining.

44
Mining Cities
r~
© +3 Standard Deviations
o +2 Standard Deviations
* + 1 Standard Deviation
Figure 12: Mining cities above 1, 2, and 3 SD from the mean.

45
Construction Cities
In terms of the number of cities in a particular function, the 35 cities
classified in the construction category are second only to manufacturing (see
Table 6). The average employment of 6.4 percent is not especially high, but is
higher than six other classes. Construction cities are found to be located near
larger cities, transportation routes, or manufacturing cities (see Figure 13). There
are 16 cities in Minnesota, nine in Iowa, six in Nebraska, three in South Dakota,
and only one in North Dakota. By examining the map, there are two clusters of
construction cities around Minneapolis/St. Paul and Omaha where heavy
expansion of suburbia is occurring. There are relatively few cities in this class in
North and South Dakota, and west of the Omaha area. In Iowa there is a
reasonably even distribution of construction cities throughout the state.
City State Function % + SDValley City ND 8.56 + 1 SDGering NE 8.71 + 1 SDGrimes IA 8.84 + 1 SDSpirit Lake IA 8.89 + 1 SDElkhorn NE 8.89 + 2 SDMontgomery MN 8.90 + 3 SDForest Lake MN 8.90 + 3 SDDe Witt IA 8.97 + 3 SDPlainview MN 9.07 + 3 SDMobridge SD 9.07 + 3 SDDilworth MN 9.17 + 3 SDMaquoketa (A 9.25 + 3 SDO’Neil NE 9.31 + 1 SDBig Lake MN 9.36 + 1 SDGlenwood IA 9.43 + 1 SDCokato MN 9.51 + 1 SDCherokee IA 9.52 + 1 SDCanton SD 9.69 + 1 SD
City State Function % + SDWahoo NE 9.70 + 1 SDSt. Charles MN 9.73 + 1 SDBlair NE 9.73 + 1 SDIowa Falls IA 9.85 + 1 SDVinton IA 10.18 + 1 SDNorth Branch MN 10.29 + 1 SDMora MN 10.35 + 1 SDBelle Fourche SD 10.35 + 1 SDAlbia IA 10.65 + 1 SDGrant MN 10.68 + 1 SDBelle Plaine MN 11.08 + 2 SDBreckenridge MN 11.19 + 2 SDAnnandale MN 11.48 + 2 SDZimmerman MN 11.74 + 2 SDPiattsmouth NE 13.01 + 3 SDBecker MN 13.23 + 3 SDSt. Francis MN 15.34 + 3 SD
Table 6: Cities above 1, 2, and 3 SD from the mean in construction.

46
Construction Cities
® +3 Standard Deviations
+ 2 Standard Deviations
• + 1 Standard Deviation
Figure 13: Construction cities above 1, 2, and 3 SD from the mean.

47
Manufacturing Cities
The number of cities with significant amounts (+1 SD or more) of
manufacturing is higher than any other category. Manufacturing tends to be an
important part of the economic structure in these urban places where an average
of 17.5 percent work in the industry (see Table 7). Most of the 38 classified cities
are part of the traditional manufacturing belt that spans from the northeast coast
of the United States to roughly the middle of Minnesota and Iowa (see Figure
14). The location of manufacturing cites also has a tendency to follow major
routes of transportation such as Interstate 35 through central Iowa and
Minnesota. Schuyler, Nebraska was the only city to receive a rating of + 3 SD in
manufacturing. North and South Dakota failed to register a single city in the
category. Of the 38 cities, 24 (63%) were specialized, meaning no other
economic function was significant.
City State Function % + SDCokato MN 26.04 + 1 SDWest Point NE 26.14 + 1 SDMount Pleasant IA 26.25 + 1 SDMelrose MN 26.37 + 1 SDBelmond IA 26.61 + 2 SDOsage IA 26.68 + 3 SDHumboldt IA 26.80 + 3 SDCold Spring MN 26.92 + 3 SDBig Lake MN 27.32 + 3 SDLong Prairie MN 28.01 + 3 SDFairbury NE 28.19 + 3 SDCenterville IA 28.24 + 3 SDWilton IA 28.61 + 1 SDBelle Plaine IA 29.28 + 1 SDCamanche IA 29.37 + 1 SDLake City MN 29.64 + 1 SDGarner IA 29.78 + 1 SDWebster City IA 29.92 + 1 SDZimmerman MN 30.01 + 1 SD
City State Function % + SDCrete NE 30.13 + 1 SDNorwood Young MN 30.24 + 1 SDPella IA 30.29 + 1 SDSibley IA 30.31 + 1 SDLitchfield MN 30.46 + 1 SDMarengo IA 30.51 + 1 SDMontgomery MN 30.66 + 1 SDPrinceton MN 30.77 + 1 SDGlencoe MN 31.80 + 1 SDDenison IA 32.28 + 1 SDGoodview MN 33.13 + 1 SDCozad NE 34.02 + 1 SDWaseca MN 34.03 + 1 SDSt. James MN 34.95 + 2 SDForest City IA 35.16 + 2 SDLe Sueur MN 35.32 + 2 SDRoseau MN 36.41 + 2 S DWest Liberty IA 41.66 + 2 SDSchuyler NE 46.10 + 3 SD
Table 7: Cities above 1, 2, and 3 SD from the mean in manufacturing.

48
Manufacturing Cities
• +3 Standard Deviations
© +2 Standard Deviations
■ + 1 Standard Deviation
Figure 14: Manufacturing cities above 1, 2, and 3 SD from the mean.

49
Wholesale Trade Cities
The distribution of wholesale cities follows conventional central place
theory where the most significant places (+3 SD) are evenly spaced with smaller,
supportive cities found in between (see Figure 15). Wholesaling activities include
the sale of commodities in large quantities for retailers and the assembly and
sale of merchandise. In this region, farm equipment sales are a significant
industry of wholesale trade. These cities are generally located where specialized
forms of agricultural produce must be assembled, packaged, and marketed.
(Hart 1955) Access to transportation is also a high priority for wholesaling. Also,
there are no cities with +3 SD located within 30 miles of MSA cities. The average
amount of people working in wholesale trade is relatively small at only 3.1
percent. Even cities with a substantial amount (see Table 8) within the function
are typically multifunctional in this region.
City State Function % + SD City State Function % + SDPark Rapids MN 4.99 + 1 SD Monticello IA 5.91 + 1 SDLa Crescent MN 4.99 + 1 SD Waconia MN 5.95 + 1 SDDyersville IA 5.09 + 1 SD Goodview MN 5.96 + 1 SDElkhorn NE 5.12 + 1 SD Glenwood MN 6.40 + 1 SDWaukee IA 5.15 + 1 SD Sheldon IA 6.51 + 1 SDAdel IA 5.28 + 1 SD Chisago City MN 6.75 + 2 SDWyoming MN 5.37 + 1 SD Mountain Iron MN 7.07 + 2 SDMadison SD 5.40 + 1 SD West Union IA 7.25 + 2 SDRugby ND 5.52 + 1 SD Iowa Falls IA 8.37 + 3 SDPleasant Hill IA 5.55 + 1 SD Milbank SD 8.40 + 3 SDWadena MN 5.62 + 1 SD O’Neil NE 8.80 + 3 SDDilworth MN 5.69 + 1 SD Harlan IA 10.24 + 3 SDCannon Falls MN 5.69 + 1 SD Chariton IA 14.20 + 3 SDVictoria MN 5.90 + 1 SD
Table 8: Cities above 1, 2, and 3 SD from the mean in wholesale trade.

50
Wholesale Trade Cit es
" M '
+ 3 Standard Deviations
© +2 Standard Deviations
• + 1 Standard Deviation
Figure 15: Wholesale Trade cities above 1, 2, and 3 SD from the mean.

51
Retail Trade Centers
One of the most dispersed functions in the classification are the retail
trade cities. These small urban places are responsible for providing goods to the
surrounding agricultural population. It could be said that these cities are the
backbone of rural America, particularly in this particular region of the country.
Cities average 12.76 percent of the workforces in this category. Within the study
area, half of the retail cities are specialized due to the high level of employment
in this function, (see Table 8). In the Black Hills region, cities are providing
merchandise targeting the tourist flow (see Figure 16). Waite Park, Minnesota,
just west of Minneapolis is a large shopping area. Sidney Nebraska, with an
incredible 29.06 percent engaged in retail trade, is home to sportsmen's
superstore Cabela's. Other locations are more dispersed and far away from
larger cities, signifying their role in supplying the hinterland.
City State Function % + SD
Eveleth MN 15.63 + 1 SDMonticello MN 15.74 + 1 SDTipton IA 15.75 + 1 SDSpearfish SD 15.76 + 1 SDJordan MN 15.88 + 2 SDWadena MN 15.99 + 3 SDMinot AFB ND 16.06 + 3 SDSt. Charles MN 16.08 + 3 SDRedfield SD 16.11 + 3 SDStory City IA 16.18 + 3 SDWayne NE 16.21 + 3 SDEast Grand Forks MN 16.23 + 3 SDCanton SD 16.26 + 1 SDWinterset IA 16.26 + 1 SDBelle Fourche SD 16.32 + 1 SDWaukon IA 16.54 + 1 SD
City State Function % + SD
McCook NE 16.61 + 1 SDThief River Falls MN 16.69 + 1 SDWinner SD 16.96 + 1 SDNew Hampton IA 17.00 + 1 SDRed Oak IA 17.04 + 1 SDAlexandria MN 17.11 + 1 SDWindom MN 17.13 + 1 SDChariton IA 17.85 + 1 SDSturgis SD 18.02 + 1 SDDevils Lake ND 18.03 + 1 SDBenson MN 18.32 + 1 SDChadron NE 18.45 + 2 S DOgallala NE 18.83 + 2 SDShenandoah IA 19.23 + 2 SDWaite Park MN 21.35 + 3 SDSidney NE 29.06 + 3 SD
Table 9: Cities above 1, 2, and 3 SD from the mean in retail trade.

52
Retail Trade Cities
V
0 + 3 Standard Deviations
+ 2 Standard Deviations
• + 1 Standard Deviation
Figure 16: Retail Trade cities above 1, 2, and 3 SD from the mean.

53
Transportation Cities
Another example of site and situation, to a lesser degree than mining, is
that of transportation. Access to large scale routes of transportation such as
interstates, railways, or waterways is of critical importance. Only 16 cities
reached at least +1 SD from the mean, similar to mining (see Table 10).
Typically these cities are found in linear patterns or in groups because the
smaller cities play a supporting role along a transportation route. This sort of
pattern can be seen in western and extreme southeastern Nebraska (see Figure
17). Oftentimes, cities classified as transportation area also found in another
category such as manufacturing, construction, or mining. This category also
includes utility based industries like the nuclear power plant in Auburn, and the
coal factories associated with Beulah and Nebraska City. The importance of
transporting materials across the region from the east to west by railroad and
interstate highway is quite evident when examining the amount of transportation
cities in Nebraska. In fact, there just as many cities in this category from
Minnesota, Iowa, South Dakota, and North Dakota combined as there are in
Nebraska.
City State Function % + SD
Valentine NE 7.65 + 1 SDSibley IA 7.71 + 1 SDHot Springs SD 7.90 + 1 SDBrandon SD 7.96 + 1 SDNebraska City NE 8.04 + 1 SDDavid City NE 8.19 + 1 SDChisholm MN 8.22 + 1 SDBecker MN 8.28 + 1 SD
City State Function % + SD
Clarion IA 9.73 + 1 SDKimball NE 10.13 + 1 SDGering NE 10.46 + 2 SDEagle Grove IA 10.59 + 2 SDFalls City NE 10.95 + 2 SDBeulah ND 19.26 + 3 SDAuburn NE 22.17 + 3 SDAlliance NE 27.15 + 3 SD
Table 10: Cities above 1, 2, and 3 SD from the mean in transportation.

54
Transportation Cities
• +3 Standard Deviations
© +2 Standard Deviations
° + 1 Standard Deviation
Figure 17: Transportation cities above 1,2, and 3 SD from the mean.

55
Information Technology Cities
A new category to the classification is that of information technology.
Most of the previous functional studies on cities in the United States either
occurred before the computer age or simply grouped communications and
transportation together in one class. Industries in this category include
newspaper publishing, radio and television broadcasting, libraries, data
processing services, software publishing, and other telecommunication services.
The average of 2.7 percent is second lowest only to mining, but there were 29
cities with at least +1 SD from the mean (see Table 11). The most intriguing
discovery in this service class was the distribution of cities. It is generally thought
that information technology jobs are only located in or around a larger city, but
this is not the case. A wide spatial distribution of cities, both close and far from
larger cities, are found (see Figure 18). There are no information technology
cities in North and South Dakota or west of the 98th meridian in Nebraska.
City State Function % + SD City State Function % + SDGrand Rapids MN 3.46 + 1 SD Jackson MN 4.28 + 1 SDWilliamsburg IA 3.49 + 1 SD Norwalk IA 4.40 + 1 SDAfton MN 3.54 + 1 SD Falls City NE 4.56 + 2 SDAppleton MN 3.57 + 1 SD Sauk Centre MN 4.70 + 2 SDWaconia MN 3.57 + 1 SD Winterset IA 4.74 + 2 SDMontevideo MN 3.68 + 1 SD Wayne NE 4.83 + 2 SDLong Prairie MN 3.74 + 1 SD Belmond IA 4.89 + 2 SDCarlisle IA 3.79 + 1 SD Vinton IA 5.03 + 2 SDVermillion SD 3.79 + 1 SD Elkhorn NE 5.08 + 2 SDOnawa IA 3.89 + 1 SD Grinnell IA 5.11 + 2 SDMonticello IA 3.90 + 1 SD Perham MN 5.26 + 2 SDPleasant Hill IA 4.13 + 1 SD Waseca MN 5.86 + 2 SDGrimes IA 4.13 + 1 SD Blair NE 7.23 + 2 SDCambridge MN 4.14 + 1 SD Fairfield IA 7.72 + 3 SDFairbury NE 4.27 + 1 SD
Table 11: Cities above 1, 2, and 3 SD from the mean in information technology.

56
Information Technology Cities
® +3 Standard Deviations
© +2 Standard Deviations
• + 1 Standard Deviation
Figure 18: Information technology cities above 1, 2, and 3 SD from the mean.

57
Finance Cities
Cities included within this category are related to finance, insurance, real
estate, and rental and leasing. Only 5.17 percent of the total employment is in
the finance class. Previous studies conducted in the United States have found
that a considerable amount of the largest cities in the country boast high levels of
banking and finance. Typically, this function is not going to be found in excessive
amounts in smaller cities. Within the study area, the city of Des Moines, Iowa, is
considered an insurance and financial center. A majority of the cities in this
category are from the state of Iowa. In fact, eight of the nine highest averages
come from the Hawkeye state (see Table 12). The spatial distribution of these
cities tends to be clustered around the Des Moines metropolitan area (see Figure
19). Proximity to a larger city can be seen as the rule with cities of this class
found around Sioux Falls, Minneapolis/St. Paul, Rapid City, and Omaha. One
obvious exception is that of International Falls, Minnesota, located along the
border with Canada.
City State Function % + SDCold Spring MN 8.18 + 1 SDEllsworth AFB SD 8.33 + 1 SDGering NE 8.37 + 1 SDVictoria MN 8.40 + 1 SDWyoming MN 8.52 + 1 SDInternational Falls MN 8.80 + 1 SDWaconia MN 8.83 + 1 SDCanton SD 9.13 + 1 SDForest Lake MN 9.24 + 1 SDLuverne MN 9.26 + 1 SDMilbank SD 9.93 + 1 SDDe Witt IA 10.21 + 1 SD
City State Function % + SDWaverly IA 10.30 + 1 SDDell Rapids SD 10.53 + 1 SDElkhorn NE 11.10 + 2 SDAdel IA 12.53 + 2 SDWinterset IA 13.08 + 2 SDMissouri Valley IA 14.60 + 3 SDCarlisle IA 14.72 + 3 SDPleasant Hill IA 14.86 + 3 SDBrandon SD 17.12 + 3 SDNorwalk IA 17.26 + 3 SDGrimes IA 19.25 + 3 SDWaukee IA 19.99 + 3 SD
Table 12: Cities above 1, 2, and 3 SD from the mean in finance.

58
Finance Cities
M
+ 3 Standard Deviations
+ 2 Standard Deviations
+ 1 Standard Deviation
Figure 19: Finance cities above 1, 2, and 3 SD from the mean.

59
Professional Service Cities
The category of professional services comprises the highest average of
any class by a considerable amount. Included in the professional service group
are accountants, payroll services, legal services, scientific and technical
management, advertising, consulting, educational services, and health care
services. The 30 cities in this class all exhibit a substantial amount of average
employment ranging from 34 percent to almost 48 percent (see Table 13). Many
of these cities are college towns like Grinnell, Orange City, Sioux Center,
Chadron, Mount Vernon, Vermillion, and Decorah. The distribution of these cities
is widespread and occurs in every state, providing the fundamental educational
and health services for the immediate surrounding region (see Figure 20). North
and South Dakota have a particularly high proportion of cities in this class. Five
of the eight cities in North Dakota, and five of seventeen in South Dakota are
classified as professional service cities. Also, all ten cities in the Dakotas are
multi-functional.
City State Function % + SD City State Function % + SDPlainview MN 34.67 + 1 SD Stewartville MN 38.56 + 1 SDEmmetsburg IA 35.62 + 1 SD Grand Forks AFB ND 38.61 + 1 SDRedfield SD 35.93 + 1 SD Sisseton SD 38.99 + 1 SDHot Springs SD 36.22 + 1 SD Seward NE 39.08 + 1 SDCrookston MN 36.28 + 1 SD Sioux Center IA 39.76 + 1 SDGrinnell IA 36.54 + 1 SD Glenwood IA 39.77 + 1 SDOrange City IA 37.04 + 1 SD Vermillion SD 40.57 + 2 SDGrafton ND 37.05 + 1 SD Waverly IA 40.96 + 2 SDValley City ND 37.45 + 1 SD Byron MN 41.25 + 2 SDRugby ND 37.47 + 1 SD Pine Ridge SD 42.90 + 2 SDFairfield IA 37.56 + 1 SD Minot AFB ND 44.27 + 2 SDBaxter MN 37.79 + 1 SD Mount Vernon IA 44.29 + 2 SDChadron NE 37.89 + 1 SD St. Peter MN 45.94 + 3 SDLa Crescent MN 38.42 + 1 SD Morris MN 46.95 + 3 SDSt. Joseph MN 38.45 + 1 SD Decorah IA 47.90 + 3 SD
Table 13: Cities above 1, 2, and 3 SD from the mean in professional services.

60
Professional Sen/ ce Cities
c ~ \
+ 3 Standard Deviations
+ 2 Standard Deviations
+ 1 Standard Deviation
Figure 20: Professional service cities above 1, 2, and 3 SD from the mean.

61
Personal Service Cities
Personal service is another function that is widely distributed throughout
the study area, but each state has a different set of circumstances. The average
employment of 12.25 percent is the fourth highest of the eleven functions. Of the
28 cities in this group, ten are in South Dakota, nine in Minnesota, five in Iowa,
and only two each in North Dakota and Nebraska (see Table 14). Cities in this
category are usually found in areas that attract a large flow of people. The tourist
area of the Black Hills is a prime example where five cities, including the largest
in the class, Lead, are located (see Figure 21). This region offers a multitude of
functions that fit into this class consisting of motels, restaurants, bars, gift shops,
sight-seeing, and gambling. The second and third highest cities in personal
service, Tama and Toledo, Iowa, are located only a few miles from one another.
The Meskwaki Casino and entertainment center provides a substantial amount of
employment for these two cities. Many cities in North Dakota are also classified
as professional service cities. There is no overlap of classes in any other state.
City State Function % + SD City State Function % + SDGranite Falls MN 16.34 + 1 SD Mtnden NE 17.57 + 1 SDEly MN 16.63 + 1 SD Chisholm MN 17.79 + 1 SDDetroit Lakes MN 16.70 + 1 SD Valentine NE 17.97 + 1 SDBelle Fourche SD 16.79 + 1 SD Virginia MN 18.33 + 1 SDDevils Lake ND 16.80 + 1 SD Winner SD 18.37 + 1 SDOnawa IA 16.82 + 1 SD Sisseton SD 19.86 + 1 SDSpirit Lake IA 16.85 + 1 SD Mobridge SD 20.33 + 2 SDOsceola IA 16.90 + 1 SD Mora MN 20.84 + 2 SDGrand Forks AFB ND 17.36 + 1 SD Pine City MN 21.28 + 2 SDEllsworth AFB SD 17.37 + 1 SD Spearfish SD 23.28 + 2 SDSturgis SD 17.39 + 1 SD Pine Ridge SD 23.89 + 2 SDVermillion SD 17.40 + 1 SD Tama IA 25.82 + 3 SDRedwood Falls MN 17.50 + 1 SD Toledo IA 29.85 + 3 SDGrand Rapids MN 17.52 + 1 SD Lead SD 39.31 + 3 SD
Table 14: Cities above 1, 2, and 3 SD from the mean in personal services.

62
Personal Serv ice Cities
■-------- V -^ p .
0 + 3 Standard Deviations
o +2 Standard Deviations
- + 1 Standard Deviation
Figure 21: Personal service cities above 15 2, and 3 SD from the mean.

63
Public Administration Cities
Cities in this study area providing public administration services are almost
always going to be political centers or military installations. The overall average
employment in the study area is relatively low at only 4.11 percent, but many
cities in this category have significant levels (see Table 15). In other words,
much like mining, a city is either fairly low or quite high in public administration.
Unlike mining though, the location of these cities is not based on the proximity to
a natural resource. The spatial distribution of these cities is quite dispersed (see
Figure 22). The three air force bases of Minot, Ellsworth, and Grand Forks are all
at least +2 SD from the mean. Pine Ridge, South Dakota, is a significant political
center for the Lakota people, and is home to federal government sponsored
Bureau of Indian Affairs. Anamosa, Iowa, is home to a state penitentiary. Other
cities are local seats of government. All seven cities in North and South Dakota
classified as public administration also fall into the professional or personal
service class. Only half of the cities in Iowa and Minnesota are multi-functional.
City State Function % + SD City State Function % + SD
Eldora IA 6.96 + 1 SD Toledo IA 8.25 + 1 SDWahoo NE 6.99 + 1 SD Anamosa IA 9.75 + 1 SDWabasha MN 7.05 + 1 SD Minot AFB ND 12.46 + 2 SDSisseton SD 7.19 + 1 SD Redfield SD 13.52 + 3 SDOlivia MN 7.22 + 1 SD Grand Forks AFB ND 15.23 + 3 SDWest Union IA 7.41 + 1 SD Appleton MN 20.50 + 3 SDGrafton ND 7.45 + 1 SD Pine Ridge SD 22.13 + 3 SDClarinda IA 7.70 + 1 SD Ellsworth AFB SD 23.80 + 3 SD
Table 15: Cities above 1, 2, and 3 SD from the mean in public administration.

64
Public Administration Cities
+ 3 Standard Deviations
+ 2 Standard Deviations
+ 1 Standard Deviation
Figure 22: Public administration cities above 1,2, and 3 SD from the mean.

65
Diversified Cities
Of the 231 cities within the study area of this functional classification, there
are 45 cities that did not reach at least +1 SD in any of the eleven services
classes (see Table 16). Iowa alone had 22 of the cities, and Minnesota was
second with 16. Nebraska has six cities in the category, North Dakota has one,
and South Dakota contains zero. The location of these cities tends to follow the
traditional cornbelt throughout Iowa, southern Minnesota, and through south-
central Nebraska (see Figure 19). These cities serve important roles in the local
economy despite not having a significant amount of employment in one of the
eleven classes. The spacing of these cities is quite even in Iowa and southern
Minnesota.
City State City State City State
Wahpeton ND Oak Park Heights MN Estherville IAAurora NE Pipestone MN Grundy Center IABroken Bow NE Sartell MN Hampton IACentral City NE Sleepy Eye MN Independence IAGothenburg NE Spring Valley MN Jefferson IAHoldrege NE Staples MN Knoxville IAYork NE Watertown MN Le Mars IABayport MN Zumbrota MN Manchester IABlue Earth MN Algona IA Nevada IACaledonia MN Atlantic IA Oelwein IAKasson MN Bloomfield IA Perry IALindstrom MN Charles City IA Rock Rapids IALittle Falls MN Clear Lake IA Rock Valley IAMilaca MN Cresco IA Washington IANew Prague MN Creston IA West Burlington IA
Table 16: Diversified cities.

66
Diversified Cities
Figure 23: Diversified cities.

67
Nearest Neighbor Analysis
Many geographers utilize nearest neighbor analysis as a valid statistical
tool for determining spatial distribution in a two-dimensional space. The
maximum departure at one end of the scale is absolute clustering, where all
points are at the same place. The other end is absolute dispersal, where all
points are equidistant from other points. The index ranges from 0, indicating
clustering, to 2.15, indicating maximum dispersion.
The nearest neighbor results are shown below in Table 17. The columns
contain the index value (r value), average distance calculated in miles (Ave.
Dist), the expected average distance for the number of points randomly placed in
a study area (Exp.Ave.Dist), standard deviation (S.D.), the study area in square
miles (Area) and the number of cities per function (# of points). Overall, the point
distribution of each function, except retail, was random tending toward clustering.
Function R Value Ave. Dist (mi) Exp.Ave.Dist (mi) S.D. (mi) Area (mi2) # of PointsAll Cities 0.95 19.6 20.6 0.8 367,798 231
Mi 0.67 68.8 102.6 17.6 367,798 12C 0.87 48.8 56.0 5.5 367,798 35Mf 0.67 35.8 53.5 5 367,798 38W 0.77 49.7 64.6 7.2 367,798 27R 1.02 60.3 58.8 6 367,798 32T 0.85 74.3 86.8 12.8 367,798 161 0.92 . 38.7 62.1 6.7 367,798 29F 0.67 46.4 69.0 8.2 367,798 24Pf 0.78 48.0 61.0 6.5 367,798 30Ps 0.8 51.0 63.3 7 367,798 28Pa 0.83 72.0 86.8 12.8 367,798 16D 0.64 31.3 48.8 4.2 367,798 45
Table 17: Nearest Neighbor Analysis results for each economic function.

68
Retail was random and slightly leaning towards uniformity. The average distance
between cities in the transportation class was the highest at 74.3 miles.
Diversified cities were the closest together at an average of 31.3 miles.
However, those cities were generally clustered towards the southeastern region
of the study area.
Summary of Results
It must be noted again that the purpose of functional classifications is to
identify the spatial regularities in the distribution and structure or urban functions.
This chapter provided an explanation of the results produced by the creation of
the contemporary functional classification of cities in the study area. Compared
to previous studies on city classification, many service categories were
consistent regarding percent of workers. Examples of this are public
administration, wholesaling, transportation, and to a certain extent mining. Other
economic classes such as personal and professional services were significantly
higher in this study than previous research had found in other geographic areas,
and city size. There was a noticeable divide in functions from the agricultural
portions of Iowa, Minnesota and eastern Nebraska to the rest of the study area of
western Nebraska, North Dakota, and South Dakota.
Urban geographers are interested in describing the pattern of points within
a specified study area. With this in mind, the utilization of nearest neighbor
analysis, a method of analysis that distinguishes objectively between clustered

69
and dispersed spatial distributions was used. The results showed that most of
the spatial distribution was random, with a tendency towards clustering for every
function except retail, which was random tending towards uniformity. The results
of the nearest neighbor analysis demonstrate a degree of spatial distribution of a
two-dimensional distribution. It is important to reiterate that these cities provide
basic connections between the dispersed agricultural populations and the
agglomerated urban populations. For the most part, such direct connections as
do exist are through the goods and services which are provided in these small
towns for the agricultural population surrounding them.

70
Chapter 5
Conclusion
It is commonly understood that cities have diverse economic structures
and social characteristics. Many times these differences can be traced to
historical regional growth or resource availability. Recognition and better
understanding of these different types of cities results from their classification.
Classification is one way to organize complex and diverse information in order to
create a better understanding of processes and relationships. The relevance and
usefulness of classifications in geography is wide-spread throughout the
discipline. In urban geography, “generalizations can be made concerning a
single group comprised of like items, or one group can be compared and
contrasted with one or more other groups” (Northam 1975, 13).
Location also has been an important dimension in the study of systems of
cities. The activities and characteristics of a local community are thought to be
influenced not only by its immediate locality, but also by its ecological position
with respect to other centers of various sizes. Given the exchange relationships
between cities, and the economics of transportation and communication,
geographic location is an important aspect of this ecological position. (Fuguitt
and Field 1972) The small town is of academic interest because it represents the
lower end of the central place continuum. Any generalizations, theories, or laws
developed for central places should hold true for larger cities as well as smaller
cities. (Stafford 1963)

71
Harris, Ulfman, Nelson, and Hart set the framework of functional
classification as the original architects of the discipline. Smith developed a
methodological outline for a more scientific and replicable methodological design
in city classifications for the future. More recent applications of multivariate
statistical analysis created other avenues for scientific inquiry to be obtained.
The purpose behind each of these studies is to find relationships in the spatial
distribution of economic functions in an attempt to better understand the
incredibly complex urban structure.
Within the scope of academic research, “geography is the branch largely
concerned with the attainment of spatial knowledge, and is also concerned with
the identification, analysis, and interpretation of spatial distributions of
phenomena and their locational relationships as they occur on the planet”
(Haring et al. 1992, 5). The purpose of functional classifications is to identify the
spatial regularities in the distribution and structure or urban functions, and this is
consistent with the accepted role of geography in academia. There are two
primary objectives for this thesis: 1) To create a contemporary taxonomy of the
small urban places (population 2,500-10,000) in the study area using a standard
classification method for urban geography. 2) To discover and explain the spatial
distribution of the dominant economic functions of small cities in the study area.
Any system of classification should provide a vehicle for efficient
communication, a set of definitions, and a system of relationships among these
definitions. Each label in the classification system should convey the greatest

72
possible meaning in the fewest possible symbols. The categories should be
precisely defined, and overlapping should be eliminated wherever possible. The
goals of any such system are to allow the investigator to compare groups of cities
by type and allow him to reduce hundreds of cities into some kind of order.
(Atchley 1967)
Staying consistent with previous studies concerning functional
classifications, the occupational data obtained from the 2000 U.S. Census were
used. Only cities with populations between 2,500 and 10,000, and not contained
within the contiguous urbanized area of a MSA city were examined.
When determining a method to use for this thesis, it is important to
consider the overall objectives of the study. The purpose of this classification is
to compare the economic functions of towns within the specified population range
in one particular geographic region and to discover spatial relationships. The
standard deviation method developed provides an approach that allows a multi
functional classification, and provides a firm, relative assessment of these cities.
The mapping of the classification by economic functions provides a unique
insight into the spatial distribution of the cities. Nearest neighbor analysis is an
applicable statistical tool for determining spatial distribution in a two-dimensional
space.
It must be noted again that the purpose of functional classifications is to
identify the spatial regularities in the distribution and structure or urban functions.
This chapter provided an explanation of the results produced by the creation of

73
the contemporary functional classification of cities in the study area. Compared
to previous studies on city classification, many service categories were
consistent regarding the amount of workers. Examples of this are public
administration, wholesaling, transportation, and to a certain extent mining. Other
economic classes such as personal and professional services were significantly
higher in this study than previous research had found in other geographic areas,
and city size. A noticeable divide was formed with functions from the agricultural
portions of Iowa, Minnesota and eastern Nebraska to the rest of the study area of
western Nebraska, North Dakota, and South Dakota.
Urban geographers are interested in describing the pattern of points within
a specified study area. The utilization of nearest neighbor analysis provides a
method of analysis that distinguishes objectively between clustered and
dispersed spatial distributions. (Berry 1958) The results illustrate that most of the
spatial distribution was random, with a tendency towards clustering for every
function except retail, which was random tending towards uniformity. The results
of the nearest neighbor analysis demonstrate a degree of spatial distribution of a
two-dimensional distribution. It is important to reiterate that these cities provide
basic connections between the dispersed agricultural populations and the
agglomerated urban populations. For the most part, such direct connections as
do exist are through the goods and services which are provided in these small
towns for the agricultural population surrounding them.

74
The present study, in conjunction with those that have preceded it, lends
empirical support to Brush’s statement that “small towns and villages in
agricultural areas of Anglo-America exist mainly because of their function as
central places for the exchange of goods and services, each for its local farm
trade area” (Brush 1953, 380). By building one similar study upon another in
different areas, progress is made toward valid generalizations concerning the
economic functioning of central places, thus making precise prediction more
possible. (Stafford 1963)
These small places provide basic connections between the dispersed
agricultural populations and the agglomerated urban populations. For the most
part, such direct connections that do exist are through the goods and services
which are provided in these small towns for the agricultural population
surrounding them. Second, even if small towns do not fulfill their role of providing
goods and services for a dispersed farm population, the fact remains that these
small places exist and that economic activities are performed in them just as they
are in larger places. (Thomas 1960)
This thesis establishes the framework for further research into
understanding the economic functionality of small urban places. Future research
could investigate various issues including temporal studies, because
geographers should examine functional changes and spatial distribution as the
urban construct evolves. Another aspect that should be carefully examined is the
changes in population for cities in a particular region or service class. Other

75
forms of multivariate statistical analyses, such as cluster analysis or regression
analysis, could be used to locate groups of cities with similar economic
structures. Many plausible avenues can be utilized in order to discover and
understand this diverse and complex system, but it is crucial to employ a method
that strictly follows the research objective(s) of a particular study.

76
APPENDIX A
City Employment Data and Percentages by Function (population sort)

77
sSn£L 3.
7%
3.7%
sOO'*CMCO 7.
4%
6.0%
2.3%
7.2%
7.2%
35
2.0%
2.7%
6.2%
5.1%
7.1%
3.2%
4.4%
3.3%
5.0% 3?in
2.0%
2.7%
3.1%
35CMcd 2.
6%
\ 0o'*co
5.1%
5.1%
6.3%
2.5%
20.5
%
<0CL co 05
05 CM05 co coCM
CO 05 OCO To 05
CM r - 05to COCO
r -co
CMto 3 r - 05 05CM
toco
coCO
CO coco s
co(005CO 97 38
CMCO
5?
S . 14.5
%
13.5
%
29.8
%
12.0
%
13.4
%
10.6
%
6.7%
8.2%
19.9
%
11.9
%
14.0
%
13.5
%
11.4
%
5.4%
12.4
%
14.5
%
9.6%
6.3%
9.2%
| 15
.0%
9.3%
350505 25
.8%
5.4%
11.2
% 3805G> 7.
0% 1i d 10.3
%
9.0%
9.0%
Ps 182
178
<o 149 CO
co CM coCO
CMCM
Oto 05 to toCO coco
CO COco toco 'c o 05 co CO
CM COCO
COr -to<0 GO CO05 24
2
0 5OCO COCO GOto
Pf%
30.4
%
23.2
%
23.9
%
23.8
%
22.0
%
28.4
%
27.8
%
27.8
%
39.0
%
NCM 31
.6%
30.5
%
26.6
%
31.7
%
28.3
%
31.3
%
30.8
%
29.3%
j
23.6
%
27.9
%
32.8
%
27.0
%
23.7
%
cdCM 34.3
%
21.3
%
23.7
%
32.3
%
28.3
% o *cq
CO 20.2
%
23.3
%
£CMCOCO 30
7 coCM 29
5
267
324 CO
cocoToCO
CO r - tococo
05CMCO
co co
coCOCO
COcoCO
05toCO
to(Oco
to05CO
coco
, 35
5 co 05CO
C505CM05
COC5to05
. CO CM
CO toCO0 5
493 COC5
coOto
ssU . 7.
1%
2.6%
2.3%
4.4%
5.8%
2.6%
..
3.4%
5.5%
5.1%
8.0%
| 4.
4%
5.4%
5.2%
2.9%
4.6%
4.6%
5.9% 35
CM 4.7%
3.7%
4.8
%
4.2%
3.5%
4.6%
6.4%
2.9%
4.5%
3.4%
8 5.5%
4.8%
6.2%
U . 05GO
COCO
r -CM
coCO -
CDCO 3
05CO to §
coto CMCO co to coto C5 co
CM CO -05CO 3 CO to
CO 05 C5 C5CO
<0kO
CO00
co „ CD
38
2.3%
2.0%
0.6%
35r-.
5.3% 05
0.9%
ssco
3.0%
2.3%
3.2%
35cp
0.4%
2.9% 35
co
2.9%
3.5%
0.8%
3.0%
2.2%
1.1%
2.6%
2.0%
0.6%
2.2%
1.2% CM
3.5% 38CM S '
COcd
- GO CO m -CM co CM co <o - co coco CM co CM to co co co CM co
coco CO
CMco CO 05
CM co C5co
<0-
toto co COCM
SS»— 6.
3%
2.3%
2.6%
3.4%
10.1
%
4.9%
2.5%
4.8%
2.2%
4.7%
| 3.
4%
5.5%
5.4%
8.2%
4.6%
6.1
%
5.0
%
3.0
%
8.3%
4.6
%
2.9%
3.0%
3.5
% 38co
6.1%
4.3
%
7.7%
7.6%
c d 4.3%
4.6%
5.4%
» - 051 - C5co 30 CM co
CM COCOcoCO CO CM
05to coCO05to CO
to05 5 05to 5 £05tr> CM 05CO
co toCM 05 05to
COC5 COC5 0 5OD COCO r - to
CO
R% 11.8
%
12.8
%
9.7%
10.6
%
12.4
%
10.2
%
12.1
%
14.8
%
11.8
%
12.7
%
14.6
%
11.5
%
| 14
.3%
9.9%
11.2
%
6.4%
8.7%
14.0
%
11.9
%
10.6
%
12.2
%
11.6
%
9.0
%
12.5
%
10.8
%
12.7
%
8.7%
14.3
%
12.0% 35
cd ._
35GO
11.0
%
O '05 05
COCMCO
C5co <o coco GO n COtoto CM
C5r - to CMco ■ CO COC5 05
COco<0
toCO
cor - 150 0 £
159 coh- <0 CM05 GO to
CM05
w%
2.2%
1.1%
1.3%
7.2%
I 3.
7%
1.9%
I 2.
2%
2.8%
1.4%
2.8%
35
6.4%
| 3.
4%
2.6%
3505
1.7% Sd
cd 3.6%
2.6%
3.7% s 2.2%
2.0%
0.6%
4.4%
4.0
%
2.8%
35CO
3^tr>
4.0%
2.5%
2.2%
5 CMCO CO O05 co CM
CM05CM CO <o toCO CM 05
coC5CO CM
CM05 C5co 05
co -r -to co
CM CM GO cototo coCO to
co COCMCO
COco
Mf %
13.2
%
30.5
%
12.3
%
20.6
%
11.6
%
24.8
% S 'COcdCM 15
.5%
cocd 16
.0% o 'r -
co 14.9
%
19.1
%
23.7
%
20.3
%
21.6
%
17.6
%
20.0
%
18.3
%
17.5
%
21.9
%
26.0
%
20.3
%
36.4
%
13.9
%
30.7
%
30.3
%
2.7%
28.6%
35GOCO 30
.0%
11.2
%
£COco 40
3
145
256 coco
CM coCO05 r -
coCMCM
co05 co CMCM
toCM
05coCM
GOCM
05C5CM CM 25
9 coCMCM
toCO
r -coco 24
9
516
204
417
405 CO
co 3 CM05CM
toto CM
C% S5
coto 5.
1% 35r-.
5.0%
4.9%
•sOO'*cocd 6.
0%
6.6% 05
id 5.1%
6.4%
3.6%
3.5%
5.4%
5.9%
7.1%
8.0%
8.2%
13.2
%
11.5
%
5.9
%
9.5
%
6.9%
3.0%
7.2%
8.9%
35cq
7.5% 38CO
CM 6.1%
11.7
%
4.7%
O 05CO CO
CD05 CMCO
05m r -r - 05 coGO
<oCO CO
coCO
05CO
CM coCO
05CO
CMCO
to05 CO 3 toGO
COCM GO
CM
106 CM CM
CO 5 COV 05co C5
CO
38s
38CD 0.
0%
0.0%
0.0%
3.8%
0.4%
I 0.
0%
0.0%
0.0%
0.0% cd
G> 0.0%
0.0%
0.0%
0.0%
0.0%
0.0%
0.0%
0.0%
0.0%
0.0%
0.0%
0.0%
0.0%
0.0%
0.1%
0.0%
0.0% 38
CMO 0.
3%
0.0%
0.0%
E CD C5 o C5 <o- o o o C5 C5 C5 C5 C5 O CD C5 C5 - CD co to 0 C5
Empl
. GOCOCM 13
21
1176 CM
CM 1214
1140
1308 CO
CM 1113 to<oCM
COC5GO
1189
1160
I 11
77
1147
1185
1348
1413 CM
CM 5 1294 CM
CM 1417
1467
,136
0
1336
1347
1482
1552
1516
644
Pop.
2518
2535
2539
2549
2559
2559
2560
2570
2572
2573
2580
2594
2596
2597
0505toCM
OCOCM
CMCMCOCM
CMCMCOCM 26
73
2684
2702
2727 CO
CM 2756
05COCM 27
94
2796
2820
2829
2839
2851 coCM
IS
MN < 3 < ' LUz MN < MN a
s < zE MN < LUz M
N < MN < MN
MN < MN < MN MN
MN < NE < MN MN
MN
Urba
n Pl
ace
Sprin
g Va
lley
Mare
ngo
Toled
o
Wes
t Un
ion
-OE
Perh
am
Belm
ond
Olivi
a
Siss
eton
Rock
Rapid
s
Milac
a
Glen
wood
Grun
dy C
ente
r
David
Ci
ty
Wab
asha
Bloo
mfiel
d
Chisa
go
City
Willi
amsb
urg
Beck
er
Anna
ndale
Rock
Valle
y
Coka
to
Tam
a
Rose
au
Zum
brot
a
Mont
gom
ery
Sible
y
Valen
tine
Wilto
n
Afton
Zim
merm
an
Apple
ton

78
Pa%
1.7%
13.5%
3.8%
3.1%
2.8%
4.4%
2.2% as
CO
3.0%
2.5%
4.9%
4.6%
5.8%
5.2%
2.5% GO
7.0%
3.2%
4.8%
4.8%
4.0%
3.7%
5.3%
2.1%
1.5%
4.1%
5.2%
2.6%
5.2%
4.9%
22.1%
cfla. - 146
57 0 9c o
CO 62 c oCMCM
L40 £5 COco K c oGO
COGO
GOc o
09CM
CM0 9
0 9c o
COCO
C- to CO 0 9 28 mCMCO<0 CO 39 e g
GO .3 C0
Ps%
12.3%
12.2%
6.3%
14.3%
17.6%
11.9%
9.7%
8.8%
10.5%
10.9%
12.5%
11.1%
13.1%
12.8%
39.3
%
13.9%
10.9%
11.4
%
21.3
%
9.5%
16.3% as<0
CO 16.8%
11.4%
j
12.1%
5.6%
18.4%
12.1% CM 8.6%
12.4%
1 23
.9%
£ 156 n 94 178 CO
COoo<0 0 9
CO s? 09 c o CM 0 9OO O
CM<J>uo 22
7 3 c o 279 s c o
COCM
c o0 9
O O0 9
O<0CM
c o00 N—O O
U>CO 11
1 C-r--
pf%
26.1%
35.8%
26.4
%
37.5%
25.9
%
34.0
%
30.7%
27.3%
31.8
%
26.6%
30.2%
27.8
%
24.2%
33.7
%
19.4%
26.2
%
30.6
%
28.3%
22.4
%
27.2
%
30.4
%
23.0%
aSCMGOCM r*
CM 24.1
%
23.1
%
26.0%
25.6
% O""( 0irSCM 25
.0%
22.3%
42.9
%
s: 331 r--«o
c o<0CT>c o
OOCO■M-
CM0>c o 48
1 CM5 c o
c ooo GOGO
0 9■M-
CM 0 9c o
COS 29
3 GOCM■M- O
c o■M-o>CM
O3
COCO 0>c o
CM COc o
0 90>c o
0 9<0CO
GOCOCO
OOGOCO
CM0 9
O )0> GOc o
aSu. 5.7
%
3.6%
5.7%
5.3%
5.4%
1.4%
4.7%
cd 10.5%
14.6%
4.0%
5.0%
5.3%
5.1%
23%
5.8%
4.0%
4.3%
2.4%
8.5%
4.1%
5.5%
1.9%
3.4%
5.2%
9.1%
5.3%
4.0% oo
CM 1.1%
7.8% asin
u. 72 o>CO tf>00
99 OO OCM <0
CO OCO
c o CO GOc- CMGOUOc o 0 9
c ouo
CMuo CO
OOCO CO
GOGOCM 3 CO
GOCO m <0 CT5 O
-
0.7%
1.4%
1.9%
3.0%
2.3%
2.3%
2.4%
0.5%
3.2%
2.5% 5?
3.1% 1.3% asco 1.8%
1.0% as
CM 3.7%
0.8%
3.0%
0.3%
2.6%
3.9% as
1.2%
2.3% ascq 2.0% f e
CM 1.5%
3.0%
! 0.0
%
- o> 15 GOc o
coc o
CMCO
UOCO -
0 9 coCO
zz o> 0 9- -
c- COCO
uo- 48 O OOtn O
COc o 3 23 C-
CM
T% 5.1%
3.8%
5.0%
5.4%
3.7%
4.1%
9.7%
3.0%
5.3%
6.0%
5.2%
5.1%
6.3% 2.5
% as0 9
5.9%
2.7%
3.1%
4.5%
4.3% ascq 5.3%
4.6%
4.7%
4.6%
7.4%
6.5%
19.3% as
tr i 7.0%
4.8%
0.8%
h- uo<o 5 toc- oo<0 COuo
GO O5 Ooo OO
GOCM 000 0 9
Ofr GOCM
co0 9
<0CO c-c o
OO 0 910 CMGO GO
GOCO
CM<0 <0 0 9 CM0 9
CM09CM 00 CO C0
as
10.7%
16.1%
12.4%
12.1%
13.2%
13.4%
8.0%
13.8%
11.1%
15.0%
12.4%
13.2%
14.1%
11.0%
10.8%
13.3%
a?co
10.7%
14.6%
11.9%
10.8%
12.5%
12.0%
15.3% 9.3%
16.3%
17.0%
11.3% to 14.1%
14.2%
! 5.0
%
QC 135
186
5O<=>CM 18
9 m o> 168 0 9
CMCM
205 CO0
CMh-c- <0 CO
uo 129
0 9CO0 9 to O
0 90 9
OCM
3 OCOCM 24
0 t o•^rCM CMCM c-
c o
w% as
co 3.1%
3.9%
5.5% as
CM
2.8%
3.5%
3.1%
4.5%
CM 2.3%
7.1%
5.7% aso> 1.1%
2.9%
2.2%
0.5% as<0 5.4%
3.4%
4.4%
3.3%
3.9%
3.3%
3.9%
4.7%
0.5% g 3.2%
1.5%
0.0%
3 36 COc o
0 910
0 9<0 oo O O 43 0 9(0 COCO n
OGO
06 CO 0 9CM CO CM GO
GOCO
0 9uo
muo
c o<0 CO<0 CO COCM O CO G>
Mf %
29.3% 3.1
%
29.8%
5.3%
14,3%
16.0%
16.3%
26.9%
10.3%
9.9%
15.2%
3.7%
13.1%
18.7% 1.7
%
21.1%
16.4%
28.0%
18.8%
18.8%
16.1%
26.4%
13.1%
24.2%
30.2
%
17.7%
0.7%
6.5%
oSO
25.2%
20.5%
1 0.
0%
371 c oCO
m
COCO CM CO
CM c oto 5 IS 0 9
OO 302 m
CMuo■M-c o 21
6
337
246
304 OCO
CMOO
CO0 9 co 50
1 COOOCM
O 0 90 9
t oCOCS| 396 c o
GO 0
c% 2.9%
4.3% as
0 9
5.1%
7.4%
8.3%
5.6%
5.9% g
r* 7.4%
6.6%
6.1%
9.2%
7.6%
6.1%
7.5%
7.0%
5.2% a*CM
h-' 6.7%
8.1%
4.8%
7.6%
4.8%
7.3%
9.7%
7.7%
3.4%
8.2%
7.2%
8.4%
1 3.
8%u c o
<0m - ooCM <0
GO OOO oo
oo COO 0 9
U*>0 9 CO
ZZl CM0>c oCM CO
0 9CO<0 OO
0 9O to CO CO CO<0 CM 155
109 CM
U9aoCM
c o uoc- GOCM
SSE 0.0
%
0.0% 0.0
%
0.6%
0.3%
0.1%
0.0%
0.0% 0.8%
0.3%
0.4%
12.7%
0.0%
0.0%
10.9%
0.1%
0.0%
0.0%
0.0%
0.0%
0.0%
|
as00 0.
0%
0.2% 0.3
%
0.0%
0.0%
12.3% ps
Ck 0.0%
0.0%
1 0.
0%
£ o o o - CM o o CM - 0> 0 OuoCO CM 0 0 0 0 0 0 0 CO uo O <=> C-OO CO 0 0 0
Empl
.
1267 o«o
o 1501
1249
1514
1415
1439
1382
1517
1459
1386
1556
1440
CO t o 1634
1321
1203 0 1619
1426
1517
1492 To 1657
1599
1415
1516
I 15
56
1571 CM
O )CO 74
1
Pop.
2878
2897
2922
2939
2964
2965
2968
2975
2980
2992
2998
2999 O
OCO 30
15
3027
3029
3035
3040
3043
3048
3070 0 9
CO0 9Oc o 31
04 OOOCO 31
10
3137
3152
| 31
55
3161
3162
3171
LiiJ < QCO < Q
ZLUZ
zs < M
N QLO < LU
Z MN MN MN O
CO MN < MN
zs M
N
MN Z
S < MN MN as O
CO ND < MN OCO
Urba
n Pl
ace
Belle
Plain
e
Redf
ield
Garn
er
Rugb
y
Mind
en
Caled
onia
Clar
ion
Cold
Sprin
g
Dell
Rapid
s
Miss
ouri
Valle
y
Cent
ral C
ity
Moun
tain
Iron
Dilw
orth
Linds
trom
Lead
Wat
erto
wn
Eldo
ra
Long
Pr
airie
Pine
City
Wyo
ming
Gran
ite
Falls
jMe
lrose
Onaw
a
Stap
les
Norw
ood
Youn
g Am
erica
Cant
on
Win
ner
Beula
h
Tipto
n
West
Burli
ngto
n
Bayp
ort
Pine
Ridg
e

79
Pa
% 35|M
2.4
%
5.2
%
5.7
%
3.4
%
1.5
%
4.8
%
2.9
%
4.1
%
3.2
%
5.4
%
2.5
%
3.3
%
6.7
%
3.2
%
3.1
%
1.1%
3.5
%
5.6
%
5.4
%
6.2
%
3.3
%
5.3
%
3.3
%
2.1
%
3.6
%
3.9
% a£oq C M
r d 5.5
%
4.1
%
2.7
%
Pa P*-
CM 34 0> CM CTi
COCOCM
CTi r»»IA
COco S
06
-^ rco
OCM 3
COCO
OO CDco OO CT>
coo 5
9
94
55 r -.r o
r oco
CMCO
or o u S r-.CT>
CTi COIA
Ps
%
7.6%
20
.8%
9.3
%
12
.9%
11
.4%
10
.6%
14
.2%
9.4
%
8.1
%
§0> 8
.5%
10
.8%
13
.5%
6.1
%
8.9
%
13
.1%
12
.9%
9.6
%
20
.3%
9.9
%
15
.6%
15
.0%
10
.7%
14
.1%
11
.6%
11.1
%
9.1
%
10
.6%
tc >
14.4
%
15.5
%
12,3
%
COa. CMOOO)CM
r o COco
OoCM
IACO
COr oCM
COoo r o CO
OOr o
CMCM
CTiO
CO Or oCM
CM . CM co
r-.or o 16
7
263
267 CTi
OO
232 CO
oCM
CMCT> 3 18
2 r*—CM IACM 30
3
pt%
34
.7%
23
.0%
30.6
%
29
.6%
31.2
%
22
.3%
25
.1%
24
.7%
24
.0%
44
.3%
25
.4%
26
.4%
29
.5%
26
.0%
1 4
1.2
%
20
.7%
27
.9%
33
.0%
30
.9%
23
.0%
27
.4%
21
.3%
30
.5%
22
.9%
22
.1%
27
.4%
25
.2%
28
.6%
o s ir o 2
2.8
%
21
.4%
1 2
3.0
%
£ 56
2 CTiCMCO
0>co
CO 54
5,
r»»CO 4
80
38
8 COoo 4
23 CM
48
4 COco
IAoo
CMcoCO
CTiCO coCO
COCO
oCT>ro
COCTiCO
Os
COCO
r-.ooCO
r-.CTiCO 4
89 <=>
i o 401 r -. CTi
CO
LL. 5.2
%
3.5
%
6.5
%
5.2
%
2.7
%
1.7
%
4.3
%
4.7
%
4.4
%
5.8
%
12.5
%
4.3
%
2.6
%
14
.7%
3.6
%
6.4
%
3.6
%
2.8%
j
2.8
%
2.8
%
6.0
%
5.1
%
5.6
%
9.9%
|
4.0
%
3.3%
1
3.6
%
3.3%
!
5 ^o ou S 6.
2%
6.5
%
5.7
%
Up 84 O
t oO )o»
coco 4
8 coCM O
o>w>
20
9 CTiCO
r o
26
4 CM OCO
CM^3* 3 O OCTi 10
0 r oco o
r-. COr--IA f t era
O CM £
1.9%
2.2
%
1.7
% 3 '-
0.7
% CTi
2.5
%
3.2
%
2.9
%
2.6
%
2.8
%
0.9
%
0.5
%
3.8
% a?
4.3
% egco
2.1
%
1.5%
3.9
% sOco
2.3
%
2.9
% a?oo
2.1
%
1.3
%
1.1
% a?CTi r g
0.9
%
2.0
%
cq
- COCOCM
CM CT>CM CM
COr»»
IA *tf> oo 6
8 tf> COCM cor o
CMCM
coco
r**-CM 5 r U )
CTiCM
COr o
CMCM
oo r or o u o LO CT>r o cor o
SSh - 5
.5%
1.4
%
3.5
%
2.1
%
4.7
%
4.2
%
22
.2%
2.8
%
| 6
.3%
3.2
%
5.3
%
2.6
%
6.1
%
6.9
%
2.4
%
5.8
%
4.5
%
2.8
%
5.5
%
4.3
%
5.6
%
6.9
%
4.3
%
7.6
%
5.0
%
3.5
%
3.8
%
10
.6%
oCM 6
.8%
6.0
%
4.0
%
»— 89 OCM S coCM CMoo COco 3
63
S 102 ^ r
cooooo
CM
100 CO
CM oo O 48 r o
ooCM ■M-
CT>CMCM CM oo
Oco Oco oo S 3
CTi t ooo
K 13
.5%
13.2
%
16
.2%
11
.9%
16
.1%
10
.2%
11
.4%
7.1
%
18
.3%
11
.7%
12
.9%
13
.5%
13
.1%
11
.0%
14
.8%
13
,8%
9.5
%
8.6
% ££oo
11
.5%
12
.1%
12
.2%
15
.0%
13
.0%
13
.5%
17
.0%
r d 7.3
%
13.6
%
15
.3% as
ooo 1
2.8
%
OSCTiCM
0>OO
24
8
I15
0
281
159 cooo
CT>r o
296
CMtf> r»» tf> oo
O)
29
2
CMcoco co r o
CMCM
tf>O)
20
4 r»»26
5 r o cor oCM
CTiCM
co ■M-CM COCM
CV|CT>COCM
o
261
w%
•vOCT>CO 1
.5%
4.5
%
5.0
% 3 '-CMCM 1.
5%
s?
6.0
%
2.0
%
2.5
%
5.3
%
2.5
%
2.6
%
3.4
%
I 0
.8%
2.6
% s?oo
3.0
% a?ooCO 5
.9%
1.2%
4.5
%
2.8
%
8.4
%
4.7
%
2.7
%
2.7
%
4.7
% a sr q a?oo
od 2.5
%
5.7
%
5 : sCMCM
CT>CO
COco
ooCO CMroCM
CO r or o 5
0 oooo
O CMCO
tf> co
oc CM
CO CO 100
r jOoo
Oco 13
8 CMOO co r o
S°
SS
I
OO CO
Mf%
14.4
%
21.2
%
14
.0%
15
.6%
16
.4%
41
.7%
9.8
%
33.1
%
21.2
%
10.2
%
10.7
%
26
.7%
13
.2%
13.6
%
16.1
%
20
,5%
22
.9%
18.2
%
1.3%
25.3
%
12.3
%
12.0
%
17
.0%
8.2
%
26
.1%
20.8
%
23
.2%
20.0
%i n 1
.3% o
oCM 24
.5%
£r oCOCM
r oor o
coCT>
coOOCM S 16
0
64
5 r o■M-ro OCM
CTi CTiCM 3CM
CTiro
CT>coro
cor o
Or o
oCM
OOCM
r**-oCM
Oro
cr>CT>LOr o 36
6
3COa o
roCM
CT>OOr o 5
00
C%
9.1
%
10.3
%
7.8
%
7.4
% 3?r—oS 3
.2%
2.9
%
5.3
%
5.6%
4.5
%
7.4
%
7.2
%
5.7%
7.9
%
7.2
%
5.2
%
7.7
%
11
.2%
9.1
%
5.7
%
5.1
% a?ood 4
.2%
3.8
%
5.5
%
7.1
%
10
.6%
8.3
% a s
t o 9.3
%
11
.1%
5.5%
Or»»
148
OCM COCT>
or— CTi
48
104 O
CT> oooo
^ rCM
co r oCTi 3
CMCT>
COCM 5> r o r**-
o>COOO
CM CO COco
r**-o>
CMCM
oot o
CMco
coCM
r o
ass 0
.1%
0.3
%
0.7
%
0.0
%
0.2
%
Oo 0
.0%
0.0
%
0.0
%
0.0
%
0.5
%
0.0
%
0.0
%
0.0
% a soo 0
.0%
0.4
%
0.0
%
0.0
%
0.0
%
3.6
% §6 0
.0%
3.5
%
0.9
%
0.0
%
0.0
%
0.0
% aS
0.0
%
0.0
%
0.0
%
s CM IA - o CO o O O o o OO o o o o o CO o o o OCO o o OO
IAco o o o CM o o o
Em
pl.
1621
Or o
1533
1263
1748
15
53
163
7
1947
16
16
CTi
1668
1608
163
8
179
4
1976
1751
1645 o -
15
10 CM
O)CO
1682
1781
1772
16
42
17
48 CT>
CMr**-
15
78 O )
oCOCOCO
176
2 O )CT>
20
38
Po
p.
31
90
31
93
32
28
32
76
32
95
33
32
33
50
33
73
| 3
37
6
33
90
34
35
3451
3491
34
97
35
00
3501
351
5
35
59
35
74
360
7
36
13
36
19
3621
36
40
36
60
36
92
37
06 CM
r**-r o 3
72
4
37
33
37
89
37
95
IS NIA
I MN <
NIA
I
NIAI < LU
Z
NIA
I MN < < < NE < MN
NIA
I
z2
NIA
I
aCO <
NIA
I
LUZ
z2
oCO
LUZ < < < ZS N
E
NIA
I
Z2
Urb
an
Pla
ce
Pla
invi
ew
Mo
ra
Stor
y C
ity
Park
R
ap
ids
St
Ch
arl
es
Wes
t L
ibe
rty
Au
bu
rn
Go
od
vie
w
Be
nso
n
Mou
nt
Ve
rno
n
Ad
el
Osa
ge
Bro
ken
Bo
w
Ca
rlis
le CO>>
CQ Jack
son
Sle
epy
Eye
Bre
cke
nri
dg
e
Mo
bri
dg
e
Mo
nb
cello
Two
Ha
rbo
rs
Go
the
nb
urg
Blue
E
art
h
Mllb
an
k
Wes
t P
oin
t
New
Ha
mp
ton
Alb
ia
Eagl
e G
rove
LU
O’N
eill
Belle
P
lain
e
Can
non
Fa
lls

80
Q . 2.9%
4.6%
3.3%
0.7% 2.4%
2.2%
7.0%
5.5% 1.7%
1.9%
5.2%
2.3%
6.2%
2.9%
2.4%
23.8
%
3.2%
2.9%
5.3%
2.6%
2.9%
1.7%
'
2.4%
2.0%
3.5%
5.8%
4.9%
7.4% L O
CM 5.5%
3.9%
3.8%
Pa 57 76 ro
LOro 03 ro
134 O
O COCO -
LO
50 0 30 3
OLO 49 23
7 O 58 2 SS COLO
Px.CO 5 47 83 CMCO
CO L OL O
LO
80 84
(AQ . 12
.2%
15.9
%
10.7
%
8.6%
13.4
%
8.9%
13.8
%
14.7
%
14.6
%
7.7%
10.4
%
14.1
%
13.8
%
7.5%
10.9
%
17.4
%
12.9
%
12.6
%
11.0
%
16.8
%
9.7%
15.6
%
12.8
%
9.0%
7.6%
9.6%
10.2
%
9.3%
14.7
%
16.8
% oSCO03 15
.5%
LAQ_ 23
8
263 rsio £ 273 30 4
ix.LO0 4
o>0 4
oCOCM CO
CMCM
CMLO
fx.CM
CO
282
253
234 CM
LOCO
fx.
342
233 fx.
CMCO 20
0 COCM
OCMt o IX.
LOco OCM 34
3
Pf%
24.0
%
I 25
.9%
22.8
%
28.5
%
27.9
%
24.3
% CO
0 4 26.9
%
35.6
%
34.1
%
33.6
%
26.2
%
36.2
%
32.6
%
20.4
%
26.9
%
24.3
%
30.4
%
31.9
%
26.9
% c £COCOCM 30
.3%
32.2
%
26.7
%
34.3
%
20.5
%
26.9
%
37.0
%
26.4
%
21.9
%
25.8
%
29.1
%
£ 469
427 O
ro 03LOlO 57
0 CO LO
489 LOo LO
c*.ix. 57
7
582 LO
LO 424 CO
CMCMCOLO LO
OLO
ooLO
COCOCOCO
ooLO 61
4
817 CO LOCM
CO
108 LOL O 46
5
531
644
F%
4.8%
2.4%
5.5%
x $CO
5.3%
2.5%
3.5%
5.1%
3.8%
8.4%
4.5%
4.3%
4.0%
3.2%
3.5%
8.3%
2.9%
3.0%
6.5% a®
CO 3.3%
3.0%
3.0%
3.2%
7.4%
5.1%
4.3%
4.2% 0 3
3.3%
4.7%
9.3%
- S 40 O LO03 O ooLO
COo> LO LO 0>o> 03LOLO
LOLO
CM COoo COLO LO
eoCO LO OLO
LOLO LO
co fx. fx.0 100 O
0 3t oO
-LOo> 20
5
1% 1.7%
1.7%
2.4%
2.5%
4.7%
2.5%
1.3%
2.1%
3.1%
1.3%
1.6%
1.8%
2.4%
1.3%
0.5%
1.1% CM
1.8%
2.4% 1.1% 5?
CO
2.3% 0
0.6% 1.7% 2Sco
2.1%
1.2% s ecq
2.5% 1.1% g
-coro CO LO OS LOo> 48 0 4
03CO LO 0 4
LOc o
O OOCO
fx.CM - - LOCM
LOCO LO
COCM eo LO
03§
■*»-CO 48 |x-
CM0 3co
11 OO
CO
T %
' 5.
8%
7.3%
3.9% as03
0 4 6.3%
5.0%
3.4%
5.7%
4.6%
3.3%
2.6%
3.3%
7.9%
3.2%
5.9%
2.3%
7.6%
2.8%
6.8%
2.5%
5.8%
2.6%
2.9%
3.4%
5.8%
4.9%
4.5% S S0< 0
00
5.6%
4.4%
b~ ’ CM roc*. LO
o>rsi 0 3LOLO O 03
0 4U )
CMfx. CM LO
LOCOCM CO
CMLOLO LO
LO COLO
LO0O LOCM oo LO
COCMOO
0 oo0 3 CO
COO
LOcr>
O' 15.9
%
15.6
%
10.5
%
7.7%
14.8
%
14.3
%
13.1
%
11.2
%
9.7%
14.2
%
9.9%
12.4
%
12.3
%
16.5
%
10.8
%
11.3
%
9.4%
11.1
%
10.2
%
14.0
%
9.3%
12.6
%
16.0
%
1 12.8
%
13.5
%
17.1
%
11.4
%
10.2
%
16.3
%
17.9
%
10.4
%
oe 258 0 3
i15
4
302 03r -0 4 LO
0 4COO04
03 0 403
o>CM
COix.CM 03 CO
COCMCM
COOCM CM
CMOOCO 16
9 LOCM
O03CM 20
2 LOOCO
CMCM
COo>CO CM
aoCM 3 LO
CO0COCM
%M
3.6% 3.1%
4.1%
3.3% 3.8% 1.7%
4.1% 2.2%
2.0%
5.9% sS
LO
5.1%
2.1%
4.1% 1.9%
1.5%
3.8%
3.0%
2.1% CO
2.2%
5.6%
2.2%
2.5%
3.4%
2.5%
2.2% ^3-
c d 1.1%
14.2
%
3.5%
5 O-
CO LOLO
c*.ro 0 3 O 03
COOCO c o
CMc o OO
0 3CO
CMCO
LOLO
LO COCM
03 CMO 50 03
LO -0OLO 47 co
CMCMo>CM
0O
Mf
%
20.7
%
9.4%
24.9
%
35.3
%
13.9
%
30.8
%
18.0
% $50 4o0 4 15
.4%
17.7
%
19.5
%
23.1
%
2.9%
18.3
%
34.0
%
3.3%
29.4
%
19.3
%
13.5
%
21.1
%
28.2
%
15.8
%
16.9
%
35.2
%
16.3
%
26.8
%
19.8
%
8.2%
23.8
%
6.4% in
od 13.3
%
£ 406
155 03co Oix. 283
599
346 LO
roOCO
03CO
COCO
OOoLO
CMc*.CO 70
8 COCO 64
4 ooCOro
03COCM
COLO
LOLO
LOCO
IX.OCO
eo0oo0 3COCO 55
9 o>LO
fx. OLO
LOCO
CMCO
LT303CM
o 7.7%
3.7%
7.3%
5.4%
3.8%
6.6%
9.7%
6.0%
4.8%
5.3%
10.7
%
5.0%
6.8%
5.8%
2.8%
7.0%
4.6%
6.5%
8.9%
|
6.3%
6.2%
5.9%
5.1%
7.5%
4.7%
5.0%
6.2% co
10.3
%
5.8%
5.2%
o LO UDooCO
c*.o ix.oo04 LO O LOo>
LOCOCM
o LOCO CO § ooCM
COLO CM
0 303CO 03 to LO
CO OOCO 98
CO COCO CMco O
CMCM
OCM
LO
^x£ 0.
1%
10.1
% o®Oo 0.
4%
0.0%
0.2%
g?oo 0.
0%
0.0%
0.0%
0.0%
0.0%
0.9%
0.0%
0.0%
0.0%
0.0%
0.3%
s?oo 0.
0%
0.0%
0.0%
0.0% sS
OO 0.
2%
0.5%
0.1%
0.0%
0.2%
6.0%
s?OO 0.
1%
E - 166 o fx. o ro o o o o O o O o o o LO o o 0 0 O O LO O CM 0 LO
aoCM O CO
Empl
. COLO0 3 16
51 CMOOCO 19
93 CM■*»-o0 4 19
47
1917 o
CMoo 1979
2203
2220 CMo
CMCM 1607
2038 coo
CM
LO0303 21
93
2013
2135
2149
1827
2190 oo 2298
2385 LO
. O CM 2324
2162
| 21
44
2126
2056
2213
Pop.
3833
3865
3905
3922
3930
3933
3942
3957
3958
4025
4026
4035
4129
4131
4163
4165
4215
4218
4225 LOCM■*»- 4262
4280
4294
4362
4398
4452
4490
4516
4559
|
4565
4573
4617
IS
MN
MN < MN
MN
MN ID
Z MN < MN
MN SD < ID
ZoCO < < LU
Z < IDZ M
N
MN < z
s < MN ND z
sOCO < Z
s
Urba
n Pl
ace
Jord
an
Evele
th
Cres
co
Le Su
eur
jSa
uk C
entre
Princ
eton
Wah
oo
Oak
Park
Heigh
ts
Emme
tsbur
g
Victo
ria
Gran
t
Dyer
sville
Hot
Sprin
gs
Wau
kon
Coza
d
Ellsw
orth
AFB
Cam
anch
e
Hamp
ton
Auro
ra .2*CD
CO Fairb
ury
Pipe
stone
Wad
ena
Fores
t Ci
ty
Kass
on
Humb
oldt
Win
dom
Graft
on
New
Prag
ue
Belle
Four
che
Char
iton
Luve
me
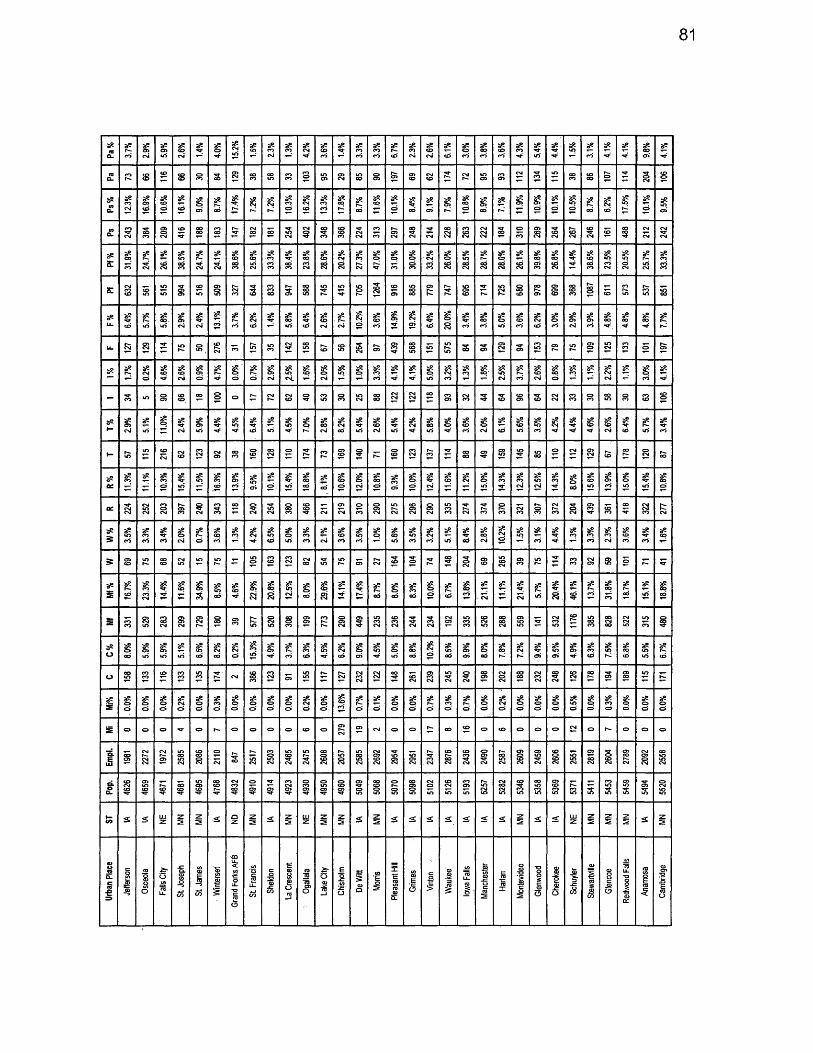
81
Pa%
3.7%
2.9%
5.9%
2.6%
1.4%
4.0%
15.2
% g
2.3%
aSCO
4.2%
3.6%
3.3%
3.3%
6.7% CO
2.6%
6.1%
3.0%
3.8%
3.6%
4.3%
5,4%
1.5%
3.1%
4.1%
4.1% as00
01 4.1%
toa . OO coCO
co COCO
l°
e 84 129 coCO
com OOCO 103 to©
O)CM toCO ©©h—O) cr>
CO CMCO
CM mOi 0001CM
134 tn coco 88 O 3
204 coo
Ps
%
12.3
%
16.9
%
10.6
%
16.1
%
9.0%
od 17.4
% g
7.2%
|
10.3
%
16.2
%
13.3
%
17.8
%
8.7%
11.6
%
10.1
%
8.4%
9.1%
7.9%
10.8
% asOicd 7.
1%
11.9
%
10.9
%
10.1
%
10.5
%
8.7%
6.2%
17.5
%
10.1
%
9.5%
tna . 24
3
384
209
4!6 OOOO 183 h—
182 co
254
402
348 COcoCO 224
313 h—O)CM 248
214
228
263
222
184
310 OiCOCM coCM 267
246 to
488
212
242
I pf
% I
31.9
%
24.7
%
26.1
%
38.5
% g
CM CM 38.6
%
25.6
%
33.3
%
38.4
%
23.8
%
28.6
%
20.2
%
27.3
%
47.0
%
31.0
%
30.0
%
33.2
%
26.0
%
28.5
%
28.7
%
28.0
%
26.1
%
39.8
%
26.8
%
14.4
%
38.6
%
23.5
%
20.5
%
25.7
%
33.3
%
£CMOOto
commlO O)©
COCO
o>oto co 3tooooooo
h—o>
OOcototo to
5to©
1264 co
© 885 O) ^r
r>.mOiCO f>.
mCM ©OOcO
0001
OiOiCOcoCOCO
h-coo coCOtn
h—com toOO
F%
6.4%
5.7%
5.8%
2.9%
2.4%
13.1
% gcd 6.
2%
as a£ooid 6.
4%
2.6%
2.7%
10.2
%
3.6%
asA
19.2
%
6.4%
20.0
%
3.4%
3.8%
5.0%
3.6% asCM
cd§od 2.
9%
3.9%
4.8% aseo
4.8%
7.7%
- CM OiCM
os’ 276 to tooo
CM
158
cO coto 264
© 439 coCOto In 575
3 3 129
Oi 153 o i toh- 109 tnCM 133 O 197
1% 1.7% CM
© 4.6%
2.6%
0.9%
4.7%
0.0%
0.7%
2.9% asto
cnIasco
2.0%
1.5%
1.0%
3.3%
4.1%
4.1%
5.0%
3.2%
1.3% g
2.5%
3.7%
2.6%
0.8%
1.3%
1.1%
2.2%
1.1%
3.0%
4.1%
- m OO) coCOOO
100 © - CMh- CM
CDo OOto ©CO toCM aooo
CMCM CM ao coOi CMCO 3 CO coOi CO CMCM coco Oco cotn oCO coCOco©
T%
2.9%
in 11.0
%
2.4%
5.9%
4.4%
4.5%
. 6.
4%
5.1%
4.5% ©
2.8%
8.2%
5.4%
2.6%
5.4%
4.2%
5.8%
4.0%
3.6%
2.0%
6.1%
5.6%
3.5%
4.2%
4.4%
4.6%
2.6%
6.4%
5.7%
3.4%
t - h— m COCM
CMCOooCM CM
©OOoo
OcoOOCM O f>. CO o>co OCO coCM co co
ooOi Oitn 3
mao© CM OiCM CO
oo OCM co
a?oc 11
.3%
11.1
%
10.3
%
15.4
%
| 11
.5% aSCO
cd 13.9
%
9.5%
10.1
%
15.4
%
18.8
% gco* 10
.6%
12.0
%
10.8
% a?COo i 10
.0%
12.4
%
11.6
%
11.2
%
15.0
%
14.3
%
12.3
%
12.5
%
14.3
%
8.0%
15.6
%
13.9
%
15.0
%
15.4
%
10.8
%
ae 224 CMmCM
OOoCM 397
240 oo
COOO
240
254 OOOoo
coco CMO)CM 31
0
290
275 COO)CM 290 toOOCO 274 ^r
co 370
321 ©CO 372
204
439 COCO 418
322
277
3?3 3.
5%
3.3%
3.4%
2.0%
0.7%
3.6% oo
4.2%
6.5%
5.0%
3.3%
2.1%
3.6%
3.5%
1.0%
5.6%
3.5%
3.2%
5.1%
8.4%
2.8%
10.2
%
1.5%
3.1% g asco
3.3%
2.3%
cd 3.4%
1.6%
3 ACO CO coco CMm m m - 105 COco COCM CMco to to o> f>.CM S O h— 148
204 OiCO
tncoCM
Oico to COco CMOi Oito o -
ss£ 16
.7%
23.3
%
14.4
%
11.6
%
34.9
%
8.5%
4.6%
22.9
%
20.8
%
12.5
%
8.0%
29.6
%
14.1
%
17.4
%
8.7%
8.0%
8.3% ©
© 6.7%
13.8
%
21.1
%
11.1
%
21.4
%
5.7%
20.4
%
46.1
%
13.7
%
31.8
%
od 15.1
% asOOcd
£ coO)CMto
COcoCM©O)CM
©CMf>.©OO O)oo to
©CMtoOOooo
©O) CON
©O)CM©3
to<oCMcocoCM 3CM coCM
CMOi mcoCOCOCMm
1 28
8 1
Oitotn 3CMOOm
CO tnaoCO 828
atn
480
%0
8.0%
5.9%
5.9%
5.1%
| 6.
5%
8.2%
0.2%
15.3
%
4.9%
3.7%
6.3%
4.5%
6.2%
9.0%
4.5%
5.0%
sO8saoad 10
.2% aStn
ad 9.9% §
od 7.8%
7.2%
9.4%
9.5%
4.9%
6.3%
7.5%
6.8%
5.5%
6.7%
o 158 OOOO cO COOO COOO 174 CM 386
123
o> 155 N f>.CM 232
122
148 COCM 239
245
240 ooo> CMOCM
OOco 232 ao
CM 126 ao
194
189 tn h—
s?£ 0.
0%
0.0% ©
c> 0.2% ©© 0.3%
0.0%
0.0%
0.0%
0.0%
0.2%
0.0%
13.6
%
0.7%
0.1%
0.0%
0.0%
0.7%
0.3%
0.7%
0.0%
0.2%
aso© 0.
0%
0.0%
0.5%
0.0%
0.3%
0.0%
0.0%
as©©
£ © © © - o h— © © © © CO o 279 O) CM © © ao CO o CO © © o CM © h- O © ©
Empl
.
1981
2272
1972
2585
2086 O
847
toCM 25
03
2465 to
CM 2608 h—to©CM 2585
2692
2954
2951
2347
2876
2436
2490
2587
2609
2459
2606
2551
2819
2604
2789
2092
2558
Pop.
4626
4659
| 46
71 OOco^r 4695
4768
4832
4910 O) 4923
4930
4950
4960
5049
5068
5070
5098
5102
5126 COOi
tntnto 52
82 co^rcotn 5358
5369 h—co
m tn 5453
5459
5494
5520
ST <
[ NE Z
2z2 .<
QN z2 < z
2 NE z2
z . 2 < MN < < < < < < < Z
2 < < NE MN z2 MN < MN
Urba
n Pl
ace
Jeffe
rson
Osce
ola
Falls
City
St Jo
seph
St Ja
mes
Win
ters
ef
Gran
d Fo
rks A
FB
St Fr
ancis
Sheld
on
La Cr
esce
nt
Ogall
ala
Lake
City
Chish
olm
De W
itt
Mom
s
Plea
sant
Hill
Grim
es
Vint
on
Wau
kee
Iowa
Falls
Manc
hest
er
Harla
n
Mont
evide
o
O01 O Ch
erok
ee
Schu
yler
Stew
artvi
lle
Glen
coe
Redw
ood
Falls
Anam
osa
Cam
bridg
e

82
Pa
%
2.3
%
6.5
%
2.3
%
2.1
%
5.3
%
4.3
% g
5.2
%
4.5
% GO
0.6
%
5.4
%
2.3
%
1.5
%
2.4
%
3.5
%
3.9
%
3.1
%
5.3
%
5.2
% vOo'*GO
2.2
%
2.0
%
3.4
%
6.3
%
2.4
%
4.0
%
4.0
%
2.2
%
5.3
%
5.6
%
6.4
%
£oom
co03 O i
COh*-co
COCO CM 16
5
170 CMCM
GO OCM
COLO 03
COOGO 10
4 |-*~C3 9
8 CM
156 CO
co COcoIM. £
CMCM
GOco
m ■oGO ^1
CMCOCM
Ps
%
12
.2%
10
.0%
11
.9%
15
.0%
15
.7%
13
.2%
9.9%
10
.6%
13
.1%
12
.6%
% aeCMGO 1
1.0
%
9.2
%
11
.5% vOo'*
COGO 1
1.8
%
12
.5%
13
.4%
17
.4%
12
.6%
8.5
%
15
.5%
11
.0%
10
.4%
12.1
%
12
.6%
10
.9%
8.8
%
11
.5%
8.9
%
13.8
%
£ COoCO
mCO
O i
48
4 03CO 2
13
34
4
35
8
28
3 i nOOCO
«CM
oCOCO 2
89 GO
CO 24
7 CMCMCO
0303CO
mCO CO
CMm 4
35
26
0 OOOi n
COCO 3
74
3COCMcoCO 3
84
31
9
CO 45
6
pf%
25
.8% seoo
CO 37.0
%
30.7
%
37
.9%
26.8
%
32.4
%
26
.5%
28.3
%
22
.6%
39
.8%
31.4
%
30.1
%
26
.8%
20.5
%
25
.8%
20.7
%
20
.9%
39
.1%
27
.8%
28
.7%
30
.6%
22.1
%
26
.2%
33
.9%
30.2
%
28
.1%
26
.2%
27
.5%
37
.4%
29
.6%
23.8
%
£ 65
9
11
36
11
03 O i
O i
o1-*- Oh*-
1-*-&CO 8
60 CMI-*-
I-*-03Om CO 8
85
89
9 03COGO CO
COI-*-
com
I-*-coCO CM
OCO
0303
03CO03
C3COGO
03GO
COi nGO
moGO
OOCM03
m03O i
I-*-
11
69 OO
ooI-*-
aeu . 3.
4%
7.1
%
4.4
%
7.9
%
CO 5.8
% ascoCM 17
.1%
4.6
%
2.9%
CO|
4.4
%
2.6
%
11.1
%
4.2
%
6.0
%
i n
g
i nCO
6.6
%
4.5
%
2.9
%
4.9
%
3.8
%
5.8
%
3.4% o
GO 9.2
%
8.8
%
3.6
%
17.3
% vpOGO
u . 1-*-OO
COCM
OCO i nCM 03 165 03
in 555 COCM CO
COO CM I-*-
h*- 34
7 CO
180 03CO CM
CO 155
OCM 156 03
GO 185 C3
CO GO9CM
m03
CMmCM 3
27 03
COGO CO
GOco COCM
3.2
%
2.4
%
2.1
%
4.8
%
2.4
%
2.2
% sOo'*in
0.9
%
1.2%
1.4
%
1.9
%
2.1
%
3.1
%
5.1
%
1.3%
2.8
%
2.2
%
0.9
%
2.1
%
2.6
%
1.5%
2.4
%
2.0
%
1.6
%
2.0
%
3.0
%
1.9
%
3.3
%
3.6
%
1.8%
4.4
%
2.1
%
-04oo CM1-*-
CMco
j 15
4 CO COco
COCO
OCO CO CO COco
Oco 03 15
9 CM8
4 cooCO
fM.CO
03I-*-
CMm r*-
CO 3CM
84 COm
CO 03CM GOm
a *»— 4
.0%
3.0
%
2.3
%
2.1
%
2.7
%
7.0
%
2.5
% oco
g
CO 4.8
%
3.4
%
3.9%
3.6
% asI-*-i n 6
.4%
3.3
%
CM 7.0
%
5.1
%
2.0
%
3.8
%
2.8
%
2.6
%
Oi n 3
.9%
4.3
%
3.8
%
5.3
%
2.0
%
2.9
% g
r*^
i—COo O i
ooO iCO
r-*-co 3
ooCM m
oomCM GO
OOo
m
111 h*-
O03oCM
0303
CO COCMCM
mCO 03
mCMCO COco CO03
C3IM. 9 03
ocoGO
-CO03 GO
CM COCM
250£ 1
9.2
%
13
.7%
14
.7%
16
.2%
18.5
%
03GO 1
1.6
%
11.8
%
14.4
%
13.2
%
11.1
%
12.9
%
03 13
.5% asop
13
.6%
17.0
%
29
.1% g
03 18
.0%
14.7
%
10.8
%
21
.3%
13.1
%
12.3
%
15
.1%
13.0
%
12
.6%
13.7
%
14
.6%
10
.3%
11
.8%
QCCMO i
CM ooCO h*-
55 57
0 COCOCM
GOCM
3COCM03CO
I-*-03CM
LOh*-CO
coCO
CMh*-CM
CMCM
COO
46
5 OOCM03
coCO 5
45
om
COCOCO OOO 3 5 co
CMCO CO . 4
47
49
6 COI-*- O
CMO iCO
w% 2.2
%
3.2
% g sGO
2.4
%
2.0
%
3.4
% spf c
2.4
%
3.1
%
3.6
%
3.7
% asmo i 2
.3%
5.1
%
4.2
%
2.9
%
3.3
%
3.3
%
3.7
%
1.7
%
5.4
% GO
4.3
%
2.4
%
1.7
%
2.3
%
0.9
%
3.3
%
6.0
%
2.9
%
3.3
%
3.1
%
com 03 s
mh*- CMcoh*-03
coCO GOOO
Ooo CM
-03co 16
0 I-*-CO CO
GOO03 10
6 OCM C3
m 186 co
mCOco CO
GO OcocoCO
mCM
OO
21
5 CO03 CO
104
Mf
%
20
.1%
9.1
%
18
.7%
10
.2%
2.4
%
15
.5%
25.7
%
10
.2%
18
.3%
28
.2%
15
.2%
22
.4%
30
.1%
13
.1%
27
.3%
23
.5%
20
.7%
7.5
%
11
.4%
5.2
%
18
.1%
30
.5%
17
.9%
25
.4%
15
.7%
18
.3%
23.1
%
16.0
%
20.0
%
GO 6.6
%
10.4
%
£ 55COCM
coin
COCMCO h - I m
mC3CO
0303
coCOco
LOm
COCOco
oo03
03o
89
9
Ococom
§ CMI-*-CO
GOm CMco
CO03
CMI-*-co 86
4
564 co
m COcomCO
CMCMI-*-GOcoCM
COCM
mCO
C% 6.0
%
6.4
% VPO
5.1
%
3.2
%
7.1
%
2.7
%
6.8
%
5.1
%
3.6%
5.6
%
5.1
%
3.4
% se03GO 9
.4%
9.3
%
8.1
%
5.6
%
3.7
%
7.7
%
5.9
%
4.4
%
6.1
%
5.3
%
7.2
%
6.3
%
3.3
%
8.9
%
6.9
%
8.6
%
6.5
%
13
.0%
O COm CM
O iGO
CO 100 O
CM m CM 140 O
oo03OO
CO
103 OO
CMGOC3CO
I-*-CM CM
GO OCM
COCOCM 2
05 co
COI-*-CMCM
03 GOCM
£ 03mCO
GOCM GO
CM03CM
CO
s 0.0
%
0.0
%
0.0
%
0.0
%
0.1
%
0.0
%
0.0
%
0.0
%
0.0
%
0.0
%
0.0
%
0.2
%
0.2
%
0.0
%
0.2
%
0.2
%
0.4
%
0.4
%
0.0
%
3.0
%
0.3
%
0.0
%
0.5
%
0.4
%
0.0
%
0.2
%
0.0
%
0.2
%
0.0
%
0.2
%
0.0
%
0.2
%
s o o o O - o o o . O o o m I-*- C3 co CM CO o C303 03 o GO CM o S - o co o m o I-*-
Empl
.
25
58
30
06
29
78
31
89
30
88
28
68
21
43
CMCO 27
28
22
52
33
88
28
20
298
7 CM 03CMCO 2
99
3 03CMI-*-CM
CO03CO 3
25
2 mCMC3CO 3
44
7
30
70
37
52
34
02
35
82
28
19
28
64
35
39
36
12
32
50
39
56
33
14
Pop.
55
46
55
55
55
82
558
3
56
34
56
36
56
90
56
93
LO 59
24
60
02
60
14
60
28
60
62
60
63 CM
co
fM.03s 6
28
2
63
19
64
42
65
40
65
62
65
68
66
56
66
58
66
92
67
03
67
98
68
14
68
26
68
84
68
87
ST < MN <
In
eJ
NE NE <
as < < < NE NE MN < < NE NE
as as MN MN < < S MN MN MN ND <
[n
eJ
Urba
n Pl
ace
Shen
ando
ah
Baxte
r
Oran
ge C
ity
Way
ne
Chad
ron
Holdr
ege
Clar
inda
Bran
don
Algo
na
Cent
ervil
le
Sioux
Ce
nter
Indep
ende
nce
Cret
e
Elkh
orn
Big
Lake
Maqu
oket
a
Red
Oak
Sidn
ey
Sewa
rd
Stur
gis
Madi
son
Litch
field
Waite
Pa
rk
Esth
ervil
le
Neva
da
Oelw
ein
Intern
ation
al Fa
lls
Fores
t La
ke
Wac
onia
Valle
y Ci
ty
Norw
alk
Platt
smou
th

83
Pa
%
3.7
%
6.6
%
3.2
%
3.3
%
3.3
% g?
uo 3.6
%
1.3
%
4.2
%
12
.5%
3.3
%
5.2
%
3.0
%
3.1
%
2.6
%
3.1
%
1.9%
4.4
% s s
cd 4.3
% 3®
CM 2.7
%
3.9
%
6.1
%
3.8
%
3.9
%
4.1
%
2.2
% 3®CM od
3.9
%
2.0
%
£ 132
221 uo £
186
UO <oCOto 12
0 CMO
rcoCO O 8
4 COm
uor— CT> 12
2 coto
23
4 CMan
CSJr— an
COCOto 03
P—COto CT)
3®tn
o . 11.0
%
16
.8%
14
.7%
12
.2%
10
.5%
16.7
%
15
.2%
14
.6%
13
.0%
13
.1%
9.0
%
14
.6%
13
.9%
14
.0%
17.5
%
13
.3%
11.1
%
13
.6% 3®
03 14
.9%
14
.0%
12
.4%
9.5
%
14.2
%
14.7
% 3®oood 1
1.9
%
23
.3% 3®
COc r i 1
2.8
%
13
.2%
| 1
0.5
%
Ql 8r o
o>UOuo 51
0
42
4 ooCOco 54
4 UOUOuo
03COuo
CSJ03 oo
CMco
OOO
CO
52
7 coCOan
mm
CSJCO
Om 4
04 O
CO 60
9 COCOtn 4
02 03
CO
58
3 CSJ03CO 51
0 OOoooo
COtoCO 5
50 an
COr ooo
pt%
28
.8% S«S '
>csiCO 2
2.8
%
26
.9%
24.7
% CSjodCM 3
1.9
%
29
.8%
27
.3%
44
.3% iS®
CM 31
.9%
27
.5%
30.6
%
32
.5%
33
.1%
26
.2%
28
.5%
26.0
%
odCM 30
.8%
47
.9%
27.4
%
36
.3%
26
.7%
21.0
%
34
.2%
32
.5%
29
.8%
26.2
%
20.8
%
41
.0%
£
1021
ooooo
03GO
uoco03 8
64 o
CM03
03CO O
CMuoCOo
03UO
COO
UOO
o03 §
ooo
Oco
mi
COco
COooo
o
1338
03tn oo
coCOo
oCO03 14
62
ooCOCM
t oCSJ
1125 co
o>oo CO
U . 4.4
%
5.4
%
4.2
%
6.1
%
3.0
%
4.7
%
3.8
%
4.6
%
4.2
%
4.4
%
5.6
%
2.3
%
7.1
% s®od 3.
5%
3.1
% gS
cd 6.3
%
4.8
%
5.5
% 3®
in 3.5
%
ocd 3
.8%
2.9
%
5.2
%
3.5
%
5.9
%
2.3
%
4.4
%
3.6
% 5®coC>
u .COm eo
CO
212 S
152 03
co 184 CO
CO UO 20
4 UOr—
coCM
COco ,
ooO 03
CM 251 03
o> 222
221 to 126
203CMCSJ
03
225 1**-
oo 03< 0.an
47
2
eS
2.6
%
3.1
%
1.7%
1.7
%
2.1
%
1.7% sS c?rsi
2.8
%
0.7
%
2.9
%
0.5
%
2.0
% a®cq3
.5% 3®
O)
2.0
%
2.3
% a®CMrsi 2
.5%
2.9
% £rs i 1
.9%
2.2
%
1.6
%
5.9
% 85 3®cq
2.2
%
2.3
%
1.1
%
2.4
%
COCT> 102 OO
uo03uo r—UO t o 29
1 COCO 03
105 UO 03
CO03CO
mCO
03oo 03 CM
03 O CM 03 oo oomCO
OCOCSJ t ooCO
CSIoo eo03 §
| 10
8
3®t - 3
.3%
2.5
%
8.0
%
2.4
%
4.3
%
5.3
%
6.2
%
5.0
%
5.2
%
2.0
% 3®eo
2.6
%
3.1
%
10.5
%
5.5
%
2.5
%
4.9
% 3®Csl
5.7
%
7.4
%
4.3
% 3®uo
5.3
%
3.4
%
4.2
%
sOO'*cocd
3®
3.2
%
4.2
%
cd 27
.2%
2.0
%
1—CO Csl
OO 27
9 UOoo
O cor—
COCMCSJ
CMOCSJ
oo03 COCSJ
to COoo
COo 03
cooo 3
co . ^ 2
07 o>
COCSJ OCO
tooo CO
COCMCM
GOCSJ o>CO
CO o>ooCMCSJ
COt o
11
64
O )
<5OC 1
5.2
%
18
.0%
15.1
%
14
.4%
9.6
%
15.4
%
16
.2%
15
.2%
13.4
%
16
.1%
12
.0%
I 14
.5%
13
.0%
12
.0%
13.9
%
11
.4%
15.7
%
16.6
%
13.3
%
12.1
%
13
.2%
11.6
% 3®
od 10.0
%
16.7
%
10.7
%
10.2
%
15.8
%
15.1
%
17
.1%
10
.5%
12
.7%
oc03 . COan
ooCO
rsiCs|uo
COouo
COco
CMOuo
03uo 6
12
50
9
21
0
44
0
44
4
46
4 O03CO
COCOCO
OCOCO
comuo
03OO
57
5 OOCMUO
COtoCO 3
80 CO
COr—
COCO OCO
03COan 7
35 an
OOOan
w% 4.0
%
rs itT
2.3
%
3.7
%
2.0
%
3.2
% S 'oo
2.5
%
0.6
%
3.5
%
2.2
%
1.3
% cors i 2
.0%
4.2
%
4.5
%
2.7
% 3®cq
2.8
%
4.8
%
2.5
%
2.2
%
2.6
%
4.4
%
1.9%
2.1
%
1.0
%
1.9% s®
O)
2.0
%
2.3
%
s or—
ouo
COCO
03CSJ uo
tooo CM
P—uooo oo
Oco-
co COo m
CO 5 CO03
03o
201 CSJ ao
oCM
CMOO 10
0 COoo CO
o>o
fs. CO 104
£ 16.9
%
5.3
%
17.5
%
21
.1%
32
.3%
11.7
% 2?cq
10
.4% 03
od 2.8
%
24
.3%
19.0
%
24
.0%
6.2
%
12
.4%
21
.2% sOO 'oo
cd 9.5%
18
.6%
14
.7%
14
.9%
10
.9%
29
.9%
12
.5%
od
34
.0%
17
.3%
5.9
%
26
.2%
22
.0%
9.0
%
12
.9%
£OCO
£ oCOcoco
03CSJ O
OOco ooCSJ
03 CO toCO 03
ooCMCO
OCMOO
ir>COCSJ
CMCSJ CSJ
ooCOco
uo COOOuo 6
48 uo
03CMtoCM
CO COco
03oan 7
40 an
CMCMo0303 503 3r o
CO03an
C%
7.1
%
5.9
%
8.1
%
7.9
%
4.9
%
5.9
%
8.3
%
9.7
%
5.7
%
1.3
%
4.6
%
5.4
%
3.5
%
8.7
%
5.0
%
3.6
% 3®m
6.4
%
10
.3%
5.8
%
6.1
%
3.7
%
5.6
%
5.2
%
4.6
%
4.3
%
6.6
%
5.3
%
3.2
%
6.1
%
3.4
%
3.4
%O
CslanCsl
CO03
CS|GOCM 27
6 c ooo 3
coCMOOco
COCSJ to
03 03 03CMCO 16
8 coCSJanCMco
comCSJ
03CM
COcoCSJ
COCO CO 23
5
198 co
oo o>
28
2
201 CM
26
4 CO COm
38s 0
.2%
0.0
%
0.0
%
0.0
%
0.0
% 3®oo 0
.2%
0.0
%
0.2
%
1.0% o
o 0.0
%
0.4
%
0.4
%
1.0%
0.5
%
0.2
%
0.7
%
0.0
% 3®oo 0
.0%
0.4
%
0.0
%
0.1
%
0.0
%
0.0
%
0.0
%
1.9%
0.0
%
0.0
%
0.1
%
0.0
%
£ CO o o O o o oo o CO co o o CSJ - coCO 03 CO
CM o o o oCSJ O an o o o CSJr— o o an o
Empl
.
3anCO 3
32
7 ooCOCO 3
48
2 P—033 3
25
8
36
59
40
27
37
97
130
8
36
64
03CSJCO 3
41
2
37
76 fs.
CMCOCO 3
40
9
43
59
39
74 03
COCMo
4341
45
49
42
18
38
06
39
78
44
34
42
77
38
14 CMP—
CO 42
96
42
87
45
82
Pop.
70
47
72
22 oo
CMCM
72
57
73
39
73
48 S
uoCMUOP— 7
59
7
75
99
76
33 03
COr*-
t o
77
64 CSJ
eoCOCOCO
3o>
80
23 oo
ooo
coao
CSJ
oo 81
76
81
92
84
10
84
93 CO
ooanoo
COotooo
t nfS.oo 8
82
0
89
59
89
68
IS < az NE < < z
2 MN NE < az < Z
2 < NE ZS < z
£ NE Z£ NE < < < Z
£z£
z£ a
z < z£ <
Urba
n Pl
ace
Was
hingt
on
Devil
s La
ke
Nebr
aska
Ci
ty
Atlan
tic
Denis
on
Detro
it La
kes
East
Gran
d Fo
rks
Blair
Cres
ton CQ
U_<0
1
Perry
Little
Falls
Knox
ville
Gerin
g
Gran
d Ra
pids
Charl
es C
ity
Mont
icello
McCo
ok
North
Bra
nch
York
Clea
r La
ke
Deco
rah
Web
ster
City
o
ooO
Thief
Rive
r Fa
lls
Was
eca
Wah
peto
n
Spea
rfish
Moun
t Pl
easa
nt
Alex
andr
ia
Allia
nce
Wav
eriy

Pa %
2.2%
13.9
%
2.7%
2.0%
| 3.
2%
3.7% 3.4
% S9oo
toOL O 14
9 CM 97 coCOO i 17
3 CMcn
sec l
o9CMCM* 18
.3%
11.9%
oo 10.1%
13.8%
17.4%
12.6%
(AOL
CMcom
CMOh -
3CO
coO iCO
olO
CMCM 891 cn
co
£ 36.5%
27.9%
22.0%
37.6%
31.6
%
45.9
%
40.6%
32.9%
£ooooco
CT>COO 10
03 cooo 16
52
2400
2078
1718
F% 5.5%
2.7%
5.9%
6.8% 5.4
%
2.7%
3.1%
4.4%
U .U*>CM
CMOO iCOCM co
ooCM
O OCO
aoCMCM
1% 5.1%
2.8% 2.3
%
7,7%
2.9%
2.3% o>
OOco 1.1
%
cocnCM
o>o
coo
CTih -co
co oo M-O i CO
m
a s►- 4.
3% 3.6%
5.8%
2.3%
4.4% S9
CMco 3.1
% S9
1- O io>
0>co
COCOCM CM
ooco to 0
01
s9O! 10.
2%
.
14.6%
14.4%
12.4%
15.4%
6.3%
13-3
%
6.9%
CL 471 oo
LOeococo
609 COOoo
Ococo eo
coCOcoCO
S95:
geCM 2.
6%
o9coCO 2.6
%
4.2%
2.0%
1.9%
2.4%
5 CO o>O i CO CM
O i
106
O icoCM
Mf %
17.6%
6.9%
22.5%
13.5%
16.8%
14.4% 8.7
%
30.3%
£ 812 m
coCM
CM • O coCO eo 75
0
445
1584
gso 2.7
%
5.2%
6.6%
6.0%
5.9%
3.5% 3.4
%
5.0%
oM-CM 20
0
299 co
O iCM 31
0 eocn CO
COCM
s£E 0.0
%
11.4%
0.0%
0.1%
0.0%
0.5%
I
0.0%
0.0%
E ococo O O CM o o
Empl
.
4620
3830 o
COCO-n- 49
07 coCMCMco 52
24 CMCM
5229
Pop.
9105
9157
9237
9509 coO i 9747
9765
9832
IS <z> MN < < Z
2 MN □CO <
Urba
n Pl
ace
Grinn
ell
Virg
inia
Le Ma
rs
Fairf
ield
Sarte
ll
St Pe
ter
Verm
illion
Pella

85
APPENDIX B
City Employment Data and Percentages by Function (alpha sort)

86
Pa%
5.4%
6.3%
3.9% S3cq
4.5% 33
03co 9.
8%
1.5%
20.5
%
3.3% ao
5.3%
6.5%
4.9%
5.0%
5.5%
1.7%
4.1%
4.1%
2.6%
2.4%
1.3%
3.2%
5.3%
5.2%
3.5% 33
COcd 3.
2%
4.4%
3.2% 63
reQ . OCJ> a> CN( 0 CJ> CNCN( 0( 0 O
CN03 CNCO LO 03r*-
CO03 9 s :
CO 03r*- LO <0<0 03co Oco LOr*-OO 03
O Oco s 9 CNco Or*-CO0
Ps%
8.5%
10.3
%
9.1%
12.8
%
13.1
%
13.2
%
10.1
%
15.0
%
9.0%
12.2
%
14.2
%
11.0
%
10.0
%
12.4
%
9.2%
S3-00cd 12
.3%
15.5
%
6.7%
8.1%
12.1
%
11.5
%
14.6
%
14.5
%
10.7
%
10.6
%
9.6%
13.5
%
8.9%
11.9
%
12.9
% S3LO03
CL 5O( 0 9
OSS coLOCOLOCOLO
CN 03 OO10 CN
coCOCN coCN 0
COgz OCO r*-10CO
<0LOCO0co co CO COco 00r*-co
03co10
<0CO03ao I
•crcoCN
co coco 282
242
ac 25.4
%
31.8
%
25.2
%
26.2
%
28.3
%
20.8
%
25.7
%
27.9
%
23.3
%
26.9
%
I 25
.1%
31.9
%
37.8
%
22.3
%
23.6
%
21.9
%
26.1
%
21.4
%
27.8
%
24.0
%
25.6
%
20.5
%
29.8
%
31.3
%
30.5
%
26.5
%
33.0
%
29.5
%
41.2
%
34.0
%
24.3
%
33.3
%
£coCN
coo> r*-o>CO
LOCN CN
r*-CO03co CO
LOLOLOCO
OLO LOCO03 5 cot o
(0CO 0303 COco
10C0 COco 5CO(0CO
OOcoCOcococo r*-
<0 1201 03LO
COO ' LO
Ocoao s 484 LO
OO 9CNCOLO LOCO
%j
12.5
% 5?inin
S3( 0CO 4.
4%
4.6%
3.6% 33co
3.7%
6.2% 33
CO 4.3%
6 .5 % S3
7.8%
4.7%
3.3%
5.7%
6.5%
3.4%
4.4%
4.0%
4.2% 33
CO
4.6%
5.6%
17.1
% 33aoCN 2.
6%
3.6%
1.4%
2.9%
7.7%
LU 03oCN
( 0co r*-LO 03 <0
CNtoLO 0 r*- O CN O coCO CO
CN CO -CNr*-
r*-CN 9 tor*-co 18
4 coLO
O LOLO -CO
-0CN
coCO
r*-03
2 *
2.8%
3.5%
1.1%
2.3% 33CN
33
3.0%
3.0%
3.6%
1.7%
2.5%
2.4%
2.4%
3.0% 33cq 33
LOCN 0.
7%
2.0%
4.9%
2.9%
2.0%
1.3%
7.2%
1.6%
2.9%
0.9%
2.1%
0.5% 35
2.3%
S3CN
4.1%
- r*-■*r LOLO
co OOCJ> CO OO co<0
coco COCN
03LO - LOCN
CNCN ■*r
LO 03 03CO CO r*- £3 CN 03
CNco LO CO
COco co CN CNCOcoCN
CO0
%i
g5COin 4.
3% loCO 3.
1% 33co 27
.2%
5.7%
4.6%
5.4%
2.4%
22.2
%
6.8% 33O
co 4.8%
8.3% 33cq
5.1%
vO
cd 2.5%
6.3%
19.3
%
6.4% O
id 6.1%
4.3%
8.0%
2.8%
6.1%
2.4%
4.1%
7.6%
3.4%
»“ aooo eg o(0LOCO co 11
64 0CN 03LOLOco LOOO
COCOco
SH 03ao co r*- co0 LOCO
<0 COcoCNO CN
03CN
03OCNCNOCN
0 sao10CN 9 10
0 co 00LOcoCO co
Od 12.9
%
8.1%
g?co 17
.1%
14.4
%
10.5
%
15.4
%
10.6
%
11.0
%
14.4
%
11.4
%
10.2
%
13.7
%
14.2
%
11.9
%
16.3
%
10.7
%
10.8
%
12.1
%
18.3
%
11.3
%
12.8
%
15.2
%
6.4%
15.0
%
11.8
% S3coad 13
.1%
14.8
%
13.4
%
9.4%
10.8
%
O ' LOCN
LOCN COCN
LOCO CN03CO LO
CNCNCO
LOCO 50
0 CDaoCN
CN5
r*-CN
co<0 CO
LOco O OOLO
CO03CN
r*- CNCN(0
cor*-LOC0CN co
CO 9 LO CN03CN
0 3OO 207 r*-
CN
w%
5.3%
4.0%
2.7%
2.9%
3.1%
2.0%
3.4%
3.7%
2.2%
2.3% 33
3.0%
3.2%
2.6%
1.1%
2.8%
2.5%
2.2%
2.0%
0 .5%
4.2% 33cq
1.7%
2.8%
2.4%
3.0%
2.6%
0.8%
2.8%
1.5% c3cp
3 : aoco CN( 0 CO■*r CN co co !C * 9 OOO S3 LO<0
r*-03 CO S COCO ao■*r 03
CNcoco co CO CN 03 OLO
aor*- CNLO CN LO CD P3
m 10.7
%
18.8
%
23.2
%
22.0
%
18.3
%
9.0%
15.1
%
17.5
%
11.2
% g
CN
seco03
33LOco 9.
1%
20.5
%
18.3
%
6.4%
29.3
%
20.0
%
26.6
%
21.2
% 33LOcd
33COr*-'CN 10
.4%
21.6
%
17.0
%
10.2
%
18.2
%
13.2
%
16.1
%
16.0
%
29.4
%
18.8
%
m 03 CNa>CNCOCOco
CO03
0303■*r
scoLO CO
CNCN
CNr*-
COcor*-
OCO03OOCN
COCN
co00
03LOCN
<0CO co03coco
OOCO
coCO
03030303co
035
OOCN CO
COcoO
CN03CO
CNCN 644
480
o r*-* 6.1%
10.6
%
6.1%
5.1% 33
CO
33LOLO 11
.5%
4.7%
7.9% 33
03CN 6.
5%
6.4%
8.4%
13.2
%
10.3
%
2.9%
11.1
%
6.0% 33
(0LO
33cd 9.
4%
9.7%
7.1%
4.2%
6.8%
11.2
% 33LO r*-* 8.
3% S30r*-’ 6.
7%
o CN 9coC0 <0CN
O (0 LO <0 0co<0CN
co 03co CN03 LOr*- co 22
0
co<0CN
03r*- O03
CN10
coCO
CN03coCNco f2 CN
03 CO03
CN ao COLO
l i 0.5%
0.3%
0.0%
0.0%
0.0%
0.1%
0.0%
0.0% 33
00 0.
0%
0.0% ®3"00 0.0%
0.0%
0.0%
6.0%
0.0% 33
OO 0.
0%
0.0%
12.3
%
0.2%
0.0%
0.0%
0.0%
0.0%
0.0%
0.0%
0.0%
0.1%
0.0%
0.0%
E ao LO o LO 0 0 0coCN 0 O 0 0
r*-co CO 0 0 0 0 0 CN 0 0
Empl
. co<0( 0 1552 co
LO<003CN
ooCNCN
aoCN
CN03OCN
CNr*-CN 9(0
CNcoco
r*-coCO
LOCO
3006 CN03co
CO <0CN
1267 03
■*r03
co0CO<0<0
<0LO 03CN
CO 4027
1147 CN
r*- CNCO
000COco
cor*-03
LO co03
2558
Pop.
3435
2839 <0O
r*-co 8820
LO 8959 03
LOcoCOCN OO
CNLOCN 33
50
4225
5555 CN
<0co
COCOCN
LOCOLO
OOOOCN
03OOco 25
60 COcoco
LOCO 60
63 CNLO
OCOCN
CNcoCO 56
93
3559 03
CO 3500
2965 LO
CNOCNLOLO
HCO < z
s < z2 < UJz < Z
2Z2 < UJz UJz M
N
MN
MN O
CO < Z2
< MN O
Zz2
UJz < MN O
CO MN UJz z
2 MN < z
2
Urba
n Pl
ace
Adel
Alto
n
Albi
a
Alex
andr
ia
Algo
na
Allia
nce
Anam
osa
Ann
anda
le
Appl
eton
Atla
ntic
Aubu
rn
Auro
ra
Baxt
er
Bayp
ort
Beck
er
Belle
Fo
urch
e
Belle
Pl
aine
Belle
Pl
aine
Belm
ond
Bens
on
Beul
ah
Big
Lake
Blai
r
Bloo
mfie
ld
Blue
Earth
Bran
don
Brec
kenr
idge
Brok
en
Bow
Byro
n
Cale
doni
a
Cam
anch
e
Cam
brid
ge

87
Pa%
2.7%
4.1% 6.7
% aSco
4.9%
5.3%
3.9%
3.1%
4.4%
4.4% aS g
CM 2.1% g
CM 1.6%
2.4%
3.3% aS
CM
2.3%
6.1%
5.1%
• 3.3
%
2.7%
3.0%
3.3%
5.7%
6.6%
5.8%
2.3% OO 3.6%
IQ0. co coCO 12
0 coC 3 coCO
COco C3
eo O 10 CM10
03CM 16
5 C*> 0310CO
CMCM
03S CO 03
CO COCM
0310 10co 12
2 10 £ coco CM
CMCOeo 10 O
co
ae
Ql 12.3%
5.6% 6.1
%
12.6%
12.5%
15.7%
9.8%
13.3%
10.1%
9.6%
17.8%
9.9%
9.7%
14.0%
9.9% as
oocd 10
.9%
10.7%
13.0%
11.0%
14.2%
5.4%
8.7%
12.4%
10.5%
10.5%
16.7%
j
16.8%
13.1%
14.1%
10.6%
15.2%
Ma . 25
1 O03 10
9 cocoCM
cor-*- OO 201
455
264
366 CO
CM03CO
03CO
coCM CM
r*CMCM 20
2 CM03
oCOCO
03coC0
coCO CMCM
COCO10 15
9
368
544
559 03
OOCO
CMCO 55
5
&s£ 23
.0%
| 23
.1%
26.0%
22.6%
30.2%
37.9%
25.8%
33.1%
26.8%
30.8
%
20.2%
32.4%
30.7
%
30.8%
27.0% CO
CM 20.4
%
22.8
%
27.3
%
30.1%
36.3
%
31.7
%
27.3%
47.9%
31.8
%
24.7
%
28.2
%
32.7
%
24.2% as
CMcdCM 28.
6%
I
31.9%
£ObCO
03COCO
COco
03C3lO03 O
coCO
OCO 0303CO
10COco
105 *
03CO
CM9 13
38 033
h*.co
oco
1035 0303
coOOco
eococo
10C3
2179 CO
OO coco 03 10
88
349 h*.
10 489
1169
a?u_ 5.7
%
9.1%
14.7%
2.9%
4.0% 3.1
%
4.7%
3.1%
3.0%
5.9%
2.7% 2.8
%
4.7%
5.1%
4.2%
8.2%
3.5%
5.5%
4.2%
2.6%
3.8%
2.9%
10.2%
3.5%
10.5%
3.0%
4.7% 5.4
%
5.3%
4.3%
3.3%
3.8%
COCOCM
lOco
cotnr-*-03 CO
03h*.o 03 C 3 CO
100310 co CM
CM 3co CM 10
4
160
145
CO 264
COoCO 10
4
152 ao h*. 10
03 1003CO
ss
1.8%
2.3%
3.8% S '
1.6%
2.4% vO as
03aSeo 2.9
%
1.5%
1.5%
2.4%
2.9%
CM 0.5%
0.5%
2.4%
2.8%
3.1%
2.2%
0.4%
1.0%
2.1%
cd 2.1%
1.7%
3.1% V?O'*
co
1.8%
1.9%
1.4%
-coCO
r -co
coCO C3 CM
CMco CM
CMlOco
CMCM CO
OC co
CO10CO CM co
CM - - 10 coC3 03 eo 10 10CM 03
0310
CMC 3 03 C3 coco 10
T% §
7.4% as03
cd
ascp
5.2%
2.7%
5.6% aslO
CM 4.2%
5.0% aS
CMcd 2.5
%
9.7%
4.3% 3.0
%
3.0% 5.9
% gcd 5.2
%
3.6%
3.4% aS
CMod 5.4
% as10
aScp10 4.3%
5.3% aS
10
6.3%
3.3%
10.6%
6-2%
t— oo03 CO
CMcoo CM
eoco
eoC3 03
1003CO s § 10
OO 03CO 5*
coCM COr-*- co03 C 3 oo
CM 1003
C3 h*.CO
C3OO
O10
coh*. CM
OO 03CM co
coCMCM
s?o i 12
.8%
j 16.3%
11.0%
13.2%
12.4%
18.5%
17.9%
11.4%
14.3% g
cd 10.6%
11.6% ss
C 3cd 13
.2%
11.6%
13.8%
10.8%
10.5%
13.4%
9.1%
10.0%
9.9%
12.0%
11.6%
11.1
%
9.6%
15.4%
18.0%
14.1%
12.4%
7.3%
16.2%
o i 261 O
COCM
eo03 03
CMCM O
10h*.coco
O03CO
CMCO
coC3 21
9
248 10 10
10 150
03 CMCM
h*.03
0310 27
2
coCO
10
310 co
CM10eoCO co
co 502 O
COcoC3CM
COCM
CM 594
sSS 5.
7% 3.9%
3.4%
3.6%
2.3%
2.0%
14.2%
4.2%
4.4%
6.8% 3.6
%
1.7%
3.5%
4.8%
2.2%
3.1%
1.9%
4.1%
2.5%
2.3%
2.6%
2.6% 3.5
%
2.5% j
4.5% 3.7
%
2.0%
2.1%
5.7%
5.1%
4.7%
3.2%
5 co COCO co OOO
CMCO
CMco
CM03CM
5 2 oco
10 COCO
OS 03oCM
OOCM
CO 03CO CO 10
0303CO 10
0 OCO 03
03CO
03CM 10
coo CM
CO £ OGO
ao
s£m
Sv»10xrCM 17
.7%
13.6%
28.2%
15.2%
2.4% sPS '
03cd 21
.2%
20.4%
17.6%
14.1%
25.7%
16.3%
14.9%
| 26
.0%
26.9%
34.0
%
24.9%
18.9%
30.1
%
12.5%
23.7%
17.4%
10.9%
10.3%
32.3%
11.7%
5.3%
%m
23.1%
20.0% 7.8
%
£ 500 CO
eoCM
(0coco CM
CMco
CMCM
CMCO10
03C3CM
O03CM
1010
co 648 r *
COco
CMr-*-co
eoC3h*.
03CO CO OC 303
CO 10h*.CM
039
1003 10
1129 O
coCO
03co eoC 310 co
ao
aso 5.5
%
9.7% 7.9
%
3.6%
6.6% 3.2
%
5.8%
3.6%
9.5%
8.0%
6.2%
2.7%
5.6%
6.1% 9.5
%
5.9%
5.8%
7.3%
5.7%
3.4%
5.2%
5.4%
9.0%
3.7%
7.1%
4.9%
5.9%
5.9%
9.2%
5.0%
8.3%
8.3%
o CO
155 5 Oco 03 100
120 co
CM 248 10
03h*.CM 10
OGO
coCOCM 12
3 CMOO
OCM 13
8 coCM 10
3 co03 CO
COCMCOCM 16
7 coo 5
CO03
co03
CMCO
C 3
304
asE
©SOo 0.0
%
0.0%
. 0.0% 0.4
%
0.1%
0.0%
0.5%
0.0%
0.0%
13.6%
0.0%
0.0%
0.0%
0.0%
0.0%
0.0%
0.0%
0.2%
0.2%
0.1%
0.0%
0.7%
e> 0.8%
0.0%
0.0%
0.0%
0.0%
0.0%
0.0%
0.2%
E o o C3 tn- O C3 27
9 o C3 o o C3 o C3 CO - 10 C3 03 o - o C3 o - C3 C3 C3 ao
Empl
.
2038
1599
1794
2252
1386
3088
2056
3409
2606
1185
2057
2143
1439 co 1294 CM
coCO
oooCM 18
82
3797
2987
3806
1160
2585
4549
1517
3497
3258
3327
1440
2202
1709
3659
Pop.
3795
3110 03
5924
2998
5634 co
h*.inCMOO
03COCOm
CMCMcoCM 49
60
5690
2968 CO
eoCMCM
10h*.03CM
CO<£>
3905 0310r*
OOCMC 3CO
CM03ao 25
97
5049
8172
2980
7339
7348
7222
3001
j 403
5 CM
CO 7501
H(/) MN SD < < NE NE < < < MN MN < < < MN MN NE < NE MN NE < < SD < MN
ON MN < < MN
Urba
n Pl
ace
Cann
on
Falls
Cant
on
Carli
sle
Cent
ervil
le
Cent
ral C
ity
Chad
ron
Char
iton
Charl
es C
ity
Cher
okee
Chisa
go C
ity
Chish
olm
. Cl
arin
da
Clar
ion
Clear
Lake
Coka
to
Cold
Sprin
g
Coza
d
Cres
co
Cres
ton
Crete
Croo
ksto
n
David
City
DeW
itt
Deco
rah
Dell
Rapid
s
Denis
on
Detro
it La
kes
Devil
s La
ke
Dilw
orth
Dyer
sville
Eagle
Gr
ove
East
Gran
d Fo
rks

88
<0o . 7.
0%
1.5%
23.8
%
3.2%
ssN
3.4%
oSto
2.9%
2.0%
5.9%
2.0%
4.0%
3.8%
s srd 4.
1%
2.7%
5.4%
2.9%
3.3%
7.4%
15.2
%
2.6%
4.0%
5.2%
2.3%
2.2%
[ 6.2
% |
2.9% CO
c d 4.3%
6.2%
s soo
coQ- CM05 23
7 roi n
COCO
m cor - rom 05
co f— § NLOr -
O 05CM 13
4 r*-LO 05m to
05CM to
oo min 05
CO O f—OOi n CO
o> 124 05
05
Ps%
10.9
%
9.2%
17.4
%
16.6
%
14.6
%
11.0
%
15.9
%
9.7%
SSod 10
.6%
9.0%
10.9
%
6.3%
14.0
%
6.2%
13.5
%
10.9
%
9.4%
15.0
%
9.3%
17.4
%
17.5
%
16.3
%
10.4
% s soo 12
.2%
11.4
%
12.6
%
7.1%
13.2
%
13.8
%
9.6%
CL. ? o>OOCM
rof— f—CM
o>ooCM
roCO 26
3 f — co05CO
05oCM 207 oo
CO 05 CMLO co 145 05
COCM 18
3
COCM 20
1 COoot o
COcnCM
cnCM 24
8 CMcoint oCO
COLOCM s
05CO
CMCMCM 20
0
£ 30.6
%
26.8
%
26.9
%
32.4
%
35.6
%
26.2
%
25.9
%
23.6
%
37.6
%
26.1
%
26.7
%
26.2
%
26.4
%
30.6
%
23.5
%
30.5
%
39.8
%
24.7
%
21.3
%
37.0
%
38.6
%
32.5
%
30.4
%
33.6
%
30.0
%
36.5
%
26.6
%
30.4
%
28.0
%
26.8
%
36.2
%
20.5
%
£ 404 o>
roeo
ooCOCM m
moi"-. o>oo
CM COCOoo
mLO CO
ooCM05
co05CO
I"-LOCO
05CMCO
oof —05aOO
05CO
5eo CMCO 10
81 cncn
747
885
1688 CO
tomCMf—
OI"-
CMOOto
I 42
8 I
SSl i . 4.
0%
11.1
%
8.3%
5.8%
3.8%
3.8%
2.4%
3.3%
6.8%
5.8%
3.2%
9.2%
5.7%
sSod 4.
8%
5.4%
6.2%
4.7%
5.1% g
3.7%
3.5%
4.1%
4.5%
19.2
% SSin
5.2%
3.0%
5.0%
sSooi n 4.
0%
SSin
u. rom
f—CO
COoo 05 m OCO O O
CO COCO
COf— CMCO
LOeo
cocn 12
5 ooLO
COLO 05 O05 o05 cnoo OOm
0505 56
8
255 CM
co t o05CM
int o CO o
££•vPo'-r*-cm 5.
1%
1.1%
3.2%
3.1%
•vpS1**co
1.7%
4.3%
7.7%
4.6%
0.6%
3.3%
1.9%
SSoo
2.2% s s
CMcd 2.
6%
3.2%
2.3%
1.2%
0.0%
3.5%
0.3%
1.6%
4.1%
5.1%
3Soo g
2.5%
2.2%
2.4%
1.6%
- coCO
o>-
roU5 CO s
OOCM
ooI"-.05f—ro
O05co oo
CM05CO
oom 3 COCMCO - CM o
LO-
coCO 12
2 coCOCM
toCO t o cot o oo
CO CO
SS»— 2.
7%
5.7%
2.3% SSo
CM 4.6%
5.0%
7.3%
4.7%
2.3%
11.0
%
2.9%
5.3% o
LO
| 10
.5%
'
2.6%
5.5%
s sLOcd
sSooCM 6.
9%
4.5%
4.5%
5.5% i o
LO 2.6%
4.2%
4.3%
5.4%
2.8%
6.1%
7.0%
7.9%
s sooi n
H coCO
r*-i"-. COCM
COCO 05
oCM meo
m coCM
coCO
COOO mr -
LOC75CO CO
C75i n LOeo 3CMCM OO05 oo
CO 3 CMeo ooLO CM
05o> co IS
05t o
OOZ CM
oCM
s£0£ 11
.8%
13.5
%
11.3
%
13.6
%
9.7%
13.1
%
15.6
%
9.3%
12.4
%
10.3
% ssoood 12
.6%
12.4
%
12.0
%
13.9
%
11.5
%
12.5
%
7.1%
12.2
%
11.4
%
13.9
%
13.9
%
10.8
%
9.9%
SSoo 10
.2%
14.3
%
11.1
%
14.3
%
8.9%
12.3
%
13.5
%
occot o CM
CMCO CO
CMCM
o>3 25
8 05co
05oCO
CO.o 'CM
CMoCM 44
7 cooo
455 CO
COCM O
CO05CO I"- ^ r
CMoo ^ r
co 3 05 to05CM
O
224 a
cn 256 05 CM
OOCM
w%
2.2%
5.1%
1.4%
1.3%
| 2.
0%
2.4%
3.1%
1.3%
2.6%
3.4%
2.2%
3.3%
3.9%
2.8%
2.3%
6.4%
3.1%
6.0%
4.5%
2.2%
s sCO
2.0%
3.4%
1.5%
3.5%
2.4%
3.4%
3.8%
|
10.2
%
cd 2.1%
3.4%
a 03CM
Oco CM05CO
COoo U)
COCM 12
9 eoco
Ot nOO 05
LOCOo 05
LOC75CO
i nf—CO
80 r*- - mco 3 CO 3
cn LOCOCM o> 3
1 16.4
%
13.1
%
3.3%
5.0% §
u i
25.4
%
9.4%
sSCMooCM
SSt ord 14
.4%
35.2
%
16.0
%
29.8
%
6.2%
s sGO
05 14.9
%
5.7%
33.1
%
12.0
%
8.2%
4.6%
12.4
%
16.1
%
19.5
%
8.3%
17.6
%
19.1
%
19.3
%
11.1
%
15.5
% s s05CM 26
.8%
1CO o>o ro
roCOoo o
COcoeo
in mLO
CMcoCO
COooCM 80
8 mCOm
f —3
mroCM
eoCMOO
comCO
c - 05CO 5
- O CO CM
COcn 3 CMOO 22
7 eoooCO
eoooCM 5 f— 05in
m
c%
7.0%
8.9%
2.8%
6.7% saoo
5.3%
3.7%
6.3%
6.0%
.5.9
%
5.1%
8.9%
1.9%
8.7%
7.5%
3.6%
9.4%
5.3%
8.0%
6.2%
0.2%
5.0%
8.1%
10.7
%
8.8%
2.7%
3.5%
SScq
SSGO
7.1%
8.4%
4.7%
O COo>
eoCM
eoCM
CM mo>05
com CO05
CMCO I"- m eo
CMC75CMro
05 05CO
CMCOCM 10
4
142 CO
CO CMOOco
LO f—cnCM
coCM
CM CM CM05 20
2
204 m
CO eo05
SSs 0.
0%
0.0%
0.0%
7.4%
0.0%
0.4%
10.1
%
oo 0.
1%
0.0%
0.0%
0.2% g
O 0.4%
0.3%
0.0%
0.0%
SSoo
ssoo 0.
0%
SSoo 1.
0%
0.0% O
o 0.0%
0.0%
SSoo 0.
3%
0.2%
0.0%
0.9%
0.5%
is o o o 124 o - 166 o - o o co a LO f— o a o o o o CO
CO a o o o o co co O O
Empl
.
1321
3127 co05
o> 1666
1979
3402
1651
1827
4907
I 19
72
2298
3539
1501
3776
^ roCOCM 10
78
2459
1947
1781
2162
s 3327
1426
2220 LO
05CM 46
20
1189
cnOCM 25
87
2868
1607
2086
Pop.
3035
6062
4165 CM
CO 3958
6656
3865
CMCOCM 95
09
4671
4362
6798
CMCM05CM 77
51
COLOm 25
94
5358
. 33
73
3619
4516
4832
7764
3070
4026
5098
9105
2596
4218 CMOO
CMm 5636
4129
4452
<n < NE SD MN < < z2 NE < < z
2 < NE Z2
z2 < z
2 ND
ON MN mn
J
MN < UA < < < NE
Is
dI
<
Urba
n Pl
ace
Eldo
ra
Elkh
orn
Ellsw
orth
AFB
Ely
Emm
etsbu
rg
Esth
ervil
le
Evele
th
Fairb
ury
Fairf
ield
Falls
City
Fores
t Ci
ty
Fores
t La
ke
Garn
er
Gerin
g
Glen
coe
Glen
wood
Glen
wood
Good
view
Goth
enbu
rg
Graft
on
Gran
d Fo
rks A
FB
Gran
d Ra
pids
Gran
ite
Falls
Gran
t
Grim
es
Grinn
ell
Grun
dy C
ente
r
Hamp
ton
Harla
n
Hold
rege
Hot
Sprin
gs
Humb
oldt

89
asraQ. 5
.4%
4.0
% $5Oco 3
.1%
3.7
%
2.9
%
3.5
%
OCO* 3
.0%
1.3%
3.6
%
2.7
%
0.7
%
2.5
%
5.2
% 2.2% 5.2
%
3.2
%
3.8%
.
asco
3.8
%
3.5
%
3.7
%
4.4
%
3.7%
|
2.0% 3.3
% 2.8% UT^Csi 2.
5%
5.6
%
4.3
%
Pa---
------
-----
115
3 j
to
72
55
73 57 cooo 73
104 COco
toO i CO GO
COcoco co
CM CDco co COCO tnOi O Oi totn tn CO CO
j 37 oo
CM
0>a .
asCslcd 12.6
%
10.8%
13.1
%
12
.3%
12.2%
7.6
%
13
.4%
13.9
%
10.3
%
13.3
%
I 11
.9%
8.6% 39
.3%
12.8%
8.5
%
14
.6%
11.4
%
15
.5%
12.6%
8.9
%
8.3
%
13
.5%
13.6
% s sCDGO 1
4.0
%
14
.1%
17
.6% a—
CO
10
.9%
20
.3%
I 11
.9%
£ coCM
Cslcoco 26
3 OcoCM 2
43 GO
COCM
eo 16
3
47
3
25
4 GOco 3to N O ito 20
7 OcoCMOco co co
COtnco CMCMCM ^3"CM
co
540 CO
Oi
23
2
26
6
159
30
7
31
0
£ 31
.4%
28
.1%
28
.5%
20
.7%
31
.9%
24
.0%
34
.3%
22.0%
27
.5%
38
.4%
28
.6%
22.0%
28
.5%
19.4
%
33
.7%
30
.6%
31
.9%
28.3
%
29
.1% g
COCM 28.7
%
25
.8%
23
.2%
28
.5%
23.0
%
31
.6%
22.9
%
25
.9%
44
.3%
26
.6%
30
.9%
26
.1%
£to<ooo
toooo 695 CMCOco
CMCOCO 46
9 P«-CO COCM 9
40
^3"O i
tops. 10
03 O iCDtocoCDCM
coto
CTico Oi ,too § 3CD OiOi
coOCO
coCO Oi
cotncoco 3
76 CMOi
CO u oCOOOco
<oCD oooto
u . 4.4
% S?COoo* 3
.4%
6.4
%
6.4
%
4.8
%
7.4
%
5.8
%
7.1
%
5.8
% 2.6% 5.9
% 5Scq^■* 2
.3%
5.1
%
2.9
%
2.3
%
4.3
%
9.3
%
4.5
%
3.8
% 6.0% 2.6% 6.3
%
5.5
%
4.4
%
9.9
%
5.4
%
14
.6%
2.8% 3.6
%
u.
124 Cslto
Csl 3CM CM 94 co
CM 142
CO 269 to
CDtoco CMCO CTiGO to CMto 20
5
156 3"o>
OGO tnco tnCM 84
-coCD CMao ir>
coCM 4
2 ' 3-Oi
1% 2.1% Oi
1.3
%
4.3
% g
1.7%
1.7%
1.7% 2.0% 2.5
% 2.0% 2.3
%
2.5
% 1.8% 1.6% 2.4
%
0.5
% a®p-
r *
a f U) cq 2.8% 2.3
%
2.3
% 2.6% 2.3
% cq
2.3
%
c i 2.5
%
1.5%
3.7
%
-
09 coto CMCO
S L 3 co
COO*a-
O iCO CMCO cotoCDO
OS CMtoCM 3 to to coCO CMtn 3 ao 5 i
O 3"CM CMtnco O i CD
CO 22 toOi
T% 3.9
%
3.8
%
3.6
%
5.8
%
2.9
%
5.8
%
3.4%
.
10.1%
3.1
%
4.5
% 2.8% aoto 2
.9%
1.9
%
2.5
% 2.8% 2.6% 3.1
%
4.4
%
3.8
% 2.0% 3.3
%
2.3
%
5.2
%
5.3
%
3.4
%
7.6
%
3.7
% 001 6.0% 5.5
%
5.6
%
h- 111 109 oooo O 5
7 cocoCM COo O CO to
COCM to GOCM O COco COco Nco CTiCMco Oi OiOi Oco OCM GO toco CM COtn toCsl ooco cooo 14
5
&0£
12.9
%
13
.0%
11.2%
. 1
3.8
%
co
15
.9%
12.8%
12
.4%
13
.0%
15
.4% c?
GO 14
.4%
7.7
% 10.8%
11.0% S?co
o
. 1
4.5
%
10.7
%
10.4
%
14.7
%
15.0
%
13.6
% coCM
16
.6%
.12.
5%
14.6
%
13.0
%
13.2
%
16.1%
15
.0%
14
.8%
12
.3%
Q£^3"CDCO
coCO
■'sfCM 5
CMCM
COtooco
Oto
44
4 OCOCO
COtoCO to coCO
-cocoCO 5
OiCM OcoCM 50
7
coCDO
169 OCDCO 190 tntn co 200 CO
«NJOiCM
coCMCM 321
w%
2.5
%
0.9
%
od 2.6% 3.5
%
3.6
%
2.5
%
3.7
%
1.3%
5.0
%
CM 3.6
%
3.3
% 1.1% a sOi S?cq 2.2% 0.5
%
3.5
%
5.4
% 2.8% 2.9
% 1.1% 2.7
%
4.4
%
1.1% 5?
cd
oSCM UZ»e> 2.6% 3
.8% asto
s NtoCsl CO
CslCO O iCO O O ito to co COCM to CO COCD CO Oco COto CO CO COco OiCD CDCO tn CTi
O CD CM ooco OO oo ooco i ncnco
m 22
.4%
23
.1%
13.8
%
20
.5%
16.7
%
20
.7%
16.3
%
1.1.6%
24
.0%
12.5
%
29
.6%
22
.5%
35.3
% sefs.
vO
cd
30.5
%
19.0
%
28.0
%
13.3
%
GO 21.1%
23.5
%
30
.5%
9.5
%
26.4
%
18.7
%
8.2% 14.3
%
aocsi 9
.9%
1.3%
21
.4%
£coco(O 6
62 tococo
O itoCO co 4
06 O iGO
CO 5OCMOO
cooCO
cor--
1024 O toCM SCO
toCOOi CMCD COco 2
95
62
4
526
Ocoo
CDco
Oo
0001
^3"CO t oCO 5 OCM 559
3?O 5
.1%
3.3
%
9.9
%
5.2
% 8.0% 7.7
%
7.5
%
4.9
%
3.5
%
3.7
%
4.5
% 6.6% 5.4
% 6.1%'
7.6
%
4.4
%
5.4
%
5.2
%
5.2
%
5.9
% 8.0% 9.3
%
5.1
%
6.4
% aScq
6.4
%
3.8
%
7.4
% co7
.4%
9.1
%
7.2
%O
co «**O iOCM CD
ooto 151 OCO 5
9 OiO) £
CDO iCM 10
7
CTiCMCM COco CD
63 i n
205 aoOi CM
P -<D 25
3 co 68 COCDCM
t : 108 P -co GOOO
E 0.2% 0.0% 0.7
% 0.0% 0.0% 0.1% 0.2% 3.8
%
0.4
% 0.0% 0.0%I
0.0
%
0.4
%
10.9
%
0.0% 0.0% 0.0% 0.0% 0.1% 0.3
% 0.0% 0.2% 0.0% 0.7
% 0.0% 0.0% 3.5
%
0.3
% §
0.3
% 0.0% a soo
E to o co o o - to CO*a-CM o ' o o -
toCO o o o O co Oi o tn o toCM o O ootn -CO o o
Empl
.
28
20
28
64
243
6
1751 GO
O i 1958
23
85
12
14
341
2
24
65
26
08
45
60
1993 to CO
30
70 o>CMCO 12
03
22
13
344
7
24
90
29
93 CMCO
39
74
1517
| 10
61
164
2
151
4 aooco
145
9
151
0
26
09
Pop.
60
14
67
03
51
93
Otoco 46
26
383
3
43
98
25
59 co
r--r-- 4
92
3
49
50
92
37
39
22
30
27
30
15
65
62
77
19
30
40
46
17
65
40
52
57
61
12
25
35
79
94 Oioco 2
58
0
36
40
29
64
75
99
29
92
35
74
53
46
IS |
< MN < MN < MN MN NE !
< MN MN < MN oCO
Z2 MN MN MN MN o
CO < < < NE MN MN □CO
LUZ ND < SD z
2
Urba
n Pl
ace
Indep
ende
nce
Intern
ation
al Fa
lls |
Iowa
Falls
Jack
son
Jeffe
rson
Jord
an
Kass
on
Kimb
all
Knox
ville
La Cr
esce
nt
Lake
City
Le Ma
rs
Le Su
eur
Lead
Linds
trom
Litch
field
Little
Falls
|
Long
Pr
airie
Luve
me
Madis
on
|
Manc
hest
er
Maqu
oket
a
Maren
go
. |
McCo
ok
Melro
se
Milac
a
Milba
nk
Mind
en
Mino
t AFB
j
Miss
ouri
Valle
y
Mobr
idge
Mont
evide
o

90
Pa
% cq
5.4
%
1.9
%
2.4
%
3.3
%
4.2
%
3.2
%
4.6
%
3.2
%
6.3
%
3.6
%
2.6
%
3.7
%
| 5
.6%
1.5
%
5.5
%
csi 4.2
%
7.2
%
5.3
%
5.5
%
2.3
%
2.5
%
2.9
%
5.7
% OO
2.3
%
3.3
%
22
.1%
1.7
%
Pa
24
5 84 c o 90 O
CO C0CMr>- - CM
CMCOCO
cot/5COtr>
CM1/5CM 1
00 CO
COco
0505r>- 05
05CO 5
CO . CO
CMr--
CM05
COCM CM c o
C D 164
co
Ps
%
10.9
%
9.9
%
11
.1%
20
.8%
11.6
%
9.6
%
9.4
%
11.1
%
14
.7%
10.4
%
11.1
%
14
.7%
9.7
%
8.9
%
12.1
%
14
.7%
12.1
%
CMCO 8
.2%
16.8
%
14
.4%
11
.9%
10
.8%
16
.9%
12.9
%
12.6
%
10
.6%
9.0
%
21.3%
23.9
%
15
.6%
ma. 148
CO OO
29
8 con
coCOco
COCO
CMU5 co
05tr>CO
CM1/5co O
CMCOCM co 4
02 CO
O t/5CM
1/5CM
1/5CO
co2co
COCO
65
9 coCMco
0 5CM 1
77
34
2
&£ 2
1.3
%
23
.0%
26.2
%
23
.0%
47
.0%
29.8
%
44
.3%
27
.8%
22
.8%
33
.9%
27.4
%
26.4
%
26
.0%
29
.6%
24.1
%
26
.9%
30
.2%
23
.8%
27
.8% CM
co*CM 2
2.8
%
37
.0%
c oCM CM 29
.6%
32.9
%
28
.4%
27
.7%
22.4%
42
.9%
30
.3%
£ 289
39
0
11
44 05CM
CO 12
64
112
5 c oCO
CMco
05CO
121
6
-CO1/5 1
08
6
11
69 05
05co 4
89
851 co
oo1/5
t nco 42
1
401
11
03
CM CO1/5
r>-co 17
18
CMCO 10
16
0 9CM 3
18 co
coCO
F%
2.9
%
2.8
%
6.7
%
3.5
%
3.6
%
2.3
%
5.8%
5.0
%
4.2
%
5.8
%
3.3
%
4.9
% J? CO
. ^ 17.3
%
5.2
%
5.1
%
3.4
%
6.4
%
5.5
%
1.9%
6.2
%
4.4
%
4.3
%
5.7
%
5.2
%
4.4
%
2.6
%
5.6
%
CM 1.5
%
I 3
.0%
u . O§ 2
94 Ot/5 9
7 r -co
U-5 cor>-
CO OOoCM
r^to
tr>o
0505
COcoco OO
CO051/505
cot/5 05
COCOCM
Oco 05co
05CM CO
COOOCMCM
OCO 20
4 CMCO -
COCO
s?
0.6
%
3.9
%
2.0%
2.2
%
I 3
.3%
2.2
%
2.6
%
3.1
%
1.7%
2.0%
j
1.3% co
2.2
%
4.4
% 3 sCM
2.1
%
3.0
% SfScq
0.9
%
3.9
%
0.9
%
2.1
%
0.9
% CMO 1.
1%
1.1%
5.3
%
2.9
%
i oo 0
.0%
2.3
%
- co COCO 8
9 cococo CM
co to05 co
t o CM CM05CO
CM05 O 05CO 8
4 o - OOU-5
1/5 CMCO
1/5 U-5 COt/5 OCO
1/5
-o t/5
T%
4.3
%
4.3
%
4.9
% M-
2.6
%
4.2
%
3.2
%
t o 8.0
%
3.9
%
3.5
% &co* 5.
7%
7.1
%
4.6
%
5.7
%
4.3
%
7.0
%
4.8
%
4.6
% §CO* 2.
3%
2.6
%
5.1
%
2.1
% fx-
4.9
%
4.8
% u o
0.8
%
5.8
%
h - 59
72
21
3
20 r>- 158
64 CO
05NCM
O 09 s
05COCM
COCM
COr>- 104 r>- CO
OOCO
05
69 CM U-5 COCM 05 COt/5 e 0 5
t o COCOCM
ss££
12.7
%
11.5
%
15
-7%
13
.2%
10
.8%
15.1
%
11
.7%
13
.2%
15
.1%
12.3
%
17
.0%
10
.2%
13
.3%
10.3
%
9.3
%
11
.2%
15
.1%
18
.8%
14.8
%
12.0
%
15
.3%
14
.7%
13
.5%
11.1
%
11.9
%
6.9
%
10
.2%
12.0
%
14.6%
5.0
%
12.6
%
OSCO
195 COCO
CO 189 05
CM05COW5
nCM 2
05 CMCM
to §05CM
co
55
3 r -o 1/5cooCM 4
26
46
6 r>-CO
052
69 oo
COr>-
25
2 U-5cocoCO
CO
44
0 0 5 r*xCO
COCM
SS5 4
.0%
5.9
%
4.5
%
1.5
%
1.0
%
1.9
%
2.5
%
7.1
%
1.4
%
1.7%
2.7
%
3.4
%
4.8
%
3.3
%
3.3
%
2.2
%
2.3
%
3.3
%
2.8
%
3.3
%
8.8
% co2
.5%
3.3
%
5.0
%
2.4
%
1.9
%
3.5
% 5?c o
0.0
%
2.2
%
=s t«m 100 CO
O) CMCM CM N toO Oto O
COco CO O
CMCO 1/5
1/5 O COCO
CMco
t/5CO
05 U-5U-5 U-5
O U-5 COCO CM CM
CMOCO 05
ss
£ 30
.7%
25
.3%
18.8
%
21
.2%
8.7
%
26
.2%
10.2
%
3.7
%
17.5
%
15.7
%
20
.8%
23
.8%
18.6
% V©COCO* 3
0.2
%
20
.2%
18.3
%
8.0
%
15
.5%
13.1
%
c q
18.7
%
26
.7%
23
.3%
15.6
%
30
.3% s?
oo^-*CM 2
4.3
%
18.8%
0.0
%
15.8
%
£ 5 42
8
821 c o
oco
U-5coCM
O0505 20
1
t o OCO 5
64 05
toCO 5
10
77
5 co
501
COCO1/5 19
9
196
196 CO
CM 55
6 05CM
52
9 05
158
4 coooCM 05
OOc o^ rCM o
tn .co
seo
-spo'*cnco 5
.7%
7.5
%
10
.3%
I 4
.5%
3.2
%
4.5
%
6.1
%
8.1
% CM
7.1
%
7.6
%
10
.3%
6.5
%
7.3
%
6.0
%
6.3
%
6.3
% spo'*COCO* 7
.6%
9.3
%
4.0
% CMis ! 5
.9%
7.4
%
5.0
%
6.8
%
4.6
% s*?CM3
.8%
6.2
%o CM O)
t nCMco 14
8 CMCM CM co
cot o05 2
82
25
8 CMCMCO
42
9
25
9
CM 2 r-- U-51/5 CO
coCO
COOO CO COCO co
05coCOCM -
co t o0 5 co
CMCOCO
s*as O
£8oo' 0
.2%
0.3
%
0.1
%
0.0
%
0.0
%
12.7
%
0.0
%
0.0
%
0.0
%
0.2
%
0.0
%
0.0
%
0.3
%
0.0
%
0.2
% CMO 0
.0% g
o 0.0
%
0.0
%
0.0
%
0.0
%
0.0
%
0.0
%
§O 0
.0% s ?
c> 0.0
%
0.0
%
£ - o 05 U-5 CM or>-05 O O o tr> O O U-5 o r>- CO o o o o o o o o o
Em
pl.
136
0
1692
43
59
1430
| 2
69
2
37
72
05
1556
346
8 CMCOt oCO 172
9
214
4
41
69 COtr>
05CO 16
57
182
0
28
19 t/5r>-
CM 1261
149
2
1762
29
78
1608
CMCMCM 12
63
52
29
36
64
CO
21
90
Po
p.
27
94
36
07
78
68
31
93
50
68 U-5
OO 33
90
29
99
72
28
I 6
65
8
36
92
45
59
80
23
68
84
31
08
39
57
66
92
49
30
25
70
3091
37
33
55
82 U-5
CO 46
59
32
76
98
32
25
59
76
33 CO
oco 3
171
42
80
ST Z
£< Z
£Z£
z£
< < z£
LUZ < < Z
£Z2
< Z£
Z£
< LUZ
Z£
< NE < < < Z
£< Z
2 <z£
as Z2
Urb
an
Pla
ce
Mo
ntg
om
ery
Mo
ntic
ello
Mo
ntic
ello
Mo
ra
Mo
rris
Mou
nt
Ple
asa
nt
Mou
nt
Ve
rno
n
Mou
ntai
n Ir
on
Neb
rask
a C
ity
Ne
vad
a
New
Ha
mp
ton
New
Pra
gu
e
Nor
th
Bra
nch
No
rwa
lk
Nor
woo
d Y
oung
A
me
rica
Oak
Pa
rk
He
igh
ts
Oe
lwe
in
Og
alla
la
Oliv
ia
<0
I6 O'N
eill
Ora
nge
City
Osa
ge
Osc
eo
la
Park
R
ap
ids
Pe
lla
Pe
rha
m
Pe
rry
Pine
Q
ty
Pine
R
idg
e
Pip
est
on
e

91
Pa%
1.7%
6.4%
6.7% 2.2% 3.9%
13.5
%
4.1%
4.0% 2.0% 3.2%
3.1%
3.2%
2.4% as
LO
5.3%
2.3% 2.3%
5.1%
3.1% 0.6% 7.2% g 2.2% 2.6% 3.7%
3.4%
1.5%
s 2.6% 3.7% 2.1% g
cb
COa. CMcoCM 19
7 CO O 146
Zo o>CM
CO o>CO CO o> co
coCM coio coio OOco coo> O
CMOco CO lO
CO IOo>uo
coCO
OCO
coCO
LOo> GOCM
coco
Ps%
7.6%
13.8
%
10.1%
8.9% 11.8
%
12.2%
17.5
%
11.9
%
9.3% §
uS 14.3
%
10.1%
13.4
%
10.5
%
13.4
%
7.2% 12.2
%
7.0%
12.5
%
11.4
%
19.9
%
12.9
%
23.3
%
16.8
%
14.5
%
11.4
%
7.2%
9.0%
16.1
%
I 13
.8%
11.4
%
8.7%
c l 124
456 o>
CM^rr-. CM
CMCO
CMCO
co3 15
0 co co co
530 co
CM 267
435 co
COcoo>
o>o>COCOcoco 221 212 coco
COCMCOCO 18
2 200 CMGO
cooo 416 CM
CM 149
246
pf%
34.7
%
23.8
%
31.0
%
24.3
%
20.7
%
35.8
%
20.5
% a?
CM 32.8
%
28.9
%
37.5
%
31.6
%
27.9
%
14.4
%
39.1
%
33.3
%
25.8
%
23.7
%
20.9
%
39.8
%
39.0
%
27.9
%
32.5
%
26.9
%
30.4
%
31.2
%
25.6
% g
CM 38.5
%
| 45
.9%
27.2
%
38.6
%
a :CMCOio
COCO
coo>
co ioCOlo
COCO
COh -io co
coh -
O COCO
1652 O
iocoCOCO CM
coCOCO
o>ioCO
COCO
COco CO coo>lO
1238 co
lOCMCOCO
LOLO
5CO
COO)o>
| 24
00 COLOCO 10
87
%J
5.2% 8.0% 14.9
%
loCM
g
lo 3.6%
4.8% 8.0% 4.8%
4.6%
5.3%
5.4%
5.3%
2.9%
4.8%
1.4%
3.4%
4.5%
i n 3.1% 5.1%
3.6%
'
5.9% g
CO 7.1%
2.7% 6.2% a?
CM 2.9%
2.7%
3.4%
! 3.
9%
U . COmCOCM 43
9 co o>co o>
cococo O o>
COioco CO
CO COCM
COo i n
155 m
co COOCO
CMCO 10
6
co €3coCOCMCM co <J>co co
■o- LO
OS LO
140
3 109
a?
1.9% 2.1% 4.1%
2.5% 2.2% 1.4%
1 .1 %
3.0% 1.2% 2.6% 3.0%
2.9%
4.7%
1.3% 2.1% 2.9%
3.2% 2 .2% 0.9%
1.9% 1.6% 1.6% 1.6% 1.1% 1.4%
0.7%
0.7%
0.9% 2.6% 2.3% 1.1% g
- co 1C 3 COCO
io oco
COCO
co r—CO h -co 15
3 COo> coco CO
CM CMCOOco
oCO
coCO
CO COCM
Oco COCM
CO CM - GO COCO
OO3 O
co
%i 5.
5%
7.1%
5.4%
5.0%
2.9%
3.8%
6.4%
4.7%
2.9% aScq
5.4%
4.4%
6.3%
4.4%
5.1%
lo 4.0%
7.7%
7.0%
3.4% 2.2% 4.5% as
CMco 2.
5%
6.3%
4.7%
6.4%
5.9%
2.4%
3.2%
4.7%
I 4.
6%
Cft coiocoCM
oco o> CO-
CO o>io CMCM
COCO co
CMo>CM
CM mCO
COCM
COo
coo
COCMCM £ CM
CMCM COio o> co
OCO
COCM CM
COGOCO CO
a>CM
%H
13.5
%
11.8%
9.3%
14.3
%
17.0
%
16.1
%
15.0
%
12.7
% asCMCM 12
.5%
12.1%
15.4
%
14.8
%
8.0% 9.7% 10.1
%
19.2
%
8.7%
29.1
%
11.1%
11.8%
9.5%
15.8
%
14.0
%
11.8%
16.1
%
9.5%
11.5
%
15.4
% a£cocb 15
.3%
15.6
%
ec 219 CM
CT>CO 27
5
279
465 co
5 COCO £ Zo io
ocoCMco 20
4 COco 25
4
492 CO co
CMo>coCO
CO 156
601 O
oCO
<J>■^r co
CMOCM 24
0 CJiCOOcoCO 201 43
9
w%
3.9%
3.1%
5.6%
1.7%
3.3%
3.1%
3.6% 2.8% 4.0% 0.6% 5.5%
4.2%
3.8%
1.3%
3.7%
6.5% 2.2% 2.8% 3.3%
3.7% 1.4% as
CO 1.0% CM
3?CMCM 2.2% 4.
2%
0.7% 2.0% 2.0% 3.9%
3.3%
3 co 104
3 coOo> co
co O ioco tn co o>
CO 219 co
CO 120 COco com
COCO
COo CM co oCO
O LO GO coco 10
5 LO CMLO 10
6 CMO)
S?
10.4
%
8.0% 30.8
%
20.7
%
3.1%
18.7
%
16.0
%
21.9
%
36.4
%
5.3%
16.8
%
13.9
%
46.1
%
11.4
%
20.8%
20.1%
30.3
%
7.5%
15.2
%
3.3%
22.9
%
5.9% 21.1
%
13.2
%
16.4
%
22.9
%
34.9
%
11.6%
%fr'H
24.2
%
13.7
%
£. CO CO CM
ioco
COCOCM
o>o>lo
coCOCO
coco
CMCMio OCM
ioCO
COi n
COCO
ioCO
cocoCM
CO CMco
oi n i n
ioo CM
COCO co
coCO
lOCMCM
CO COCO
COGOCM LO
o>CM
o>o>CM
OLO
OLOcoco
C% 9.1%
13.0
%
5.0% 6.6% 8.1% 4.3% 6.8% 5.1%
5.9%
3.0%
5.1%
5.9%
3.8%
4.9%
3.7%
4.9% 6.0% 4.6%
5.6%
5.6%
5.9%
7.7%
5.3%
co 5.5%
9.7%
15.3
%
6.5% g
LO 3.5%
4.8%
6.3%
O5 -
Oco co
CM3
CO
189
COi nCO CM CO
OCO - 12
6 120 CMCOio CM
COco o>co coco
coCM 201 o> o>
COO CO
GOCO 13
5 COco 18
4 coCO
co
£ 0.1% 0.2% 0.0% 0.2% 0.4% 0.0% 0.0% 0.0% 0.0% 0.0% 0.6% 0.0% 0.0% 0.5% 0.0% 0,0% 0.0% 0.0% 0.4% 0 .0% 0.0% 0.4% a?<j> 0.0% 0.0% 0.2% 0.0% 0.0% 0.2% 0.5% 0.2% 0.0%
i s CM - o co CM O - O o o o-
o o CM o . o o o co o o co CM o o co o o CM co o
Empl
.
1621
3314
2954
1947 a>
CMCM 10
80 o>ooCM 12
65 5 1417
1249
5223 CM
oCM 25
51
3252
2503
2558
1336
3193
3388
1113
1645
3814
2149 COLO
CM 1748
2517
2086
2585
5224
o 2819
Pop.
3190
6887 O
O 3933 a>
coCJicoCM 54
59
2573 CM
OCM
COio
2939 coo> 3930 co
m 6319 5> 5546
2796
6282
6002
2572
3515
9099 4261
2518
3295
4910
4695 CO
CO 9747
3104
5411H
Z2 NE z
2< SD z
2 < < Z2
oz Z2
z2 NE NE < < . <
he
]
< SD z2
as < MN
z2
z2
z2 MN Z
2z.2
Zs
Urba
n Pl
ace
Plaln
view
Platt
smou
th
Plea
sant
Hill
Princ
eton
Red
Oak
Redf
ield
Redw
ood
Falls
Rock
Rap
ids
Rock
Valle
y
Rose
au
Rugb
y
Sarte
ll
Sauk
Cen
tre
Schu
yler
Sewa
rd
Sheld
on
Shen
ando
ah
Sible
y
Sidn
ey
Sioux
Cen
ter
Siss
eton
Sleep
y Ey
e
Spea
rfish
Spirit
Lak
e
Sprin
g Va
lley
St Ch
arles
SL Fr
ancis
SL Ja
mes
SL Jo
seph
St Pe
ter
Stap
les
Stew
artvi
ile

92
Pa
%
5.2%
5.2%
3.1%
3.8%
5.5%
8.2%
6.2%
5.1%
5.3%
3.4%
SS053SCOCM 3.
9%
asr- i 2.
2%
2.4%
7.0%
4.1%
2.0%
3.9%
3.7%
ascqascb 2.
9%
2.0%
2.1%
3.9%
5.2%
1.5%
2.1%
7.4%
3.3%
na . o>r—
COIO coCMIO COco 05 10
5 05CO
coh- 5
CMCO
05 coco CO 3
^3-co r— CO
172
13
2|
05CM3"
r— OCO 05 COCOCO CO CM CO
CM05 5
5?o>a . 9.
3%
17.4
%
25.8
%
14.7
%
12.0
%
29.8
%
15.6
%
18.0
%
11.5
%
17.4
%
7.7%
9.1%
18.3
%
12.4
%
8.8%
12.8
%
13.8
%
11.9
%
15.5
% as00cb 11
.0%
13.9
%
7.9%
7.5%
10.5
%
15.0
%
9.5%
8.6%
10.6
%
11.6
%
12.0
%
6.3%
e>a . 14
3 COCMIO 31
6 CO0OIO
r—co LOCO
cocoCM
CMCM co 05
coOr— 21
4
702 CO 05
coCOCOCM 3CM 51
0 O CM05CO 39
0 r—CMCM
CMCM
CMLO coGO^3-05
402
j
LOCO 16
5 coOCM
05^3- GO
pf%
30.6
%
27.8
%
23.7
%
26.7
%
25.6
%
23.9
%
27.4
%
32.3
%
37.4
%
40.6
%
34.1
%
33.2
%
27.9
%
28.3
%
27.5
%
32.2
%
24.8
%
34.2
%
22.1
%
21.0
%
28.8
%
26.2
%
26.0
%
32.6
%
41.0
%
30.7
%
27.4
%
25.0
%
22.3
%
22.1
%
23.8
%
29.3
%
£05CO
Oco
O05CMCO 0505
COCOCM CO
LOCO
r—
2078 LOr—
05r—r— 10
69 cococo
IO0505^3-co
LOr—
1462 CO
Oco05 OcoCM £ COco 18
77 05r—05S CM05
CO CO GOCOLO05CM 05
co
F%
6.5%
6.6%
3.5%
2.9%
2.8%
2.3%
6.0%
3.4%
3SCOcb 3.
1%
cb 6.4%
2.7%
4.6
% OOcb 3.
0%
3.5%
3.5%
4.9%
5.2%
5.8%
20.0
%
3.2%
10.3
%
7.9%
3.0%
1.1%
1.7%
4.0%
4.4%
2.1%
u . 05O) 20
1 CO . ^IO CO^3- CM i
co^3- ? 160 10
00 LO 102 ^3-
1005co LO co
05 LO0O
05CMCM 156 3-05
IOr—LOLOco 47
2
251
126
- coCM O LO
IOGOCM
- 1.7%
2.6%
1.1%
vOo'*co
2.0%
2.0%
1.6%
1.2% GO
3.8%
1.3%
5.0%
2.8%
2.9%
3.6
%
1.0%
1.3%
1.2%
2.0%
5.9%
ascoCM 1.
0%
3.2%
1.3%
2.4%
4.8% 05
1.5%
1.9%
2.1%
0.6%
3.5%
- COCM05 CO IO
co co*3CM f -CM co 00LO 05 00CM 10
9
7S05CM 05 CM IO CO OCDCM
co05 r— CO05 r— CM .
GO.O S S coCM
05CM COco GO r—
T%
3.5%
2.0% §
cb 4.2%
5 .4
%
2.6%
5.6%
7.6%
2.9% a-*
cb 3.3%
5.8%
3.6%
4.6%
2.0%
2.6%
3.4%
4.4%
2.6%
3.3%
3.3%
5.9%
3.2%
2.0%
CM 5.3%
7.0%
4.2%
5.0%
3.4%
3.0%
IO05IO
co 05 CO . 00 co 05
co.0 co05 CO CM r—co 05
CO IO -co COco
05CO CO05
CO3- CO CO05 LOCO 05 fv.
COcoCMCM
2 co r— CM ^3-
a: 16.2
%
cb 9.0
%
16.7
%
15.7
%
9. 7
%
12.1
%
14.3
% <5cq
13.3
%
14.2
%
12.4
%
14.6
%
11.2
%
13.7
%
16.0
%
13.1
%
10.2
%
21.3
%
10.7
%
15.2
%
13.3
%
11.6
%
16.5
%
12.7
%
16.2
%
8.7%
14.1
%
10.2
%
13.5
% C&
14.0
%
O' 248 IO3-10
0coCO
IOCM 3 CM
CM05 co
^3" coco
CM 005CMLOLO 13
2 CD05 O05CMLOCM
coco OO 5
05CO10
LOcoCO
r—COCO 580 r—
LOCDCOCO
CMCM 159 coCOCM 132
189
w%
4.5%
1.7%
2.0%
: 4.
4%I
1.7%
1.3%
1.2% IS
2.9%
1.9%
5.9%
3.2%
3SCOCM
as05
6.0%
5.6%
4.1%
2.1%
4.3% 05
4.0%
2.9%
5.1%
4.1%
2.3%
2.4%
2.2%
3.2%
asLO
4.7%
7.2%
j 3.6%
s O)CO010
^3-CMco coCM 12 CM LO
COco05 r—05
OCO 3-r— 0505 CMCM 215
102 05
r— 05COCO 0O
r— GO 3-co 104 10r— CM05 OLO CM CMGO 05 05
ss
£
1 14
.0%
5.2%
20.3
%
18.4
%
17.0
%
12.3
%
12.3
%
2.7%
8.2%
8.7%
17.7
%
10.0
%
6.9%
20.3
%
20.0
%
16.9
%
18.0
%
17.3
%
17.9
%
34.0
%
16.9
%
21.1
%
6.7%
18.3
%
12.9
%
10.2
%
29.9
%
25.2
%
41.7%
j
oScbCM 20
.6%
20.0
%
£IOCM 10
05CM
COCO IOCOCM
LO*3
CMCOCO COCM
IO3
05OOCO3CM
IOCOCM
05coCM
CMCM CO
coco
CMr—co05LO
OCO co
CM05 CMr—CO 05IOcoCMCO 12
62 co05CO S
co10CMOh-CM
SSCJ 7.
8%
7.7%
6.9%
4.6%
7.7%
5.1%
7.5%
8.6%
3.4%
5.3%
10.2
%
5.2%
nO05IO 6.
9%
5.9%
9.7%
asCOcb 6.
1%
4.3%
7.1%
7.5%
8.5%
asGOcb 3.
4%
5.1%
5.6%
7.2%
3.2%
5.5%
5.0%
8.2%
o 120
233 3-
0Ococo
00CM 05 co00 i COCM
IOh-
co 05COCM 20
0 05CO 24
8 co00 CM0OCM CMCM
05 CMIOCM
COCM
IOCM co 15
6
164 LO
COCM
CO 0505 CM
CO
s 0.7%
3.0%
0.0%
0.0%
0.8%
0.0
%
3.6%
sO©■-O
0.2%
0.0%
0.0%
<=> 11.4
%
0.0%
0.0%
0.0%
0.0%
0.0%
0.5%
0.0%
0.2%
0.1%
0.3%
0 .0%
0.0%
0.0%
0.0%
0.0%
0.0%
0.9%
0.0%
0.0%
£ - O05 «=> 0 co 0 0CD «=>O
«=> -COCO C3 «=> 0 0 0 co 0 CO CM CO 0 O «=> 0 «=> 0 co
«=> 0
Empl.
1533
3025
1224
3978
1556
1176
1682
1347
3250
CMCMU) 22
03
2347
3830
1177
3612
1814
1917
4277
3752
4434
3544
1634 CO
COCM 20
38
4582
3189
4218 LO
1553
1748
CMCM 13
48
Pop.
3228
CM3CO
cnCM 84
10
3155
O)coCM 36
13
2820
6826
LOCO05
LOCMO
CMOLO 91
57
2599
6814
4294
3942
8586
6568
8493
7047
3029
5126
GOco05GO 55
83
8176 CO
CO
CMcococo 3660
.25
49
2622
CO < OCO < z
2 < ' z2
LUZ ND SD z
2 < z2
z2
z2
z2 Oz z
2 MN < MN < < < LUZ < < < UJ
Z < <
Urba
n Pl
ace
Story
City
Stur
gis
Tam
a
Thief
Rive
r Fa
lls
Tipto
n
Toled
o
Two
Harb
ors
Valen
tine
Valle
y Ci
ty
Verm
illion
Victo
ria
Vint
on
Virg
inia
Wab
asha
Wac
onia
Wad
ena
Wah
oo
Wah
peto
n
Waite
Pa
rk
Was
eca
Was
hingt
on
Wate
rtown
Wau
kee
Wau
kon
Wav
erly
Way
ne
Web
ster
City
West
Burli
ngto
n
West
Liber
ty
West
Point
West
Union
Willi
amsb
urg

«0tL 3.2
%
4.9%
5.2%
4.0%
4.8%
4.3%
2.5%
2.6%
COtL
co co 84 -LO ooco ooCO
Ps%
6.5%
10.2%
18.4% 8.7%
9.5%
14.9
%
9.0%
11.2
%
<r>Q. Cb COCM coCM
COOO in OcocoCO LOco
a: 28.3
%
26.9%
26.0%
CM 27.2%
28.2%
20.2%
34.3%
a: 419 coCM
COoococo
CDOm 440
1140 COoco 503
F %
3.6%
4.3%
5.3%
.
13.1%
8.5%
5.5%
4.8%
6.4%
Li. U"5 IO coCM
ooCO CMCM
CO *1*Cb
1% 3.2%
2.1%
1.6%
4.7% 3.0
%
2.5%
1.2%
2.0%
- - 48 COCM 100
O 09 Cb
H* 6.7%
4.9%
6.5%
4.4%
4.3%
7.4%
4.6%
6.1%
f— CbCb J CM03 92 Cbco • O co
O OCb
R% 12.0%
17.1%
17.0%
16.3%
11.9% CM
S'oo
10.8%
ocOO ooCbCO CM
COco
COCb Cboo 03 CbLO
w% 4.5%
2.5%
4.7%
3.6%
5.4%
2.8%
2.5%
4.4%
5 COOOio coCO 75 oo
CM ooco 2
Mf %
28.6%
19.8%
0.7%
8.5%
18.8%
14.7%
30.0%
13.9%
£ CM 459 o O
oo OCOCOCbLO to 20
4
gSo 2.9%
5.0%
7.7%
[ 8.2
%
6.7%
5.8%
11.7%
7.2%
o co CO Cb Cb coCOCMOO CO
se! € 0.2
%
0.1%
0.0%
0.3%
0.0%
0.0%
0.0%
0.0%
£ CO CM o - O
Empl
.
1482
2324
1415
2110
1619
4042 CO
LO 1467
Pop.
2829
4490
3137
4768
3048
8081 CO 2789
IS <2 SD < MN
UJZ MN MN
Urba
n Pl
ace
Wilto
n
Wind
om
Win
ner
Win
ters
et
Wyo
ming
York
Zimm
erm
an
Zum
brot
a

94
APPENDIX C
Functional Classification

95
Functional Classification
KEY
Function Plus 1SD Plus 2SD Plus 3SD
Mining............................. .......M i......... .......M i2.................Mi3Construction............ ...... .......C .......... ....... C2...... ........C3Manufacturing................ .......M f......... ....... M f2....... ........Mf3Wholesale Trade ............ .......W .......... .......W 2 .................W3Retail Trade.................... ....... R .... . ........R2......... ........R3Transportation............... ........T ......... ...... T2 ........ ........T3Information Technology. ......... I .............. .........12......... .........13Finance........................... ........F .......... ........F2......... ........F3Professional Service...... .......Pf.......... ...... Pf2 ........ ........Pf 3Personal Service........... .......P s ........ ..... . Ps2...... .......Ps3Public Administration..... .......P a ........ ...... Pa2........ ...... Pa 3Diversified....................... .......D
DDDC FPf3MfWT2PaPfD13 Pf Mf Mf C Pf C I F3 12 Pf D
Iowa Clear Lake............ :...............Cresco............. ......................
Adel.... ............................. ..... W F2 Creston..................................
A lb ia................................. ..... C De W itt...................................
Algona.............................. .... D Decorah.................................Anamosa......................... ..... Pa Denison.................................A tlantic............................. ......D Dyersville........... ...................Belle Plaine..................... ..... Mf Eagle G rove.........................Belmond.......................... ......Mf 12 Eldora................... .................Bloomfield............ .......... ..... D Emmetsburg.........................
Camanche....................... ..... Mf Estherville..............................Carlisle.... ........................ ..... 1 F3 Fairfield.................... .............Centerville....................... ..... Mf Forest C ity............. ...............Chariton ........................ ..... W3 R Garner...................................Charles C ity .................... ......D Glenwood..................... ........Cherokee........................ ..... C Grimes........................... .......Clarinda............................ ..... Pa Grinnell............... ....... ..........Clarion.............................. ..... T Grundy Center......................

96
Hampton .......................DHarlan ..............................W3Humboldt............................... MfIndependence ............... DIowa Falls ..... .......... ......C W3Jefferson............................... DKnoxville................................ DLe Mars ........................DManchester...........................DMaquoketa............................CMarengo................................ MfMissouri Valley..................... F3Monticello..............................W IMount Pleasant....................MfMount Vernon....................... Pf2Nevada.................................. DNew Hampton ................... ...RNorwalk............................ ..I F3Oelwein................................. DOnawa................................... I PsOrange City...........................PfO sage................................... MfOsceola................. ...... ......... PsPella............. ............ .............MfPerry......................................MfPleasant H ill W I F3Red Oak................................ RRock Rapids................ ......... DRock Valley...........................DSheldon..................................WShenandoah ..................R2Sib ley.....................................Mf TSioux Center........................ PfSpirit Lake.............................C PsStory C ity ..............................R
Tam a .............. ............. Ps3Tipton ....................................RToledo........................ . Ps3 PaVinton......................................C 12Washington...........................DW aukee.................................. W F3Waukon .......................RW averly...................................F1 Pf2Webster City. ......... MfWest Burlington..................... DWest Liberty..................... Mf2West Union.............................W2 PaWilliamsburg...........................LW ilton.....................................MfWinterset............................... R 12 F2
Minnesota
Afton....................................... IAlexandria...................... ...... RAnnandale..............................C2Appleton........................ ....... I Pa3Baxter................................ PfBayport................................... DBecker............. ......................C3 TBelle P la ine............................C2Benson .............................RBig Lake................................. C MfBlue Earth...............................DBreckenridge ....................... C2Byron......................... ............PfCaledonia...................... ....... DCambridge.............................ICannon Falls......................... WChisago C ity.......................... W2

97
Chisholm................................Mi3 T PsCokato................................ ... C MfCold Spring ........................MfCrookston.............................. PfDetroit Lakes.........................PsDil worth................................. C WEast Grand Forks.................RE ly .......................................... Mi PsEveleth.................................. Mi3 RForest Lake...........................C FGlencoe................................. MfGlenwood.............................. WGoodview..................... ........ Mf WGrand Rapids............... ........ I PsGranite Falls..........................PfGrant......................................CInternational Falls................. .FJackson................................. IJordan....................................RKasson.................................. DLa Crescent ............. W PfLake C ity............................... MfLe Sueur......................... ......Mf2Lindstrom ..............................DLitchfield................................ MfLittle Falls ......................... DLong Prairie............................Mf ILu verne............... .................. FMelrose................................. MfMilaca. .......................... DMontevideo...........................IMontgomery..........................C MfMonticello..............................RMora.......................................C Ps2Morris.....................................Pf3
Mountain Iron ................ Mi3 W2New Prague.............. ........... DNorth Bcanch.........................CNorwood Young America MfOak Park Heights................ DOlivia .................................. PaPark Rapids.................... ...... WPerham................................ . 12Pine C ity .............. ....... Ps2Pipestone..............................DPlainview................................C PfPrinceton......................... ..... MfRedwood Falls..................... . PsRoseau........................ ..........Mf2Sartell ........... .............DSauk Centre ............. . 12Sleepy Eye ....................DSpring Valley............... . DSt. Charles............................ C RSt. Francis........................... C3St. Jam es..................... ........ MfSt. Joseph.............................PfSt. Peter........................ ....... Pf3Staples...................................DStewartville................. ... P FThief River Falls................. RTwo Harbors........................ . MiV ictoria ........................W FV irg in ia.............................. Mi3 PsW abasha..................... . PaW aconia................................ W I FWadena............................ . W RWaite Park..................... . R3W aseca....................... ......... Mf 1Watertown D

98
Windom...............................RW yoming.............................W FZimmerman....................... . C2 MfZumbrota. ....................D
Nebraska
Alliance ....................T3Auburn ......................T3Aurora.................................DBlair..................................... C 12Broken Bow........................ DCentral C ity .....................DChadron ......................R2 PfCpzad............. ....................Mf FC rete...................................MfDavid City .................. TElkhorn................... ............C W 12 F2Fairbury .......................Mf IFalls C ity .............................T2 12Gering.................................C T2 FGothenburg ............. DHoldrege .....................DKim ball................................Mi TMcCook...............................RM inden................................PsNebraska City.....................TOgallala.............................. R2O 'N eil.................................. C W3Plattsmouth C3Schuyler..............................Mf3Seward .................. PfS idney.................................R3Valentine .................. T PsWahoo.................................C Pa
W ayne R 12West Point.............................. MfYork................................. ...... D
North Dakota
Beulah.............................. Mi3 T3Devils Lake...................... R PsGrafton ....................... Pf PaGrand Forks AFB Pf Ps Pa3Minot AFB.........................R Pf2 Pa2Rugby............................... W PfValley C ity C PfWahpeton.........................D
South Dakota
Belle Fourche..................Mi2 C R PsBrandon............. ....... ......T F3Canton.............................. C R FDell Rapids...................... FEllsworth AFB..................F Ps Pa3Hot Springs...................... T PfLead .............................Mi3 Ps3Madison..................... . WMilbank............................. Mi W3 FMobridge..........................C Ps2Pine Ridge........................Pf2 Ps2 Pa3Redfield............................R Pf Pa3Sisseton ..................Pf Ps PaSpearfish......................... R Ps2Sturgis .....................Mi PsVermillion..........................I Pf2 PsWinner...................... .......R Ps

99
BIBLIOGRAPHY
Atchley, Robert C. “A Size-Funotion Typology of Cities.” Demography 4, no. 2 (1967): 721-733.
Aurousseau, M. “The Distribution of Population: A Constructive Problem.” Geographical Review 11, (1921): 563-592.
Berry, Brian. “A Note Concerning Methods of Classification.” Annals o f the Association of American Geographers 48, no. 3 (1958): 300-303.
Berry, Brian. “Cities as Systems Within Systems of Cities.” Regional Science Association, Papers and Procedures 13,(1964): 147-165.
Berry, Brian, and William Garrison. ‘The Functional Bases of the Central Place Hierarchy.” Economic Geography 34, (1958): 145-154.
Boloton, P.J., and W.J. Krzenowski. “Characterization of Principal Components for Projection Pursuit.” The American Statistician 53, (1999): 108-111.
Brush, John E. “The Hierarchy of Central Places in Southwestern Wisconsin.” Geographical Review43, no. 3 (1953): 380-402.
Clark, Audrey N. The Penguin Dictionary of Geography. London: Penguin,1998.
„ Clark, P.J., and F.C. Evans. “Distance to Nearest Neighbor as a Measure of Spatial Relationships in Populations.” Ecology 35, (1954): 445-453.
Cline, G. “Basic Principals of Soil Classification.” Soil Science 67, (1949): 83.
Environmental Systems Research Institute, Inc. (ESRI). ArcGIS 9.
Environmental Systems Research Institute, Inc. (ESRI). Using ArcView GIS. Redlands: Environmental Systems Research Institute, Inc., 1996.
Freestone, Robert, Peter Murphy, and Alan Jenner. “The Functions of Australian Towns, Revisited.” Tijdschrift voor Economische en Sociale Geografie 94, no. 2 (2003): 188-204.

100
Fuguitt, Glen, and Donald Field. “Some Population Characteristics of VillagesDifferentiated by Size, Location and Growth.” Demography 9, no. 2 (1972): 295-308.
Gildersleeve, Charles. “Changing Patterns of Communities in the Midwest.” Business in Nebraska 48, no. 16 (1969): 1-5.
Hammond, Robert, and Patrick McCullagh. Quantitative Techniques inGeography: An Introduction. London: Oxford University Press, 1975.
Haring, Lloyd L., John F. Lounsbury, and John W. Frazier. Introduction to Scientific Research. Boston: WCB McGraw-Hill, 1992.
Harris, Chauncy. “A Functional Classification of Cities in the United States."Annals o f the Association o f American Geographers 33 no. 1, (1943): 86- 99.
Harris, Chauncy, and Edward Ullman. “The Nature of Cities.” The Annals of the American Academy o f Political and Social Science 242, (1945): 7-17.
Hart, John Fraser. “Functions and Occupational Structure of Cities of theAmerican South.” Annals o f the Association o f American Geographers 45, no. 3 (1955): 269-286.
Hart, John Fraser, and Neil E. Salisbury. “Population Change in MiddleWestern Villages: A Statistical Approach.” Annals of the Association of American Geographers 55, no. 1 (1965): 140-60.
Hill, Edward W., John F Brennan, and Harold L Wolman. “What is a Central City in the United States? Applying a Statistical Technique for Developing Taxonomies.” Urban Studies 35, no. 11 (1998): 1935-1969.
McGrew, Chapman J. Jr., and Charles B. Monroe. An Introduction to Statistical Problem Solving in Geography. Dubuque: WCB, 1993.
Nelson, Howard. “A Service Classification of American Cities.” Economic Geography 31, no. 3 (1955): 189-210.
Nelson, Howard J. “Some Characteristics of the Populations of Cities in Similar Service Classifications.” Economic Geography 33, no. 2 (1957): 95-108.

101
Northam, Ray M. Urban Geography. New York: Wiley & Sons, 1975.
Pownall, L.L. “The Functions of New Zealand Towns. ’’Annals o f the Association of American Geographers 43, (1953): 352-350.
Sawada, M. Nearest Neighbor GIS Application. 2002.
Silk, John. Statistical Concepts in Geography. London: George Allen & Unwin, 1979.
Smith, Robert. “Method and Purpose in Functional Town Classification.” Annals of the Association of American Geographers 55, no. 3 (1965): 539-548.
Stafford, Howard Jr. “The Functional Bases of Small Towns.” Economic Geography 39, no. 2 (1963): 165-175.
Steigenga, W. “A Comparative Analysis and a Classification of Netherlands Towns.” Tijdschrift voor Economische en Sociale Geografie 46, (1955): 108-119.
Thomas, Edwin N. “Some Comments on the Functional Bases for Small Iowa Towns.” Iowa Business Digest, (1960): 10.
United States Census Bureau. “2000 Industry Data.” http://www.census.gov. Viewed September 15, 2004.
^ Webb, John. “Basic Concepts in the Analysis of Small Urban Centers ofMinnesota.” Annals o f the Association o f American Geographers 49, no. 1 (1959): 55-72.
Wilson, M.G. “Some Population Characteristics of Australian MiningSettlements.” Tijdschrift voor Economische en Sociale Geografie 53, (1967): 125.
Yeates, Maurice. An Introduction to Quantitative Analysis in Human Geography. New York: McGrew-Hill, 1974.
Yeates, Maurice, and Barry Garner. The North American City. New York: Harper & Row, 1976.
Related Documents