1 American Journal of Botany 96(5): 1–8. 2009. Agroforestry systems are the result of a long evolutionary process during which an association between natural elements such as trees and shrubs share the same stands with crops and sometimes with households. They are characterized by the dominance of several multipurpose tree species, which are con- served and maintained in the field by farmers because of their economic importance. To date, the proportion and structure of variation maintained on-farm in tree species during the development of tropical agro- forestry systems is largely uncharacterized at an intraspecific level. Knowledge about population genetics is, however, of key importance for understanding microevolutionary processes in plant populations and supporting or developing appropriate use and conservation strategies (Lengkeek et al., 2006). The long- term viability of tree species within agroforestry systems de- pends upon a wide genetic base providing the capacity to adapt to environmental fluctuations or changing farmer requirements, such as change in species use or planting niche (Lengkeek et al., 2006). To date, few studies have focused on genetic variation of semidomesticated edible trees growing in parkland systems in sub-Saharian Africa (Allaye Kelly et al, 2004; Sanou et al, 2005; Lengkeek et al, 2006). Generally, spatial genetic struc- ture in tree species is influenced by several biological factors such as gene flow (mediated by seed and pollen dispersal), den- sity, fragmentation, colonization history, isolation into small patches, differential mortality, and microenvironmental selec- tion (Wright, 1951, Heywood, 1991, Epperson, 1993, Kang and Chung, 2000; Vekemans and Hardy, 2004). More specifically, in agroforestry systems, all these factors may be influenced by human activity leading to many changes in ecosystem processes with various impacts (Young and Merriam, 1994; Aldrich et al., 1998; Allaye Kelly et al., 2004; Sanou et al., 2005). West African agroforestry systems are dominated by several multipurpose tree species such as Adansonia digitata, Parkia africana, Blighia sapida, Tamarindus indica, and Vitellaria paradoxa. On the basis of threats (e.g., bush fire, overgrazing, and overexploitation) and on the economic importance of Adan- sonia digitata (baobab tree) to the rural poor in Africa, the In- ternational Centre for Underutilised Crops (ICUC) has accorded high priority to enhance research and development for Adanso- nia digitata (Sidibe and Williams, 2002). Also, Bioversity In- ternational (previously called International Plant Genetic Resources Institute) has classified the baobab tree among the 10 top agroforestry tree species to be conserved and domesticated in West Africa (Eyog Matig et al., 2002). African baobab ( Adansonia digitata L., Malvaceae) is natu- rally associated with the savannah, especially the drier parts (Wickens, 1982). It is a multipurpose tree species used daily by rural farmers for food and medicine and is economically and culturally important to local people. However, field studies 1 Manuscript received 4 August 2009; revision accepted 14 January 2009. This work was supported by Bioversity International and Pioneer Hi- Bred International Inc., a Dupont Company, through a Vavilov-Frankel Fellowship and by Rothamsted International through its African Fellowship Program for the financial support in Europe. Additional funding for DNA fingerprinting and fieldwork was provided by the DADOBAT-Project (EU- Funding) The King Leopold III Fund for Nature Conservation and Exploration. T.K. received a postdoctoral grant from Ghent University (BOF). O.J.H. is a Research Associate with the Belgian Fund for Scientific Research (FNRS). T.K. and A.E.A. equally contributed to this work. 6 Author for correspondence (e-mail: [email protected]) doi:10.3732/ajb.0800266 SPATIAL GENETIC STRUCTURING OF BAOBAB ( ADANSONIA DIGITATA, MALVACEAE) IN THE TRADITIONAL AGROFORESTRY SYSTEMS OF WEST AFRICA 1 Tina Kyndt, 2,6 Achille E. Assogbadjo, 3 Olivier J. Hardy, 4 Romain Glele Kakaï, 3 Brice Sinsin, 3 Patrick Van Damme, 5 and Godelieve Gheysen 2 2 Department of Molecular Biotechnology, Ghent University (UGent), Coupure Links 653, B-9000 Ghent, Belgium; 3 Laboratory of Applied Ecology, Faculty of Agronomic Sciences, University of Abomey-Calavi, 05 BP 1752 Cotonou, Benin; 4 Behavioural and Evolutionary Ecology Unit, CP 160/12, Faculté des Sciences, Université Libre de Bruxelles, 50 Av. F. Roosevelt, B-1050 Brussels, Belgium; and 5 Laboratory of Tropical and Subtropical Agriculture and Ethnobotany, Department of Plant Production, Ghent University (UGent), Coupure links 653, B-9000 Ghent (Belgium) This study evaluates the spatial genetic structure of baobab ( Adansonia digitata) populations from West African agroforestry systems at different geographical scales using AFLP fingerprints. Eleven populations from four countries (Benin, Ghana, Burkina Faso, and Senegal) had comparable levels of genetic diversity, although the two populations in the extreme west (Senegal) had less diversity. Pairwise F ST ranged from 0.02 to 0.28 and increased with geographic distance, even at a regional scale. Gene pools de- tected by Bayesian clustering seem to be a byproduct of the isolation-by-distance pattern rather than representing actual discrete entities. The organization of genetic diversity appears to result essentially from spatially restricted gene flow, with some influences of human seed exchange. Despite the potential for relatively long-distance pollen and seed dispersal by bats within populations, statistically significant spatial genetic structuring within populations (SGS) was detected and gave a mean indirect estimate of neighborhood size of ca. 45. This study demonstrated that relatively high levels of genetic structuring are present in baobab at both large and within-population level, which was unexpected in regard to its dispersal by bats and the influence of human exchange of seeds. Implications of these results for the conservation of baobab populations are discussed. Key words: Adansonia digitata; agroforestry systems; Malvaceae; genetic structure; spatial autocorrelation; West Africa. GALLEY PROOF

Welcome message from author
This document is posted to help you gain knowledge. Please leave a comment to let me know what you think about it! Share it to your friends and learn new things together.
Transcript

1
American Journal of Botany 96(5): 1–8. 2009.
Agroforestry systems are the result of a long evolutionary process during which an association between natural elements such as trees and shrubs share the same stands with crops and sometimes with households. They are characterized by the dominance of several multipurpose tree species, which are con-served and maintained in the fi eld by farmers because of their economic importance.
To date, the proportion and structure of variation maintained on-farm in tree species during the development of tropical agro-forestry systems is largely uncharacterized at an intraspecifi c level. Knowledge about population genetics is, however, of key importance for understanding microevolutionary processes in plant populations and supporting or developing appropriate use and conservation strategies ( Lengkeek et al., 2006 ). The long-term viability of tree species within agroforestry systems de-pends upon a wide genetic base providing the capacity to adapt to environmental fl uctuations or changing farmer requirements, such as change in species use or planting niche ( Lengkeek et al., 2006 ).
To date, few studies have focused on genetic variation of semidomesticated edible trees growing in parkland systems in sub-Saharian Africa (Allaye Kelly et al, 2004 ; Sanou et al, 2005 ; Lengkeek et al, 2006 ). Generally, spatial genetic struc-ture in tree species is infl uenced by several biological factors such as gene fl ow (mediated by seed and pollen dispersal), den-sity, fragmentation, colonization history, isolation into small patches, differential mortality, and microenvironmental selec-tion ( Wright, 1951 , Heywood, 1991 , Epperson, 1993 , Kang and Chung, 2000 ; Vekemans and Hardy, 2004 ). More specifi cally, in agroforestry systems, all these factors may be infl uenced by human activity leading to many changes in ecosystem processes with various impacts ( Young and Merriam, 1994 ; Aldrich et al., 1998 ; Allaye Kelly et al., 2004 ; Sanou et al., 2005 ).
West African agroforestry systems are dominated by several multipurpose tree species such as Adansonia digitata , Parkia africana , Blighia sapida , Tamarindus indica , and Vitellaria paradoxa . On the basis of threats (e.g., bush fi re, overgrazing, and overexploitation) and on the economic importance of Adan-sonia digitata (baobab tree) to the rural poor in Africa, the In-ternational Centre for Underutilised Crops (ICUC) has accorded high priority to enhance research and development for Adanso-nia digitata ( Sidibe and Williams, 2002 ). Also, Bioversity In-ternational (previously called International Plant Genetic Resources Institute) has classifi ed the baobab tree among the 10 top agroforestry tree species to be conserved and domesticated in West Africa ( Eyog Matig et al., 2002 ).
African baobab ( Adansonia digitata L., Malvaceae) is natu-rally associated with the savannah, especially the drier parts ( Wickens, 1982 ). It is a multipurpose tree species used daily by rural farmers for food and medicine and is economically and culturally important to local people. However, fi eld studies
1 Manuscript received 4 August 2009; revision accepted 14 January 2009. This work was supported by Bioversity International and Pioneer Hi-
Bred International Inc., a Dupont Company, through a Vavilov-Frankel Fellowship and by Rothamsted International through its African Fellowship Program for the fi nancial support in Europe. Additional funding for DNA fi ngerprinting and fi eldwork was provided by the DADOBAT-Project (EU-Funding) The King Leopold III Fund for Nature Conservation and Exploration. T.K. received a postdoctoral grant from Ghent University (BOF). O.J.H. is a Research Associate with the Belgian Fund for Scientifi c Research (FNRS). T.K. and A.E.A. equally contributed to this work.
6 Author for correspondence (e-mail: [email protected])
doi:10.3732/ajb.0800266
SPATIAL GENETIC STRUCTURING OF BAOBAB ( ADANSONIA DIGITATA , MALVACEAE) IN THE TRADITIONAL AGROFORESTRY
SYSTEMS OF WEST AFRICA 1
Tina Kyndt , 2,6 Achille E. Assogbadjo , 3 Olivier J. Hardy , 4 Romain Glele Kaka ï , 3 Brice Sinsin , 3 Patrick Van Damme, 5 and Godelieve Gheysen 2
2 Department of Molecular Biotechnology, Ghent University (UGent), Coupure Links 653, B-9000 Ghent, Belgium; 3 Laboratory of Applied Ecology, Faculty of Agronomic Sciences, University of Abomey-Calavi,
05 BP 1752 Cotonou, Benin; 4 Behavioural and Evolutionary Ecology Unit, CP 160/12, Facult é des Sciences, Universit é Libre de Bruxelles, 50 Av. F. Roosevelt, B-1050 Brussels, Belgium; and 5 Laboratory of Tropical and Subtropical Agriculture and Ethnobotany, Department of Plant Production, Ghent University (UGent), Coupure links 653, B-9000 Ghent (Belgium)
This study evaluates the spatial genetic structure of baobab ( Adansonia digitata ) populations from West African agroforestry systems at different geographical scales using AFLP fi ngerprints. Eleven populations from four countries (Benin, Ghana, Burkina Faso, and Senegal) had comparable levels of genetic diversity, although the two populations in the extreme west (Senegal) had less diversity. Pairwise F ST ranged from 0.02 to 0.28 and increased with geographic distance, even at a regional scale. Gene pools de-tected by Bayesian clustering seem to be a byproduct of the isolation-by-distance pattern rather than representing actual discrete entities. The organization of genetic diversity appears to result essentially from spatially restricted gene fl ow, with some infl uences of human seed exchange. Despite the potential for relatively long-distance pollen and seed dispersal by bats within populations, statistically signifi cant spatial genetic structuring within populations (SGS) was detected and gave a mean indirect estimate of neighborhood size of ca. 45. This study demonstrated that relatively high levels of genetic structuring are present in baobab at both large and within-population level, which was unexpected in regard to its dispersal by bats and the infl uence of human exchange of seeds. Implications of these results for the conservation of baobab populations are discussed.
Key words: Adansonia digitata ; agroforestry systems; Malvaceae; genetic structure; spatial autocorrelation; West Africa.
GALLEY PROOF

2 American Journal of Botany [Vol. 96
2006 ). The DNA fi ngerprints were scored by visual inspection for presence (1) or absence (0) of specifi c AFLP-bands. Only distinct, major bands were scored.
Data analyses — A model-based (Bayesian) clustering method was applied on the presence/absence matrix to infer genetic structure in the data set, using the software Structure version 2.0. ( Pritchard et al, 2000 ). Applying 250 000 iterations without using prior information of the number of populations (USE-POPINFO = 0), different K -values (2 – 19) were evaluated to estimate the num-ber of gene pools present in the data set. The most likely number of gene pools was determined by Δ K as described in Evanno et al. (2005) . Individuals of the 11 populations were then assigned probabilistically to the inferred gene pools.
To estimate genetic diversity and differentiation among populations, we analyzed population structure based on allele frequency using AFLPsurv ver-sion 1.0. ( Vekemans, 2002 ) with the methods described by Lynch and Milligan (1994) . Allelic frequencies at AFLP loci were estimated from the binary pres-ence/absence matrix, under the assumption of Hardy – Weinberg equilibrium, from the observed frequencies of fragments using the Bayesian approach pro-posed by Zhivotovsky (1999) . A non-uniform prior distribution of allelic fre-quencies was assumed with its parameters derived from the observed distribution of fragment frequencies among loci (see note 4 in Zhivotovsky, 1999 ). Nei ’ s (1973) gene diversity (also known as expected heterozygosity H e ) as well as pairwise genetic differentiation ( F ST ) were computed. Signifi cance of the ge-netic differentiation between groups was tested by comparison of the observed F ST with a distribution of F ST under a hypothesis of no genetic structure, ob-tained by means of 1000 random permutations of individuals among groups.
Estimation of gene frequencies from dominant markers requires an a priori assumption on the level of inbreeding within populations. Because fl oral traits of baobab suggest a predominantly outcrossing mating system, as observed for the large majority of tropical trees, we assumed Hardy – Weinberg equilibrium to esti-mate F ST and heterozygosity. However, because this assumption could not be checked, we used an alternative phenetic method for partitioning genetic vari-ability among and within populations and regions, an analysis of molecular vari-ance (AMOVA) based on the presence/absence matrix using the program Arlequin version 2.000 ( Schneider et al., 2000 ). This statistical analysis is recognized as an effective tool to characterize population structure and degree of genetic differen-tiation ( φ ST ) ( Excoffi er et al., 1992 ). It has also been shown to be effective in the study of tetraploid species ( Jenczewski et al., 1999 ). This analysis is particularly interesting in the case of A. digitata, for which cytological hypervariability and an autotetraploid origin (resulting from aneuploid reduction from 4 × = 176) has been suggested ( Baum and Oginuma, 1994 ) but not thoroughly established.
Under Wright ’ s isolation-by-distance model, the pairwise genetic diversity between individuals and/or populations is expected to vary linearly with the logarithm of their geographic distance on a two-dimensional scale ( Rousset 1997 , 2000 ; Hardy and Vekemans, 1999 , Hardy, 2003 ). To detect this kind of spatial autocorrelation at large and regional scales, we calculated and tested the correlation between F ST /(1 − F ST ) and the natural logarithm of geographical distances between populations using the Mantel test ( Mantel, 1967 ) in the pro-gram NTSYS-pc ( Rohlf, 2000 ). Statistical signifi cance was evaluated with 1000 permutations.
have shown that the current semidomestication of baobab is al-ready causing regeneration problems ( Assogbadjo et al, 2005 ), and the species is threatened by overexploitation as well as by bush fi re, agriculture, and grazing in the parkland agroforestry systems of West Africa ( Sidibe and Williams, 2002 ; Assogbadjo et al, 2005 , 2006 ).
The only study on the population genetics of baobab, per-formed by our research group in Benin ( Assogbadjo et al, 2006 ), indicated some degree of physical isolation of the populations collected in the three climatic zones of Benin and supposed a certain impact of the environment and geographic distance on the level of genetic structuring among the analyzed populations. However, the study area was restricted in size.
The current study aims at studying the levels of spatial struc-turing of baobab at different geographic scales. Specifi cally, this study involves a population genetic study of 11 baobab populations from four West African countries where the spe-cies is abundant and widely distributed in the parkland agrofor-estry systems (Benin, Ghana, Burkina Faso, and Senegal). Our main objectives were to characterize the level and organization of genetic variation within and between A. digitata populations at different geographical levels: large scale (the four West Afri-can countries), regional scale (i.e., Benin, Ghana, and Burkina Faso), and fi ne scale (within populations).
This study addresses the following questions: (1) Is there a geographical gradient of genetic diversity? (2) Does the organi-zation of genetic variation at the large, country scale and at the regional scale reveal discrete gene pools and/or a pattern of iso-lation by distance? (3) Is there any evidence for spatial genetic structuring within populations (SGS)?
This study provides insights into the level of gene fl ow among and within baobab populations and more specifi cally on the effi ciency of humans and animals as seed dispersers of this African tree species. The results of this study will be used to build and enhance a database for species conservation and do-mestication in the West African region.
MATERIALS AND METHODS
Sampling — In this study, baobab individuals from four countries were sam-pled in the Sudanian and Sudano-Sahelian regions of West Africa: Benin, Burkina Faso, Ghana, and Senegal. These countries are characterized by opti-mal ecological conditions for the growth and development of this species ( FAO, 1981 ; Wickens, 1982 ).
Figure 1 shows the geographic distribution of the analyzed populations. Fif-teen to 29 individuals were sampled within each population. A baobab popula-tion was defi ned as a group of baobab trees randomly and naturally distributed in a traditional agroforestry system within a 30-km maximum radius. Two dif-ferent populations are isolated from each other by a distance of at least 50 km. Within a population, baobab individuals were randomly selected. In total, 11 populations of baobab represented by 251 individuals were sampled in the four countries.
For Benin, sampling of a transect and megatransect within the studied eco-logical zones and localities of Benin ( Assogbadjo et al., 2005 ) showed that the natural mean population density is 5 baobabs/km 2 in the Sudanian zone. Per-sonal observations in the fi eld suggest that mean densities in the Sudano-Sahe-lian zone of Ghana, Burkina Faso, and Senegal are 4, 6 and 7 baobabs/km 2 , respectively.
Molecular analyses — For each baobab, four or fi ve leaves were harvested and dried in silica gel for DNA extraction and AFLP analysis. Five primer pairs (E-GT/M-ACGG, E-GT/M-ACGA, E-GA/M-ACGC, E-TC/M-GCGA, E-AT/M-GCGG) were chosen based on an initial screening for polymorphism among a limited number of samples and on band consistency and repeatability during previous work on the genetic diversity of baobab in Benin ( Assogbadjo et al.,
Fig. 1. Map of West Africa, showing the geographical location of the studied baobab populations.
GALLEY PROOF
3May 2009] Kyndt et al. — Spatial genetic structure of ADANSONIA DIGITATA
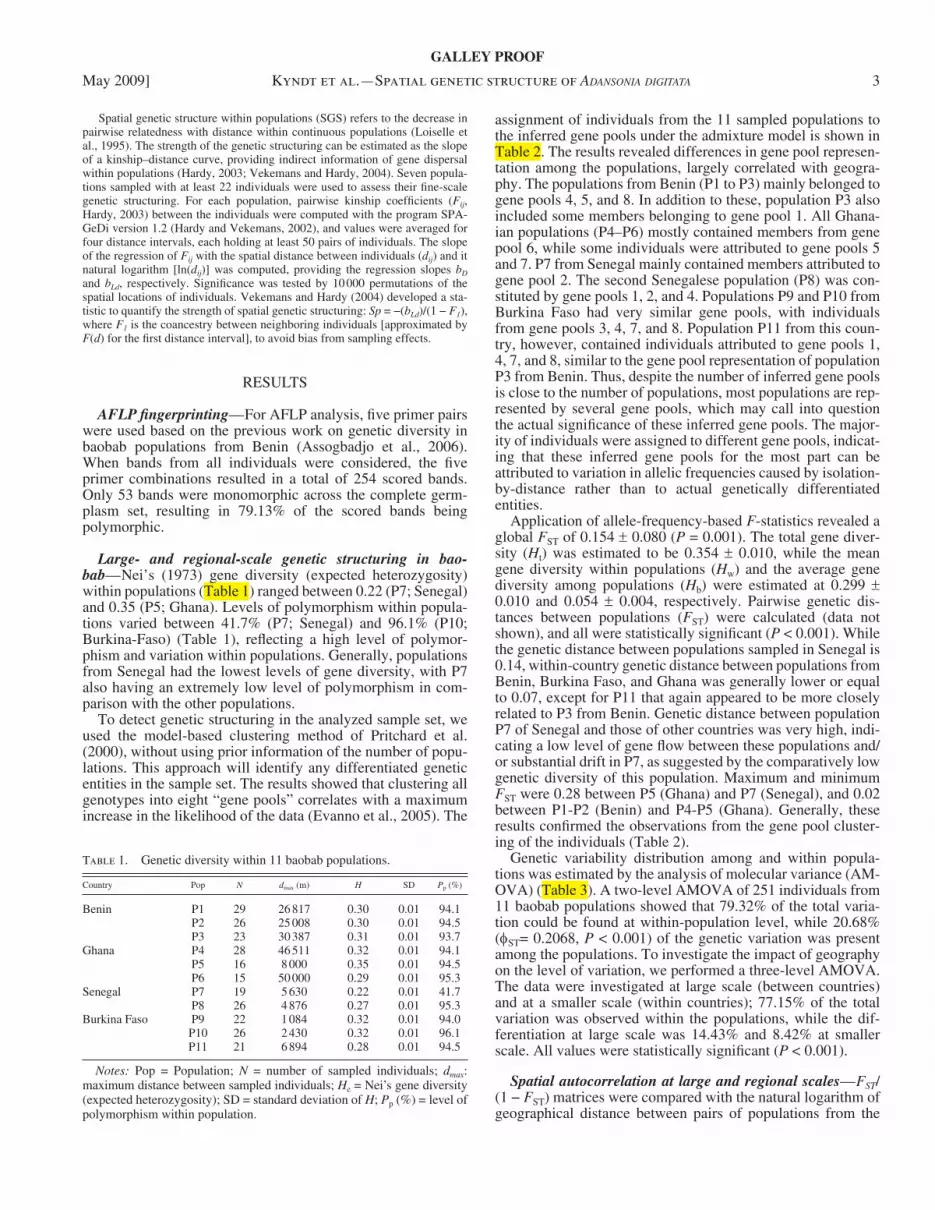
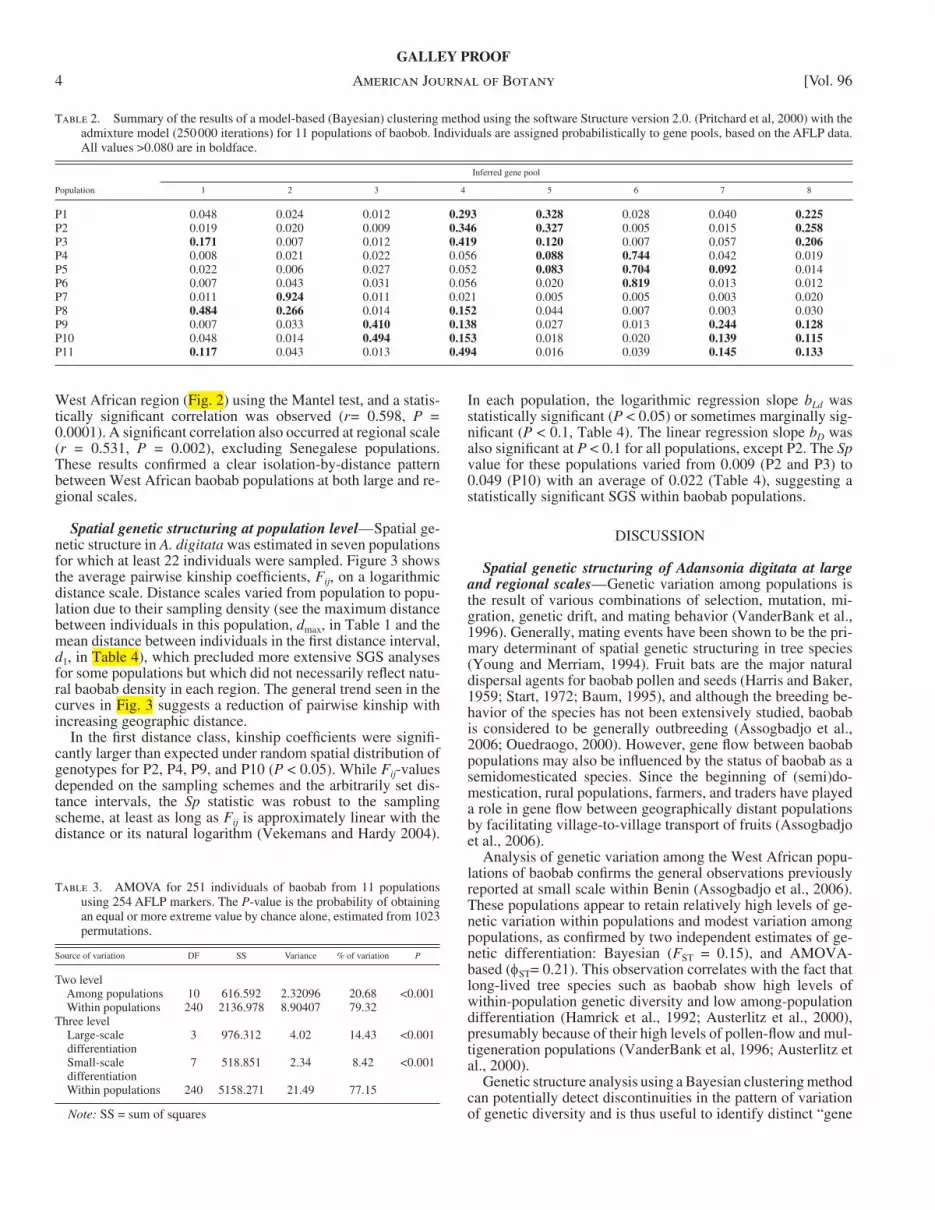
assignment of individuals from the 11 sampled populations to the inferred gene pools under the admixture model is shown in Table 2 . The results revealed differences in gene pool represen-tation among the populations, largely correlated with geogra-phy. The populations from Benin (P1 to P3) mainly belonged to gene pools 4, 5, and 8. In addition to these, population P3 also included some members belonging to gene pool 1. All Ghana-ian populations (P4 – P6) mostly contained members from gene pool 6, while some individuals were attributed to gene pools 5 and 7. P7 from Senegal mainly contained members attributed to gene pool 2. The second Senegalese population (P8) was con-stituted by gene pools 1, 2, and 4. Populations P9 and P10 from Burkina Faso had very similar gene pools, with individuals from gene pools 3, 4, 7, and 8. Population P11 from this coun-try, however, contained individuals attributed to gene pools 1, 4, 7, and 8, similar to the gene pool representation of population P3 from Benin. Thus, despite the number of inferred gene pools is close to the number of populations, most populations are rep-resented by several gene pools, which may call into question the actual signifi cance of these inferred gene pools. The major-ity of individuals were assigned to different gene pools, indicat-ing that these inferred gene pools for the most part can be attributed to variation in allelic frequencies caused by isolation-by-distance rather than to actual genetically differentiated entities.
Application of allele-frequency-based F -statistics revealed a global F ST of 0.154 ± 0.080 ( P = 0.001). The total gene diver-sity ( H t ) was estimated to be 0.354 ± 0.010, while the mean gene diversity within populations ( H w ) and the average gene diversity among populations ( H b ) were estimated at 0.299 ± 0.010 and 0.054 ± 0.004, respectively. Pairwise genetic dis-tances between populations ( F ST ) were calculated (data not shown), and all were statistically signifi cant ( P < 0.001). While the genetic distance between populations sampled in Senegal is 0.14, within-country genetic distance between populations from Benin, Burkina Faso, and Ghana was generally lower or equal to 0.07, except for P11 that again appeared to be more closely related to P3 from Benin. Genetic distance between population P7 of Senegal and those of other countries was very high, indi-cating a low level of gene fl ow between these populations and/or substantial drift in P7, as suggested by the comparatively low genetic diversity of this population. Maximum and minimum F ST were 0.28 between P5 (Ghana) and P7 (Senegal), and 0.02 between P1-P2 (Benin) and P4-P5 (Ghana). Generally, these results confi rmed the observations from the gene pool cluster-ing of the individuals ( Table 2 ).
Genetic variability distribution among and within popula-tions was estimated by the analysis of molecular variance (AM-OVA) ( Table 3 ). A two-level AMOVA of 251 individuals from 11 baobab populations showed that 79.32% of the total varia-tion could be found at within-population level, while 20.68% ( φ ST = 0.2068, P < 0.001) of the genetic variation was present among the populations. To investigate the impact of geography on the level of variation, we performed a three-level AMOVA. The data were investigated at large scale (between countries) and at a smaller scale (within countries); 77.15% of the total variation was observed within the populations, while the dif-ferentiation at large scale was 14.43% and 8.42% at smaller scale. All values were statistically signifi cant ( P < 0.001).
Spatial autocorrelation at large and regional scales — F ST /(1 − F ST ) matrices were compared with the natural logarithm of geographical distance between pairs of populations from the
Spatial genetic structure within populations (SGS) refers to the decrease in pairwise relatedness with distance within continuous populations ( Loiselle et al., 1995 ). The strength of the genetic structuring can be estimated as the slope of a kinship – distance curve, providing indirect information of gene dispersal within populations ( Hardy, 2003 ; Vekemans and Hardy, 2004 ). Seven popula-tions sampled with at least 22 individuals were used to assess their fi ne-scale genetic structuring. For each population, pairwise kinship coeffi cients ( F ij , Hardy, 2003 ) between the individuals were computed with the program SPA-GeDi version 1.2 ( Hardy and Vekemans, 2002 ), and values were averaged for four distance intervals, each holding at least 50 pairs of individuals. The slope of the regression of F ij with the spatial distance between individuals ( d ij ) and it natural logarithm [ln( d ij )] was computed, providing the regression slopes b D and b Ld , respectively. Signifi cance was tested by 10 000 permutations of the spatial locations of individuals. Vekemans and Hardy (2004) developed a sta-tistic to quantify the strength of spatial genetic structuring: Sp = − ( b Ld )/(1 − F 1 ), where F 1 is the coancestry between neighboring individuals [approximated by F ( d ) for the fi rst distance interval], to avoid bias from sampling effects.
RESULTS
AFLP fi ngerprinting — For AFLP analysis, fi ve primer pairs were used based on the previous work on genetic diversity in baobab populations from Benin ( Assogbadjo et al., 2006 ). When bands from all individuals were considered, the fi ve primer combinations resulted in a total of 254 scored bands. Only 53 bands were monomorphic across the complete germ-plasm set, resulting in 79.13% of the scored bands being polymorphic.
Large- and regional-scale genetic structuring in bao-bab — Nei ’ s (1973) gene diversity (expected heterozygosity) within populations ( Table 1 ) ranged between 0.22 (P7; Senegal) and 0.35 (P5; Ghana). Levels of polymorphism within popula-tions varied between 41.7% (P7; Senegal) and 96.1% (P10; Burkina-Faso) ( Table 1 ), refl ecting a high level of polymor-phism and variation within populations. Generally, populations from Senegal had the lowest levels of gene diversity, with P7 also having an extremely low level of polymorphism in com-parison with the other populations.
To detect genetic structuring in the analyzed sample set, we used the model-based clustering method of Pritchard et al. (2000) , without using prior information of the number of popu-lations. This approach will identify any differentiated genetic entities in the sample set. The results showed that clustering all genotypes into eight “ gene pools ” correlates with a maximum increase in the likelihood of the data ( Evanno et al., 2005 ). The
Table 1. Genetic diversity within 11 baobab populations.
Country Pop N d max (m) H SD P p (%)
Benin P1 29 26 817 0.30 0.01 94.1P2 26 25 008 0.30 0.01 94.5P3 23 30 387 0.31 0.01 93.7
Ghana P4 28 46 511 0.32 0.01 94.1P5 16 8 000 0.35 0.01 94.5P6 15 50 000 0.29 0.01 95.3
Senegal P7 19 5 630 0.22 0.01 41.7P8 26 4 876 0.27 0.01 95.3
Burkina Faso P9 22 1 084 0.32 0.01 94.0P10 26 2 430 0.32 0.01 96.1P11 21 6 894 0.28 0.01 94.5
Notes: Pop = Population; N = number of sampled individuals; d max : maximum distance between sampled individuals; H e = Nei ’ s gene diversity (expected heterozygosity); SD = standard deviation of H ; P p (%) = level of polymorphism within population.
GALLEY PROOF
4 American Journal of Botany [Vol. 96
In each population, the logarithmic regression slope b Ld was statistically signifi cant ( P < 0.05) or sometimes marginally sig-nifi cant ( P < 0.1, Table 4 ). The linear regression slope b D was also signifi cant at P < 0.1 for all populations, except P2. The Sp value for these populations varied from 0.009 (P2 and P3) to 0.049 (P10) with an average of 0.022 ( Table 4 ), suggesting a statistically signifi cant SGS within baobab populations.
DISCUSSION
Spatial genetic structuring of Adansonia digitata at large and regional scales — Genetic variation among populations is the result of various combinations of selection, mutation, mi-gration, genetic drift, and mating behavior (VanderBank et al., 1996). Generally, mating events have been shown to be the pri-mary determinant of spatial genetic structuring in tree species ( Young and Merriam, 1994 ). Fruit bats are the major natural dispersal agents for baobab pollen and seeds (Harris and Baker, 1959; Start, 1972 ; Baum, 1995 ), and although the breeding be-havior of the species has not been extensively studied, baobab is considered to be generally outbreeding ( Assogbadjo et al., 2006 ; Ouedraogo, 2000 ). However, gene fl ow between baobab populations may also be infl uenced by the status of baobab as a semidomesticated species. Since the beginning of (semi)do-mestication, rural populations, farmers, and traders have played a role in gene fl ow between geographically distant populations by facilitating village-to-village transport of fruits ( Assogbadjo et al., 2006 ).
Analysis of genetic variation among the West African popu-lations of baobab confi rms the general observations previously reported at small scale within Benin ( Assogbadjo et al., 2006 ). These populations appear to retain relatively high levels of ge-netic variation within populations and modest variation among populations, as confi rmed by two independent estimates of ge-netic differentiation: Bayesian ( F ST = 0.15), and AMOVA-based ( φ ST = 0.21). This observation correlates with the fact that long-lived tree species such as baobab show high levels of within-population genetic diversity and low among-population differentiation ( Hamrick et al., 1992 ; Austerlitz et al., 2000 ), presumably because of their high levels of pollen-fl ow and mul-tigeneration populations (VanderBank et al, 1996; Austerlitz et al., 2000 ).
Genetic structure analysis using a Bayesian clustering method can potentially detect discontinuities in the pattern of variation of genetic diversity and is thus useful to identify distinct “ gene
West African region ( Fig. 2 ) using the Mantel test, and a statis-tically signifi cant correlation was observed ( r= 0.598, P = 0.0001). A signifi cant correlation also occurred at regional scale ( r = 0.531, P = 0.002), excluding Senegalese populations. These results confi rmed a clear isolation-by-distance pattern between West African baobab populations at both large and re-gional scales.
Spatial genetic structuring at population level — Spatial ge-netic structure in A. digitata was estimated in seven populations for which at least 22 individuals were sampled. Figure 3 shows the average pairwise kinship coeffi cients, F ij , on a logarithmic distance scale. Distance scales varied from population to popu-lation due to their sampling density (see the maximum distance between individuals in this population, d max , in Table 1 and the mean distance between individuals in the fi rst distance interval, d 1 , in Table 4 ) , which precluded more extensive SGS analyses for some populations but which did not necessarily refl ect natu-ral baobab density in each region. The general trend seen in the curves in Fig. 3 suggests a reduction of pairwise kinship with increasing geographic distance.
In the fi rst distance class, kinship coeffi cients were signifi -cantly larger than expected under random spatial distribution of genotypes for P2, P4, P9, and P10 ( P < 0.05). While F ij -values depended on the sampling schemes and the arbitrarily set dis-tance intervals, the Sp statistic was robust to the sampling scheme, at least as long as F ij is approximately linear with the distance or its natural logarithm ( Vekemans and Hardy 2004 ).
Table 2. Summary of the results of a model-based (Bayesian) clustering method using the software Structure version 2.0. ( Pritchard et al, 2000 ) with the admixture model (250 000 iterations) for 11 populations of baobob. Individuals are assigned probabilistically to gene pools, based on the AFLP data. All values > 0.080 are in boldface.
Inferred gene pool
Population 1 2 3 4 5 6 7 8
P1 0.048 0.024 0.012 0.293 0.328 0.028 0.040 0.225 P2 0.019 0.020 0.009 0.346 0.327 0.005 0.015 0.258 P3 0.171 0.007 0.012 0.419 0.120 0.007 0.057 0.206 P4 0.008 0.021 0.022 0.056 0.088 0.744 0.042 0.019P5 0.022 0.006 0.027 0.052 0.083 0.704 0.092 0.014P6 0.007 0.043 0.031 0.056 0.020 0.819 0.013 0.012P7 0.011 0.924 0.011 0.021 0.005 0.005 0.003 0.020P8 0.484 0.266 0.014 0.152 0.044 0.007 0.003 0.030P9 0.007 0.033 0.410 0.138 0.027 0.013 0.244 0.128 P10 0.048 0.014 0.494 0.153 0.018 0.020 0.139 0.115 P11 0.117 0.043 0.013 0.494 0.016 0.039 0.145 0.133
Table 3. AMOVA for 251 individuals of baobab from 11 populations using 254 AFLP markers. The P -value is the probability of obtaining an equal or more extreme value by chance alone, estimated from 1023 permutations.
Source of variation DF SS Variance % of variation P
Two level Among populations 10 616.592 2.32096 20.68 < 0.001 Within populations 240 2136.978 8.90407 79.32Three level Large-scale
differentiation3 976.312 4.02 14.43 < 0.001
Small-scale differentiation
7 518.851 2.34 8.42 < 0.001
Within populations 240 5158.271 21.49 77.15
Note: SS = sum of squares
GALLEY PROOF

5May 2009] Kyndt et al. — Spatial genetic structure of ADANSONIA DIGITATA
geographic organization of genetic variation, continuous geo-graphic gradients in allele frequencies due to isolation by dis-tance cause the clustering algorithm to create discrete entities. The spatial autocorrelation tests in this study confi rmed that the genetic differentiation between West African baobab popula-tions is positively correlated to the logarithm of their geograph-ical distance, as predicted under the isolation-by-distance theory. This isolation by distance was observed at both large scale (the whole West African zone) and medium scale (the region covering Benin, Ghana, and Burkina Faso). Although human infl uence in the traditional agroforestry systems is ex-pected to have a reducing effect on the genetic differentiation between populations by seed exchange, this effect is apparently only playing at narrow geographical scale, e.g., at local mar-kets. Between-population seed exchange by humans is not able to prevent some level of spatial isolation by distance between baobab populations at larger scales.
Spatial genetic structuring at within-population level — The-oretical models ( Wright, 1951 , 1978 ) predict an absence of fi ne-scale spatial structure when gene fl ow is extensive and there is local spatial genetic structure under locally restricted gene fl ow. The isolation-by-distance model, as proposed by Wright (1946) predicts the formation of local pedigree struc-tures as a result of limited gene dispersal and local random ge-netic drift. Gene movement in plant populations involves both pollen and seed, but the development of spatial genetic struc-ture within populations is supposed to be infl uenced more strongly by seed dispersal ( Fenster, 1991 ; Chung et al., 2004 ). Neighboring individuals will have an increased probability of sharing at least one parent when seed dispersal is limited while pollen dispersal is panmictic, leading to the formation of spatial autocorrelative genetic structure ( Dyer, 2007 ).
In this study, a statistically signifi cant SGS was detected within seven populations from West Africa. Kinship between individuals was shown to decrease following distance in all populations and signifi cant Sp -values were recorded despite the small sample sizes. Although small sample sizes restrict the available details regarding SGS and limit the statistical power to detect signifi cant SGS, our result show that a high number of AFLP markers can partially compensate for small sample sizes by providing more precise estimates of pairwise kinship coef-fi cients, in line with results from Hardy (2003) and Hardy et al. (2006) .
On average, the Sp statistic equals 0.022, which would correspond with a neighborhood size (Nb ≈ 1/ Sp ) of about 45 individuals (varying from 20 to 100 individuals depending on the studied population) if we assume that drift-dispersal equilibrium is reached. This observation implies that gene dispersal, and hence seed dispersal, within populations is lim-ited ( Loiselle et al., 1995 ), which is remarkable considering the fact that baobab is known to be relying mainly on fruit bats ( E. helvum , Epomophorus gambiensis , and Rousettus aegyptiacus ) for pollination and seed dispersal ( Baum, 1995 ).
Fruit bats are among the most widely distributed gregarious bats in Africa. Some populations are very localized, forming vast colonies in areas where there is year long abundance of fruit ( Kingdon, 1984 ), others (like E. helvum ) perform seasonal migrations ranging up to thousands of kilometers looking for food ( Richter and Cumming, 2005 ). Throughout the residence period, a foraging range of up to 15 km has been reported for E. helvum ( Richter and Cumming, 2005 ). This kind of movement within the baobab population would suggest a substantial
pools ” that have diverged following an historical separation or as a result of peculiar gene fl ow barriers (e.g., Born et al., 2008 ). Using the criterion designed by Evanno et al. (2005), eight such “ gene pools ” were inferred in our population sample and popu-lations from the same country are largely constituted of indi-viduals belonging to the same gene pools. The only clear exception to this rule is population P11 from Burkina Faso, which shows a similar gene pool composition as P3 from Be-nin. Nevertheless, this observation is not surprising considering the fact that P11 is located close to the geographical border be-tween Burkina Faso and Benin and is therefore very likely to be infl uenced by human seed exchange with populations from Be-nin. Whether the inferred gene pools represent biologically rel-evant entities can be questioned because there were nearly as many inferred gene pools as populations, most populations were represented by at least two gene pools, and the majority of individuals were attributed to different gene pools. As men-tioned in the documentation of the Structure 2.2 software, these results suggest that instead of clear-cut discontinuities in the
Fig. 2. Scatter plot showing the relationship between F ST /(1 − F ST ) and the natural logarithm of geographical distances between populations.
Fig. 3. Mean pairwise kinship coeffi cients ( F ij ) between individuals according to the natural logarithm of geographical distance within seven baobab populations from West Africa.
GALLEY PROOF

6 American Journal of Botany [Vol. 96
The current high levels of genetic variation present within populations of Benin, Ghana, and Burkina Faso imply that large numbers of samples from a few populations will capture a suf-fi cient amount of the species ’ genetic variability for conserva-tion programs. However, it has to be noted that such a practice would increase the chance of missing rare alleles, particularly in disjunct populations, which also express extreme phenotypes for phenological traits related to climatic adaptation. Indeed, this study and a previous study in Benin ( Assogbadjo et al, 2006 ) showed substantive levels of isolation by distance be-tween and within baobab populations. Gapare et al. (2005) sug-gested in these cases to sample populations from different geographic areas to maximize genetic diversity for ex situ col-lections. It has to be noted that AFLP provides neutral markers, which are not correlated with morphological subclassifi cation of baobab ( Assogbadjo et al., 2008 ) across the West African region. However, some morphometric variables were shown to correlate with geographic distance and genetic differentiation between baobab populations from Benin ( Assogbadjo et al. 2006 ). In addition, taking into account the isolation by distance observed in the current study, we can see that sampling across a wide ecogeographical range is essential.
Low genetic diversity and high levels of differentiation with other populations imply the need for conservation strategies to primarily focus on baobab populations from Senegal. Sampling for conservation strategies should target more populations and individuals in Senegal, and to a lesser extent in Burkina Faso, where a substantial amount of genetic differentiation was ob-served between populations. Although more populations should be studied to confi rm our observations about SGS within bao-bab populations, conservation strategies should avoid sampling neighboring trees, which are likely to be closely related.
To obtain a view of the long-term genetic variation of baobab in agroforestry systems, we need to monitor the allelic richness and inbreeding effects in the populations across generations. A comparison of SGS between populations with different levels of human infl uence would provide interesting insights in the long-term effects of agroforestry systems on the population ge-netics of savannah trees.
LITERATURE CITED
Aldrich , P. R. , J. L. Hamrick , P. Chavarriaga , and G. Kochert . 1998 . Microsatellite analysis of demographic genetic structure in fragmented populations of the tropical tree Symphonia globulifera. Molecular Ecology 7 : 933 – 944 .
Allaye Kelly , B. , O. J. Hardy , and J.-M. Bouvet . 2004 . Temporal and spatial genetic structure in Vitellaria paradoxa (shea tree) in an agro-forestry system in southern Mali. Molecular Ecology 13 : 1231 – 1240 .
Assogbadjo , A. E. , R. Gl è l è Kaka ï , F. J. Chadare , L. Thomson , T. Kyndt , B. Sinsin , and P. Van Damme . 2008 . Genetic fi ngerprint-ing using AFLP cannot distinguish traditionally classifi ed baobab morphotypes. Agroforestry Systems .
Assogbadjo , A. E. , T. Kyndt , B. Sinsin , G. Gheysen , and P. Van Damme . 2006 . Patterns of genetic and morphometric diversity in baobab ( Adansonia digitata L.) populations across different climatic zones of Benin (West Africa). Annals of Botany 97 : 819 – 830 .
Assogbadjo , A. E. , B. Sinsin , J. T. C. Codjia , and P. Van Damme . 2005 . Ecological diversity and pulp, seed and kernel production of the baobab ( Adansonia digitata ) in Benin. Belgian Journal of Botany 138 : 7 – 56 .
Austerlitz , F. , S. Mariette , N. Machon , P. H. Gouyon , and B. Godelle . 2000 . Effects of colonization processes on genetic diver-sity: Differences between annual plants and tree species. Genetics 154 : 1309 – 1321 .
amount of gene dispersal (up to 15 km), which is expected to erase SGS within populations ( Hamrick and Loveless, 1986 ; Kalisz et al., 2001 ).
Based on the SGS found in this study, it might be hypothe-sized that bats are not so effective to promote long-distance dis-persal of seeds within baobab populations. Although the lack of natural pollinators around the sampled baobab populations might account for the observed phenomenon, more plausible ex-planations lie in baobab ’ s possession of heavy diaspores and its low density populations. Heavy diaspores have been suggested to result in short-distance seed dispersal, leading to short gene-dispersal distances in neotropical tree species ( Hardy et al., 2006 ). At small distances, localized seed fall from related indi-viduals will enhance the spatial genetic structure within popula-tions. In addition, baobab populations in agroforestry systems reveal very low densities: 1 – 5 individuals per km 2 have been reported in Benin ( Assogbadjo et al., 2005 ). The Sp statistic was found to be higher in low density plant populations, a pattern regularly found in other species ( Vekemans and Hardy 2004 ). It can be explained by the reduction of seed shadow overlap at low density so that nearby individuals are more related and kinship coeffi cients decrease faster with geographic distance.
Consequences for conservation of baobab genetic variation in West Africa — Baobab populations in West African agrofor-estry systems are under the constant infl uence of human activi-ties, which may affect the genetic structure of tree species through their effect on seed and pollen dispersal, density, frag-mentation, and selection ( Young and Merriam, 1994 ; Aldrich et al, 1998 ; Allaye Kelly et al., 2004 ). These perturbations of natu-ral populations can have a major impact on breeding structure and hence reduce genetic diversity and fi tness by promoting in-breeding ( Aldrich et al., 1998 ; Chung et al., 2004 ). The current study of SGS suggests a spatial aggregation of related geno-types and therefore risks for future inbreeding depression. How-ever, a substantial amount of genetic variability was observed within the 11 analyzed baobab populations from West Africa and baobab populations with strong human infl uence (e.g., in Benin) even revealed slightly higher levels of variation than less-infl uenced populations (e.g., from Senegal). Most proba-bly, active seed exchange on local markets will enhance gene fl ow between populations, maintaining genetic variation within populations and reducing interpopulation genetic differentia-tion and inbreeding levels ( Loiselle et al., 1995 ; Chung et al., 2000 ). Nevertheless, this local seed exchange does not obstruct the development of some signifi cant level of genetic differentia-tion between and within populations, correlated with their geo-graphic distance, following the isolation-by-distance theory.
Table 4. Sp statistic α α ( Vekemans and Hardy, 2004 ) and 95% confi dence intervals (CI) revealing strength of spatial genetic structuring in seven baobab populations. d 1 : mean distance (m) between individuals in the fi rst distance interval. P -values refer to Mantel tests.
Population d 1 (m) Sp CI ( Sp ) P -value
P1 627 0.012 (0.007 – 0.017) 0.024P2 635 0.009 (0.002 – 0.016) 0.073P3 627 0.009 (0.001 – 0.015) 0.061P4 764 0.019 (0.012 – 0.026) 0.002P8 300 0.011 (0.002 – 0.021) 0.038P9 153 0.046 (0.028 – 0.064) 0.001P10 320 0.049 (0.030 – 0.066) 0.001Mean 0.022
GALLEY PROOF
7May 2009] Kyndt et al. — Spatial genetic structure of ADANSONIA DIGITATA
phic DNA (RAPD) markers and comparison to allozymes. Molecular Ecology 8 : 1317 – 1330 .
Kalisz , S. , J. D. Nason , F. M. Hanzawa , and S. J. Tonsor . 2001 . Spatial population genetic structure in Trillium grandifl orum : The roles of dispersal, mating, history, and selection. Evolution 55 : 1560 – 1568 .
Kang , S. K. , and M. G. Chung . 2000 . High levels of allozyme variation within populations and low allozyme divergence within and among species of Hemerocallis (Liliaceae). American Journal of Botany 87 : 1634 – 1646 .
Kingdon , J. 1984 . East African mammals: An atlas of evolution in Africa, vol. 2, part A, Insectivores and bats. University of Chicago Press, Chicago, Illinois, USA.
Lengkeek , A. G. , A. M. Mwangi , C. A. C. Agufa , J. O. Ahenda , and I. K. Dawson . 2006 . Comparing genetic diversity in agroforestry systems with natural forest: A case study of the important timber tree Vitex fi scheri in central Kenya. Agroforestry Systems 67 : 293 – 300 .
Loiselle , B. A. , V. L. Sork , J. Nason , and C. Graham . 1995 . Spatial genetic structure of a tropical understory shrub, Psychotria offi cinalis (Rubiaceae). American Journal of Botany 82 : 1420 – 1425 .
Lynch , M. , and B. G. Milligan . 1994 . Analysis of population genetic structure with RAPD markers. Molecular Ecology 3 : 91 – 99 .
Mantel , N. A. 1967 . The detection of disease clustering and a general-ized regression approach. Cancer Research 27 : 209 – 220 .
Nei , M. 1973 . Analysis of gene diversity in subdivided populations. Proceedings of the National Academy of Sciences, USA 70 : 3321 – 3323 .
Ouedraogo , L. G. 2000 . Rapport du Burkina-Faso. In O. Eyog Matig, O.G. Gaou é , and B. Dossou [eds.], R é seau Esp è ces Ligneuses Alimentaires: Compte rendu de la premi è re r é union du R é seau tenue 11 – 13 d é cembre 2000 au CNSF Ouagadougou, Burkina Faso. Institut International des Ressources Phytog é n é tiques, Rome, Italy.
Pritchard , J. K. , M. Stephens , and P. Donnelly . 2000 . Inference of population structure using multilocus genotype data. Genetics 155 : 945 – 959 .
Richter , H. V. , and G. S. Cumming . 2005 . Food availability and annual migration of the straw-colored fruit bat ( Eidolon helvum ). Journal of Zoology 268 : 35 – 44 .
Rohlf , F. J. 2000 . NTSYS-pc, numerical taxonomy and multivariate analysis system, version 2.1. Exeter Software, Setauket, New York, USA.
Rousset , F. 1997 . Genetic differentiation and estimation of gene fl ow from F -statistics under isolation by distance. Genetics 145 : 1219 – 1228 .
Rousset , F. 2000 . Genetic differentiation between individuals. Journal of Evolutionary Biology 13 : 58 – 62 .
Sanou , H. , P. N. Lovett , and J. M. Bouvet . 2005 . Comparison of quantitative and molecular variation in agroforestry populations of the shea tree ( Vitellaria paradoxa CF Gaertn) in Mali. Molecular Ecology 14 : 2601 – 2610 .
Schneider , S. , D. Roessli , and L. Excoffier . 2000 . Arlequin: Software for population genetic data. Genetics and Biometry Laboratory, University of Geneva, Switzerland.
Sidibe , M. , and J. T. Williams . 2002 . Baobab: Adansonia digitata L.. International Centre for Underutilised Crops, Southampton, UK.
Start , A. N. 1972 . Pollination of the baobab ( Adansonia digitata ) by the fruit bat ( Rousethus agyptiacus ). East African Wildlife Journal 10 : 71 – 72 .
VanderBank , H., B.-E. Van Wykt, and M. VanderBank . 1996 . Genetic variation within and geographical relationships between four natu-ral populations of Virgilia oroboides (tribe Podalyrieae: Fabaceae). Biochemical Systematics and Ecology 24 : 135 – 143 .
Vekemans , X. 2002 . AFLP-surv, version 1.0. Computer program distrib-uted by the author, Laboratoire de G é n é tique et Ecologie V é g é tale, Universit é Libre de Bruxelles, Brussels, Belgium.
Vekemans , X. , and O. J. Hardy . 2004 . New insights from fi ne-scale spatial genetic structure analyses in plant populations. Molecular Ecology 13 : 921 – 935 .
Wickens , G. E. 1982 . The baobab: Africa ’ s upside-down tree. Kew Bulletin 37 : 173 – 209 .
Wright , S. 1946 . Isolation by distance under diverse systems of mating. Genetics 31 : 39 – 59 .
Baum , D. A. 1995 . The comparative pollination and fl oral biology of bao-babs ( Adansonia – Bombacaceae). Annals of the Missouri Botanical Garden 82 : 322 – 348 .
Baum , D. A. , and K. Oginuma . 1994 . A review of chromosome numbers in Bombacaceae with new counts for Adansonia. Taxon 43 : 11 – 20 .
Born , C. , O. J. Hardy , M. H. Chevallier , S. Ossari , C. Atteke , J. Wickings , and M. Hossaert-McKey . 2008 . Small-scale spatial ge-netic structure in the Central African rainforest tree species Aucoumea klaineana : A stepwise approach to infer the impact of limited gene dispersal, population history and habitat fragmentation. Molecular Ecology 17 : 2041 – 2050 .
Chung , M. G. , M. Y. Chung , G. S. Oh , and B. K. Epperson . 2000 . Spatial genetic structure in a Neolitsea sericea population (Lauraceae). Heredity 85 : 490 – 497 .
Chung , M. Y. , J. D. Nason , and M. G. Chung . 2004 . Spatial genetic structure in populations of the terrestrial orchid Cephelanthera longi-bracteata (Orchidaceae). American Journal of Botany 91 : 52 – 57 .
Dyer , R. J. 2007 . Powers of discerning: Challenges to understanding dispersal processes in natural populations. Molecular Ecology 16 : 4881 – 4882 .
Epperson , B. K. 1993 . Recent advances in correlation studies of spatial patterns of genetic variation. Evolutionary Biology 27 : 95 – 155 .
Evanno , G. , S. Regnaut , and J. Goudet . 2005 . Detecting the number of clusters of individuals using the software STRUCTURE: A simulation study. Molecular Ecology 14 : 2611 – 2620 .
Eyog Matig , O. , O. G. Gaou é , and B. Dossou . 2002 . R é seau « Esp è ces ligneuses alimentaires » . Compte rendu de la premi è re r é union du r é seau tenue 11 – 13 d é cembre 2000 au CNSF Ouagadougou, Burkina Faso. Institut International des Ressources Phytog é n é tiques , Rome, Italy.
Excoffier , L. , P. E. Smouse , and J. M. Quattro . 1992 . Analysis of molecular variance inferred from metric distances among DNA hap-lotypes: Application to human mitochondrial DNA restriction data. Genetics 131 : 479 – 491 .
FAO . 1981 . An eco-climatic classifi cation of inter-tropical Africa. Plant production and protection paper 31. FAO, Rome, Italy.
Fenster , C. B. 1991 . Gene fl ow in Chamaecrista fasciculata (Leguminosae). I. Gene dispersal. Evolution 45 : 410 – 422 .
Gapare , W. J. , S. N. Aitken , and C. E. Ritland . 2005 . Genetic diver-sity of core and peripheral Sitka spruce ( Picea sitchensis (Bong.) Carr.) populations: Implications for gene conservation of widespread species. Biological Conservation 123 : 113 – 123 .
Hamrick , J. L. , M. J. O. W. Godt , and S. L. Sherman-Broyles . 1992 . Factors infl uencing levels of genetic diversity in woody plant species. New Forests 6 : 95 – 124 .
Hamrick , J. L. , and M. D. Loveless . 1986 . The infl uence of seed dispersal mechanisms on the genetic structure of plant populations. In A. Estrada and T. H. Fleming [eds.], Frugivores and seed dispersal, 211 – 223, W. Junk, The Hague, Netherlands.
Hardy , O. J. 2003 . Estimation of pair wise relatedness between individuals and characterization of isolation-by-distance processes using dominant genetic markers. Molecular Ecology 12 : 1577 – 1588 .
Hardy , O. J. , L. Maggia , E. Bandou , P. Breyne , H. Caron , M. Chevallier , A. Doligez , C. Dutech , A. Kremer , C. Latouche-Halle , V. Troispoux , V. Veron , and B. Degen . 2006 . Fine-scale genetic structure and gene dispersal inferences in 10 neotropical tree species. Molecular Ecology 15 : 559 – 571 .
Hardy , O. J. , and X. Vekemans . 1999 . Isolation by distance in a con-tinuous population: Reconciliation between spatial autocorrelation analysis and population genetics models. Heredity 83 : 145 – 154 .
Hardy , O. J. , and X. Vekemans . 2002 . SPAGEDI: A versatile computer program to analyse spatial genetic structure at the individual or popu-lation levels. Molecular Ecology Notes 2 : 618 – 620 .
Harris , B. J. , and H. G. Baker . 1959 . Pollination of fl owers by bats in Ghana. Nigerian Field 24 : 151 – 159 .
Heywood , J. S. 1991 . Spatial analysis of genetic variation in plant popu-lations. Annual Review of Ecology and Systematics 22 : 335 – 355 .
Jenczewski , E. , J. M. Prosperi , and J. Ronfort . 1999 . Differentiation between natural and cultivated populations of Medicago sativa (Leguminosae) from Spain: Analysis with random amplifi ed polymor-
GALLEY PROOF

8 American Journal of Botany [Vol. 96
Wright , S. 1951 . The genetic structure of populations. Annals of Eugenics 15 : 323 – 354 .
Wright , S. 1978 . Evolution and the genetics of populations, vol. 4, Variability within and among populations. University of Chicago Press, Chicago, Illinois, USA.
Young , A. C. , and H. G. Merriam . 1994 . Effect of forest fragmenta-tion on the spatial genetic structure of Acer saccharum Marsh. (sugar maple) populations. Heredity 72 : 201 – 208 .
Zhivotovsky , L. A. 1999 . Estimating population structure in diploids with multilocus dominant markers. Molecular Ecology 8 : 907 – 913 .
GALLEY PROOF
Related Documents