Spatial distribution and microscale characteristics of the urban heat island in Tel-Aviv, Israel Hadas Saaroni * , Eyal Ben-Dor, Arieh Bitan, Oded Potchter Department of Geography and Human Environment, Tel-Aviv University, P.O. Box 39040, 69978 Ramat Aviv Tel Aviv, Israel Received 9 December 1998; received in revised form 6 September 1999; accepted 22 October 1999 Abstract A significant urban heat island (UHI) was identified in Tel-Aviv on a stablewinter day. The UHI detection was performed using air temperatures at both the roof and the street levels (using fixed-station and car-traverse measurements) and at the surface level (using an airborne thermal video radiometer [TVR]). Whereas the complex microscale characteristics of the UHI studied by the TVR at the surface level showed variations of up to 108C, at the street level, air temperature variations of 3–58C were identified between the city center and the surrounding areas. It was found that during the nighttime, the warm Mediterranean Sea has a moderating effect on the roof-level temperatures, whereas, at the street level, the urban heat island is more pronounced. The combined method of monitoring the UHI from different levels and on different scales for the first time enabled a spatial assessment of the city’s UHI and its diverse thermal coverage characteristics. The thermal differences of neighborhoods, urban activity and urban components were compared. It was demonstrated that the city cover plays an important role in the thermal activity of Tel-Aviv. A similar UHI spatial pattern was obtained using isotherm maps, generated from the air temperatures at street level, and thermal images, generated by the TVR at the surface level. It was concluded that there are differences in the magnitude of the UHI at different levels of the canopy layer and at different times, but the UHI pattern has similar trends. # 2000 Elsevier Science B.V. All rights reserved. Keywords: Urban heat island; Thermal video radiometer (TVR); Coastal city 1. Introduction 1.1. General background The urban heat island (UHI) is one of the most studied phenomena of a city’s climate. Almost uni- versally the modified thermal climate in cities is warmer and leads to a set of distinct micro- and mesoscale climates (Roth et al., 1989). Comprehen- sive reviews of typical UHIs have been provided by many UHI workers (Landsberg, 1981; Atkinson, 1985; Oke, 1987). Oke (1995) described the different types of heat islands, identifying the differences between surface and air distribution of UHIs as well as the differences between the urban canopy and boundary layers. The magnitude of the UHI has been studied mostly in terms of the temperature differences between rural and urban stations. Its spatial distribu- Landscape and Urban Planning 48 (2000) 1–18 * Corresponding author. Tel.: 972-3-6406470; fax: 972-3-6406243. E-mail address: [email protected] (H. Saaroni) 0169-2046/00/$20.00 # 2000 Elsevier Science B.V. All rights reserved. PII:S0169-2046(99)00075-4

Welcome message from author
This document is posted to help you gain knowledge. Please leave a comment to let me know what you think about it! Share it to your friends and learn new things together.
Transcript
Spatial distribution and microscale characteristics
of the urban heat island in Tel-Aviv, Israel
Hadas Saaroni*, Eyal Ben-Dor, Arieh Bitan, Oded Potchter
Department of Geography and Human Environment, Tel-Aviv University, P.O. Box 39040, 69978 Ramat Aviv Tel Aviv, Israel
Received 9 December 1998; received in revised form 6 September 1999; accepted 22 October 1999
Abstract
A signi®cant urban heat island (UHI) was identi®ed in Tel-Aviv on a stable winter day. The UHI detection was performed
using air temperatures at both the roof and the street levels (using ®xed-station and car-traverse measurements) and at the
surface level (using an airborne thermal video radiometer [TVR]). Whereas the complex microscale characteristics of the UHI
studied by the TVR at the surface level showed variations of up to 108C, at the street level, air temperature variations of 3±58Cwere identi®ed between the city center and the surrounding areas. It was found that during the nighttime, the warm
Mediterranean Sea has a moderating effect on the roof-level temperatures, whereas, at the street level, the urban heat island is
more pronounced. The combined method of monitoring the UHI from different levels and on different scales for the ®rst time
enabled a spatial assessment of the city's UHI and its diverse thermal coverage characteristics. The thermal differences of
neighborhoods, urban activity and urban components were compared. It was demonstrated that the city cover plays an
important role in the thermal activity of Tel-Aviv. A similar UHI spatial pattern was obtained using isotherm maps, generated
from the air temperatures at street level, and thermal images, generated by the TVR at the surface level. It was concluded that
there are differences in the magnitude of the UHI at different levels of the canopy layer and at different times, but the UHI
pattern has similar trends. # 2000 Elsevier Science B.V. All rights reserved.
Keywords: Urban heat island; Thermal video radiometer (TVR); Coastal city
1. Introduction
1.1. General background
The urban heat island (UHI) is one of the most
studied phenomena of a city's climate. Almost uni-
versally the modi®ed thermal climate in cities is
warmer and leads to a set of distinct micro- and
mesoscale climates (Roth et al., 1989). Comprehen-
sive reviews of typical UHIs have been provided by
many UHI workers (Landsberg, 1981; Atkinson,
1985; Oke, 1987). Oke (1995) described the different
types of heat islands, identifying the differences
between surface and air distribution of UHIs as well
as the differences between the urban canopy and
boundary layers. The magnitude of the UHI has been
studied mostly in terms of the temperature differences
between rural and urban stations. Its spatial distribu-
Landscape and Urban Planning 48 (2000) 1±18
* Corresponding author. Tel.: �972-3-6406470;
fax: �972-3-6406243.
E-mail address: [email protected] (H. Saaroni)
0169-2046/00/$20.00 # 2000 Elsevier Science B.V. All rights reserved.
PII: S 0 1 6 9 - 2 0 4 6 ( 9 9 ) 0 0 0 7 5 - 4
tion pattern, although showing a large thermal varia-
bility at the canopy layer, has been interpolated into
isotherm maps showing a high correlation between
land use and temperature distribution. For example,
park areas appear to be relatively cold and maximum
temperatures appear at the city center (e.g. Oke, 1987;
Moreno-Garcia, 1994). Several studies have pointed
out a phenomenon called `negative UHI' or `urban
heat sink', which develops in cities, especially in city
centers, during the daytime. A `negative UHI' has
been recognized both in surface temperature measure-
ments (e.g. Wanner and Hertig, 1984; Carnahan and
Larson, 1990) and in air temperature measurements
(e.g. Myrup, 1969). The canyon geometry, which
characterizes cities, and especially city centers, can
be a major contributor to the negative UHI during the
daytime. This is because the insolation absorption
decreases at the street level with the relatively high
heat capacity of the buildings. The in¯uence of the
urban geometry on surface and air temperatures has
been widely studied by Oke (1981), Barring et al.
(1985) and Eliasson, 1990/1991; 1996).
Pease et al. (1976) described the complex thermal
behavior of an urban area, referring both to air and
surface levels. Whereas air temperature measurements
provide spot data of a selected point or route, thermal
remote sensing methods give a spatially continuous
view of the surface UHI. Although the genesis and
temporal dynamics of surface and air UHIs have
dissimilarities, they are, nevertheless, related (Oke,
1995; Voogt and Oke, 1997), and several studies have
shown good correlation between them. Stoll and
Brazel (1992) obtained good correlation between sur-
face radiometric temperature (measured from a dis-
tance of 3 m by a thermal radiometer) and air
temperature (measured at a level of 1.5 m) over Phoe-
nix, Arizona. Yang et al. (1994) obtained positive
agreement between the surface radiometric tempera-
ture (acquired from an airborne sensor) and air tem-
perature over Wuhan, China. Thermal remote sensing
from satellites is a common useful technique for
studying the surface UHI and its spatial complexity
(Carlson et al., 1977; Balling and Brazel, 1988; Roth
et al., 1989; Reutter et al., 1994). However, such data
can be de®cient in spatial and spectral resolution and
can be attenuated by a thick atmosphere. On the other
hand, there are some excellent airborne IR scanners
with relatively high spectral and spatial resolution
capabilities that can be used for UHI studies (e.g.
Eliasson, 1992; Quattrochi and Ridd, 1994; Yang et al.,
1994). The ability to cover large areas simultaneously
on a repeated basis and the ability to measure almost
every element on the ground are additional signi®cant
advantages of this method over conventional climatic
methods.
Accordingly, because the UHI is a re¯ection of the
totality of microclimatic changes brought about by
man-made alterations to the urban surface (Landsberg,
1981), it is important to combine both air and surface
measurements in order to understand the complexity
of the UHI and its inner differences.
This study investigates the UHI of Tel-Aviv City,
Israel, as expressed at different levels of the canopy
layer (roof, street and surface levels) and examines the
relationships among them. This investigation used
both conventional air and remote sensing measure-
ments. The spatial distribution, magnitude and char-
acteristics of the UHI are of great interest to the
climatic and environmental planning missions of cities
in general and of Tel-Aviv in particular. The construc-
tion of high-rise buildings and the growth of the
metropolitan area, re¯ected by a higher traf®c load
and higher air pollution levels, leads to a growth in
energy consumption, heat stress (especially during the
warm season) and other environmental problems
(Bitan et al., 1992; EPU-NTUA and ICTAF, 1994;
Rosenfeld et al., 1995).
1.2. Study area
The city of Tel-Aviv is located on the seashore at the
eastern edge of the Mediterranean Sea (348470E328060N) and has a subtropical dry-summer (Medi-
terranean) climate (Fig. 1). The city has an area of ca.
50 km2 and extends along the sea coast for ca. 14 km
with a width of 3±6 km. Tel-Aviv is the commercial,
®nancial and cultural center of Israel with a population
of 350 000 people in 1996 (Statistical Abstract of
Israel, 1998). It is the center of the largest metropolitan
area in Israel (Fig. 2), with a combined population of
1 950 000 (together with Tel-Aviv itself). The research
area is de®ned as the municipality of Tel-Aviv,
which is considered to be the heart of the metropolitan
area. Most of the buildings in Tel-Aviv are 3±4 ¯oors
(10±15 m) high. Several high-rise buildings up to
30 ¯oors (up to 100 m), mostly of®ces and hotels,
2 H. Saaroni et al. / Landscape and Urban Planning 48 (2000) 1±18
are scattered throughout the city. The dominant
anthropogenic heat sources in the city are transporta-
tion (57%) and use within buildings (34%). Industry
energy consumption is small, 9% (EPU-NTUA and
ICTAF, 1994).
1.3. Study time and weather conditions
Generally, the UHI has the greatest magnitude at
nighttime and under stable weather conditions Ð calm
air and cloudless skies Ð de®ned by Oke (1982) as
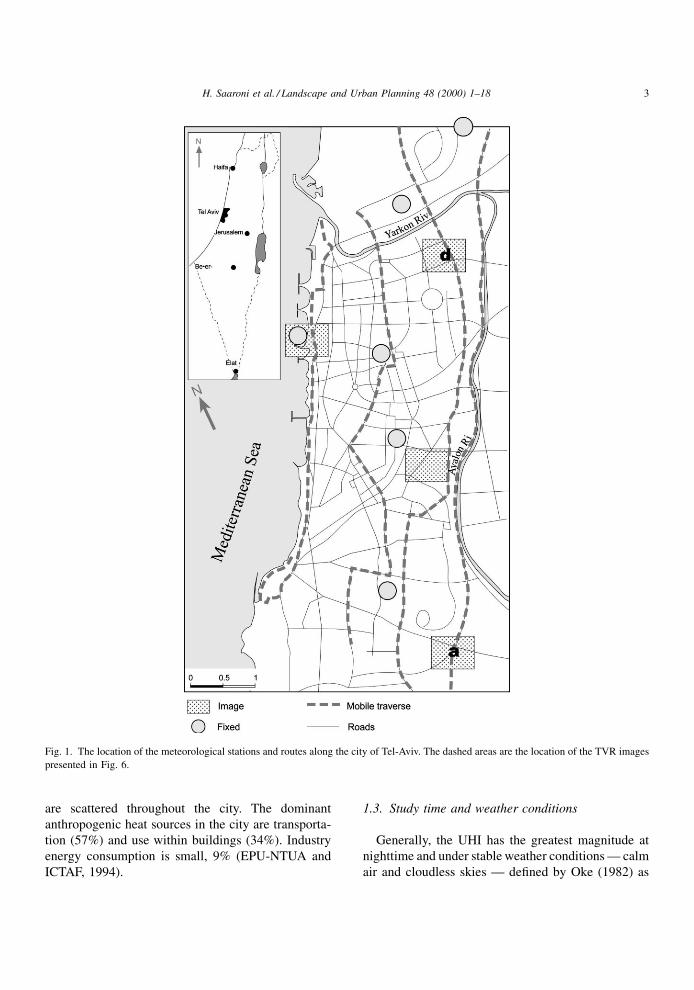
Fig. 1. The location of the meteorological stations and routes along the city of Tel-Aviv. The dashed areas are the location of the TVR images
presented in Fig. 6.
H. Saaroni et al. / Landscape and Urban Planning 48 (2000) 1±18 3
`ideal' conditions for the development of UHI (Oke,
1981; Landsberg, 1981; Oke, 1987; Eliasson, 1996).
These conditions were selected for this study (27 and
28 February 1995).
The synoptic conditions were as follows: the lower
levels were in¯uenced by an anticyclone over the
eastern Mediterranean, with light northeasterly winds.
An upper barometric ridge caused air subsidence and
thus high stability. During the day there was a light sea
breeze (3±6 m sÿ1) at Tel-Aviv's seashore; during the
®rst half of the night until midnight, light easterly
winds of 0±2 m sÿ1 blew, and calm conditions devel-
oped from midnight until morning. The radiosonde
data for 27 February 1995, 01:00 hours local time
from Bet Dagan (situated on the coastal plain of Israel,
7 km east of Tel-Aviv; see Fig. 2 for the exact location)
indicated the stability by a strong ground inversion (up
to 308 m) and a ®rst upper inversion (from 354 to
578 m).
Generally, during the rainy season (October±May)
ca. 50% of the days are under relatively stable con-
ditions (Ronberg, 1984). However, easterly winds,
which diminish the UHI effect, can be relatively
strong under these stable conditions (Saaroni et al.,
1996; Saaroni et al., 1998). At nighttime along the
coastal strip, (October±May) calm conditions occur
17±40% of the time (Bitan and Rubin, 1994). During
summer the persistent Persian Gulf trough causes
Ethesian westerly winds combined with sea breeze
of an average of 3±6 m sÿ1 during the daytime and a
relatively weak land breeze (below 4 m sÿ1) and with
a frequency of calm conditions 37% of the time during
the nighttime (Bitan and Rubin, 1994). Under an
`enhanced' Persian Gulf trough the winds are stronger,
and the inversion layer is higher than under a `weak'
trough (Alpert et al., 1992; Bitan and Saaroni, 1992).
These conditions are likely to have a dominant impact
on the intensity of the UHI.
2. Methodology
Temperature measurements were acquired using
various monitoring systems, airborne remote sensing
and conventional ground meteorological measure-
ments at ®xed locations and mobile traverses. Air
temperature was measured at the street level (2 m
above the ground), using car traverses with thermo-
couples in ventilated screens, and at the roof level (2 m
above the roof), using Stevenson screens. Radiant
surface temperature was measured using a thermal
video radiometer (TVR) mounted onboard a helicop-
ter at an altitude of ca. 2000 m.
For spatial identi®cation of the city, a 1:5000 map
was digitized, using an Auto Cad package (Fig. 1).
This map was further used for analyzing both the air
and surface measurements.
2.1. Air temperature measurements
Air temperature measurements were taken at both
the roof and the street levels as follows:
(a) Roof level: diurnal measurements of air
temperature were taken at fixed (Stevenson)
weather screens at six selected sites within the
city (Fig. 4a; Fig. 1 shows their location). The
roofs were approximately the same height, ca.
12 m. We used thermographs and minimum and
maximum thermometers in the screens. All the
instruments were calibrated, checked and com-
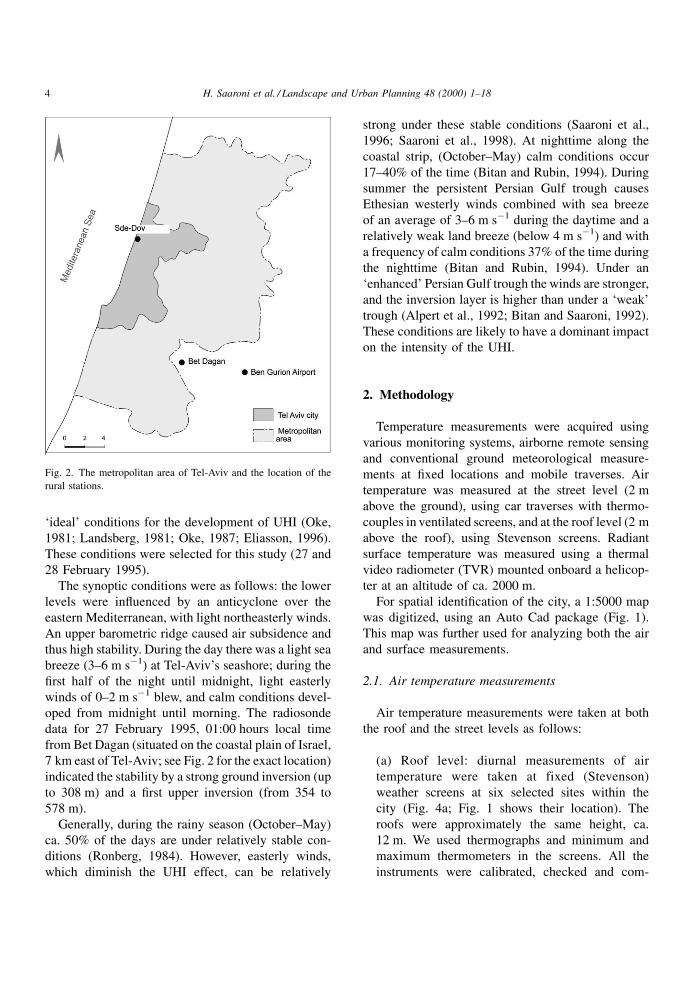
Fig. 2. The metropolitan area of Tel-Aviv and the location of the
rural stations.
4 H. Saaroni et al. / Landscape and Urban Planning 48 (2000) 1±18
pared before and after the experiment under the
same conditions. The stations represent the city's
diversity: The seashore (1), city center (2 and 3),
southern margins (4) and northern margins (5 and
6). Note that the stations representing the city's
margins (4±6) are not purely rural areas, but are
less dense than the city center (2 and 3). Air
temperature was also measured at three rural
stations (Fig. 4b): Bet Dagan (situated 7 km east
of Tel-Aviv), Ben Gurion International Airport
(situated 10 km east of Tel-Aviv) and Sde Dov
Airport (situated in the northern suburbs of Tel-
Aviv, 400 m from the seashore in an open area).
Fig. 2 shows their exact locations. The measure-
ments at these three stations were taken 2 m above
the ground (not from roof level) in Stevenson
screens.
(b) Street level: the data were taken along four
main routes crossing the city from north to south
by four mobile traverses (Fig. 1). The traverse
measurements were conducted at four different
times of the day, 14:00, 21:00, 01:00 and
03:00 hours local time. Each car was equipped
with thermocouples (made of copper and con-
stantan with a time response of <1 s), which were
calibrated, checked and compared before and after
the experiment under the same conditions. Ther-
mocouple sensors were mounted on each car at a
height of 2 m above the ground in ventilated
screens, and the vehicles maintained a constant
speed of 20±30 km/h. Temperature was measured
every second, averaged every 20 s and stored in
data loggers for further analysis. Data that were
measured when the traverses had to stop (e.g. at
intersections) were omitted from the database.
Each car traverse took �20 min, therefore, no
corrections in temperature had to be inserted
because of time. The four main routes are
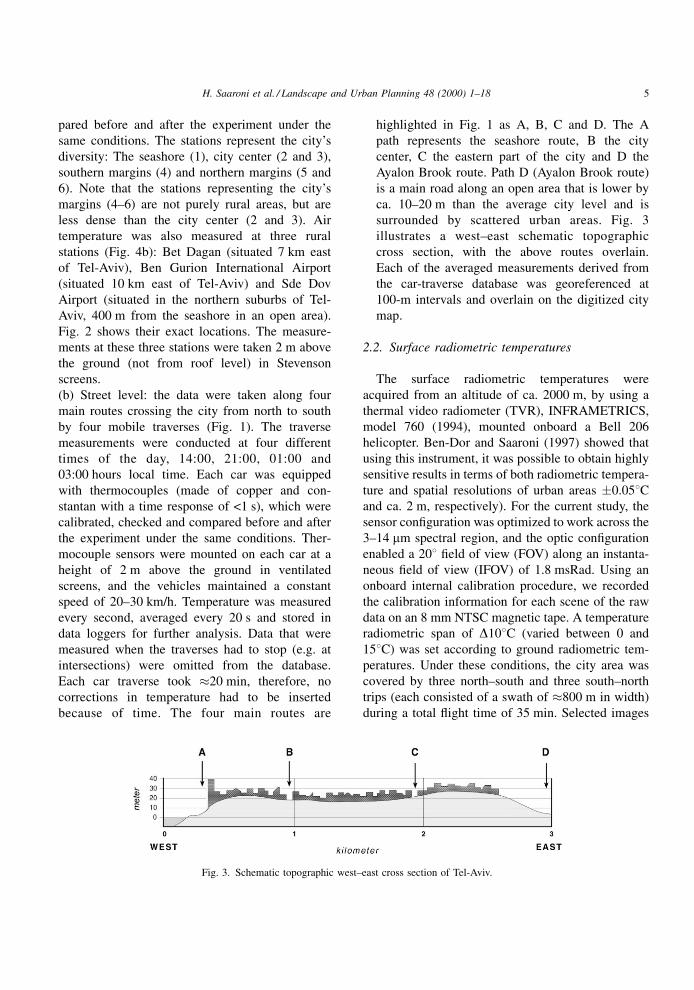
highlighted in Fig. 1 as A, B, C and D. The A
path represents the seashore route, B the city
center, C the eastern part of the city and D the
Ayalon Brook route. Path D (Ayalon Brook route)
is a main road along an open area that is lower by
ca. 10±20 m than the average city level and is
surrounded by scattered urban areas. Fig. 3
illustrates a west±east schematic topographic
cross section, with the above routes overlain.
Each of the averaged measurements derived from
the car-traverse database was georeferenced at
100-m intervals and overlain on the digitized city
map.
2.2. Surface radiometric temperatures
The surface radiometric temperatures were
acquired from an altitude of ca. 2000 m, by using a
thermal video radiometer (TVR), INFRAMETRICS,
model 760 (1994), mounted onboard a Bell 206
helicopter. Ben-Dor and Saaroni (1997) showed that
using this instrument, it was possible to obtain highly
sensitive results in terms of both radiometric tempera-
ture and spatial resolutions of urban areas �0.058Cand ca. 2 m, respectively). For the current study, the
sensor con®guration was optimized to work across the
3±14 mm spectral region, and the optic con®guration
enabled a 208 ®eld of view (FOV) along an instanta-
neous ®eld of view (IFOV) of 1.8 msRad. Using an
onboard internal calibration procedure, we recorded
the calibration information for each scene of the raw
data on an 8 mm NTSC magnetic tape. A temperature
radiometric span of D108C (varied between 0 and
158C) was set according to ground radiometric tem-
peratures. Under these conditions, the city area was
covered by three north±south and three south±north
trips (each consisted of a swath of �800 m in width)
during a total ¯ight time of 35 min. Selected images
Fig. 3. Schematic topographic west±east cross section of Tel-Aviv.
H. Saaroni et al. / Landscape and Urban Planning 48 (2000) 1±18 5
were saved as TIFF ®les and further processed with
both PCI and ENVI software's (PCI, 1994; ENVI,
1994).
The ¯ight took place at 03:00 hours local time,
when traf®c load was minimal and the weather con-
ditions were calm and stable. We selected this time
even though Roth et al. (1989) pointed out that at this
time and under such conditions it is the air (and not the
surface) heat island that is more pronounced. This is
because during the nighttime the shadow effect is
negligible (Lillesand and Kiefer, 1994) and detection
of the surface thermal characteristics of the entire city
is more reliable. We also wanted to compare the results
with the air UHI, which is more pronounced at night-
time.
3. Results
3.1. Air temperature distribution at roof level
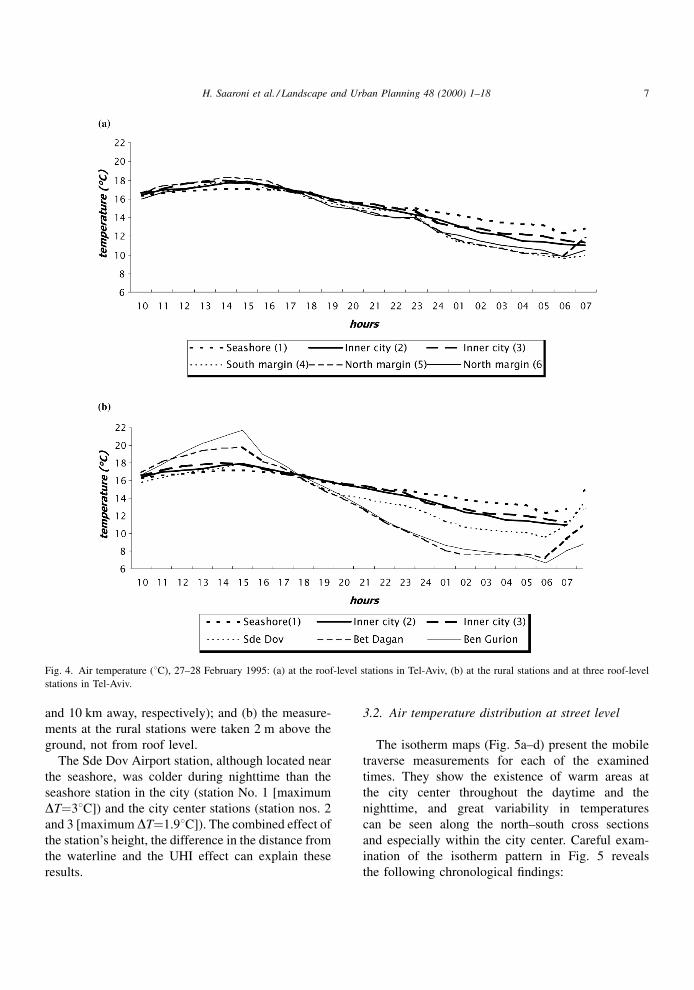
The diurnal air temperature measurements taken
from the six roof-level stations are given in Fig. 4a.
Fig. 4b presents the diurnal air temperature measure-
ments taken at the three rural stations (Bet Dagan, Ben
Gurion International Airport and Sde Dov Airport)
compared with the seashore and the city center sta-
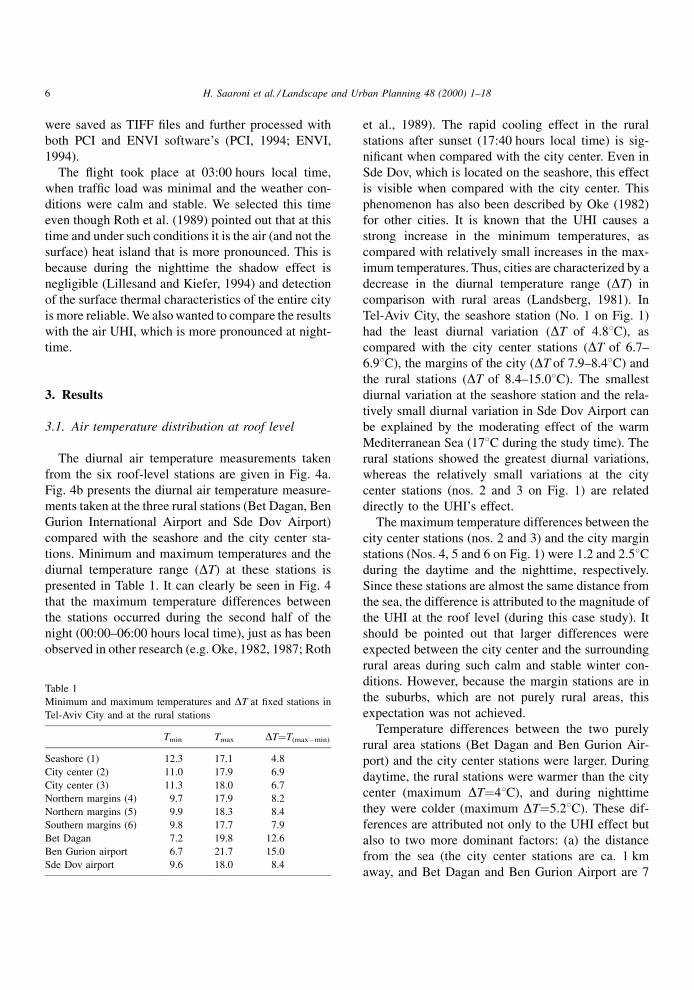
tions. Minimum and maximum temperatures and the
diurnal temperature range (DT) at these stations is
presented in Table 1. It can clearly be seen in Fig. 4
that the maximum temperature differences between
the stations occurred during the second half of the
night (00:00±06:00 hours local time), just as has been
observed in other research (e.g. Oke, 1982, 1987; Roth
et al., 1989). The rapid cooling effect in the rural
stations after sunset (17:40 hours local time) is sig-
ni®cant when compared with the city center. Even in
Sde Dov, which is located on the seashore, this effect
is visible when compared with the city center. This
phenomenon has also been described by Oke (1982)
for other cities. It is known that the UHI causes a
strong increase in the minimum temperatures, as
compared with relatively small increases in the max-
imum temperatures. Thus, cities are characterized by a
decrease in the diurnal temperature range (DT) in
comparison with rural areas (Landsberg, 1981). In
Tel-Aviv City, the seashore station (No. 1 on Fig. 1)
had the least diurnal variation (DT of 4.88C), as
compared with the city center stations (DT of 6.7±
6.98C), the margins of the city (DT of 7.9±8.48C) and
the rural stations (DT of 8.4±15.08C). The smallest
diurnal variation at the seashore station and the rela-
tively small diurnal variation in Sde Dov Airport can
be explained by the moderating effect of the warm
Mediterranean Sea (178C during the study time). The
rural stations showed the greatest diurnal variations,
whereas the relatively small variations at the city
center stations (nos. 2 and 3 on Fig. 1) are related
directly to the UHI's effect.
The maximum temperature differences between the
city center stations (nos. 2 and 3) and the city margin
stations (Nos. 4, 5 and 6 on Fig. 1) were 1.2 and 2.58Cduring the daytime and the nighttime, respectively.
Since these stations are almost the same distance from
the sea, the difference is attributed to the magnitude of
the UHI at the roof level (during this case study). It
should be pointed out that larger differences were
expected between the city center and the surrounding
rural areas during such calm and stable winter con-
ditions. However, because the margin stations are in
the suburbs, which are not purely rural areas, this
expectation was not achieved.
Temperature differences between the two purely
rural area stations (Bet Dagan and Ben Gurion Air-
port) and the city center stations were larger. During
daytime, the rural stations were warmer than the city
center (maximum DT�48C), and during nighttime
they were colder (maximum DT�5.28C). These dif-
ferences are attributed not only to the UHI effect but
also to two more dominant factors: (a) the distance
from the sea (the city center stations are ca. 1 km
away, and Bet Dagan and Ben Gurion Airport are 7
Table 1
Minimum and maximum temperatures and DT at ®xed stations in
Tel-Aviv City and at the rural stations
Tmin Tmax DT�T(maxÿmin)
Seashore (1) 12.3 17.1 4.8
City center (2) 11.0 17.9 6.9
City center (3) 11.3 18.0 6.7
Northern margins (4) 9.7 17.9 8.2
Northern margins (5) 9.9 18.3 8.4
Southern margins (6) 9.8 17.7 7.9
Bet Dagan 7.2 19.8 12.6
Ben Gurion airport 6.7 21.7 15.0
Sde Dov airport 9.6 18.0 8.4
6 H. Saaroni et al. / Landscape and Urban Planning 48 (2000) 1±18
and 10 km away, respectively); and (b) the measure-
ments at the rural stations were taken 2 m above the
ground, not from roof level.
The Sde Dov Airport station, although located near
the seashore, was colder during nighttime than the
seashore station in the city (station No. 1 [maximum
DT�38C]) and the city center stations (station nos. 2
and 3 [maximum DT�1.98C]). The combined effect of
the station's height, the difference in the distance from
the waterline and the UHI effect can explain these
results.
3.2. Air temperature distribution at street level
The isotherm maps (Fig. 5a±d) present the mobile
traverse measurements for each of the examined
times. They show the existence of warm areas at
the city center throughout the daytime and the
nighttime, and great variability in temperatures
can be seen along the north±south cross sections
and especially within the city center. Careful exam-
ination of the isotherm pattern in Fig. 5 reveals
the following chronological ®ndings:
Fig. 4. Air temperature (8C), 27±28 February 1995: (a) at the roof-level stations in Tel-Aviv, (b) at the rural stations and at three roof-level
stations in Tel-Aviv.
H. Saaroni et al. / Landscape and Urban Planning 48 (2000) 1±18 7
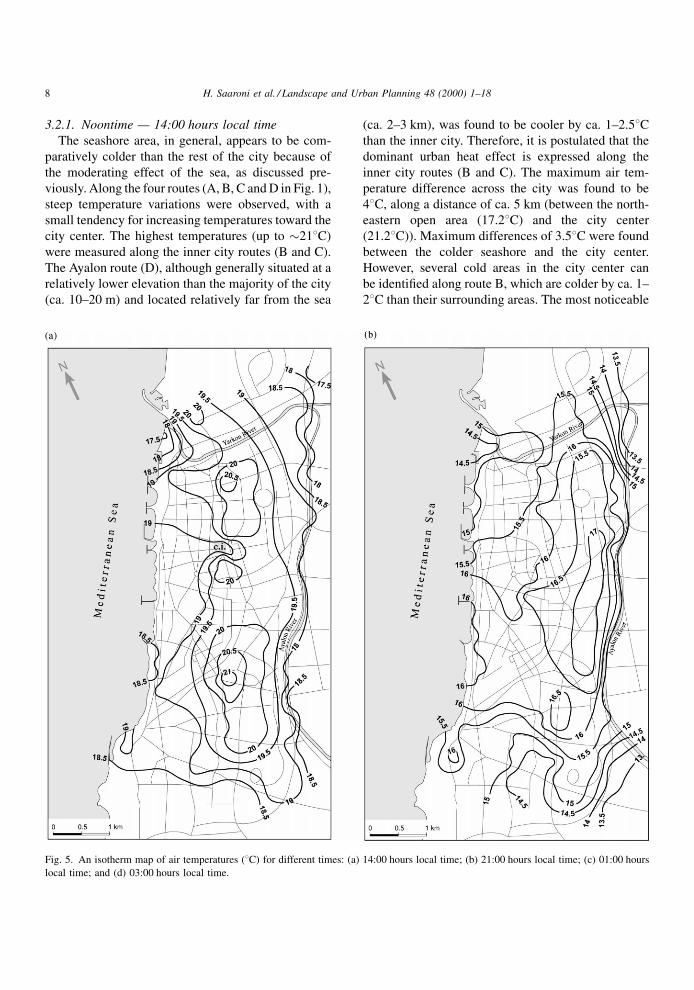
3.2.1. Noontime Ð 14:00 hours local time
The seashore area, in general, appears to be com-
paratively colder than the rest of the city because of
the moderating effect of the sea, as discussed pre-
viously. Along the four routes (A, B, C and D in Fig. 1),
steep temperature variations were observed, with a
small tendency for increasing temperatures toward the
city center. The highest temperatures (up to �218C)
were measured along the inner city routes (B and C).
The Ayalon route (D), although generally situated at a
relatively lower elevation than the majority of the city
(ca. 10±20 m) and located relatively far from the sea
(ca. 2±3 km), was found to be cooler by ca. 1±2.58Cthan the inner city. Therefore, it is postulated that the
dominant urban heat effect is expressed along the
inner city routes (B and C). The maximum air tem-
perature difference across the city was found to be
48C, along a distance of ca. 5 km (between the north-
eastern open area (17.28C) and the city center
(21.28C)). Maximum differences of 3.58C were found
between the colder seashore and the city center.
However, several cold areas in the city center can
be identi®ed along route B, which are colder by ca. 1±
28C than their surrounding areas. The most noticeable
Fig. 5. An isotherm map of air temperatures (8C) for different times: (a) 14:00 hours local time; (b) 21:00 hours local time; (c) 01:00 hours
local time; and (d) 03:00 hours local time.
8 H. Saaroni et al. / Landscape and Urban Planning 48 (2000) 1±18
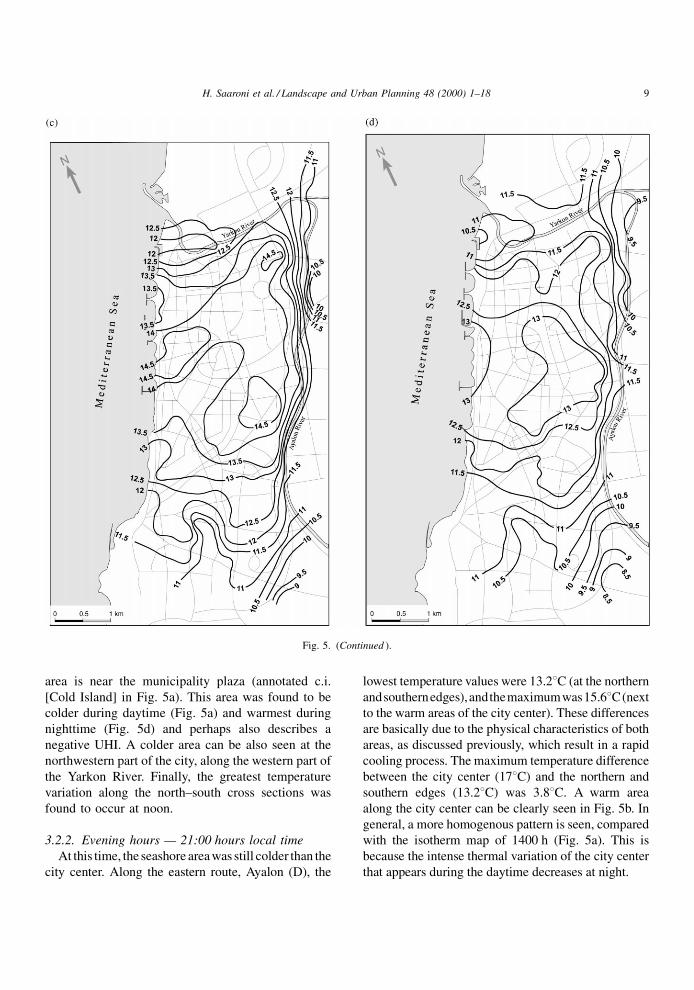
area is near the municipality plaza (annotated c.i.
[Cold Island] in Fig. 5a). This area was found to be
colder during daytime (Fig. 5a) and warmest during
nighttime (Fig. 5d) and perhaps also describes a
negative UHI. A colder area can be also seen at the
northwestern part of the city, along the western part of
the Yarkon River. Finally, the greatest temperature
variation along the north±south cross sections was
found to occur at noon.
3.2.2. Evening hours Ð 21:00 hours local time
At this time, the seashore area was still colder than the
city center. Along the eastern route, Ayalon (D), the
lowest temperature values were 13.28C (at the northern
andsouthernedges),andthemaximumwas15.68C(next
to the warm areas of the city center). These differences
are basically due to the physical characteristics of both
areas, as discussed previously, which result in a rapid
cooling process. The maximum temperature difference
between the city center (178C) and the northern and
southern edges (13.28C) was 3.88C. A warm area
along the city center can be clearly seen in Fig. 5b. In
general, a more homogenous pattern is seen, compared
with the isotherm map of 1400 h (Fig. 5a). This is
because the intense thermal variation of the city center
that appears during the daytime decreases at night.
Fig. 5. (Continued ).
H. Saaroni et al. / Landscape and Urban Planning 48 (2000) 1±18 9
3.2.3. Midnight Ð 01:00 hours local time
At this hour, the seashore area was observed to be as
warm as the city center. The eastern part of the city,
along the Ayalon route (D), was the coldest area. At
this time of the day, and along the four routes, there
was a more signi®cant temperature increase toward
the city center. A steep temperature decline was
observed at both the north and the south edges of
the city, which consequently became relatively cold.
The maximum air temperature difference at this time
was 5.68C, as measured between the southern open
area (98C) and the warm city center areas (14.68C).
3.2.4. Late nighttime Ð 03:00 hours local time
Results measured at 0300 were similar to those
measured at 0100 h. The overall temperature values
were colder than at 0100 by ca. 1±28C because of the
longer night cooling effect. Similar temperatures were
observed along the seashore and the inner city routes.
The maximum air temperature difference was 58C
between the southern open area (8.38C) and the city
center (13.38C). It is notable that a difference of 2.28Cwas found between Ayalon (D) and the east city route
(C), which are 400 m apart.
3.3. Surface radiometric temperatures
Using the TVR, we were able to study the thermal
behavior of each urban component and to identify the
various heat sources throughout the city. The high
resolution of the images enables a comparison of
surface and air temperatures based on precise geor-
eference points.
Fig. 6a±d shows four selected images throughout
the city of Tel-Aviv. Their exact locations are shown
on the city map on Fig. 1. The images show the
thermal behavior of the selected areas on a microscale
level and the thermal characteristics of selected neigh-
borhoods and land uses inside these images. The areas
selected are:
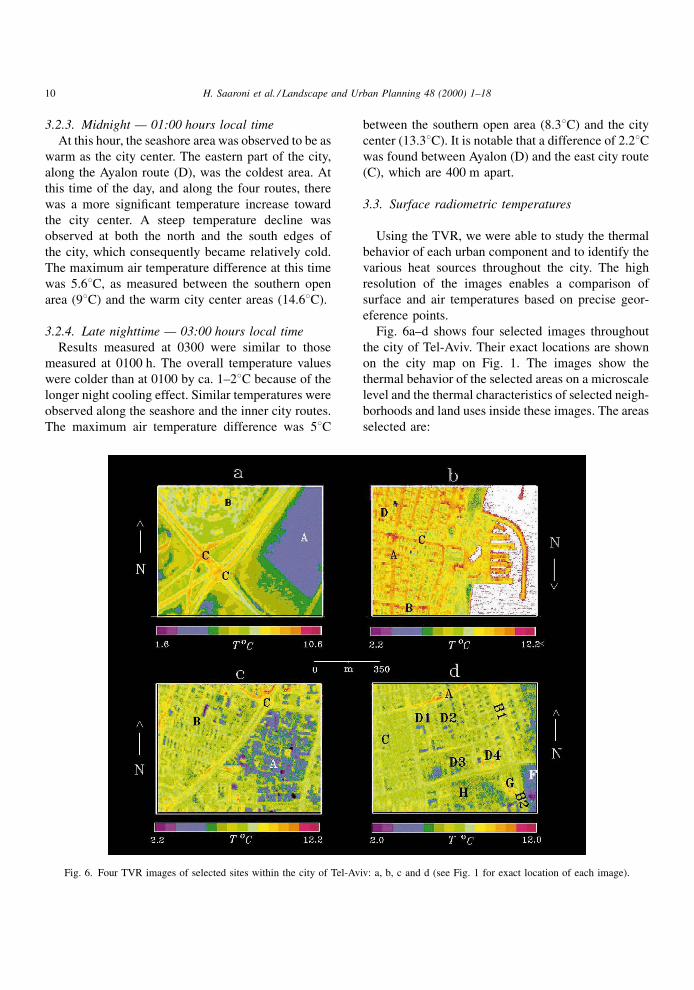
Fig. 6. Four TVR images of selected sites within the city of Tel-Aviv: a, b, c and d (see Fig. 1 for exact location of each image).
10 H. Saaroni et al. / Landscape and Urban Planning 48 (2000) 1±18
(a) The southeastern edge of Tel-Aviv, expressing
the change from an open rural area to a residential
area (a suburb of Tel-Aviv City), and one of the
central junctions at the entrance of Tel-Aviv
(Fig. 6a).
(b) The seashore area west of the city center,
including the city's marina (Fig. 6b).
(c) Two close neighborhoods at the center of the
city (Fig. 6c).
(d) A residential neighborhood at the northeastern
part of the city (Fig. 6d).
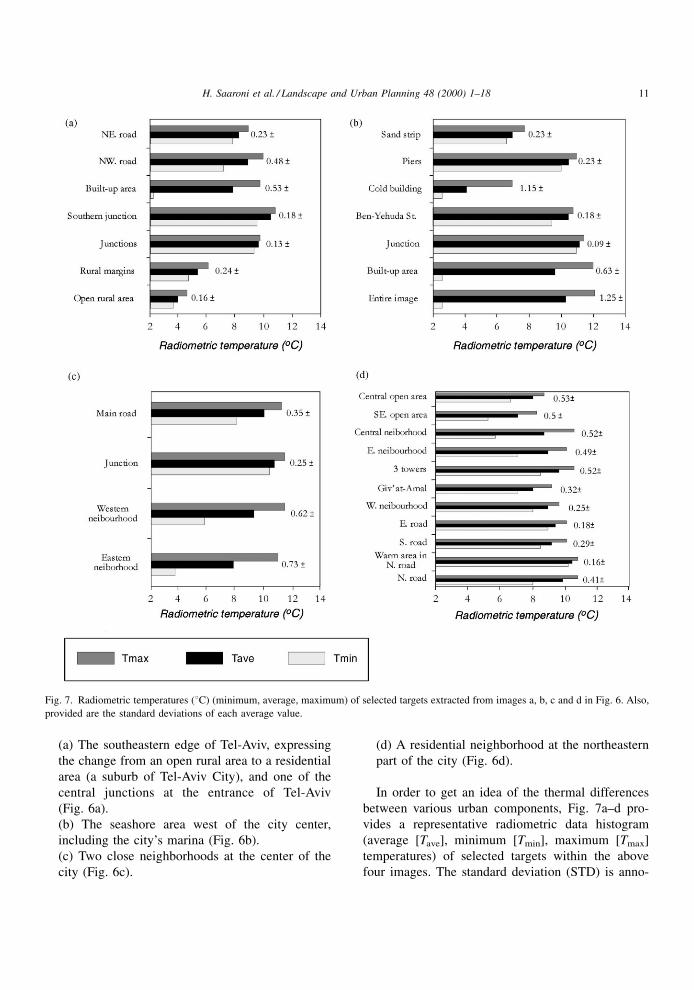
In order to get an idea of the thermal differences
between various urban components, Fig. 7a±d pro-
vides a representative radiometric data histogram
(average [Tave], minimum [Tmin], maximum [Tmax]
temperatures) of selected targets within the above
four images. The standard deviation (STD) is anno-
Fig. 7. Radiometric temperatures (8C) (minimum, average, maximum) of selected targets extracted from images a, b, c and d in Fig. 6. Also,
provided are the standard deviations of each average value.
H. Saaroni et al. / Landscape and Urban Planning 48 (2000) 1±18 11

tated on the Tave column. The targets consist of
different numbers of pixels (more than 24 pixels
per target), based on their spatial size. The images
(Fig. 6a±d) and the radiometric temperature results
(Fig. 7a±d) clearly indicate the occurrence of thermal
changes, resulting from cover surface variety, land use
and anthropogenic activity. Below is a systematic
discussion on each of the images.
3.3.1. Image a Ð the southeastern edge of Tel-Aviv
(Fig. 6a)
The image illustrates the thermal changes between
the rural open (Tavg�4.08C) and the built-up
(Tavg�7.88C) areas. There is a noticeable change
(DT of 3.88C) between surface radiometric tempera-
tures of the homogenous and cold rural area (A) and
the warm built-up area (B). On the other hand, the
residential neighborhood has the largest standard
deviation (0.538C as compared with 0.168C in the
rural area) because it consists of a wide variety of
materials and complex structures. The roads appear to
be the warmest element in the image (Tavg�8.3±
8.88C), especially the road junctions (C), which are
ca. 18C warmer than the roads themselves (Tavg�9.5±
9.68C). Note that the roads in the rural area are colder
by ca. 0.58C than the roads in the residential area.
3.3.2. Image b Ð the seashore area (Fig. 6b)
This image shows the seashore area and the
western residential area at the center of Tel-Aviv
City. Obviously, the sea and other water bodies in
the image (such as the swimming pool that appears in
the middle of the image) are the warmest targets
during the nighttime, with radiometric temperatures
of >12.28C (this was the upper detection limit of the
current TVR measurement). In this image, a relatively
warm spot appears at the piers in Tel-Aviv's port
(Tavg�10.58C), which was warm because of its asphalt
coverage. Also, visible are the warmer edges of the
piers which is caused by the relatively high water
content at these areas. The sand strip along the sea-
shore is relatively cold because of the low heat capa-
city, light color and absence of anthropogenic heat
sources. Note that a thin warm strip associated with
the sea's waterline is visible, and its location moves
with the motion of the sea waves. As in the previous
image, the streets in the current image were found to
be the warmest element throughout the land area, with
the main streets (Ben-Yehuda St. [A] and Arlozorov
St. ([B]) being the warmest. At Ben Gurion Boulevard
(C), where relatively dense vegetation appears, the
radiometric temperatures were relatively cold because
of the canopy effect. The residential area presented in
the image is characterized by minimum vegetation and
a dense built-up neighborhood as well as a heavy
traf®c load along the main streets during the daytime.
Note that within this residential area, a cold spot (D)
was detected. This spot was found to be an uninhab-
ited house (located beside the main street) which
strongly suggests that anthropogenic activity can be
monitored by the TVR at the house (microscale) level.
3.3.3. Image c Ð two close neighborhoods at the
center of the City (Fig. 6c)
This image illustrates two neighborhoods that have
noticeable thermal variations between them. These
variations were found to be a function of the difference
in the neighborhoods' physical structures and urban
activity. The cold neighborhood (A, known as the
`Rakevet' neighborhood) is a workshop area com-
posed of low buildings such as garages, carpenter's
shops, small industries and storehouses. This area is
empty during the nighttime and has no heating or
urban activity sources to warm it at night. Addition-
ally, the streets of this neighborhood are barely paved
and appear bleached by a signi®cant amount of dust
coverage. During the daytime, such a con®guration
tends to re¯ect the solar energy, and, hence,
diminishes the absorbed (and emitted) energy.
Because the streets in neighborhood B are heavily
paved with asphalt and have a relatively dense traf®c
load during the daytime, the differences that occur
between the two neighborhoods are signi®cant (the
average temperature of the `cold' and `warm' neigh-
borhoods are 8.0 and 9.38C, respectively). Owing to
the high spectral and spatial resolution of the TVR,
radiometric temperature differences DT of ca. 108Chave been observed between two closely situated
objects in the cold neighborhood (A), because of
different emissivities, thermal conductivity and capa-
city. The `cold' object is a storehouse with metal walls
and roof that can be characterized by low emissivity
and low thermal conductivity and capacity, which is
visualized as cold. The `warm' object is a gray brick
workshop with a transparent asbestos roof acting as a
green house, which is visualized as hot. In the image a
12 H. Saaroni et al. / Landscape and Urban Planning 48 (2000) 1±18
warm neighborhood (B), which represents a residen-
tial area with a few cold public (uninhabited) houses
(on its southern corner) and a commercial area (on its
northeastern corner) is also visible. Note that a warm
area is seen in the intersection located at the northern
part of the image (C). This area contains a building
where a newspaper is published, which is very active
at night and, hence, is visualized as hot (Tavg�10.78C).
3.3.4. Image d Ð a residential neighborhood
(Fig. 6d)
This image illustrates a heterogeneous residential
area at the northeastern part of the city as well as an
open area (east and southeast of this region). A notice-
able temperature difference appears between the
streets, and the northern street, Yehuda Hamaccabi
(A), was found to be the warmest. Along this street and
especially along its northern edge, several busy res-
taurants and night bars were operating during the time
of the ¯ight. These restaurants can be considered as a
heat source for this street, which was easily detected
by the TVR. The eastern street ([B]; Namir Drive) is
one of the main roads in the city. A temperature
difference appears between its northern part (B1),
which is blocked between dense heat-emitting build-
ings, and its southern part (B2), which is situated in a
cold open area. The image also shows several neigh-
borhoods with different thermal characteristics. The
western neighborhood (C) consists of 3- to 4-¯oor
buildings (50 years old), with vegetated areas in their
backyards and along the streets (as boulevards). The
central neighborhood (D1±4) illustrates a heteroge-
neous area. Another old neighborhood (D1), similar to
C, is visible. At the northwestern corner of the image
some cold spots appear, resulting from a strip of small
private houses (2 ¯oors) that are heavily vegetated
(D2). Also, a public area (museum) surrounded by a
vegetated area (D3) shows relatively cold radiant
temperatures. Next to the museum (D3), a relatively
young area (10±20 years) with taller buildings (D4)
appears to be comparatively warmer (Tavg�9.18C).
The cold spot at the southeast corner of the central
neighborhood is a bare soil area situated at relatively
low topography (ca. 5 m lower than its surroundings;
Tavg�8.18C). The eastern neighborhood (E) consists
of younger (5±10 years) high-rise buildings (6±8
¯oors), which appear to be warmer than the older
(10±20 years) western buildings. The southern part of
the image consists of a cold, open area (F; Tavg�7.28C). Also, in this area are three tall buildings having
20 ¯oors (G), which appear to be the warmest build-
ings in this image (Tavg�9.88C), and a small residen-
tial housing area (H) that appears to be relatively cold
(Tavg�8.38C).
In summary, it can be concluded that the four
selected images clearly show thermal variations on
a microscale level, caused by coverage type, land use,
building materials and activity patterns.
4. Discussion
Air temperature measurements from both roof and
street levels indicated a noticeable UHI in Tel-Aviv
City especially during the nighttime. At roof level, and
during the daytime, the seashore was colder than the
city center, based on the moderating effect of the sea.
No signi®cant differences were found between the city
center stations and the margin stations, both located
the same distance from the sea. The rural stations east
of Tel-Aviv were warmer than the inner city by up to
48C. During the nighttime the seashore station was
warmer than the inner city, due to the moderating
effect of the sea. Nevertheless, the city center was
warmer than the margins, by ca. 1.5±2.58C, which, in
principle, indicates the UHI effect. These ®ndings
con®rm the conclusion made by Bitan et al. (1992),
who investigated the impact of the sea on the roof-
level temperatures of Tel-Aviv City during a selected
summer. They found that the impact of the sea is
greater than the urban effect during both day and
nighttime: `̀ the seashore was found to be warmer than
the city center during nighttime and colder during the
daytime''. Our measurements also show that the
Mediterranean Sea plays an important role in the
roof-level temperatures during stable winter days,
but the urban effect is more pronounced during night-
time. At roof level, the urban effect can be seen only
on a north±south cross section (at the same distance
from the sea), where the city center is warmer than its
margins by ca. 28C at night and by ca. 18C during the
daytime. The moderating effect of the Mediterranean
Sea is also pronounced at the street level, especially in
the daytime, where the seashore was found to be
colder than the city center. During nighttime, whereas
the seashore station (at the roof level) was found to be
H. Saaroni et al. / Landscape and Urban Planning 48 (2000) 1±18 13
warmer than the city center stations, the seashore route
(at the street level) was not found to be warmer than
the inner city routes. No land breeze was measured
during nighttime, and, therefore, we speculated that
there was no heat transfer from the city mass toward
the seashore. This supports the assumption that at the
street level there is a greater urban contribution to the
creation of the UHI than at the roof level, where the
sea's effect is not blocked by the buildings and is
therefore more pronounced. Thermal differences were
also observed between the magnitude of the UHI at the
roof and at the street levels. Whereas at roof level the
UHI was obvious only during nighttime and the
temperature differences between the city center and
the margins were ca. 1±28C, at street level the UHI
was observed during both day and nighttime, and its
magnitude was 4 and 5.68C, respectively.
During the daytime, in addition to several warm
areas observed from the air temperature measurements
at the street level, several cold areas were found within
the city center (Fig. 5a). The warm areas may be
related to the heavy traf®c loads, high urban densities,
daytime heat sources and lower sea breeze ventilation.
The colder areas do not appear to express a classic
`negative UHI' effect, but indicate that such a trend is
possible. It should be noted that these cold areas are
not characterized by a canyon geometry structure but
by more open spaces, such as wide roads, junctions
and a city plaza. Accordingly, it is assumed that the
cold areas actually result from sea breeze penetration
into these locations. It should be emphasized that there
were no wind measurements taken on these streets to
argue this assumption, but a westerly sea breeze (3±
6 m sÿ1) was measured at the seashore. Further study
on temperature variations based on street geometry
and wind pattern is needed for the city of Tel-Aviv.
The spatial and diurnal distribution of the UHI of
Tel-Aviv, as can be seen from the isotherm maps (Fig.
5a±d), indicate that the UHI is more homogeneously
pronounced during the nighttime, whereas during the
daytime, there is a larger temperature variation, espe-
cially within the routes in the city center.
Although the TVR images present a bird's-eye view
(Voogt and Oke, 1997) of the city, they indicate the
complex thermal behavior of an urban surface versus
the homogeneity of open spaces. It clearly presents the
thermal differences due to material composition, land
uses, type of coverage, color and anthropogenic activ-
ities. Temperature differences between objects in the
images were found to be higher than the differences
found in the air temperatures (up to >10 and 5.68C,
respectively) for the early morning hours (0300). It is
assumed that during the daytime the thermal differ-
ences between the same objects shown will be greater,
because the surface UHI is more pronounced then
(Roth et al., 1989; Voogt and Oke, 1997). The images
show different heat sources throughout the city neigh-
borhoods and present the thermal behavior of various
urban elements in the city of Tel-Aviv.
The images indicated that the asphalt paved streets
in Tel-Aviv are a signi®cant heat source at night
(images available) and probably during the daytime
(images not available). An interesting ®nding was the
fact that junctions were even warmer than the asphalt
streets themselves, contrary to what Barring et al.
(1985) found in Malmo, Sweden, and Eliasson
(1990/1991) found in Goteborg, Sweden. They
observed cold junctions relative to the street and
explained this ®nding by the higher sky view factor
(SVF) over the junctions. This interesting converse
observation in Tel-Aviv may be explained by several
factors:
(a) Differences in the material composition of the
street: in Tel-Aviv the streets are paved with
asphalt, and junctions were found to have more
ragged asphalt, mostly covered with oil spots and
the remains of tire friction. These alterations might
cause changes in the target's emissivity, which
would result in higher temperatures.
(b) Differences in street geometry and climate
conditions: Tel-Aviv is located in the Mediterra-
nean climate at latitude 328N. Therefore, even
given similar street size and street geometry, the
insolation conditions are different, differently
affecting the warming and cooling mechanisms
of the streets and junctions. Also, most streets
shown in the images (Fig. 6) are quite wide (ca.
20±30 m).
(c) Our measurements were taken around
03:00 hours local time when the cooling effect is
higher relative to 17:00±22:00 and 21:00 hours
(local times), when Eliasson (1990/1991) and
Barring et al. (1985) conducted their measure-
ments, respectively. Therefore, the effect of the
different SVFs is expected to be higher in
14 H. Saaroni et al. / Landscape and Urban Planning 48 (2000) 1±18
Goteborg and Malmo and lower in Tel-Aviv. As a
result, it is assumed that the SVF is highly
dependent on the local conditions of the area
examined.
Despite the warm streets, air temperatures taken at
street level indicated that along areas with vegetation,
the temperature values were relatively colder than
along non vegetated areas. The surface images show
the spatial location of green areas, boulevards, gardens
and parks, based on their thermal behavior. Vegetated
areas are known to be comparatively colder during the
daytime than most other urban elements (Wanner and
Hertig, 1984) and bare soil areas (Sabins, 1987).
During the nighttime, vegetated areas appear to be
relatively warmer than bare soil areas (Sabins, 1987).
Nevertheless, the thermal images obtained by the TVR
(Fig. 6) show that the vegetated areas were colder at
nighttime than most of the other urban components,
and especially relative to the warm streets. This
observation indicates that there is a noticeable night-
time contribution from both urban components and
anthropogenic activity to the UHI. Accordingly, the
daytime thermal differences between vegetated areas
and urban components are expected to be even greater.
Moreover, during the daytime, vegetation on the
boulevards casts shadows on the surface of the streets,
causing less absorption of insolation (in addition to its
other environmental implications). Basically, vegeta-
tion has been reported to have a positive effect on
reducing the heat stress and improving the climatic
conditions of cities in warm regions (Givoni, 1991;
Rosenfeld et al., 1995). In the current study, most roofs
in Tel-Aviv were found to be relatively cold during the
nighttime and were assumed to maintain this trend
during the daytime as well. This characteristic is
related to the light color of roofs, on the one hand,
and to the extensive use of insulated material, on the
other. The city of Tel-Aviv has been called the `white
city', because of the generally light color of the roofs.
This is known to play an important role in reducing
solar heating during the warm season and therefore
reduces energy consumption and urban smog (Rosen-
feld et al., 1995). From all of the thermal video data of
the city (images not shown) it was observed that roofs
covered with vegetation were warmer during the
nighttime than were the light-colored roofs without
vegetation coverage. A daytime monitoring is required
to study the daytime thermal differences between
exposed roofs and vegetated ones. Moreover, because
the in¯uence of humidity should also be considered
during both day and nighttime, a future study should
include an examination during the summertime, when
the effect of humidity is at its greatest.
Several studies have revealed positive correlation
between surface radiometric temperature and air tem-
perature in urban areas (Stoll and Brazel, 1992; Yang
et al., 1994; Ben-Dor and Saaroni, 1997; Voogt and
Oke, 1997). In order to compare the patterns of the
UHI (as measured by air temperature at street level
and surface radiometric temperatures), we generated
an isotherm map of the surface (TVR) radiometric
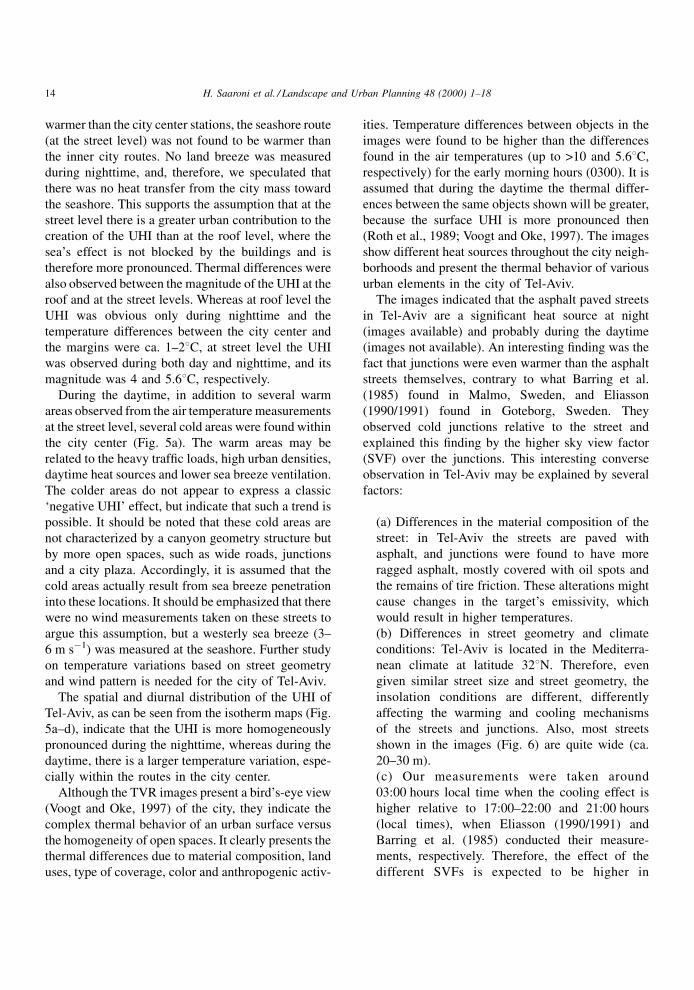
temperatures (Fig. 8) by extracting the surface radio-
metric temperatures along the four routes (shown in
Fig. 1) at the same ground locations where the air
measurements were taken. A comparison between this
map (Fig. 8) and the isotherm map of the air tem-
perature for the same hour (Fig. 5d) results in the
following conclusions:
(a) Both maps show a similarity in the magnifica-
tion of the temperature variation as well as in the
spatial thermal distribution.
(b) Both maps show a similarity in temperatures
between the seashore and the city center routes (A
and B, respectively), and the eastern part of the city
was the coldest.
Although similar trends were observed between the
two maps, there are some minor differences that can
be explained by different atmospheric conditions over
the four studied routes (see Ben-Dor and Saaroni,
1997).
In general, it can be concluded that the TVR,
together with conventional air temperature measure-
ments, provides a reliable spatial representation of the
pattern, magnitude and microscale characteristics of
the UHI.
5. Summary and conclusions
A signi®cant UHI was identi®ed in the city of Tel-
Aviv using surface radiometric temperature as well as
air temperatures measured from mobile traverses and
at ®xed stations, on a stable, calm winter day. The
thermal images showed, for the ®rst time, the thermal
H. Saaroni et al. / Landscape and Urban Planning 48 (2000) 1±18 15
pattern and complexity of the city's coverage in Tel-
Aviv, which impact its UHI. The UHI was found to be
most pronounced during the nighttime. During the
daytime, several isolated warm areas were observed
next to colder ones, indicating, perhaps, a negative
UHI. The in¯uence of the warm Mediterranean Sea is
obvious at the roof level and is diminished at the street
level, where the urban effects are more pronounced.
Air temperature differences of up to 68C at the street
level and of ca. 28C at the roof level were identi®ed
between the city center areas and the southeastern
margins of the city (ca. 5 km distance) during night-
time. The isotherm maps of the mobile traverses at
different times indicate the pattern of the UHI in Tel-
Aviv, which is a function of the physical conditions,
the effect of the Mediterranean Sea, the local topo-
graphy and the urban characteristics such as land uses,
building density, traf®c load, construction materials
and anthropogenic heat sources. These isotherm maps,
generated from the air measurements, are an inter-
polation that gives an inclusive picture of the pattern
of the UHI in Tel-Aviv. A comparison between the
isotherm maps of the air and surface radiometric
temperatures indicates a similar pattern and suggests
that the TVR can rapidly depict the overall pattern of
the UHI. The TVR also enables imaging of the
microscale pattern and shows the in¯uence of the
different urban components, indicating the great com-
plexity of UHI sources. It shows the noticeable con-
tribution of asphalt streets and their junctions as well
as the in¯uence of diverse anthropogenic activities and
signi®cant effect of both open and vegetated areas.
The thermal images, acquired by the TVR sensor,
emphasized the major role of vegetation in cooling the
city. The parks and open areas were the coldest
elements within the city during both day and night-
time. Furthermore, the advanced TVR sensor enables
thermal recognition of the city's different areas.
Noticeable differences between neighborhoods in
the city (resulting from the type of urban activity,
building patterns, structural materials, street color,
vegetation and open area characteristics) could be
depicted by this tool. The presented study integrates
several methods and techniques that can be used to
characterize the UHI in both micro- and mesoscales.
Identi®cation of the different heat sources in Tel-Aviv,
their spatial distribution, intensity and spatial in¯u-
ence may lead to better understanding the UHI of the
city. The results have further relevance for environ-
mental implications in a time of global warming,
especially in a warm region such as the Mediterranean
basin.
Acknowledgements
The authors wish to thank the heads of the Geo-
graphy Department, Tel-Aviv University, Professors J.
Portugali and A. Bitan, for supporting the ¯ight
expenses; Mr. E. Cohen from Elbit Israel LTD, for
providing the radiometer; Dr. A. Manes, Mr. A. Israeli
Fig. 8. An isotherm map of surface radiometric temperatures (8C)
for 03:00 hours local time.
16 H. Saaroni et al. / Landscape and Urban Planning 48 (2000) 1±18

and Dr. A. Dozortsef from the Israel Meteorological
Service, Dr. J. Dorfman and Dr. O. Tsafrir from the
Geography Department and Mr. A. Tal from ICTAF
for their technical assistance.
References
Alpert, P., Abramski, R., Neeman, B.U., 1992. The prevailing
summer synoptic system in Israel Ð Subtropical high, not
Persian trough. Isr. J. Earth Sci. 39, 93±102.
Atkinson, B.J., 1985. The Urban Atmosphere. Cambridge Uni-
versity Press, Cambridge.
Balling, R., Brazel, S.W., 1988. High-resolution surface tempera-
ture patterns in a complex urban terrain. Photogram. Eng. Rem.
Sens. 54 (9), 1289±1293.
Barring, L., Mattsson, J.O., Lindqvist, S., 1985. Canyon geometry,
street temperatures and urban heat island in Malmo, Sweden.
Int. J. Climatology 5, 433±444.
Ben-Dor, E., Saaroni, H., 1997. Airborne video thermal radiometry
as a tool for monitoring microscale structures of the urban heat
island. Int. J. Rem. Sens. 18 (14), 3039±3053.
Bitan, A., Noy, L., Turk, R., 1992. The impact of the seashore on
the climate of Tel-Aviv. Scienti®c reports of the institute for
meteorology and climate research of the Karlsruhe University
16, pp. 147±160.
Bitan, A., Rubin, S., 1994. Climatic Atlas of Israel for Physical and
Environmental Planning and Design. Tel-Aviv: Ramot Publish-
ing.
Bitan, A., Saaroni, H., 1992. The horizontal and vertical extension
of the Persian Gulf trough. Int. J. Climatology 12, 733±747.
Carlson, T.N., Augustine, J.N., Boland, F.E., 1977. Potential
application of satellite temperature measurements in analysis of
land use over urban areas. Bull. Am. Meteorolog. Soc. 58 (12),
1301±1303.
Carnahan, W.H., Larson, R.C., 1990. An analysis of an urban heat
sink. Rem. Sens. Environ. 33, 65±71.
Eliasson, I., 1990/1991. Urban geometry, surface temperature and
air temperature, Energy and Building, 15±16, 141±145.
Eliasson, I., 1992. Infrared thermography and urban temperature
patterns. Int. J. Rem. Sens. 13 (5), 869±879.
Eliasson, I., 1996. Intra-urban nocturnal temperature differences: a
multivariate approach. Clim. Res. 7, 21±30.
ENVI, 1994. The Environment for Visualization ENVI, User's
Guide. Vesion 1.1, ENVI, Boulder, Co.
EPU-NTUA and ICTAF, 1994. Energy in the urban environment Ð
an action plan for the city of Tel-Aviv. Interior Report, Athens,
Tel-Aviv.
Givoni, B., 1991. Impact of planted areas on urban environmental
quality: a review. Atmos. Environ. 25B (3), 289±299.
Landsberg, H.E., 1981. The urban climate. In: Mieghem, J.V.,
Hales, A.L., Donn, W.L. (Eds.), International Geophysics
Series. Vol. 28. Academic Press, New York.
Lillesand, T.M., Kiefer, R.W., 1994. Remote Sensing and Image
Interpretation, 3rd Edition. Wiley, New York, pp. 380±385.
Moreno-Garcia, M.C., 1994. Intensity and form of the urban heat
island in Barcelona. Int. J. Climatology 14, 705±710.
Myrup, L.O., 1969. A numerical model of the urban heat island. J.
Appl. Meteorol. 8, 908±918.
Oke, T.R., 1981. Canyon geometry and the nocturnal urban heat
island: comparison of scale model and ®eld observations. Int. J.
Climatology 1, 237±254.
Oke, T.R., 1982. The energetic basis of the urban heat island. Royal
Meteor. Soc. 108, 1±28.
Oke, T. R., 1987. Boundary layer climates. Methuen Press,
London, pp. 252±302.
Oke, T.R., 1995. The heat island of the urban boundary layer: char-
acteristics, causes and effects. In Cermak, J.E., Davenport, A.G.,
Plate, E.J, Viegas, D.X. (Eds.), Wind Climate in Cities. NAASI
series. Kluwer Academic Publishers, Dordrecht, pp. 81±107.
PCI, 1994. Image Works Reference Manual. Version 5.3, PCI,
Ontario, Canada.
Pease, R.W., Lewis, J.E., Outcalt, S.I., 1976. Urban terrain
climatology and remote sensing. Ann. Assoc. Am. Geographers
66 (4), 557±569.
Quattrochi, D.A., Ridd, M.K., 1994. Measurement and analysis of
thermal energy responses from discrete urban surfaces using
remote sensing data. Int. J. Rem. Sens. 15 (10), 1991±2022.
Reutter, H., Olesen, F.S., Fischer, H., 1994. Distribution of the
brightness temperature of land surfaces determined from
AVHRR data. Int. J. Rem. Sens. 15 (1), 95±104.
Ronberg, B., 1984. An Objective Weather Typing System for
Israel: A Synoptic Climatological Study. Ph.D. Thesis, The
Hebrew University, Jerusalem, 126 pp.
Rosenfeld, A.H., Akbari, H., Bretz, S., Fishman, B.L., Kurn, D.M.,
Sailor, D., Taha, H., 1995. Mitigation of urban heat island: mat-
erials, utility programs, updates. Energy Building 22, 255±265.
Roth, M., Oke, T.R., Emery, W.J., 1989. Satellite-derived urban
heat islands from three coastal cities and the utilization of such
data in urban climatology. Int. J. Rem. Sens. 10, 1699±1720.
Saaroni, H., Bitan, A., Alpert, P., Ziv, B., 1996. Continental polar
outbreaks into the Levant and eastern Mediterranean. Int. J.
Climatology 16, 1175±1191.
Saaroni, H., Ziv, B., Alpert, P., Bitan, A., 1998. Easterly wind
storms over Israel. Theor. Appl. Climatology 59, 61±77.
Sabins, F.F., 1987. Remote Sensing Principles and Interretation.
2nd Edition. W.H. Freeman and company, New York, 449 pp.
Statistical Abstract of Israel, 1998. Central Bureau of Statistics, No.
49, Jerusalem.
Stoll, M., Brazel, A., 1992. Surface-air temperature relationships in
the urban environment of Phoenix, Arizona. Phys. Geography
13 (2), 160±179.
Voogt, J.A., Oke, T.R., 1997. Complete urban surface temperatures.
J. Appl. Meteorol. 36, 1117±1132.
Wanner, H., Hertig, J., 1984. Studies of urban climates and air
pollution in Switzerland. J. Clim. Appl. Meteorol. 23 (12),
1614±1625.
Yang, X., Li, C., Zhang, Z., 1994. A remote sensing method for
studying urban heat island. Proceedings of the ®rst international
airborne remote sensing conference and exhibition held in
Strasbourg, France, on 12±15 September 1994, III, pp. 261±
271.
H. Saaroni et al. / Landscape and Urban Planning 48 (2000) 1±18 17

Hadas Saaroni (Ph.D., Tel-Aviv University, 1994) is a lecturer at
the Department of Geography and Human Environment, Tel-Aviv
University, Israel. She is an expert in urban climatology and synoptic
climatology. Her studies focus on two fields: (1) Climatological
aspects of urban areas in Israel; (2) Synoptic climatology of the
Levant region and Israel and its correlation with polar outbreaks,
severe storms, forest fires and other climatological aspects of the
region. Her current studies focus on analyzing the UHI character-
istics of cities along the eastern Mediterranean and the effect of
various green areas in the city, combining theoretical and field
study, using climatological and remote sensing techniques. Mailing
address: Department of Geography and Human Environment, Tel-
Aviv University, P.O. Box 39040, Ramat Aviv, Tel Aviv, Israel 69978.
Eyal Ben-Dor (Ph.D., Hebrew University of Jerusalem, 1992) is a
senior lecturer at the Department of Geography and Human
Environment, Tel-Aviv University Israel. He is an expert in soil and
remote sensing sciences and is interested in broad environmental
aspects using state-of-the-art remote sensing technology. His
studies deal with high spatial and spectral resolution analysis of
the lithosphere, hydrosphere and atmosphere from the visible, near
infrared and far infrared spectral regions. He was a visiting scientist
at the Center for Study of the Earth from Space (CSES), at the
University of Colorado from 1992 to 1994 under special grants of
the NOAA. His current studies focus on quantitative mapping of
soils and water from hyperspectral data and developing of low cost
remote sensing capabilities. Mailing address: Department of
Geography and Human Environment, Tel-Aviv University, P.O.
Box 39040, Ramat Aviv, Tel Aviv, Israel 69978. http://www.outa-
sites.com/tauniv
Arieh Bitan (Ph.D., Hebrew University of Jerusalem, 1970) is a
full Professor and head of the Unit for Applied Climatology and
Environmental Aspects, Department of Geography and the Human
Environment, Tel-Aviv University. Twice head of the Department
of Geography, Tel-Aviv University. Previous positions: Department
of Geography, Hebrew University, Jerusalem, Lecturer. Department
of Geography, Haifa University, guest lecturer. Professional
specialization: Urban climatology, applied climatology and plan-
ning and climate of Israel. Professional activities: Research on the
urban climate of Tel Aviv. Consultant in applied climatology to
different ministries, public agencies and private companies in
integrating climatic considerations in national, regional and urban
planning.
Oded Potchter (M.A., Tel-Aviv University, 1984) is a teacher and
researcher at the Department of Geography and Human Environ-
ment, Tel-Aviv University, Israel. His main expertise are applied
climatology, urban climatology, regional climatology and climate
and human habitation. His current studies focus on the climatic
aspects of urban parks and green area, climatic aspects of human
settlement in ancient time, human settlement in arid zones and
climatic aspects of vernacular architecture. Mailing address:
Department of Geography and Human Environment, Tel-Aviv
University, P.O. Box 39040, Ramat Aviv, Tel Aviv, Israel 69978.
E-mail: [email protected]
18 H. Saaroni et al. / Landscape and Urban Planning 48 (2000) 1±18
Related Documents


