Geothermics 37 (2008) 267–299 Available online at www.sciencedirect.com Spatial data analysis and integration for regional-scale geothermal potential mapping, West Java, Indonesia Emmanuel John M. Carranza a,∗ , Hendro Wibowo b , Sally D. Barritt a , Prihadi Sumintadireja b a Department of Earth Systems Analysis, International Institute for Geo-information Science and Earth Observation (ITC), Enschede, The Netherlands b Laboratory of Volcanology and Geothermal, Geology Department, Institute of Technology Bandung (ITB), Bandung, Indonesia Received 25 August 2006; accepted 14 March 2008 Available online 25 April 2008 Abstract Conceptual modeling and predictive mapping of potential for geothermal resources at the regional-scale in West Java are supported by analysis of the spatial distribution of geothermal prospects and thermal springs, and their spatial associations with geologic features derived from publicly available regional-scale spatial data sets. Fry analysis shows that geothermal occurrences have regional-scale spatial distributions that are related to Quaternary volcanic centers and shallow earthquake epicenters. Spatial frequency distribution analysis shows that geothermal occurrences have strong positive spatial associations with Quaternary vol- canic centers, Quaternary volcanic rocks, quasi-gravity lows, and NE-, NNW-, WNW-trending faults. These geological features, with their strong positive spatial associations with geothermal occurrences, constitute spatial recognition criteria of regional-scale geothermal potential in a study area. Application of data-driven evidential belief functions in GIS-based predictive mapping of regional-scale geothermal potential resulted in delineation of high potential zones occupying 25% of West Java, which is a substantial reduction of the search area for further exploration of geothermal resources. The predicted high potential zones delineate about 53–58% of the training geothermal areas and 94% of the validated geothermal occurrences. The results of this study demonstrate the value of regional-scale geothermal potential mapping in: (a) data-poor situations, such as West Java, and (b) regions with geotectonic environments similar to the study area. © 2008 Elsevier Ltd. All rights reserved. Keywords: Gravity lows; Fry analysis; Spatial association analysis; Evidential belief functions; Geographic Information Systems (GIS); West Java; Indonesia ∗ Corresponding author. Tel.: +31 53 487 4444; fax: +31 53 487 4336. E-mail address: [email protected] (E.J.M. Carranza). 0375-6505/$30.00 © 2008 Elsevier Ltd. All rights reserved. doi:10.1016/j.geothermics.2008.03.003

Welcome message from author
This document is posted to help you gain knowledge. Please leave a comment to let me know what you think about it! Share it to your friends and learn new things together.
Transcript
Geothermics 37 (2008) 267–299
Available online at www.sciencedirect.com
Spatial data analysis and integration for regional-scalegeothermal potential mapping, West Java, Indonesia
Emmanuel John M. Carranza a,∗, Hendro Wibowo b,Sally D. Barritt a, Prihadi Sumintadireja b
a Department of Earth Systems Analysis, International Institute for Geo-information Science and EarthObservation (ITC), Enschede, The Netherlands
b Laboratory of Volcanology and Geothermal, Geology Department, Institute ofTechnology Bandung (ITB), Bandung, Indonesia
Received 25 August 2006; accepted 14 March 2008Available online 25 April 2008
Abstract
Conceptual modeling and predictive mapping of potential for geothermal resources at the regional-scale inWest Java are supported by analysis of the spatial distribution of geothermal prospects and thermal springs,and their spatial associations with geologic features derived from publicly available regional-scale spatialdata sets. Fry analysis shows that geothermal occurrences have regional-scale spatial distributions that arerelated to Quaternary volcanic centers and shallow earthquake epicenters. Spatial frequency distributionanalysis shows that geothermal occurrences have strong positive spatial associations with Quaternary vol-canic centers, Quaternary volcanic rocks, quasi-gravity lows, and NE-, NNW-, WNW-trending faults. Thesegeological features, with their strong positive spatial associations with geothermal occurrences, constitutespatial recognition criteria of regional-scale geothermal potential in a study area. Application of data-drivenevidential belief functions in GIS-based predictive mapping of regional-scale geothermal potential resultedin delineation of high potential zones occupying 25% of West Java, which is a substantial reduction of thesearch area for further exploration of geothermal resources. The predicted high potential zones delineateabout 53–58% of the training geothermal areas and 94% of the validated geothermal occurrences. Theresults of this study demonstrate the value of regional-scale geothermal potential mapping in: (a) data-poorsituations, such as West Java, and (b) regions with geotectonic environments similar to the study area.© 2008 Elsevier Ltd. All rights reserved.
Keywords: Gravity lows; Fry analysis; Spatial association analysis; Evidential belief functions; Geographic InformationSystems (GIS); West Java; Indonesia
∗ Corresponding author. Tel.: +31 53 487 4444; fax: +31 53 487 4336.E-mail address: [email protected] (E.J.M. Carranza).
0375-6505/$30.00 © 2008 Elsevier Ltd. All rights reserved.doi:10.1016/j.geothermics.2008.03.003
268 E.J.M. Carranza et al. / Geothermics 37 (2008) 267–299
1. Introduction
The term potential implies the chance or likelihood that a resource of the type sought (e.g.mineral deposits, geothermal reservoirs) can be found in an area or region of interest. Itsusage has exploration significance, but no economic viability implication because not all ofthe discoveries or prospects will likely be economically viable. Known occurrences of the typesought are samples of a resource population and are characterized by physical and/or chemicalfeatures that indicate their presence. Knowledge of the locations and geological characteristicsof these resources provides spatial evidence for resource potential mapping. The focus of thismapping, rather than attempting to locate individual resource occurrences that constitute discretespatial evidence for potential (e.g. a mineral (ore) deposit or geothermal activity, associated witha nearby “parent” or primary resource), is to delineate promising search (i.e. exploration) areaswhere prospects are most likely to be found.
Predictive mapping of resources is a multi-stage area-selection activity, whether field- orGIS-based, with the ultimate objective of delineating prospective ground for further explo-ration. In the early stages, large areas are investigated, using regional-scale maps at mapscales of 1:100,000 or smaller, with the objective of identifying promising search areas. Inthe later stages of mapping, promising search areas are explored in greater detail. From theearly to the late stages of the project, maps representing spatial recognition criteria (i.e. geo-logical information/features used to identify resource potential) should have increasing detailand accuracy. At each stage of the mapping, resource potential is related to the degree, pres-ence or importance of these features. If, for example, more important features are present inone area than another, then the former is considered to have higher potential than the lat-ter.
Methods for GIS-based resource potential mapping are either knowledge-driven (e.g. Prol-Ledesma, 2000; Noorollahi et al., 2007, 2008) or data-driven (e.g. Coolbaugh et al., 2002;Coolbaugh, 2003). On the one hand, knowledge-driven methods involve application of expertknowledge to select and assign weights to indirect spatial evidence of resource potential. Onthe other hand, data-driven methods involve quantitative analysis of spatial associations betweenthe locations of the resources and indirect geological evidence associated with resource poten-tial (Blewitt et al., 2002; Coolbaugh et al., 2002). Knowledge- or data-driven methods forGIS-based mapping employ a conceptual model of resource potential, which provides knowl-edge of spatial associations between the resource and evidence corresponding to (geological)features related to the resource. For example, spatial associations of geothermal occurrenceswith geodetic strain (Blewitt et al., 2002), magnetic and/or gravity anomalies (Hildebrandand Kucks, 1981; Sugihara et al., 2002), and seismicity (Voulgaris et al., 2004), suggestcertain types of structures or lithologies are characteristic (i.e. evidence) of geothermal poten-tial, whereas other geological features are not. Predictive mapping is scale-dependent, suchthat a conceptual model developed at the local scale (e.g. Ostapenko et al., 1998) maynot be appropriate for regional-scale mapping. In addition, spatial associations of resourceoccurrences with certain geological features may vary, from one study area to another, so con-ceptual modeling of resource potential must be supported by spatial analytical tools (Carranza,2002).
Here we describe methods to resolve the spatial distribution of resource occurrences and thespatial associations between them and individual sets of geological features, in order to con-ceptually model regional resource potential. The methods are demonstrated using GIS-basedregional-scale geothermal potential mapping in West Java (Indonesia). In this study, existing
E.J.M. Carranza et al. / Geothermics 37 (2008) 267–299 269
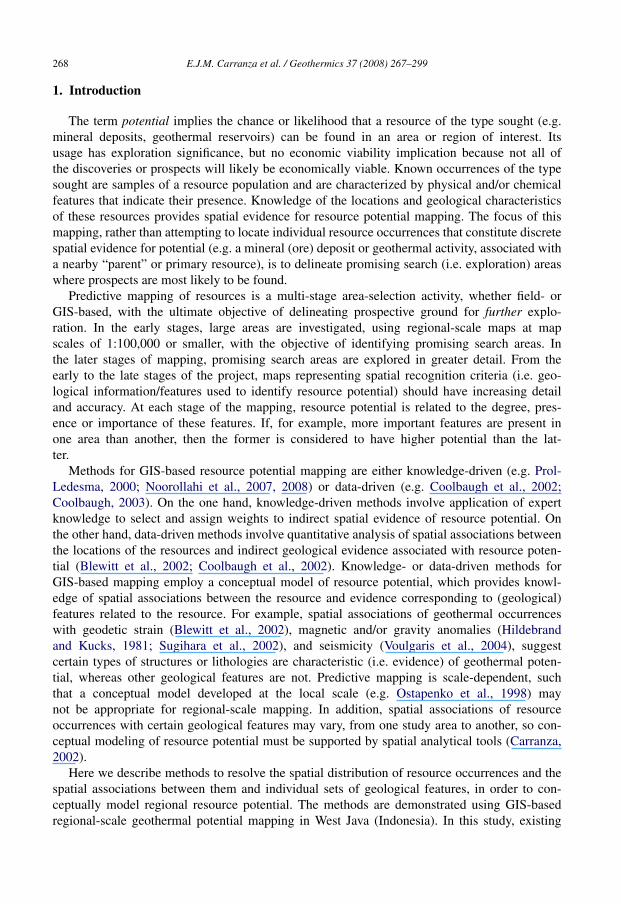
Fig. 1. Geotectonic setting of the island of Java, Indonesia. Black triangles: Quaternary volcanoes.
regional-scale maps at scales of 1:100,000 or smaller) were used. Fry analysis (Vearncombe andVearncombe, 1999) was carried out to infer plausible regional-scale geological controls on thespatial distribution of the geothermal occurrences. Analysis of the spatial frequency distribution(Bonham-Carter, 1994) of the occurrences and geological features was performed to determinewhich sets of geological features are useful indicators of geothermal potential. Finally, evidentialbelief functions (Carranza and Hale, 2003) were applied in data-driven regional-scale mappingof geothermal potential.
2. Case study area
West Java was chosen for a case study as it has been well-explored for geothermal resources,and consequently there are data of locations of known geothermal activity and relevant regional-scale geoscience data sets that are publicly available and usable for data-driven regional-scalepotential mapping.
2.1. Geological background
The island of Java is part of the 3000 km-long Sunda Volcanic Arc associated with the NNEsubduction of the oceanic Indo-Australian Plate beneath the continental Eurasian Plate along theSunda Trench (Katili, 1975; Hamilton, 1979; Fig. 1). Due to subduction along the WNW-ESEtrending part of the Sunda Trench, Java is characterized by WNW-ESE-trending physiographicand structural units (Van Bemmelen, 1949). In West Java, three major morphological belts aredistinguished (Fig. 2a). The Lowland Plain of northern West Java is underlain by shelf sediments
270 E.J.M. Carranza et al. / Geothermics 37 (2008) 267–299
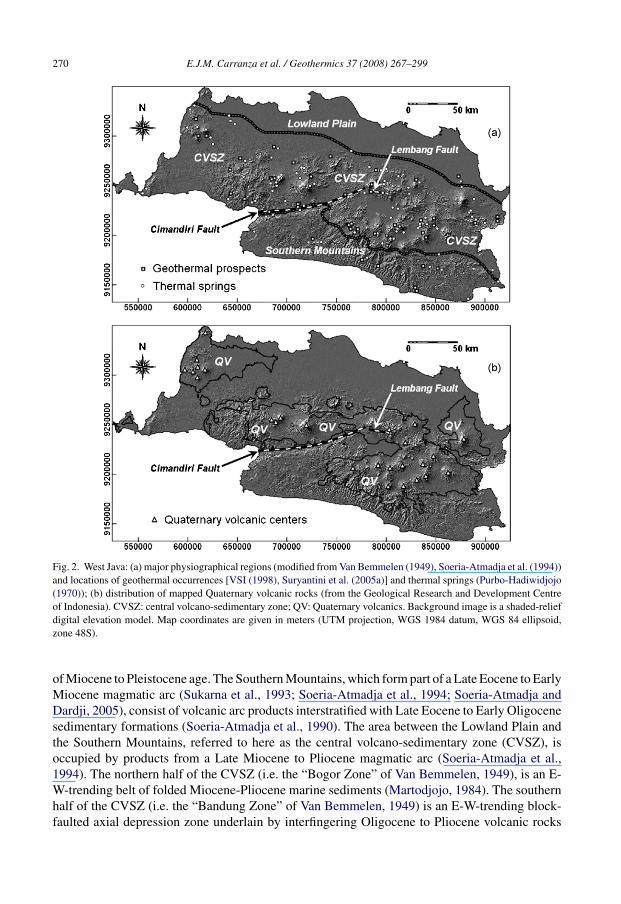
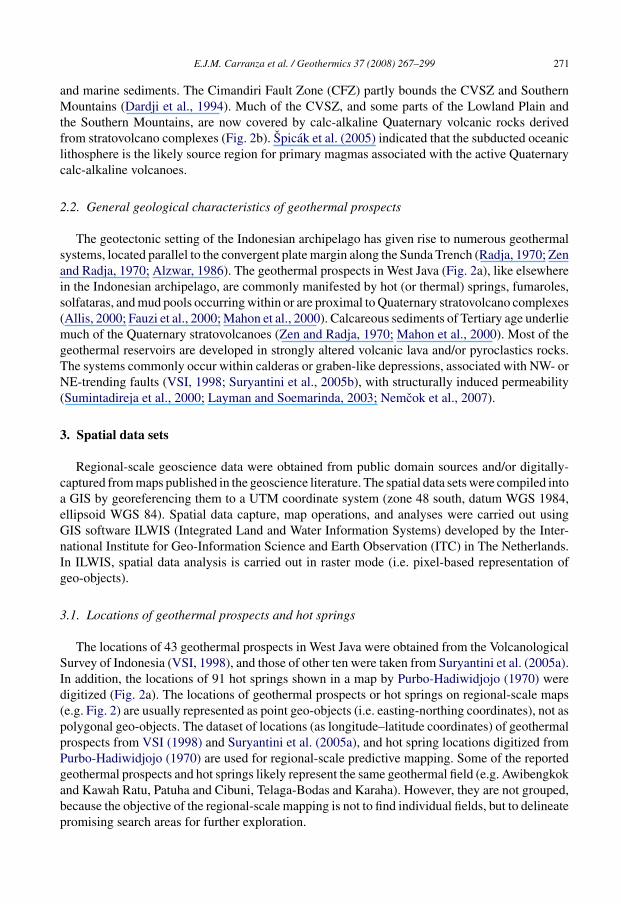
Fig. 2. West Java: (a) major physiographical regions (modified from Van Bemmelen (1949), Soeria-Atmadja et al. (1994))and locations of geothermal occurrences [VSI (1998), Suryantini et al. (2005a)] and thermal springs (Purbo-Hadiwidjojo(1970)); (b) distribution of mapped Quaternary volcanic rocks (from the Geological Research and Development Centreof Indonesia). CVSZ: central volcano-sedimentary zone; QV: Quaternary volcanics. Background image is a shaded-reliefdigital elevation model. Map coordinates are given in meters (UTM projection, WGS 1984 datum, WGS 84 ellipsoid,zone 48S).
of Miocene to Pleistocene age. The Southern Mountains, which form part of a Late Eocene to EarlyMiocene magmatic arc (Sukarna et al., 1993; Soeria-Atmadja et al., 1994; Soeria-Atmadja andDardji, 2005), consist of volcanic arc products interstratified with Late Eocene to Early Oligocenesedimentary formations (Soeria-Atmadja et al., 1990). The area between the Lowland Plain andthe Southern Mountains, referred to here as the central volcano-sedimentary zone (CVSZ), isoccupied by products from a Late Miocene to Pliocene magmatic arc (Soeria-Atmadja et al.,1994). The northern half of the CVSZ (i.e. the “Bogor Zone” of Van Bemmelen, 1949), is an E-W-trending belt of folded Miocene-Pliocene marine sediments (Martodjojo, 1984). The southernhalf of the CVSZ (i.e. the “Bandung Zone” of Van Bemmelen, 1949) is an E-W-trending block-faulted axial depression zone underlain by interfingering Oligocene to Pliocene volcanic rocks
E.J.M. Carranza et al. / Geothermics 37 (2008) 267–299 271
and marine sediments. The Cimandiri Fault Zone (CFZ) partly bounds the CVSZ and SouthernMountains (Dardji et al., 1994). Much of the CVSZ, and some parts of the Lowland Plain andthe Southern Mountains, are now covered by calc-alkaline Quaternary volcanic rocks derivedfrom stratovolcano complexes (Fig. 2b). Spicak et al. (2005) indicated that the subducted oceaniclithosphere is the likely source region for primary magmas associated with the active Quaternarycalc-alkaline volcanoes.
2.2. General geological characteristics of geothermal prospects
The geotectonic setting of the Indonesian archipelago has given rise to numerous geothermalsystems, located parallel to the convergent plate margin along the Sunda Trench (Radja, 1970; Zenand Radja, 1970; Alzwar, 1986). The geothermal prospects in West Java (Fig. 2a), like elsewherein the Indonesian archipelago, are commonly manifested by hot (or thermal) springs, fumaroles,solfataras, and mud pools occurring within or are proximal to Quaternary stratovolcano complexes(Allis, 2000; Fauzi et al., 2000; Mahon et al., 2000). Calcareous sediments of Tertiary age underliemuch of the Quaternary stratovolcanoes (Zen and Radja, 1970; Mahon et al., 2000). Most of thegeothermal reservoirs are developed in strongly altered volcanic lava and/or pyroclastics rocks.The systems commonly occur within calderas or graben-like depressions, associated with NW- orNE-trending faults (VSI, 1998; Suryantini et al., 2005b), with structurally induced permeability(Sumintadireja et al., 2000; Layman and Soemarinda, 2003; Nemcok et al., 2007).
3. Spatial data sets
Regional-scale geoscience data were obtained from public domain sources and/or digitally-captured from maps published in the geoscience literature. The spatial data sets were compiled intoa GIS by georeferencing them to a UTM coordinate system (zone 48 south, datum WGS 1984,ellipsoid WGS 84). Spatial data capture, map operations, and analyses were carried out usingGIS software ILWIS (Integrated Land and Water Information Systems) developed by the Inter-national Institute for Geo-Information Science and Earth Observation (ITC) in The Netherlands.In ILWIS, spatial data analysis is carried out in raster mode (i.e. pixel-based representation ofgeo-objects).
3.1. Locations of geothermal prospects and hot springs
The locations of 43 geothermal prospects in West Java were obtained from the VolcanologicalSurvey of Indonesia (VSI, 1998), and those of other ten were taken from Suryantini et al. (2005a).In addition, the locations of 91 hot springs shown in a map by Purbo-Hadiwidjojo (1970) weredigitized (Fig. 2a). The locations of geothermal prospects or hot springs on regional-scale maps(e.g. Fig. 2) are usually represented as point geo-objects (i.e. easting-northing coordinates), not aspolygonal geo-objects. The dataset of locations (as longitude–latitude coordinates) of geothermalprospects from VSI (1998) and Suryantini et al. (2005a), and hot spring locations digitized fromPurbo-Hadiwidjojo (1970) are used for regional-scale predictive mapping. Some of the reportedgeothermal prospects and hot springs likely represent the same geothermal field (e.g. Awibengkokand Kawah Ratu, Patuha and Cibuni, Telaga-Bodas and Karaha). However, they are not grouped,because the objective of the regional-scale mapping is not to find individual fields, but to delineatepromising search areas for further exploration.
272 E.J.M. Carranza et al. / Geothermics 37 (2008) 267–299
3.2. Mapped and remotely-sensed geological features
Various regional-scale geological features can be considered as indirect spatial indicators ofregional-scale geothermal potential. Based on the general character of geothermal prospectsin West Java, the geological features include: (1) Quaternary volcanic centers; (2) Quaternaryvolcanic rocks; and (3) regional-scale faults.
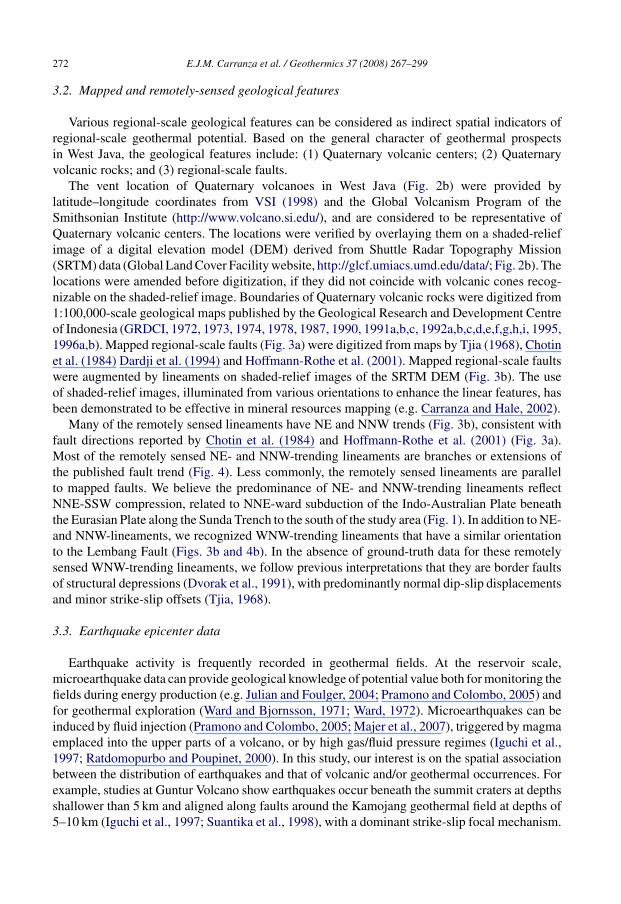
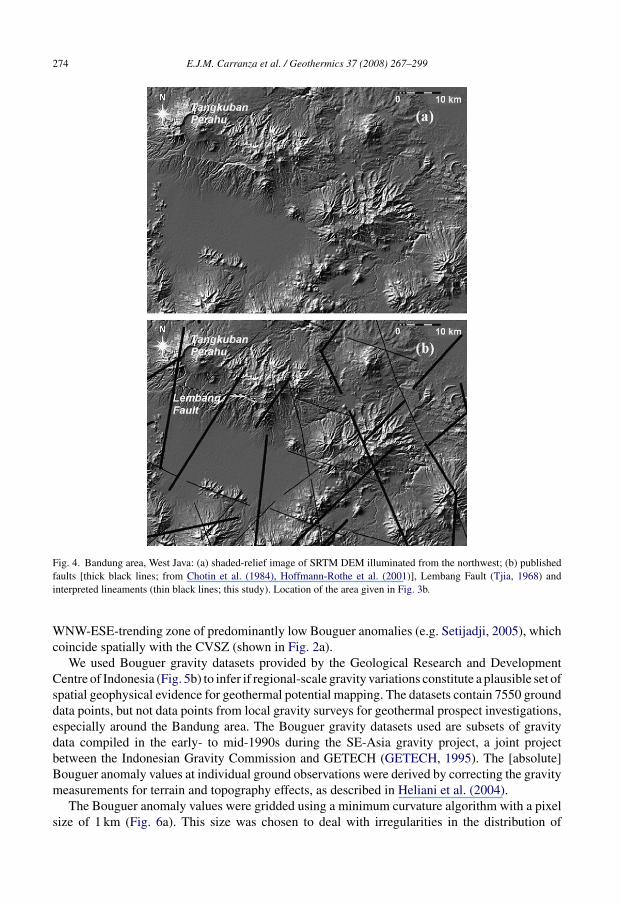
The vent location of Quaternary volcanoes in West Java (Fig. 2b) were provided bylatitude–longitude coordinates from VSI (1998) and the Global Volcanism Program of theSmithsonian Institute (http://www.volcano.si.edu/), and are considered to be representative ofQuaternary volcanic centers. The locations were verified by overlaying them on a shaded-reliefimage of a digital elevation model (DEM) derived from Shuttle Radar Topography Mission(SRTM) data (Global Land Cover Facility website, http://glcf.umiacs.umd.edu/data/; Fig. 2b). Thelocations were amended before digitization, if they did not coincide with volcanic cones recog-nizable on the shaded-relief image. Boundaries of Quaternary volcanic rocks were digitized from1:100,000-scale geological maps published by the Geological Research and Development Centreof Indonesia (GRDCI, 1972, 1973, 1974, 1978, 1987, 1990, 1991a,b,c, 1992a,b,c,d,e,f,g,h,i, 1995,1996a,b). Mapped regional-scale faults (Fig. 3a) were digitized from maps by Tjia (1968), Chotinet al. (1984) Dardji et al. (1994) and Hoffmann-Rothe et al. (2001). Mapped regional-scale faultswere augmented by lineaments on shaded-relief images of the SRTM DEM (Fig. 3b). The useof shaded-relief images, illuminated from various orientations to enhance the linear features, hasbeen demonstrated to be effective in mineral resources mapping (e.g. Carranza and Hale, 2002).
Many of the remotely sensed lineaments have NE and NNW trends (Fig. 3b), consistent withfault directions reported by Chotin et al. (1984) and Hoffmann-Rothe et al. (2001) (Fig. 3a).Most of the remotely sensed NE- and NNW-trending lineaments are branches or extensions ofthe published fault trend (Fig. 4). Less commonly, the remotely sensed lineaments are parallelto mapped faults. We believe the predominance of NE- and NNW-trending lineaments reflectNNE-SSW compression, related to NNE-ward subduction of the Indo-Australian Plate beneaththe Eurasian Plate along the Sunda Trench to the south of the study area (Fig. 1). In addition to NE-and NNW-lineaments, we recognized WNW-trending lineaments that have a similar orientationto the Lembang Fault (Figs. 3b and 4b). In the absence of ground-truth data for these remotelysensed WNW-trending lineaments, we follow previous interpretations that they are border faultsof structural depressions (Dvorak et al., 1991), with predominantly normal dip-slip displacementsand minor strike-slip offsets (Tjia, 1968).
3.3. Earthquake epicenter data
Earthquake activity is frequently recorded in geothermal fields. At the reservoir scale,microearthquake data can provide geological knowledge of potential value both for monitoring thefields during energy production (e.g. Julian and Foulger, 2004; Pramono and Colombo, 2005) andfor geothermal exploration (Ward and Bjornsson, 1971; Ward, 1972). Microearthquakes can beinduced by fluid injection (Pramono and Colombo, 2005; Majer et al., 2007), triggered by magmaemplaced into the upper parts of a volcano, or by high gas/fluid pressure regimes (Iguchi et al.,1997; Ratdomopurbo and Poupinet, 2000). In this study, our interest is on the spatial associationbetween the distribution of earthquakes and that of volcanic and/or geothermal occurrences. Forexample, studies at Guntur Volcano show earthquakes occur beneath the summit craters at depthsshallower than 5 km and aligned along faults around the Kamojang geothermal field at depths of5–10 km (Iguchi et al., 1997; Suantika et al., 1998), with a dominant strike-slip focal mechanism.
E.J.M. Carranza et al. / Geothermics 37 (2008) 267–299 273
Fig. 3. West Java: (a) regional-scale faults [from Tjia (1968), Chotin et al. (1984), Dardji et al. (1994), Hoffmann-Rotheet al. (2001)]; (b) regional-scale lineaments interpreted from shaded-relief images of the digital elevation model (DEM)derived from Shuttle Radar Topography Mission (SRTM) data. Map coordinates are given in meters (UTM projection,WGS 1984 datum, WGS 84 ellipsoid, zone 48S).
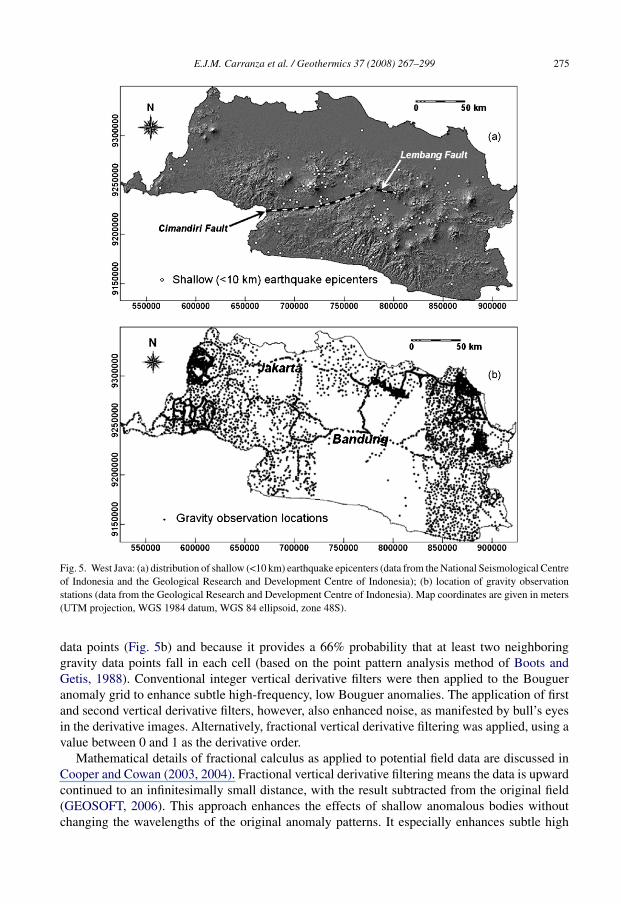
We used earthquake epicenter datasets from the Meteorological and Geophysical Agency(National Seismological Centre) and Geological Research and Development Centre of Indonesiato determine if the distribution of shallow (<10 km) earthquakes at regional-scale constitutes aplausible set of spatial geological evidence for regional-scale geothermal mapping. The datasetscontain 127 earthquake epicenters with magnitudes of 2.7–6.2 on the Richter scale, with approx-imate depths of less than 10 km (Fig. 5a).
3.4. Bouguer gravity data
Geothermal systems in West Java have variable gravity signatures (e.g. Sudarman andHochstein, 1983; VSI, 1998; Sumintadireja et al., 2000; Tripp et al., 2002; Layman andSoemarinda, 2003). At a regional-scale, however, most geothermal prospects are situated within a
274 E.J.M. Carranza et al. / Geothermics 37 (2008) 267–299
Fig. 4. Bandung area, West Java: (a) shaded-relief image of SRTM DEM illuminated from the northwest; (b) publishedfaults [thick black lines; from Chotin et al. (1984), Hoffmann-Rothe et al. (2001)], Lembang Fault (Tjia, 1968) andinterpreted lineaments (thin black lines; this study). Location of the area given in Fig. 3b.
WNW-ESE-trending zone of predominantly low Bouguer anomalies (e.g. Setijadji, 2005), whichcoincide spatially with the CVSZ (shown in Fig. 2a).
We used Bouguer gravity datasets provided by the Geological Research and DevelopmentCentre of Indonesia (Fig. 5b) to infer if regional-scale gravity variations constitute a plausible set ofspatial geophysical evidence for geothermal potential mapping. The datasets contain 7550 grounddata points, but not data points from local gravity surveys for geothermal prospect investigations,especially around the Bandung area. The Bouguer gravity datasets used are subsets of gravitydata compiled in the early- to mid-1990s during the SE-Asia gravity project, a joint projectbetween the Indonesian Gravity Commission and GETECH (GETECH, 1995). The [absolute]Bouguer anomaly values at individual ground observations were derived by correcting the gravitymeasurements for terrain and topography effects, as described in Heliani et al. (2004).
The Bouguer anomaly values were gridded using a minimum curvature algorithm with a pixelsize of 1 km (Fig. 6a). This size was chosen to deal with irregularities in the distribution of
E.J.M. Carranza et al. / Geothermics 37 (2008) 267–299 275
Fig. 5. West Java: (a) distribution of shallow (<10 km) earthquake epicenters (data from the National Seismological Centreof Indonesia and the Geological Research and Development Centre of Indonesia); (b) location of gravity observationstations (data from the Geological Research and Development Centre of Indonesia). Map coordinates are given in meters(UTM projection, WGS 1984 datum, WGS 84 ellipsoid, zone 48S).
data points (Fig. 5b) and because it provides a 66% probability that at least two neighboringgravity data points fall in each cell (based on the point pattern analysis method of Boots andGetis, 1988). Conventional integer vertical derivative filters were then applied to the Bougueranomaly grid to enhance subtle high-frequency, low Bouguer anomalies. The application of firstand second vertical derivative filters, however, also enhanced noise, as manifested by bull’s eyesin the derivative images. Alternatively, fractional vertical derivative filtering was applied, using avalue between 0 and 1 as the derivative order.
Mathematical details of fractional calculus as applied to potential field data are discussed inCooper and Cowan (2003, 2004). Fractional vertical derivative filtering means the data is upwardcontinued to an infinitesimally small distance, with the result subtracted from the original field(GEOSOFT, 2006). This approach enhances the effects of shallow anomalous bodies withoutchanging the wavelengths of the original anomaly patterns. It especially enhances subtle high
276 E.J.M. Carranza et al. / Geothermics 37 (2008) 267–299
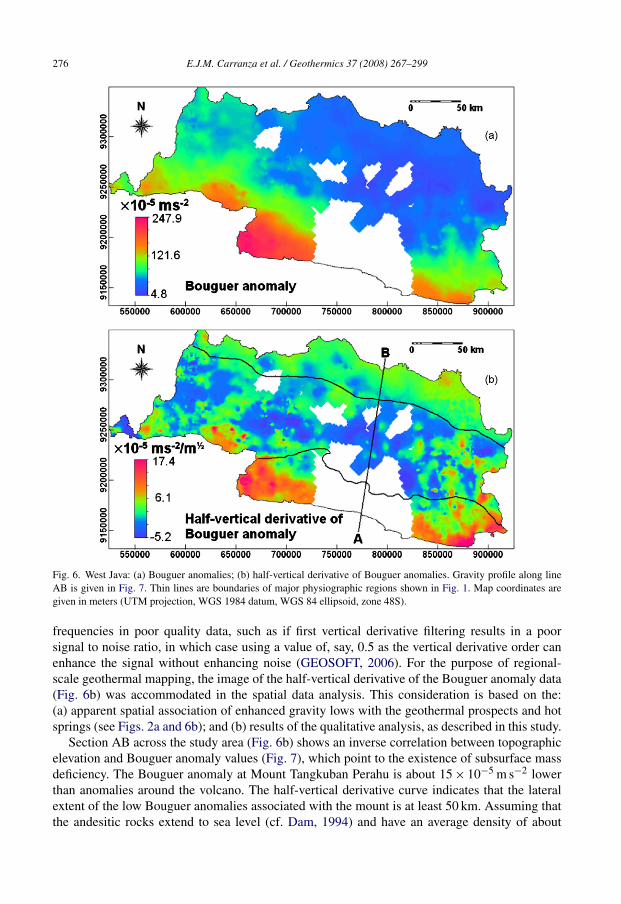
Fig. 6. West Java: (a) Bouguer anomalies; (b) half-vertical derivative of Bouguer anomalies. Gravity profile along lineAB is given in Fig. 7. Thin lines are boundaries of major physiographic regions shown in Fig. 1. Map coordinates aregiven in meters (UTM projection, WGS 1984 datum, WGS 84 ellipsoid, zone 48S).
frequencies in poor quality data, such as if first vertical derivative filtering results in a poorsignal to noise ratio, in which case using a value of, say, 0.5 as the vertical derivative order canenhance the signal without enhancing noise (GEOSOFT, 2006). For the purpose of regional-scale geothermal mapping, the image of the half-vertical derivative of the Bouguer anomaly data(Fig. 6b) was accommodated in the spatial data analysis. This consideration is based on the:(a) apparent spatial association of enhanced gravity lows with the geothermal prospects and hotsprings (see Figs. 2a and 6b); and (b) results of the qualitative analysis, as described in this study.
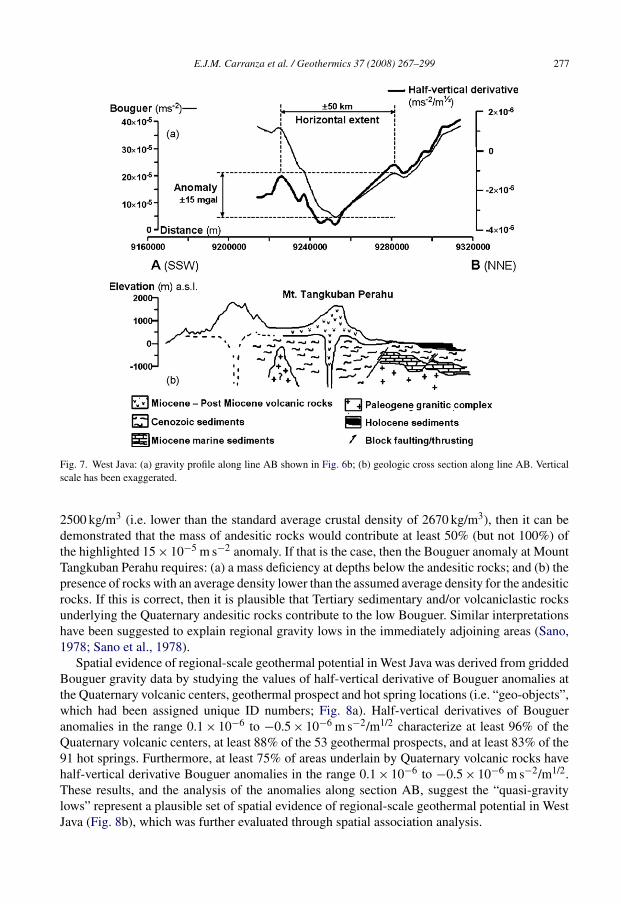
Section AB across the study area (Fig. 6b) shows an inverse correlation between topographicelevation and Bouguer anomaly values (Fig. 7), which point to the existence of subsurface massdeficiency. The Bouguer anomaly at Mount Tangkuban Perahu is about 15 × 10−5 m s−2 lowerthan anomalies around the volcano. The half-vertical derivative curve indicates that the lateralextent of the low Bouguer anomalies associated with the mount is at least 50 km. Assuming thatthe andesitic rocks extend to sea level (cf. Dam, 1994) and have an average density of about
E.J.M. Carranza et al. / Geothermics 37 (2008) 267–299 277
Fig. 7. West Java: (a) gravity profile along line AB shown in Fig. 6b; (b) geologic cross section along line AB. Verticalscale has been exaggerated.
2500 kg/m3 (i.e. lower than the standard average crustal density of 2670 kg/m3), then it can bedemonstrated that the mass of andesitic rocks would contribute at least 50% (but not 100%) ofthe highlighted 15 × 10−5 m s−2 anomaly. If that is the case, then the Bouguer anomaly at MountTangkuban Perahu requires: (a) a mass deficiency at depths below the andesitic rocks; and (b) thepresence of rocks with an average density lower than the assumed average density for the andesiticrocks. If this is correct, then it is plausible that Tertiary sedimentary and/or volcaniclastic rocksunderlying the Quaternary andesitic rocks contribute to the low Bouguer. Similar interpretationshave been suggested to explain regional gravity lows in the immediately adjoining areas (Sano,1978; Sano et al., 1978).
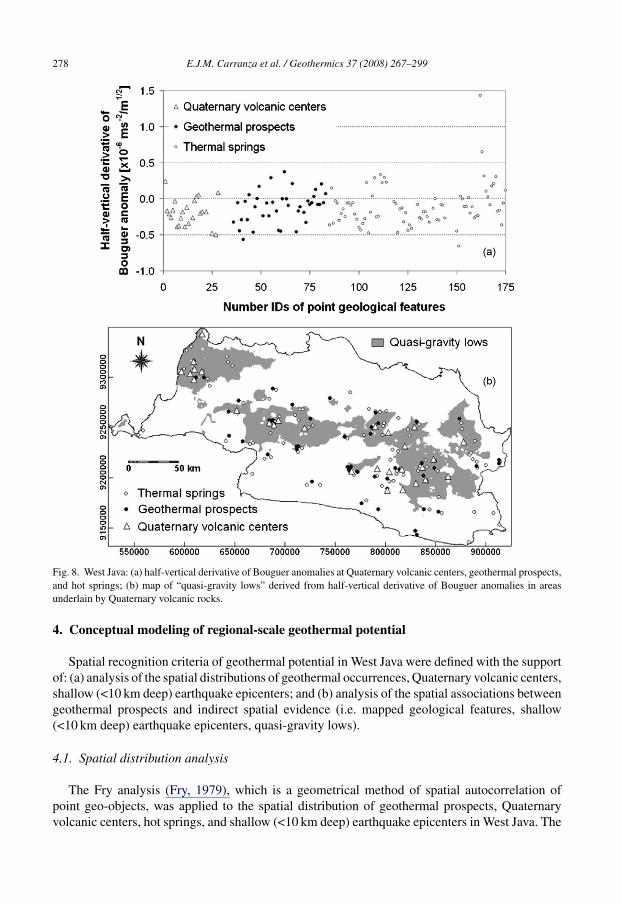
Spatial evidence of regional-scale geothermal potential in West Java was derived from griddedBouguer gravity data by studying the values of half-vertical derivative of Bouguer anomalies atthe Quaternary volcanic centers, geothermal prospect and hot spring locations (i.e. “geo-objects”,which had been assigned unique ID numbers; Fig. 8a). Half-vertical derivatives of Bougueranomalies in the range 0.1 × 10⁻⁶ to −0.5 × 10⁻⁶ m s−2/m1/2 characterize at least 96% of theQuaternary volcanic centers, at least 88% of the 53 geothermal prospects, and at least 83% of the91 hot springs. Furthermore, at least 75% of areas underlain by Quaternary volcanic rocks havehalf-vertical derivative Bouguer anomalies in the range 0.1 × 10⁻⁶ to −0.5 × 10⁻⁶ m s−2/m1/2.These results, and the analysis of the anomalies along section AB, suggest the “quasi-gravitylows” represent a plausible set of spatial evidence of regional-scale geothermal potential in WestJava (Fig. 8b), which was further evaluated through spatial association analysis.
278 E.J.M. Carranza et al. / Geothermics 37 (2008) 267–299
Fig. 8. West Java: (a) half-vertical derivative of Bouguer anomalies at Quaternary volcanic centers, geothermal prospects,and hot springs; (b) map of “quasi-gravity lows” derived from half-vertical derivative of Bouguer anomalies in areasunderlain by Quaternary volcanic rocks.
4. Conceptual modeling of regional-scale geothermal potential
Spatial recognition criteria of geothermal potential in West Java were defined with the supportof: (a) analysis of the spatial distributions of geothermal occurrences, Quaternary volcanic centers,shallow (<10 km deep) earthquake epicenters; and (b) analysis of the spatial associations betweengeothermal prospects and indirect spatial evidence (i.e. mapped geological features, shallow(<10 km deep) earthquake epicenters, quasi-gravity lows).
4.1. Spatial distribution analysis
The Fry analysis (Fry, 1979), which is a geometrical method of spatial autocorrelation ofpoint geo-objects, was applied to the spatial distribution of geothermal prospects, Quaternaryvolcanic centers, hot springs, and shallow (<10 km deep) earthquake epicenters in West Java. The
E.J.M. Carranza et al. / Geothermics 37 (2008) 267–299 279
method plots translations (so-called “Fry plots”) of point geo-objects by using each point as acenter. Vearncombe and Vearncombe (1999) describe how Fry plots can be created manually. Fora number, n, of data points there are n2–n translations, as a Fry plot enhances subtle patterns inspatial distribution of points based on distances and orientations between pairs of translated pointsrecorded from each of the point. High frequencies of orientations in a Fry plot provide a usefulinsight into the geological controls on the spatial distribution of point geo-objects (Vearncombeand Vearncombe, 1999). Analysis of a Fry plot is usually supported by rose diagrams of orien-tations and frequency of orientations between: (a) all pairs of translated points; or (b) pairs oftranslated points within specified distances from each other. For the latter case, the interest isdistance within which there is maximum probability of two neighboring point geo-objects of thesame type; this distance was determined via point pattern analysis (Boots and Getis, 1988).
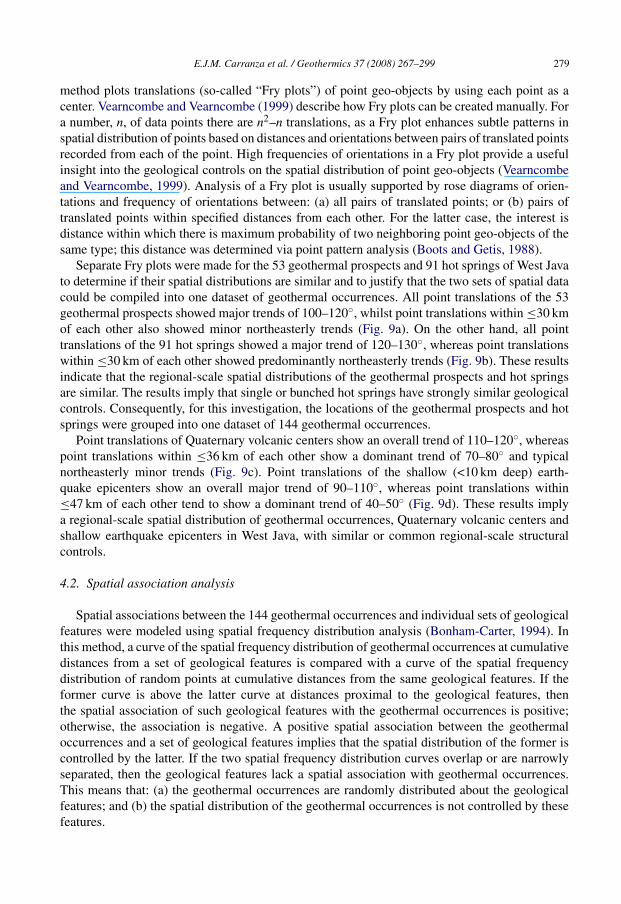
Separate Fry plots were made for the 53 geothermal prospects and 91 hot springs of West Javato determine if their spatial distributions are similar and to justify that the two sets of spatial datacould be compiled into one dataset of geothermal occurrences. All point translations of the 53geothermal prospects showed major trends of 100–120◦, whilst point translations within ≤30 kmof each other also showed minor northeasterly trends (Fig. 9a). On the other hand, all pointtranslations of the 91 hot springs showed a major trend of 120–130◦, whereas point translationswithin ≤30 km of each other showed predominantly northeasterly trends (Fig. 9b). These resultsindicate that the regional-scale spatial distributions of the geothermal prospects and hot springsare similar. The results imply that single or bunched hot springs have strongly similar geologicalcontrols. Consequently, for this investigation, the locations of the geothermal prospects and hotsprings were grouped into one dataset of 144 geothermal occurrences.
Point translations of Quaternary volcanic centers show an overall trend of 110–120◦, whereaspoint translations within ≤36 km of each other show a dominant trend of 70–80◦ and typicalnortheasterly minor trends (Fig. 9c). Point translations of the shallow (<10 km deep) earth-quake epicenters show an overall major trend of 90–110◦, whereas point translations within≤47 km of each other tend to show a dominant trend of 40–50◦ (Fig. 9d). These results implya regional-scale spatial distribution of geothermal occurrences, Quaternary volcanic centers andshallow earthquake epicenters in West Java, with similar or common regional-scale structuralcontrols.
4.2. Spatial association analysis
Spatial associations between the 144 geothermal occurrences and individual sets of geologicalfeatures were modeled using spatial frequency distribution analysis (Bonham-Carter, 1994). Inthis method, a curve of the spatial frequency distribution of geothermal occurrences at cumulativedistances from a set of geological features is compared with a curve of the spatial frequencydistribution of random points at cumulative distances from the same geological features. If theformer curve is above the latter curve at distances proximal to the geological features, thenthe spatial association of such geological features with the geothermal occurrences is positive;otherwise, the association is negative. A positive spatial association between the geothermaloccurrences and a set of geological features implies that the spatial distribution of the former iscontrolled by the latter. If the two spatial frequency distribution curves overlap or are narrowlyseparated, then the geological features lack a spatial association with geothermal occurrences.This means that: (a) the geothermal occurrences are randomly distributed about the geologicalfeatures; and (b) the spatial distribution of the geothermal occurrences is not controlled by thesefeatures.
280E
.J.M.C
arranzaetal./G
eothermics
37(2008)
267–299
Fig. 9. West Java: Fry plots of (a) geothermal prospects, (b), thermal springs, (c) Quaternary volcanic centers, and (d) shallow (<10 km deep) earthquake epicenters.
E.J.M. Carranza et al. / Geothermics 37 (2008) 267–299 281
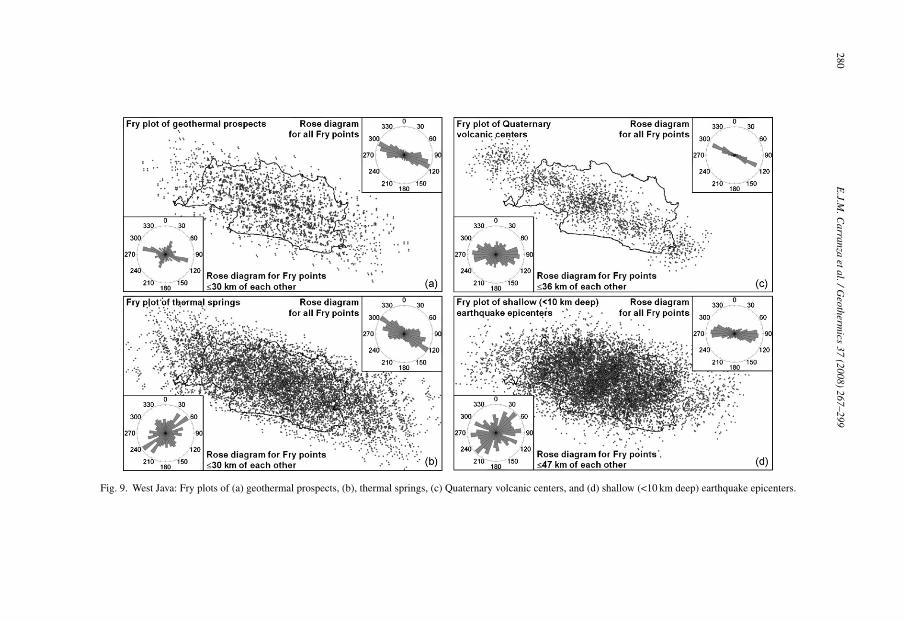
Fig. 10. West Java: cumulative spatial frequency distributions of random points and geothermal occurrences near (a)Quaternary volcanic centers, (b) Quaternary volcanic rocks, (c) shallow (<10 km deep) earthquake epicenters, and (d)quasi-gravity lows.
The distance at which the difference between the two spatial frequency distribution curves isgreatest represents the distance of optimum spatial association between the geothermal occur-rences and the geological features. The strength of the spatial association is proportional to thedegree of separation between the two spatial frequency distribution curves; that is, the greater theseparation the stronger the spatial association. The strength of the positive (or negative) spatialassociation is also inversely proportional to the distance of the optimum positive (or negative)spatial association. Only features having strong positive spatial associations with the geothermaloccurrences provide spatial recognition criteria of regional-scale geothermal potential. The quan-tified spatial associations between the geothermal occurrences and individual sets of geologicalfeatures are illustrated in Figs. 10–12.
The Quaternary volcanic centers have a strong positive spatial association with the geother-mal occurrences. At distances up to about 15 km from the Quaternary volcanic centers, there isapproximately a 30% higher frequency of geothermal occurrences than would be expected due tochance (Fig. 10a). The Quaternary volcanic rocks also have a strong positive spatial associationwith the geothermal occurrences. At distances up to about 3 km from the Quaternary volcanicrocks, there is approximately a 30% higher frequency of geothermal occurrences than would beexpected due to chance (Fig. 10b). However, the shallow (<10 km deep) earthquake epicenters lacka spatial association with the geothermal prospects. About 30% of the geothermal occurrences aredistributed randomly within 10 km of the shallow earthquake epicenters, whereas about 70% arelocated approximately 15 km away (Fig. 10c). Areas of quasi-gravity lows have a strong positivespatial association with the geothermal occurrences. At distances up to about 5 km from areas
282 E.J.M. Carranza et al. / Geothermics 37 (2008) 267–299
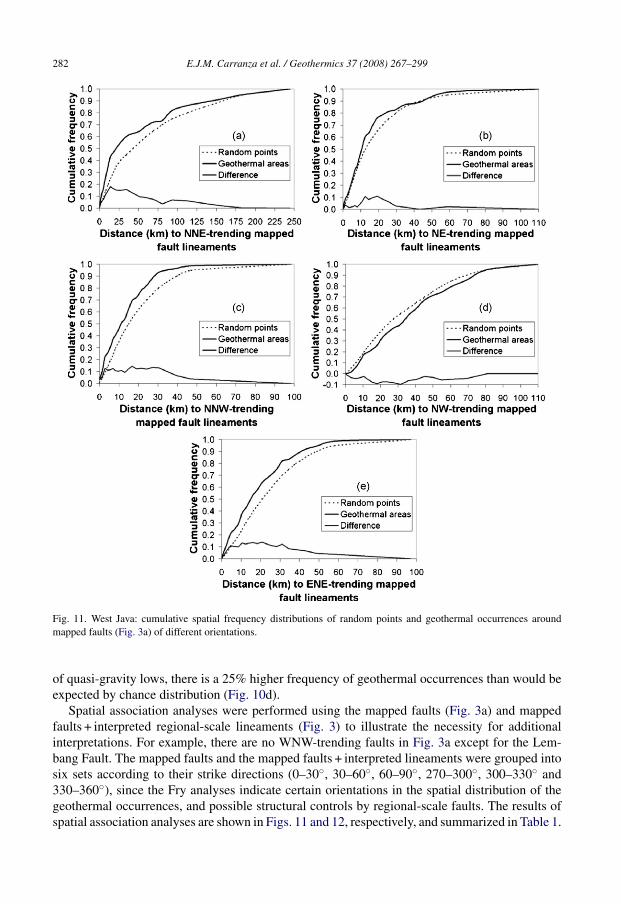
Fig. 11. West Java: cumulative spatial frequency distributions of random points and geothermal occurrences aroundmapped faults (Fig. 3a) of different orientations.
of quasi-gravity lows, there is a 25% higher frequency of geothermal occurrences than would beexpected by chance distribution (Fig. 10d).
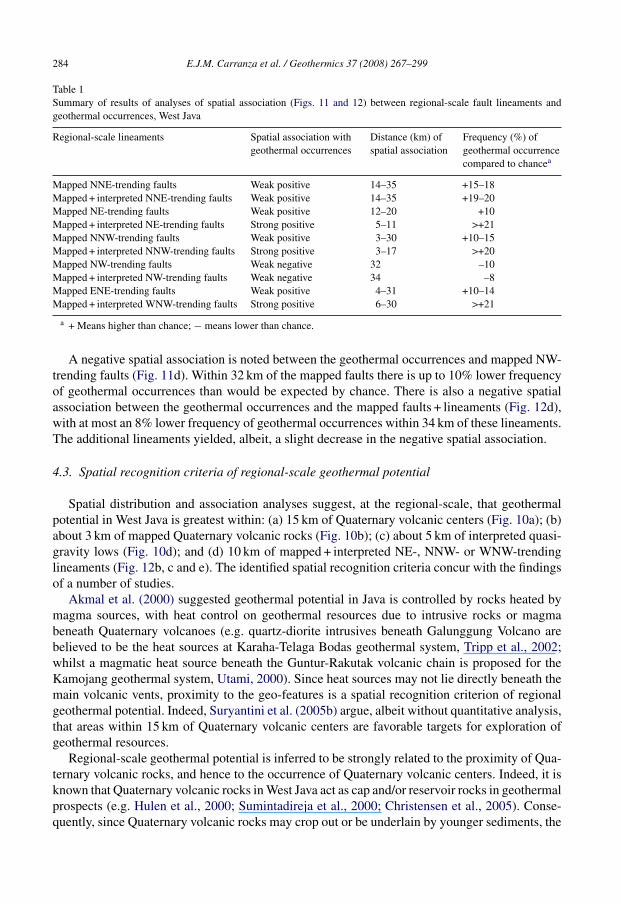
Spatial association analyses were performed using the mapped faults (Fig. 3a) and mappedfaults + interpreted regional-scale lineaments (Fig. 3) to illustrate the necessity for additionalinterpretations. For example, there are no WNW-trending faults in Fig. 3a except for the Lem-bang Fault. The mapped faults and the mapped faults + interpreted lineaments were grouped intosix sets according to their strike directions (0–30◦, 30–60◦, 60–90◦, 270–300◦, 300–330◦ and330–360◦), since the Fry analyses indicate certain orientations in the spatial distribution of thegeothermal occurrences, and possible structural controls by regional-scale faults. The results ofspatial association analyses are shown in Figs. 11 and 12, respectively, and summarized in Table 1.
E.J.M. Carranza et al. / Geothermics 37 (2008) 267–299 283
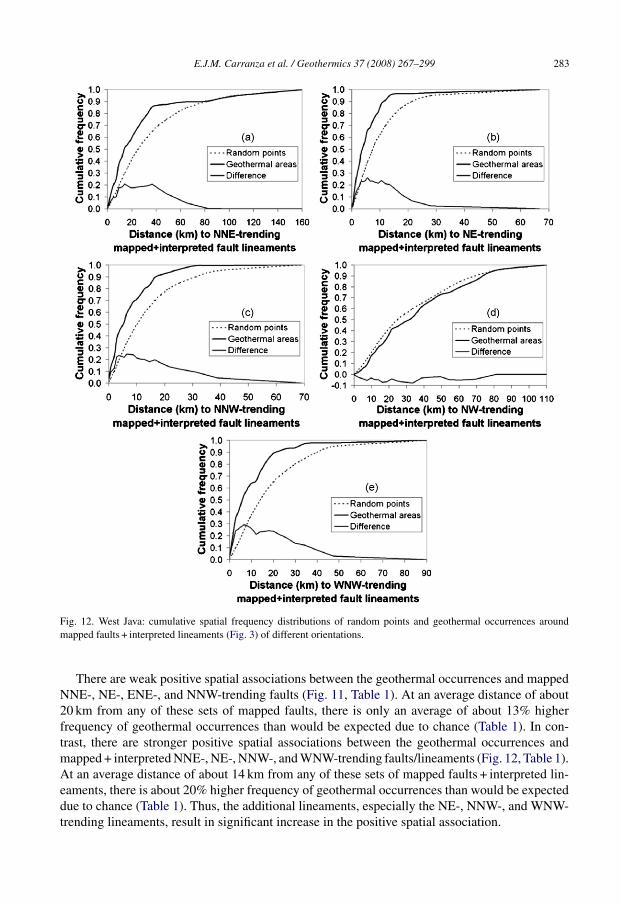
Fig. 12. West Java: cumulative spatial frequency distributions of random points and geothermal occurrences aroundmapped faults + interpreted lineaments (Fig. 3) of different orientations.
There are weak positive spatial associations between the geothermal occurrences and mappedNNE-, NE-, ENE-, and NNW-trending faults (Fig. 11, Table 1). At an average distance of about20 km from any of these sets of mapped faults, there is only an average of about 13% higherfrequency of geothermal occurrences than would be expected due to chance (Table 1). In con-trast, there are stronger positive spatial associations between the geothermal occurrences andmapped + interpreted NNE-, NE-, NNW-, and WNW-trending faults/lineaments (Fig. 12, Table 1).At an average distance of about 14 km from any of these sets of mapped faults + interpreted lin-eaments, there is about 20% higher frequency of geothermal occurrences than would be expecteddue to chance (Table 1). Thus, the additional lineaments, especially the NE-, NNW-, and WNW-trending lineaments, result in significant increase in the positive spatial association.
284 E.J.M. Carranza et al. / Geothermics 37 (2008) 267–299
Table 1Summary of results of analyses of spatial association (Figs. 11 and 12) between regional-scale fault lineaments andgeothermal occurrences, West Java
Regional-scale lineaments Spatial association withgeothermal occurrences
Distance (km) ofspatial association
Frequency (%) ofgeothermal occurrencecompared to chancea
Mapped NNE-trending faults Weak positive 14–35 +15–18Mapped + interpreted NNE-trending faults Weak positive 14–35 +19–20Mapped NE-trending faults Weak positive 12–20 +10Mapped + interpreted NE-trending faults Strong positive 5–11 >+21Mapped NNW-trending faults Weak positive 3–30 +10–15Mapped + interpreted NNW-trending faults Strong positive 3–17 >+20Mapped NW-trending faults Weak negative 32 –10Mapped + interpreted NW-trending faults Weak negative 34 –8Mapped ENE-trending faults Weak positive 4–31 +10–14Mapped + interpreted WNW-trending faults Strong positive 6–30 >+21
a + Means higher than chance; − means lower than chance.
A negative spatial association is noted between the geothermal occurrences and mapped NW-trending faults (Fig. 11d). Within 32 km of the mapped faults there is up to 10% lower frequencyof geothermal occurrences than would be expected by chance. There is also a negative spatialassociation between the geothermal occurrences and the mapped faults + lineaments (Fig. 12d),with at most an 8% lower frequency of geothermal occurrences within 34 km of these lineaments.The additional lineaments yielded, albeit, a slight decrease in the negative spatial association.
4.3. Spatial recognition criteria of regional-scale geothermal potential
Spatial distribution and association analyses suggest, at the regional-scale, that geothermalpotential in West Java is greatest within: (a) 15 km of Quaternary volcanic centers (Fig. 10a); (b)about 3 km of mapped Quaternary volcanic rocks (Fig. 10b); (c) about 5 km of interpreted quasi-gravity lows (Fig. 10d); and (d) 10 km of mapped + interpreted NE-, NNW- or WNW-trendinglineaments (Fig. 12b, c and e). The identified spatial recognition criteria concur with the findingsof a number of studies.
Akmal et al. (2000) suggested geothermal potential in Java is controlled by rocks heated bymagma sources, with heat control on geothermal resources due to intrusive rocks or magmabeneath Quaternary volcanoes (e.g. quartz-diorite intrusives beneath Galunggung Volcano arebelieved to be the heat sources at Karaha-Telaga Bodas geothermal system, Tripp et al., 2002;whilst a magmatic heat source beneath the Guntur-Rakutak volcanic chain is proposed for theKamojang geothermal system, Utami, 2000). Since heat sources may not lie directly beneath themain volcanic vents, proximity to the geo-features is a spatial recognition criterion of regionalgeothermal potential. Indeed, Suryantini et al. (2005b) argue, albeit without quantitative analysis,that areas within 15 km of Quaternary volcanic centers are favorable targets for exploration ofgeothermal resources.
Regional-scale geothermal potential is inferred to be strongly related to the proximity of Qua-ternary volcanic rocks, and hence to the occurrence of Quaternary volcanic centers. Indeed, it isknown that Quaternary volcanic rocks in West Java act as cap and/or reservoir rocks in geothermalprospects (e.g. Hulen et al., 2000; Sumintadireja et al., 2000; Christensen et al., 2005). Conse-quently, since Quaternary volcanic rocks may crop out or be underlain by younger sediments, the
E.J.M. Carranza et al. / Geothermics 37 (2008) 267–299 285
presence and/or proximity to such lithologies should constitute a spatial recognition criterion ofregional-scale geothermal potential.
The relationship between regional-scale geothermal potential and proximity to quasi-gravitylows in Quaternary volcanic areas has been recognised in many volcanic-hosted geothermal sys-tems (e.g. Pakiser, 1964; Green and Cook, 1981; Blank et al., 1998; Sepulveda et al., 2005) and isa factor to establish geothermal potential in West Java. The quasi-gravity lows in Quaternaryvolcanic areas in West Java are likely due to thick accumulation of low-density sedimen-tary/volcaniclastic deposits in calderas, and/or presence of silicic intrusive rocks. It is known thatsome geothermal areas in West Java are associated with caldera or graben-like structures (VSI,1998; Suryantini et al., 2005b), which are filled by Quaternary volcanic deposits, and underlainby Tertiary sedimentary and volcaniclastic rocks (Zen and Radja, 1970; Mahon et al., 2000).Whilst Quaternary volcanic rocks in West Java are mainly basaltic to andesitic in composition,silicic intrusive complexes are present in places (e.g. Awibengkok geothermal system, Hulen etal., 2000; Stimac and Sugiaman, 2000). Although geothermal occurrences may not occur directlyabove low-density reservoir rocks and/or silicic heat sources, the proximity to quasi-gravity lowsin Quaternary volcanic areas clearly constitutes a spatial recognition criterion of regional-scalegeothermal potential.
The proximity to mapped + interpreted NE-trending regional-scale fault lineaments is a stronggeothermal potential indicator, and is exemplified at Darajat (Whittome and Salveson, 1990;Pramono and Colombo, 2005), Cisolok (VSI, 1998) and Awibengkok (Stimac and Sugiaman,2000). In these geothermal occurrences, NE-trending faults have mostly strike-slip displace-ments. However, due to ∼10◦ angle of obliquity between the Java Arc and subduction along theSunda Trench (Malod et al., 1995), NE-trending conjugate strike-slip faults are potentially moreimportant for the development of structural permeability in reservoir rocks than NNE-trendingstrike-slip faults (Bogie, 2000).
The association between regional-scale geothermal potential and proximity to NNW-trendingregional fault lineaments is exemplified in Kamojang (Utami, 2000), Karang (VSI, 1998) andKaraha-Telaga Bodas (Nemcok et al., 2007). In these geothermal occurrences, NNW-trendingfaults have mostly normal dip-slip displacements, and are either conjugate to NE-trending strike-slip faults (e.g. Nemcok et al., 2001), or border faults of calderas or graben-like depressions(e.g. Milesi et al., 1999). Good examples of the relationship between regional-scale geothermalpotential and proximity to WNW-trending regional-scale fault lineaments are Tangkuban Perahu(Nasution et al., 2004) and Subang (VSI, 1998). In such occurrences, WNW-trending faults havemostly normal dip-slip displacements, and also border calderas or graben-like depressions (e.g.Dvorak et al., 1991). In both cases, NNW- and WNW-trending regional-scale fault lineaments pro-vide structural permeability and are important to regional-scale geothermal potential in West Java.
The proposition regional-scale geothermal potential is poorly correlated to the proximity ofshallow (<10 km deep) earthquake epicenters and regional seismicity is consistent with otherstudies (e.g. Evison et al., 1976; Ehara, 1987; Bodri and Iizuka, 1993; Bryan et al., 1999). However,the negative result for the shallow earthquake epicenter dataset could be due to poor or incompletedata, and warrant further investigation.
5. Predictive mapping of regional-scale geothermal potential
The availability of training data (i.e. locations of known geothermal occurrences) allows theapplication of data-driven methods for regional-scale geothermal potential mapping in West Java.There are several data-driven methods that can be utilized. Methods based on Bayesian probability
286 E.J.M. Carranza et al. / Geothermics 37 (2008) 267–299
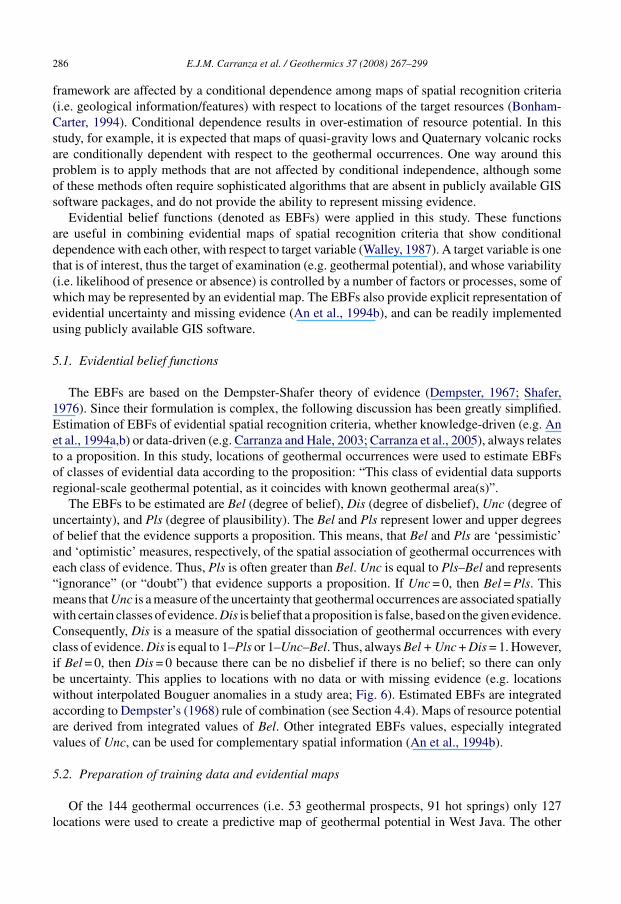
framework are affected by a conditional dependence among maps of spatial recognition criteria(i.e. geological information/features) with respect to locations of the target resources (Bonham-Carter, 1994). Conditional dependence results in over-estimation of resource potential. In thisstudy, for example, it is expected that maps of quasi-gravity lows and Quaternary volcanic rocksare conditionally dependent with respect to the geothermal occurrences. One way around thisproblem is to apply methods that are not affected by conditional independence, although someof these methods often require sophisticated algorithms that are absent in publicly available GISsoftware packages, and do not provide the ability to represent missing evidence.
Evidential belief functions (denoted as EBFs) were applied in this study. These functionsare useful in combining evidential maps of spatial recognition criteria that show conditionaldependence with each other, with respect to target variable (Walley, 1987). A target variable is onethat is of interest, thus the target of examination (e.g. geothermal potential), and whose variability(i.e. likelihood of presence or absence) is controlled by a number of factors or processes, some ofwhich may be represented by an evidential map. The EBFs also provide explicit representation ofevidential uncertainty and missing evidence (An et al., 1994b), and can be readily implementedusing publicly available GIS software.
5.1. Evidential belief functions
The EBFs are based on the Dempster-Shafer theory of evidence (Dempster, 1967; Shafer,1976). Since their formulation is complex, the following discussion has been greatly simplified.Estimation of EBFs of evidential spatial recognition criteria, whether knowledge-driven (e.g. Anet al., 1994a,b) or data-driven (e.g. Carranza and Hale, 2003; Carranza et al., 2005), always relatesto a proposition. In this study, locations of geothermal occurrences were used to estimate EBFsof classes of evidential data according to the proposition: “This class of evidential data supportsregional-scale geothermal potential, as it coincides with known geothermal area(s)”.
The EBFs to be estimated are Bel (degree of belief), Dis (degree of disbelief), Unc (degree ofuncertainty), and Pls (degree of plausibility). The Bel and Pls represent lower and upper degreesof belief that the evidence supports a proposition. This means, that Bel and Pls are ‘pessimistic’and ‘optimistic’ measures, respectively, of the spatial association of geothermal occurrences witheach class of evidence. Thus, Pls is often greater than Bel. Unc is equal to Pls–Bel and represents“ignorance” (or “doubt”) that evidence supports a proposition. If Unc = 0, then Bel = Pls. Thismeans that Unc is a measure of the uncertainty that geothermal occurrences are associated spatiallywith certain classes of evidence. Dis is belief that a proposition is false, based on the given evidence.Consequently, Dis is a measure of the spatial dissociation of geothermal occurrences with everyclass of evidence. Dis is equal to 1–Pls or 1–Unc–Bel. Thus, always Bel + Unc + Dis = 1. However,if Bel = 0, then Dis = 0 because there can be no disbelief if there is no belief; so there can onlybe uncertainty. This applies to locations with no data or with missing evidence (e.g. locationswithout interpolated Bouguer anomalies in a study area; Fig. 6). Estimated EBFs are integratedaccording to Dempster’s (1968) rule of combination (see Section 4.4). Maps of resource potentialare derived from integrated values of Bel. Other integrated EBFs values, especially integratedvalues of Unc, can be used for complementary spatial information (An et al., 1994b).
5.2. Preparation of training data and evidential maps
Of the 144 geothermal occurrences (i.e. 53 geothermal prospects, 91 hot springs) only 127locations were used to create a predictive map of geothermal potential in West Java. The other
E.J.M. Carranza et al. / Geothermics 37 (2008) 267–299 287
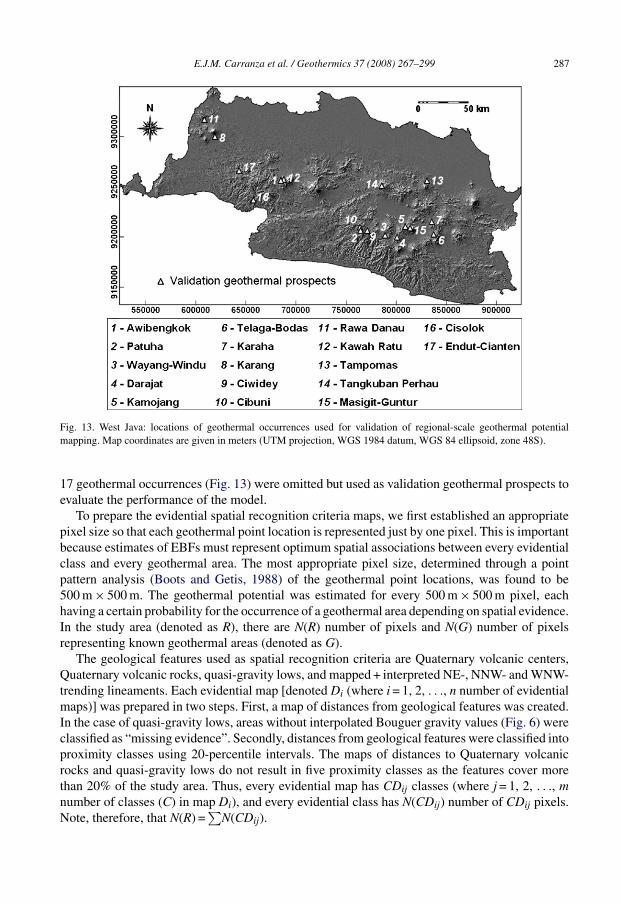
Fig. 13. West Java: locations of geothermal occurrences used for validation of regional-scale geothermal potentialmapping. Map coordinates are given in meters (UTM projection, WGS 1984 datum, WGS 84 ellipsoid, zone 48S).
17 geothermal occurrences (Fig. 13) were omitted but used as validation geothermal prospects toevaluate the performance of the model.
To prepare the evidential spatial recognition criteria maps, we first established an appropriatepixel size so that each geothermal point location is represented just by one pixel. This is importantbecause estimates of EBFs must represent optimum spatial associations between every evidentialclass and every geothermal area. The most appropriate pixel size, determined through a pointpattern analysis (Boots and Getis, 1988) of the geothermal point locations, was found to be500 m × 500 m. The geothermal potential was estimated for every 500 m × 500 m pixel, eachhaving a certain probability for the occurrence of a geothermal area depending on spatial evidence.In the study area (denoted as R), there are N(R) number of pixels and N(G) number of pixelsrepresenting known geothermal areas (denoted as G).
The geological features used as spatial recognition criteria are Quaternary volcanic centers,Quaternary volcanic rocks, quasi-gravity lows, and mapped + interpreted NE-, NNW- and WNW-trending lineaments. Each evidential map [denoted Di (where i = 1, 2, . . ., n number of evidentialmaps)] was prepared in two steps. First, a map of distances from geological features was created.In the case of quasi-gravity lows, areas without interpolated Bouguer gravity values (Fig. 6) wereclassified as “missing evidence”. Secondly, distances from geological features were classified intoproximity classes using 20-percentile intervals. The maps of distances to Quaternary volcanicrocks and quasi-gravity lows do not result in five proximity classes as the features cover morethan 20% of the study area. Thus, every evidential map has CDij classes (where j = 1, 2, . . ., mnumber of classes (C) in map Di), and every evidential class has N(CDij) number of CDij pixels.Note, therefore, that N(R) =
∑N(CDij).
288 E.J.M. Carranza et al. / Geothermics 37 (2008) 267–299
5.3. Estimation of EBFs of evidential classes
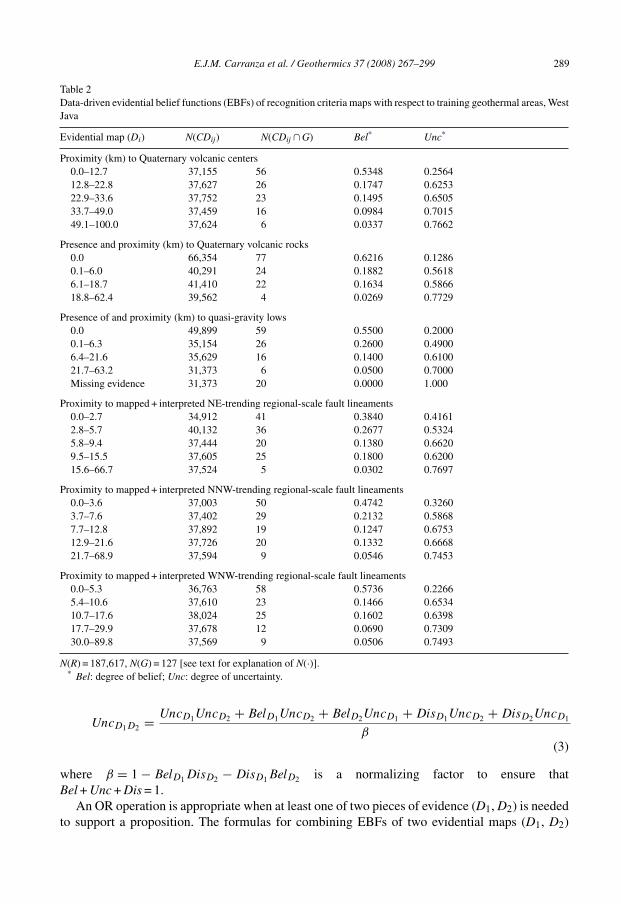
The geothermal occurrences (G) were overlain on each evidential map to determine the num-ber of pixels in CDij that contain G [i.e. N(CDij ∩ G)] and the number pixels in CDij that donot contain G [i.e. N(CDij) − N(Cij ∩ G)]. The N() parameters [i.e. N(R), N(CDij), N(CDij ∩ G),and N(CDij) − N(Cij ∩ G)] were then used for data-driven estimations of EBFs. Equations forGIS-based data-driven estimation of EBFs can be found in Carranza and Hale (2003) andCarranza et al. (2005). For areas with missing evidence, both Bel and Dis are set to 0, andUnc is set to 1. Data-driven estimates of Bel and Unc for every evidential class are given inTable 2.
Values of Bel and Unc are much higher and lower, respectively, within 12.7 km of Quaternaryvolcanic centers than at greater distances. This fact points to the spatial distributions of Quaternaryvolcanoes and geothermal occurrences in West Java having similar heat sources.
Values of Bel and Unc are higher and lower, respectively, in areas where Quaternary volcanicrocks have been mapped, than in areas where volcanic rocks are not shown on regional geologicalmaps. This result suggests that Quaternary volcanic rocks in West Java are potential geothermalreservoir or cap rocks. Furthermore, values of Bel and Unc are intermediate but are higher andlower, respectively, within 18.7 km of Quaternary volcanic rocks than at greater distances. Thisimplies that these areas may be underlain by volcanic rocks, even though they are not shown onthe regional maps.
Values of Bel and Unc are highest and lowest, respectively, within the quasi-gravity lows.Tertiary sedimentary and/or volcaniclastic rocks underlying Quaternary volcanics are plausiblesources of quasi-gravity lows, and quasi-gravity lows in areas of Quaternary volcanic rocks maybe underlain by potential reservoir rocks. Values of Bel and Unc are intermediate but, respectively,higher and lower within 6.3 km of quasi-gravity lows than at greater distances. This suggests areaswithin 6.3 km of quasi-gravity lows are plausibly underlain by potential geothermal reservoirrocks.
Values of Bel and Unc are highest and lowest within: a) 5.7 km of the NE-lineaments; b) 7.6 kmof the NNW-trending lineaments; and c) 5.3 km of the WNW-trending lineaments. The resultssuggest that areas within 8 km of NE-, NNW- or WNW-trending lineaments may contain rockswith enhanced structural permeability, favorable for the circulation of thermal fluids.
5.4. Integration of EBFs of evidential maps
Estimated EBFs were tabulated, and used to create EBFs maps for each evidential map (Di).According to Dempster’s (1968) rule of combination, only two EBFs evidential maps can beintegrated at a time. Dempster’s (1968) rule can be implemented using either AND or OR operation(An et al., 1994a).
An AND operation is appropriate when two pieces of evidence (D1, D2) are needed to supporta proposition. The formulas for combining EBFs of two evidential maps (D1, D2) according toan AND operation are:
BelD1D2 = BelD1BelD2
β(1)
DisD1D2 = DisD1DisD2
β(2)
E.J.M. Carranza et al. / Geothermics 37 (2008) 267–299 289
Table 2Data-driven evidential belief functions (EBFs) of recognition criteria maps with respect to training geothermal areas, WestJava
Evidential map (Di) N(CDij) N(CDij ∩ G) Bel* Unc*
Proximity (km) to Quaternary volcanic centers0.0–12.7 37,155 56 0.5348 0.256412.8–22.8 37,627 26 0.1747 0.625322.9–33.6 37,752 23 0.1495 0.650533.7–49.0 37,459 16 0.0984 0.701549.1–100.0 37,624 6 0.0337 0.7662
Presence and proximity (km) to Quaternary volcanic rocks0.0 66,354 77 0.6216 0.12860.1–6.0 40,291 24 0.1882 0.56186.1–18.7 41,410 22 0.1634 0.586618.8–62.4 39,562 4 0.0269 0.7729
Presence of and proximity (km) to quasi-gravity lows0.0 49,899 59 0.5500 0.20000.1–6.3 35,154 26 0.2600 0.49006.4–21.6 35,629 16 0.1400 0.610021.7–63.2 31,373 6 0.0500 0.7000Missing evidence 31,373 20 0.0000 1.000
Proximity to mapped + interpreted NE-trending regional-scale fault lineaments0.0–2.7 34,912 41 0.3840 0.41612.8–5.7 40,132 36 0.2677 0.53245.8–9.4 37,444 20 0.1380 0.66209.5–15.5 37,605 25 0.1800 0.620015.6–66.7 37,524 5 0.0302 0.7697
Proximity to mapped + interpreted NNW-trending regional-scale fault lineaments0.0–3.6 37,003 50 0.4742 0.32603.7–7.6 37,402 29 0.2132 0.58687.7–12.8 37,892 19 0.1247 0.675312.9–21.6 37,726 20 0.1332 0.666821.7–68.9 37,594 9 0.0546 0.7453
Proximity to mapped + interpreted WNW-trending regional-scale fault lineaments0.0–5.3 36,763 58 0.5736 0.22665.4–10.6 37,610 23 0.1466 0.653410.7–17.6 38,024 25 0.1602 0.639817.7–29.9 37,678 12 0.0690 0.730930.0–89.8 37,569 9 0.0506 0.7493
N(R) = 187,617, N(G) = 127 [see text for explanation of N(·)].* Bel: degree of belief; Unc: degree of uncertainty.
UncD1D2 = UncD1UncD2 + BelD1UncD2 + BelD2UncD1 + DisD1UncD2 + DisD2UncD1
β(3)
where β = 1 − BelD1DisD2 − DisD1BelD2 is a normalizing factor to ensure thatBel + Unc + Dis = 1.
An OR operation is appropriate when at least one of two pieces of evidence (D1, D2) is neededto support a proposition. The formulas for combining EBFs of two evidential maps (D1, D2)
290 E.J.M. Carranza et al. / Geothermics 37 (2008) 267–299
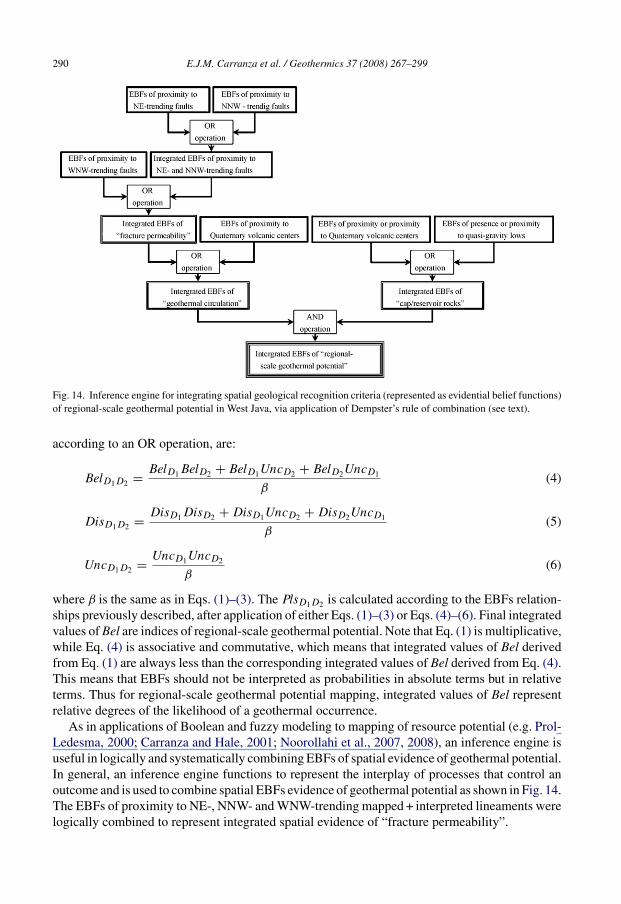
Fig. 14. Inference engine for integrating spatial geological recognition criteria (represented as evidential belief functions)of regional-scale geothermal potential in West Java, via application of Dempster’s rule of combination (see text).
according to an OR operation, are:
BelD1D2 = BelD1BelD2 + BelD1UncD2 + BelD2UncD1
β(4)
DisD1D2 = DisD1DisD2 + DisD1UncD2 + DisD2UncD1
β(5)
UncD1D2 = UncD1UncD2
β(6)
where β is the same as in Eqs. (1)–(3). The PlsD1D2 is calculated according to the EBFs relation-ships previously described, after application of either Eqs. (1)–(3) or Eqs. (4)–(6). Final integratedvalues of Bel are indices of regional-scale geothermal potential. Note that Eq. (1) is multiplicative,while Eq. (4) is associative and commutative, which means that integrated values of Bel derivedfrom Eq. (1) are always less than the corresponding integrated values of Bel derived from Eq. (4).This means that EBFs should not be interpreted as probabilities in absolute terms but in relativeterms. Thus for regional-scale geothermal potential mapping, integrated values of Bel representrelative degrees of the likelihood of a geothermal occurrence.
As in applications of Boolean and fuzzy modeling to mapping of resource potential (e.g. Prol-Ledesma, 2000; Carranza and Hale, 2001; Noorollahi et al., 2007, 2008), an inference engine isuseful in logically and systematically combining EBFs of spatial evidence of geothermal potential.In general, an inference engine functions to represent the interplay of processes that control anoutcome and is used to combine spatial EBFs evidence of geothermal potential as shown in Fig. 14.The EBFs of proximity to NE-, NNW- and WNW-trending mapped + interpreted lineaments werelogically combined to represent integrated spatial evidence of “fracture permeability”.
E.J.M. Carranza et al. / Geothermics 37 (2008) 267–299 291
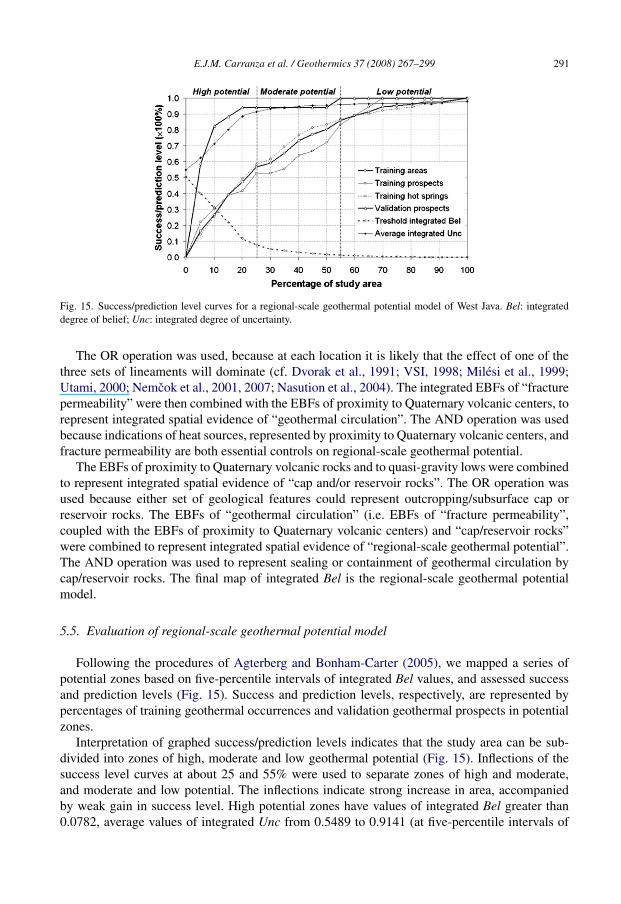
Fig. 15. Success/prediction level curves for a regional-scale geothermal potential model of West Java. Bel: integrateddegree of belief; Unc: integrated degree of uncertainty.
The OR operation was used, because at each location it is likely that the effect of one of thethree sets of lineaments will dominate (cf. Dvorak et al., 1991; VSI, 1998; Milesi et al., 1999;Utami, 2000; Nemcok et al., 2001, 2007; Nasution et al., 2004). The integrated EBFs of “fracturepermeability” were then combined with the EBFs of proximity to Quaternary volcanic centers, torepresent integrated spatial evidence of “geothermal circulation”. The AND operation was usedbecause indications of heat sources, represented by proximity to Quaternary volcanic centers, andfracture permeability are both essential controls on regional-scale geothermal potential.
The EBFs of proximity to Quaternary volcanic rocks and to quasi-gravity lows were combinedto represent integrated spatial evidence of “cap and/or reservoir rocks”. The OR operation wasused because either set of geological features could represent outcropping/subsurface cap orreservoir rocks. The EBFs of “geothermal circulation” (i.e. EBFs of “fracture permeability”,coupled with the EBFs of proximity to Quaternary volcanic centers) and “cap/reservoir rocks”were combined to represent integrated spatial evidence of “regional-scale geothermal potential”.The AND operation was used to represent sealing or containment of geothermal circulation bycap/reservoir rocks. The final map of integrated Bel is the regional-scale geothermal potentialmodel.
5.5. Evaluation of regional-scale geothermal potential model
Following the procedures of Agterberg and Bonham-Carter (2005), we mapped a series ofpotential zones based on five-percentile intervals of integrated Bel values, and assessed successand prediction levels (Fig. 15). Success and prediction levels, respectively, are represented bypercentages of training geothermal occurrences and validation geothermal prospects in potentialzones.
Interpretation of graphed success/prediction levels indicates that the study area can be sub-divided into zones of high, moderate and low geothermal potential (Fig. 15). Inflections of thesuccess level curves at about 25 and 55% were used to separate zones of high and moderate,and moderate and low potential. The inflections indicate strong increase in area, accompaniedby weak gain in success level. High potential zones have values of integrated Bel greater than0.0782, average values of integrated Unc from 0.5489 to 0.9141 (at five-percentile intervals of
292 E.J.M. Carranza et al. / Geothermics 37 (2008) 267–299
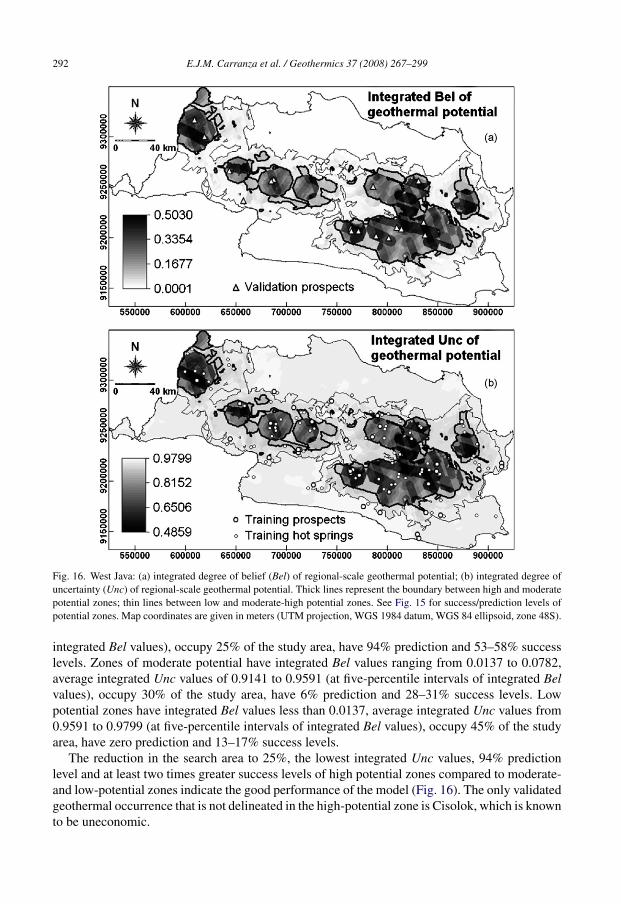
Fig. 16. West Java: (a) integrated degree of belief (Bel) of regional-scale geothermal potential; (b) integrated degree ofuncertainty (Unc) of regional-scale geothermal potential. Thick lines represent the boundary between high and moderatepotential zones; thin lines between low and moderate-high potential zones. See Fig. 15 for success/prediction levels ofpotential zones. Map coordinates are given in meters (UTM projection, WGS 1984 datum, WGS 84 ellipsoid, zone 48S).
integrated Bel values), occupy 25% of the study area, have 94% prediction and 53–58% successlevels. Zones of moderate potential have integrated Bel values ranging from 0.0137 to 0.0782,average integrated Unc values of 0.9141 to 0.9591 (at five-percentile intervals of integrated Belvalues), occupy 30% of the study area, have 6% prediction and 28–31% success levels. Lowpotential zones have integrated Bel values less than 0.0137, average integrated Unc values from0.9591 to 0.9799 (at five-percentile intervals of integrated Bel values), occupy 45% of the studyarea, have zero prediction and 13–17% success levels.
The reduction in the search area to 25%, the lowest integrated Unc values, 94% predictionlevel and at least two times greater success levels of high potential zones compared to moderate-and low-potential zones indicate the good performance of the model (Fig. 16). The only validatedgeothermal occurrence that is not delineated in the high-potential zone is Cisolok, which is knownto be uneconomic.
E.J.M. Carranza et al. / Geothermics 37 (2008) 267–299 293
6. Discussion and conclusions
GIS-based studies of regional-scale geothermal potential mapping have been utilized in manycountries (e.g. Blewitt et al., 2002; Coolbaugh et al., 2002; Kohl et al., 2005; Ondreka et al.,2006) but have not been extensively applied in those that are lesser developed (e.g. Yousefi et al.,2007). This is not necessarily due to the lack of resources but rather the lack of geospatial data(Carranza et al., 2004). Publicly available regional-scale geoscience datasets used in this studyrepresent both direct (e.g. geothermal prospects, hot springs) and indirect geological evidence(e.g. location of Quaternary volcanic centers, Quaternary volcanic rocks, mapped + interpretedregional-scale fault lineaments, quasi-gravity lows) of regional-scale geothermal potential. Thereare other publicly available geoscience datasets (e.g. sinter deposits, epithermal deposits), buttheir quality and quantity are better suited to district- and prospect-scale mapping.
It has been demonstrated in this study, i.e. in a data-poor situation, that regional-scale geother-mal potential can be mapped with the support of Fry and spatial frequency distribution analyses.These spatial analytical tools provide empirical support for the definition of spatial recognitioncriteria at the regional-scale. It must be realized that spatial recognition criteria derived by appli-cation of such tools represent explored, rather than confirmed, relationships between direct andindirect spatial evidence of resource potential (Bonham-Carter, 1994). Nevertheless, in spite oflimited available data, the spatial recognition criteria defined for regional-scale geothermal map-ping in West Java are geologically meaningful, because they are consistent with independent fieldobservations.
It is apparent that most of the geothermal prospects in West Java occur preferentially close tomapped + interpreted regional-scale lineaments or intersections of these lineaments near Quater-nary volcanic centers (Fig. 16). The circular pattern of high-potential zones (Fig. 16), reflect theirproximity to Quaternary volcanic centers, and imply that integrated spatial evidence of “geother-mal circulation”, i.e. integrated EBFs of “fracture permeability” (proximity to NE-, NNW- andWNW-trending mapped + interpreted lineaments), combined with the EBFs of proximity to Qua-ternary volcanic centers) is more important than evidence of integrated “cap/reservoir rocks”(i.e. proximity to Quaternary volcanic rocks and quasi-gravity lows) in terms of regional-scalegeothermal potential (Fig. 14). It is envisaged, therefore, that regional-scale datasets (in additionto mapped and remotely sensed geological features) such as geothermal gradient, heat flow, andgeodetic strain among others, would also be very useful in regional-scale geothermal potentialmapping.
The patterns of the moderate potential zones (Fig. 16), apparently reflecting Quaternary vol-canic rocks and/or the quasi-gravity lows and suggesting spatial evidence of integrated “capand/or reservoir rocks”, is important in discriminating moderate and low potential zones. Wesuggest that cap/reservoir rocks” play an important role in district-to prospect-scale mapping,although datasets with higher accuracy and spatial resolution than the datasets used in this studyare required.
The methods for spatial data analysis and integration demonstrated here not only provides theability to delineate zones where geothermal resources may be present on a regional-scale, butalso the opportunity to improve our understanding of why geothermal resources are not presenteverywhere. For example, the regional map shows the importance of fault intersections (Fig. 16).However, such geological features were not used here, as the factors that control the distribution ofvolcanic vents and influence of fault intersections on geothermal activity are not well establishedin West Java. Clearly, a-priori knowledge needed for using fault intersections for GIS-basedgeothermal potential mapping is lacking. Many studies, however, have shown that locations of
294 E.J.M. Carranza et al. / Geothermics 37 (2008) 267–299
magmatic, volcanic or hydrothermal vents can be explained by fault intersections (e.g. Kyle andCole, 1974; Curewitz and Karson, 1997; Hansen, 2006) and that fault intersections act as stressconcentrators (Gangopadhyay and Talwani, 2005). Therefore, the results presented here suggestthat investigating the relationship between geodetic strain and geothermal activity in West Java(cf. Blewitt et al., 2002) is warranted.
The application of EBFs, in contrast to a weight-of-evidence method (e.g. Coolbaugh et al.,2002), provides the ability to integrate spatial geological evidence, such that interactions betweencontrolling factors represented by individual sets of spatial data can be conceptually represented(Fig. 14). Note that in weights-of-evidence methods, geological evidence is combined in a multi-plicative way, which is a similar function to the AND operation in Dempster’s rule of combiningEBFs. Thus, in terms of spatial evidence integration, the application of EBFs is similar to the appli-cation of fuzzy sets (Prol-Ledesma, 2000) or weighted indices (Noorollahi et al., 2007, 2008).However, the application of data-driven EBFs is advantageous in terms of the objective weightingof geospatial evidence.
The results of the model, derived from the few publicly available regional-scale geosciencedatasets, suggest that it could be used (albeit with caution) to guide exploration in zones of highpotential. In this study, we have not identified any new geothermal prospects in the predicted high-potential zones as important as any of the 16 geothermal prospects already delineated (Fig. 16).That is because the (economic) importance of the (geothermal, mineral) prospect is usually notdetermined in regional-scale resource mapping, although the possibility of identifying new areasof potential, as additional regional-scale geophysical and geochemical datasets become available,is envisaged.
Acknowledgments
We are grateful to the Volcanological Survey of Indonesia and the Geological Research andDevelopment Centre of Indonesia for providing essential data used in this study. Parts of the workwere based on H. Wibowo’s MSc research at ITC, which was funded by the StuNed ScholarshipProgramme. We also acknowledge M.P. Hochstein and two anonymous reviewers for their criticalcomments and valuable suggestions, which helped to improve earlier versions of the paper.
References
Agterberg, F.P., Bonham-Carter, F., 2005. Measuring performance of mineral-potential maps. Natural Resources Research14, 1–17.
Akmal, F., Darnel, H., Sugiharto, P., 2000. The geothermal power business in Java–Bali: trading mechanism, competi-tiveness with fossil fuel and challenges to its development. In: Proceedings of the World Geothermal Congress 2000,28 May–10 June 2000, Kyushu, Tohoku, Japan, pp. 777–783.
Allis, R., 2000. Insights on the formation of vapor-dominated geothermal systems. In: Proceedings of the World GeothermalCongress 2000, 28 May–10 June 2000, Kyushu, Tohoku, Japan, pp. 2489–2496.
Alzwar, M., 1986. Geothermal energy potential related to active volcanism in Indonesia. Geothermics 15 (5–6), 601–607.An, P., Moon, W.M., Bonham-Carter, G.F., 1994a. An object-oriented knowledge representation structure for exploration
data integration. Nonrenewable Resources 3, 132–145.An, P., Moon, W.M., Bonham-Carter, G.F., 1994b. Uncertainty management in integration of exploration data using the
belief functions. Nonrenewable Resources 3, 60–71.Blank, H.R., Butler, W.C., Saltus, R.W., 1998. Neogene uplift and radial collapse of the Colorado Plateau—regional
implications of gravity and aeromagnetic data. U.S. Geological Survey Bulletin 2158, 9–32.Blewitt, G., Coolbaugh, M.F., Holt, W., Kreemer, C., Davis, J.L., Bennett, R.A., 2002. Targetting of potential geothermal
resources in the Great Basin from regional relationships between geodetic strain and geological structures. TransactionsGeothermal Resources Council 26, 523–526.
E.J.M. Carranza et al. / Geothermics 37 (2008) 267–299 295
Bodri, B., Iizuka, S., 1993. Earthquake cutoff depth as a possible geothermometer—applications to Central Japan.Tectonophysics 225, 63–78.
Bogie, I., 2000. The use of plate motion vectors to predict orientation of highly permeable structures in active geothermalfields related to subduction. In: Proceedings of the 22nd New Zealand Geothermal Workshop, Auckland, New Zealand,pp. 69–74.
Bonham-Carter, G.F., 1994. Geographic Information Systems for Geoscientists: Modeling with GIS. Pergamon Press,Ontario, Canada, 398 pp.
Boots, B.N., Getis, A., 1988. Point Pattern Analysis. Sage Publications, Beverly Hills, CA, USA (Sage University ScientificGeography Series no. 8, 93 pp.).
Bryan, C.J., Sherburn, S., Bibby, H.M., Bannister, S.C., Hurst, A.W., 1999. Shallow seismicity of the central Taupo VolcanicZone, new Zealand: its distribution and nature. New Zealand Journal of Geology and Geophysics 42, 533–542.
Carranza, E.J.M., 2002. Geologically-Constrained Mineral Potential Mapping (Examples from the Philippines). Ph.D.Thesis. Delft University of Technology, The Netherlands, 480 pp.
Carranza, E.J.M., Hale, M., 2001. Geologically constrained fuzzy mapping of gold mineralization potential, Baguiodistrict Philippines. Natural Resources Research 10, 125–136.
Carranza, E.J.M., Hale, M., 2002. Where are porphyry copper deposits spatially localized? A case study in Benguetprovince Philippines. Natural Resources Research 11, 45–59.
Carranza, E.J.M., Hale, M., 2003. Evidential belief functions for geologically constrained mapping of gold potential,Baguio district Philippines. Ore Geology Reviews 22, 117–132.
Carranza, E.J.M., Radwan, M., Hale, M., 2004. Geospatial data infrastructure for mineral resource development. GISDevelopment 8, 44–47.
Carranza, E.J.M., Woldai, T., Chikambwe, E.M., 2005. Application of data-driven evidential belief functions to potentialmapping for aquamarine-bearing pegmatites, Lundazi district Zambia. Natural Resources Research 14, 47–63.
Chotin, P., Rampnoux, J.-P., Rasplus Suminta, L., Priyomarsono, S., 1984. Etude de la fracturation dans l’ile de JavaIndonesie. Bulletin de la Societe Geologique de France 26, 1325–1333.
Christensen, C., Nemcok, M., Moore, J.N., Allis, R., Powell, T., Murray, B., Nash, G., McCulloch, J., 2005. Reservoirregime and controls in the Karaha–Telaga Bodas geothermal field Indonesia. In: Abstracts with Programs of GeologicalSociety of America Annual Meeting, 16–19 October 2005, Salt Lake City, Utah, vol. 37, no. 7, p. 236.
Coolbaugh, M.F., 2003. The Prediction and Detection of Geothermal Systems at Regional and Local Scales in Nevadausing a Geographic Information System, Spatial Statistics, and Thermal Infrared Imagery. Ph.D. Thesis, Universityof Nevada, Reno, USA, 172 pp.
Coolbaugh, M.F., Taranik, J.V., Raines, G.L., Shevenell, L.A., Sawatzky, D.L., Minor, T.B., Bedell, R., 2002. A geothermalGIS for Nevada: defining regional controls and favorable exploration terrains for extensional geothermal systems.Geothermal Resources Council Transactions 26, 485–490.
Cooper, G.R.J., Cowan, D.R., 2003. The application of fractional calculus to potential field data. Exploration Geophysics34, 51–56.
Cooper, G.R.J., Cowan, D.R., 2004. Filtering using variable order vertical derivatives. Computers & Geosciences 30,455–459.
Curewitz, D., Karson, J.A., 1997. Structural settings of hydrothermal outflow: fracture permeability maintained by faultpropagation and interaction. Journal of Volcanology and Geothermal Research 79, 149–168.
Dam, M.A.C., 1994. The Late Quaternary Evolution of the Bandung Basin, West Java, Indonesia. PhD Thesis. VrijeUniversiteit, Amsterdam, The Netherlands, 252 pp.
Dardji, N., Villemin, T., Rampnoux, J.P., 1994. Paleostresses and strike-slip movement: the Cimandiri Fault Zone, WestJava, Indonesia. Journal of Southeast Asian Earth Sciences 9, 3–11.
Dempster, A.P., 1967. Upper and lower probabilities induced by a multivalued mapping. Annals of Mathematical Statistics38, 325–339.
Dempster, A.P., 1968. A generalization of Bayesian inference. Journal of the Royal Statistical Society 30 (B),205–247.
Dvorak, J., Matahelumual, J., Okamura, A.T., Said, H., Casadevall, T.J., Mulyadi, D., 1991. Recent uplift and hydrothermalactivity at Tangkuban Parahu, west Java Indonesia. Bulletin of Volcanology 53, 20–28.
Ehara, S., 1987. Thermal structure and seismic activity in Central Kyushu Japan. Tectonophysics 159, 269–278.Evison, F.F., Robinson, R., Arabasz, W.J., 1976. Microearthquakes, geothermal activity and structure, central North Island
New Zealand. New Zealand Journal of Geology and Geophysics 19, 625–637.Fauzi, A., Bahri, S., Akuanbatin, H., 2000. Geothermal development in Indonesia: an overview of industry status and
future growth. In: Proceedings of the World Geothermal Congress 2000, 28 May–10 June 2000, Kyushu, Tohoku,Japan, pp. 1109–1114.
296 E.J.M. Carranza et al. / Geothermics 37 (2008) 267–299
Fry, N., 1979. Random point distributions and strain measurement in rocks. Tectonophysics 60, 89–105.Gangopadhyay, A., Talwani, P., 2005. Fault intersections and intraplate seismicity in Charleston South Carolina: insights
from a 2-d numerical model. Current Science 88, 1609–1616.GEOSOFT, 2006. Physical significance and application of fractional vertical derivatives. Geosoft Technical Notes,
http://www.geosoft.com/resources/technotes/index.asp.GETECH, 1995. South East Asia Gravity Project, Technical Report, Indonesia. Department of Earth Sciences, University
of Leeds, UK.GRDCI, 1972. Cianjur 1:100,000 Scale Geological Map Sheet 1209-2. Geological Research and Development Centre of
Indonesia, Bandung.GRDCI, 1973. Bandung 1:100,000 Scale Geological Map Sheet 1209-3. Geological Research and Development Centre
of Indonesia, Bandung.GRDCI, 1974. Bogor 1:100,000 Scale Geological Map Sheet 1209-1. Geological Research and Development Centre of
Indonesia, Bandung.GRDCI, 1978. Cirebon 1:100,000 Scale Geological Map Sheets 1309-2 and 1309-5. Geological Research and Develop-
ment Centre of Indonesia, Bandung.GRDCI, 1987. Tasikmalaya 1:100,000 Scale Geological Map Sheet 1308-1. Geological Research and Development Centre
of Indonesia, Bandung.GRDCI, 1990. Jampang and Balaikambang 1:100,000 Scale Geological Map Sheets 1208-4 and 1108-6. Geological
Research and Development Centre of Indonesia, Bandung.GRDCI, 1991a. Anyer 1:100,000 Scale Geological Map Sheets 1109-5 and 1110-2. Geological Research and Development
Centre of Indonesia, Bandung.GRDCI, 1991b. Serang 1:100,000 Scale Geological Map Sheets 1109-5 and 1110-3. Geological Research and Develop-
ment Centre of Indonesia, Bandung.GRDCI, 1991c. Ujungkulon 1:100,000 Scale Geological Map Sheet 1109-1. Geological Research and Development
Centre of Indonesia, Bandung.GRDCI, 1992a. Cikarang 1:100,000 Scale Geological Map Sheet 1109-2. Geological Research and Development Centre
of Indonesia, Bandung.GRDCI, 1992b. Garut and Pameungpeuk 1:100,000 Scale Geological Map Sheet 1208-6 and 1208-3. Geological Research
and Development Centre of Indonesia, Bandung.GRDCI, 1992c. Indamayu 1:100,000 Scale Geological Map Sheet 1309-4. Geological Research and Development Centre
of Indonesia, Bandung.GRDCI, 1992d. Jakarta and Kepulauan Seribu 1:100,000 Scale Geological Map Sheets 1209-4 and 1210-1. Geological
Research and Development Centre of Indonesia, Bandung.GRDCI, 1992e. Karangnunggal 1:100,000 Scale Geological Map Sheet 1308-1. Geological Research and Development
Centre of Indonesia, Bandung.GRDCI, 1992f. Karawang 1:100,000 Scale Geological Map Sheets 1209-5 and 1210-2. Geological Research and Devel-
opment Centre of Indonesia, Bandung.GRDCI, 1992g. Leuwidamar 1:100,000 Scale Geological Map Sheet 1109-3. Geological Research and Development
Centre of Indonesia, Bandung.GRDCI, 1992h. Pamanukan 1:100,000 Scale Geological Map Sheet 1209-5 and 1210-2. Geological Research and Devel-
opment Centre of Indonesia, Bandung.GRDCI, 1992i. Pangandaran 1:100,000 Scale Geological Map Sheet 1308-2. Geological Research and Development
Centre of Indonesia, Bandung.GRDCI, 1995. Arjawinangun 1:100,000 Scale Geological Map Sheet 1309-1. Geological Research and Development
Centre of Indonesia, Bandung.GRDCI, 1996a. Majenang 1:100,000 Scale Geological Map Sheet 1308-5. Geological Research and Development Centre
of Indonesia, Bandung.GRDCI, 1996b. Sindangbarang and Bandarwaru 1:100,000 Scale Geological Map Sheet 1209-2. Geological Research
and Development Centre of Indonesia, Bandung.Green, R.T., Cook, K.L., 1981. Gravity Survey of the Southwestern part of the Southern Utah Geothermal Belt. Department
of Geology and Geophysics, University of Utah, Salt Lake City, UT, USA, 116 pp.Hamilton, W.B., 1979. Tectonics of the Indonesian region. U.S. Geological Survey Professional Paper 1078.Hansen, D.M., 2006. The morphology of intrusion-related vent structures and their implications for constraining timing
of intrusive events along the NE Atlantic region. Journal of the Geological Society 163, 789–800.Heliani, L.S., Fukuda, Y., Takemoto, S., 2004. Simulation of the Indonesian land gravity data using a digital terrain model
data. Earth Planets Space 56, 15–24.
E.J.M. Carranza et al. / Geothermics 37 (2008) 267–299 297
Hildebrand, T.G., Kucks, R.P., 1981. Gravity and magnetic features and their relationship to the geothermal system insouthwestern South Dakota. U.S. Geological Survey Open-File Report 81-1345.
Hoffmann-Rothe, A., Ritter, O., Haak, V., 2001. Magnetotelluric and geomagnetic modelling reveals zones of veryhigh electrical conductivity in the upper crust of Central Java. Physics of the Earth and Planetary Interiors 124,131–151.
Hulen, J.B., Stimac, J.A., Sugiaman, F., 2000. The Awibengkok core research program: part I—stratigraphy, volcanicfacies, and hydrothermal alteration. In: Proceedings of the World Geothermal Congress 2000, 28 May–10 June 2000,Kyushu, Tohoku, Japan, pp. 1271–1276.
Iguchi, M., Suantika, G., Suganda, O.K., Ishihara, K., 1997. Increase in seismic activity in 1997 at Guntur volcano, WestJawa Indonesia. In: Proceedings of the International Symposium on Natural Disaster Prediction and Mitigation, Kyoto,Japan, pp. 225–232.
Julian, B.R., Foulger, G.R., 2004. Microearthquake focal mechanisms—a tool for monitoring geothermal systems. GRCBulletin 33, 166–171.
Katili, J.A., 1975. Volcanism and plate tectonics in the Indonesian island arcs. Tectonophysics 26, 165–188.Kohl, T., Signorelli, S., Engelhardt, I., Andenmatten-Berthoud, N., Sellami, S., Rybach, 2005. Development of a regional
geothermal resource atlas. Journal of Geophysics and Engineering 2, 372–385.Kyle, P.R., Cole, J.W., 1974. Structural control of volcanism in the McMurdo Volcanic Group Antarctica. Bulletin of
Volcanology 38, 16–25.Layman, E.B., Soemarinda, S., 2003. The Patuha vapor-dominated resource, West Java Indonesia. In: Proceedings of the
28th Workshop on Geothermal Reservoir Engineering, Stanford University, pp. 56–65.Mahon, T., Harvey, C., Crosby, D., 2000. The chemistry of geothermal fluids in Indonesia and their relationship to water
and vapour dominated systems. In: Proceedings of the World Geothermal Congress 2000, 28 May–10 June 2000,Kyushu, Tohoku, Japan, pp. 1389–1394.
Majer, E.L., Baria, R., Stark, M., Oates, S., Bommer, J., Smith, B., Asanuma, H., 2007. Induced seismicity associatedwith Enhanced Geothermal Systems. Geothermics 36, 185–222.
Malod, J.A., Karta, K., Beslier, M.O., Zen, M.T., 1995. From normal to oblique subduction: tectonic relationships betweenJava and Sumatra. Journal of Southeast Asian Earth Sciences 12, 85–93.
Martodjojo, S., 1984. Evolusi Cekungan Bogor Jawa Barat. Ph.D. Thesis, Institut Teknologi Bandung (ITB), Bandung,Indonesia, 396 pp.
Milesi, J.P., Marcoux, E., Sitorus, T., Simandjuntak, M., Leroy, J., Bailly, L., 1999. Pongkor (west Java Indonesia): aPliocene supergene-enriched epithermal Au-Ag-(Mn) deposit. Mineralium Deposita 34, 131–149.
Nasution, A., Kartadinata, M.N., Kobayashi, T., Siregar, D., Sutaningsih, E., Hadisantono, R., Kadarstia, E., 2004. Geology,age dating and geochemistry of the Tangkuban Perahu geothermal area, West Java Indonesia. Journal GeothermalResearch Society of Japan 26, 285–304.
Nemcok, M., McCulloch, J., Nash, G., Moore, J.N., 2001. Fault kinematics in the Karaha–Telaga Bodas, Indonesia,geothermal field: an interpretation tool for remote sensing data. Transactions Geothermal Resources Council 25,411–415.
Nemcok, M., Moore, J.N., Christensen, C., Allis, R., Powell, T., Murray, B., Nash, G., 2007. Controls on the Karaha–TelagaBodas geothermal reservoir Indonesia. Geothermics 36, 9–46.
Noorollahi, Y., Itoi, R., Fujii, H., Tanaka, T., 2007. GIS model for geothermal resource exploration in Akita and Iwateprefectures, northern Japan. Computers & Geosciences 33, 1008–1021.
Noorollahi, Y., Itoi, R., Fujii, H., Tanaka, T., 2008. GIS integration model for geothermal exploration and well siting.Geothermics 37, 107–131.
Ondreka, J., Rusgen, M.I., Stober, I., Cruzda, K., 2006. GIS-supported mapping of shallow geothermal poten-tial of representative areas in south-western Germany—possibilities and limitations. Renewable Energy 32,2186–2200.
Ostapenko, S.V., Spektor, S.V., Netesov, Y.P., 1998. San Jacinto—Tizate geothermal field Nicaragua: exploration andconceptual model. Geothermics 27, 361–378.
Pakiser, L.C., 1964. Gravity, volcanism, and crustal structure in the southern Cascade Range California. Bulletin of theGeological Society of America 75, 611–620.
Pramono, B., Colombo, D., 2005. Microearthquake characteristics in Darajat geothermal field Indonesia. In: CD-ROMProceedings of the World Geothermal Congress 2005, 24–29 April 2005, Antalya, Turkey, p. 6.
Prol-Ledesma, R.M., 2000. Evaluation of reconnaissance results in geothermal exploration using GIS. Geothermics 29,83–103.
Purbo-Hadiwidjojo, M.M., 1970. A Tentative Map of the Prospective Geothermal Areas of Java and Bali, 1:1,000,000.Geological Survey of Indonesia, Bandung, Indonesia.
298 E.J.M. Carranza et al. / Geothermics 37 (2008) 267–299
Radja, V.T., 1970. Geothermal energy prospects in South Sulawesi, Indonesia. Geothermics 2, 136–149.Ratdomopurbo, A., Poupinet, G., 2000. An overview of the seismicity of Merapi volcano (Java, Indonesia), 1983–1994.
Journal of Volcanology and Geothermal Research 100, 193–214.Sano, S.-I., 1978. Gravity anomalies associated with island arc. In: Nutalaya, P. (Ed.), Proceedings of the Third Regional
Conference on Geology and Mineral Resources of Southeast Asia. 14–18 November 1978, Bangkok, Thailand, pp.173–176.
Sano, S.-I., Untung, M., Gujii, K., 1978. Some gravity features of the island arc of Java and Japan. in: Untung, M., Sato, Y.(Eds.), Gravity and Geological Studies in Java, Indonesia, Special Publication No. 6, Geological Survey of Indonesia,Bandung, pp. 183–207.
Sepulveda, F., Lahsen, A., Bonvalot, S., Cembrano, J., Alvarado, A., Letelier, P., 2005. Morpho-structural evolution ofthe Cordon Caulle geothermal, Southern Volcanic Zone, Chile: insights from gravity and 40Ar/39Ar dating. Journalof Volcanology and Geothermal Research 148, 165–189.
Setijadji, L.D., 2005. Geoinformation of Island Arc Magmatism and Associated Earth Resources: A Case Study of JavaIsland, Sunda Arc, Indonesia. Ph.D. Thesis, Kyushu University, Fukuoka, Japan, 201 pp.
Shafer, G., 1976. A Mathematical Theory of Evidence. Princeton University Press, Princeton, New Jersey.Soeria-Atmadja, R., Dardji, N., 2005. Distribution of Early Tertiary volcanic rocks in south Sumatra and west Java. The
Island Arc 14, 679–686.Soeria-Atmadja, R., Maury, R.C., Bellon, H., Pringgoprawiro, H., Polve, M., Priadi, B., 1994. Tertiary magmatic belts in
Java. Journal of Southeast Asian Earth Sciences 9, 13–27.Soeria-Atmadja, R., Pringgoprawiro, H., Priadi, B., 1990. Tertiary magmatic activity in Java: a study on geochemical
and mineralogical evolution. In: Prosiding Persidangan Sains Bumi and Masyarakat, 9–10 Julai 1990, UniversitiKebangsaan Malaysia, Kuala Lumpur, pp. 164–180.
Spicak, A., Hanus, V., Vanek, J., 2005. Seismotectonic pattern and the source region of volcanism in the central part ofSunda Arc. Journal of Asian Earth Sciences 25, 583–600.
Stimac, J.A., Sugiaman, F., 2000. The Awi 1-2 core research program: part I, geologic review of the Awibengkok geothermalfield Indonesia. In: Proceedings of the World Geothermal Congress 2000, 28 May–10 June 2000, Kyushu, Tohoku,Japan, pp. 2221–2226.
Suantika, G., Iguchi, M., Sutawiddjaja, I.S., Yamamoto, K., 1998. Characteristics of volcanic earthquakes around Gunturvolcano, West Java Indonesia—hypocenter and focal mechanism from 1994 to 1998. In: Proceedings of the Symposiumon Japan-Indonesia IDNDR Projects—Volcanology, Tectonics, Flood and Sediment Hazards, Bandung, Indonesia,pp. 71–80.
Sudarman, S., Hochstein, M.P., 1983. Geophysical structure of the Kamojang geothermal field (Java). In: Proceedings ofthe 5th New Zealand Geothermal Workshop, Auckland, 9–11 November, pp. 225–230.
Sugihara, M., Okuma, S., Nakano, S., Furukawa, R., Komazawa, M., Supper, R., 2002. Relationships between geothermalactivity and gravity anomalies on Vulcano Island Italy. In: Proceedings of the 24th New Zealand Geothermal Workshop,Auckland, 13–15 November, pp. 175–179.
Sukarna, D.J., Andi Mangga, S., Brata, K., 1993. Geology of the Bayah area: implications for the Cenozoic evolution ofWest Java, Indonesia. Bulletin of the Geological Society of Malaysia, Special Publication no. 33, 163–180.
Sumintadireja, P., Sudarman, S., Mizunaga, H., Ushijima, K., 2000. Mise-a-la-masse and gravity data surveys at theKamojang geothermal field. In: Proceedings of the World Geothermal Congress 2000, 28 May–10 June 2000, Kyushu,Tohoku, Japan, pp. 1777–1784.
Suryantini, N., Ashat, A., Achmad, D.R., Simanjuntak, J., Hutasoit, L.M., Hasjim, I., 2005a. Searching for an opportunityin the development of direct use geothermal resources: a case study in West Java Province-Indonesia. In: CD-ROMProceedings of the World Geothermal Congress 2005, 24–29 April 2005, Antalya, Turkey, p. 10.
Suryantini, N., Setijadji, L.D., Wahyuningsih, R., Ehara, S., Imai, A., Watanabe, K., 2005b. Geothermal fields of JavaIsland, Indonesia: their descriptions, geologic environments, and preliminary area-selection exploration strategy. In:Proceedings of the Third International Workshop on Earth Science and Technology, 5 December 2005, KyushuUniversity, Fukuoka, Japan, pp. 11–18.
Tjia, H.D., 1968. The Lembang Fault West Java. Geologie en Mijnbouw 42, 126–130.Tripp, A., Moore, J., Ussher, G., McCulloch, J., 2002. Gravity modeling of the Karaha–Telaga Bodas geothermal system
Indonesia. In: Proceedings of the 27th Workshop on Geothermal Reservoir Engineering, Stanford University, pp.444–452.
Utami, P., 2000. Characteristics of the Kamojang geothermal reservoir (West Java) as revealed by its hydrothermalalteration mineralogy. In: Proceedings of the World Geothermal Congress 2000, 28 May–10 June 2000, Kyushu,Tohoku, Japan, pp. 1921–1926.
E.J.M. Carranza et al. / Geothermics 37 (2008) 267–299 299
Van Bemmelen, R.W., 1949. The Geology of Indonesia. General Geology of Indonesia and Adjacent Archipelagoes., vol.1A., second edition Martinus-Nijhoff, The Hague, The Netherlands, 732 pp.
Vearncombe, J.R., Vearncombe, S., 1999. The spatial distribution of mineralization: application of Fry analysis. EconomicGeology 94, 475–486.
Voulgaris, N., Parcharidis, I., Pahoula, Pirlis, E., 2004. Correlation of tectonics, seismicity and geothermics of LesbosIsland using remote sensing data and geographical information systems. In: Bulletin of the Geological Society ofGreece (Proceedings 10th International Congress of the Geological Society of Greece, Thessaloniki, 15–17 April2004, vol. XXXVI, pp. 938–947.
VSI, 1998. Geothermal Resources in Indonesia. Geothermal Division, Volcanological Survey of Indonesia (VSI),http://www.vsi.esdm.go.id/pbumi/index.html (last accessed on 2/28/2007), last updated on 5/28/1998 by Sri WidodoSingowerdoko.
Walley, P., 1987. Belief function representations of statistical evidence. The Annals of Statistics 15, 1439–1465.Ward, P.L., 1972. Microearthquakes: prospecting tool and possible hazard in the development of geothermal resource.
Geothermics 1, 3–12.Ward, P.L., Bjornsson, S., 1971. Microearthquakes, swarms and the geothermal areas of Iceland. Journal of Geophysical
Research 76, 3953–3982.Whittome, A.J., Salveson, J.O., 1990. Exploration and evaluation of the Darajat geothermal field, West Java Indonesia.
Geothermal Resources Council Transactions 14, 999–1005.Yousefi, H., Ehara, S., Noorollahi, Y., 2007. Geothermal potential site selection using GIS in Iran. In: Proceedings of the
32nd Workshop on Geothermal Reservoir Engineering, Stanford University, pp. 174–182.Zen, M.T., Radja, V.T., 1970. Result of preliminary geological investigation of natural steam fields in Indonesia. Geother-
mics 2, 130–135.
Related Documents