BioOne sees sustainable scholarly publishing as an inherently collaborative enterprise connecting authors, nonprofit publishers, academic institutions, research libraries, and research funders in the common goal of maximizing access to critical research. Spatial Assessment of Water Use in an Environmentally Sensitive Wetland Author(s): Shahbaz Khan, Mohsin Hafeez, Akhtar Abbas, and Aftab Ahmad Source: AMBIO: A Journal of the Human Environment, 38(3):157-165. 2009. Published By: Royal Swedish Academy of Sciences DOI: http://dx.doi.org/10.1579/0044-7447-38.3.157 URL: http://www.bioone.org/doi/full/10.1579/0044-7447-38.3.157 BioOne (www.bioone.org ) is a nonprofit, online aggregation of core research in the biological, ecological, and environmental sciences. BioOne provides a sustainable online platform for over 170 journals and books published by nonprofit societies, associations, museums, institutions, and presses. Your use of this PDF, the BioOne Web site, and all posted and associated content indicates your acceptance of BioOne’s Terms of Use, available at www.bioone.org/page/terms_of_use . Usage of BioOne content is strictly limited to personal, educational, and non-commercial use. Commercial inquiries or rights and permissions requests should be directed to the individual publisher as copyright holder.

Welcome message from author
This document is posted to help you gain knowledge. Please leave a comment to let me know what you think about it! Share it to your friends and learn new things together.
Transcript
BioOne sees sustainable scholarly publishing as an inherently collaborative enterprise connecting authors, nonprofit publishers, academic institutions,research libraries, and research funders in the common goal of maximizing access to critical research.
Spatial Assessment of Water Use in an Environmentally Sensitive WetlandAuthor(s): Shahbaz Khan, Mohsin Hafeez, Akhtar Abbas, and Aftab AhmadSource: AMBIO: A Journal of the Human Environment, 38(3):157-165. 2009.Published By: Royal Swedish Academy of SciencesDOI: http://dx.doi.org/10.1579/0044-7447-38.3.157URL: http://www.bioone.org/doi/full/10.1579/0044-7447-38.3.157
BioOne (www.bioone.org) is a nonprofit, online aggregation of core research in the biological, ecological,and environmental sciences. BioOne provides a sustainable online platform for over 170 journals and bookspublished by nonprofit societies, associations, museums, institutions, and presses.
Your use of this PDF, the BioOne Web site, and all posted and associated content indicates your acceptance ofBioOne’s Terms of Use, available at www.bioone.org/page/terms_of_use.
Usage of BioOne content is strictly limited to personal, educational, and non-commercial use. Commercialinquiries or rights and permissions requests should be directed to the individual publisher as copyright holder.
Report Shahbaz Khan, Mohsin Hafeez, Akhtar Abbas and Aftab Ahmad
Spatial Assessment of Water Use in anEnvironmentally Sensitive Wetland
Wetlands are among the most valuable ecosystems inthe world and are crucial in supporting biodiversity. Theyalso provide space for storing surface waters, whereintense biological processing occurs that helps improvewater quality. Human activities, particularly irrigatedagriculture and urban developments instigating waterdiversions from rivers, have altered the hydrology of mostwetlands. The Lower Murrumbidgee wetland, located inthe Murrumbidgee River Catchment, is an example and isone of the significant wetlands across the Murray DarlingBasin of Australia. Historic estimates show the volumesof water ranged from none in dry years to about 300 to400 GL (1 GL ¼ 109 L) in an average and wet year,respectively. The flows reaching the Lower Murrumbidg-ee wetland have been drastically reduced by at least 60%because of the upstream diversions introduced during thelast century. These reductions have adversely affectedthe health of natural vegetation and agricultural crops inthe Lower Murrumbidgee floodplain. This article presentsthe results of the quantification of total water consumptionof various land uses in the Lower Murrumbidgee flood-plain using the remote sensing–based Surface EnergyBalance Algorithm for Land (SEBAL) modeling approach.The spatial analysis of actual evapotranspiration (ETa)shows that ETa rates are the highest (13–26%) for the redgum (Eucalyptus camaldulensis) forests both in summerand winter days. However, in terms of total ETa volume,lignum (Muehlenbeckia florulenta) constitutes the mostsignificant part, which is around 14–30% of the total ETa
volume for the area. Actual evapotranspiration fromwinter cereal cropping areas following the summerponding is the third highest consumer of water after theriver red gum and lignum. Actual evapotranspiration fromthe fallow land is also significant, representing 5–28% oftotal ETa from the region. In view of the extent of theunaccounted flows in the overall water balance of thesystem, there is a need to upgrade measuring andreporting infrastructure by strengthening the institutionaland management arrangements to better gauge theefficiency of environmental and consumptive water use.The state-of-the-art technology of remote sensing–basedSEBAL modeling proved to have potential for measuringactual water use with reliable accuracy and can be usedfor assessing the environmental and productive use ofwater from wetlands in other regions of Australia.
INTRODUCTION
Wetlands are floodplain water storages that exhibit importanthydrological and ecological settings in the ecosystem. After aflood event, wetlands nourish rivers with invertebrates, nutri-ents, organic carbon, fish, and plants. The wetland hydrology isconsiderably affected by the river flow regulations, theconstruction of hydraulic structures, and the subsequentdiversions of water, mainly for irrigation (1). The LowerMurrumbidgee wetland is one of the most significant wetlandsystems located in the Murrumbidgee River catchment in the
Murray Darling Basin of Australia. The Lower Murrumbidgeewetland carries the scars of the water resource developmentsestablished at local and catchment scales over 144 years (1855–1998), resulting in ecological collapse of approximately 76% ofthe wetland (2, 3). This is clear evidence that when communitiescontinue changing water use, the long-term environmental costsbecome significant. The Lower Murrumbidgee wetland has avery dynamic but sensitive ecosystem with enormous spatial andtemporal complexities (4, 5). Its red gum (Eucalyptus camaldu-lensis) forests are the largest in the Murrumbidgee catchmentand have significant environmental value. It is declared aRamsar wetland with much international importance under theRamsar Convention (6).
The irrigators in the Lower Murrumbidgee Flood Controland Irrigation District (LFCID) are dependent on ‘‘surplusflows’’ or supplementary water from the Murrumbidgee River,as they do not have secure water access licenses or entitlements.Major agricultural activities in the area include irrigated wintercereals, safflower, forestry, and livestock grazing. The regionreceives water by diversions fromMaude and RedbankWeirs orby overbank flows when there is sufficient supplementary or‘‘surplus’’ water spared from upstream diversions. These flowsare not metered and show immense variations strongly linkedwith climate variability. The estimates of the flow volumes varyfrom none in dry years, to some 300 GL in an average year, and400 GL in a wet year (3). Currently, water is shared on a 50–50basis between Maude and Redbank Weirs. Water diversionsreaching the Lower Murrumbidgee floodplain have beenreduced by at least 60% from 1888 to 1998 (7), and the leveeswere also cut off in the western parts of the floodplain in theearly 1900s from the river. The irrigation development and dryclimate in the recent past have significantly altered theseasonality of natural flow patterns, leaving the remainingflows considerably lower than those of the natural conditions(8). Obviously, this has led to the degradation of this inlandwetland system. Khan et al. (3) reported that current watermanagement strategies in the region are primarily based onwater availability (which is linked with the rejection of flows byirrigators, the spilling of dams, or maintaining a minimum flowdownstream of Balranald) rather than maintaining the hydrau-lic linkages between the floodplain and the rivers, thusfacilitating ecosystem health. At present, the flows in thiswetland are neither secured to the irrigators nor to theenvironment. The surplus flows that are not metered and thelevee banks built by irrigators to harvest flows have even alteredthe flow patterns within the floodplain. Moreover, the persistentrecent drought from 2002 to 2007 has exacerbated the situation,and the health of environmental assets is deteriorating. Due tothe inadequate knowledge base on water use, the floodplain wasnot included in the Water Sharing Plan for the MurrumbidgeeCatchment (3). The knowledge gaps identified in the floodplaininclude: i) lack of water security for the environment and forirrigators; ii) lack of ability to account for flows; iii) lack ofability to design flow patterns to improve environmental andagricultural outcomes; and iv) lack of ability to plan foranything more than minor adjustments to existing patterns ofwater use.
Ambio Vol. 38, No. 3, May 2009 157� Royal Swedish Academy of Sciences 2009http://www.ambio.kva.se
There are apparent losses and uncertainties both for theenvironment and agriculture under the present flooding regimebecause of uncertain data and a lack of information aboutactual water use by different vegetation types. The tree forestsare patchy at the junction of Nimmie-Caira and the Redbankareas, with less capacity of the floodplains to pass water and alack of hydraulic linkages. Such hydrological linkages play animportant role in the floodplain and riverine ecosystem healthby enabling the transfer of organic matter and the exchange offlora and fauna between the floodplains and the rivers. There isalso a need to consider the water requirements of habitat areas.Unless the management of bird habitat is separated from themanagement of the agricultural land it will be impossible tomeet spatial and temporal water demands for agriculture andthe environment. These special habitat areas need to bemanaged, taking into consideration natural climate variabilityby maintaining stable water levels, especially during theSeptember to November period followed by a drying-out phasefor a minimum period of one to four months every year. Thiscan be achieved by providing secure water rights to the LowerMurrumbidgee environment and the local land owners.
Some of the earlier studies explored the anticipated impactsof river regulations on the wetlands. These effects include: i)permanent inundation upstream of weirs and dams; ii) frequentinundation of low connecting wetlands; iii) reduced inundationof high connecting wetlands; and iv) altered seasonality ofconnections (1, 9–11). Others have used satellite remote sensingfor monitoring the destruction of wetlands and water birdpopulations triggered by the construction of dams (5, 7). Thepresent study is focused on determining the actual evapotrans-piration (ETa) of the Lower Murrumbidgee wetland at thespatial scale using the Surface Energy Balance Algorithm forLand (SEBAL) (12, 13) in combination with optical andthermal satellite imagery from Landsat 5 Thermatic Mapper(TM). Surface Energy Balance Algorithm for Land is athermodynamically based model, which partitions betweensensible heat flux and latent heat of vaporization flux (12, 14).The literature uncovers the use of remote sensing–basedtechniques to quantify energy flux and surface parameters fromdifferent land uses. They include energy flux from i) agriculturalfields (13, 15–18), ii) wetlands 19–21), iii) rangeland and othervegetated surfaces (22–24), and iv) desert (25). These studieshave demonstrated the applicability and credibility of remotesensing in the spatial mapping of flux and surface parameters tocharacterize the response of land surface to vegetation dynamics
in various parts of the world. However, the SEBAL approachhas not been yet applied in any wetland ecosystem environmentof Australia. This article presents a state-of-the-art techniquefor quantification of total water consumption and separation ofenvironmental and agricultural water use in the LowerMurrumbidgee wetland. The specific objectives are: i) to assessthe feasibility of SEBAL using satellite images over the LowerMurrumbidgee wetland and ii) to compute the spatialdistribution of the ETa of different land uses to assessenvironmental and agricultural water use.
MATERIALS AND METHODS
Study Area
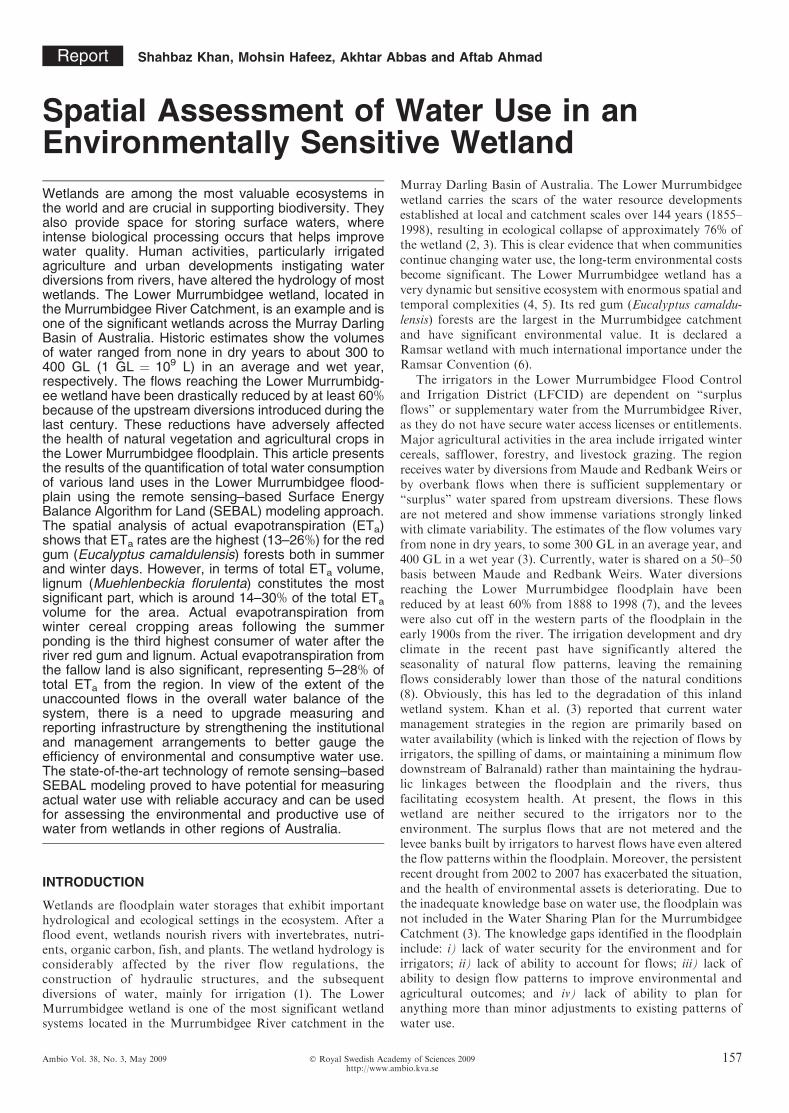
The Lower Murrumbidgee wetlands are located between Maudeand Balranald on the floodplain of the 1690 km longMurrumbidgee River in the southwest part of New SouthWales of Australia as shown in Figure 1. There was anestimated area of 303 781 ha of wetlands in the beginning of the20th century, of which 76% is destroyed or degraded. In orderto effectively manage land and water resources in the LowerMurrumbidgee floodplain, the LFCID was promulgated, whichcovers a gazetted area of 155 000 ha, bounded by theMurrumbidgee River in the north and the Sturt Highway inthe south. The LFCID is situated approximately 50 km west ofthe town of Hay between Maude and Balranald and issubdivided into two distinct Land and Water ManagementPlans (LWMPs), commonly known as the Nimmie-Cairasystem and the Redbank system (Fig. 1). The Nimmie-Cairasystem, located in the southeast, covers an approximate area of75 000 ha. During 1970s, the land use shifted from grazing towinter-irrigated cereals following the rapid clearing of wetlandvegetation. By 1996, 39 000 ha of land were completelydeveloped for irrigated cropping. There are also 23 800 ha ofprotected lands. The area has national significance and isregarded as a very important area for native wildlife. TheRedbank system, located in the northwestern part of the area,covers an approximate area of 70 000 ha. It is a large floodplaindissected by channels with no defined distributary creeks. Thisarea is primarily reliant on overbank flows caused by aconstriction in the main channel cross section of the river.
The Lower Murrumbidgee floodplain is characterized by asemi-arid climate, with mean annual rainfall and mean annualevaporation of 368 mm and 1819 mm, respectively, at Hay. Thehistoric annual rainfall and annual reference evapotranspiration(ETo) at Hay is shown in Figure 2. The main environmentalland uses in the area include lignum (Muehlenbeckia florulenta)in the seasonal flooding areas, river red gum forest along theedges of the Murrumbidgee River and major creeks, and black
Figure 1. Schematic of the Lower Murrumbidgee floodplain showingthe Nimmie-Caira and Redbank Systems and the hydraulic struc-tures.
Figure 2. Historical rainfall and reference evapotranspiration at Hayin the Lower Murrumbidgee floodplain.
158 Ambio Vol. 38, No. 3, May 2009� Royal Swedish Academy of Sciences 2009http://www.ambio.kva.se
box (Eucalyptus largiflorens) woodlands along the western edgethe floodplain where there is limited water supply. The LowerMurrumbidgee wetlands have been highly productive ecosys-tems providing habitat for native fish, birds, mammals,invertebrates, and other animals. They support rookeries forwaterbirds with great diversity, facilitating their breeding ineastern Australia. Floods are carried throughout the floodplainby a complex system of interconnected natural creeks (includingFiddlers, Uara, Caira, Nimmie, Pollen, Waugorah, Talpee,Monken, Kietta, Yanga, and Paika) flowing east to west. Thereare also open water lakes (such as Piggery, Tala, and Yanga),with an aerial extent of more than 50 ha. When theMurrumbidgee River reaches near the town of Balranald, itloses some of its complex network of creeks, and flows areprimarily confined to the main channel before eventuallyflowing into the Murray River (the longest river of Australiawith approximate length of 2520 km).
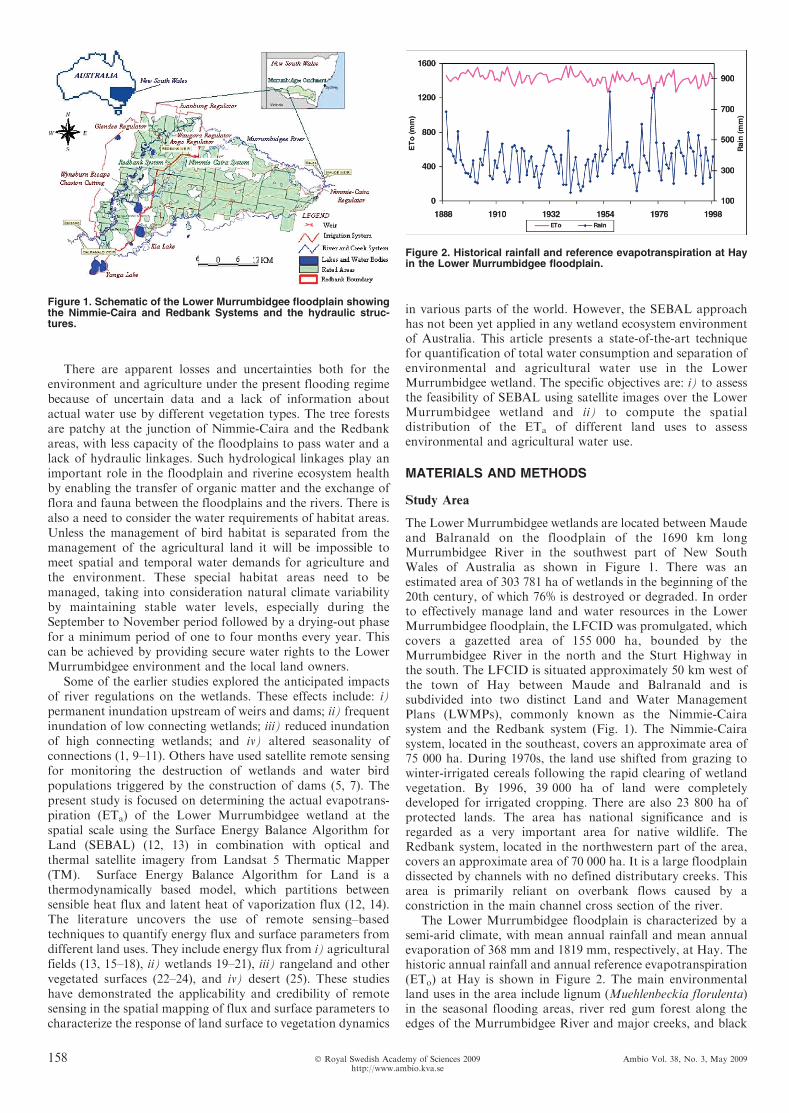
As the annual rainfall is low and evaporation rates are highin this area, its wetlands greatly rely on replenishment from theflooding events. The river regulations not only reduced thefrequency of medium to large flood events but have prolongedthe low flow periods. Flows to the Lower Murrumbidgeefloodplain have declined in volume during the last century(1898–1998). The percentage volume of annual flows in theMurrumbidgee River reaching Hay from Wagga Wagga hashalved in the 20 years from 1979 to 1998 compared to 20 yearsfrom 1888 to 1907 before the river regulation infrastructure wasput in place (5). The 20-year period between 1979 and 1998 hadthe lowest annual flows at Wagga Wagga and Hay (3). Thehistorical annual flows in the Murrumbidgee River at WaggaWagga and Hay are shown in Figure 3.
Satellite Data
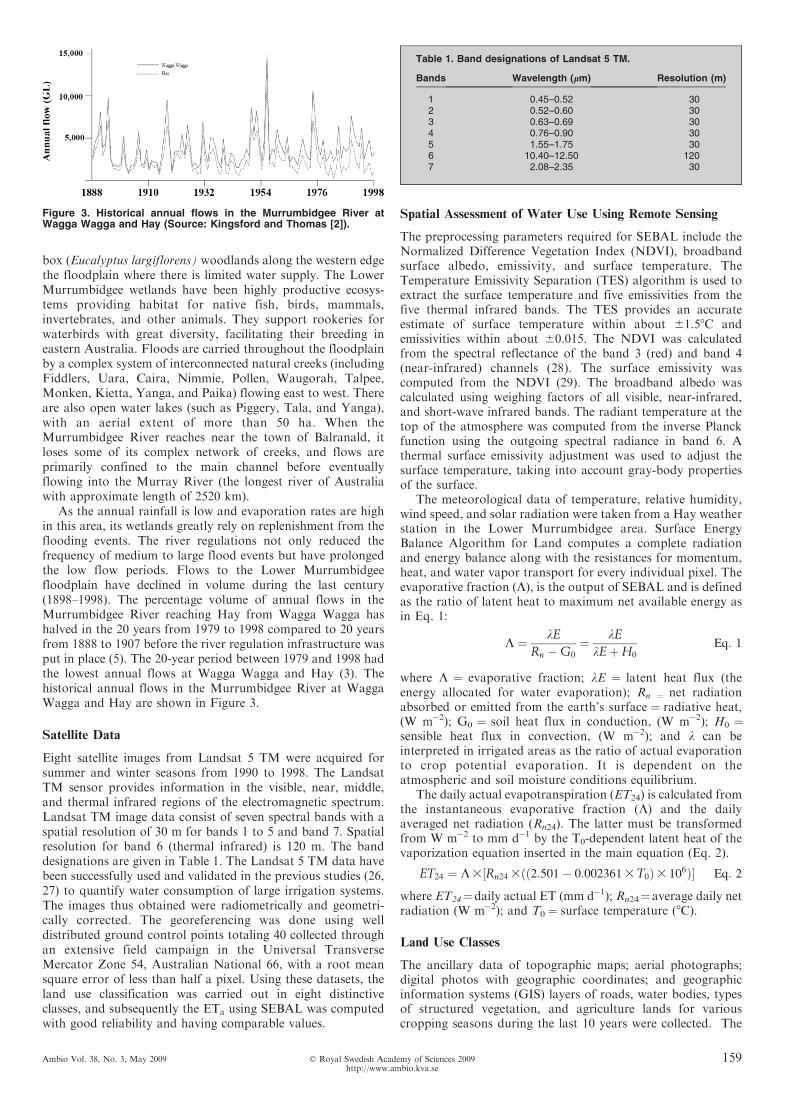
Eight satellite images from Landsat 5 TM were acquired forsummer and winter seasons from 1990 to 1998. The LandsatTM sensor provides information in the visible, near, middle,and thermal infrared regions of the electromagnetic spectrum.Landsat TM image data consist of seven spectral bands with aspatial resolution of 30 m for bands 1 to 5 and band 7. Spatialresolution for band 6 (thermal infrared) is 120 m. The banddesignations are given in Table 1. The Landsat 5 TM data havebeen successfully used and validated in the previous studies (26,27) to quantify water consumption of large irrigation systems.The images thus obtained were radiometrically and geometri-cally corrected. The georeferencing was done using welldistributed ground control points totaling 40 collected throughan extensive field campaign in the Universal TransverseMercator Zone 54, Australian National 66, with a root meansquare error of less than half a pixel. Using these datasets, theland use classification was carried out in eight distinctiveclasses, and subsequently the ETa using SEBAL was computedwith good reliability and having comparable values.
Spatial Assessment of Water Use Using Remote Sensing
The preprocessing parameters required for SEBAL include theNormalized Difference Vegetation Index (NDVI), broadbandsurface albedo, emissivity, and surface temperature. TheTemperature Emissivity Separation (TES) algorithm is used toextract the surface temperature and five emissivities from thefive thermal infrared bands. The TES provides an accurateestimate of surface temperature within about 61.58C andemissivities within about 60.015. The NDVI was calculatedfrom the spectral reflectance of the band 3 (red) and band 4(near-infrared) channels (28). The surface emissivity wascomputed from the NDVI (29). The broadband albedo wascalculated using weighing factors of all visible, near-infrared,and short-wave infrared bands. The radiant temperature at thetop of the atmosphere was computed from the inverse Planckfunction using the outgoing spectral radiance in band 6. Athermal surface emissivity adjustment was used to adjust thesurface temperature, taking into account gray-body propertiesof the surface.
The meteorological data of temperature, relative humidity,wind speed, and solar radiation were taken from a Hay weatherstation in the Lower Murrumbidgee area. Surface EnergyBalance Algorithm for Land computes a complete radiationand energy balance along with the resistances for momentum,heat, and water vapor transport for every individual pixel. Theevaporative fraction (K), is the output of SEBAL and is definedas the ratio of latent heat to maximum net available energy asin Eq. 1:
K ¼ kE
Rn �G0
¼ kE
kEþH0
Eq: 1
where K ¼ evaporative fraction; kE ¼ latent heat flux (theenergy allocated for water evaporation); Rn ¼ net radiationabsorbed or emitted from the earth’s surface ¼ radiative heat,(W m�2); G0 ¼ soil heat flux in conduction, (W m�2); H0 ¼sensible heat flux in convection, (W m�2); and k can beinterpreted in irrigated areas as the ratio of actual evaporationto crop potential evaporation. It is dependent on theatmospheric and soil moisture conditions equilibrium.
The daily actual evapotranspiration (ET24) is calculated fromthe instantaneous evaporative fraction (K) and the dailyaveraged net radiation (Rn24). The latter must be transformedfrom W m�2 to mm d�1 by the T0-dependent latent heat of thevaporization equation inserted in the main equation (Eq. 2).
ET24 ¼ K 3½Rn24 3ðð2:501� 0:002361 3 T0Þ3 106Þ� Eq: 2
where ET24¼daily actual ET (mm d�1); Rn24¼average daily netradiation (W m�2); and T0 ¼ surface temperature (8C).
Land Use Classes
The ancillary data of topographic maps; aerial photographs;digital photos with geographic coordinates; and geographicinformation systems (GIS) layers of roads, water bodies, typesof structured vegetation, and agriculture lands for variouscropping seasons during the last 10 years were collected. The
Figure 3. Historical annual flows in the Murrumbidgee River atWagga Wagga and Hay (Source: Kingsford and Thomas [2]).
Table 1. Band designations of Landsat 5 TM.
Bands Wavelength (lm) Resolution (m)
1 0.45–0.52 302 0.52–0.60 303 0.63–0.69 304 0.76–0.90 305 1.55–1.75 306 10.40–12.50 1207 2.08–2.35 30
Ambio Vol. 38, No. 3, May 2009 159� Royal Swedish Academy of Sciences 2009http://www.ambio.kva.se
Lower Murrumbidgee floodplain is spectrally complex. Thecomplex mixture of remnant vegetation, bare soil, andinundation within land cover types necessitated the use ofunsupervised classification (5, 30, 31) for the area. Kingsfordand Thomas (5) reported that growing wetland vegetation andshallow open water lakes are spectrally similar to irrigated areaand flooded agricultural land.
The land use classification was performed using a series ofconsecutive unsupervised classification steps on the basis of theiterative self-organizing data analysis (ISODATA) clusteringalgorithm. Three ISODATA clustering attempts were madeusing 10, 20, and 40 clusters, respectively. The ISODATAclustering with eight classes was used to separate water bodies(e.g., rivers, lakes, etc.), red gum forest, wetland including floodpath, agriculture crops (wheat, rice, maize, vegetables. etc.),lignum (perennial vegetation), fallow land (bush, shrubs, andfields), bare soil, and others (clouds, roads, etc.). Aerialphotographs, types of structured vegetation, and various GISlayers were used to assign the ISODATA clustering results toland cover classes. A similar land use classification procedurewas applied to all Landsat 5 TM images.
For various land use classes, 191 random ground controllocations were defined during each field campaign. UsingDifferential global positioning system, 25 points were recordedfor each land use class. The data on vegetation health, type, andgeneral vegetation pattern in the surrounding area wererecorded for the selected points. This information was usedduring the image classification and later to assess the accuracyby comparing the classification with the observation points.The accuracy of each land use class was expressed as thenumber of correctly classified pixels divided by the totalnumber of test pixels. The overall accuracy and the Kappacoefficient of land use classification calculated by the methoddescribed by Congalton (32) were 73% and 0.70, respectively.The accuracy of the image classification depends on severalfactors, such as the spectral separability of the land coverclasses, heterogeneity of the land surface, and the number ofground truth samples.
Evapotranspiration Analysis to Separate Relative
Consumptive and Environmental Uses of Water
The ETa for different land use classes was determined from theclassified images. This involved transforming the classifiedimages and SEBAL-derived ETa maps into polygons for thecorresponding time period. The land use polygon maps wereoverlaid on the ETa maps. The ETa map for each land use classwas computed for each satellite image.
RESULTS AND DISCUSSION
Land Use Classification
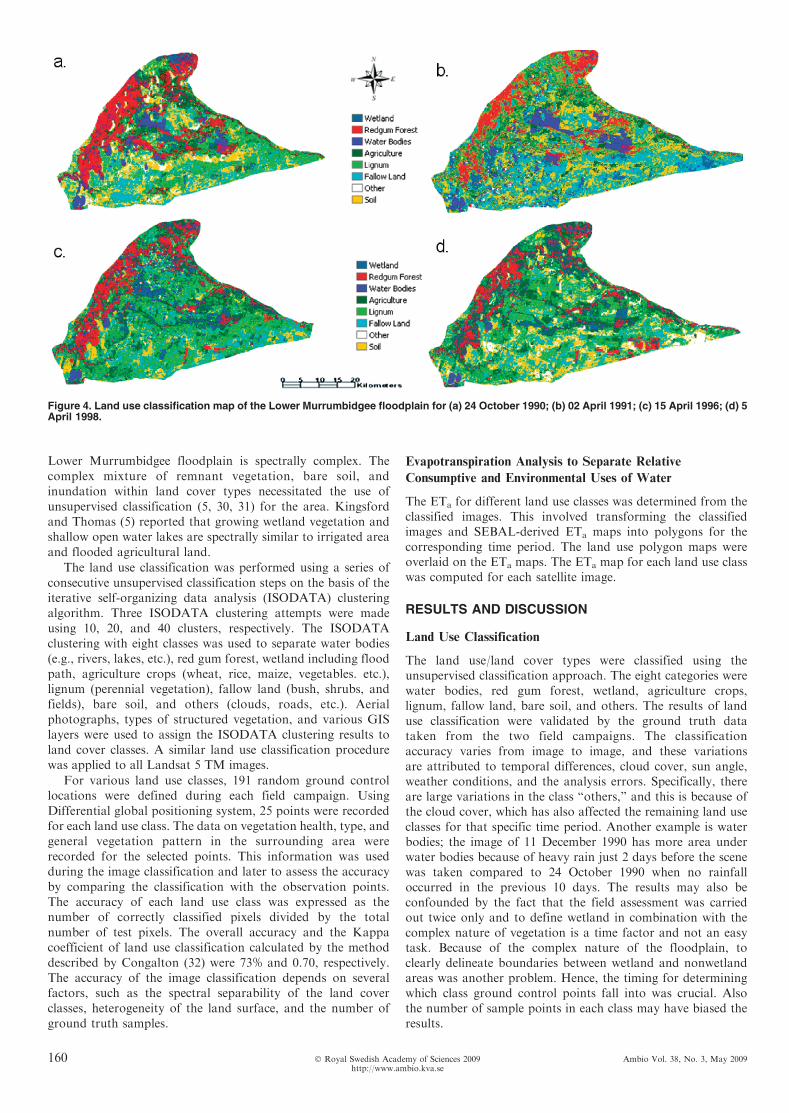
The land use/land cover types were classified using theunsupervised classification approach. The eight categories werewater bodies, red gum forest, wetland, agriculture crops,lignum, fallow land, bare soil, and others. The results of landuse classification were validated by the ground truth datataken from the two field campaigns. The classificationaccuracy varies from image to image, and these variationsare attributed to temporal differences, cloud cover, sun angle,weather conditions, and the analysis errors. Specifically, thereare large variations in the class ‘‘others,’’ and this is because ofthe cloud cover, which has also affected the remaining land useclasses for that specific time period. Another example is waterbodies; the image of 11 December 1990 has more area underwater bodies because of heavy rain just 2 days before the scenewas taken compared to 24 October 1990 when no rainfalloccurred in the previous 10 days. The results may also beconfounded by the fact that the field assessment was carriedout twice only and to define wetland in combination with thecomplex nature of vegetation is a time factor and not an easytask. Because of the complex nature of the floodplain, toclearly delineate boundaries between wetland and nonwetlandareas was another problem. Hence, the timing for determiningwhich class ground control points fall into was crucial. Alsothe number of sample points in each class may have biased theresults.
Figure 4. Land use classification map of the Lower Murrumbidgee floodplain for (a) 24 October 1990; (b) 02 April 1991; (c) 15 April 1996; (d) 5April 1998.
160 Ambio Vol. 38, No. 3, May 2009� Royal Swedish Academy of Sciences 2009http://www.ambio.kva.se
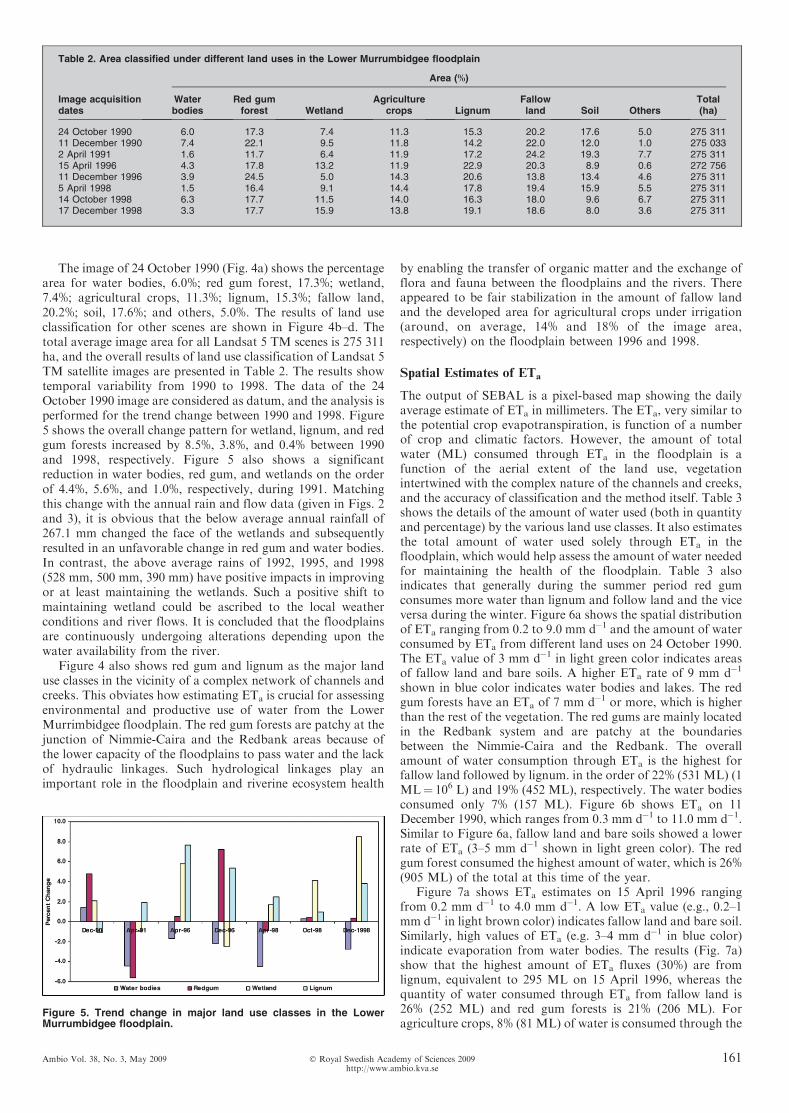
The image of 24 October 1990 (Fig. 4a) shows the percentagearea for water bodies, 6.0%; red gum forest, 17.3%; wetland,7.4%; agricultural crops, 11.3%; lignum, 15.3%; fallow land,20.2%; soil, 17.6%; and others, 5.0%. The results of land useclassification for other scenes are shown in Figure 4b–d. Thetotal average image area for all Landsat 5 TM scenes is 275 311ha, and the overall results of land use classification of Landsat 5TM satellite images are presented in Table 2. The results showtemporal variability from 1990 to 1998. The data of the 24October 1990 image are considered as datum, and the analysis isperformed for the trend change between 1990 and 1998. Figure5 shows the overall change pattern for wetland, lignum, and redgum forests increased by 8.5%, 3.8%, and 0.4% between 1990and 1998, respectively. Figure 5 also shows a significantreduction in water bodies, red gum, and wetlands on the orderof 4.4%, 5.6%, and 1.0%, respectively, during 1991. Matchingthis change with the annual rain and flow data (given in Figs. 2and 3), it is obvious that the below average annual rainfall of267.1 mm changed the face of the wetlands and subsequentlyresulted in an unfavorable change in red gum and water bodies.In contrast, the above average rains of 1992, 1995, and 1998(528 mm, 500 mm, 390 mm) have positive impacts in improvingor at least maintaining the wetlands. Such a positive shift tomaintaining wetland could be ascribed to the local weatherconditions and river flows. It is concluded that the floodplainsare continuously undergoing alterations depending upon thewater availability from the river.
Figure 4 also shows red gum and lignum as the major landuse classes in the vicinity of a complex network of channels andcreeks. This obviates how estimating ETa is crucial for assessingenvironmental and productive use of water from the LowerMurrimbidgee floodplain. The red gum forests are patchy at thejunction of Nimmie-Caira and the Redbank areas because ofthe lower capacity of the floodplains to pass water and the lackof hydraulic linkages. Such hydrological linkages play animportant role in the floodplain and riverine ecosystem health
by enabling the transfer of organic matter and the exchange offlora and fauna between the floodplains and the rivers. Thereappeared to be fair stabilization in the amount of fallow landand the developed area for agricultural crops under irrigation(around, on average, 14% and 18% of the image area,respectively) on the floodplain between 1996 and 1998.
Spatial Estimates of ETa
The output of SEBAL is a pixel-based map showing the dailyaverage estimate of ETa in millimeters. The ETa, very similar tothe potential crop evapotranspiration, is function of a numberof crop and climatic factors. However, the amount of totalwater (ML) consumed through ETa in the floodplain is afunction of the aerial extent of the land use, vegetationintertwined with the complex nature of the channels and creeks,and the accuracy of classification and the method itself. Table 3shows the details of the amount of water used (both in quantityand percentage) by the various land use classes. It also estimatesthe total amount of water used solely through ETa in thefloodplain, which would help assess the amount of water neededfor maintaining the health of the floodplain. Table 3 alsoindicates that generally during the summer period red gumconsumes more water than lignum and follow land and the viceversa during the winter. Figure 6a shows the spatial distributionof ETa ranging from 0.2 to 9.0 mm d�1 and the amount of waterconsumed by ETa from different land uses on 24 October 1990.The ETa value of 3 mm d�1 in light green color indicates areasof fallow land and bare soils. A higher ETa rate of 9 mm d�1
shown in blue color indicates water bodies and lakes. The redgum forests have an ETa of 7 mm d�1 or more, which is higherthan the rest of the vegetation. The red gums are mainly locatedin the Redbank system and are patchy at the boundariesbetween the Nimmie-Caira and the Redbank. The overallamount of water consumption through ETa is the highest forfallow land followed by lignum. in the order of 22% (531 ML) (1ML¼ 106 L) and 19% (452 ML), respectively. The water bodiesconsumed only 7% (157 ML). Figure 6b shows ETa on 11December 1990, which ranges from 0.3 mm d�1 to 11.0 mm d�1.Similar to Figure 6a, fallow land and bare soils showed a lowerrate of ETa (3–5 mm d�1 shown in light green color). The redgum forest consumed the highest amount of water, which is 26%(905 ML) of the total at this time of the year.
Figure 7a shows ETa estimates on 15 April 1996 rangingfrom 0.2 mm d�1 to 4.0 mm d�1. A low ETa value (e.g., 0.2–1mm d�1 in light brown color) indicates fallow land and bare soil.Similarly, high values of ETa (e.g. 3–4 mm d�1 in blue color)indicate evaporation from water bodies. The results (Fig. 7a)show that the highest amount of ETa fluxes (30%) are fromlignum, equivalent to 295 ML on 15 April 1996, whereas thequantity of water consumed through ETa from fallow land is26% (252 ML) and red gum forests is 21% (206 ML). Foragriculture crops, 8% (81 ML) of water is consumed through the
Table 2. Area classified under different land uses in the Lower Murrumbidgee floodplain
Image acquisitiondates
Area (%)
Waterbodies
Red gumforest Wetland
Agriculturecrops Lignum
Fallowland Soil Others
Total(ha)
24 October 1990 6.0 17.3 7.4 11.3 15.3 20.2 17.6 5.0 275 31111 December 1990 7.4 22.1 9.5 11.8 14.2 22.0 12.0 1.0 275 0332 April 1991 1.6 11.7 6.4 11.9 17.2 24.2 19.3 7.7 275 31115 April 1996 4.3 17.8 13.2 11.9 22.9 20.3 8.9 0.6 272 75611 December 1996 3.9 24.5 5.0 14.3 20.6 13.8 13.4 4.6 275 3115 April 1998 1.5 16.4 9.1 14.4 17.8 19.4 15.9 5.5 275 31114 October 1998 6.3 17.7 11.5 14.0 16.3 18.0 9.6 6.7 275 31117 December 1998 3.3 17.7 15.9 13.8 19.1 18.6 8.0 3.6 275 311
Figure 5. Trend change in major land use classes in the LowerMurrumbidgee floodplain.
Ambio Vol. 38, No. 3, May 2009 161� Royal Swedish Academy of Sciences 2009http://www.ambio.kva.se
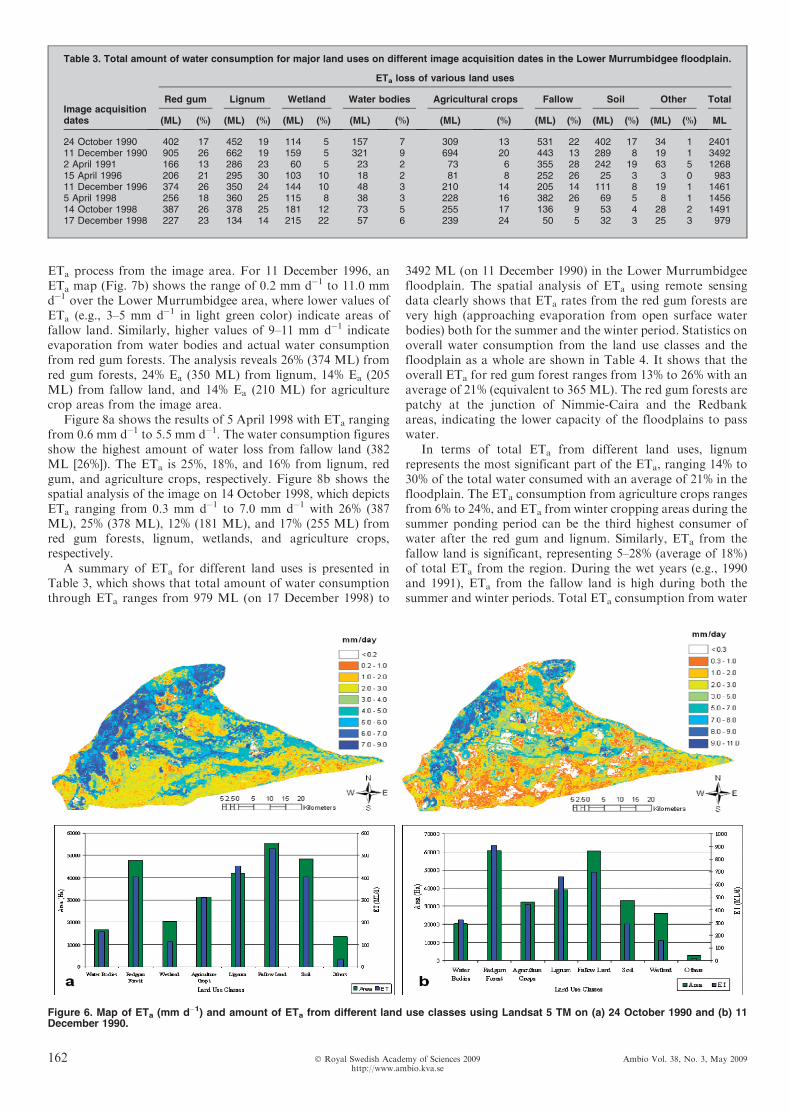
ETa process from the image area. For 11 December 1996, anETa map (Fig. 7b) shows the range of 0.2 mm d�1 to 11.0 mmd�1 over the Lower Murrumbidgee area, where lower values ofETa (e.g., 3–5 mm d�1 in light green color) indicate areas offallow land. Similarly, higher values of 9–11 mm d�1 indicateevaporation from water bodies and actual water consumptionfrom red gum forests. The analysis reveals 26% (374 ML) fromred gum forests, 24% Ea (350 ML) from lignum, 14% Ea (205ML) from fallow land, and 14% Ea (210 ML) for agriculturecrop areas from the image area.
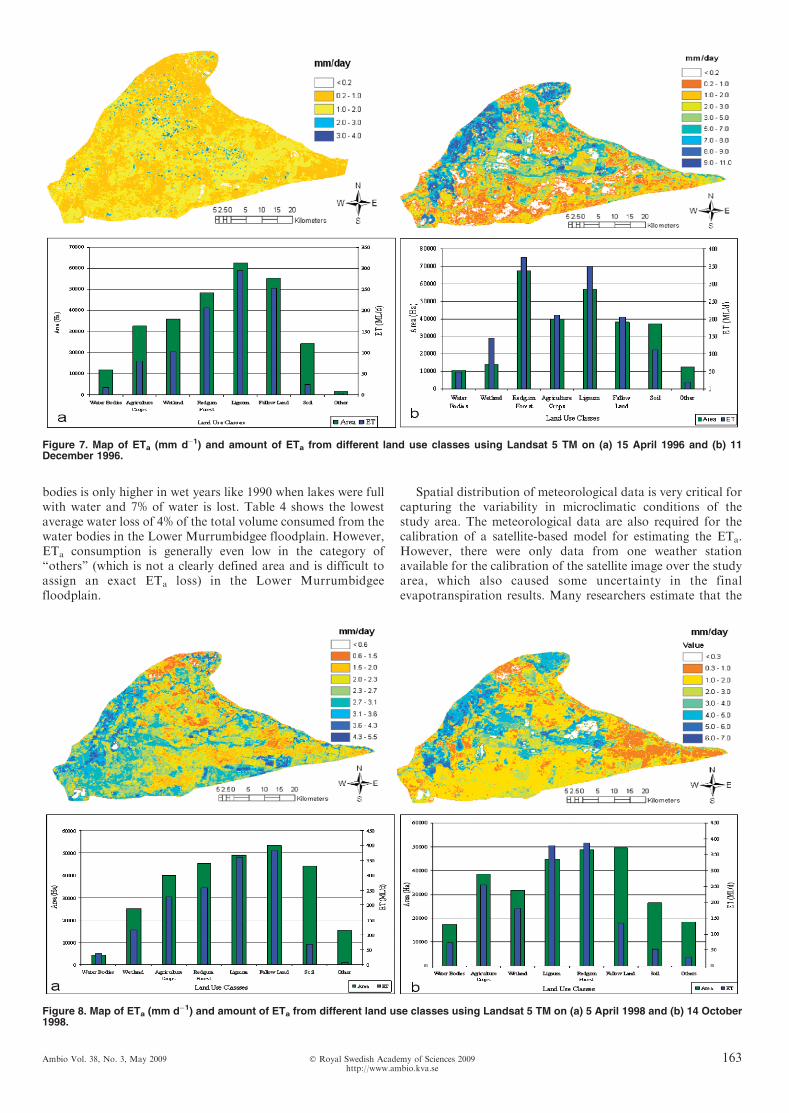
Figure 8a shows the results of 5 April 1998 with ETa rangingfrom 0.6 mm d�1 to 5.5 mm d�1. The water consumption figuresshow the highest amount of water loss from fallow land (382ML [26%]). The ETa is 25%, 18%, and 16% from lignum, redgum, and agriculture crops, respectively. Figure 8b shows thespatial analysis of the image on 14 October 1998, which depictsETa ranging from 0.3 mm d�1 to 7.0 mm d�1 with 26% (387ML), 25% (378 ML), 12% (181 ML), and 17% (255 ML) fromred gum forests, lignum, wetlands, and agriculture crops,respectively.
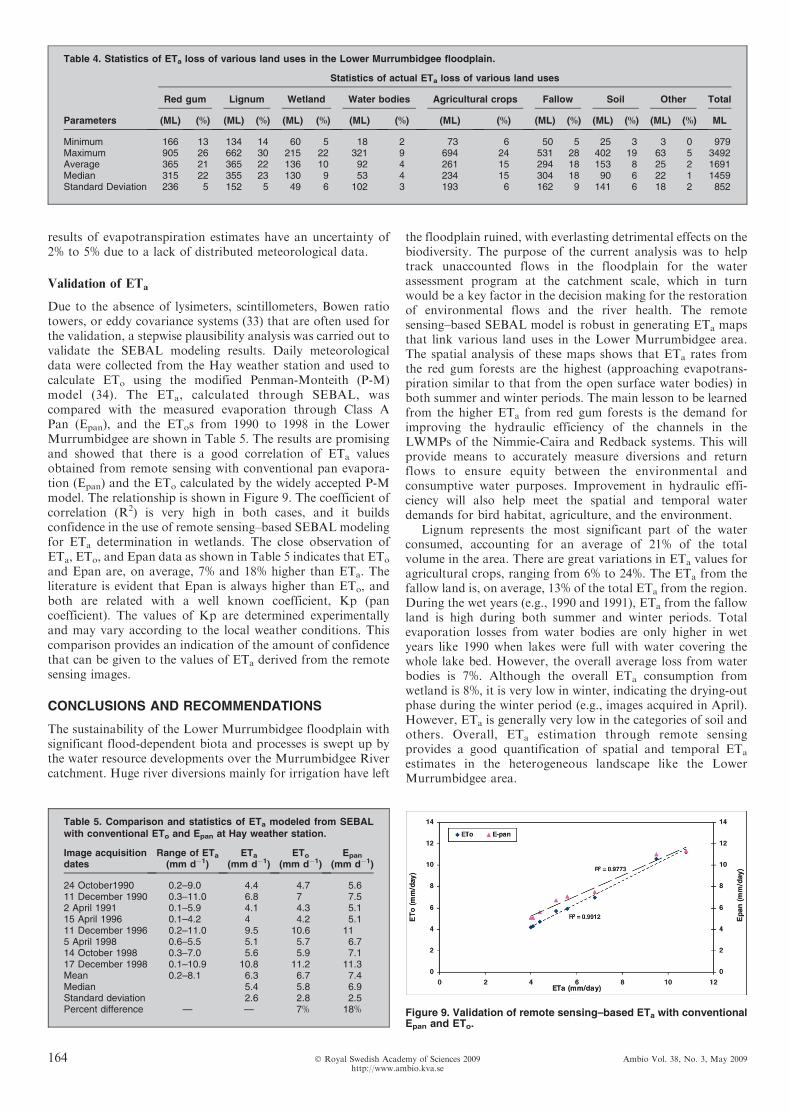
A summary of ETa for different land uses is presented inTable 3, which shows that total amount of water consumptionthrough ETa ranges from 979 ML (on 17 December 1998) to
3492 ML (on 11 December 1990) in the Lower Murrumbidgeefloodplain. The spatial analysis of ETa using remote sensingdata clearly shows that ETa rates from the red gum forests arevery high (approaching evaporation from open surface waterbodies) both for the summer and the winter period. Statistics onoverall water consumption from the land use classes and thefloodplain as a whole are shown in Table 4. It shows that theoverall ETa for red gum forest ranges from 13% to 26% with anaverage of 21% (equivalent to 365 ML). The red gum forests arepatchy at the junction of Nimmie-Caira and the Redbankareas, indicating the lower capacity of the floodplains to passwater.
In terms of total ETa from different land uses, lignumrepresents the most significant part of the ETa, ranging 14% to30% of the total water consumed with an average of 21% in thefloodplain. The ETa consumption from agriculture crops rangesfrom 6% to 24%, and ETa from winter cropping areas during thesummer ponding period can be the third highest consumer ofwater after the red gum and lignum. Similarly, ETa from thefallow land is significant, representing 5–28% (average of 18%)of total ETa from the region. During the wet years (e.g., 1990and 1991), ETa from the fallow land is high during both thesummer and winter periods. Total ETa consumption from water
Table 3. Total amount of water consumption for major land uses on different image acquisition dates in the Lower Murrumbidgee floodplain.
Image acquisitiondates
ETa loss of various land uses
Red gum Lignum Wetland Water bodies Agricultural crops Fallow Soil Other Total
(ML) (%) (ML) (%) (ML) (%) (ML) (%) (ML) (%) (ML) (%) (ML) (%) (ML) (%) ML
24 October 1990 402 17 452 19 114 5 157 7 309 13 531 22 402 17 34 1 240111 December 1990 905 26 662 19 159 5 321 9 694 20 443 13 289 8 19 1 34922 April 1991 166 13 286 23 60 5 23 2 73 6 355 28 242 19 63 5 126815 April 1996 206 21 295 30 103 10 18 2 81 8 252 26 25 3 3 0 98311 December 1996 374 26 350 24 144 10 48 3 210 14 205 14 111 8 19 1 14615 April 1998 256 18 360 25 115 8 38 3 228 16 382 26 69 5 8 1 145614 October 1998 387 26 378 25 181 12 73 5 255 17 136 9 53 4 28 2 149117 December 1998 227 23 134 14 215 22 57 6 239 24 50 5 32 3 25 3 979
Figure 6. Map of ETa (mm d�1) and amount of ETa from different land use classes using Landsat 5 TM on (a) 24 October 1990 and (b) 11December 1990.
162 Ambio Vol. 38, No. 3, May 2009� Royal Swedish Academy of Sciences 2009http://www.ambio.kva.se
bodies is only higher in wet years like 1990 when lakes were fullwith water and 7% of water is lost. Table 4 shows the lowestaverage water loss of 4% of the total volume consumed from thewater bodies in the Lower Murrumbidgee floodplain. However,ETa consumption is generally even low in the category of‘‘others’’ (which is not a clearly defined area and is difficult toassign an exact ETa loss) in the Lower Murrumbidgeefloodplain.
Spatial distribution of meteorological data is very critical forcapturing the variability in microclimatic conditions of thestudy area. The meteorological data are also required for thecalibration of a satellite-based model for estimating the ETa.However, there were only data from one weather stationavailable for the calibration of the satellite image over the studyarea, which also caused some uncertainty in the finalevapotranspiration results. Many researchers estimate that the
Figure 7. Map of ETa (mm d�1) and amount of ETa from different land use classes using Landsat 5 TM on (a) 15 April 1996 and (b) 11December 1996.
Figure 8. Map of ETa (mm d�1) and amount of ETa from different land use classes using Landsat 5 TM on (a) 5 April 1998 and (b) 14 October1998.
Ambio Vol. 38, No. 3, May 2009 163� Royal Swedish Academy of Sciences 2009http://www.ambio.kva.se
results of evapotranspiration estimates have an uncertainty of2% to 5% due to a lack of distributed meteorological data.
Validation of ETa
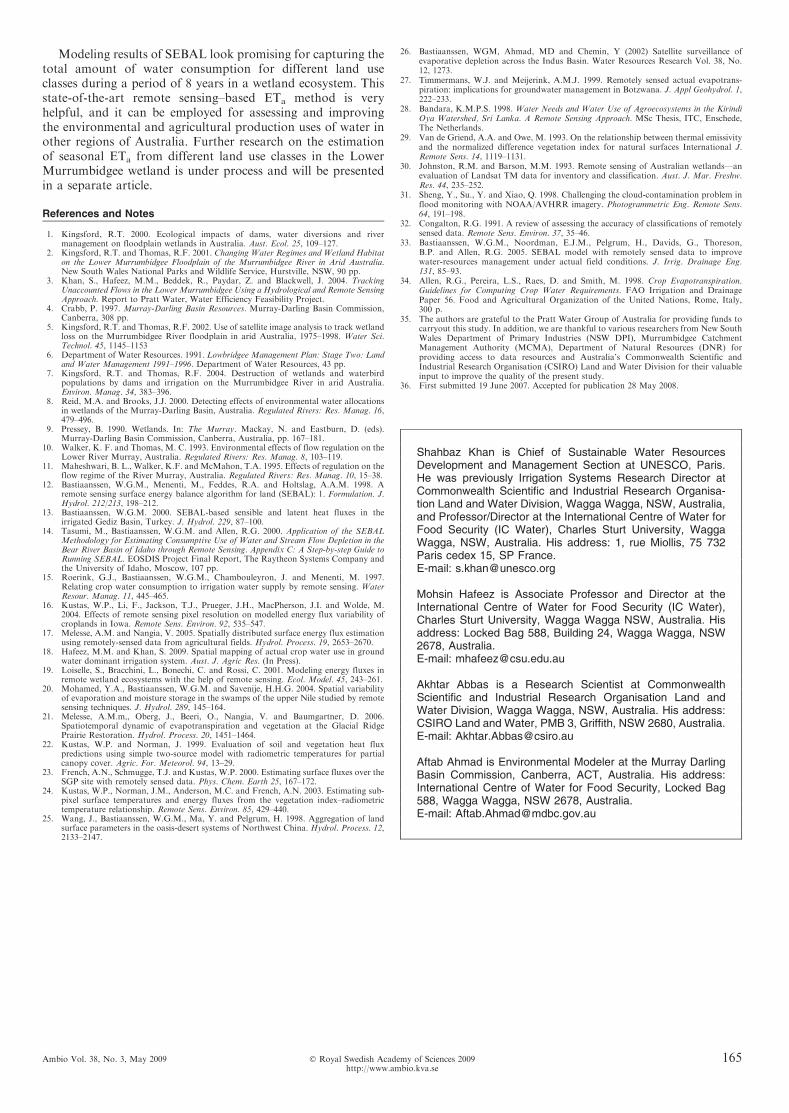
Due to the absence of lysimeters, scintillometers, Bowen ratiotowers, or eddy covariance systems (33) that are often used forthe validation, a stepwise plausibility analysis was carried out tovalidate the SEBAL modeling results. Daily meteorologicaldata were collected from the Hay weather station and used tocalculate ETo using the modified Penman-Monteith (P-M)model (34). The ETa, calculated through SEBAL, wascompared with the measured evaporation through Class APan (Epan), and the ETos from 1990 to 1998 in the LowerMurrumbidgee are shown in Table 5. The results are promisingand showed that there is a good correlation of ETa valuesobtained from remote sensing with conventional pan evapora-tion (Epan) and the ETo calculated by the widely accepted P-Mmodel. The relationship is shown in Figure 9. The coefficient ofcorrelation (R2) is very high in both cases, and it buildsconfidence in the use of remote sensing–based SEBAL modelingfor ETa determination in wetlands. The close observation ofETa, ETo, and Epan data as shown in Table 5 indicates that ETo
and Epan are, on average, 7% and 18% higher than ETa. Theliterature is evident that Epan is always higher than ETo, andboth are related with a well known coefficient, Kp (pancoefficient). The values of Kp are determined experimentallyand may vary according to the local weather conditions. Thiscomparison provides an indication of the amount of confidencethat can be given to the values of ETa derived from the remotesensing images.
CONCLUSIONS AND RECOMMENDATIONS
The sustainability of the Lower Murrumbidgee floodplain withsignificant flood-dependent biota and processes is swept up bythe water resource developments over the Murrumbidgee Rivercatchment. Huge river diversions mainly for irrigation have left
the floodplain ruined, with everlasting detrimental effects on thebiodiversity. The purpose of the current analysis was to helptrack unaccounted flows in the floodplain for the waterassessment program at the catchment scale, which in turnwould be a key factor in the decision making for the restorationof environmental flows and the river health. The remotesensing–based SEBAL model is robust in generating ETa mapsthat link various land uses in the Lower Murrumbidgee area.The spatial analysis of these maps shows that ETa rates fromthe red gum forests are the highest (approaching evapotrans-piration similar to that from the open surface water bodies) inboth summer and winter periods. The main lesson to be learnedfrom the higher ETa from red gum forests is the demand forimproving the hydraulic efficiency of the channels in theLWMPs of the Nimmie-Caira and Redback systems. This willprovide means to accurately measure diversions and returnflows to ensure equity between the environmental andconsumptive water purposes. Improvement in hydraulic effi-ciency will also help meet the spatial and temporal waterdemands for bird habitat, agriculture, and the environment.
Lignum represents the most significant part of the waterconsumed, accounting for an average of 21% of the totalvolume in the area. There are great variations in ETa values foragricultural crops, ranging from 6% to 24%. The ETa from thefallow land is, on average, 13% of the total ETa from the region.During the wet years (e.g., 1990 and 1991), ETa from the fallowland is high during both summer and winter periods. Totalevaporation losses from water bodies are only higher in wetyears like 1990 when lakes were full with water covering thewhole lake bed. However, the overall average loss from waterbodies is 7%. Although the overall ETa consumption fromwetland is 8%, it is very low in winter, indicating the drying-outphase during the winter period (e.g., images acquired in April).However, ETa is generally very low in the categories of soil andothers. Overall, ETa estimation through remote sensingprovides a good quantification of spatial and temporal ETa
estimates in the heterogeneous landscape like the LowerMurrumbidgee area.
Table 4. Statistics of ETa loss of various land uses in the Lower Murrumbidgee floodplain.
Parameters
Statistics of actual ETa loss of various land uses
Red gum Lignum Wetland Water bodies Agricultural crops Fallow Soil Other Total
(ML) (%) (ML) (%) (ML) (%) (ML) (%) (ML) (%) (ML) (%) (ML) (%) (ML) (%) ML
Minimum 166 13 134 14 60 5 18 2 73 6 50 5 25 3 3 0 979Maximum 905 26 662 30 215 22 321 9 694 24 531 28 402 19 63 5 3492Average 365 21 365 22 136 10 92 4 261 15 294 18 153 8 25 2 1691Median 315 22 355 23 130 9 53 4 234 15 304 18 90 6 22 1 1459Standard Deviation 236 5 152 5 49 6 102 3 193 6 162 9 141 6 18 2 852
Table 5. Comparison and statistics of ETa modeled from SEBALwith conventional ETo and Epan at Hay weather station.
Image acquisitiondates
Range of ETa
(mm d�1)ETa
(mm d�1)ETo
(mm d�1)Epan
(mm d�1)
24 October1990 0.2–9.0 4.4 4.7 5.611 December 1990 0.3–11.0 6.8 7 7.52 April 1991 0.1–5.9 4.1 4.3 5.115 April 1996 0.1–4.2 4 4.2 5.111 December 1996 0.2–11.0 9.5 10.6 115 April 1998 0.6–5.5 5.1 5.7 6.714 October 1998 0.3–7.0 5.6 5.9 7.117 December 1998 0.1–10.9 10.8 11.2 11.3Mean 0.2–8.1 6.3 6.7 7.4Median 5.4 5.8 6.9Standard deviation 2.6 2.8 2.5Percent difference — — 7% 18% Figure 9. Validation of remote sensing–based ETa with conventional
Epan and ETo.
164 Ambio Vol. 38, No. 3, May 2009� Royal Swedish Academy of Sciences 2009http://www.ambio.kva.se
Modeling results of SEBAL look promising for capturing thetotal amount of water consumption for different land useclasses during a period of 8 years in a wetland ecosystem. Thisstate-of-the-art remote sensing–based ETa method is veryhelpful, and it can be employed for assessing and improvingthe environmental and agricultural production uses of water inother regions of Australia. Further research on the estimationof seasonal ETa from different land use classes in the LowerMurrumbidgee wetland is under process and will be presentedin a separate article.
References and Notes
1. Kingsford, R.T. 2000. Ecological impacts of dams, water diversions and rivermanagement on floodplain wetlands in Australia. Aust. Ecol. 25, 109–127.
2. Kingsford, R.T. and Thomas, R.F. 2001. Changing Water Regimes and Wetland Habitaton the Lower Murrumbidgee Floodplain of the Murrumbidgee River in Arid Australia.New South Wales National Parks and Wildlife Service, Hurstville, NSW, 90 pp.
3. Khan, S., Hafeez, M.M., Beddek, R., Paydar, Z. and Blackwell, J. 2004. TrackingUnaccounted Flows in the Lower Murrumbidgee Using a Hydrological and Remote SensingApproach. Report to Pratt Water, Water Efficiency Feasibility Project.
4. Crabb, P. 1997. Murray-Darling Basin Resources. Murray-Darling Basin Commission,Canberra, 308 pp.
5. Kingsford, R.T. and Thomas, R.F. 2002. Use of satellite image analysis to track wetlandloss on the Murrumbidgee River floodplain in arid Australia, 1975–1998. Water Sci.Technol. 45, 1145–1153
6. Department of Water Resources. 1991. Lowbridgee Management Plan: Stage Two: Landand Water Management 1991–1996. Department of Water Resources, 43 pp.
7. Kingsford, R.T. and Thomas, R.F. 2004. Destruction of wetlands and waterbirdpopulations by dams and irrigation on the Murrumbidgee River in arid Australia.Environ. Manag. 34, 383–396.
8. Reid, M.A. and Brooks, J.J. 2000. Detecting effects of environmental water allocationsin wetlands of the Murray-Darling Basin, Australia. Regulated Rivers: Res. Manag. 16,479–496.
9. Pressey, B. 1990. Wetlands. In: The Murray. Mackay, N. and Eastburn, D. (eds).Murray-Darling Basin Commission, Canberra, Australia, pp. 167–181.
10. Walker, K. F. and Thomas, M. C. 1993. Environmental effects of flow regulation on theLower River Murray, Australia. Regulated Rivers: Res. Manag. 8, 103–119.
11. Maheshwari, B. L., Walker, K.F. and McMahon, T.A. 1995. Effects of regulation on theflow regime of the River Murray, Australia. Regulated Rivers: Res. Manag. 10, 15–38.
12. Bastiaanssen, W.G.M., Menenti, M., Feddes, R.A. and Holtslag, A.A.M. 1998. Aremote sensing surface energy balance algorithm for land (SEBAL): 1. Formulation. J.Hydrol. 212/213, 198–212.
13. Bastiaanssen, W.G.M. 2000. SEBAL-based sensible and latent heat fluxes in theirrigated Gediz Basin, Turkey. J. Hydrol. 229, 87–100.
14. Tasumi, M., Bastiaanssen, W.G.M. and Allen, R.G. 2000. Application of the SEBALMethodology for Estimating Consumptive Use of Water and Stream Flow Depletion in theBear River Basin of Idaho through Remote Sensing. Appendix C: A Step-by-step Guide toRunning SEBAL. EOSDIS Project Final Report, The Raytheon Systems Company andthe University of Idaho, Moscow, 107 pp.
15. Roerink, G.J., Bastiaanssen, W.G.M., Chambouleyron, J. and Menenti, M. 1997.Relating crop water consumption to irrigation water supply by remote sensing. WaterResour. Manag. 11, 445–465.
16. Kustas, W.P., Li, F., Jackson, T.J., Prueger, J.H., MacPherson, J.I. and Wolde, M.2004. Effects of remote sensing pixel resolution on modelled energy flux variability ofcroplands in Iowa. Remote Sens. Environ. 92, 535–547.
17. Melesse, A.M. and Nangia, V. 2005. Spatially distributed surface energy flux estimationusing remotely-sensed data from agricultural fields. Hydrol. Process. 19, 2653–2670.
18. Hafeez, M.M. and Khan, S. 2009. Spatial mapping of actual crop water use in groundwater dominant irrigation system. Aust. J. Agric Res. (In Press).
19. Loiselle, S., Bracchini, L., Bonechi, C. and Rossi, C. 2001. Modeling energy fluxes inremote wetland ecosystems with the help of remote sensing. Ecol. Model. 45, 243–261.
20. Mohamed, Y.A., Bastiaanssen, W.G.M. and Savenije, H.H.G. 2004. Spatial variabilityof evaporation and moisture storage in the swamps of the upper Nile studied by remotesensing techniques. J. Hydrol. 289, 145–164.
21. Melesse, A.M.m,, Oberg, J., Beeri, O., Nangia, V. and Baumgartner, D. 2006.Spatiotemporal dynamic of evapotranspiration and vegetation at the Glacial RidgePrairie Restoration. Hydrol. Process. 20, 1451–1464.
22. Kustas, W.P. and Norman, J. 1999. Evaluation of soil and vegetation heat fluxpredictions using simple two-source model with radiometric temperatures for partialcanopy cover. Agric. For. Meteorol. 94, 13–29.
23. French, A.N., Schmugge, T.J. and Kustas, W.P. 2000. Estimating surface fluxes over theSGP site with remotely sensed data. Phys. Chem. Earth 25, 167–172.
24. Kustas, W.P., Norman, J.M., Anderson, M.C. and French, A.N. 2003. Estimating sub-pixel surface temperatures and energy fluxes from the vegetation index–radiometrictemperature relationship. Remote Sens. Environ. 85, 429–440.
25. Wang, J., Bastiaanssen, W.G.M., Ma, Y. and Pelgrum, H. 1998. Aggregation of landsurface parameters in the oasis-desert systems of Northwest China. Hydrol. Process. 12,2133–2147.
26. Bastiaanssen, WGM, Ahmad, MD and Chemin, Y (2002) Satellite surveillance ofevaporative depletion across the Indus Basin. Water Resources Research Vol. 38, No.12, 1273.
27. Timmermans, W.J. and Meijerink, A.M.J. 1999. Remotely sensed actual evapotrans-piration: implications for groundwater management in Botzwana. J. Appl Geohydrol. 1,222–233.
28. Bandara, K.M.P.S. 1998. Water Needs and Water Use of Agroecosystems in the KirindiOya Watershed, Sri Lanka. A Remote Sensing Approach. MSc Thesis, ITC, Enschede,The Netherlands.
29. Van de Griend, A.A. and Owe, M. 1993. On the relationship between thermal emissivityand the normalized difference vegetation index for natural surfaces International J.Remote Sens. 14, 1119–1131.
30. Johnston, R.M. and Barson, M.M. 1993. Remote sensing of Australian wetlands—anevaluation of Landsat TM data for inventory and classification. Aust. J. Mar. Freshw.Res. 44, 235–252.
31. Sheng, Y., Su., Y. and Xiao, Q. 1998. Challenging the cloud-contamination problem inflood monitoring with NOAA/AVHRR imagery. Photogrammetric Eng. Remote Sens.64, 191–198.
32. Congalton, R.G. 1991. A review of assessing the accuracy of classifications of remotelysensed data. Remote Sens. Environ. 37, 35–46.
33. Bastiaanssen, W.G.M., Noordman, E.J.M., Pelgrum, H., Davids, G., Thoreson,B.P. and Allen, R.G. 2005. SEBAL model with remotely sensed data to improvewater-resources management under actual field conditions. J. Irrig. Drainage Eng.131, 85–93.
34. Allen, R.G., Pereira, L.S., Raes, D. and Smith, M. 1998. Crop Evapotranspiration.Guidelines for Computing Crop Water Requirements. FAO Irrigation and DrainagePaper 56. Food and Agricultural Organization of the United Nations, Rome, Italy,300 p.
35. The authors are grateful to the Pratt Water Group of Australia for providing funds tocarryout this study. In addition, we are thankful to various researchers from New SouthWales Department of Primary Industries (NSW DPI), Murrumbidgee CatchmentManagement Authority (MCMA), Department of Natural Resources (DNR) forproviding access to data resources and Australia’s Commonwealth Scientific andIndustrial Research Organisation (CSIRO) Land and Water Division for their valuableinput to improve the quality of the present study.
36. First submitted 19 June 2007. Accepted for publication 28 May 2008.
Shahbaz Khan is Chief of Sustainable Water ResourcesDevelopment and Management Section at UNESCO, Paris.He was previously Irrigation Systems Research Director atCommonwealth Scientific and Industrial Research Organisa-tion Land and Water Division, Wagga Wagga, NSW, Australia,and Professor/Director at the International Centre of Water forFood Security (IC Water), Charles Sturt University, WaggaWagga, NSW, Australia. His address: 1, rue Miollis, 75 732Paris cedex 15, SP France.E-mail: [email protected]
Mohsin Hafeez is Associate Professor and Director at theInternational Centre of Water for Food Security (IC Water),Charles Sturt University, Wagga Wagga NSW, Australia. Hisaddress: Locked Bag 588, Building 24, Wagga Wagga, NSW2678, Australia.E-mail: [email protected]
Akhtar Abbas is a Research Scientist at CommonwealthScientific and Industrial Research Organisation Land andWater Division, Wagga Wagga, NSW, Australia. His address:CSIRO Land and Water, PMB 3, Griffith, NSW 2680, Australia.E-mail: [email protected]
Aftab Ahmad is Environmental Modeler at the Murray DarlingBasin Commission, Canberra, ACT, Australia. His address:International Centre of Water for Food Security, Locked Bag588, Wagga Wagga, NSW 2678, Australia.E-mail: [email protected]
Ambio Vol. 38, No. 3, May 2009 165� Royal Swedish Academy of Sciences 2009http://www.ambio.kva.se
Related Documents