Spatial and temporal variability of fires in relation to ecosystems, land tenure and rainfall in savannas of northern South America M. ROMERO-RUIZ *, A. ETTER w , A. SARMIENTO w and K . T A N S E Y * *Department of Geography, University of Leicester, University Road, Leicester LE1 7RH, UK, wDepartamento de Ecologı ´a y Territorio, Facultad Estudios Ambientales y Rurales, Universidad Javeriana, Tr. 4 Nr 42-00 piso 8, Bogota ´ DC, Colombia Abstract Fire is a predominant factor forcing global terrestrial biomass dynamics, with more than 30% of the land surface showing frequent burning, particularly in the tropics, where it mostly affects savannas ecosystems annually. Savannas, which cover approximately 269 million ha in South America, play a major role in the global carbon cycle. They are affected by increasing human pressures and global climate change. Using satellite data, this study quantifies vegetation burning in the Colombian Llanos savannas for the period 2000–2008, and analyzes how fire spatial pattern, frequency and extent vary with ecosystem type, land tenure and rainfall. On average 2.75 0.5 million ha (24 4.2%) of the savannas burn each year. Burned area is highly variable, with 3.4 million ha burned in 2002–2003 and o1.9 million ha in 2005– 2006. However, during the 2000–2008 period near of 3.7 million ha (33.5%) of the savannas never burned. Compared with the average 8–10 years of fire return time for the tropics and subtropics, these savannas burn twice as often. In addition, the average burn size figure for tropical and subtropical grassland savannas (with o5% trees) of 7000 ha (median 5000 ha), is about seven times the average burned patch size we found in our study. Fires predominate in the well-drained high plain savannas, lowest figures occurring along the Andean foothills, in forested areas and in pasture and croplands. Annual proportion burned varies with land tenure, being highest in National Parks. This study is the first complete regional map of fire disturbance in a South American savanna. This detailed regional data provides a unique opportunity for increasing the accuracy of global carbon emission calculations. Keywords: burned area, Colombia, fire, Llanos Orientales, Modis, satellite Received 23 June 2009 and accepted 17 August 2009 Introduction Human induced land cover change is considered to be one of the most important processes affecting ecosystem structure, carbon and nutrient cycling, greenhouse gas emissions and land–atmosphere energy exchange, all contributing to global ecological change (Foley et al., 2005). Factors driving land cover dynamics such as fire are key actors in these processes. More than 30% of the global land surface shows significant fire frequencies particularly in the tropical belt 201N–301S (Chuvieco et al., 2008a; Tansey et al., 2008). Between 2000 and 2007 more than 3900 million ha of burned area was detected globally, 80% occurring in woodlands and scrublands, and 17% in grasslands and croplands (Cochrane, 2002; Tansey et al., 2004, 2008). Most of these fires are asso- ciated with savanna vegetation taking place in Africa, Australia, and South America (Andreae, 1992; Hao & Liu, 1994). Savannas play a role in the global carbon cycle given their belowground storage capacity, seasonal burning, regrowth and tree-grass dynamics. Savanna fires are a major source of CO 2 release to the atmosphere (Mouillot et al., 2006), and fires associated with tropical grazing systems are thought to have been contributing to 440% of globally burned phytomass (Hall & Scurlock, 1991). Van der Werf et al. (2003) in turn, estimates carbon emissions from fires in the tropics to represent 9% of the NPP (4 Pg C yr 1 ), and the portion of NPP con- sumed by in for tropical savannas to be around 25%. Emissions from fires have increased over the last 100 years, from 30% to 50% mainly in the tropical areas (Mouillot et al., 2006). Fire is a seasonal phenomenon with peaks associated with dry seasons. During the wet season normally there Correspondence: M. Romero, tel. 1 44 571 2576639, fax 1 44 571 2018326, e-mail: [email protected] Global Change Biology (2010) 16, 2013–2023, doi: 10.1111/j.1365-2486.2009.02081.x r 2009 Blackwell Publishing Ltd 2013

Welcome message from author
This document is posted to help you gain knowledge. Please leave a comment to let me know what you think about it! Share it to your friends and learn new things together.
Transcript
Spatial and temporal variability of fires in relation toecosystems, land tenure and rainfall in savannas ofnorthern South America
M . R O M E R O-R U I Z *, A . E T T E R w , A . S A R M I E N T O w and K . T A N S E Y *
*Department of Geography, University of Leicester, University Road, Leicester LE1 7RH, UK, wDepartamento de Ecologıa
y Territorio, Facultad Estudios Ambientales y Rurales, Universidad Javeriana, Tr. 4 Nr 42-00 piso 8, Bogota DC, Colombia
Abstract
Fire is a predominant factor forcing global terrestrial biomass dynamics, with more than 30%of the land surface showing frequent burning, particularly in the tropics, where it mostlyaffects savannas ecosystems annually. Savannas, which cover approximately 269 million ha inSouth America, play a major role in the global carbon cycle. They are affected by increasinghuman pressures and global climate change. Using satellite data, this study quantifiesvegetation burning in the Colombian Llanos savannas for the period 2000–2008, and analyzeshow fire spatial pattern, frequency and extent vary with ecosystem type, land tenure andrainfall. On average 2.75� 0.5 million ha (24� 4.2%) of the savannas burn each year. Burnedarea is highly variable, with 3.4 million ha burned in 2002–2003 and o1.9 million ha in 2005–2006. However, during the 2000–2008 period near of 3.7 million ha (33.5%) of the savannasnever burned. Compared with the average 8–10 years of fire return time for the tropics andsubtropics, these savannas burn twice as often. In addition, the average burn size figure fortropical and subtropical grassland savannas (with o5% trees) of 7000 ha (median 5000 ha), isabout seven times the average burned patch size we found in our study. Fires predominate inthe well-drained high plain savannas, lowest figures occurring along the Andean foothills, inforested areas and in pasture and croplands. Annual proportion burned varies with landtenure, being highest in National Parks. This study is the first complete regional map of firedisturbance in a South American savanna. This detailed regional data provides a uniqueopportunity for increasing the accuracy of global carbon emission calculations.
Keywords: burned area, Colombia, fire, Llanos Orientales, Modis, satellite
Received 23 June 2009 and accepted 17 August 2009
Introduction
Human induced land cover change is considered to be
one of the most important processes affecting ecosystem
structure, carbon and nutrient cycling, greenhouse gas
emissions and land–atmosphere energy exchange, all
contributing to global ecological change (Foley et al.,
2005). Factors driving land cover dynamics such as fire
are key actors in these processes. More than 30% of the
global land surface shows significant fire frequencies
particularly in the tropical belt 201N–301S (Chuvieco
et al., 2008a; Tansey et al., 2008). Between 2000 and 2007
more than 3900 million ha of burned area was detected
globally, 80% occurring in woodlands and scrublands,
and 17% in grasslands and croplands (Cochrane, 2002;
Tansey et al., 2004, 2008). Most of these fires are asso-
ciated with savanna vegetation taking place in Africa,
Australia, and South America (Andreae, 1992; Hao &
Liu, 1994).
Savannas play a role in the global carbon cycle given
their belowground storage capacity, seasonal burning,
regrowth and tree-grass dynamics. Savanna fires are a
major source of CO2 release to the atmosphere (Mouillot
et al., 2006), and fires associated with tropical grazing
systems are thought to have been contributing to 440%
of globally burned phytomass (Hall & Scurlock, 1991).
Van der Werf et al. (2003) in turn, estimates carbon
emissions from fires in the tropics to represent 9% of
the NPP (4 Pg C yr�1), and the portion of NPP con-
sumed by in for tropical savannas to be around 25%.
Emissions from fires have increased over the last 100
years, from 30% to 50% mainly in the tropical areas
(Mouillot et al., 2006).
Fire is a seasonal phenomenon with peaks associated
with dry seasons. During the wet season normally thereCorrespondence: M. Romero, tel. 1 44 571 2576639, fax 1 44 571
2018326, e-mail: [email protected]
Global Change Biology (2010) 16, 2013–2023, doi: 10.1111/j.1365-2486.2009.02081.x
r 2009 Blackwell Publishing Ltd 2013
is an establishment of an herbaceous carpet that dries
quickly in the dry leading to increased fire risks. In
northern South America, specifically in Colombia and
Venezuela, fires occur in a dry season between Decem-
ber and early April (Dwyer et al., 2000). Besides climate,
land management practices are a major factor determin-
ing soil and vegetation characteristics, and driving the
ecological processes of savannas that control the
amounts of C within the terrestrial pool, such as fire
frequencies and biomass accumulation (Hoffmann et al.,
2002; Grace et al., 2006). Humans have used fire to
develop roads, establish crop areas, eliminate grass
and other types of nondesirable vegetation, eliminate
culture wastes, hunt, and to develop methods to pre-
vent natural disasters (Laris, 2002; Wardell et al., 2004).
The global characterization of fire activity by Chuvieco
et al. (2008a) concludes on the importance of socio-
economic drivers such as population density, accessi-
bility and economic availability in determining the
density, intensity and variability of fire patterns.
In Latin America there is an increasing human pres-
sure on savannas due to the role such ecosystems are
playing in the world food supply (Brannstrom et al.,
2008). In the Brazilian savannas burning frequency
increased due to more intensive management of the
native grasslands for cattle grazing (Coutinho, 1990),
while in areas of intensive agriculture and improved
pastures burning has been disappearing (Brannstrom
et al., 2008). In Colombia there has been an increasing
expansion of the agricultural front into the savannas of
the Llanos during the last 30 years. Such human pres-
sures are driving big changes in the ecological processes
by affecting fire regimes, hydrology and nutrient cycles
including the capture and emission of green house
gasses (Asner et al., 2004).
Because savannas are naturally subject to frequent
fires, they also are dynamic aggrading systems and will
tend to sequester carbon in periods of fire exclusion. It
has been shown for Africa, that fires play an important
role as a disturbance factor affecting vegetation struc-
ture, woody cover and biomass accumulation, espe-
cially in mesic savannas with mean annual rainfall
4350 mm (Sankaran et al., 2005). Grace et al. (2006)
argue that in the framework of the global climate
change savannas could potentially help with carbon
sequestration if emissions from fires and grazing were
controlled by management options. Scurlock & Hall
(1998) contend that savannas account globally for an
estimated annual carbon sink of up to 0.5 Pg C.
However, carbon accounting still relies too much on
global average figures with few regional studies. Emis-
sions from fires can vary significantly due to local and
regional differences in ecosystem type, biomass and
combustion efficiencies (Van Der Werf et al., 2003).
Regional differences are highly relevant because savan-
nas vary much depending on the proportions of grass
and shrub/tree components as a response to soil, cli-
mate and management (Eiten, 1971). Delmas et al. (1995)
and Barbosa & Fearnside (2005a) have shown the com-
plexity of the burning processes in savanna fires, with
fire density and severity influenced by physical controls
(combustion), biological characteristics (biomass quan-
tity and quality), environmental factors (topography
and climate) and management practices. With global
warming some of these factors will change due to the
expected temperature increases and longer droughts in
this biome. Hoffmann et al. (2002) conclude that there is
an apparent positive feedback between rising carbon
emissions, global warming and fires, which could
increase fire frequency by 40% in the near future.
There are, however, large uncertainties in the stocks
and fluxes of carbon, and especially in the fluxes
attributable to burning and the impacts of land use
change (Grace et al., 2006). Burned area is a most
significant uncertainty factor of up to 50% of the mean
annual estimates (Van Der Werf et al., 2003). A funda-
mental problem regarding the estimates of carbon emis-
sions is the lack of spatially explicit regional analyses
that can be included in calculations, under the wide
range of biophysical and management conditions in
savannas. Wassmann & Vlek (2004) argue that in order
to get better estimates of fluxes, it is essential to inte-
grate GIS databases that can capture the heterogeneity
of natural factors and management, rather than look to
providing more detailed field data. In their study of the
global characterization of fire regimes Chuvieco et al.
(2008a) point to the need to address two aspects: (i)
exploring the relations between human and biophysical
variables at the regional scale, and (ii) the study of
the spatial variations of the fire patterns using spatial
metrics.
South American savannas cover approximately
269 million ha or in other words 8–10% of the global
savanna biome, and are subject to intense human pres-
sure (Grace et al., 2006; Chuvieco et al., 2008b). The
Llanos of Colombia and Venezuela is an important
savanna region in South America covering some 45 mil-
lion ha. The Llanos exhibit high fire frequencies (Tansey
et al., 2008), but lack a comprehensive regional knowl-
edge on the spatial and temporal burning patterns. This
paper addresses a first spatially explicit regional analy-
sis study of fire patterns for the Colombian Llanos
savannas. We address the variability of the burning
patterns using the best available satellite data for the
period of 2000–2008. A specific aim was to establish the
extent, recurrence and area patterns in relation to bio-
physical and management factors, such as rainfall,
ecosystem type and land tenure.
2014 M . R O M E R O-R U I Z et al.
r 2009 Blackwell Publishing Ltd, Global Change Biology, 16, 2013–2023
Materials and methods
Study area
In Colombia, the Llanos region covers almost 17
million ha located between 2.51 to 71N and �741 to
�671W with an altitude ranging between 200 and
400 m. Annual rainfall varies between 1500 and
2500 mm in an east–west gradient. The dry season runs
from December through the end of March. The mean
annual temperature fluctuates between 27 1C and 30 1C
in the dry months and 23 1C and 26 1C in the rainy
season (Etter, 1998a). Relative humidity varies between
60% and 90%. In the year 2000, nearly 11 million ha
(65%) of the Llanos region correspond to grassland
savanna ecosystems and the remaining 6 million ha
are distributed between gallery forest (a narrow strip
of forest found next to rivers), crops, introduced pas-
tures and water bodies. The region is composed of two
main physiographic units divided by the River Meta:
the Andean piedmont to the north and the high-plains
to the south. The savanna landscapes are composed of flat
to rolling plains and comprise three major geomorpholo-
gic units: (i) the quaternary foothills of the Andes; (ii) the
tertiary sedimentary plains with various incision levels
south of the Meta and Orinoco rivers; and (iii) the sandy
foothills and plains west of the Orinoco river. The Andean
piedmont (i) includes large areas of wetlands and season-
ally flooded savannas in the lower parts close to the River
Meta, which run northeast into Venezuelan Apure region.
The Llanos savannas are generally chemically poor, soil
limited ecosystems(pedobiomes), where Ultisols and Oxi-
sols predominate (Instituto Geografico Agustin Codazzi –
IGAC, 1983). However, savannas in the region are quite
heterogeneous and include several ecosystem types ac-
cording to their geomorphology, soils, flooding, and ve-
getation type (Fig. 1, Table 1).
Until the arrival of the Spanish in the 1500s the region
was occupied for several thousand years by aboriginal
hunter gatherer and few farmer communities (Rausch,
1994). Spanish missions introduced cattle and the
Llanos stayed until a few decades ago, a frontier area
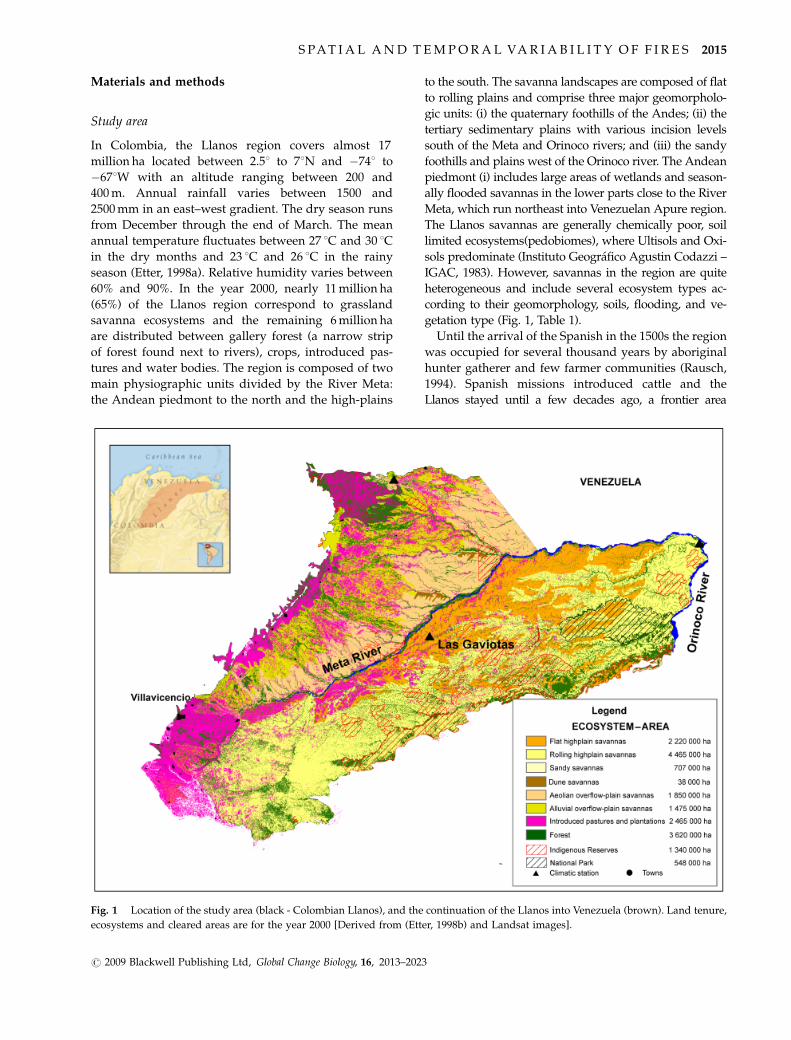
Fig. 1 Location of the study area (black - Colombian Llanos), and the continuation of the Llanos into Venezuela (brown). Land tenure,
ecosystems and cleared areas are for the year 2000 [Derived from (Etter, 1998b) and Landsat images].
S PA T I A L A N D T E M P O R A L VA R I A B I L I T Y O F F I R E S 2015
r 2009 Blackwell Publishing Ltd, Global Change Biology, 16, 2013–2023
dominated by extensive cattle grazing. With the exploita-
tion of oil fields in the 1980s, development of infrastructure
in the region lead to increasing the regional economy and
to more profitable agricultural production. Large areas
of natural savannas changed from the predominantly
extensive grazing to more intensive agricultural uses,
with nowadays 2.5 million ha of introduced pastures
(Brachiaria sp.), 120 000 ha of oil palm and timber planta-
tions, and 180 000 ha of rice and other crops. However,
extensive cattle grazing is currently still the dominant
land use in area, with a cattle herd of approximately
5.5 million head, which relies on burning to provide
regrowth forage for the cattle in the dry season.
The Llanos are still sparsely populated with current
population of the region approximately 1.4 million or
o5% of the country total, 31% living in rural areas.
Most of the population is concentrated within 50 km of
the Andean mountain range, where the major center
Villavicencio with 350 000 inhabitants, is located. Also
20 minor towns with up to 20 000 inhabitants exist. The
major economic center, Villavicencio is well connected
to the capital Bogota. The economy of the region de-
pends mainly from the exploitation of oil fields, cattle
ranching and intensive agriculture (irrigated rice, sor-
ghum), and increasingly also on oil palm and forestry
plantations, mainly along the western part of the region.
Land tenure in the region includes privately owned
ranches (480% of area), as well as indigenous reserves
formally established in the 1990s with a total area (TA)
of 1 340 000 ha, and the National Park ‘El Tuparro’ of
548 000 ha created in 1973 (Fig. 1).
Burned area mapping
To analyze fire patterns we used the MODerate-resolu-
tion Imaging Spectroradiometer (MODIS) composite
surface reflectance (MOD09A1) Level 2 product,
which has a 500 m spatial and 8-day temporal resolution.
Level 2, corresponds to the atmospherically corrected
surface reflectance product composed of seven bands:
band 1 – visible red (620–670� 10�9 m); band 2 – near
infrared (NIR) (841–876� 10�9 m); band 3 – blue (459–
479� 10�9 m); band 4 – green (545–565� 10�9 m); band
5 – short wave infrared SWIR (1.230–1.250� 10�9 m); band
6 – medium wave infrared MIR (1.628–1.652� 10�9 m) and
band 7 – long wave infrared LIR (2.105–2.155� 10�9 m).
It has been shown that 490% of fires occur in the
peak of the dry season (Dwyer et al., 2000; Barbosa &
Fearnside, 2005b). We used data from end December to
early April to ensure inclusion of the whole dry season,
for all available data for the years 2000 through 2008.
Data were downloaded from the WIST System (https://
wist.echo.nasa.gov/api/). Images were downloaded,
subset and reprojected to UTM zone 191N. To eliminate
nonfuel areas such as water bodies, wetlands, river
sand banks, rocky outcrops and urban areas we used
land cover obtained from Landsat ETM products to
mask these areas. In some cases it was necessary to
eliminate clouds and shadows, for which we adopted
an unsupervised classification. To extract the burned
and not-burned areas we used the burned area index
(BAIM) developed by Martin et al. (2005) based on the
near and short wave infrared bands relationship:
BAIM ¼ 1
ðrCnir � rnirÞ2 þ ðrCswir � rswirÞ
2ð1Þ
where, rnir 5 near-infrared pixel reflectance, rswir 5
short wave infrared pixel reflectance and rCnir 5 0.04
and rCswir 5 0.2.
The BAIM threshold value was based on the mean
and standard deviation of the index, with pixels defined
as burned whenever their index value fell within the
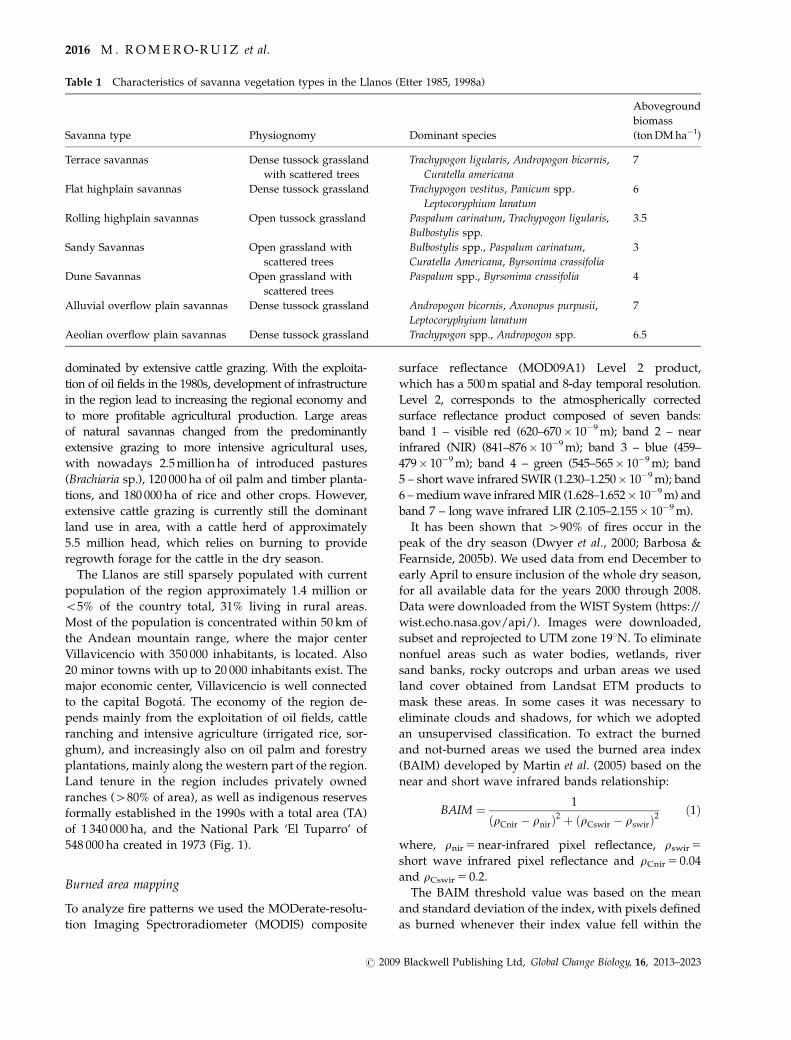
Table 1 Characteristics of savanna vegetation types in the Llanos (Etter 1985, 1998a)
Savanna type Physiognomy Dominant species
Aboveground
biomass
(ton DM ha�1)
Terrace savannas Dense tussock grassland
with scattered trees
Trachypogon ligularis, Andropogon bicornis,
Curatella americana
7
Flat highplain savannas Dense tussock grassland Trachypogon vestitus, Panicum spp.
Leptocoryphium lanatum
6
Rolling highplain savannas Open tussock grassland Paspalum carinatum, Trachypogon ligularis,
Bulbostylis spp.
3.5
Sandy Savannas Open grassland with
scattered trees
Bulbostylis spp., Paspalum carinatum,
Curatella Americana, Byrsonima crassifolia
3
Dune Savannas Open grassland with
scattered trees
Paspalum spp., Byrsonima crassifolia 4
Alluvial overflow plain savannas Dense tussock grassland Andropogon bicornis, Axonopus purpusii,
Leptocoryphyium lanatum
7
Aeolian overflow plain savannas Dense tussock grassland Trachypogon spp., Andropogon spp. 6.5
2016 M . R O M E R O-R U I Z et al.
r 2009 Blackwell Publishing Ltd, Global Change Biology, 16, 2013–2023
range of 3 SD. In a subsequent processing step, the pixel
clusters identified as burn scars and being smaller than
25 ha.
The accuracy of burned area product was done with
the use of high resolution satellite images for two
different periods: Landsat images for 2001 (456_January
9, 457_March 14, 556_January 8 and 557_February 2)
and CBERS images for 2006–2007 (183093 and 183094_
February 9, 2007, 185093 and 185094, January 1, 2006,
185095_February 03 and 187096_January 1, 2007)
(http://www.cbers.inpe.br/en/index_en.htm). Those
images are freeing available and present between 2%
and 3% of cover in clouds and shadows. This step was
based on NDVI classifications associated with super-
vised and visual interpretation, using 4, 5, 3 band
combination from which fire perimeters were derived.
A 3� 3 filter was applied to remove the ‘Salt and
pepper’ effect of automatic classification. After that a
visual classification was done to separate old and new
burned areas, taking the darkest clusters as recent burn
scars. Fire scars were extracted and compared with the
8 days MODIS burned areas classification. All these
products were spatially compared with to a hexagonal
tessellation of 5 km� 5 km. The total burned scars area
inside of every grid cell was divided by the overall of
the grid cell area to obtain the percentage of burned
scars in every cell. The accuracy for both classifications
was validated using the Kappa coefficient (k), as well as
the cross-tabulation of results.
In a subsequent step, the spatial pattern of the burn-
ing scars for each mapping season (e.g. 2000–2001,
2001–2002) was analyzed using a set of landscape
metrics: TA, number of patches (NP), mean patch area
(MPA) and patch area coefficient of variation (CV) using
the FRAGSTATS software (McGarigal et al., 2002).
Burning patterns and their relation to rainfall, ecosystemtype and land tenure
Rainfall. We used daily rainfall data from the months
December through April for the 2000–2008 study period
from four rainfall stations spread out over the study
area (Fig. 1), obtained from the Instituto de Hidrologıa,
Meteorologıa y Estudios Ambientales (IDEAM) http://
www.ideam.gov.co/. To analyze the relationship of
rainfall data of climate stations with the fire patterns
in the study area, we extracted the burned area for each
month in a radius of 50 km around each rainfall station,
to represent the local conditions while capturing
enough spatial variability. The area being flat, the aver-
age rainfall variability is not be affected by relief. We
then calculated the regression between the burned area
and total rainfall for each month.
Ecosystem types and land tenure. The study area is
heterogeneous in ecological terms and land tenure. We
therefore analyzed the burning patterns in relation to
ecosystem type and the land tenure in a GIS. The Eco-
system map was built using the savanna ecosystem
types from the map of Etter (1998b). The area of
forests, and cleared savannas of this map was upda-
ted through a supervised classification of Landsat-ETM
and CBERS satellite images. Four general land cover
types were examined: (i) Forest, (ii) Savannas, (iii) Plan-
ted pastures and annual crops, and (iv) Plantations (oil
palm and forestry). Supervised classification was done
using the ERDAS-IMAGINE 9.1 software by selecting
control areas in the form of ‘training areas’ using an
algorithm that considers the spectral characteristics of a
group of pixels assigned to each one of the classes. The
area classified as savanna was subdivided into the
savanna types of the ecosystem map.
The land tenure map was obtained combining two
sources: (i) the National Parks map acquired from
National Park Office (Ministry of Environment-Colombia,
2000); and (ii) the map of Indigenous territories from
Geographic Institute Agustin Codazzi (IGAC).
The average annual burned area for the period
2000–2008 was calculated for each ecosystem and land
tenure type.
Results
Temporal and spatial variability of fires
Fire activity in the Colombian Llanos savannas is highly
concentrated in the dry season spanning the months
December through March, with a marked peak in the
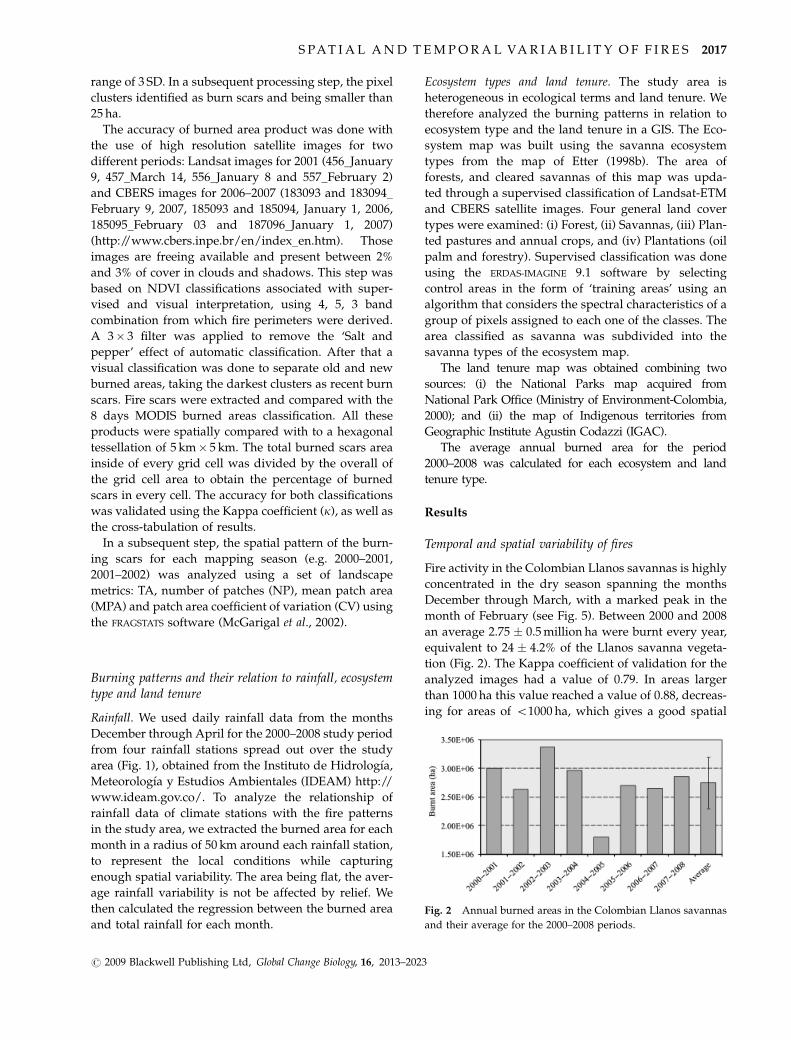
month of February (see Fig. 5). Between 2000 and 2008
an average 2.75 � 0.5 million ha were burnt every year,
equivalent to 24 � 4.2% of the Llanos savanna vegeta-
tion (Fig. 2). The Kappa coefficient of validation for the
analyzed images had a value of 0.79. In areas larger
than 1000 ha this value reached a value of 0.88, decreas-
ing for areas of o1000 ha, which gives a good spatial
Fig. 2 Annual burned areas in the Colombian Llanos savannas
and their average for the 2000–2008 periods.
S PA T I A L A N D T E M P O R A L VA R I A B I L I T Y O F F I R E S 2017
r 2009 Blackwell Publishing Ltd, Global Change Biology, 16, 2013–2023
assessment of burns, at least for medium to large size
fires.
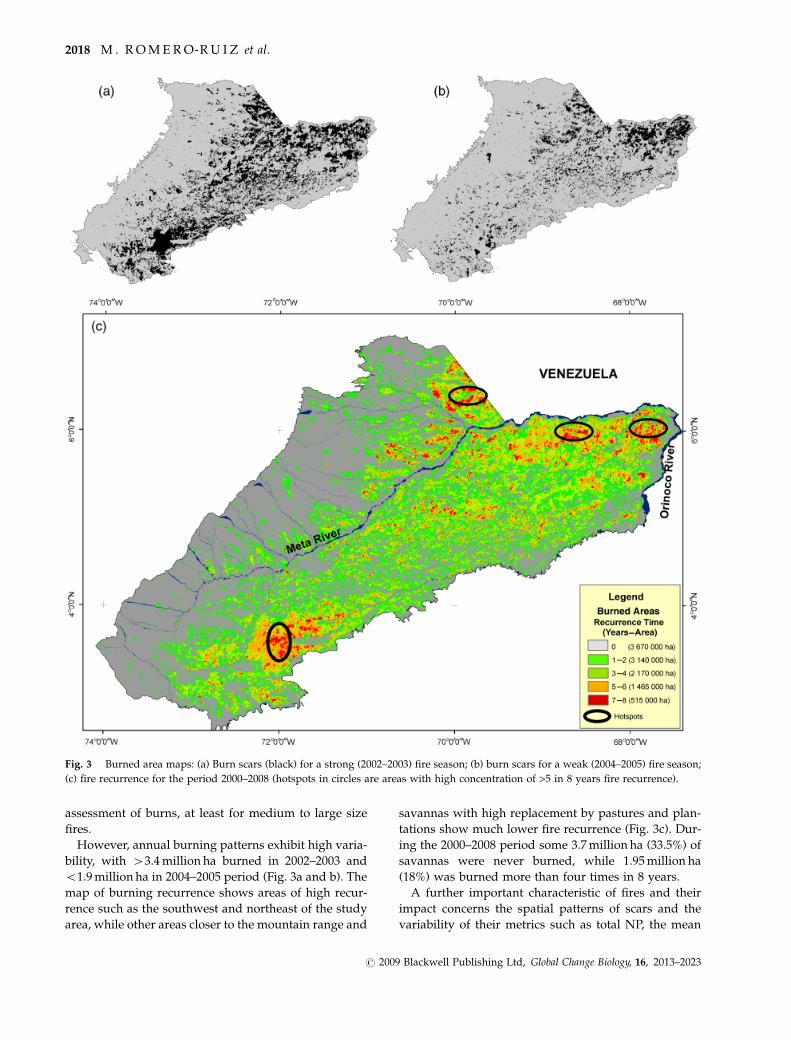
However, annual burning patterns exhibit high varia-
bility, with 43.4 million ha burned in 2002–2003 and
o1.9 million ha in 2004–2005 period (Fig. 3a and b). The
map of burning recurrence shows areas of high recur-
rence such as the southwest and northeast of the study
area, while other areas closer to the mountain range and
savannas with high replacement by pastures and plan-
tations show much lower fire recurrence (Fig. 3c). Dur-
ing the 2000–2008 period some 3.7 million ha (33.5%) of
savannas were never burned, while 1.95 million ha
(18%) was burned more than four times in 8 years.
A further important characteristic of fires and their
impact concerns the spatial patterns of scars and the
variability of their metrics such as total NP, the mean
Fig. 3 Burned area maps: (a) Burn scars (black) for a strong (2002–2003) fire season; (b) burn scars for a weak (2004–2005) fire season;
(c) fire recurrence for the period 2000–2008 (hotspots in circles are areas with high concentration of >5 in 8 years fire recurrence).
2018 M . R O M E R O-R U I Z et al.
r 2009 Blackwell Publishing Ltd, Global Change Biology, 16, 2013–2023
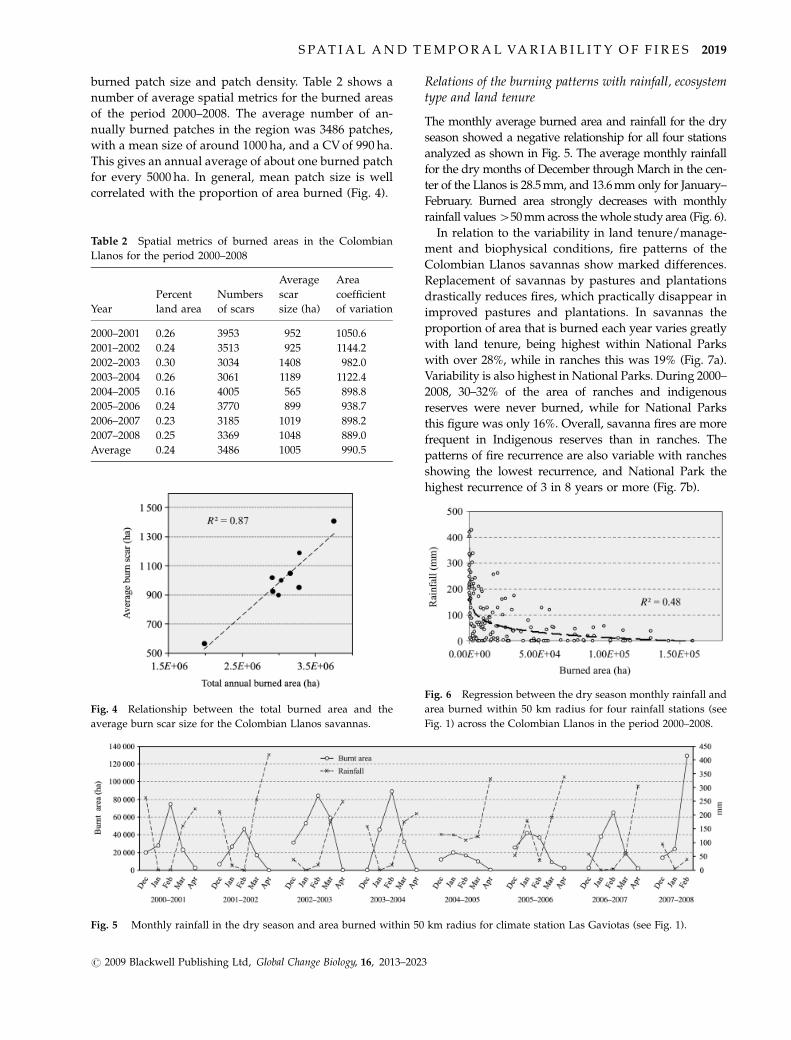
burned patch size and patch density. Table 2 shows a
number of average spatial metrics for the burned areas
of the period 2000–2008. The average number of an-
nually burned patches in the region was 3486 patches,
with a mean size of around 1000 ha, and a CV of 990 ha.
This gives an annual average of about one burned patch
for every 5000 ha. In general, mean patch size is well
correlated with the proportion of area burned (Fig. 4).
Relations of the burning patterns with rainfall, ecosystemtype and land tenure
The monthly average burned area and rainfall for the dry
season showed a negative relationship for all four stations
analyzed as shown in Fig. 5. The average monthly rainfall
for the dry months of December through March in the cen-
ter of the Llanos is 28.5 mm, and 13.6 mm only for January–
February. Burned area strongly decreases with monthly
rainfall values 450 mm across the whole study area (Fig. 6).
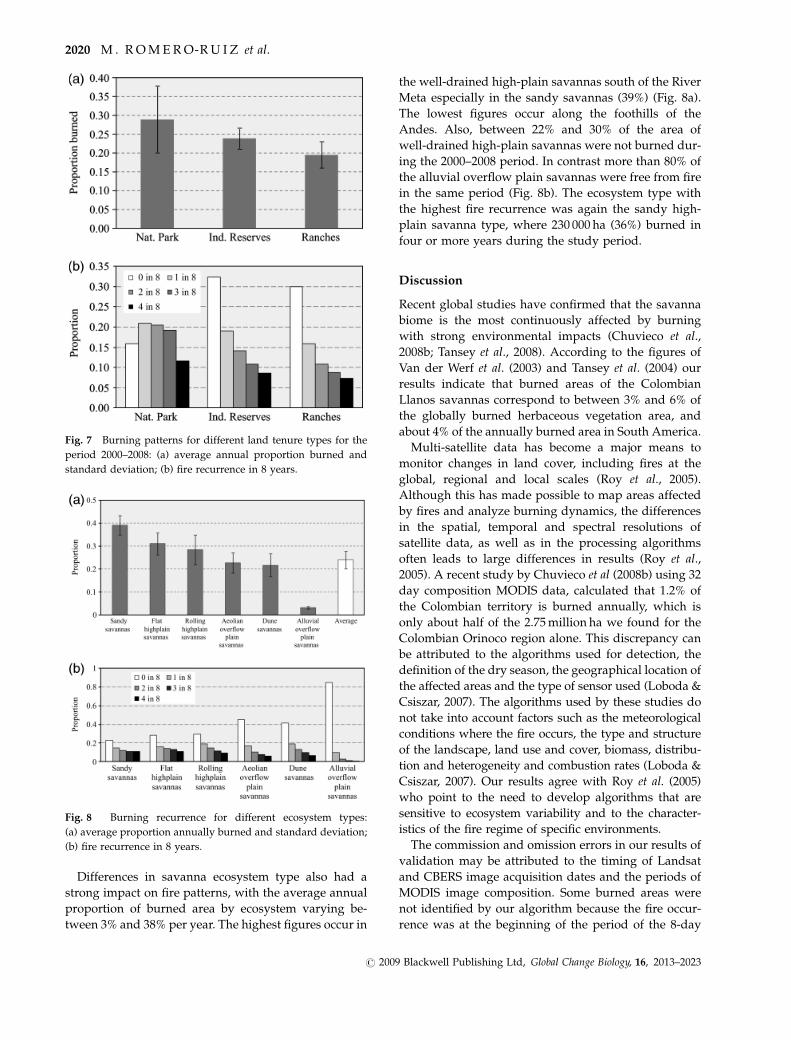
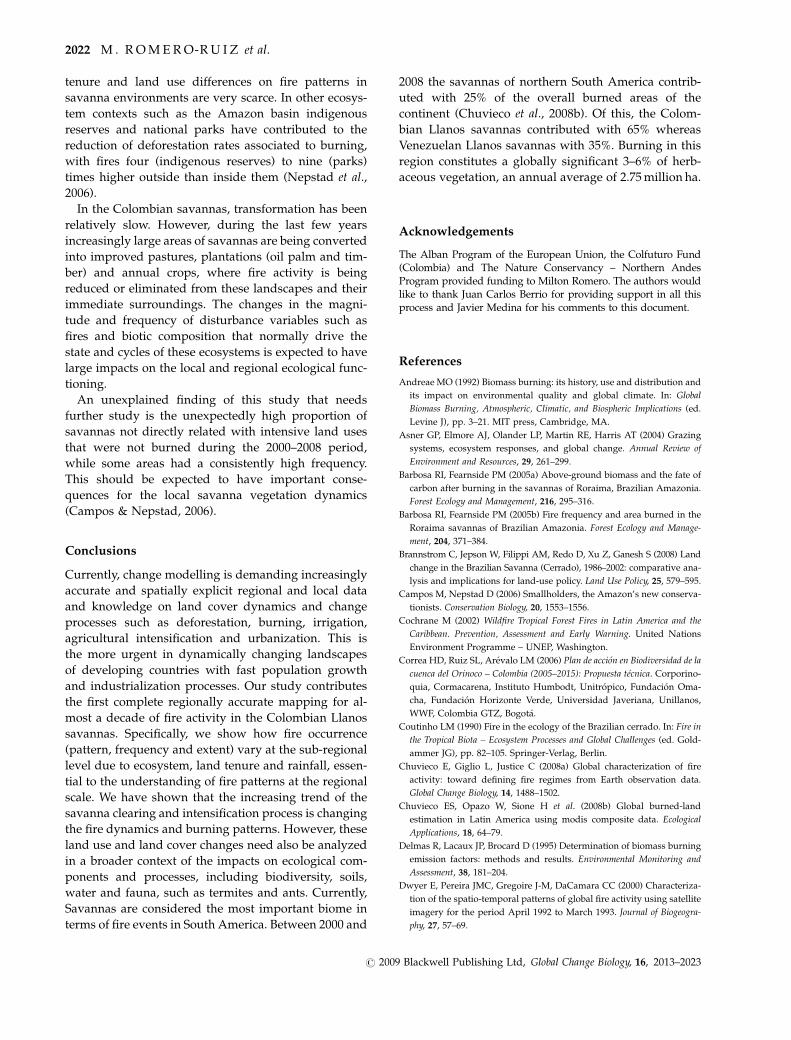
In relation to the variability in land tenure/manage-
ment and biophysical conditions, fire patterns of the
Colombian Llanos savannas show marked differences.
Replacement of savannas by pastures and plantations
drastically reduces fires, which practically disappear in
improved pastures and plantations. In savannas the
proportion of area that is burned each year varies greatly
with land tenure, being highest within National Parks
with over 28%, while in ranches this was 19% (Fig. 7a).
Variability is also highest in National Parks. During 2000–
2008, 30–32% of the area of ranches and indigenous
reserves were never burned, while for National Parks
this figure was only 16%. Overall, savanna fires are more
frequent in Indigenous reserves than in ranches. The
patterns of fire recurrence are also variable with ranches
showing the lowest recurrence, and National Park the
highest recurrence of 3 in 8 years or more (Fig. 7b).
Table 2 Spatial metrics of burned areas in the Colombian
Llanos for the period 2000–2008
Year
Percent
land area
Numbers
of scars
Average
scar
size (ha)
Area
coefficient
of variation
2000–2001 0.26 3953 952 1050.6
2001–2002 0.24 3513 925 1144.2
2002–2003 0.30 3034 1408 982.0
2003–2004 0.26 3061 1189 1122.4
2004–2005 0.16 4005 565 898.8
2005–2006 0.24 3770 899 938.7
2006–2007 0.23 3185 1019 898.2
2007–2008 0.25 3369 1048 889.0
Average 0.24 3486 1005 990.5
Fig. 4 Relationship between the total burned area and the
average burn scar size for the Colombian Llanos savannas.
Fig. 5 Monthly rainfall in the dry season and area burned within 50 km radius for climate station Las Gaviotas (see Fig. 1).
Fig. 6 Regression between the dry season monthly rainfall and
area burned within 50 km radius for four rainfall stations (see
Fig. 1) across the Colombian Llanos in the period 2000–2008.
S PA T I A L A N D T E M P O R A L VA R I A B I L I T Y O F F I R E S 2019
r 2009 Blackwell Publishing Ltd, Global Change Biology, 16, 2013–2023
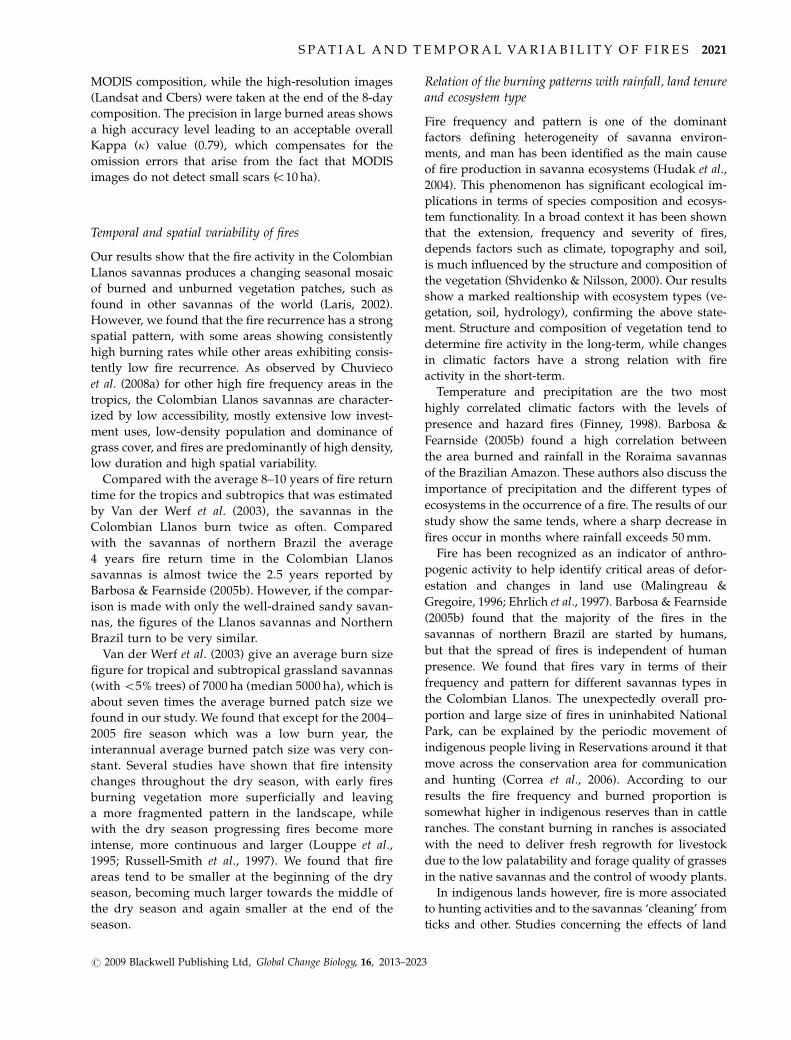
Differences in savanna ecosystem type also had a
strong impact on fire patterns, with the average annual
proportion of burned area by ecosystem varying be-
tween 3% and 38% per year. The highest figures occur in
the well-drained high-plain savannas south of the River
Meta especially in the sandy savannas (39%) (Fig. 8a).
The lowest figures occur along the foothills of the
Andes. Also, between 22% and 30% of the area of
well-drained high-plain savannas were not burned dur-
ing the 2000–2008 period. In contrast more than 80% of
the alluvial overflow plain savannas were free from fire
in the same period (Fig. 8b). The ecosystem type with
the highest fire recurrence was again the sandy high-
plain savanna type, where 230 000 ha (36%) burned in
four or more years during the study period.
Discussion
Recent global studies have confirmed that the savanna
biome is the most continuously affected by burning
with strong environmental impacts (Chuvieco et al.,
2008b; Tansey et al., 2008). According to the figures of
Van der Werf et al. (2003) and Tansey et al. (2004) our
results indicate that burned areas of the Colombian
Llanos savannas correspond to between 3% and 6% of
the globally burned herbaceous vegetation area, and
about 4% of the annually burned area in South America.
Multi-satellite data has become a major means to
monitor changes in land cover, including fires at the
global, regional and local scales (Roy et al., 2005).
Although this has made possible to map areas affected
by fires and analyze burning dynamics, the differences
in the spatial, temporal and spectral resolutions of
satellite data, as well as in the processing algorithms
often leads to large differences in results (Roy et al.,
2005). A recent study by Chuvieco et al (2008b) using 32
day composition MODIS data, calculated that 1.2% of
the Colombian territory is burned annually, which is
only about half of the 2.75 million ha we found for the
Colombian Orinoco region alone. This discrepancy can
be attributed to the algorithms used for detection, the
definition of the dry season, the geographical location of
the affected areas and the type of sensor used (Loboda &
Csiszar, 2007). The algorithms used by these studies do
not take into account factors such as the meteorological
conditions where the fire occurs, the type and structure
of the landscape, land use and cover, biomass, distribu-
tion and heterogeneity and combustion rates (Loboda &
Csiszar, 2007). Our results agree with Roy et al. (2005)
who point to the need to develop algorithms that are
sensitive to ecosystem variability and to the character-
istics of the fire regime of specific environments.
The commission and omission errors in our results of
validation may be attributed to the timing of Landsat
and CBERS image acquisition dates and the periods of
MODIS image composition. Some burned areas were
not identified by our algorithm because the fire occur-
rence was at the beginning of the period of the 8-day
Fig. 7 Burning patterns for different land tenure types for the
period 2000–2008: (a) average annual proportion burned and
standard deviation; (b) fire recurrence in 8 years.
Fig. 8 Burning recurrence for different ecosystem types:
(a) average proportion annually burned and standard deviation;
(b) fire recurrence in 8 years.
2020 M . R O M E R O-R U I Z et al.
r 2009 Blackwell Publishing Ltd, Global Change Biology, 16, 2013–2023
MODIS composition, while the high-resolution images
(Landsat and Cbers) were taken at the end of the 8-day
composition. The precision in large burned areas shows
a high accuracy level leading to an acceptable overall
Kappa (k) value (0.79), which compensates for the
omission errors that arise from the fact that MODIS
images do not detect small scars (o10 ha).
Temporal and spatial variability of fires
Our results show that the fire activity in the Colombian
Llanos savannas produces a changing seasonal mosaic
of burned and unburned vegetation patches, such as
found in other savannas of the world (Laris, 2002).
However, we found that the fire recurrence has a strong
spatial pattern, with some areas showing consistently
high burning rates while other areas exhibiting consis-
tently low fire recurrence. As observed by Chuvieco
et al. (2008a) for other high fire frequency areas in the
tropics, the Colombian Llanos savannas are character-
ized by low accessibility, mostly extensive low invest-
ment uses, low-density population and dominance of
grass cover, and fires are predominantly of high density,
low duration and high spatial variability.
Compared with the average 8–10 years of fire return
time for the tropics and subtropics that was estimated
by Van der Werf et al. (2003), the savannas in the
Colombian Llanos burn twice as often. Compared
with the savannas of northern Brazil the average
4 years fire return time in the Colombian Llanos
savannas is almost twice the 2.5 years reported by
Barbosa & Fearnside (2005b). However, if the compar-
ison is made with only the well-drained sandy savan-
nas, the figures of the Llanos savannas and Northern
Brazil turn to be very similar.
Van der Werf et al. (2003) give an average burn size
figure for tropical and subtropical grassland savannas
(with o5% trees) of 7000 ha (median 5000 ha), which is
about seven times the average burned patch size we
found in our study. We found that except for the 2004–
2005 fire season which was a low burn year, the
interannual average burned patch size was very con-
stant. Several studies have shown that fire intensity
changes throughout the dry season, with early fires
burning vegetation more superficially and leaving
a more fragmented pattern in the landscape, while
with the dry season progressing fires become more
intense, more continuous and larger (Louppe et al.,
1995; Russell-Smith et al., 1997). We found that fire
areas tend to be smaller at the beginning of the dry
season, becoming much larger towards the middle of
the dry season and again smaller at the end of the
season.
Relation of the burning patterns with rainfall, land tenureand ecosystem type
Fire frequency and pattern is one of the dominant
factors defining heterogeneity of savanna environ-
ments, and man has been identified as the main cause
of fire production in savanna ecosystems (Hudak et al.,
2004). This phenomenon has significant ecological im-
plications in terms of species composition and ecosys-
tem functionality. In a broad context it has been shown
that the extension, frequency and severity of fires,
depends factors such as climate, topography and soil,
is much influenced by the structure and composition of
the vegetation (Shvidenko & Nilsson, 2000). Our results
show a marked realtionship with ecosystem types (ve-
getation, soil, hydrology), confirming the above state-
ment. Structure and composition of vegetation tend to
determine fire activity in the long-term, while changes
in climatic factors have a strong relation with fire
activity in the short-term.
Temperature and precipitation are the two most
highly correlated climatic factors with the levels of
presence and hazard fires (Finney, 1998). Barbosa &
Fearnside (2005b) found a high correlation between
the area burned and rainfall in the Roraima savannas
of the Brazilian Amazon. These authors also discuss the
importance of precipitation and the different types of
ecosystems in the occurrence of a fire. The results of our
study show the same tends, where a sharp decrease in
fires occur in months where rainfall exceeds 50 mm.
Fire has been recognized as an indicator of anthro-
pogenic activity to help identify critical areas of defor-
estation and changes in land use (Malingreau &
Gregoire, 1996; Ehrlich et al., 1997). Barbosa & Fearnside
(2005b) found that the majority of the fires in the
savannas of northern Brazil are started by humans,
but that the spread of fires is independent of human
presence. We found that fires vary in terms of their
frequency and pattern for different savannas types in
the Colombian Llanos. The unexpectedly overall pro-
portion and large size of fires in uninhabited National
Park, can be explained by the periodic movement of
indigenous people living in Reservations around it that
move across the conservation area for communication
and hunting (Correa et al., 2006). According to our
results the fire frequency and burned proportion is
somewhat higher in indigenous reserves than in cattle
ranches. The constant burning in ranches is associated
with the need to deliver fresh regrowth for livestock
due to the low palatability and forage quality of grasses
in the native savannas and the control of woody plants.
In indigenous lands however, fire is more associated
to hunting activities and to the savannas ‘cleaning’ from
ticks and other. Studies concerning the effects of land
S PA T I A L A N D T E M P O R A L VA R I A B I L I T Y O F F I R E S 2021
r 2009 Blackwell Publishing Ltd, Global Change Biology, 16, 2013–2023
tenure and land use differences on fire patterns in
savanna environments are very scarce. In other ecosys-
tem contexts such as the Amazon basin indigenous
reserves and national parks have contributed to the
reduction of deforestation rates associated to burning,
with fires four (indigenous reserves) to nine (parks)
times higher outside than inside them (Nepstad et al.,
2006).
In the Colombian savannas, transformation has been
relatively slow. However, during the last few years
increasingly large areas of savannas are being converted
into improved pastures, plantations (oil palm and tim-
ber) and annual crops, where fire activity is being
reduced or eliminated from these landscapes and their
immediate surroundings. The changes in the magni-
tude and frequency of disturbance variables such as
fires and biotic composition that normally drive the
state and cycles of these ecosystems is expected to have
large impacts on the local and regional ecological func-
tioning.
An unexplained finding of this study that needs
further study is the unexpectedly high proportion of
savannas not directly related with intensive land uses
that were not burned during the 2000–2008 period,
while some areas had a consistently high frequency.
This should be expected to have important conse-
quences for the local savanna vegetation dynamics
(Campos & Nepstad, 2006).
Conclusions
Currently, change modelling is demanding increasingly
accurate and spatially explicit regional and local data
and knowledge on land cover dynamics and change
processes such as deforestation, burning, irrigation,
agricultural intensification and urbanization. This is
the more urgent in dynamically changing landscapes
of developing countries with fast population growth
and industrialization processes. Our study contributes
the first complete regionally accurate mapping for al-
most a decade of fire activity in the Colombian Llanos
savannas. Specifically, we show how fire occurrence
(pattern, frequency and extent) vary at the sub-regional
level due to ecosystem, land tenure and rainfall, essen-
tial to the understanding of fire patterns at the regional
scale. We have shown that the increasing trend of the
savanna clearing and intensification process is changing
the fire dynamics and burning patterns. However, these
land use and land cover changes need also be analyzed
in a broader context of the impacts on ecological com-
ponents and processes, including biodiversity, soils,
water and fauna, such as termites and ants. Currently,
Savannas are considered the most important biome in
terms of fire events in South America. Between 2000 and
2008 the savannas of northern South America contrib-
uted with 25% of the overall burned areas of the
continent (Chuvieco et al., 2008b). Of this, the Colom-
bian Llanos savannas contributed with 65% whereas
Venezuelan Llanos savannas with 35%. Burning in this
region constitutes a globally significant 3–6% of herb-
aceous vegetation, an annual average of 2.75 million ha.
Acknowledgements
The Alban Program of the European Union, the Colfuturo Fund(Colombia) and The Nature Conservancy – Northern AndesProgram provided funding to Milton Romero. The authors wouldlike to thank Juan Carlos Berrio for providing support in all thisprocess and Javier Medina for his comments to this document.
References
Andreae MO (1992) Biomass burning: its history, use and distribution and
its impact on environmental quality and global climate. In: Global
Biomass Burning, Atmospheric, Climatic, and Biospheric Implications (ed.
Levine J), pp. 3–21. MIT press, Cambridge, MA.
Asner GP, Elmore AJ, Olander LP, Martin RE, Harris AT (2004) Grazing
systems, ecosystem responses, and global change. Annual Review of
Environment and Resources, 29, 261–299.
Barbosa RI, Fearnside PM (2005a) Above-ground biomass and the fate of
carbon after burning in the savannas of Roraima, Brazilian Amazonia.
Forest Ecology and Management, 216, 295–316.
Barbosa RI, Fearnside PM (2005b) Fire frequency and area burned in the
Roraima savannas of Brazilian Amazonia. Forest Ecology and Manage-
ment, 204, 371–384.
Brannstrom C, Jepson W, Filippi AM, Redo D, Xu Z, Ganesh S (2008) Land
change in the Brazilian Savanna (Cerrado), 1986–2002: comparative ana-
lysis and implications for land-use policy. Land Use Policy, 25, 579–595.
Campos M, Nepstad D (2006) Smallholders, the Amazon’s new conserva-
tionists. Conservation Biology, 20, 1553–1556.
Cochrane M (2002) Wildfire Tropical Forest Fires in Latin America and the
Caribbean. Prevention, Assessment and Early Warning. United Nations
Environment Programme – UNEP, Washington.
Correa HD, Ruiz SL, Arevalo LM (2006) Plan de accion en Biodiversidad de la
cuenca del Orinoco – Colombia (2005–2015): Propuesta tecnica. Corporino-
quia, Cormacarena, Instituto Humbodt, Unitropico, Fundacion Oma-
cha, Fundacion Horizonte Verde, Universidad Javeriana, Unillanos,
WWF, Colombia GTZ, Bogota.
Coutinho LM (1990) Fire in the ecology of the Brazilian cerrado. In: Fire in
the Tropical Biota – Ecosystem Processes and Global Challenges (ed. Gold-
ammer JG), pp. 82–105. Springer-Verlag, Berlin.
Chuvieco E, Giglio L, Justice C (2008a) Global characterization of fire
activity: toward defining fire regimes from Earth observation data.
Global Change Biology, 14, 1488–1502.
Chuvieco ES, Opazo W, Sione H et al. (2008b) Global burned-land
estimation in Latin America using modis composite data. Ecological
Applications, 18, 64–79.
Delmas R, Lacaux JP, Brocard D (1995) Determination of biomass burning
emission factors: methods and results. Environmental Monitoring and
Assessment, 38, 181–204.
Dwyer E, Pereira JMC, Gregoire J-M, DaCamara CC (2000) Characteriza-
tion of the spatio-temporal patterns of global fire activity using satellite
imagery for the period April 1992 to March 1993. Journal of Biogeogra-
phy, 27, 57–69.
2022 M . R O M E R O-R U I Z et al.
r 2009 Blackwell Publishing Ltd, Global Change Biology, 16, 2013–2023
Ehrlich D, Lambin EF, Malingreau JP (1997) Biomass burning and broad-
scale land cover changes in western Africa. Remote Sensing of Environ-
ment, 61, 201–209.
Eiten G (1971) The Cerrado vegetation of Brazil. Botanical Review, 38,
201–341.
Etter A (1985) A Landscape Ecological Approach for Grazing Development: A
Case in the Colombian Llanos Orientales, pp. 187, Department of Land and
Rural Surveys. ITC, Enschede, The Netherlands.
Etter A (1998a) Ecosistemas de Sabanas. In: Informe Nacional sobre el Estado
de la Biodiversidad Colombia 1997 (eds Chaves ME, Arango N), pp. 76–95.
IAvH y PNUD, Bogota.
Etter A (1998b) Mapa general de ecosistemas de Colombia – 1:2 000 000.
(General ecosystem map of Colombia). In: Informe Nacional sobre el
Estado de la Biodiversidad en Colombia – 1997 (National Biodiversity Report
– 1997) (eds Chaves ME, Arango N), Instituto Alexander von Hum-
boldt, Bogota.
Finney M (1998) FARSITE: Fire Area Simulator – Model, Development and
Evaluation. Department of Agriculture, Forest Service, United States of
America.
Foley JA, DeFries R, Asner GP et al. (2005) Global consequences of land
use. Science, j309, 570–574.
Grace J, Jose JS, Meir P, Miranda HS, Montes RA (2006) Productivity and
carbon fluxes of tropical savannas. Journal of Biogeography, 33, 387–400.
Hall DO, Scurlock JMO (1991) Climate change and productivity of natural
grasslands. Annals of Botany, 67, 49–55.
Hao WM, Liu M-H (1994) Spatial and temporal distribution of tropical
biomass burning. Global Biogeochemical Cycles, 8, 495–504.
Hoffmann WA, Schroeder W, Jackson RB (2002) Positive feedbacks of fire,
climate, and vegetation and the conversion of tropical savanna. Geo-
physical Research Letters, 29, 2052.
Hudak A, Fairbanks D, Brockett B (2004) Trends in fire patterns in a
southern African savanna under alternative land use practices. Agri-
culture, Ecosystems and Environment, 101, 307–325.
Instituto Geogr a fico Agustin Codazzi – IGAC (Geographic Institute
Agustin Codazzi) (1983) Mapa general de suelos de Colombia – 1:1,500,000
(General soils map of Colombia). IGAC, Bogota.
Laris P (2002) Burning the seasonal mosaic: preventive burning strategies
in the wooded savanna of southern Mali. Human Ecology, 30, 155–186.
Loboda TV, Csiszar IA (2007) Reconstruction of fire spread within wild-
land fire events in Northern Eurasia from the MODIS active fire
product. Global and Planetary Change, 56, 258–273.
Louppe D, Oattara N, Coulibaly A (1995) The effects of brush fire on
vegetation: the Aubreville fire plots after 60 years. Commonwealth
Forestry Review, 74, 288–291.
Malingreau JP, Gregoire JM (1996) Developing a global vegetation fire
monitoring system for global change studies: a framework. In: Biomass
Burning and Global Change: Remote Sensing and Modeling of Biomass
Burning in the Boreal Forest (ed. Levine JS), pp. 14–24. MIT Press,
Cambridge, MA.
Martin MP, Gomez I, Chuvieco E (2005). Performance of a burned-area index
(BAIM) for mapping Mediterranean burned scars from MODIS data. Pro-
ceedings of the 5th International Workshop of Remote Sensing and
GIS applications to Forest Fire Management: Fire Effects Assess-
ment, Univesidad de Zaragoza, GOFC-GOLD, EARSel. pp. 193–
198.
McGarigal K, Cushman SA, Neel MC, Ene E (2002). FRAGSTATS: Spatial
pattern analysis program for categorical maps. Computer software pro-
gram produced by the authors at the University of Massachusetts,
Amherst. Available at : www.umass.edu/landeco/research/fragstats/
fragstats.html/ (accessed 23 May 2009).
Ministry of Environment-Colombia (2000). Mapas de las areas protegidas de
Colombia (1:1,500,000). Bogota.
Mouillot F, Narasimha A, Balkanski Y, Lamarque J, Field CB (2006) Global
carbon emissions from biomass burning in the 20th century. Geophysical
Research Letters, 33, L01801, doi: 10.1029/2005GL024707.
Nepstad D, Schwartzman S, Bamberger B et al. (2006) Inhibition of
Amazon Deforestation and Fire by Parks and Indigenous Lands.
Conservation Biology, 20, 65–73.
Rausch JM (1994) Una frontera de la sabana tropical los Llanos de Colombia
1531–1831. Banco de la Republica, Bogota.
Roy DP, Jin Y, Lewis PE, Justice CO (2005) Prototyping a global algorithm
for systematic fire-affected area mapping using MODIS time series
data. Remote Sensing of Environment, 97, 137–162.
Russell-Smith J, Ryan PG, Durieu R (1997) A Landsat MSS-derived fire
history of Kakadu National Park monsoonal northern Australia 1980–
94. Seasonal extend, frequency and patchiness. Journal of Applied
Ecology, 34, 748–766.
Sankaran M, Hanan NP, Scholes RJ et al. (2005) Determinants of woody
cover in African savannas. Nature, 438, 846–849.
Scurlock JMO, Hall DO (1998) The global carbon sink: a grassland
perspective. Global Change Biology, 4, 229–233.
Shvidenko AZ, Nilsson S (2000) Extent, distribution and ecological role of
fire in Russian forest. In: Fire Climate Change and Carbon Cycling in the
Boreal Forest (eds Kasiscke E, Sticks B), Springer, New York.
Tansey K, Gregoire J-M, Binaghi E et al. (2004) A global inventory of
burned areas at 1 km resolution for the year 2000 derived from spot
vegetation data. Climatic Change, 67, 345–377.
Tansey K, Gregoire J-M, Defourny P, Leigh R, Pekel J-F, van Bogaert E,
Bartholome E (2008) A new, global, multi-annual (2000–2007) burnt
area product at 1 km resolution. Geophysical Research Letters, 35, L01401,
doi: 10.1029/2007GL031567.
Van Der Werf GR, Randerson JT, Collatz GJ, Giglio L (2003) Carbon
emissions from fires in tropical and subtropical ecosystems. Global
Change Biology, 9, 547–562.
Wardell DA, Nielsen TT, Rasmussen K, Mbon C (2004) Fire history, fire
regimes and fire management in West Africa: on overview. In: Wildland
Fire Management Handbook for SubSaharan Africa (eds Goldammer JG, de
Ronde C), pp. 350–381. Global Fire Management Center, Frieburg/
Oneworld.
Wassmann R, Vlek PLG (2004) Mitigating greenhouse gas emissions from
tropical agriculture: scope and research priorities. Environment, Devel-
opment and Sustainability, 6, 1–9.
S PA T I A L A N D T E M P O R A L VA R I A B I L I T Y O F F I R E S 2023
r 2009 Blackwell Publishing Ltd, Global Change Biology, 16, 2013–2023
Related Documents