The Ohio State University 1999-09 Spatial and Temporal Trends of Deer Harvest and Deer-Vehicle Accidents in Ohio Iverson, Aaron L.; Iverson, Louis R. The Ohio Journal of Science. v99, n4 (September, 1999), 84-94 http://hdl.handle.net/1811/23828 Downloaded from the Knowledge Bank, The Ohio State University's institutional repository Knowledge Bank kb.osu.edu Ohio Journal of Science (Ohio Academy of Science) Ohio Journal of Science: Volume 99, Issue 4 (September, 1999)

Welcome message from author
This document is posted to help you gain knowledge. Please leave a comment to let me know what you think about it! Share it to your friends and learn new things together.
Transcript
The Ohio State University
1999-09
Spatial and Temporal Trends of Deer Harvest
and Deer-Vehicle Accidents in Ohio
Iverson, Aaron L.; Iverson, Louis R. The Ohio Journal of Science. v99, n4 (September, 1999), 84-94http://hdl.handle.net/1811/23828
Downloaded from the Knowledge Bank, The Ohio State University's institutional repository
Knowledge Bank kb.osu.edu
Ohio Journal of Science (Ohio Academy of Science) Ohio Journal of Science: Volume 99, Issue 4 (September, 1999)
Spatial and Temporal Trends of Deer Harvest and Deer-Vehicle Accidentsin Ohio1
AARON L. IVERSON AND LOUIS R. IVF.RSON, Buckeye Valley High School, Delaware, OH 43015 and USDA Forest Service, Delaware County,Delaware, OH 43015
ABSTRACT. White-tailed deer (Odocoileus virginianus} have been increasing dramatically in the easternUnited States, with concomitant increases in impacts resulting from deer browsing and deer-vehiclecollisions. In Ohio, the number of deer were estimated at near zero in 1940 to over 450,000 in 1995.We analyzed estimates of deer harvest and deer-vehicle collisions in 1995 for 88 counties in Ohio. Thesedata were also related to county-level spatial data on the length of major highways, urban land, rural land,crop land, forest land, all land, and human population. The objectives of this study were to evaluate thespatial and temporal trends of white-tailed deer across Ohio and to relate these patterns to the formerlymentioned environmental and human variables. For 1995 data, positive relationships existed between theamount of urban land in the county versus the number of deer-vehicle collisions, the amount of forestland in the county versus the number of deer harvested, the human population of a county versus thenumber of deer-vehicle collisions, and the length of major highways in a county versus the number ofdeer-vehicle collisions. Negative relationships existed between the amount of crop land in a county versusthe number of deer harvested, the amount of crop land versus the number of deer-vehicle collisions, andthe amount of urban land versus the number of deer harvested. Nine counties, representing various levelsof land-use and human population tendencies, were analyzed for historic trends in deer harvest (1985-1995) and deer-vehicle collisions (1988-1995); in each case, there were substantial rises over the previousdecade. Extensions of the resulting regression lines show the possibility for continued increases in deer-vehicle collisions, especially those with a high human population and forest cover. The dramatic increasesin deer populations can be attributed to increasing forest land in the state, more habitat of shrubby land,few predators, mild winters, and the deer's ability to adapt to human-inhabited environments.
OHIO J SCI 99 (4): 84-94, 1999
INTRODUCTIONDeer overabundance is one of the most challenging
problems facing wildlife and land managers across theUnited States today (Alverson and others 1988; Healyand others 1997; Warren 1997; McShea and others 1997;Stromayer and Warren 1997). Most people have long con-sidered the white-tailed deer {Odocoileus virginianus)to be a highly desired wildlife resource, so that societyhas had a difficult time accepting the fact that deer areincreasingly becoming detrimental in many areas.Marchinton (1997) summed up the primary obstacle todeer management with the term urbanism. By urban-ism, he states that "...we have a public that seems to bedeveloping a very unnatural relationship with nature."Thus, the opinions and views of some people contrastwith a healthy and sustaining ecosystem.
Before European colonists in the pre-1700s settledOhio, land was not ideal for deer. The forests were toodense, and covered over 95% of the state (Griffith andothers 1993). With dense forest canopy, the shrubs andother low vegetation within the 'deer molar zone' didnot grow well. These shrubs were the deer's main foodand, without that necessity, deer did not flourish andtheir population was minimal. The settling of Ohio inthe early 1800s expanded the deer population as thesettlers cleared more and more of the forested land and
growth of the low, deer-accessible vegetation increased.The settlers also killed many of the deer's predators.The combination of these factors led to a rise of deerpopulation for a time.
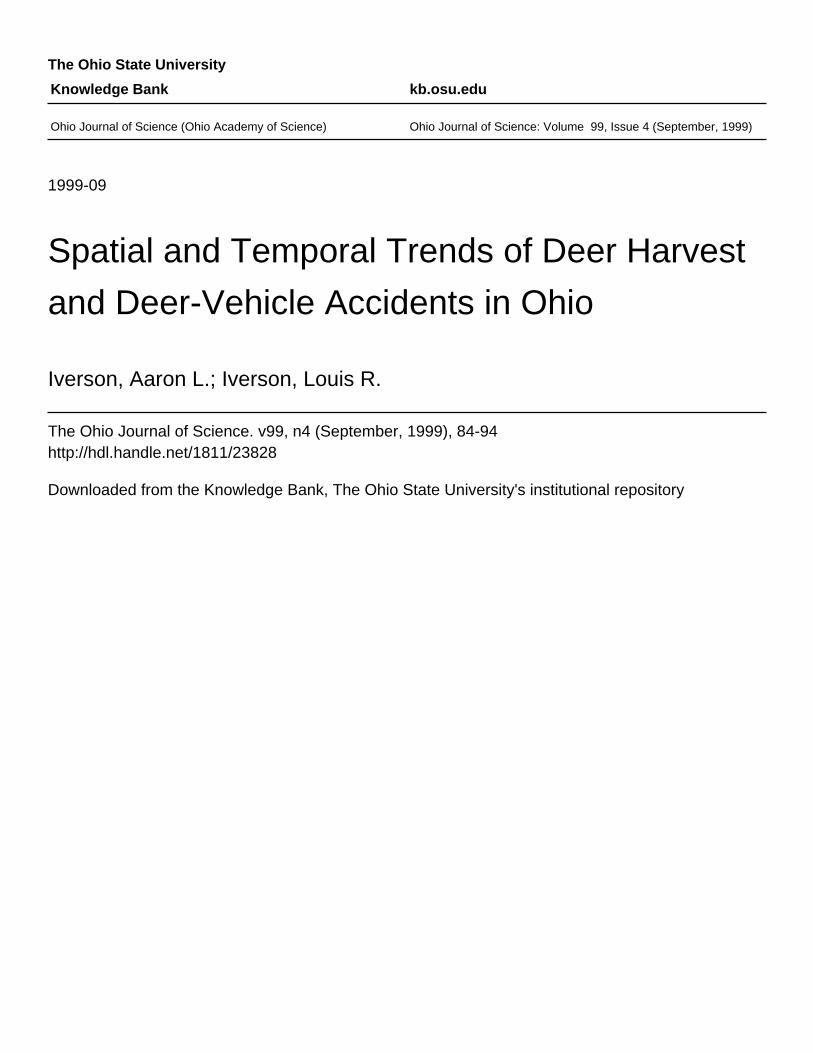
However, in the later 1800s and early 1900s, deer werepractically extirpated from the state, due to habitat lossand unrestricted exploitation. In the 1920s, deer startedimmigrating from Pennsylvania and Michigan into Ohio.The population went from being nearly extirpated, to anestimated 550,000 for the fall of 1996 (Fig. 1, ODNR1996). This great increase can be credited to betterhabitat and improved deer harvest and populationmanagement. The white-tailed deer now thrives in Ohio
Total Deer PopulationSince 1940
ooo
co
3a.oQ_
600500400300200100
0 -!1 = . 1 "
yy
yr
T11
'Manuscript received 23 March 1999 and in revised form 15 August1999 (#99-05).
1940 1950 1960 1970 1980 1990 2000Year
FIGURE 1. Estimated trends in deer populations in Ohio, 1940-1996.
OHIO JOURNAL OF SCIENCE A. L. IVERSON AND L. R. IVERSON 85
as a result of suitable cover, abundant natural and cult-ivated foods, mild winters, and being able to adapt tohuman-dominated areas.
The population of deer present today is related to twoprimary problems for society, an increasing human com-petition for critical elements of deer habitat/land area,and the fundamental issue of human population growthassociated with increasing road densities. Many studieshave shown that deer browsing affects forest regen-eration in Pennsylvania (Marquis 1975; Whitney 1984),Illinois (Strole and Anderson 1992), Michigan (Frelichand Lorimer 1985), and Ohio (Boerner and Brinkman1996). There is also evidence for deer browsing to sub-stantially affect the abundance and diversity of herb-aceous species. Herbaceous species provide the bulk ofdeer summer diet (87%, McCaffery and others 197'4).Rare species, especially orchids and other monocots,have been shown to be further endangered by deer
(Miller and others 1992). Although deer impacts on forestcommunities in Ohio are probably not as problematic asin some places such as the Allegheny National Forest inPennsylvania, there are likely more impacts in Ohiothan previously realized. It is also likely that substantialdamage to farmer's crop yields occurs in some placesduring certain times.
A second major problem associated with the over-population of deer is deer-vehicle accidents. Across theUnited States, Romin and Bissonette (1996) estimatedover 538,000 deer were killed by vehicles in 1991. Theseaccidents cost over a billion dollars in damages plus theenormous societal loss due to fatalities and injuries. InOhio between 1989 and 1994, 17 deaths and 6,506 per-sonal injuries resulted from approximately 128,000 deer-vehicle accidents (Tonkovich 1995). Most deer-vehicleaccidents in Ohio occur during the peak of the deer-breeding season, the period of October to December,
Forest Land Deer Harvested, 1995
Selected CountiesForest, ha
4000 - 80008000 - 1500015000 - 3000030000 - 6000060000 - 120000
Deer Harvested309 - 600601 - 990991 - 17091710 - 39183919 - 5895
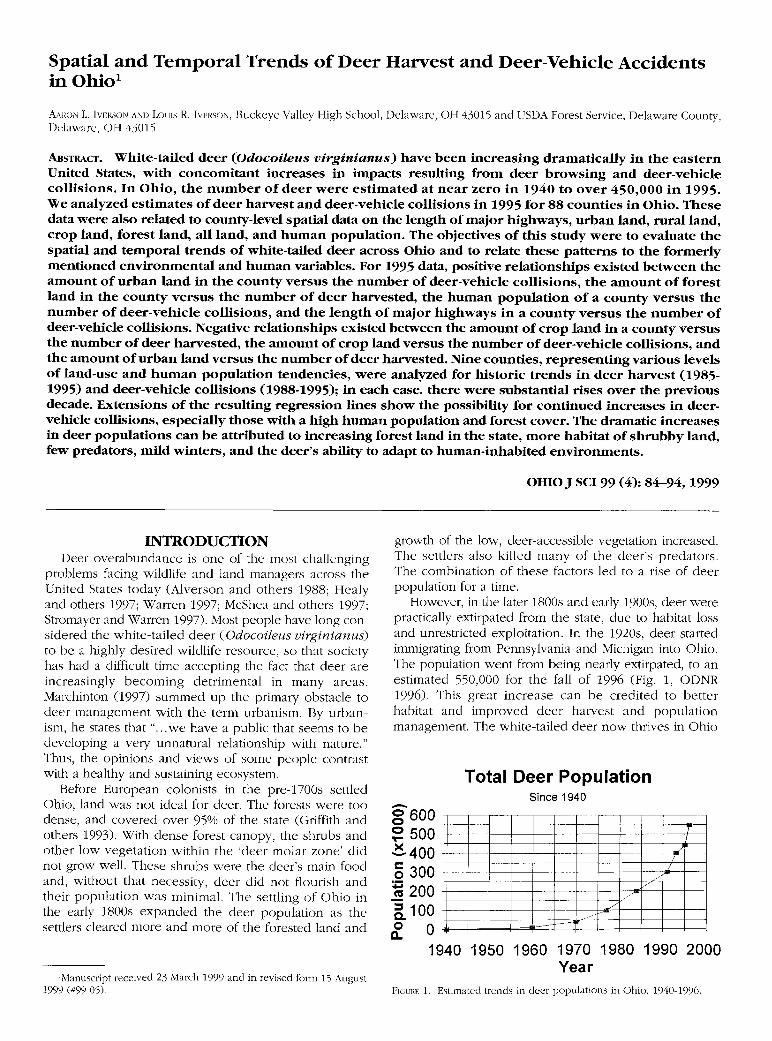
FIGURE 2. Map of Ohio (a) forest land and (b) deer harvested in 1995, by county.
86 DEER TRENDS IN OHIO VOL. 99
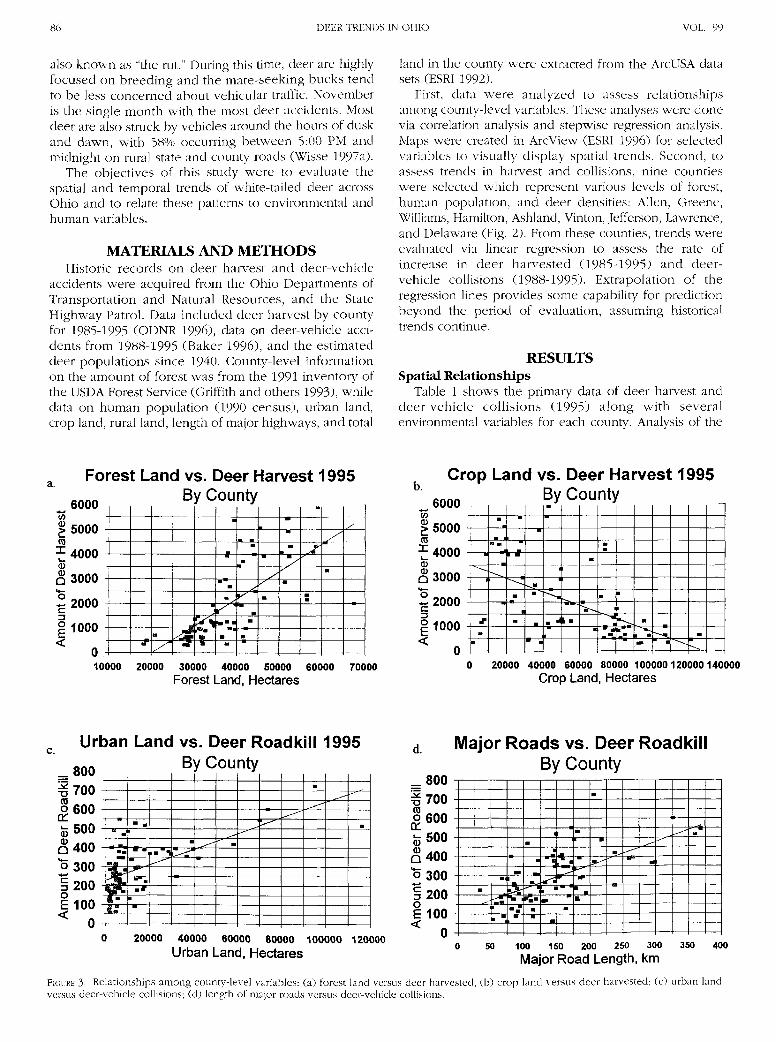
also known as "the rut." During this time, deer are highlyfocused on breeding and the mate-seeking bucks tendto be less concerned about vehicular traffic. Novemberis the single month with the most deer accidents. Mostdeer are also struck by vehicles around the hours of duskand dawn, with 58% occurring between 5:00 PM andmidnight on rural state and county roads (Wisse 1997a).
The objectives of this study were to evaluate thespatial and temporal trends of white-tailed deer acrossOhio and to relate these patterns to environmental andhuman variables.
MATERIALS AND METHODSHistoric records on deer harvest and deer-vehicle
accidents were acquired from the Ohio Departments ofTransportation and Natural Resources, and the StateHighway Patrol. Data included deer harvest by countyfor 1985-1995 (ODNR 1996), data on deer-vehicle acci-dents from 1988-1995 (Baker 1996), and the estimateddeer populations since 1940. County-level informationon the amount of forest was from the 1991 inventory ofthe USD A Forest Service (Griffith and others 1993), whiledata on human population (1990 census), urban land,crop land, rural land, length of major highways, and total
land in the county were extracted from the ArcUSA datasets (ESRI 1992).
First, data were analyzed to assess relationshipsamong county-level variables. These analyses were clonevia correlation analysis and stepwise regression analysis.Maps were created in Arc View (ESRI 1996) for selectedvariables to visually display spatial trends. Second, toassess trends in harvest and collisions, nine countieswere selected which represent various levels of forest,human population, and deer densities: Allen, Greene,Williams, Hamilton, Ashland, Vinton, Jefferson, Lawrence,and Delaware (Fig. 2). From these counties, trends wereevaluated via linear regression to assess the rate ofincrease in deer harvested (1985-1995) and cleer-vehicle collisions (1988-1995). Extrapolation of theregression lines provides some capability for predictionbeyond the period of evaluation, assuming historicaltrends continue.
RESULTSSpatial Relationships
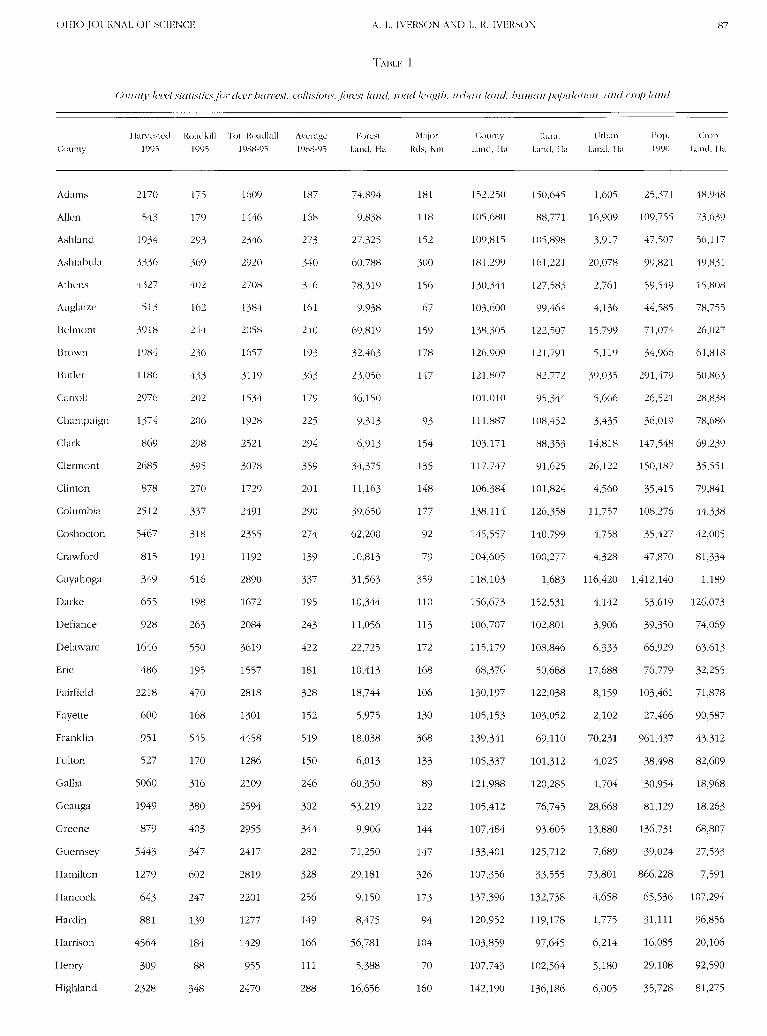
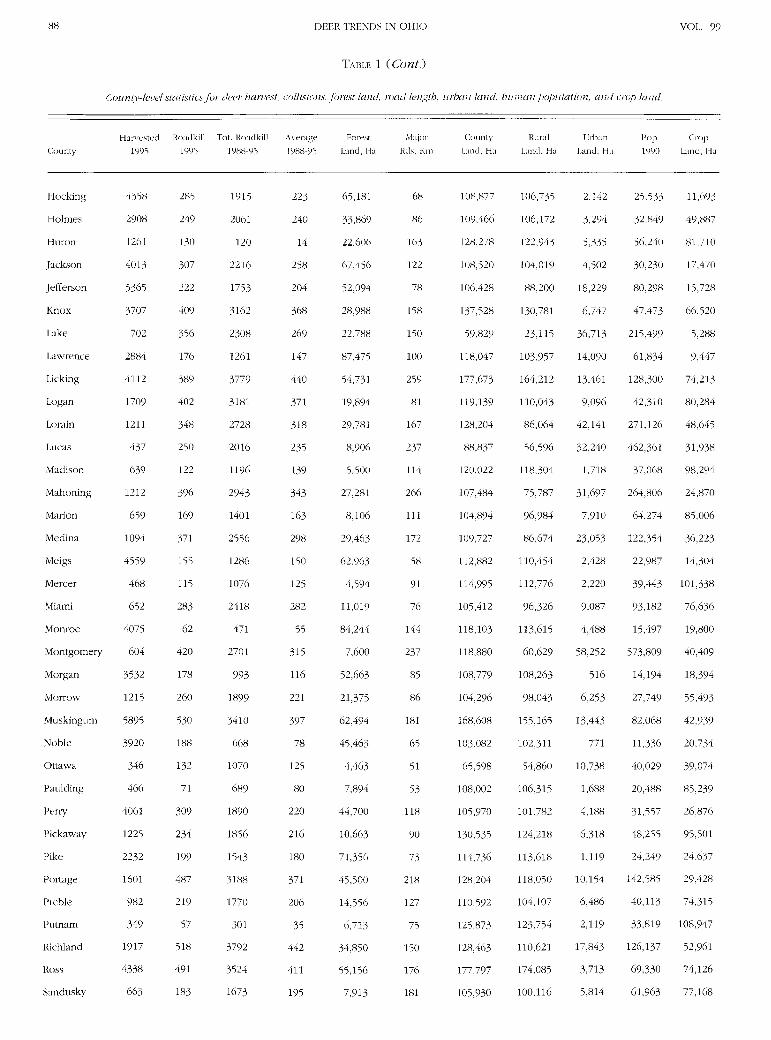
Table 1 shows the primary data of deer harvest anddeer-vehicle collisions (1995) along with severalenvironmental variables for each county. Analysis of the
Forest Land vs. Deer Harvest 1995By County
10000 20000 30000 40000 50000 60000 70000
Forest Land, Hectares
Crop Land vs. Deer Harvest 1995
20000 40000 60000 80000 100000120000 140000
Crop Land, Hectares
c.Urban Land vs. Deer Roadkill 1995
By County
20000 40000 60000 80000 100000 120000
Urban Land, Hectares
d Major Roads vs. Deer RoadkillBy County
50 100 150 200 250 300 350 400
Major Road Length, kmFIGURE 3. Relationships among county-level variables: (a) forest land versus deer harvested; (b) crop land versus deer harvested; (c) urban landversus deer-vehicle collisions; (d) length of major roads versus deer-vehicle collisions.
Am
ount
of D
eer
Roa
dkill
CD
COIi_
CDCD
Q»*—O
"c
O
<
OHIO JOURNAL OF SCIENCE A. L.. IVERSON AND L. K. IVERSON 87
TABLE 1
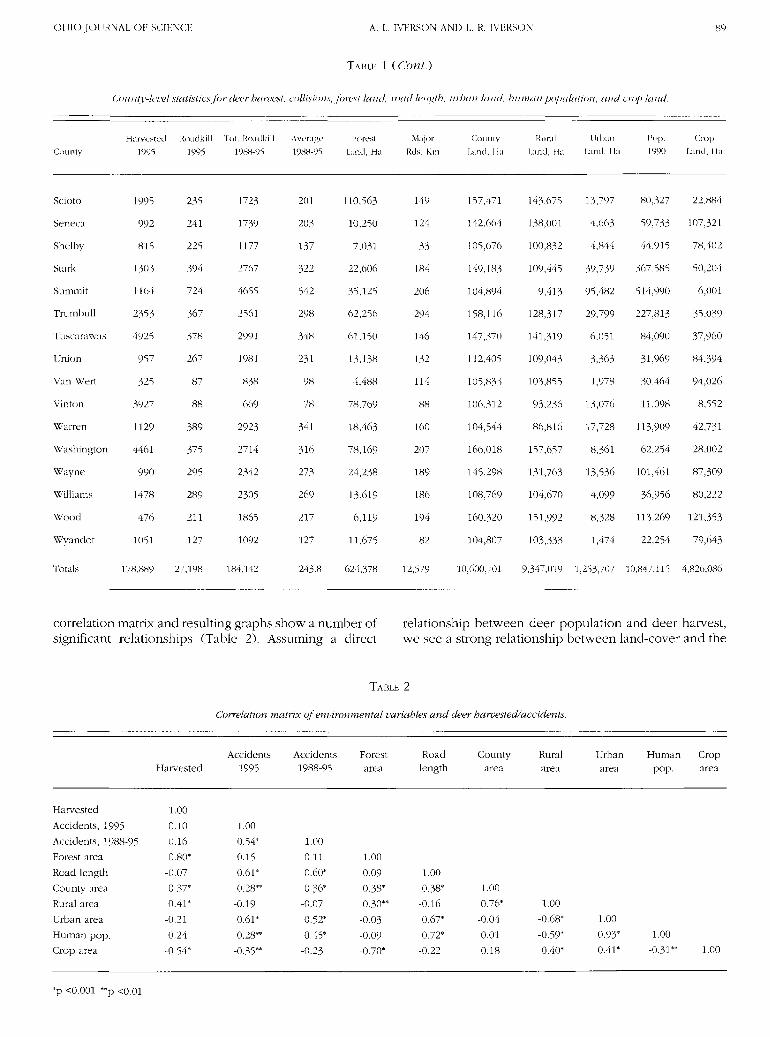
County-level statistics for deer harvest, collisions, forest land, road length, urban laud, human population, and crop land.
County
Adams
Allen
Ashland
Ashlabula
Athens
Auglaize
Belmont
Brown
Butler
Carroll
Champaign
Clark
Clermont
Clinton
Columbia
Coshocton
Crawford
Cuyahoga
Darke
Defiance
Delaware
Erie
Fairfield
Fayette
Franklin
Fulton
Gallia
Geauga
Greene
Guernsey
Hamilton
Hancock
Hardin
Harrison
Henry
Highland
Harvested
1995
2170
543
1934
3336
4327
513
3918
1984
1186
2976
1374
869
2685
878
2512
5467
815
349
655
928
1646
486
2218
600
951
527
5060
1949
879
5443
1279
643
881
4564
309
2328
Roadkill
1995
175
179
293
369
402
162
244
236
433
202
206
298
395
270
337
318
191
516
198
263
550
195
470
168
545
170
316
380
403
347
602
247
139
184
88
348
Tot. Roadkill
1988-95;
1609
1446
2346
2920
2708
1384
2058
1657
3119
1534
1928
2521
3078
1729
2491
2355
1192
2890
1672
2084
3619
1557
2818
1301
4458
1286
2109
2594
2955
2417
2819
2201
1277
1429
955
2470
Average
1988-95
187
168
273
340
316
161
240
193
363
179
225
294
359
201
290
274
139
337
195
243
422
181
328
152
519
150
246
302
344
282
328
256
149
166
111
288
Forest
Land, Ha
74,894
9,838
27,325
60,788
78,319
9,938
69,819
32,463
23,056
46,150
9,313
6,913
34,375
11,163
39,650
62,200
10,813
31,563
10,344
11,056
22,725
10,413
18,744
5,975
18,038
6,013
60,350
53,219
9,906
71,250
29,181
9,150
8,475
56,781
5,388
16,656
Major
Rds, Km
181
118
152
300
156
67
159
178
147
93
154
135
148
177
92
79
359
110
113
172
168
106
130
368
133
89
122
144
147
326
173
94
104
70
160
County
Land Ha
152,250
105,680
109,815
181,299
130,344
103,600
138,305
126,909
121,807
101,010
111,887
103,171
117,747
106,384
138,114
145,557
104,605
118,103
156,673
106,707
115,179
68,376
130,197
105,153
139,341
105,337
121,988
105,412
107,484
133,401
107,356
137,396
120,952
103,859
107,743
142,190
Rural
Land [la
150,645
88,771
105,898
161,221
127,583
99,464
122,507
121,791
82,772
95,344
108,452
88,353
91,625
101,824
126,358
140,799
100,277
1,683
152,531
102,801
108,846
50,688
122,038
103,052
69,110
101,312
120,285
76,745
93,605
125,712
33,555
132,738
119,178
97,645
102,564
136,186
Urban
Land, Ha
1,605
16,909
3,917
20,078
2,761
4,136
15,799
5,119
39,035
5,666
3,435
14,818
26,122
4,560
11,757
4,758
4,328
116,420
4,142
3,906
6,333
17,688
8,159
2,102
70,231
4,025
1,704
28,668
13,880
7,689
73,801
4,658
1,775
6,214
5,180
6,005
Pop.
1990
25,371
109,755
47,507
99,821
59,549
44,585
71,074
34,966
291,479
26,521
36,019
147,548
150,187
35,415
108,276
35,427
47,870
1,412,140
53,619
39,350
66,929
76,779
103,461
27,466
961,437
38,498
30,954
81,129
136,731
39,024
866,228
65,536
31,111
16,085
29,108
35,728
Crop
Land, 1 la
48,948
73,639
56,117
49,831
15,808
78,755
26,027
61,818
50,863
28,838
78,686
69,239
35,551
79,841
44,338
42,005
81,334
1,189
126,073
74,069
63,613
32,255
71,878
90,587
43,312
82,609
18,968
18,263
68,807
27,533
7,591
107,294
96,856
20,106
92,590
81,275
88 DEER TRENDS IN OHIO
TABLE 1 (Cont.)
County-level statistics for deer harvest, collisions, forest laud, road length, urban land, hitman population, and crop land.
VOL. 99
County
Hocking
Holmes
Huron
Jackson
Jefferson
Knox
Lake
Lawrence
Licking
Logan
Lorain
Lucas
Madison
Mahoning
Marion
Medina
Meigs
Mercer
Miami
Monroe
Montgomery
Morgan
Morrow
Muskingum
Noble
Ottawa
Paulding
Peny
Pickaway
Pike
Portage
Preble
Putnam
Richland
Ross
Sandusky
Harvested1995
4358
2908
1261
4013
5365
3707
702
2884
4112
1709
1211
437
639
1212
659
1094
4559
468
652
4075
604
3532
1215
5895
3920
346
466
4061
1225
2232
1601
982
349
1917
4338
663
Roadkill1995
285
249
130
307
222
409
356
176
389
402
348
250
122
396
169
371
155
115
283
62
420
178
260
530
188
132
71
309
234
199
487
219
57
518
491
183
Tot. Roadkill1988-95
1915
2061
120
2216
1753
3162
2308
1261
3779
3181
2728
2016
1196
2943
1401
2556
1286
1076
2418
471
2701
993
1899
3410
668
1070
689
1890
1856
1543
3188
1770
301
3792
3524
1673
Average
1988-95
223
240
14
258
204
368
269
147
440
371
318
235
139
343
163
298
150
125
282
55
315
116
221
397
78
125
80
220
216
180
371
206
35
442
411
195
Forest
Land, Ha
65,181
33,869
22,606
67,456
52,094
28,988
22,788
87,475
54,731
19,894
29,781
8,906
5,500
27,281
8,106
29,463
62,963
4,594
11,019
84,244
7,600
52,663
21,375
62,494
45,463
4,463
7,894
44,700
10,663
71,356
45,500
14,556
6,713
34,850
55,156
7,913
MajorRds, Km
68
86
163
122
78
158
150
100
259
81
167
237
114
266
111
172
58
91
76
144
237
85
86
181
65
51
53
118
90
73
218
127
75
150
176
181
CountyLand. Ha
108,877
109,466
128.278
108,520
106,428
137,528
59,829
118,047
177,673
119,139
128,204
88,837
120.022
107,484
104.894
109,727
112,882
114,995
105,412
118,103
118,880
108,779
104,296
168,608
103,082
65,598
108,002
105,970
130,535
114,736
128,204
110,592
125,873
128,463
177,797
105,930
RuralLand, Ha
106,735
106,172
122,943
104,019
88,200
130,781
23,115
103,957
164,212
110,043
86,064
56,596
118,304
75,787
96,984
86,674
110,454
112,776
96,326
113,615
60,629
108,263
98,043
155,165
102,311
54,860
106,315
101,782
124,218
113,618
118,050
104,107
123,754
110,621
174,085
100,116
UrbanLand, Ha
2,142
3,294
5,335
4,502
18,229
6,747
36,713
14,090
13,461
9,096
42,141
32,240
1,718
31,697
7,910
23,053
2,428
2,220
9,087
4,488
58,252
516
6,253
13,443
771
10,738
1,688
4,188
6,318
1,119
10,154
6,486
2,119
17,843
3,713
5,814
Pop.1990
25,533
32,849
56,240
30,230
80,298
47,473
215,499
61,834
128,300
42,310
271,126
462,361
37,068
264,806
64,274
122,354
22,987
39,443
93,182
15,497
573,809
14,194
27,749
82,068
11,336
40,029
20,488
31,557
48,255
24,249
142,585
40,113
33,819
126,137
69,330
61,963
CropLand, Ha
11,693
49,887
81,710
17,470
15,728
66,520
5,288
9,447
74,213
80,284
48.645
31,938
98,294
24,870
85,006
36,223
14,304
101,338
76,636
19,800
40,409
18,394
55,493
42,939
20,734
39,074
85,239
26,876
95,501
24,637
29,428
74,315
108,947
52,961
74,126
77,168
OHIO JOURNAL OF SCIFACF. A. L. IVERSON AND L. R. 1VERSON
T A B L K 1 (Con I.)
(x)unty-level statistics for deer harvest, collisions, forest land, road length, nrhan land, hunicni population, and crop land.
89
CountyHarvested Roadkill Tot. Roadkill Average Forest Major
1995 1995 1988-95 1988-95 Land, Ha Rds, KmCounty Rural Urban Pop. Crop
Land, Ha Land, Ha Land, Ha 1990 Land, Ha
Scioto
Seneca
Shelby
Stark
Summit
Trumbull
Tuscarawas
Union
Van Wert
Vinton
Warren
Washington
Wayne
Williams
Wood
Wyandot
Totals
1995
992
815
1303
1164
2353
4925
957
325
3927
1129
4461
990
1478
476
1051
178,889
235
241
225
394
724
367
378
267
87
88
389
375
295
289
211
127
27,198
1723
1739
1177
2767
4655
2561
2991
1981
838
669
2923
2714
2342
2305
1865
1092
184,142
201
203
137
322
542
298
348
231
98
78
341
316
273
269
217
127
243.8
110,563
10,250
7,031
22,606
35,125
62,256
61,150
13,138
4,488
78,769
18,463
78,169
24,238
13,619
6,119
11,675
624,378
149
124
33
184
206
294
146
132
114
88
160
207
189
186
194
82
12,579
157,471
142,664
105,676
149,183
104,894
158,116
147,370
112,405
105,833
106,312
104,544
166,018
145,298
108,769
160,320
104,807
10,600,701
143,675
138,001
100,832
109,445
9,413
128,317
141,319
109,043
103,855
93,236
86,816
157,657
131,763
104,670
151,992
103,333
9,347,019
13,797
4,663
4,844
39,739
95,482
29,799
6,051
3,363
1,978
13,076
17,728
8,361
13,536
4,099
8,328
1,474
1,253,707
80,327
59,733
44,915
367,585
514,990
227,813
84,090
31,969
30,464
11,098
113,909
62,254
101,461
36,956
113,269
22,254
10,847,115
22,884
107,321
78,402
50,204
6,001
35,039
37,960
84,394
94,026
8,552
42,731
28,002
87,309
80,222
121,353
79,643
4,826,086
correlation matrix and resulting graphs show a number ofsignificant relationships (Table 2). Assuming a direct
relationship between deer population and deer harvest,we see a strong relationship between land-cover and the
TABLE 2
Correlation matrix of environmental variables and deer harvested/accidents.
HarvestedAccidents, 1995Accidents, 1988-95
Forest area
Road length
County area
Rural area
Urban area
Human pop.
Crop area
Harvested
1.00
0.10
0.16
0.80*
-0.07
0.37*
0.41*
-0.21
-0.24
-0.54*
Accidents1995
1.00
0.54*
0.15
0.61*
0.28**
-0.19
0.61*
0.28**
-0.35**
Accidents1988-95
1.00
0.11
0.60*
0.36*
-0.07
0.52*
0.45*
-0.23
Forestarea
1.00
0.09
0.38*
0.30**
-0.03
-0.09
-0.70*
Roadlength
1.00
0.38*
-0.16
0.67*
0.72*
-0.22
Countyarea
1.00
0.76*
-0.04
0.01
0.18
Ruralarea
1.00
-0.68*
-0.59*
0.40*
Urbanarea
1.00
0.93*
-0.41*
Humanpop.
1.00
-0.31**
Croparea
1.00
*p <0.001 **p <0.01
DEER TRENDS IN OHIO VOL. 99
number of deer in a county. Forest land in the county(Fig. 3a) is positively correlated (r = 0.80), while cropland in the county (Fig. 3b) is negatively correlated(r = 0.54) with the number of deer harvested in 1995.The maps of forest and deer harvest (Fig. 2) show rela-tively similar patterns where the highly forested regionsin the southeast are also the locations of large deerharvest, and the high crop land/low forest land regionsof the northwest show the opposite. Other variables sig-nificantly (p <0.01) related to deer harvest includedcounty land (r = 0.37) and rural land (r = 0.41) (Table2). A stepwise regression using county deer harvest(1995) as the response variable yielded the followingregression equation with a multiple r2 of 0.76 (n = 88,p O.001):
Deer Harvested = 32932 + 0.0377 (Rural land) - 0.0171(Crop land)
When calculated on a density basis, to account for thevariation in county size, the equation was also signifi-cant with a multiple r2 of 0.78 (n = 88, p O.001):
Deer Harvest per 100 ha = 4.6l - 0.44 (% Crop) - 0.30(% Urban) - 498.85 (km road/ha)
No apparent relationship was found between deer
harvest and deer-vehicle accidents or deer harvest andlength of roads in the county in 1995, even thoughTonkovich (1995) found a significant correlation be-tween deer-vehicle accidents and buck-gun harvest persquare mile for the 1989-1994 period.
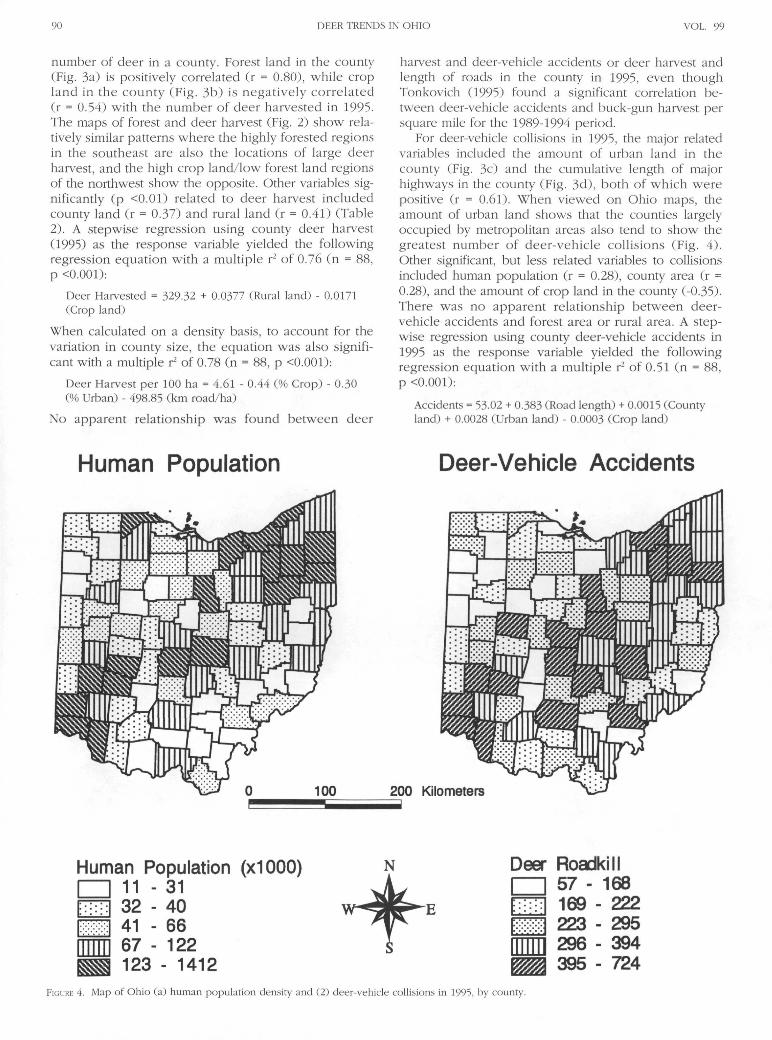
For deer-vehicle collisions in 1995, the major relatedvariables included the amount of urban land in thecounty (Fig. 3c) and the cumulative length of majorhighways in the county (Fig. 3d), both of which werepositive (r = 0.61). When viewed on Ohio maps, theamount of urban land shows that the counties largelyoccupied by metropolitan areas also tend to show thegreatest number of deer-vehicle collisions (Fig. 4).Other significant, but less related variables to collisionsincluded human population (r = 0.28), county area (r =0.28), and the amount of crop land in the county (-0.35).There was no apparent relationship between deer-vehicle accidents and forest area or rural area. A step-wise regression using county deer-vehicle accidents in1995 as the response variable yielded the followingregression equation with a multiple r2 of 0.51 (n = 88,p O.001):
Accidents = 53.02 + 0.383 (Road length) + 0.0015 (Countyland) + 0.0028 (Urban land) - 0.0003 (Crop land)
Human Population Deer-Vehicle Accidents
200 Kilometers
Human Population (x1000)| 1 11 - 31^ 3 2 - 4 0
41 - 6667 - 122123 - 1412
Deer Roadki 1157 - 168169 - 222223 - 295296 - 394395 - 724
FIGURE 4. Map of Ohio (a) human population density and (2) deer-vehicle collisions in 1995, by county.
OHIO JOURNAL OF SC1FNCF A. L. IVKKSON AND L. R. IVI-RSON 91
When calculated on a density basis, the multiple rimproved to 0.59 (n = 88, p <().()()1) with the followingequation:
Accidents per 100 ha = 0.52 - 0.0042 (% Crop) - 0.004-1(% Forest) + 0.0019 (% Urban)
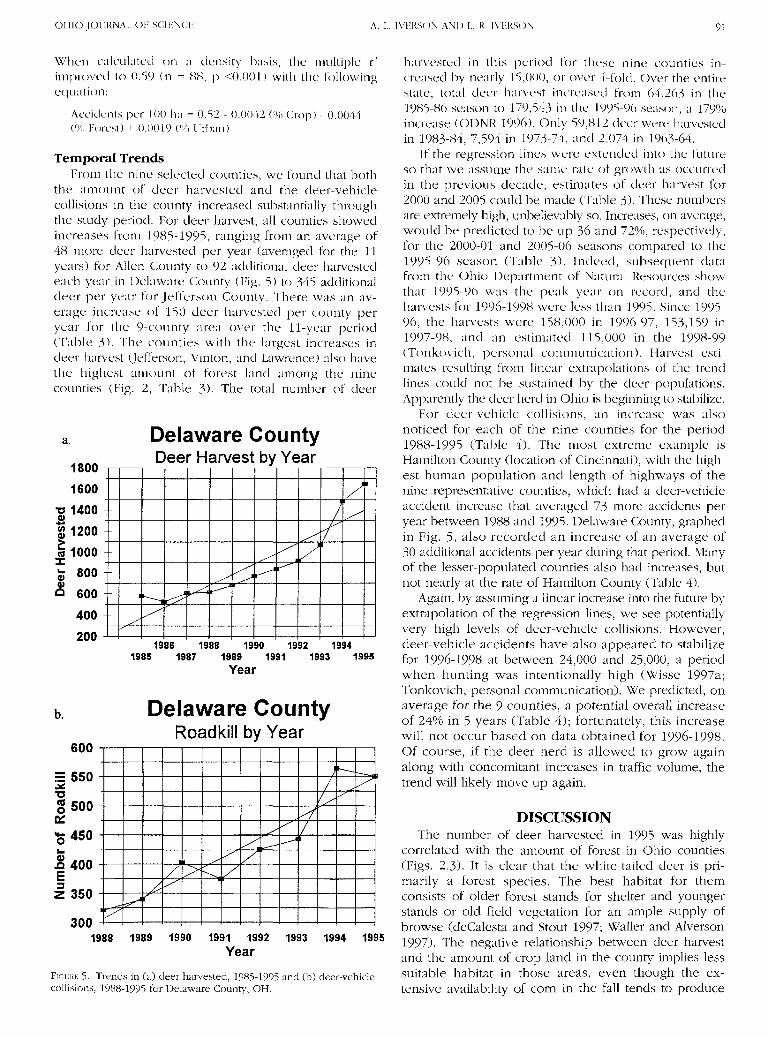
Temporal TrendsFrom the nine selected counties, we found that both
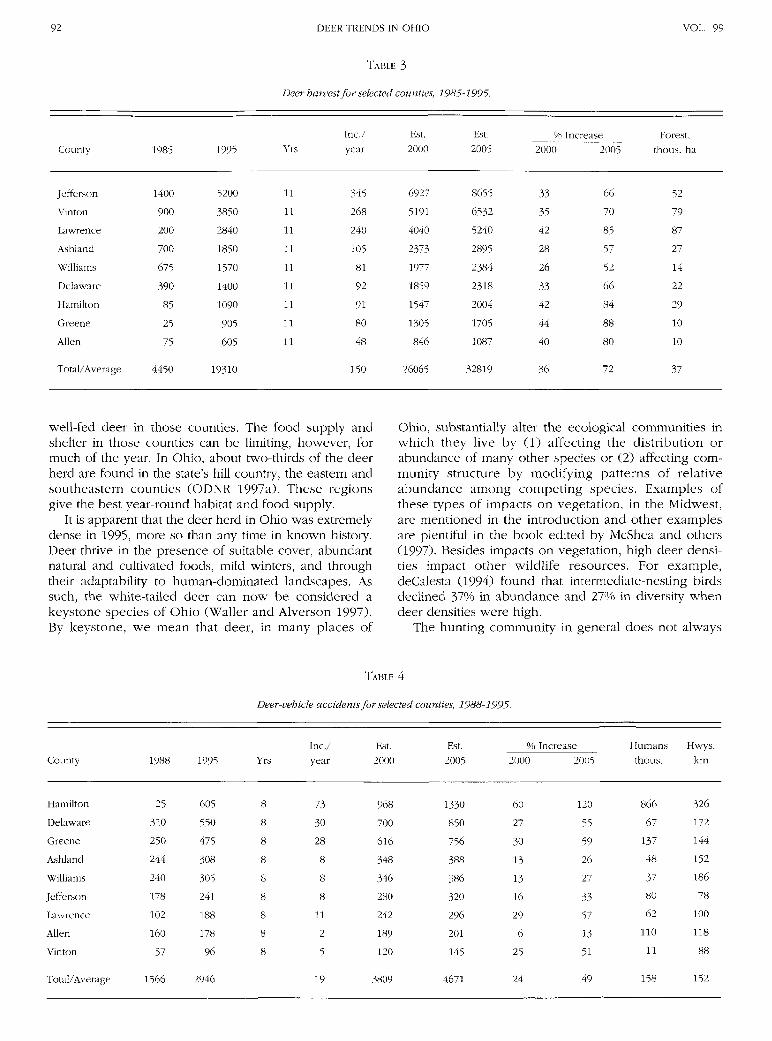
the amount of deer harvested and the deer-vehiclecollisions in the county increased substantially throughthe study period. For deer harvest, all counties showedincreases from 1985-1995, ranging from an average of48 more deer harvested per year (averaged for the 11years) for Allen County to 92 additional deer harvestedeach year in Delaware County (Fig. 5) to 345 additionaldeer per year for Jefferson County. There was an av-erage increase of 150 deer harvested per county peryear for the 9-eounty area over the 11-year period(Table 3). The counties with the largest increases indeer harvest (Jefferson, Vinton, and Lawrence) also havethe highest amount of forest land among the ninecounties (Fig. 2, Table 3). The total number of deer
a. Delaware CountyDeer Harvest by Year
•o(!)
Har
vest
Dee
r 1
i guv
1600 -
1400
1200
1000
800
600 -
400 -
200 J
i
/
/ri
/
i
b.
1986 1988 1990 1992 19941985 1987 1989 1991 1993 1995
Year
Delaware CountyRoadkill by Year
M M
ad
kil
o
oo
Jum
t
DUU -
550 -
500
450 -
400 -
350 -
300 -
B
/
I
/
i
}/
1988 1989 1990 1991 1992Year
1993 1994 1995
FIGURE 5. Trends in (a) deer harvested, 1985-1995 and (b) deer-vehiclecollisions, 1988-1995 for Delaware County, OH.
harvested in this period lor these nine counties in-creased by nearly 15,000, or over -1-fold. Over the entirestate, total deer harvest increased from 64,263 in the1985-86 season to 179,5-13 in the 1995-96 season, a 179%increase (ODNR 1996). Only 59,812 deer were harvestedin 1983-84, 7,594 in J 973-74, and 2,074 in 1963-64.
If the regression lines were extended into the futureso that we assume the same rate of growth as occurredin the previous decade, estimates of deer harvest for2000 and 2005 could be made (Table 3). These numbersare extremely high, unbelievably so. Increases, on average,would be predicted to be up 36 and 72%, respectively,for the 2000-01 and 2005-06 seasons compared to the1995-96 season (Table 3). Indeed, subsequent datafrom the Ohio Department of Natural Resources showthat 1995-96 was the peak year on record, and theharvests for 1996-1998 were less than 1995. Since 1995-96, the harvests were 158,000 in 1996-97, 153,159 in1997-98, and an estimated 115,000 in the 1998-99(Tonkovich, personal communication). Harvest esti-mates resulting from linear extrapolations of the trendlines could not be sustained by the deer populations.Apparently the deer herd in Ohio is beginning to stabilize.
For cleer-vehicle collisions, an increase was alsonoticed for each of the nine counties for the period1988-1995 (Table 4). The most extreme example isHamilton County (location of Cincinnati), with the high-est human population and length of highways of thenine representative counties, which had a deer-vehicleaccident increase that averaged 73 more accidents peryear between 1988 and 1995. Delaware County, graphedin Fig. 5, also recorded an increase of an average of30 additional accidents per year during that period. Manyof the lesser-populated counties also had increases, butnot nearly at the rate of Hamilton County (Table 4).
Again, by assuming a linear increase into the future byextrapolation of the regression lines, we see potentiallyvery high levels of deer-vehicle collisions. However,deer-vehicle accidents have also appeared to stabilizefor 1996-1998 at between 24,000 and 25,000, a periodwhen hunting was intentionally high (Wisse 1997a;Tonkovich, personal communication). We predicted, onaverage for the 9 counties, a potential overall increaseof 24% in 5 years (Table 4); fortunately, this increasewill not occur based on data obtained for 1996-1998.Of course, if the deer herd is allowed to grow againalong with concomitant increases in traffic volume, thetrend will likely move up again.
DISCUSSIONThe number of deer harvested in 1995 was highly
correlated with the amount of forest in Ohio counties(Figs. 2,3). It is clear that the white-tailed deer is pri-marily a forest species. The best habitat for themconsists of older forest stands for shelter and youngerstands or old field vegetation for an ample supply ofbrowse (deCalesta and Stout 1997; Waller and Alverson1997). The negative relationship between deer harvestand the amount of crop land in the county implies lesssuitable habitat in those areas, even though the ex-tensive availability of corn in the fall tends to produce
92 DEER TRENDS IN OHIO VOL. 99
County
Jefferson
Vinton
Lawrence
Ashland
Williams
Delaware
Hamilton
Greene
Allen
Total/Average
1985
1400
900
200
700
675
390
85
25
75
4450
1995
5200
3850
2840
1850
1570
1400
1090
905
605
19310
Deer
Yrs
11
11
11
11
11
11
11
11
11
TABLE 3
harvest for selected counties,
Inc./
year
345
268
240
105
81
92
91
80
48
150
Est.
2000
6927
5191
4040
2373
1977
1859
1547
1305
846
26065
1985-1995.
Est.
2005
8655
6532
5240
2895
2384
2318
2004
1705
1087
32819
0,
2000
33
35
42
28
26
33
42
44
40
36
6 Increase
2005
66
70
85
57
52
6684
88
80
72
Forest,
thous. ha
52
79
87
27
14
22
29
10
10
37
well-fed deer in those counties. The food supply andshelter in those counties can be limiting, however, formuch of the year. In Ohio, about two-thirds of the deerherd are found in the state's hill country, the eastern andsoutheastern counties (ODNR 1997a). These regionsgive the best year-round habitat and food supply.
It is apparent that the deer herd in Ohio was extremelydense in 1995, more so than any time in known history.Deer thrive in the presence of suitable cover, abundantnatural and cultivated foods, mild winters, and throughtheir adaptability to human-dominated landscapes. Assuch, the white-tailed deer can now be considered akeystone species of Ohio (Waller and Alverson 1997).By keystone, we mean that deer, in many places of
Ohio, substantially alter the ecological communities inwhich they live by (1) affecting the distribution orabundance of many other species or (2) affecting com-munity structure by modifying patterns of relativeabundance among competing species. Examples ofthese types of impacts on vegetation, in the Midwest,are mentioned in the introduction and other examplesare plentiful in the book edited by McShea and others(1997). Besides impacts on vegetation, high deer densi-ties impact other wildlife resources. For example,deCalesta (1994) found that intermediate-nesting birdsdeclined 37% in abundance and 27% in diversity whendeer densities were high.
The hunting community in general does not always
TABLE 4
Deer-vehicle accidents for selected counties, 1988-1995.
County
Hamilton
Delaware
Greene
Ashland
Williams
Jefferson
Lawrence
Allen
Vinton
Total/Average
1988
25
310
250
244
240
178
102
160
57
1566
1995
605
550
475
308
305
241
188
178
96
2946
Yrs
8
8
8
8
8
8
8
8
8
Inc./year
73
30
28
8
8
8
11
2
5
19
Est.2000
968
700
616
348
346
280
242
189
120
3809
Est.
2005
1330
850
756
388
386
320
296
201
145
4671
%2000
60
27
30
13
13
16
29
6
25
24
iIncrease
2005
120
55
59
26
27
33
57
13
51
49
Humans
thous.
866
67
137
48
37
80
62
110
11
158
Hwys.km
326
172
144
152
186
78
100
118
88
152
OHIO JOURNAL OF SCIFNCH IVERSON AND L. R. IVKRSON 93
agree that high deer populations are problematic.Diefenbach and others (1997) analyzed 13 years ofwhite-tailed deer data for Pennsylvania to comparetrends in deer populations to the opinions of hunterson deer management. The majority of hunters disagreedthat damage to Pennsylvania forests by deer was aproblem or that deer caused serious conflicts withother land uses. In a public attitude survey of Ohiohunters, deer damage was considered an 'annoyance,'rather than a major problem (ODNR 1998). Stoll andothers Q99D reported that optimum deer herd sizes areset for each county based on formulas for farmertolerances to crop damage or deer-vehicle accidents,whichever is lower.
The high herd densities have also begun to take theirtoll on the herd itself, as the condition of the herd,especially in the hill counties, has been shown to de-cline (Stoll and Parker 1986; Tonkovich 1996; ODNR1997b; Tonkovich, personal communication). Re-searchers report statistically significant decreases infield-dressed weight between 1982 and 1996 for does(4 pounds less) and bucks (10-12 pounds less). Declinesin antler beam diameters are also apparent for deertaken from the hill country during this 5-year period.
We found a positive relationship between deer-vehicle collisions and both the human population andthe total length of major highways in the county (Figs.3,4). Obviously, there are more opportunities for col-lisions with more traffic on more highway miles. If thecounty has both high amounts of forest (for example,high deer densities) and high human population den-sities, the risk of a deer-vehicle collision in higher; this isapparently the case for Hamilton County. Based on ourdata, it is clear that the number of accidents is more re-lated to human factors (for example, road lengths,urban land, human populations) than to deer- or habitat-related factors (for example, harvested deer, forest land,cropland).
In Ohio alone, an estimated 27,200 accidents werereported for 1995. Romin and Bissonette (1996) esti-mated over 538,000 deer were killed by vehicles in theUnited States in 1991. An estimated one million verte-brates are killed each day on US roads (Lalo 1987). Theeconomic effects of deer collisions are enormous. Injuriesand loss of human life also occur at some of theseaccidents, especially when the driver tries to avoid adeer collision and collides with another car or object.As the number of motorists increase, and as the deerherd increases, so will the deer-vehicle collisions. Thus,county and state planners and regulators have anopportunity/responsibility to address high road densities,land-use designations, and the like, to mitigate for theexpected increase in collisions.
There is some research showing that various struc-tures can be used to help control road crossing of deer.Nine foot fencing along roads, planting grass along sidethe road to help the deer to resist crossing, and reflectorsalong roadsides have all been used (Forman 1995). Thesemethods have been more successfully used in Europe,but more research is needed relative to the overpopula-tion of deer in this country (Romin and Bissonette 1996).
To also help reduce the urban deer overpopulationproblem, five urban deer zones have been set up inOhio. In these zones, a hunter may hunt in a humaninhabited area, and they may each kill up to 5 or 6 deerthroughout the deer season. The intention is to lowerthe deer population in those heavily-traveled zoneswhich would reduce the chance of hitting a deer (aswell as reduce the overgrazing problem common inparks, flower gardens, and so forth). This strategy appearsto be effective in reducing the urban deer population(Tonkovich 1998).
We have shown that the deer population has beenrising in Ohio since 1940, and especially so during the1985-1995 study period (Figs. 1,5). Evidence now existsthat the population peaked in 1995, and has stabilizedsomewhat, but is still very high. The extremely rapidrise in the deer population can be attributed to severalfactors. The amount of forest land in Ohio has beenincreasing since about 1940 (Griffith and others 1993);thus, forest habitat has also increased, especially youngforests with ample food supplies. In addition, there arerelatively mild winters in Ohio (especially since the1980s), there has been ample food and shelter, andthe deer's predators are presently very scarce.
Data for recent years have shown that the Ohio deerherd is being contained at a population level between400,000-450,000 (Tonkovich, personal communication).If the Ohio deer herd were allowed to grow unchecked,serious impacts could result. One major impact wouldbe a continued increase in vegetation damage from deerscavenging for food in urban, agricultural, and forestareas. Increased deer-vehicle accidents would also occur,as we have predicted. The increases in deer wouldeventually level off as the carrying capacity of Ohiolandscapes is reached. Deer herd decline would thenbecome even more problematic, resulting in starvationand disease when winter conditions are limiting.
Because the natural predators for deer are largelygone, humans must do the management. It may bepossible, but not very likely at this time, to reintroduce orenhance the population of native predators as a manage-ment technique to help reduce the rapid rise of the deerherd. However, of all management tools available, hunt-ing is currently the most effective. In the future, however,new paradigms in land-use planning may provide effec-tive management tools. The Ohio Division of Wildlifecarefully sets hunting policy each year to regulate thedeer herd. Controlling the deer population is not theonly thing hunting does. It is a great boost to Ohio'seconomy as well. According to a 1996 National Survey ofFishing, Hunting and Wildlife-Associated Recreation,hunters of all types spent a total of $515 million in Ohioon hunting-related expenditures (Wisse 1997b). Ex-penses included travel, food, lodging, equipment, andclothing purchased by the hunters.
The deer herd in Ohio, up until the last couple ofyears, has expanded very rapidly since 1940 and hasbecome a serious problem with vegetation damage andvehicle accidents. For the sake of both humans and deer,we must work together to support efforts to controldeer herd growth and reduce deer-vehicle accidents.
94 DEER TRENDS IN OHIO VOL. 99
ACKXOWLFDGMKXTS. This project was developed as an Ohio State Sci-ence Fair project by the first author. We thank Dr. Mike Tonkovich,John Wisse, and Teressa Parkis, Division of Wildlife. Ohio Departmentof Natural Resources and David Baker, State Highway Patrol forproviding data for this study. Thanks also to Dr. Chip Scott and twoanonymous reviewers for improving the manuscript.
LITERATURE CITEDAlverson WS, Waller DM, Solheim SL. 1988. Forests too deer: edge
effects in northern Wisconsin. Conserv Biol 2:348-58.Baker D. 1996. Ohio traffic crashes involving deer, 1988-95. Colum-
bus (OH): State Highway Patrol.Boerner RE), BrinkmanJA. 1996. Ten years of tree seedling establish-
ment and mortality in an Ohio deciduous forest complex. BullTorrey Bot Club 123:309-17.
deCalesta DS. 1994. Effect of white-tailed deer on songbirds withinmanaged forest in Pennsylvania. J Wildlife Manag 58:711-7.
deCalesta DS, Stout SL. 1997. Relative deer density and sustain-ability: a conceptual framework for integrating deer managementwith ecosystem management. Wildlife Soc Bull 25(2):252-8.
Diefenbach DR, Palmer WL, Shope WK. 1997. Attitudes of Penn-sylvania sportsmen towards managing white-tailed deer toprotect the ecological integrity of forests. Wildlife Soc Bull25(2):244-51.
[ESRI] Environmental Systems Research Institute. 1992. ArcUSA 1:2M,User's Guide and Data Reference. Redlands (CA): EnvironmentalSystems Research Institute, Inc. 6 chapters + appendices.
IESRI] Environmental Systems Research Institute. 1996. ArcView GIS.Redlands (CA): Environmental Systems Research Institute, Inc.
Forman RTT. 1995. Land Mosaics. Cambridge (UK): Cambridge UnivPr. 632 p.
Frelich LE, Lorimer CG. 1985. Current and predicted long-term ef-fects of deer browsing in hemlock forests in Michigan. USA BiolConserv 34:99-120.
Griffith DM, DiGiovanni DM, Witzel TL, Wharton EH. 1993. Foreststatistics for Ohio, 1991. Radnor (PA): Northeastern Forest Experi-ment Station, USDA Forest Service. Resource Bull NE-128. 169 p.
Healy WM, deCalesta DS, Stout SL. 1997. A research perspective onwhite-tailed deer overabundance in the northeastern United States.Wildlife Soc Bull 25(2):259-63.
Lalo J. 1987. The problem of road kill. American Forests September-October:50-52, 72.
Marchinton RL. 1997. Obstacles to future deer management. QualityWhitetaiLs 4:21-3.
Marquis DA. 1975. The Allegheny hardwood forests of Pennsyl-vania. Radnor (PA): Northeastern Forest Experiment Station, USDAForest Service. Research Report NE-47. 32 p.
McCaffery KR, Tranetzki J, Piechura J. 1974. Summer foods of deerin northern Wisconsin. J Wildlife Manag 38:215-9-
McShea WJ, Underwood HB, Rappole JH. 1997. The science of
overabundance: deer ecology and population management.Washington (DC): Smithsonian Inst Pr. 402 p.
Miller SG, Bratton SP, Hadiclian J. 1992. Impacts of white-tailed deer onendangered and threatened vascular plants. Nat Areas J 12:67-74.
[ODNR] Ohio Department of Natural Resources. 1996. Deer seasonresults, 1985-1995. Columbus (OH): Division of Wildlife. Publ 166.
[ODNR] Ohio Department of Natural Resources. 1997a. Top Ohiodeer harvest counties, www.dnr.state.oh.us/odnr/wildlife/news/archive/deer/harvest/tpdeer.html.
[ODNRl Ohio Department of Natural Resources. 1997b. New datashows condition of Ohio's deer herd in decline, www.clnr.state.oh.us/odnr/wildlife/news/archive/deer/harvest/deer.html.
[ODNR] Ohio Department of Natural Resources. 1998. Public attitudesurvey. Columbus (OH): Division of Wildlife. Note 724.
Romin LA, Bissonette JA. 1996. Deer-vehicle collisions: status of statemonitoring activities and mitigation efforts. Wildlife Soc Bull24:276-83.
Stoll RJ, Jr., Parker WP. 1986. Reproductive performance and condi-tion of white-tailed deer. OhioJ Sci 86:164-8.
Stoll RJ, Jr., Culbertson WL, Miller SE. 1991. Rural landowner atti-tudes toward deer and deer populations in Ohio - 1989 update.Columbus (OH): Division of Wildlife, Ohio Department of NaturalResources. Wildlife Inservice Note 642. 35 p.
Strole TA, Anderson RC. 1992. White-tailed deer browsing: speciespreferences and implications for central Illinois forests. Nat AreasJ 12:139-44.
Stromayer KAK, Warren RJ. 1997. Are overabundant deer herds inthe eastern United States creating alternate stable states in forestplant communities? Wildlife Soc Bull 25(2):227-34.
Tonkovich MJ. 1995. Deer-vehicle accidents in Ohio: update 1989-94.Columbus (OH): Division of Wildlife, Ohio Department of NaturalResources. Inservice Note 707. 26 p.
Tonkovich MJ. 1996. Deer age, sex, and condition data. Columbus (OH):Division of Wildlife, Ohio Department of Natural Resources. InserviceNote 709. 14 p.
Tonkovich MJ. 1998. Summary of 1997-98 Ohio deer seasons. Col-umbus (OH): Division of Wildlife, Ohio Department of NaturalResources. Publ 304 (1998). 13 p.
Waller DM, Alverson WS. 1997. The white-tailed deer: a keystoneherbivore. Wildlife Soc Bull 25(2):217-26.
Warren RJ. 1997. The challenge of deer overabundance in the 21stcentury. Wildlife Soc Bull 25(2):213-6.
Whitney GG. 1984. Fifty years of change in the arboreal vegetationof Heart's Content, an old-growth hemlock-white pine-northernhardwood stand. Ecol 65:403-8.
Wisse J. 1997a. Most deer-vehicle collisions occur during Novem-ber. www.dnr.state.oh.us/odnr/wildlife/news/archive/deer/deercar.html.
Wisse J. 1997b. Hunters spent a total of $515 million in Ohio.www.dnr.state.oh.us/odnr/wildlife/news/archive/hunting/apll397.html.
Related Documents