Spatial and temporal patterns of genetic variation in the widespread antitropical deep-sea coral Paragorgia arborea S. HERRERA,* † T. M. SHANK ‡ and J. A. SA ´ NCHEZ † *Massachusetts Institute of Technology, Woods Hole Oceanographic Institution, Joint Program in Oceanography, 266 Woods Hole Road, Woods Hole, MA 02543, USA, †Laboratorio de Biologia Molecular Marina (BIOMMAR), Departamento Ciencias Biologicas, Universidad de los Andes, Carrera 1E No 18A – 10, Bogota, Colombia, ‡Biology Department, Woods Hole Oceanographic Institution, 266 Woods Hole Road, Woods Hole, MA 02543, USA Abstract Numerous deep-sea species have apparent widespread and discontinuous distribu- tions. Many of these are important foundation species, structuring hard-bottom benthic ecosystems. Theoretically, differences in the genetic composition of their populations vary geographically and with depth. Previous studies have examined the genetic diver- sity of some of these taxa in a regional context, suggesting that genetic differentiation does not occur at scales of discrete features such as seamounts or canyons, but at larger scales (e.g. ocean basins). However, to date, few studies have evaluated such diversity throughout the known distribution of a putative deep-sea species. We utilized sequences from seven mitochondrial gene regions and nuclear genetic variants of the deep-sea coral Paragorgia arborea in a phylogeographic context to examine the global patterns of genetic variation and their possible correlation with the spatial variables of geographic position and depth. We also examined the compatibility of this morphospe- cies with the genealogical-phylospecies concept by examining specimens collected worldwide. We show that the morphospecies P. arborea can be defined as a genealogi- cal-phylospecies, in contrast to the hypothesis that P. arborea represents a cryptic species complex. Genetic variation is correlated with geographic location at the basin- scale level, but not with depth. Additionally, we present a phylogeographic hypothesis in which P. arborea originates from the North Pacific, followed by colonization of the Southern Hemisphere prior to migration to the North Atlantic. This hypothesis is consistent with the latest ocean circulation model for the Miocene. Keywords: coral, deep sea, DNA barcoding, phylogeography, species, widespread Received 1 June 2012; revision received 28 August 2012; accepted 1 September 2012 Introduction Several marine species, particularly from deep-sea envi- ronments, have apparent widespread yet discontinuous distributions (e.g. review by Roberts et al. 2009; Bik et al. 2012). Various mechanisms have been suggested to explain the apparent existence of such species, including recent connectivity among populations mediated by long-distance dispersal (Bucklin et al. 1987; France & Kocher 1996; Darling et al. 2000; Won et al. 2003; Pawlowski et al. 2007; Lecroq et al. 2009; Etter et al. 2011), large population sizes and similar selective pres- sures in a stable environment (Bisol et al. 1984; Brink- meyer et al. 2003; Etter et al. 2011), relatively recent events of colonization mediated by jump dispersal over barriers (Darling et al. 2000; Etter et al. 2011), and cryptic speciation (France & Kocher 1996; Howell et al. 2004). A number of deep-sea coral morphospecies are among these widespread species with discontinuous distribu- tions, for example Lophelia pertusa, Solenosmilia variabilis and Madrepora oculata (Roberts et al. 2009). Correspondence: Juan A. Sa ´nchez, Fax: +57 1 3394949*2817; E-mail: [email protected] © 2012 Blackwell Publishing Ltd Molecular Ecology (2012) doi: 10.1111/mec.12074

Welcome message from author
This document is posted to help you gain knowledge. Please leave a comment to let me know what you think about it! Share it to your friends and learn new things together.
Transcript
Spatial and temporal patterns of genetic variation in thewidespread antitropical deep-sea coral Paragorgiaarborea
S . HERRERA,*† T. M. SHANK‡ and J . A. SANCHEZ†
*Massachusetts Institute of Technology, Woods Hole Oceanographic Institution, Joint Program in Oceanography, 266 Woods
Hole Road, Woods Hole, MA 02543, USA, †Laboratorio de Biologia Molecular Marina (BIOMMAR), Departamento Ciencias
Biologicas, Universidad de los Andes, Carrera 1E No 18A – 10, Bogota, Colombia, ‡Biology Department, Woods Hole
Oceanographic Institution, 266 Woods Hole Road, Woods Hole, MA 02543, USA
Abstract
Numerous deep-sea species have apparent widespread and discontinuous distribu-
tions. Many of these are important foundation species, structuring hard-bottom benthic
ecosystems. Theoretically, differences in the genetic composition of their populations
vary geographically and with depth. Previous studies have examined the genetic diver-
sity of some of these taxa in a regional context, suggesting that genetic differentiation
does not occur at scales of discrete features such as seamounts or canyons, but at larger
scales (e.g. ocean basins). However, to date, few studies have evaluated such diversity
throughout the known distribution of a putative deep-sea species. We utilized
sequences from seven mitochondrial gene regions and nuclear genetic variants of the
deep-sea coral Paragorgia arborea in a phylogeographic context to examine the global
patterns of genetic variation and their possible correlation with the spatial variables of
geographic position and depth. We also examined the compatibility of this morphospe-
cies with the genealogical-phylospecies concept by examining specimens collected
worldwide. We show that the morphospecies P. arborea can be defined as a genealogi-
cal-phylospecies, in contrast to the hypothesis that P. arborea represents a cryptic
species complex. Genetic variation is correlated with geographic location at the basin-
scale level, but not with depth. Additionally, we present a phylogeographic hypothesis
in which P. arborea originates from the North Pacific, followed by colonization of the
Southern Hemisphere prior to migration to the North Atlantic. This hypothesis is
consistent with the latest ocean circulation model for the Miocene.
Keywords: coral, deep sea, DNA barcoding, phylogeography, species, widespread
Received 1 June 2012; revision received 28 August 2012; accepted 1 September 2012
Introduction
Several marine species, particularly from deep-sea envi-
ronments, have apparent widespread yet discontinuous
distributions (e.g. review by Roberts et al. 2009; Bik et al.
2012). Various mechanisms have been suggested to
explain the apparent existence of such species, including
recent connectivity among populations mediated by
long-distance dispersal (Bucklin et al. 1987; France &
Kocher 1996; Darling et al. 2000; Won et al. 2003;
Pawlowski et al. 2007; Lecroq et al. 2009; Etter et al.
2011), large population sizes and similar selective pres-
sures in a stable environment (Bisol et al. 1984; Brink-
meyer et al. 2003; Etter et al. 2011), relatively recent
events of colonization mediated by jump dispersal over
barriers (Darling et al. 2000; Etter et al. 2011), and cryptic
speciation (France & Kocher 1996; Howell et al. 2004). A
number of deep-sea coral morphospecies are among
these widespread species with discontinuous distribu-
tions, for example Lophelia pertusa, Solenosmilia variabilis
and Madrepora oculata (Roberts et al. 2009).Correspondence: Juan A. Sanchez, Fax: +57 1 3394949*2817;
E-mail: [email protected]
© 2012 Blackwell Publishing Ltd
Molecular Ecology (2012) doi: 10.1111/mec.12074

Deep-sea corals are some of the most conspi-
cuous invertebrate inhabitants of hard-bottom benthic
environments worldwide. They are not only more
diverse, in terms of number of species, than their shal-
low counterparts (Cairns 2007), but also they play a
fundamental role as foundation species and ecosystem
engineers, creating three-dimensional habitats that are
occupied by a high diversity of associate species (Buhl-
Mortensen & Mortensen 2005; Costello et al. 2005;
Etnoyer & Morgan 2007; Buhl-Mortensen et al. 2010;
Shank 2010). Coral ecosystems also support fisheries
(D’Onghia et al. 2011; Soeffker et al. 2011) and have
been identified as important sources of marine natural
products (Leal et al. 2012). Deep-sea corals have evolved
in a relatively stable and energy-poor environment; they
tend to have slow growth rates (Roberts et al. 2009; Sun
et al. 2010), great longevity (Roark et al. 2009) and
size-dependent fecundity (Cordes et al. 2001). These
characteristics make deep-sea coral ecosystems highly
susceptible to disturbance events, especially those gen-
erated by human activities, that is, bottom-trawling,
deep-sea mining, hydrocarbon extraction, waste dis-
posal, climate change and ocean acidification (reviewed
in Ramirez-Llodra et al. 2011). The characterization of
spatial distribution patterns of genetic types is of funda-
mental importance to identify the factors that shape the
ranges of deep-sea taxa, and that ultimately drive biodi-
versity patterns in the ocean (McClain & Mincks 2010).
Widespread taxa thus can be used as models to under-
stand how the effects of these factors operate at a global
scale. Such information provides critical baseline data
with which the potential effects of disturbances on
populations inhabiting earth’s largest biome can be
assessed.
A handful of studies have examined the genetic
diversity of deep-sea coral taxa in a regional context (Le
Goff-Vitry et al. 2004; Smith et al. 2004; Thoma et al.
2009; Morrison et al. 2011). These have suggested that
genetic differentiation does not seem to occur at small
geographic scales often associated with discrete features
such as individual seamounts or canyons, but presum-
ably at larger scales, that is, broader oceanic regions.
However, no studies to date have evaluated such
hypotheses throughout the entire known distribution of
a putative deep-sea coral species (see Pante & Watling
2012; for a comparison between two distant regions).
In this study, we examined the spatial patterns of
genetic variation in the widespread bubblegum coral
Paragorgia arborea (Linnaeus, 1758) (Octocorallia: Parag-
orgiidae), which is one of the most prominent coral
morphospecies in cold-water sublittoral and bathyal
hard-substrate habitats.
Paragorgia arborea plays an important ecological role
generating microhabitats for numerous species; they are
the structural analog of large trees in a rain forest
(Buhl-Mortensen & Mortensen 2005; Metaxas & Davis
2005; Watanabe et al. 2009; Buhl-Mortensen et al. 2010).
Single colonies of P. arborea can harbour hundreds of
individuals from dozens of associated species (e.g.
ophiuroids, copepods, shrimp, anemones, polychaetes,
ostracods, barnacles, amphipods, hydroids and forami-
niferans) (Buhl-Mortensen et al. 2010). The fauna associ-
ated with this coral can be two to three times richer
than the fauna associated with equivalent shallow-water
tropical gorgonians (Buhl-Mortensen & Mortensen 2004,
2005).
Paragorgia arborea has been reported from polar,
subpolar and subtropical regions of all of the world’s
oceans. This conspicuous and locally abundant species
can grow massive colonies, which can reach up to 8 m
in height (Sanchez 2005). Paragorgia arborea lives in
regions of high productivity (Sarmiento & Gruber 2006
depth-integrated primary production > 10 mol/C/m2/year) and high export fluxes (Sarmiento & Gruber
2006 particle export at 100 m > 2 mol/C/m2/year), water
temperatures lower than 12 °C and relatively high
local current velocities of 5–30 cm/s (Mortensen &
Buhl-Mortensen 2004; Bryan & Metaxas 2006; Etnoyer &
Morgan 2007; Roberts et al. 2009; Watanabe et al. 2009).
The known distribution of P. arborea in the Northern
Hemisphere includes numerous observations in both
eastern and western North Atlantic waters and also in
the eastern and western North Pacific (WNP), from
Japan to the Aleutian Islands and to the Californian
seamounts. In the Southern Hemisphere, it has been
reported around the Crozet Islands, the Patagonian
Shelf and the western South Pacific off New Zealand
(Grasshoff 1979; Tendal 1992). Since the publication of
these records, both fishing pressure and scientific
research in the deep sea have increased significantly,
and the number of new records for this species has
increased in tandem. Some of these records can now be
found in biodiversity databases such as the Ocean
Biogeographic Information System (OBIS, http://www.
iobis.org) and Global Biodiversity Information Facility
(GBIF, http://data.gbif.org); however, many others
remain unconsolidated in scattered publications and
local databases. Thus, an updated picture of the global
distribution of this species is in order.
In this study, we provide an up-to-date summary of
the global distribution of P. arborea and genetic insights
into the global phylogeography of this species. By
examining the genealogy of mitochondrial and nuclear
genetic variants from specimens collected over nearly
its entire known distribution, we tested the compatibil-
ity of the morphospecies P. arborea with the genealogi-
cal-phylospecies concept. We evaluated the hypothesis
that the morphospecies P. arborea is a complex of
© 2012 Blackwell Publishing Ltd
2 S . HERRERA, T . M. SHANK and J . A . SANCHEZ

cryptic species in a barcoding framework. We also
examined the global patterns of genetic variation and
their possible correlation with the spatial variables of
geographic position and depth. We propose a scenario
that could explain the observed evolutionary and
present-day patterns in this and other species.
Methods
Global distribution
To illustrate the currently known global distribution of
Paragorgia arborea, we plotted on a gridded geographic
map all the unique records available to date from the
databases of the OBIS, the GBIF, the Smithsonian
Institution National Museum of Natural History
(http://www.mnh.si.edu/rc/), the Yale University
Peabody Museum of Natural History (www.peabody.
yale.edu), the Harvard University Museum of Compar-
ative Zoology (www.mcz.harvard.edu), the Museum
National d’Histoire Naturelle France (www.mnhn.fr),
the National Institute of Water & Atmospheric Research
(www.niwa.cri.nz) and several local databases and
publications (Bruntse & Tendal 2000; Wareham &
Edinger 2007; Mortensen et al. 2008; Roberts et al. 2008;
Hibberd & Moore 2009; Laptikhovsky 2011). Geographic
coordinates were reconstructed using Google Earth for
records with known collection locality, but no latitude
and longitude information. Similarly, missing depth
data were reconstructed using data from the global
GEBCO_08 30 arc-second grid.
Molecular methods
We analysed a total of 130 specimens of P. arborea avail-
able from various museum and laboratory collections
(see Table S1, Supporting information). The examined
material, collected since 1878, covers most to the known
geographic distribution as well as the entire depth dis-
tribution of P. arborea (see Table S1, and Figs S1–S4,
Supporting information for comparison). For more
details on the sequencing of old specimens, see the
Appendix S1 (Supporting information). Additional
material from other paragorgiid morphospecies was
included for comparisons. Total DNA was extracted
from dry or ethanol-preserved (70–96%) samples using
a CTAB–proteinase K–PCI protocol (Coffroth et al. 1992)
or using an automated extraction system (AutoGenprep
965; AutoGen Inc.) as described in the study by Herrera
et al. (2010). DNA was eluted in TE buffer and stored at
�70 °C.Mutation rates in octocoral mitochondria are signifi-
cantly lower than in most other organisms (Bilewitch &
Degnan 2011). The implication of this lower mutation
rate is that mitochondrial markers in octocorals are use-
ful to infer phylogeographic patterns and connectivity
at broader spatial and temporal scales. Thus, to maxi-
mize the amount of variability captured from the
genome of this organelle, we obtained sequences from
seven gene regions, amplified by five primer pairs (Her-
rera et al. 2010), adding up to approximately 3000 base
pairs (bp). These regions include the 3′-end of the
NADH dehydrogenase subunit 6 (nad6), the nad6-nad3
intergenic spacer (int), the 5′-end of the NADH dehydro-
genase subunit 3 (nad3), the 3′-end of the cytochrome c
oxidase subunit I (cox1), the 5′-end of the DNA
mismatch repair protein – mutS – homolog (mtMutS),
two different regions of the large subunit ribosomal
RNA (16S) and the 5′-end of the NADH dehydrogenase
subunit 2 (nad2).
We also sequenced the nuclear ribosomal internal
transcribed spacer 2 (ITS2). In octocorals, ITS has been
assessed in a number of groups providing enough reso-
lution for diverse phylogenetic inferences (Alcyoniidae
McFadden et al. 2001; McFadden & Hutchinson 2004;
Nephtheidae van Ofwegen & Groenenberg 2007). ITS2
has also provided enough resolution for intraspecific
and phylogeographic studies in Caribbean shallow-
water octocorals (Sanchez et al. 2007; Gutierrez-Rodri-
guez et al. 2009). Furthermore, ITS2 has also provided
valuable information for the analysis of genetic struc-
ture of deep-sea corals (Le Goff-Vitry et al. 2004; Miller
et al. 2011).
Polymerase chain reactions (PCR) and sequencing
reactions for mitochondrial gene regions were per-
formed following the protocols used by Herrera et al.
(2010). ITS2 PCR amplicons, from a subset of 19 geo-
graphically representative individuals, were examined
to assess the possibility of intragenomic variants
through denaturing gradient gel electrophoresis
(DGGE). Gels contained 8% polyacrylamide, 19 TAE
buffer and a linear urea–formamide denaturing gradient
from 45% to 80%. The gels were pre-ran at 60 °C and
90 V for 30 min, followed by 13 h at 60 °C and 90 V.
Gels were stained with ethidium bromide for 15 min
and visualized using a Bio-Rad Chemidoc system. PCR
products from DGGE-excised bands were subsequently
cleaned and sequenced. Complementary chromato-
grams were assembled and edited using the SEQUEN-
CHERTM 4.8 software (Gene Codes Corp.).
Sequences of each region were aligned independently
using MAFFT 6.8 (Katoh et al. 2002). The G-INS-i and
Q-INS-i algorithms (gap opening penalty = 1.53, offset
value = 0.07) were employed for the protein coding and
ribosomal regions, respectively. Secondary structures of
ribosomal regions were inferred to improve the align-
ments, following the protocols used in the study by
Herrera et al. (2010). To correct possible mistakes, all
© 2012 Blackwell Publishing Ltd
PHYLOGEOGRAPHY OF DEEP-SEA CORAL PARAGORGIA ARBOREA 3

alignments of protein coding sequences were visually
inspected and translated to amino acids in GENEIOUS 5.3
(Drummond et al. 2010), using the genetic code of
Hydra attenuata (Pont-Kindon et al. 2000). No unusual
stop codons or suspicious substitutions were identified,
suggesting that no nuclear pseudogenes were
sequenced (Lopez et al. 1994; Bensasson et al. 2001).
Mitochondrial sequences were concatenated for each
individual and treated as one single locus in most sub-
sequent analyses, given that the mitochondrial genome
is assumed to be nonrecombining. Mitochondrial and
ITS2 genetic variants, with alignment gaps included as
an informative state (Giribet & Wheeler 1999), were
identified using DNASP 5.0 (Librado & Rozas 2009) and
will be referred hereafter as haplotypes.
Gene trees and molecular clock
To evaluate the compatibility of P. arborea with the
functional definition of genealogical-phylospecies sensu
De Queiroz (2007), that is, all alleles of a given locus in
individuals of P. arborea being ‘descended from a com-
mon ancestral allele not shared with those of other
species’ (Avise & Ball 1990; Baum & Shaw 1995), we
performed independent phylogenetic analyses of the
mitochondrial and ITS2 haplotypes. Homologous
sequences from eight other paragorgiid morphospecies
were included as outgroups (see Table S1, Supporting
information). Phylogenetic estimation was performed
using Bayesian inference (BI) in MRBAYES 3.12 (Huelsen-
beck & Ronquist 2001; Ronquist & Huelsenbeck 2003)
as implemented in the CIPRES portal (http://www.phylo.
org). Most likely nucleotide substitution models were
selected for each region based on the Akaike Informa-
tion Criteria (AIC) as implemented in JMODELTEST 2.0.
Models for the mitochondrial regions are shown in
Table S2 (Supporting information). The general time
reversible model with a gamma-distributed rate varia-
tion across sites (GTR+G) was selected for the ITS2.
Default prior distribution settings were assumed for all
parameters. Four independent analyses of 10 000 000
Monte Carlo Markov chain (MCMC) generations (94
chains) were run with a sampling frequency of 1000
generations (burn-in = 25%). Combined BI analysis of
the mitochondrial locus was performed with explicit
character partitions for each concatenated region, along
with their independently selected models of evolution.
To account for the rate variation among partitions (Mar-
shall et al. 2006), we allowed the rates to vary under a
flat Dirichlet prior distribution (ratepr = variable). The
parameters of nucleotide frequencies, substitution rates,
gamma shape and invariant site proportion were
unlinked across partitions. MCMC runs were analysed
in the program TRACER 1.5 (Rambaut & Drummond
2007). Convergence was indicated by the ‘straight hairy
caterpillar’ (Drummond et al. 2007) shape of the station-
ary posterior-distribution trace (generations vs. log-like-
lihood) of each parameter. Other examined convergence
and mixing diagnostics included the standard deviation
of partition frequencies (<0.01), the potential scale
reduction factor (PSRF) (ca. 1.00), the effective sample
sizes (EES) (>200) and the similitude of posterior proba-
bilities of specific nodes between different runs in the
program AWTY (http://ceb.csit.fsu.edu/awty) (Nylander
et al. 2008). High correlations between runs and no
obvious trends in the split frequency plots were
observed. Tree files for each run were combined, after
burn-in, using the program LOGCOMBINER v1.7.1 (Drum-
mond et al. 2012). The most probable trees were
summarized into a maximum clade credibility tree
using TREEANNOTATOR v1.7.1 (Drummond et al. 2012).
A Bayesian-MCMC joint estimation of gene genealogy
and divergence times was performed in BEAST 1.7.1
(Drummond et al. 2012) for the mitochondrial marker
assuming the same substitution model mentioned
above. We assumed an uncorrelated relaxed lognormal
molecular clock model, which allows for the variation
in mutation rates among branches, with the Yule model
of constant speciation rate (Yule 1925; Gernhard 2008)
and the coalescent model of constant population size
(Kingman 1982), as the tree priors. Additional
sequences from specimens of the sister family, Corallii-
dae, were added to estimate divergence time within the
phylogeny as this family contains some of the few fos-
sils available for Octocorallia. The coralliid node was
calibrated implementing a normal prior distribution for
the time to the most recent common ancestor (TMRCA)
with a mean of 83.5 million years before present (Myr
BP) and a standard deviation of 0.7, corresponding to
Campanian age stratum, in which the oldest known
fossil in this family has been found (Schlagintweit &
Gawlick 2009). Three MCMC independent analyses
were run for 30 000 000 generations with a sampling
frequency of 3000 (burn-in = 25%). Convergence diag-
nostics (generations plot and EES) were also examined
for the combined runs in TRACER 1.5 (Rambaut &
Drummond 2007) as mentioned above. The most proba-
ble trees were summarized into a maximum clade
credibility tree with median node heights using TREEAN-
NOTATOR v1.7.1 (Drummond et al. 2012).
To infer the historical patterns of dispersal in
P. arborea, we used the Bayesian phylogeography
framework proposed by Lemey et al. (2009), as imple-
mented in BEAST 1.7.1 (Drummond et al. 2012). We
mapped the geographic ocean region where each haplo-
type was sampled to the time-scaled mitochondrial
gene genealogy, which was inferred with the assump-
tion of an uncorrelated relaxed lognormal molecular
© 2012 Blackwell Publishing Ltd
4 S . HERRERA, T . M. SHANK and J . A . SANCHEZ
clock and the coalescent constant-population-size tree
prior, as explained above. This framework allows the
reconstruction of discrete states of geographic location
for ancestral nodes by posterior probability estimation.
Barcoding and species delimitation
To test for the possibility of cryptic species in the mor-
phospecies P. arborea, we calculated pairwise uncor-
rected distances among individuals of P. arborea and
other paragorgiid morphospecies for the mtMutS and
cox1 sequences, as proposed by McFadden et al. (2011),
in PAUP* 4.0b10 (Swofford 2002). Neighbour-joining trees
were built using the calculated distances. We also
examined the ITS2 secondary structures for the
presence of compensatory base changes (CBCs) using
the visualization program 4SALE (Seibel et al. 2006);
CBCs are altered pairings in a helix of the secondary
structure of the ITS2 RNA transcript, and empirical
work has suggested that they could be used as indica-
tors of species boundaries in most metazoans (Muller
et al. 2007; Coleman 2009).
We also used the coalescent-based species delimita-
tion method described by Pons et al. (2006) and
Monaghan et al. (2009), as implemented in the SPLITS
R-package (available from http://r-forge.r-project.org/
projects/splits/). This likelihood method is based on a
general mixed Yule-coalescent (GMYC) model, which
estimates phylospecies boundaries in a clock-con-
strained calibrated tree by identifying increases in
branching rates (looking forward in time). Such
increases are assumed to be characteristic of transition
points between interspecific speciation–extinction pro-
cesses and intraspecific coalescent processes, that is,
populations (Pons et al. 2006; Monaghan et al. 2009). Sin-
gle- and multiple-threshold models with explicit and
upper and lower limits for the estimation of scaling
parameters (0 and 10, respectively) were used in the
analysis of the time-calibrated trees obtained with the
Yule and coalescent models tree priors.
Genetic variability
Genetic variability among individuals and populations
was measured for each locus according to the haplotype
diversity (h) and genetic diversity (average number of
pairwise differences hp) indices (Tajima 1983) using
ARLEQUIN 3.5 (Excoffier & Lischer 2010). Fu’s Fs statistic
was calculated to determine whether the observed
pattern of polymorphism was consistent with a neutral
model of evolution (Tajima 1989; Fu 1997). Global FSTstatistics were calculated to evaluate for possible differ-
entiation in the genetic composition among populations
worldwide. Pairwise comparisons of population differ-
entiation were made in Arlequin and significance
values estimated after 1000 permutations. To visualize
the spatial patterns of genetic variation for each marker,
the specimens were colour-coded according to haplo-
type, their geographic collection coordinates were
plotted using IMAP v3.5 (Biovolution), and their collec-
tion depth was plotted on an X-Y scatter plot. To assess
the amount of variability in the populations of P. arbo-
rea that was represented in our samples, we generated
haplotype accumulation curves (Gotelli & Colwell 2001)
by calculating estimates of the mean and variance for
the number of accumulated haplotypes through 1000
random permutations, using the program R-package
SPIDER v1.1 (Brown et al. 2012).
Results
Global distribution
A total of 341 high-confidence geographic location
records of Paragorgia arborea were gathered (see Fig. S3,
Supporting information). Paragorgia arborea is an
antitropical taxon, occupying a band between 30° and
70° degrees of latitude in both hemispheres. These
bands are, in general, areas of high surface primary
productivity and export (Sarmiento & Gruber 2006).
Most records of P. arborea are from depths shallower
than 1000 m, indicating a preference for upper-bathyal
environments. Despite the fact that other coral species
that share part of their ranges with P. arborea have been
commonly observed in tropical and subtropical regions
(e.g. Lophelia pertusa and Madrepora oculata), P. arborea
has never been found in these areas. This suggests that
the currently known distribution of P. arborea is not a
result of undersampling at lower latitudes.
Molecular data
A total of 92 specimens were positively screened for the
mitochondrial marker. The concatenated mitochondrial
alignment for the morphospecies P. arborea had a length
of 2922 bp, of which 2881 were invariable sites (pair-
wise identity of 99.7%); eight sites were parsimony-
informative. The mean ungapped sequence length was
2917.9 bp (SD = 2.8 bp), with a range of 2910 and
2921 bp. The G-C content was 39.5%. The only noncod-
ing region in the mitochondrial locus data set, the nad6-
nad3 intergenic spacer (int), contained one indel, but no
nucleotide substitutions. The ITS2 was successfully
sequenced for 48 specimens, of which 83% overlapped
with the mitochondrial set. The ITS2 alignment had a
length of 312 bp, of which 301 were invariable (pairwise
identity of 99.2%); 35 sites were parsimony-informative.
The mean ungapped sequence length for ITS2 was
© 2012 Blackwell Publishing Ltd
PHYLOGEOGRAPHY OF DEEP-SEA CORAL PARAGORGIA ARBOREA 5
282 bp (SD 0.9 bp), ranging between 280 and 284 bp.
The G-C content was 41.1%. No intragenomic variability
was revealed, using DGGE, in the ITS2. The predicted
secondary structure of ITS2 showed the characteristic
shape of a helicoidal ring with four helixes (Coleman
2007); stems III and IV were particularly long in this
species (Fig. S5, Supporting information). The number
of haplotypes and genetic diversity estimates for each
population with both loci are shown in Figs 1 and 2.
The nad6-int-nad3 region (hereafter referred as nad6 for
simplicity) contained most of the variable sites (21) and
the greatest number of haplotypes (11) found in the
individuals with complete mitochondrial data sets.
Haplotype differences were also located in the ITS2:
one at helix I, three at helix III and five at helix IV; the
remaining two were free nucleotides at the structure
main ring (Fig. S5, Supporting information).
Gene genealogies and phylogeographic history
Individual mitochondrial gene trees were largely con-
gruent, although resolution was generally low (Fig. S6,
Supporting information). The inferred phylogeny based
on each independent loci (i.e. concatenated mitochon-
drial and ITS2) highly supported the monophyly of
P. arborea (Fig. 3) and had much greater clade resolu-
tion. Both Bayesian and neighbour-joining analyses
inferred the same evolutionary relationships. Branch
lengths were appreciably shorter within the clade of
P. arborea, when compared to the ones among morpho-
species. Relationships within Paragorgia were not fully
resolved, particularly among Paragorgia wahine, Paragor-
gia yutlinux and Paragorgia sp. 1. The systematic
relationships of Paragorgia spp. are outside of the scope
of this study and will not be further discussed.
The time-scaled trees estimated assuming the coales-
cent model of constant population size had, in general,
shorter shallower and longer deeper branches than the
tree estimated assuming the Yule model of constant
speciation rate (Figs S7 and S8, Supporting informa-
tion). Consequently, the time to the TMRCA of the
genus Paragorgia was estimated to be 61 Myr BP (95%
CI: 31–101) under the coalescent model and 54 Myr BP
(95% CI: 41–94) under the Yule model. The TMRCA of
P. arborea based on the coalescent model and the Yule
model was 10.1 Myr BP (95% CI: 4.4–18.8) and
14.1 Myr BP (95% CI: 6.7–26.3), respectively.
The Bayesian phylogeographic analysis indicates that
the lineage of P. arborea likely originated in the North
Pacific (posterior probability 0.38, see Fig. 4). Dispersal
to the South Pacific and subsequent colonization of
the North Atlantic likely occurred between the mid-
Miocene and early Pliocene.
Genetic distances, CBCs and GMYC
Maximum uncorrected genetic distances among conspe-
cifics and minimum uncorrected genetic distances
among congeners were used to measure the intraspe-
cific and interspecific variation, respectively, of mtMutS
and cox1 sequences as in the study by McFadden et al.
(2011). The maximum distances within P. arborea, 0.3%
for mtMutS and 0.9% for cox1, were in general smaller
than the distances among morphospecies of Paragorgia,
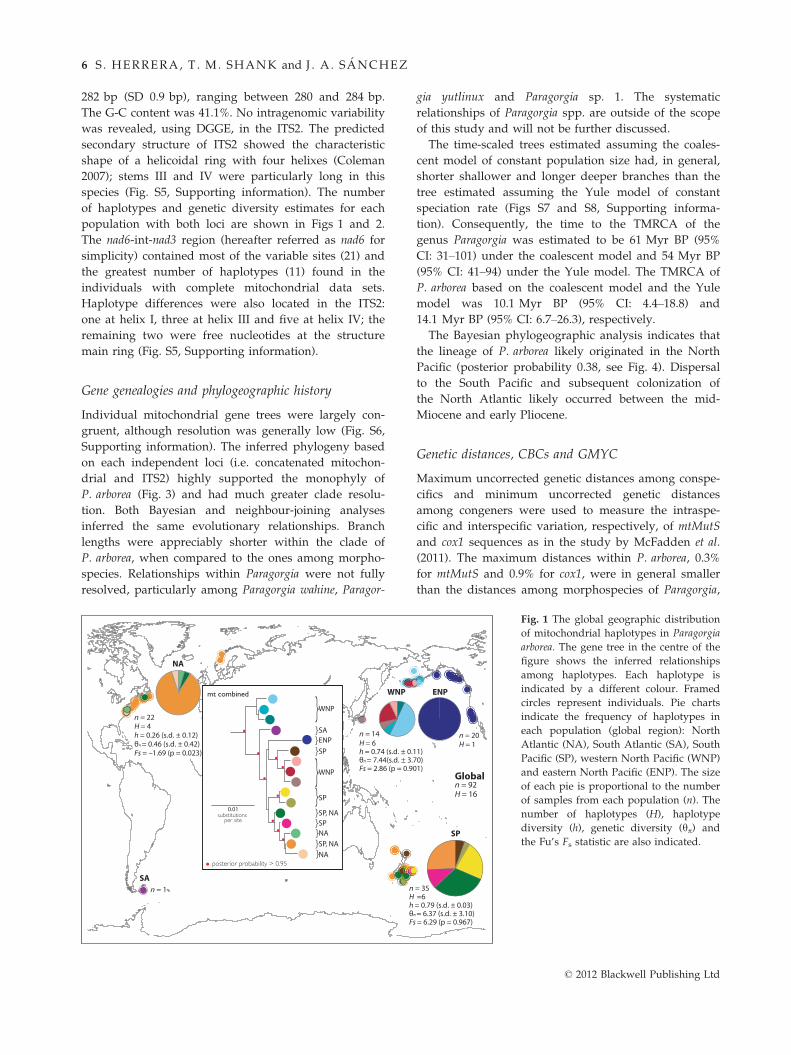
Fig. 1 The global geographic distribution
of mitochondrial haplotypes in Paragorgia
arborea. The gene tree in the centre of the
figure shows the inferred relationships
among haplotypes. Each haplotype is
indicated by a different colour. Framed
circles represent individuals. Pie charts
indicate the frequency of haplotypes in
each population (global region): North
Atlantic (NA), South Atlantic (SA), South
Pacific (SP), western North Pacific (WNP)
and eastern North Pacific (ENP). The size
of each pie is proportional to the number
of samples from each population (n). The
number of haplotypes (H), haplotype
diversity (h), genetic diversity (hp) and
the Fu’s Fs statistic are also indicated.
© 2012 Blackwell Publishing Ltd
6 S . HERRERA, T . M. SHANK and J . A . SANCHEZ

which ranged between 0.5–6.1% and 0–2.3% for mtMutS
and for cox1, respectively (Table S3, Supporting infor-
mation). The minimum distances between P. arborea
and the other morphospecies of Paragorgia ranged
between 1.8–5.1% for mtMutS and 0.6–1.8% for cox1. A
similar pattern was observed for ITS2 distances, 0.6% in
Fig. 2 The global geographic distribution
of nuclear internal transcribed spacer 2
haplotypes in Paragorgia arborea. The
gene tree in the centre of the figure
shows the inferred relationships among
haplotypes. Each haplotype is indicated
by a different colour. Framed circles rep-
resent individuals. Pie charts indicate the
frequency of haplotypes in each popula-
tion: North Atlantic (NA), South Indian
Ocean (SI), South Pacific (SP), western
North Pacific (WNP) and eastern North
Pacific (ENP). The size of each pie is
proportional to the number of samples
from each population (n). The number of
haplotypes (H), haplotype diversity (h),
genetic diversity (hp) and the Fu’s Fsstatistic are also indicated.
Fig. 3 Unrooted gene tree hypotheses for the mitochondrial
(top) and nuclear internal transcribed spacer 2 (bottom) mark-
ers in Paragorgia.
NA
SPNP
SA
Time (million years)
NP
NP
NP
NP
NPNP
NP
NP
SP
SP
SP
SP
NA
NA
NA
Fig. 4 Maximum clade credibility ultrametric time-scaled mito-
chondrial gene tree for Paragorgia arborea. Branch colours show
the most probable location states: North Atlantic (NA) in blue,
South Pacific (SP) in green, South Atlantic (SA) in violet and
North Pacific (NP) in orange. Pie charts show the posterior
probabilities of location states for each ancestral node (total pie
area = 1). The most probable location state of each node is also
indicated.
© 2012 Blackwell Publishing Ltd
PHYLOGEOGRAPHY OF DEEP-SEA CORAL PARAGORGIA ARBOREA 7
intraspecific comparisons within P. arborea (maximum
distances) and 3.3–7.4% in interspecific comparisons
among morphospecies of Paragorgia. The minimum
distances between P. arborea and the other morphospe-
cies ranged between 3.3 and 5.6%. The predicted ITS2
secondary structure was essentially the same for all
haplotypes of P. arborea and no CBCs or hemi-CBCs
were observed.
A transition point between species- and population-
level branching patterns was identified, by the single-
threshold GMYC method, at ca. 21 Myr BP for the
time-scaled mitochondrial gene genealogy estimated
with the Yule model tree prior (Fig. S7, Supporting
information). For the time-scaled gene genealogy esti-
mated with the coalescent model tree prior, this transi-
tion point was inferred to be at ca. 16 Myr BP (Fig. S8,
Supporting information). In both cases, the GMYC
model showed a marginally significant (i.e. a = 0.05)
better fit to the data than the null model of uniform
coalescent branching rates (LR = 4.84, d.f. = 3, P = 0.18,
compared to LR = 5.84, d.f. = 3, P = 0.12, respectively).
The implementation of a multiple-threshold GMYC
model did not yield a significantly (i.e. a = 0.05) better
fit than the single-threshold GMYC for either case
(v2 = 2.55, d.f. = 3, P = 0.47 and v2 = 0.83, d.f. = 3,
P = 0.84, respectively).
Spatial patterns of genetic variation
Overall, in P. arborea, 16 haplotypes were defined based
on the mitochondrial locus and 11 based on the ITS2.
The genealogical relationships among haplotypes
inferred by the Bayesian inference did not reveal reci-
procal monophyly of the specimens from Northern and
Southern Hemispheres, or from different oceans, for
example Pacific vs. Atlantic (Figs 1 and 2). In fact, a
number of haplotypes were shared across large
geographic spans.
Genetic diversity, as measured by the haplotype
diversity (h, the probability that two randomly chosen
haplotypes are different in a population sample) and
the average number of nucleotide differences between
all pairs of haplotypes in the sample (hp), was highest
in the western North Pacific Ocean (mitochondrial
h = 0.74, SD = 0.11, and hp = 7.44, SD = 0.11; nuclear
h = 0.75, SD = 0.14, and hp = 2.68, SD = 1.81) and South
Pacific Ocean (SP; mitochondrial h = 0.79, SD = 0.03,
and hp = 6.37, SD = 3.10; nuclear h = 0.73, SD = 0.09,
and hp = 1.64, SD = 1.15) regions, intermediate in the
North Atlantic Ocean (NA; mitochondrial h = 0.26,
SD = 0.12, and hp = 0.46, SD = 0.42; nuclear h = 0.71,
SD = 0.11, and hp = 1.02, SD = 0.82) and lowest in the
eastern North Pacific Ocean (ENP; mitochondrial
hp = 0.00; nuclear h = 0.49, SD = 0.18, and hp = 1.16,
SD = 0.91) (Figs 1 and 2). Overall, the relative levels of
genetic diversity for both loci were highly similar (see
Figs 1 and 2). No significant deviations from neutrality
were found in either locus (i.e. a = 0.05).
Mitochondrial haplotypes m15 and m12 were shared
between the NA and SP regions, although their
frequencies were dissimilar (Fig. 1). Haplotype m15 was
the dominant form in the NA, with a frequency of 0.86,
whereas only one specimen was found having the m12
variant. In the SP, these haplotypes represented two of
the three most common ones, with frequencies of 0.26
for m15 and 0.31 for m12. The rest of the haplotypes in
these regions represented private alleles, that is, variants
exclusive to a particular area. The haplotype from the
single specimen from the South Atlantic Ocean (SA)
region was a private allele. No haplotypes from the
North Pacific Ocean (NP) were shared with other
regions. Within the NP region, there was a clear break
between western and eastern subregions, separated by
the Alaska Peninsula. All haplotypes within these
subregions represented private alleles. Two dominant
haplotypes were found in the WNP, m2 and m7, with
frequencies of 0.5 and 0.21, respectively. In the ENP,
there was a single haplotype. In the ITS2 data set,
regional differences were less pronounced than in the
mitochondrial data set but, similarly, the haplotype
frequencies varied greatly among regions (Fig. 2).
Haplotypes i1 and i6 had near-cosmopolitan distribu-
tions. Haplotype i1 was found within all regions with
frequencies of 0.23 (NA), 0.67 [South Indian Ocean (SI)],
0.07 (SP), 0.25 (WNP) and 0.09 (ENP). Haplotype i6 was
found in specimens from the NA, SP and ENP, with fre-
quencies of 0.15, 0.07 and 0.73, respectively. Haplotype
i2 was shared between NA and SP, being dominant in
both regions, with frequencies of 0.54 and 0.43, respec-
tively. Lastly, haplotype i5 was found in both the NA
(frequency = 0.09) and the SI (frequency = 0.33). Private
alleles were found in the Pacific, with high frequencies
in the SP (i7, frequency = 0.36) and the NWP (i8,
frequency = 0.5), but none were found in the NA or SI.
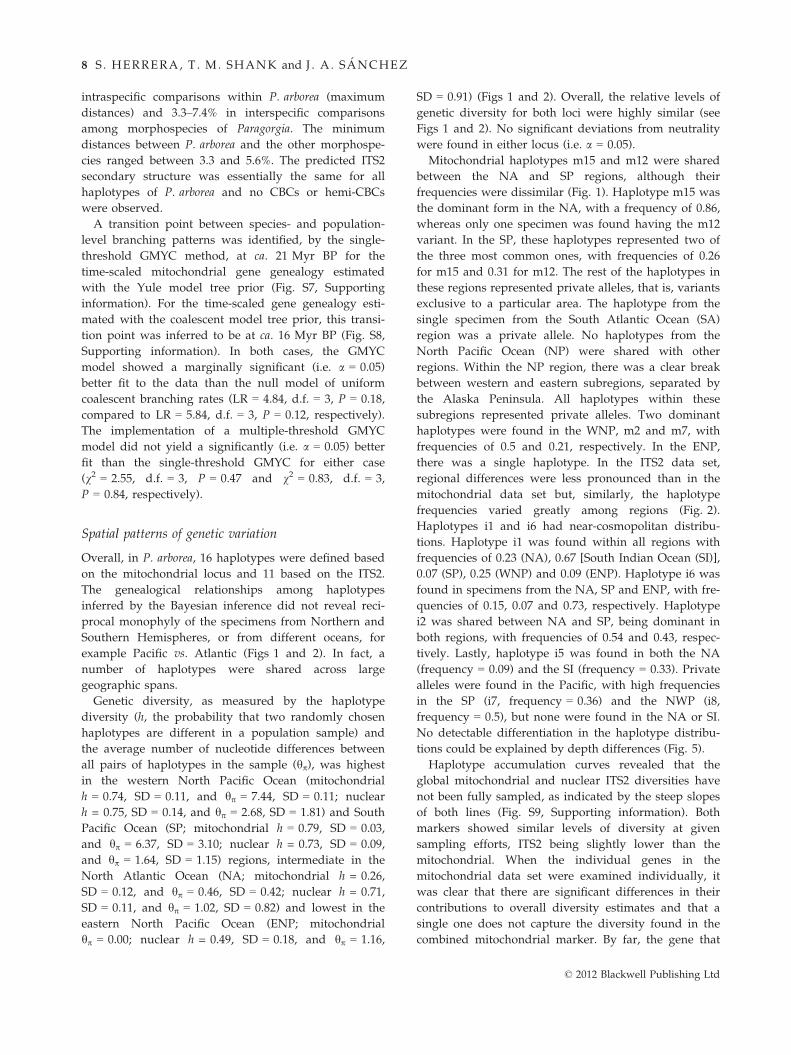
No detectable differentiation in the haplotype distribu-
tions could be explained by depth differences (Fig. 5).
Haplotype accumulation curves revealed that the
global mitochondrial and nuclear ITS2 diversities have
not been fully sampled, as indicated by the steep slopes
of both lines (Fig. S9, Supporting information). Both
markers showed similar levels of diversity at given
sampling efforts, ITS2 being slightly lower than the
mitochondrial. When the individual genes in the
mitochondrial data set were examined individually, it
was clear that there are significant differences in their
contributions to overall diversity estimates and that a
single one does not capture the diversity found in the
combined mitochondrial marker. By far, the gene that
© 2012 Blackwell Publishing Ltd
8 S . HERRERA, T . M. SHANK and J . A . SANCHEZ
captures the largest mitochondrial diversity in terms of
haplotypes in P. arborea is nad6 (11), followed by nad2
(6), mtMutS (5), 16S (4) and cox1 (3). The combination of
nad6 and 16S captures 14 haplotypes, and the addition
of nad2 to these two regions captures all 16 haplotypes
found in the combined mitochondrial marker.
Discussion
The data and analyses generated in this study showed
that the morphospecies Paragorgia arborea can be defined
as a genealogical-phylospecies, in contrast to the
hypothesis that P. arborea represents a cryptic species
complex. Genetic variation in this lineage is correlated
with geographic location at the basin-scale level, but
not with depth. We present a phylogeographic hypothe-
sis for P. arborea in which this independently evolving
lineage originates from the North Pacific, followed by
colonization of the Southern Hemisphere prior to
migration to the North Atlantic. We argue that this
hypothesis is consistent with the latest ocean circulation
model for the Miocene.
A globally distinct evolving lineage?
The distinction among species, incipient species and
structured populations in many deep-sea invertebrates
remains contentious due to the difficulties in defining
the species boundaries for certain groups and to the
paucity of the genetic, ecological and taxonomic data
available to date (Vrijenhoek 2009; McFadden et al.
2011). Commonly used species concepts (e.g. biological
species concept) have been traditionally developed in
terrestrial models. However, the biological and ecologi-
cal information required to apply such concepts to deep-
sea organisms (e.g. reproductive success, behaviour) is,
at this time, impracticable to obtain. It is now recognized
that a combination of morphologic and phylogenetic cri-
terions is most practical to discern among deep-sea coral
species (e.g. Herrera et al. 2010; Pante & Watling 2012).
Here, we examined, for the first time, the compatibil-
ity of traditional taxonomical identifications and molec-
ular information in a putative deep-sea coral species
at a global scale. The mitochondrial and nuclear gene
trees have congruent topologies, showing that alleles of
P. arborea have a common ancestor not shared with
other paragorgiid morphospecies. Thus, the morphospe-
cies P. arborea is compatible with the genealogical-
phylospecies concept. Furthermore, the branch lengths
among haplotypes of P. arborea are much shorter than
the branches among other putative species, which is to
be expected for genetic variability within a phylospe-
cies. The only consistent morphological variant corre-
sponds to the populations found in the NP, which were
previously referred as Paragorgia pacifica Verrill, 1922
but synonymized with P. arborea by Grasshoff (1979).
Individuals from these populations seem to have
reduced sclerite size and ornamentation when com-
pared to the characteristics that defined P. arborea prior
to Grasshoff synonymizing the two (Sanchez 2005).
Our data do not support P. pacifica as a valid species
(see discussion below); we rather suggest that it may
represent a subspecies. Taken together, this evidence
indicates that P. arborea is a globally distinct lineage,
implying that identifications based on morphology can
accurately distinguish this taxon.
A complex of cryptic species?
The presence of cryptic species complexes has been
detected in various presumed widespread marine mor-
phospecies (e.g. clams Goffredi et al. 2003; isopods
Raupach et al. 2007; limpets Johnson et al. 2008; gastro-
pods Duda et al. 2009; Vrijenhoek 2009). Despite being
morphological indistinguishable, cryptic species have
been detected through molecular data, on the basis of
genetic dissimilarity. Here, we tested for the possibility
of cryptic species within the specimens of P. arborea, by
analysing the pairwise uncorrected genetic distances
among haplotypes using a DNA barcoding framework
Dep
th (m
)
Mitochondrial haplotype1 2 3 5 6 7 8 9 10 11 12 13 14 15 16
Dep
th (m
)
0
500
1000
1500
0
500
1000
1500
ITS2 haplotype1 2 3 4 5 6 7 8 9 10 11
Fig. 5 The distribution of mitochondrial (left) and nuclear internal transcribed spacer 2 ITS2 (right) haplotypes of Paragorgia arborea
with depth. Individuals are represented by dots. Each haplotype is indicated by a different colour, as in Figs 1 and 2. The prefix m
denotes mitochondrial haplotypes, and the prefix i denotes nuclear ITS2 haplotypes (haplotype numbers are equivalent to the ones
in Table S1, Supporting information).
© 2012 Blackwell Publishing Ltd
PHYLOGEOGRAPHY OF DEEP-SEA CORAL PARAGORGIA ARBOREA 9
based on the cox1 and mtMutS gene regions (see
McFadden et al. 2011). Under this framework, pairwise
uncorrected distances greater than 1% for mtMutS or
cox1 genes can be confidently used to indicate cryptic
species (McFadden et al. 2011). Based on this threshold,
the maximum intraclade distances (0.3% for mtMutS
and 0.9% for cox1) among specimens of P. arborea do
not suggest the presence of cryptic species. These
distances are consistent with the intraspecific distances
found within other paragorgiid species, for example
0.8% for mtMutS in Sibogagorgia cauliflora (Herrera et al.
2010). However, the suggested threshold is unidirec-
tional, meaning that distances smaller than 1% do not
imply the absence of species boundaries. Additional
genetic and biological data are needed to test for this
possibility. The uniformity of predicted ITS2 secondary
structures and the absence of CBCs or hemi-CBCs are
also consistent with intraspecific levels of variation
(Muller et al. 2007; Coleman 2009; Ruhl et al. 2010).
However, similar to the mitochondrial barcoding
threshold discussed above, this criterion is also unidi-
rectional; thus, the absence of cryptic species is not
implied (Coleman 2009). Lastly, the branching transition
points inferred by the GMYC likelihood method
indicate that the lineage of P. arborea is independently
evolving with a branching pattern characteristic of a
population-level coalescent process (Figs S7 and S8,
Supporting information). In summary, the levels and
patterns of genetic variability in mitochondrial and ITS2
loci do not provide actual evidence for cryptic species
boundaries within P. arborea.
Global patterns of genetic variation
Genetic diversity in P. arborea is not randomly distrib-
uted, as it would be expected under a scenario of global
panmixia. It is highest at the ENP and SP populations
and lowest at WNP and NA populations, as indicated
by the haplotype diversity and the average pairwise dif-
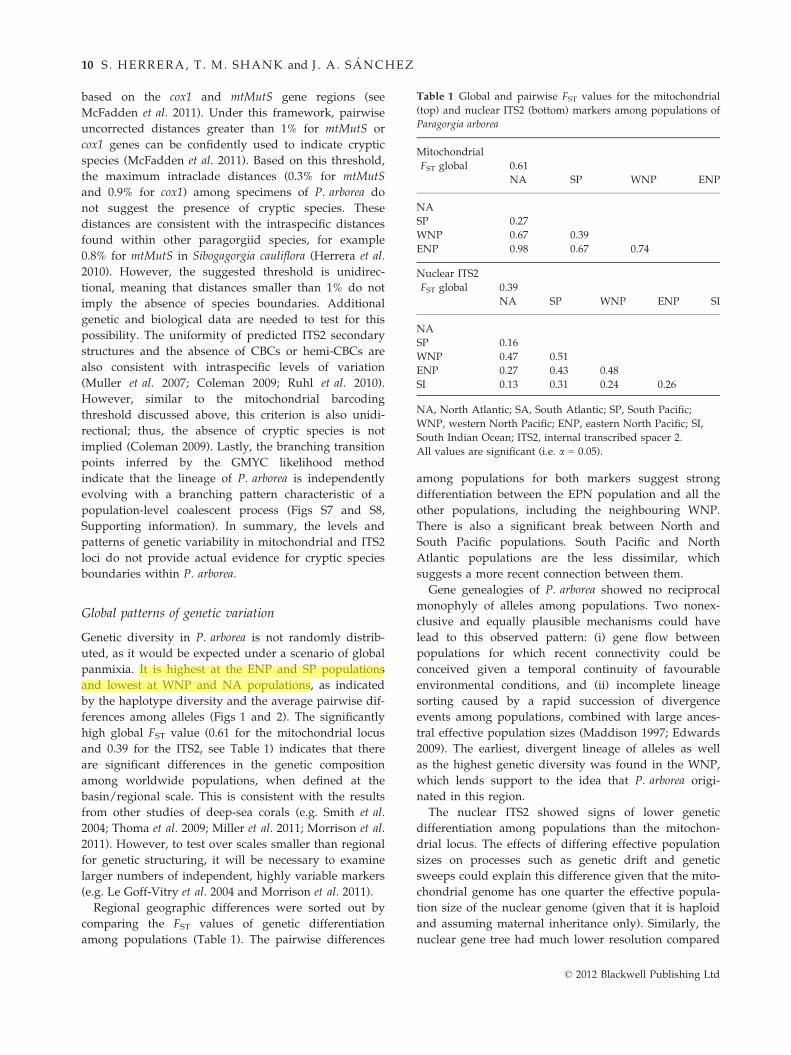
ferences among alleles (Figs 1 and 2). The significantly
high global FST value (0.61 for the mitochondrial locus
and 0.39 for the ITS2, see Table 1) indicates that there
are significant differences in the genetic composition
among worldwide populations, when defined at the
basin/regional scale. This is consistent with the results
from other studies of deep-sea corals (e.g. Smith et al.
2004; Thoma et al. 2009; Miller et al. 2011; Morrison et al.
2011). However, to test over scales smaller than regional
for genetic structuring, it will be necessary to examine
larger numbers of independent, highly variable markers
(e.g. Le Goff-Vitry et al. 2004 and Morrison et al. 2011).
Regional geographic differences were sorted out by
comparing the FST values of genetic differentiation
among populations (Table 1). The pairwise differences
among populations for both markers suggest strong
differentiation between the EPN population and all the
other populations, including the neighbouring WNP.
There is also a significant break between North and
South Pacific populations. South Pacific and North
Atlantic populations are the less dissimilar, which
suggests a more recent connection between them.
Gene genealogies of P. arborea showed no reciprocal
monophyly of alleles among populations. Two nonex-
clusive and equally plausible mechanisms could have
lead to this observed pattern: (i) gene flow between
populations for which recent connectivity could be
conceived given a temporal continuity of favourable
environmental conditions, and (ii) incomplete lineage
sorting caused by a rapid succession of divergence
events among populations, combined with large ances-
tral effective population sizes (Maddison 1997; Edwards
2009). The earliest, divergent lineage of alleles as well
as the highest genetic diversity was found in the WNP,
which lends support to the idea that P. arborea origi-
nated in this region.
The nuclear ITS2 showed signs of lower genetic
differentiation among populations than the mitochon-
drial locus. The effects of differing effective population
sizes on processes such as genetic drift and genetic
sweeps could explain this difference given that the mito-
chondrial genome has one quarter the effective popula-
tion size of the nuclear genome (given that it is haploid
and assuming maternal inheritance only). Similarly, the
nuclear gene tree had much lower resolution compared
Table 1 Global and pairwise FST values for the mitochondrial
(top) and nuclear ITS2 (bottom) markers among populations of
Paragorgia arborea
Mitochondrial
FST global 0.61
NA SP WNP ENP
NA
SP 0.27
WNP 0.67 0.39
ENP 0.98 0.67 0.74
Nuclear ITS2
FST global 0.39
NA SP WNP ENP SI
NA
SP 0.16
WNP 0.47 0.51
ENP 0.27 0.43 0.48
SI 0.13 0.31 0.24 0.26
NA, North Atlantic; SA, South Atlantic; SP, South Pacific;
WNP, western North Pacific; ENP, eastern North Pacific; SI,
South Indian Ocean; ITS2, internal transcribed spacer 2.
All values are significant (i.e. a = 0.05).
© 2012 Blackwell Publishing Ltd
10 S . HERRERA, T . M. SHANK and J . A . SANCHEZ
tiagohe
Highlight
to the mitochondrial one, which is likely due to the
smaller number of phylogenetically informative sites
present in the short ITS2 sequence.
In contrast to patterns observed in other deep-sea
organisms (Cho & Shank 2010; Etter et al. 2011; Miller
et al. 2011), depth does not appear to be an important
large-scale structuring factor in populations of
P. arborea. This is perhaps not surprising given the
widespread distribution of this organism, which sug-
gests that it is capable of living under a relatively broad
range of conditions. Alternatively, as mentioned above,
small-scale genetic structuring related to depth could be
revealed with higher-resolution markers.
The mitochondrial nad6 gene contained the greatest
amount diversity in terms of haplotypes in this data
set, that is, was the most variable mitochondrial marker.
This result contrasts with previous studies, in which the
mtMutS gene has been found to be significantly more
variable than any other mitochondrial gene region
(France & Hoover 2001; McFadden et al. 2004, 2010;
Herrera et al. 2010). We suggest that the levels of varia-
tion among different mitochondrial gene regions in
octocorals vary among taxa (see McFadden et al. 2010,
2011; Bilewitch & Degnan 2011), and thus, there is not a
single universal region that provides the largest amount
of variability. For the samples of P. arborea examined
here, we found that the combination of nad6 + 16S
+nad2 is the most informative. The nuclear ITS2 still
seems to be a good cost-effective alternative to detect
genetic variation among individuals, in the absence of
intragenomic variants.
Phylogeographic hypothesis
Here, we suggest a phylogeographic scenario in which
P. arborea originated in the North Pacific, possibly in
the WNP followed by colonization of the South Pacific
and spreading eastward around the Southern Hemi-
sphere in a stepping stone fashion (possibly via the
Antarctic Circumpolar Current). The colonization of the
North Atlantic seems to have occurred through a more
recent dispersal event from the South Pacific, via the
Central American Seaway, or from the SA. Similarities
between other deep-sea coral taxa from the South
Pacific and the North Atlantic have been independently
observed (Thoma et al. 2009; Pante & Watling 2012),
which gives support to the idea of a more recent
connection between South Pacific and North Atlantic
deep-sea communities. This scenario is an alternative to
the trans-Arctic interchange hypothesis (Vermeij 1991),
which suggests a recent North Pacific and North
Atlantic connection as indicated by the distributions of
several shallow-water taxa (e.g. red algae Vanoppen
et al. 1995; asteroids, bivalves, gastropods, barnacles
Wares & Cunningham 2001; seagrass Olsen et al. 2004;
cnidarians Govindarajan et al. 2005).
Paragorgia arborea shares a similar phylogeographic
history and genetic diversity patterns with the spiny
dogfish Squalus acanthias (Verissimo et al. 2010) and the
bryozoan Membranipora membranacea (Schwaninger
2008), both of which have modern antitropical distribu-
tions. The time of divergence between the WNP and
South Pacific populations of the spiny dogfish has been
estimated to be around 7.8 Myr BP and approximately
13.3 Myr BP (9.9–21.9) for the bryozoan, which is com-
parable to our estimates of 4.5 Myr BP (95% CI = 2.0–
8.3 using the coalescent model) and 8.1 Myr BP (95%
CI = 3.6–15.3 using the Yule model) for P. arborea
(Fig. 4, Figs S7 and S8, Supporting information). The
timing of colonization of the North Atlantic has been
estimated to be between 3.6 and 5.3 Myr BP for the
dogfish, 6.2 Myr BP (95% CI = 4.6–10.2) for the bryo-
zoan and between 1.7 Myr BP (95% CI = 0.4–3.6) and
4.0 Myr BP (95% CI = 1.3–8.3) for P. arborea. The similar
and independently estimated times for these events
give support to the idea that a common set of oceano-
graphic conditions in the Miocene and early Pliocene
lead to the current distributions of these species. The
latest Miocene ocean circulation models (Butzin et al.
2011) indicate that there was a dominant southward
horizontal flow that carried deep waters from the WNP
to the South Pacific, passing along the eastern side of
the New Zealand landmass, during the mid- to late
Miocene (~5–15 Myr BP). This flow decreased during
the late Miocene. The Antarctic Circumpolar Current
started to develop during the mid- to late Eocene (ca. 37
–40 Myr BP) (Scher 2006) and thus was already well
established as the dominant feature of ocean circulation
during the Miocene, transporting massive amounts of water
eastward. At the same time, during the mid-Miocene,
the deep-water formation in the North Atlantic and its
southward flow were absent or weak, likely due to the
dominant barotropic water flux from the Pacific to the
Atlantic. The formation of deep water in this time per-
iod mainly took place in the Southern Ocean. Deep-
water formation in the North Atlantic and the dominant
southward flow, as we know them today, were later
established during the late Miocene as the Central
American Seaway closed (Butzin et al. 2011). Evolution-
ary migrations inferred from genetic diversity patterns
presented here for P. arborea are consistent with this
history of ocean circulation. Historical changes in the
global patterns of ocean circulation and climate may
have caused shifts in the habitat and thus the distribu-
tion of P. arborea. Widespread ocean cooling during gla-
cial periods in the late Miocene–early Pliocene (Mercer
& Sutter 1982) and throughout the Quaternary (Ehlers
et al. 2011) could have aided the trans-equatorial
© 2012 Blackwell Publishing Ltd
PHYLOGEOGRAPHY OF DEEP-SEA CORAL PARAGORGIA ARBOREA 11
exchange by increasing the area of suitable habitat for
stepping stone populations towards the tropics (McIn-
tyre et al. 1989). Isolated relict low-latitude populations
might still exist. We hypothesize that the described set
of conditions could explain the current distribution
patterns of many other marine taxa (e.g. deep-sea coral
associates, such as ophiuroids and chirostylid crabs)
and thus might have played an important role shaping
extant deep-sea faunal diversity.
Acknowledgements
Support for this study was generously provided by a
mini-grant from the Global Census of Marine Life on
Seamounts Project (CenSeam) to J.A.S. and S.H., a grant from
the Facultad de Ciencias, Department of Biological Sciences of
the Universidad de los Andes to J.A.S, the National Systemat-
ics Laboratory of NOAA’s National Marine Fisheries Service,
a Smithsonian Graduate Student Fellowship to S.H., an award
from the Systematics Research Fund of the Systematics Associ-
ation and the Linnean Society of London to S.H., and a Grant-
in-Aid of Research from the Sigma Xi Research Society to S.H.
We are especially thankful to S.D. Cairns, A.G. Collins, C.L.
Agudelo, N. Ardila, L. Duenas, A. Ormos, J. Hunt, L. Weigt,
L. Monroy, M. Herrera and M. Sangrey for their generous
support, assistance and advise. Laboratory work was per-
formed at the Laboratories of Analytical Biology NMNH,
Smithsonian Institution and BIOMMAR, Universidad de los
Andes. Samples were generously provided by P. Alderslade
(CSIRO), A. Andouche (MNHN), A. Andrews (MLML), A.
Baco (FSU), A. Baldinger (MCZ), J. A. Boutillier (DFO), S.D.
Cairns (USNM), S. Davies (DFO), M. Eriksson (UUZM), Y.
Imahara (WPMNH), D. Janussen (SMF), E. Lazo-Wasem
(YPM), P. Lozouet (MNHN), L. Lundsten (MBARI), S. Mills
(NIWA), K. Schnabel (NIWA), and B. Stone (NOAA), D. Tra-
cey (NIWA), and R. Weber (Te Papa Tongarewa). We also
thank J. McDermott, N. Roterman and C. Munro for their
comments on earlier versions of the manuscript. We are grate-
ful for the helpful input from the editor and two anonymous
reviewers.
References
Avise JC, Ball RM (1990) Principles of genealogical concor-
dance in species concepts and biological taxonomy. Oxford
Surveys in Evolutionary Biology, 7, 45–67.Baum DA, Shaw KL (1995) Genealogical perspectives on the
species problem. In: Experimental and Molecular Approaches to
Plant Biosystematics (eds Hoch PC, Stephenson AG), pp. 289–
303. Missouri Botanical Gardens, St. Louis.
Bensasson D, Zhang D, Hartl D, Hewitt G (2001) Mitochondrial
pseudogenes: evolution’s misplaced witnesses. Trends in
Ecology & Evolution, 16, 314–321.
Bik HM, Sung W, De Ley P et al. (2012) Metagenetic commu-
nity analysis of microbial eukaryotes illuminates biogeo-
graphic patterns in deep-sea and shallow water sediments.
Molecular Ecology, 21, 1048–1059.
Bilewitch JP, Degnan SM (2011) A unique horizontal gene transfer
event has provided the octocoral mitochondrial genome with
an active mismatch repair gene that has potential for an unu-
sual self-contained function. BMC Evolutionary Biology, 11, 228.
Bisol PM, Costa R, Sibuet M (1984) Ecological and genetical
survey on two deep-sea holothurians: Benthogone rosea and
Benthodytes typical. Marine Ecology Progress Series, 15, 275–281.
Brinkmeyer R, Knittel K, Jurgens J, Weyland H, Amann R,
Helmke E (2003) Diversity and structure of bacterial commu-
nities in Arctic versus Antarctic pack ice. Applied Environmen-
tal Microbiology, 69, 6610–6619.
Brown SDJ, Collins RA, Boyer S et al. (2012) Spider: an R pack-
age for the analysis of species identity and evolution, with
particular reference to DNA barcoding. Molecular Ecology
Resources, 12, 562–565.
Bruntse G, Tendal OS (2000) Marine Biological Investigations
and Assemblages of Benthic Invertebrates from the Faroe
Islands. Kaldbak Marine Biological Laboratory, Faroe Islands.
Bryan TL, Metaxas A (2006) Distribution of deep-water coral
along the North American, continental margins: relationships
with environmental factors. Deep-Sea Research Part I Oceano-
graphic Research Papers, 53, 1865–1879.Bucklin A, Wilson RR Jr, Smith KL Jr (1987) Genetic differenti-
ation of seamount and basin populations of the deep-sea
amphipod Eurythenes gryllus. Deep Sea Research Part A. Ocean-
ographic Research Papers, 34, 1795–1810.Buhl-Mortensen L, Mortensen PB (2004) Crustaceans associated
with the deep-water gorgonian corals Paragorgia arborea (L.,
1758) and Primnoa resedaeformis (Gunn., 1763). Journal of Natu-
ral History, 38, 1233–1247.
Buhl-Mortensen L, Mortensen PB (2005) Distribution and
diversity of species associated with deep-sea gorgonian
corals off Atlantic Canada. In: Cold-Water Corals and Ecosys-
tems (eds Freiwald AR, Roberts JM), pp. 849–879. Springer-
Verlag, Berlin Heidelberg.
Buhl-Mortensen L, Vanreusel A, Gooday AJ et al. (2010) Biolog-
ical structures as a source of habitat heterogeneity and biodi-
versity on the deep ocean margins. Marine Ecology, 31, 21–50.
Butzin M, Lohmann G, Bickert T (2011) Miocene ocean circula-
tion inferred from marine carbon cycle modeling combined
with benthic isotope records. Paleoceanography, 26, PA1203.
Cairns S (2007) Deep-water corals: an overview with special
reference to diversity and distribution of deep-water sclerac-
tinian corals. Bulletin of Marine Science, 81, 311–322.
Cho W, Shank TM (2010) Incongruent patterns of genetic con-
nectivity among four ophiuroid species with differing coral
host specificity on North Atlantic seamounts. Marine Ecology,
31, 121–143.
Coffroth MA, Lasker HR, Diamond ME, Bruenn JA, Berming-
ham E (1992) DNA fingerprints of a gorgonian coral: a
method for detecting clonal structure in a vegetative species.
Marine Biology, 114, 317–325.
Coleman AW (2007) Pan-eukaryote ITS2 homologies revealed by
RNA secondary structure.Nucleic Acids Research, 35, 3322–3329.
Coleman AW (2009) Is there a molecular key to the level of
“biological species” in eukaryotes? A DNA guide. Molecular
Phylogenetics and Evolution, 50, 197–203.Cordes EE, Nybakken JW, VanDykhuizen G (2001) Reproduc-
tion and growth of Anthomastus ritteri (Octocorallia: Alcyona-
cea) from Monterey Bay, California, USA. Marine Biology,
138, 491–501.Costello M, McCrea M, Freiwald A et al. (2005) Role of cold-
water Lophelia pertusa coral reefs as fish habitat in the NE
© 2012 Blackwell Publishing Ltd
12 S . HERRERA, T . M. SHANK and J . A . SANCHEZ
Atlantic. In: Cold-Water Corals and Ecosystems (eds Freiwald A,
Roberts JM), pp. 771–805. Springer, Berlin Heidelberg.
Darling KF, Wade CM, Stewart IA, Kroon D, Dingle R, Brown
AJL (2000) Molecular evidence for genetic mixing of Arctic
and Antarctic subpolar populations of planktonic foramini-
fers. Nature, 405, 43–47.De Queiroz K (2007) Species concepts and species delimitation.
Systematic Biology, 56, 879–886.D’Onghia G, Indennidate A, Giove A et al. (2011) Distribution
and behaviour of deep-sea benthopelagic fauna observed
using towed cameras in the Santa Maria di Leuca cold-water
coral province. Marine Ecology Progress Series, 443, 95–110.Drummond AJ, Ho SYW, Rawlence N, Rambaut A (2007) A
rough guide to BEAST 1.4.
Drummond A, Ashton B, Buxton S et al. (2010) Geneious v5.3.
Available from http://www.geneious.com.
Drummond AJ, Suchard MA, Xie D, Rambaut A (2012) Bayes-
ian phylogenetics with BEAUti and the BEAST 1.7. Molecular
Biology and Evolution, 29, 1969–1973.
Duda TFJ, Kohn AJ, Matheny AM (2009) Cryptic species differ-
entiated in Conus ebraeus, a widespread tropical marine
gastropod. The Biological Bulletin, 217, 292–305.Edwards SV (2009) Is a new and general theory of molecular
systematics emerging? Evolution, 63, 1–19.Ehlers J, Gibbard PL, Hughes PD (2011) Quaternary Glaciations –
Extent and Chronology: A Closer Look. Elsevier, Amsterdam.
Etnoyer P, Morgan LE (2007) Predictive habitat model for deep
gorgonians needs better resolution: comment on Bryan &
Metaxas (2007). Marine Ecology Progress Series, 339, 311–312.Etter RJ, Boyle EE, Glazier A, Jennings RM, Dutra E, Chase
MR (2011) Phylogeography of a pan-Atlantic abyssal proto-
branch bivalve: implications for evolution in the Deep Atlan-
tic. Molecular Ecology, 20, 829–843.Excoffier L, Lischer HEL (2010) Arlequin suite ver 3.5: a new
series of programs to perform population genetics analyses
under Linux and Windows. Molecular Ecology Resources, 10,
564–567.France SC, Hoover LL (2001) Analysis of variation in mito-
chondrial DNA sequences (ND3, ND4L, MSH) among
Octocorallia (=Alcyonaria) (Cnidaria: Anthozoa). Bulletin of
the Biological Society of Washington, 10, 110–118.France SC, Kocher TD (1996) Geographic and bathymetric patterns
of mitochondrial 16S rRNA sequence divergence among deep-sea
amphipods, Eurythenes gryllus.Marine Biology, 126, 633–643.
Fu Y (1997) Statistical tests of neutrality of mutations against
population growth, hitchhiking and background selection.
Genetics, 147, 915–925.Gernhard T (2008) The conditioned reconstructed process. Jour-
nal of Theoretical Biology, 253, 769–778.Giribet G, Wheeler WC (1999) On gaps. Molecular Phylogenetics
and Evolution, 13, 132–143.Goffredi S, Hurtado L, Hallam S, Vrijenhoek R (2003) Evolu-
tionary relationships of deep-sea vent and cold seep clams
(Mollusca: Vesicomyidae) of the “pacifica/lepta” species com-
plex. Marine Biology, 142, 311–320.Gotelli NJ, Colwell RK (2001) Quantifying biodiversity: proce-
dures and pitfalls in the measurement and comparison of
species richness. Ecology Letters, 4, 379–391.
Govindarajan AF, Halanych KM, Cunningham CW (2005) Mito-
chondrial evolution and phylogeography in the hydrozoan
Obelia geniculata (Cnidaria).Marine Biology, 146, 213–222.
Grasshoff M (1979) Zur bipolaren verbreitung der Oktokoralle
Paragorgia arborea (Cnidaria: Anthozoa: Scleraxonia). Sencken-
bergiana maritima, 11, 115–137.
Gutierrez-Rodriguez C, Barbeitos MS, Sanchez JA, Lasker HR
(2009) Phylogeography and morphological variation of the
branching octocoral Pseudopterogorgia elisabethae. Molecular
Phylogenetics and Evolution, 50, 1–15.
Herrera S, Baco A, Sanchez JA (2010) Molecular systematics of
the bubblegum coral genera (Paragorgiidae, Octocorallia)
and description of a new deep-sea species. Molecular Phyloge-
netics and Evolution, 55, 123–135.
Hibberd T, Moore K (2009) Field identification guide to Heard
Island and McDonald Islands benthic invertebrates: a guide
for scientific observers aboard fishing vessels. The Depart-
ment of Environment, Water, Heritage and the Arts, Austra-
lian Antarctic Division and the Fisheries Research and
Development Corporation.
Howell KL, Rogers AD, Tyler PA, Billett DSM (2004) Repro-
ductive isolation among morphotypes of the Atlantic seastar
species Zoroaster fulgens (Asteroidea: Echinodermata). Marine
Biology, 144, 977–984.
Huelsenbeck JP, Ronquist F (2001) MRBAYES: Bayesian infer-
ence of phylogenetic trees. Bioinformatics (Oxford), 17, 754–755.
Johnson S, Waren A, Vrijenhoek R (2008) DNA barcoding of
Lepetodrilus limpets reveals cryptic species. Journal of Shellfish
Research, 27, 43–51.Katoh K, Misawa K, Kuma K, Miyata T (2002) MAFFT: a novel
method for rapid multiple sequence alignment based on fast
Fourier transform. Nucleic Acids Research, 30, 3059–3066.Kingman JFC (1982) The coalescent. Stochastic Processes and their
Applications, 13, 235–248.Laptikhovsky V (2011) Migrations and structure of the species
range in ridge-scaled rattail Macrourus carinatus (Southwest
Atlantic) and their application to fisheries management. ICES
Journal of Marine Science: Journal du Conseil, 68, 309–318.Le Goff-Vitry MC, Pybus OG, Rogers AD (2004) Genetic struc-
ture of the deep-sea coral Lophelia pertusa in the northeast
Atlantic revealed by microsatellites and internal transcribed
spacer sequences. Molecular Ecology, 13, 537–549.Leal MC, Puga J, Serodio J, Gomes NCM, Calado R (2012)
Trends in the discovery of new marine natural products
from invertebrates over the last two decades – where and
what are we bioprospecting? PLoS ONE, 7, e30580.
Lecroq B, Gooday AJ, Pawlowski J (2009) Global genetic homo-
geneity in the deep-sea foraminiferan Epistominella exigua
(Rotaliida: Pseudoparrellidae). Zootaxa, 2096, 23–32.
Lemey P, Rambaut A, Drummond AJ, Suchard MA (2009)
Bayesian phylogeography finds its roots. Plos Computational
Biology, 5, e1000520.
Librado P, Rozas J (2009) DnaSP v5: a software for comprehensive
analysis of DNApolymorphism data. Bioinformatics, 25, 1451–1452.Lopez JV, Yuhki N, Masuda R, Modi W, O’Brien SJ (1994)
Numt, a recent transfer and tandem amplification of mito-
chondrial DNA to the nuclear genome of the domestic cat.
Journal of Molecular Evolution, 39, 174–190.Maddison WP (1997) Gene trees in species trees. Systematic
Biology, 46, 523–536.Marshall DC, Simon C, Buckley TR (2006) Accurate branch
lengths estimation in partitioned Bayesian analyses requires
accommodation of among-partition rate variation and atten-
tion to branch length priors. Systematic Biology, 55, 993–1003.
© 2012 Blackwell Publishing Ltd
PHYLOGEOGRAPHY OF DEEP-SEA CORAL PARAGORGIA ARBOREA 13
McClain C, Mincks SL (2010) The dynamics of biogeographic
ranges in the deep sea. Proceedings of the Royal Society of Lon-
don Series B, Biological Sciences, 277, 3533–3546.
McFadden CS, Hutchinson MB (2004) Molecular evidence for the
hybrid origin of species in the soft coral genus Alcyonium (Cnida-
ria: Anthozoa: Octocorallia).Molecular Ecology, 13, 1495–1505.McFadden CS, Donahue R, Hadland BK, Weston R (2001) A
molecular phylogenetic analysis of reproductive trait evolu-
tion in the soft coral genus Alcyonium. Evolution, 55, 54–67.
McFadden CS, Tullis ID, Breton Hutchinson M, Winner K,
Sohm JA (2004) Variation in coding (NADH dehydrogenase
subunits 2, 3, and 6) and noncoding intergenic spacer
regions of the mitochondrial genome in Octocorallia (Cnida-
ria: Anthozoa). Marine Biotechnology, 6, 516–526.McFadden CS, Sanchez JA, France SC (2010) Molecular phylo-
genetic insights into the evolution of Octocorallia: a review.
Integrative and Comparative Biology, 50, 389–410.
McFadden CS, Benayahu Y, Pante E, Thoma JN, Nevarez PA,
France SC (2011) Limitations of mitochondrial gene barcod-
ing in Octocorallia. Molecular Ecology Resources, 11, 19–31.McIntyre A, Ruddiman WF, Karlin K, Mix AC (1989) Surface
water response of the equatorial Atlantic Ocean to orbital
forcing. Paleoceanography, 4, 19–55.
Mercer JH, Sutter JF (1982) Late miocene-earliest pliocene glaciation
in southern Argentina: implications for global ice-sheet history.
Palaeogeography, Palaeoclimatology, Palaeoecology, 38, 185–206.Metaxas A, Davis J (2005) Megafauna associated with assem-
blages of deep-water gorgonian corals in Northeast Channel,
off Nova Scotia, Canada. Journal of the Marine Biological Asso-
ciation of the United Kingdom, 85, 1381–1390.
Miller KJ, Rowden AA, Williams A, Haussermann V (2011)
Out of their depth? Isolated deep populations of the cosmo-
politan coral Desmophyllum dianthus may be highly vulner-
able to environmental change. PLoS ONE, 6, e19004.
Monaghan MT, Wild R, Elliot M et al. (2009) Accelerated spe-
cies inventory on Madagascar using coalescent-based models
of species delineation. Systematic Biology, 58, 298–311.Morrison CL, Ross SW, Nizinski MS et al. (2011) Genetic dis-
continuity among regional populations of Lophelia pertusa in
the North Atlantic Ocean. Conservation Genetics, 12, 713–729.
Mortensen PB, Buhl-Mortensen L (2004) Distribution of deep-
water gorgonian corals in relation to benthic habitat features
in the Northeast Channel (Atlantic Canada). Marine Biology,
144, 1223–1238.
Mortensen PB, Buhl-Mortensen L, Gebruk AV, Krylova EM
(2008) Occurrence of deep-water corals on the Mid-Atlantic
Ridge based on MAR-ECO data. Deep Sea Research Part II:
Topical Studies in Oceanography, 55, 142–152.
Muller T, Philippi N, Dandekar T, Schultz J, Wolf M (2007)
Distinguishing species. RNA, 13, 1469–1472.
Nylander JA, Wilgenbusch JC, Warren DL, Swofford DL (2008)
AWTY (are we there yet?): a system for graphical explora-
tion of MCMC convergence in Bayesian phylogenetics. Bioin-
formatics (Oxford), 24, 581–583.
van Ofwegen LP, Groenenberg DSJ (2007) A centuries old
problem in nephtheid taxonomy approached using DNA
data (Coelenterata: Alcyonacea). Contributions to Zoology, 76,
153–178.
Olsen JL, Stam WT, Coyer JA et al. (2004) North Atlantic phy-
logeography and large-scale population differentiation of the
seagrass Zostera marina L. Molecular Ecology, 13, 1923–1941.
Pante E, Watling L (2012) Chrysogorgia from the New England
and Corner Seamounts: Atlantic-Pacific connections. Journal
of the Marine Biological Association of the United Kingdom, 92,
911–927.Pawlowski J, Fahrni J, Lecroq B et al. (2007) Bipolar gene flow in
deep-sea benthic foraminifera.Molecular Ecology, 16, 4089–4096.Pons J, Barraclough TG, Gomez-Zurita J et al. (2006) Sequence-
based species delimitation for the DNA taxonomy of
undescribed insects. Systematic Biology, 55, 595–609.
Pont-Kindon G, Vassort CG, Rahul W, Okimoto R, Beagley T,
Wolstenholme DR (2000) Mitochondrial DNA of Hydra attenu-
ata (Cnidaria): a sequence that includes an end of one linear
molecule and the genes for l-rRNA, tRNA f-Met, tRNATrp,
COII, and ATPase8. Journal of Molecular Evolution, 51, 404–415.Rambaut A, Drummond AJ (2007) Tracer v1.4. Available from
http://beast.bio.ed.ac.uk/Tracer.
Ramirez-Llodra E, Tyler PA, Baker MC et al. (2011) Man and
the last great wilderness: human impact on the deep sea.
PLoS ONE, 6, e22588.
Raupach MJ, Malyutina M, Brandt A, Wagele J-W (2007) Molec-
ular data reveal a highly diverse species flock within the mun-
nopsoid deep-sea isopod Betamorpha fusiformis (Barnard, 1920)
(Crustacea: Isopoda: Asellota) in the Southern Ocean. Deep Sea
Research Part II: Topical Studies in Oceanography, 54, 1820–1830.Roark EB, Guilderson TP, Dunbar RB, Fallon SJ, Mucciarone
DA (2009) Extreme longevity in proteinaceous deep-sea cor-
als. Proceedings of the National Academy of Sciences of the United
States of America, 106, 5204–5208.
Roberts JM, Henry LA, Long D, Hartley JP (2008) Cold-water
coral reef frameworks, megafaunal communities and evi-
dence for coral carbonate mounds on the Hatton Bank, north
east Atlantic. Facies, 54, 297–316.
Roberts JM, Wheeler A, Freiwald AR, Cairns SD (2009) Cold-
Water Corals: The Biology and Geology of Deep-Sea Coral
Habitats. Cambridge University Press, Cambridge.
Ronquist F, Huelsenbeck JP (2003) MrBayes 3: Bayesian phylo-
genetic inference under mixed models. Bioinformatics
(Oxford), 19, 1572–1574.
Ruhl MW, Wolf M, Jenkins TM (2010) Compensatory base
changes illuminate morphologically difficult taxonomy.
Molecular Phylogenetics and Evolution, 54, 664–669.Sanchez JA (2005) Systematics of the bubblegum corals (Cnidaria:
Octocorallia: Paragorgiidae) with description of new species
fromNew Zealand and the Eastern Pacific. Zootaxa, 1014, 1–72.
Sanchez JA, Aguilar C, Dorado D, Manrique N (2007) Pheno-
typic plasticity and morphological integration in a marine
modular invertebrate. BMC Evolutionary Biology, 7, 9.
Sarmiento JL, Gruber N (2006) Ocean Biogeochemical Dynam-
ics. Princeton University Press, Princeton, New Jersey.
Scher HD (2006) Timing and climatic consequences of the
opening of Drake Passage. Science, 312, 428–430.Schlagintweit F, Gawlick HJ (2009) The incertae sedis Carpatho-
porella Dragastan, 1995, from the Lower Cretaceous of Alba-
nia: skeletal elements (sclerites, internodes/branches,
holdfasts) of colonial octocorals. Facies, 55, 553–573.Schwaninger HR (2008) Global mitochondrial DNA phylogeog-
raphy and biogeographic history of the antitropically and
longitudinally disjunct marine bryozoan Membranipora mem-
branacea L. (Cheilostomata): another cryptic marine sibling
species complex? Molecular Phylogenetics and Evolution, 49,
893–908.
© 2012 Blackwell Publishing Ltd
14 S . HERRERA, T . M. SHANK and J . A . SANCHEZ
Seibel PN, Muller T, Dandekar T, Schultz J, Wolf M (2006)
4SALE–a tool for synchronous RNA sequence and secondary
structure alignment and editing. BMC Bioinformatics, 7, 498.
Shank T (2010) Seamounts deep-ocean laboratories of faunal con-
nectivity, evolution, and endemism. Oceanography, 23, 108–122.
Smith P, McVeagh S, Mingoia J, France S (2004) Mitochondrial
DNA sequence variation in deep-sea bamboo coral (Keratoi-
sidinae) species in the southwest and northwest Pacific
Ocean. Marine Biology, 144, 253–261.
Soeffker M, Sloman KA, Hall-Spencer JM (2011) In situ obser-
vations of fish associated with coral reefs off Ireland. Deep
Sea Research Part I: Oceanographic Research Papers, 58, 818–825.Sun Z, Hamel JF, Mercier A (2010) Planulation periodicity, settle-
ment preferences and growth of two deep-sea octocorals from
the northwest Atlantic.Marine Ecology Progress Series, 410, 71–87.
Swofford DL (2002) PAUP*. Phylogenetic Analysis Using Parsi-
mony (*and Other Methods). Version 4. Sinauer Associates,
Sunderland, Massachusetts.
Tajima F (1983) Evolutionary relationship of DNA sequences in
finite populations. Genetics, 105, 437–460.Tajima F (1989) Statistical method for testing the neutral mutation
hypothesis by DNA polymorphism. Genetics, 123, 585–595.Tendal OS (1992) The North Atlantic distribution of the octocoral
P. arborea (L., 1758) (Cnidaria, Anthozoa). Sarsia, 77, 213–217.Thoma J, Pante E, BruglerM, France S (2009) Deep-sea octocorals and
antipatharians show no evidence of seamount-scale endemism in
theNWAtlantic.Marine Ecology Progress Series, 397, 25–35.
Vanoppen MJH, Draisma SGA, Olsen JL, Stam WT (1995) Multiple
trans-arctic passages in the red alga Phycodrys rubens: evidence
from nuclear rDNA ITS sequences.Marine Biology, 123, 179–188.
Verissimo A, McDowell JR, Graves JE (2010) Global population
structure of the spiny dogfish Squalus acanthias, a temperate shark
with an antitropical distribution.Molecular Ecology, 19, 1651–1662.Vermeij GJ (1991) Anatomy of an invasion – the trans-Arctic
interchange. Paleobiology, 17, 281–307.Vrijenhoek RC (2009) Cryptic species, phenotypic plasticity,
and complex life histories: assessing deep-sea faunal diver-
sity with molecular markers. Deep-Sea Research Part II, Topical
studies in oceanography, 56, 1713–1723.Wareham VE, Edinger EN (2007) Distribution of deep-sea cor-
als in the Newfoundland and Labrador region, Northwest
Atlantic Ocean. Bulletin of Marine Science, 81, 289–313.
Wares JP, Cunningham CW (2001) Phylogeography and historical
ecology of the North Atlantic intertidal. Evolution, 55, 2455–2469.
Watanabe S, Metaxas A, Sameoto J, Lawton P (2009) Patterns in
abundance and size of two deep-water gorgonian octocorals, in
relation to depth and substrate features off Nova Scotia. Deep-Sea
Research Part I Oceanographic Research Papers, 56, 2235–2248.
Won Y, Young CR, Lutz RA, Vrijenhoek RC (2003) Dispersal
barriers and isolation among deep-sea mussel populations
(Mytilidae: Bathymodiolus) from eastern Pacific hydrothermal
vents. Molecular Ecology, 12, 169–184.
Yule GA (1925) A mathematical theory of evolution, based on the
conclusions of Dr. J.C. Willis. Philosophical Transactions of the
Royal Society of London Series B, Biological Sciences, 213, 21–87.
S.H. and J.A.S. conceived and designed the study. S.H. per-
formed the research, analysed the data and wrote the article
with contributions from T.M.S. and J.A.S.
Data accessibility
Sample information and locations are provided as
supporting information in Table S1 (Supporting infor-
mation).
DNA sequences are available in GenBank and acces-
sion numbers appear in Table S1 (Supporting informa-
tion).
DNA sequence alignments are available in DRYAD
doi:10.5061/dryad.ns23j.
Supporting information
Additional Supporting Information may be found in the online ver-
sion of this article.
Appendix S1 Sequencing of old samples.
Table S1 Collection and sequence information for the speci-
mens used in this study.
Table S2 Nucleotide substitution models for mitochondrial
gene partitions, as selected by the AIC criterion in JMODELTEST.
Table S3 Interspecific and intraspecific (i.e. coalescent depths)
uncorrected pairwise distances (%) among haplotypes of spe-
cies of Paragorgia and Sibogagorgia.
Fig. S1 Sampling location of specimens of Paragorgia arborea
examined in this study.
Fig. S2 Depth distribution of samples shown in Fig. S1 (Sup-
porting information).
Fig. S3 The revised geographic distribution of Paragorgia arbo-
rea.
Fig. S4 Depth distribution of records shown in Fig. S3 (Sup-
porting information).
Fig. S5 Predicted ITS2 secondary structure of Paragorgia arbo-
rea.
Fig. S6 Individual mitochondrial gene tree hypotheses in Para-
gorgia.
Fig. S7 Fit of the GMYC single-threshold model to the mito-
chondrial time-calibrated gene tree generated with the Yule
model tree prior.
Fig. S8 Fit of the GMYC single-threshold model to the mito-
chondrial time-calibrated gene tree generated with the coales-
cent model tree prior.
Fig. S9 Haplotype accumulation curves in Paragorgia arborea.
© 2012 Blackwell Publishing Ltd
PHYLOGEOGRAPHY OF DEEP-SEA CORAL PARAGORGIA ARBOREA 15
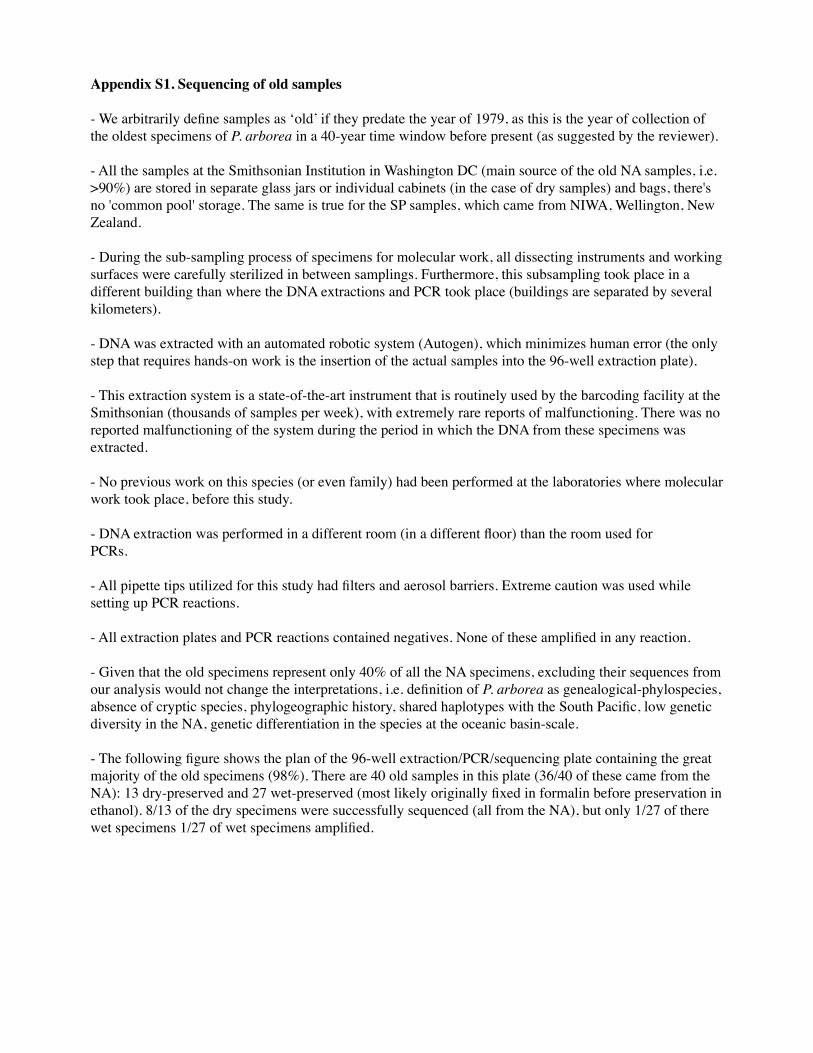
Appendix S1. Sequencing of old samples
- We arbitrarily define samples as ‘old’ if they predate the year of 1979, as this is the year of collection of the oldest specimens of P. arborea in a 40-year time window before present (as suggested by the reviewer).
- All the samples at the Smithsonian Institution in Washington DC (main source of the old NA samples, i.e. >90%) are stored in separate glass jars or individual cabinets (in the case of dry samples) and bags, there's no 'common pool' storage. The same is true for the SP samples, which came from NIWA, Wellington, New Zealand.
- During the sub-sampling process of specimens for molecular work, all dissecting instruments and working surfaces were carefully sterilized in between samplings. Furthermore, this subsampling took place in a different building than where the DNA extractions and PCR took place (buildings are separated by several kilometers).
- DNA was extracted with an automated robotic system (Autogen), which minimizes human error (the only step that requires hands-on work is the insertion of the actual samples into the 96-well extraction plate).
- This extraction system is a state-of-the-art instrument that is routinely used by the barcoding facility at the Smithsonian (thousands of samples per week), with extremely rare reports of malfunctioning. There was no reported malfunctioning of the system during the period in which the DNA from these specimens was extracted.
- No previous work on this species (or even family) had been performed at the laboratories where molecular work took place, before this study.
- DNA extraction was performed in a different room (in a different floor) than the room used forPCRs.
- All pipette tips utilized for this study had filters and aerosol barriers. Extreme caution was used while setting up PCR reactions.
- All extraction plates and PCR reactions contained negatives. None of these amplified in any reaction.
- Given that the old specimens represent only 40% of all the NA specimens, excluding their sequences from our analysis would not change the interpretations, i.e. definition of P. arborea as genealogical-phylospecies, absence of cryptic species, phylogeographic history, shared haplotypes with the South Pacific, low genetic diversity in the NA, genetic differentiation in the species at the oceanic basin-scale.
- The following figure shows the plan of the 96-well extraction/PCR/sequencing plate containing the great majority of the old specimens (98%). There are 40 old samples in this plate (36/40 of these came from the NA): 13 dry-preserved and 27 wet-preserved (most likely originally fixed in formalin before preservation in ethanol). 8/13 of the dry specimens were successfully sequenced (all from the NA), but only 1/27 of there wet specimens 1/27 of wet specimens amplified.

1 2 3 4 5 6 7 8 9 10 11 12
AParborea98080
Parborea4569
Parborea30238
Parborea80937
Parboreap17265
Ppacifica52432
Parborea100817
Parboreap30241
Parborea3310
Parborea28123
Parborea28160
ParboreaSMF4588
BParborea1016643
Parborea17264
Parborea17262
Parborea100818
Parborea4911
Parborea15874
Parborea80828
Parborea1092764
Parborea3311
Parborea28154
Parborea28392
ParboreaSMF4605
CParborea4089
Parborea4910
Parborea100843
Parborea1002420
Parborea54497
Parborea30239
Parborea1011360
Parborea4242
Palisonae3312
Parborea28155
Parborea28422
ParboreaSMF4600
DParborea5116
ParboreaNew568
ParboreaNew100
Parborea1092765
Parborea100846
Parborea17260
Parborea80838
Parborea4091
Parborea17969
Parborea28156
Parborea28423
ParboreaSMF9554
EParborea16937
ParboreaNew545
Parborea80936
Parborea1010787
Parborea33559
Parborea1011097
Parborea1011098
Parborea21855
Palisonae3312
Parborea28157
Parborea28425
ParboreaSMF9559
FParborea33733
Parborea1092766
Parborea1011079
Parboreap33560
Parborea1011014
Parborea50890
Parborea30240
Parborea1011360
Palisonae3313
Parborea28158
ParboreaZ11166
PcfarboreJapan
GParborea100758
Parborea17263
Parborea33562
Parborea17261
Parborea15880
Parborea54298
Parborea33561
Parborea3308
Parborea17970
Parborea28159
ParboreaZC0706
PcfarboreJapan
HParboreap5107
Parborea4238
Parboreap17266
Parboreap4573
Parboreap4143
Parborea50028
Parborea4599
Parborea3309
Parborea25527
Parborea28161
ParboreaSMF1246
Blank
Figure showing the plan of the 96-well plate configuration used to extract, amplify and sequence 98% of the old specimens. TOP shows the distribution of old samples in the plate (underlined names with colored backgrounds). Blue background indicates that the specimen was wet-preserved and red indicates that the specimen was dry-preserved. BOTTOM shows the distribution of all sequenced samples in the plate. Colored backgrounds indicate the mitochondrial haplotype of the specimens of Paragorgia arborea (as in figures 1, 3 and 5 and table S1 of the manuscript): Orange for haplotype m15, light blue for haplotype m3, light green for haplotype m14, light orange for haplotype m16, aquamarine for haplotype m2, violet for haplotype m4, dark green for haplotype m12, brown for haplotype m5, fuchsia for haplotype m13, yellow-green for haplotype m10, yellow for haplotype m11, and pink for haplotype m6. Cells with white background and black font indicate non-NA specimens of Paragorgia cf. arborea that did not amplify. Cells with white background and maroon font indicate modern samples (post-1979) from other species that were sequenced for all genes. Cells with white font indicate NA specimens of Paragorgia cf. arborea, and those underlined indicate old specimens. Cells with black background indicate old NA specimens that did not sequence.
- The ‘old’ specimens (predating 1979) from the NA that were successfully sequenced represented 3 mitochondrial haplotypes:
m15 (orange)Globally 28 individuals had this haplotype. 9 from the South Pacific (SP) and 19 from the North Atlantic (NA). All the old samples (collected before 1979) with this haplotype were collected in the NA, and add up to 7 specimens (37% of the total m15 NA samples).
m12 (dark green)Globally 10 individuals had this haplotype. 9 from NZ and 1 from the NA, the later is an old sample.
m16 (light orange)
This is a unique haplotype from an old NA sample (therefore no contamination is possible in this case).
- This plate also contained modern samples from P. arborea specimens representing 12 mt haplotypes, plus representatives from at least 5 other species.
- It is thus extremely unlikely that if contamination occurred it was restricted to 2 particular haplotypes, and that it was strongly biased towards dry specimens from the NA
- We are aware of two publications that have successfully sequenced old octocoral specimens:
- The Aguilar and Sanchez 2008 Bull Mar Sci paper has an ITS2 sequences from the octocoral Calyptrophora japonica collected in 1900s from the USNM collection.
- The Aguilar and Sanchez 2007 MPE has several octocoral specimens collected from the Atlantide expedition 1945-1946. Their ITS2 sequences and RNA secondary structures are unique compared to any other octocoral.
In conclusion, all these lines of evidence strongly indicate that our sequences from old specimens are legitimate and are not products of contamination. It is plausible that DNA in old specimens of Paragorgia can be still viable for the sequencing of mitochondrial and nuclear ribosomal DNA if the tissue material is fixed and preserved correctly. Wet specimens were traditional fixed in formalin, which is well known to damage DNA, thus these are mostly unusable for genetic purposes. Dry preservation of specimens of Paragorgia and other octocorals is an acceptable, although not ideal, way to preserve mitochondrial and nuclear ribosomal DNA.
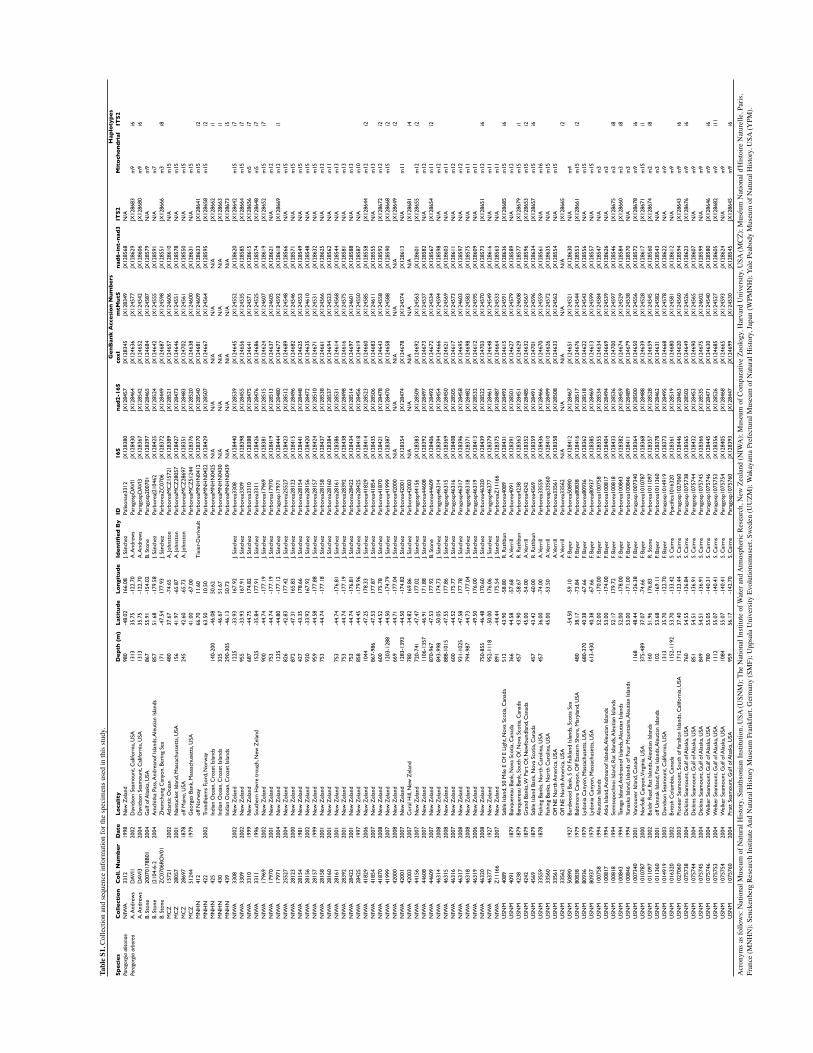
Sp
eci
es
Co
lle
ctio
nC
oll
. Nu
mb
er
Dat
eL
oca
lity
De
pth
(m
)L
atit
ud
eL
on
gitu
de
Ide
nti
fie
d B
yID
16
Sn
ad2
-16
Sco
xI
mtM
utS
nad
6-i
nt-
nad
3IT
S2
Mit
och
on
dri
alIT
S2
Para
gorg
ia a
lison
aeN
IWA
3312
1998
New
Zel
and
980
-48.
0216
6.08
J. Sá
nche
zPa
lison
ae33
12JX
1283
80JX
1284
57JX
1283
45JX
1283
49JX
1285
68N
/APa
rago
rgia
arb
orea
A. A
ndre
ws
DA
VI1
2002
Dav
idso
n Se
amou
nt, C
alifo
rnia
, USA
1313
35.7
5-1
22.7
0A
. And
rew
sPa
rago
spD
AV
I1JX
1284
30JX
1284
64JX
1246
36JX
1245
77JX
1286
29JX
1286
83m
9i6
A. A
ndre
ws
DA
VI3
2004
Dav
idso
n Se
amou
nt, C
alifo
rnia
, USA
1313
35.7
5-1
22.7
0A
. And
rew
sPa
rago
spD
AV
I3JX
1283
67JX
1285
42JX
1246
52JX
1245
42JX
1286
06JX
1286
80m
9i6
B. S
tone
2007
0178
B01
2004
Gul
f of A
lask
a, U
SA86
755
.91
-154
.02
B. S
tone
Para
gosp
2007
01JX
1283
97JX
1284
65JX
1246
84JX
1245
87JX
1285
79N
/Am
9B.
Sto
neJ2
104-
6-2
2004
Am
chitk
a Pa
ss, A
ndre
anof
Isla
nds,
Ale
utia
n Is
land
s85
751
.68
-179
.58
J. Sá
nche
zPa
rbor
eaJ2
1046
2JX
1284
25JX
1285
24JX
1246
42JX
1245
55JX
1285
91N
/Am
7B.
Sto
neZ
C07
06RO
V01
Zhe
mch
ung
Can
yon,
Ber
ing
Sea
171
-47.
5417
7.93
J. Sá
nche
zPa
rbor
eaZ
C07
06JX
1283
72JX
1284
49JX
1246
87JX
1245
98JX
1285
51JX
1286
66m
3i8
MC
Z15
721
2002
Atla
ntic
Oce
an48
037
.67
-74.
65A
. Joh
nsto
nPa
rbor
eaM
CZ
1572
1JX
1283
89JX
1285
21JX
1246
57JX
1246
06JX
1286
10N
/Am
15M
CZ
2805
720
01N
antu
cket
Isla
nd, M
assa
chus
sett
s, U
SA15
641
.97
-65.
87A
. Joh
nsto
nPa
rbor
eaM
CZ
2805
7JX
1284
27JX
1284
73JX
1246
46JX
1245
51JX
1285
78N
/Am
15M
CZ
2869
718
78of
f Mai
ne, U
SA24
542
.60
-65.
73A
. Joh
nsto
nPa
rbor
eaM
CZ
2869
7JX
1283
51JX
1284
83JX
1247
02JX
1245
61JX
1285
50N
/Am
15M
CZ
5124
419
79G
eorg
es B
ank,
Mas
sach
uset
ts, U
SA41
.00
-67.
00Pa
rbor
eaM
CZ
5124
4JX
1283
76JX
1285
20JX
1246
38JX
1246
00JX
1286
31N
/Am
15M
NH
N41
2of
f Nor
way
66.7
011
.60
Tix
ier-
Dur
ivau
ltPa
rbor
eaM
NH
N04
12JX
1283
70JX
1285
40JX
1246
81JX
1246
09JX
1286
33JX
1286
41m
15i2
MN
HN
422
2002
Tron
dhje
ms
Fjor
d, N
orw
ay63
.50
10.5
0Pa
rbor
eaM
NH
N04
22JX
1284
29JX
1285
07JX
1246
67JX
1245
64JX
1285
95JX
1286
58m
15i2
MN
HN
425
Indi
an O
cean
, Cro
zet
Isla
nds
140-
200
-46.
0850
.62
Parb
orea
MN
HN
0425
N/A
N/A
N/A
N/A
N/A
JX12
8662
i1M
NH
N43
0In
dian
Oce
an, C
roze
t Is
land
s32
5-4
6.67
51.6
7Pa
rbor
eaM
NH
N04
30N
/AN
/AN
/AN
/AN
/AJX
1286
63i1
MN
HN
439
Indi
an O
cean
, Cro
zet
Isla
nds
290-
305
-46.
1350
.73
Parb
orea
MN
HN
0439
N/A
N/A
N/A
N/A
N/A
JX12
8673
i5N
IWA
3308
2002
New
Zel
and
1225
-33.
9316
7.92
J. Sá
nche
zPa
rbor
ea33
08JX
1284
40JX
1285
39JX
1246
45JX
1245
52JX
1286
20JX
1286
42m
15i7
NIW
A33
0920
02N
ew Z
elan
d95
5-3
3.93
167.
91J.
Sánc
hez
Parb
orea
3309
JX12
8398
JX12
8455
JX12
4656
JX12
4535
JX12
8585
JX12
8664
m15
i7N
IWA
3310
1999
New
Zel
and
687
-44.
7517
4.82
J. Sá
nche
zPa
rbor
ea33
10JX
1283
88JX
1284
75JX
1246
41JX
1245
71JX
1286
15JX
1286
56m
5i7
NIW
A33
1119
96So
uthe
rn H
avre
tro
ugh,
New
Zel
and
1525
-35.
8417
7.91
J. Sá
nche
zPa
rbor
ea33
11JX
1284
26JX
1284
76JX
1246
86JX
1245
25JX
1285
74JX
1286
48m
5i7
NIW
A17
969
2002
New
Zel
and
900
-44.
74-1
77.1
9J.
Sánc
hez
Parb
orea
1796
9JX
1283
81JX
1285
15JX
1246
24JX
1246
07JX
1286
19JX
1286
52m
15i7
NIW
A17
970
2001
New
Zel
and
753
-44.
74-1
77.1
9J.
Sánc
hez
Parb
orea
1797
0JX
1284
19JX
1285
13JX
1246
37JX
1246
05JX
1286
21N
/Am
12N
IWA
1797
120
04N
ew Z
elan
d12
35-4
4.80
-177
.12
J. Sá
nche
zPa
rago
sp17
971
JX12
8444
JX12
8480
JX12
4677
JX12
4592
JX12
8618
JX12
8669
m12
i1N
IWA
2552
720
04N
ew Z
elan
d82
6-4
2.83
177.
42J.
Sánc
hez
Parb
orea
2552
7JX
1284
23JX
1285
12JX
1246
89JX
1245
48JX
1285
66N
/Am
15N
IWA
2812
320
00N
ew Z
elan
d87
2-4
7.31
165.
83J.
Sánc
hez
Parb
orea
2812
3JX
1284
15JX
1284
96JX
1246
82JX
1245
46JX
1285
71N
/Am
15N
IWA
2815
419
81N
ew Z
elan
d42
7-4
3.35
178.
66J.
Sánc
hez
Parb
orea
2815
4JX
1284
41JX
1284
48JX
1246
25JX
1245
53JX
1285
49N
/Am
15N
IWA
2815
620
02N
ew Z
elan
d92
0-3
3.92
167.
92J.
Sánc
hez
Parb
orea
2815
6JX
1284
20JX
1284
72JX
1246
35JX
1246
10JX
1285
48N
/Am
15N
IWA
2815
719
99N
ew Z
elan
d95
9-4
4.58
-177
.88
J. Sá
nche
zPa
rbor
ea28
157
JX12
8424
JX12
8510
JX12
4671
JX12
4531
JX12
8632
N/A
m15
NIW
A28
158
2001
New
Zel
and
753
-44.
74-1
77.1
8J.
Sánc
hez
Parb
orea
2815
8JX
1284
37JX
1285
38JX
1246
61JX
1245
66JX
1286
25N
/Am
12N
IWA
2816
020
01N
ew Z
elan
dJ.
Sánc
hez
Parb
orea
2816
0JX
1283
84JX
1285
37JX
1246
94JX
1245
23JX
1285
62N
/Am
11N
IWA
2816
120
01N
ew Z
elan
d75
3-4
4.74
-176
.81
J. Sá
nche
zPa
rbor
ea28
161
JX12
8386
JX12
8531
JX12
4614
JX12
4568
JX12
8544
N/A
m13
NIW
A28
392
2001
New
Zel
and
753
-44.
74-1
77.1
9J.
Sánc
hez
Parb
orea
2839
2JX
1284
38JX
1284
98JX
1246
16JX
1245
75JX
1285
81N
/Am
13N
IWA
2842
220
01N
ew Z
elan
d75
3-4
4.74
-176
.81
J. Sá
nche
zPa
rbor
ea28
422
JX12
8434
JX12
8514
JX12
4697
JX12
4601
JX12
8588
N/A
m13
NIW
A28
425
1997
New
Zel
and
858
-44.
45-1
79.9
6J.
Sánc
hez
Parb
orea
2842
5JX
1284
18JX
1284
56JX
1246
19JX
1245
50JX
1285
87N
/Am
10N
IWA
4182
920
06N
ew Z
elan
d10
44-4
7.25
178.
33J.
Sánc
hez
Parb
orea
4182
9JX
1284
14JX
1285
23JX
1246
60JX
1245
85JX
1285
58JX
1286
44m
12i2
NIW
A41
854
2007
New
Zel
and
867-
986
-47.
5317
7.87
J. Sá
nche
zPa
rbor
ea41
854
JX12
8435
JX12
8506
JX12
4683
JX12
4611
JX12
8555
N/A
m13
NIW
A41
870
2008
New
Zel
and
600
-44.
5217
5.78
J. Sá
nche
zPa
rbor
ea41
870
JX12
8421
JX12
8478
JX12
4643
JX12
4558
JX12
8592
JX12
8672
m12
i2N
IWA
4199
920
07N
ew Z
elan
d12
03-1
288
-44.
50-1
74.7
9J.
Sánc
hez
Parb
orea
4199
9JX
1283
87JX
1284
70JX
1246
58JX
1245
88JX
1285
90JX
1286
68m
15i2
NIW
A42
000
2008
New
Zel
and
669
-44.
71-1
77.0
4J.
Sánc
hez
Parb
orea
4200
0N
/AN
/AN
/AN
/AN
/AJX
1286
49i2
NIW
A42
001
2007
New
Zel
and
1283
-139
3-4
4.50
-174
.82
J. Sá
nche
zPa
rbor
ea42
001
JX12
8354
JX12
8474
JX12
4678
JX12
4574
JX12
8613
N/A
m11
NIW
A42
003
2007
Cor
al H
ill, N
ew Z
elan
d78
0-3
4.82
169.
86J.
Sánc
hez
Parb
orea
4200
3N
/AN
/AN
/AN
/AN
/AJX
1286
81i4
NIW
A44
156
2007
New
Zel
and
720-
741
-47.
4717
7.02
J. Sá
nche
zPa
rago
sp44
156
JX12
8383
JX12
8509
JX12
4692
JX12
4563
JX12
8601
JX12
8655
m12
i2N
IWA
4460
820
07N
ew Z
elan
d11
06-1
357
-46.
9117
1.88
J. Sá
nche
zPa
rbor
ea44
608
JX12
8392
JX12
8497
JX12
4673
JX12
4537
JX12
8582
N/A
m12
NIW
A44
609
2007
New
Zel
and
870-
967
-47.
5317
7.92
B. S
tone
Parb
orea
4460
9JX
1284
06JX
1284
92JX
1246
72JX
1245
34JX
1285
67JX
1286
54m
11i2
NIW
A46
314
2008
New
Zel
and
843-
998
-50.
0517
4.73
J. Sá
nche
zPa
rago
sp46
314
JX12
8394
JX12
8454
JX12
4666
JX12
4594
JX12
8598
N/A
m12
NIW
A46
315
2008
New
Zel
and
888-
1015
-47.
5517
7.86
J. Sá
nche
zPa
rago
sp46
315
JX12
8369
JX12
8450
JX12
4621
JX12
4569
JX12
8603
N/A
m11
NIW
A46
316
2007
New
Zel
and
600
-44.
5217
5.77
J. Sá
nche
zPa
rago
sp46
316
JX12
8408
JX12
8505
JX12
4617
JX12
4573
JX12
8611
N/A
m12
NIW
A46
317
2008
New
Zel
and
931-
1025
-47.
5817
7.78
J. Sá
nche
zPa
rago
sp46
317
JX12
8396
JX12
8458
JX12
4695
JX12
4603
JX12
8597
N/A
m12
NIW
A46
318
2008
New
Zel
and
794-
987
-44.
73-1
77.0
4J.
Sánc
hez
Para
gosp
4631
8JX
1283
71JX
1284
82JX
1246
98JX
1245
83JX
1285
75N
/Am
11N
IWA
4631
920
06N
ew Z
elan
d-4
9.50
176.
00J.
Sánc
hez
Para
gosp
4631
9JX
1284
13JX
1285
32JX
1246
12JX
1245
95JX
1286
09N
/Am
11N
IWA
4632
020
08N
ew Z
elan
d75
0-85
5-4
6.48
170.
60J.
Sánc
hez
Parb
orea
4632
0JX
1284
39JX
1285
22JX
1247
03JX
1245
70JX
1285
73JX
1286
51m
12i6
NIW
A46
377
1927
New
Zel
and
952-
1118
-50.
0017
6.06
J. Sá
nche
zPa
rago
sp46
377
JX12
8379
JX12
8461
JX12
4648
JX12
4549
JX12
8616
N/A
m11
NIW
AZ
1116
620
07N
ew Z
elan
d89
1-4
4.44
175.
54J.
Sánc
hez
Parb
orea
Z11
166
JX12
8375
JX12
8487
JX12
4664
JX12
4533
JX12
8563
N/A
m11
USN
M40
89Sa
ble
Isla
nd, 5
0 M
ile E
Of E
Lig
ht, N
ova
Scot
ia, C
anad
a51
243
.90
-58.
80R
. Rat
hbun
Parb
orea
4089
JX12
8431
JX12
8493
JX12
4615
JX12
4591
JX12
8636
JX12
8685
m15
i6U
SNM
4091
1879
Banq
uere
au B
ank,
Nov
a Sc
otia
, Can
ada
366
44.5
8-5
7.68
A. V
erri
llPa
rbor
ea40
91JX
1283
91JX
1285
01JX
1246
27JX
1245
79JX
1285
89N
/Am
12U
SNM
4238
1879
Banq
uere
au B
ank,
Sou
th O
f, N
ova
Scot
ia, C
anad
a45
743
.90
-58.
67R
. Rat
hbun
Parb
orea
4238
JX12
8363
JX12
8451
JX12
4629
JX12
4608
JX12
8577
JX12
8679
m15
i1U
SNM
4242
1879
Gra
nd B
anks
, W P
art
Of,
New
foun
dlan
d, C
anad
a45
.00
-54.
00A
. Ver
rill
Parb
orea
4242
JX12
8352
JX12
8485
JX12
4632
JX12
4567
JX12
8596
JX12
8653
m15
i2U
SNM
4569
1879
Sabl
e Is
land
Ban
k, N
ova
Scot
ia, C
anad
a45
743
.42
-60.
00R
. Rat
hbun
Parb
orea
4569
JX12
8359
JX12
8491
JX12
4701
JX12
4596
JX12
8634
JX12
8657
m15
i6U
SNM
3355
918
78Fi
shin
g Ba
nks,
Nor
th C
arol
ina,
USA
457
36.0
0-7
4.00
A. V
erri
llPa
rbor
ea33
559
JX12
8436
JX12
8466
JX12
4670
JX12
4559
JX12
8561
N/A
m16
USN
M33
560
Fish
ing
Bank
s, N
orth
Car
olin
a, U
SA45
.00
-53.
50A
. Ver
rill
Parb
orea
p335
60JX
1284
10JX
1284
99JX
1246
26JX
1245
72JX
1286
35N
/Am
15U
SNM
3356
1O
ff N
E N
orth
Am
eric
a, U
SAA
. Ver
rill
Parb
orea
3356
1JX
1283
58JX
1285
08JX
1246
33JX
1245
62JX
1285
54N
/Am
15U
SNM
3356
2O
ff N
E N
orth
Am
eric
a, U
SAA
. Ver
rill
Parb
orea
3356
2N
/AN
/AN
/AN
/AN
/AJX
1286
65i2
USN
M50
890
1927
Burd
woo
d Ba
nk, S
Of F
alkl
and
Isla
nds,
Scot
ia S
ea-5
4.50
-59.
10F.
Baye
rPa
rbor
ea50
890
JX12
8412
JX12
8467
JX12
4651
JX12
4521
JX12
8630
N/A
m4
USN
M80
838
1979
Balti
mor
e C
anyo
n, O
ff Ea
ster
n Sh
ore,
Mar
ylan
d, U
SA48
038
.17
-73.
84F.
Baye
rPa
rbor
ea80
838
JX12
8416
JX12
8517
JX12
4676
JX12
4544
JX12
8553
JX12
8661
m15
i2U
SNM
8093
619
79Ly
doni
a C
anyo
n, M
assa
chus
etts
, USA
680-
370
40.3
8-6
7.66
F. Ba
yer
Parb
orea
8093
6JX
1283
62JX
1285
18JX
1246
22JX
1245
43JX
1285
56N
/Am
15U
SNM
8093
719
79Ly
doni
a C
anyo
n, M
assa
chus
etts
, USA
613-
430
40.3
8-6
7.66
F. Ba
yer
Parb
orea
8093
7JX
1283
85JX
1284
69JX
1246
13JX
1245
99JX
1285
57N
/Am
15U
SNM
1007
5819
94A
leut
ian
Isla
nds
52.0
0-1
70.0
0F.
Baye
rPa
rbor
ea10
0758
JX12
8355
JX12
8534
JX12
4634
JX12
4584
JX12
8547
N/A
m3
USN
M10
0817
1994
Atk
a Is
land
, And
rean
of Is
land
s, A
leut
ian
Isla
nds
53.0
0-1
74.0
0F.
Baye
rPa
rbor
ea10
0817
JX12
8404
JX12
8494
JX12
4669
JX12
4539
JX12
8626
N/A
m3
USN
M10
0818
1994
Sem
isop
ochn
oi Is
land
, Rat
Isla
nds,
Ale
utia
n Is
land
s52
.17
179.
72F.
Baye
rPa
rbor
ea10
0818
JX12
8433
JX12
8536
JX12
4700
JX12
4597
JX12
8546
JX12
8675
m3
i8U
SNM
1008
4319
94Ta
naga
Isla
nd, A
ndre
anof
Isla
nds,
Ale
utia
n Is
land
s52
.00
-178
.00
F. Ba
yer
Parb
orea
1008
43JX
1283
82JX
1284
59JX
1246
74JX
1245
29JX
1285
84JX
1286
60m
3i8
USN
M10
0846
1994
Yuna
ska
Isla
nd, I
slan
ds o
f Fou
r M
ount
ains
, Ale
utia
n Is
land
s53
.00
-171
.00
F. Ba
yer
Parb
orea
1008
46JX
1284
11JX
1284
89JX
1246
79JX
1245
38JX
1285
70N
/Am
3U
SNM
1007
340
2001
Vanc
ouve
r Is
land
, Can
ada
1168
48.4
4-1
26.3
8F.
Baye
rPa
rago
sp10
0734
0JX
1283
64JX
1285
00JX
1246
50JX
1245
56JX
1285
72JX
1286
78m
9i6
USN
M10
1078
720
00N
orfo
lk C
anyo
n, V
irgi
nia,
USA
375-
489
37.0
7-7
4.66
F. Ba
yer
Parb
orea
1010
787
JX12
8368
JX12
8488
JX12
4639
JX12
4528
JX12
8617
JX12
8671
m15
i1U
SNM
1011
097
2002
Buld
ir R
eef,
Rat
Isla
nds,
Ale
utia
n Is
land
s16
051
.96
176.
83R
. Sto
nePa
rbor
ea10
1109
7JX
1283
57JX
1285
28JX
1246
59JX
1245
45JX
1285
60JX
1286
74m
2i8
USN
M10
1136
020
01of
f Um
nak
Isla
nd, F
ox Is
land
s, A
leut
ian
Isla
nds
102
53.6
8-1
69.1
1F.
Baye
rPa
rbor
ea10
1136
0JX
1283
78JX
1284
62JX
1246
31JX
1245
82JX
1285
43N
/Am
3U
SNM
1014
919
2003
Dav
idso
n Se
amou
nt, C
alifo
rnia
, USA
1313
35.7
0-1
22.7
0F.
Baye
rPa
rago
sp10
1491
9JX
1283
73JX
1284
95JX
1246
68JX
1245
78JX
1286
22N
/Am
9U
SNM
1016
320
2002
Briti
sh C
olum
bia,
Can
ada
1152
-119
253
.70
-133
.42
S. C
airn
sPp
acifi
ca10
1632
0JX
1283
61JX
1285
19JX
1246
80JX
1245
81JX
1286
12N
/Am
9U
SNM
1027
060
2003
Pion
eer
Seam
ount
, Sou
th o
f far
allo
n Is
land
s, C
alifo
rnia
, USA
1712
37.4
0-1
23.4
4S.
Cai
rns
Para
gosp
1027
060
JX12
8446
JX12
8463
JX12
4620
JX12
4560
JX12
8594
JX12
8643
m9
i6U
SNM
1075
738
2004
Dic
kins
Sea
mou
nt, G
ulf o
f Ala
ska,
USA
760
54.5
5-1
36.8
4S.
Cai
rns
Para
gosp
1075
738
JX12
8365
JX12
8502
JX12
4649
JX12
4526
JX12
8623
JX12
8676
m9
i6U
SNM
1075
744
2004
Dic
kins
Sea
mou
nt, G
ulf o
f Ala
ska,
USA
851
54.5
1-1
36.9
1S.
Cai
rns
Para
gosp
1075
744
JX12
8432
JX12
8453
JX12
4690
JX12
4565
JX12
8607
N/A
m9
USN
M10
7574
520
04D
icki
ns S
eam
ount
, Gul
f of A
lask
a, U
SA84
954
.51
-136
.91
S. C
airn
sPa
rago
sp10
7574
5JX
1283
66JX
1285
35JX
1246
75JX
1246
02JX
1285
99N
/Am
9U
SNM
1075
746
2004
Wel
ker
Seam
ount
, Gul
f of A
lask
a, U
SA78
055
.05
-140
.31
S. C
airn
sPa
rago
sp10
7574
6JX
1284
45JX
1284
71JX
1246
30JX
1245
40JX
1285
80JX
1286
46m
9i6
USN
M10
7575
320
04W
elke
r Se
amou
nt, G
ulf o
f Ala
ska,
USA
1112
55.0
7-1
40.4
1S.
Cai
rns
Para
gosp
1075
753
JX12
8356
JX12
8526
JX12
4685
JX12
4527
JX12
8605
JX12
8682
m9
i11
USN
M10
7575
420
04W
elke
r Se
amou
nt. G
ulf o
f Ala
ska,
USA
1084
55.0
7-1
40.4
1S.
Cai
rns
Para
gosp
1075
754
JX12
8405
JX12
8468
JX12
4665
JX12
4593
JX12
8624
N/A
m9
USN
M10
7576
020
04Pr
att
Seam
ount
, Gul
f of A
lask
a, U
SA95
956
.17
-142
.70
S. C
airn
sPa
rago
sp10
7576
0JX
1283
93JX
1284
47JX
1246
99JX
1245
30JX
1285
45JX
1286
45m
9i6
Ge
nB
an
k A
cce
sio
n N
um
be
rsTa
ble
S1. C
olle
ctio
n an
d se
quen
ce in
form
atio
n fo
r the
spec
imen
s use
d in
this
stud
y.
Hap
loty
pe
s
Acr
onym
s as f
ollo
ws:
Nat
iona
l Mus
eum
of N
atur
al H
isto
ry, S
mith
soni
an In
stitu
tion,
USA
(USN
M);
The
Nat
iona
l Ins
titut
e of
Wat
er a
nd A
tmos
pher
ic R
esea
rch,
New
Zea
land
(NIW
A);
Mus
eum
of C
ompa
rativ
e Zo
olog
y, H
arva
rd U
nive
rsity
, USA
(MC
Z); M
uséu
m N
atio
nal d
'His
toire
Nat
urel
le, P
aris
, Fr
ance
(MN
HN
); Se
ncke
nber
g R
esea
rch
Inst
itute
And
Nat
ural
His
tory
Mus
eum
Fra
nkfu
rt, G
erm
any
(SM
F); U
ppsa
la U
nive
rsity
Evo
lutio
nsm
usee
t, Sw
eden
(UU
ZM);
Wak
ayam
a Pr
efec
tura
l Mus
eum
of N
atur
al H
isto
ry, J
apan
(WPM
NH
); Ya
le P
eabo
dy M
useu
m o
f Nat
ural
His
tory
, USA
(YPM
).
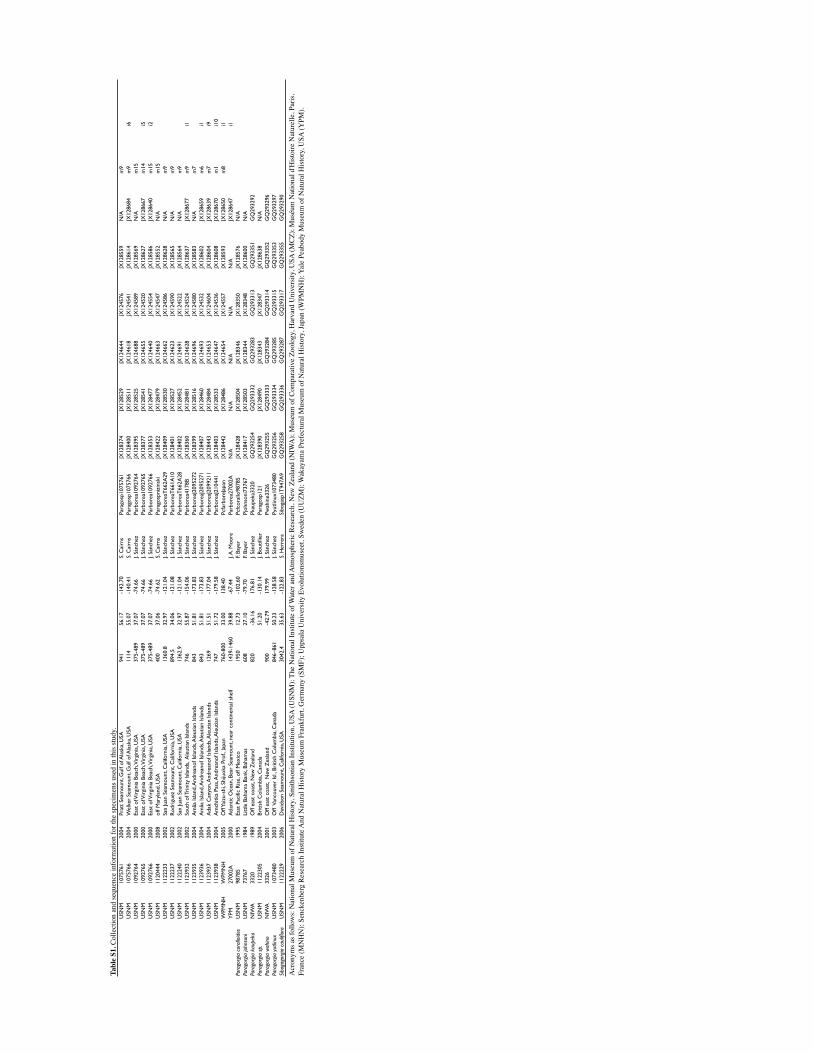
USN
M10
7576
120
04Pr
att
Seam
ount
, Gul
f of A
lask
a, U
SA94
156
.17
-142
.70
S. C
airn
sPa
rago
sp10
7576
1JX
1283
74JX
1285
29JX
1246
44JX
1245
76JX
1285
59N
/Am
9U
SNM
1075
766
2004
Wel
ker
Seam
ount
, Gul
f of A
lask
a, U
SA11
1455
.07
-140
.41
S. C
airn
sPa
rago
sp10
7576
6JX
1284
00JX
1285
11JX
1246
18JX
1245
41JX
1286
14JX
1286
84m
9i6
USN
M10
9276
420
00Ea
st o
f Vir
gini
a Be
ach,
Vir
gini
a, U
SA37
5-48
937
.07
-74.
66J.
Sánc
hez
Parb
orea
1092
764
JX12
8395
JX12
8525
JX12
4688
JX12
4589
JX12
8569
N/A
m15
USN
M10
9276
520
00Ea
st o
f Vir
gini
a Be
ach,
Vir
gini
a, U
SA37
5-48
937
.07
-74.
66J.
Sánc
hez
Parb
orea
1092
765
JX12
8377
JX12
8541
JX12
4655
JX12
4520
JX12
8627
JX12
8667
m14
i5U
SNM
1092
766
2000
East
of V
irgi
nia
Beac
h, V
irgi
nia,
USA
375-
489
37.0
7-7
4.66
J. Sá
nche
zPa
rbor
ea10
9276
6JX
1283
53JX
1284
77JX
1246
40JX
1245
54JX
1285
86JX
1286
40m
15i2
USN
M11
2044
420
08of
f Mar
ylan
d, U
SA40
037
.06
-74.
62S.
Cai
rns
Para
gosp
nizi
nski
JX12
8422
JX12
8479
JX12
4663
JX12
4547
JX12
8552
N/A
m15
USN
M11
2223
320
02Sa
n Ju
an S
eam
ount
, Cal
iforn
ia, U
SA13
60.8
32.9
7-1
21.0
4J.
Sánc
hez
Parb
orea
T66
2A29
JX12
8409
JX12
8530
JX12
4662
JX12
4586
JX12
8628
N/A
m9
USN
M11
2223
720
02R
odri
guez
Sea
mou
nt, C
alifo
rnia
, USA
894.
534
.06
-121
.08
J. Sá
nche
zPa
rbor
eaT
661A
10JX
1284
01JX
1285
27JX
1246
23JX
1245
90JX
1285
65N
/Am
9U
SNM
1122
240
2002
San
Juan
Sea
mou
nt, C
alifo
rnia
, USA
1362
.932
.97
-121
.04
J. Sá
nche
zPa
rbor
eaT
662A
28JX
1284
02JX
1284
52JX
1246
91JX
1245
22JX
1285
64N
/Am
9U
SNM
1123
932
2002
Sout
h of
Tri
nity
Isla
nds,
Ale
utia
n Is
land
s74
655
.87
-154
.06
J. Sá
nche
zPa
rbor
ea41
78B
JX12
8360
JX12
8481
JX12
4628
JX12
4524
JX12
8637
JX12
8677
m9
i1U
SNM
1123
935
2004
Am
lia Is
land
, And
rean
of Is
land
s, A
leut
ian
Isla
nds
843
51.8
1-1
73.8
3J.
Sánc
hez
Parb
orea
J209
5272
JX12
8399
JX12
8516
JX12
4696
JX12
4580
JX12
8583
N/A
m7
USN
M11
2393
620
04A
mlia
Isla
nd, A
ndre
anof
Isla
nds,
Ale
utia
n Is
land
s84
351
.81
-173
.83
J. Sá
nche
zPa
rbor
eaJ2
0952
71JX
1284
07JX
1284
60JX
1246
93JX
1245
32JX
1286
02JX
1286
59m
6i1
USN
M11
2393
720
04A
dak
Can
yon,
And
rean
of Is
land
s, A
leut
ian
Isla
nds
1269
51.5
1-1
77.0
4J.
Sánc
hez
Parb
orea
J209
9211
JX12
8443
JX12
8484
JX12
4653
JX12
4604
JX12
8604
JX12
8639
m7
i9U
SNM
1123
938
2004
Am
chitk
a Pa
ss, A
ndre
anof
Isla
nds,
Ale
utia
n Is
land
s74
751
.72
-179
.58
J. Sá
nche
zPa
rbor
eaJ2
1044
1JX
1284
03JX
1285
33JX
1246
47JX
1245
36JX
1286
08JX
1286
70m
1i1
0W
PMN
HW
PMN
H20
05O
ff Ya
izu-
shi,
Shiju
oka
Prof
., Ja
pan
760-
800
33.0
013
8.40
Pcfa
rbor
eJap
anJX
1284
42JX
1284
86JX
1246
54JX
1245
57JX
1285
93JX
1286
50m
8i1
YPM
2700
2A20
00A
tlant
ic O
cean
, Bea
r Se
amou
nt, n
ear
cont
inen
tal s
helf
1439
-146
039
.88
-67.
44J. A
. Moo
rePa
rbor
ea27
002A
N/A
N/A
N/A
N/A
N/A
JX12
8647
i1Pa
rago
rgia
cor
allo
ides
USN
M98
785
1995
East
Pac
ific
Ris
e, o
ff M
exic
o19
5012
.73
-102
.60
F. Ba
yer
Pcfc
oral
lo98
785
JX12
8428
JX12
8504
JX12
8346
JX12
8350
JX12
8576
N/A
Para
gorg
ia jo
hnso
niU
SNM
7376
719
84Li
ttle
Bah
ama
Bank
, Bah
amas
608
27.1
0-7
9.70
F. Ba
yer
Pjoh
nson
i737
67JX
1284
17JX
1285
03JX
1283
44JX
1283
48JX
1286
00N
/APa
rago
rgia
kau
peka
NIW
A33
2019
89O
ff ea
st c
oast
, New
Zea
land
820
-36.
1617
6.81
J. Sá
nche
zPk
aupe
ka33
20G
Q29
3254
GQ
2933
32G
Q29
3283
GQ
2933
13G
Q29
3351
GQ
2932
92Pa
rago
rgia
sp.
USN
M11
2230
520
04Br
itish
Col
umbi
a, C
anad
a51
.20
-130
.14
J. Bo
utill
ier
Para
gosp
121
JX12
8390
JX12
8490
JX12
8343
JX12
8347
JX12
8638
N/A
Para
gorg
ia w
ahin
eN
IWA
3326
2001
Off
east
coa
st,
New
Zea
land
900
-42.
7917
9.99
J. Sá
nche
zPw
ahin
e332
6G
Q29
3255
GQ
2933
33G
Q29
3284
GQ
2933
14G
Q29
3352
GQ
2932
96Pa
rago
rgia
yut
linux
USN
M10
7348
020
03O
ff V
anco
uver
Isl.,
Briti
sh C
olum
bia,
Can
ada
846–
861
50.2
3-1
28.5
8J.
Sánc
hez
Pyut
linux
1073
480
GQ
2932
56G
Q29
3334
GQ
2932
85G
Q29
3315
GQ
2933
53G
Q29
3297
Sibo
gago
rgia
cau
liflo
raU
SNM
1122
229
2006
Dav
idso
n Se
amou
nt, C
alifo
rnia
, USA
3042
.435
.63
-122
.83
S. H
erre
raSi
boga
sp1T
947A
9G
Q29
3258
GQ
2933
36G
Q29
3287
GQ
2933
17G
Q29
3355
GQ
2932
90
Acr
onym
s as f
ollo
ws:
Nat
iona
l Mus
eum
of N
atur
al H
isto
ry, S
mith
soni
an In
stitu
tion,
USA
(USN
M);
The
Nat
iona
l Ins
titut
e of
Wat
er a
nd A
tmos
pher
ic R
esea
rch,
New
Zea
land
(NIW
A);
Mus
eum
of C
ompa
rativ
e Zo
olog
y, H
arva
rd U
nive
rsity
, USA
(MC
Z); M
uséu
m N
atio
nal d
'His
toire
Nat
urel
le, P
aris
, Fr
ance
(MN
HN
); Se
ncke
nber
g R
esea
rch
Inst
itute
And
Nat
ural
His
tory
Mus
eum
Fra
nkfu
rt, G
erm
any
(SM
F); U
ppsa
la U
nive
rsity
Evo
lutio
nsm
usee
t, Sw
eden
(UU
ZM);
Wak
ayam
a Pr
efec
tura
l Mus
eum
of N
atur
al H
isto
ry, J
apan
(WPM
NH
); Ya
le P
eabo
dy M
useu
m o
f Nat
ural
His
tory
, USA
(YPM
).
Tabl
e S1
. Col
lect
ion
and
sequ
ence
info
rmat
ion
for t
he sp
ecim
ens u
sed
in th
is st
udy.

Model Partition -lnL AIC deltaAIC weight cumweight uDelta16S TPM2+I 10212 1086.8644 2271.7289 0 0.1562 0.1562 -coxI TPM2+I 10212 853.9125 1805.8249 0 0.1728 0.1728 -nad3 TPM1 12210 239.1497 574.2994 0 0.0933 0.0933 115.8078nad2 TPM1+I 12210 1168.0114 2434.0228 0 0.0698 0.0698 242.8336mtMutS TPM2+I 10212 1581.1612 3260.3225 0 0.1328 0.1328 216.9732nad6 TVMef+G 12314 1106.6466 2315.2932 0 0.1708 0.1708 319.3048int TIM3ef 12032 68.6581 235.3162 0 0.1623 0.1623 -
Table S2. Nucleotide substitution models for mitochondrial gene partitions, as selected by the AIC criterion in jModeltest.
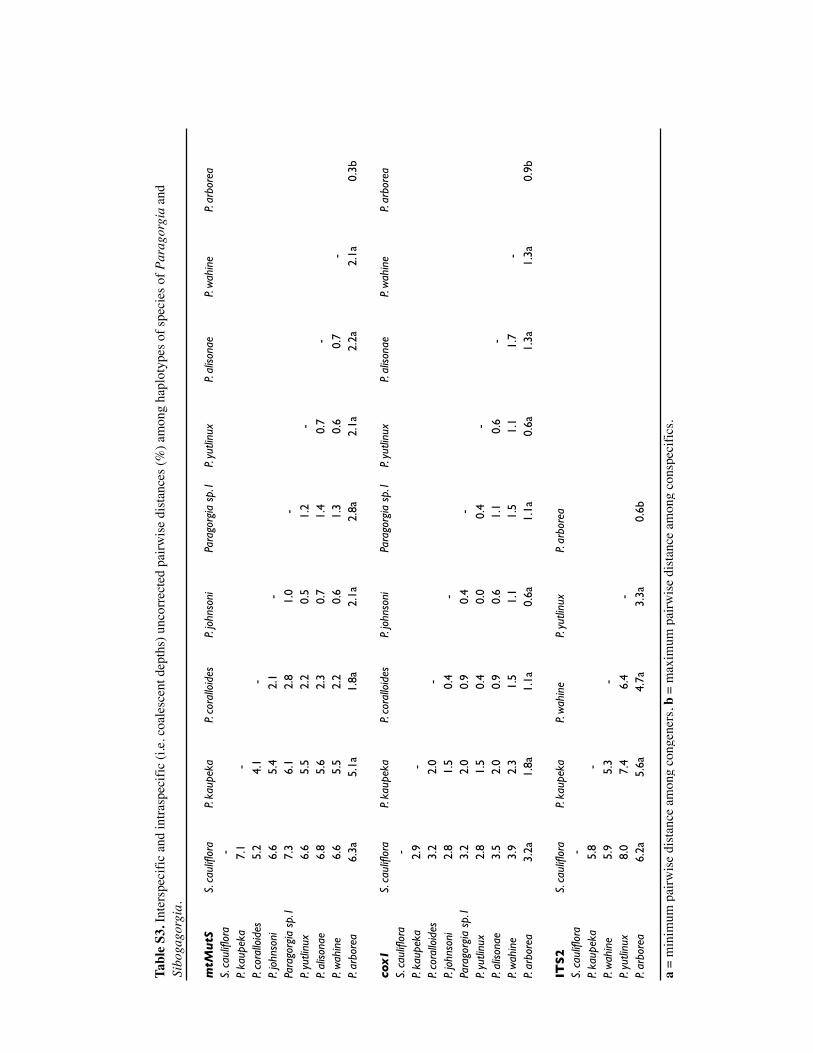
mtM
utS
S. c
aulif
lora
P. ka
upek
aP.
cora
lloid
esP.
john
soni
Para
gorg
ia s
p.1
P. yu
tlinu
xP.
aliso
nae
P. w
ahin
eP.
arbo
rea
S. c
aulif
lora
-P.
kaup
eka
7.1
-P.
cora
lloid
es5.2
4.1
-P.
john
soni
6.6
5.4
2.1
-Pa
rago
rgia
sp.
17.3
6.1
2.8
1.0
-P.
yutli
nux
6.6
5.5
2.2
0.5
1.2
-P.
aliso
nae
6.8
5.6
2.3
0.7
1.4
0.7
-P.
wah
ine
6.6
5.5
2.2
0.6
1.3
0.6
0.7
-P.
arbo
rea
6.3a
5.1a
1.8a
2.1a
2.8a
2.1a
2.2a
2.1a
0.3b
cox1
S. c
aulif
lora
P. ka
upek
aP.
cora
lloid
esP.
john
soni
Para
gorg
ia s
p.1
P. yu
tlinu
xP.
aliso
nae
P. w
ahin
eP.
arbo
rea
S. c
aulif
lora
-P.
kaup
eka
2.9
-P.
cora
lloid
es3.2
2.0
-P.
john
soni
2.8
1.5
0.4
-Pa
rago
rgia
sp.
13.2
2.0
0.9
0.4
-P.
yutli
nux
2.8
1.5
0.4
0.0
0.4
-P.
aliso
nae
3.5
2.0
0.9
0.6
1.1
0.6
-P.
wah
ine
3.9
2.3
1.5
1.1
1.5
1.1
1.7
-P.
arbo
rea
3.2a
1.8a
1.1a
0.6a
1.1a
0.6a
1.3a
1.3a
0.9b
ITS2
S. c
aulif
lora
P. ka
upek
aP.
wah
ine
P. yu
tlinu
xP.
arbo
rea
S. c
aulif
lora
-P.
kaup
eka
5.8
-P.
wah
ine
5.9
5.3
-P.
yutli
nux
8.0
7.4
6.4
-P.
arbo
rea
6.2a
5.6a
4.7a
3.3a
0.6b
a =
min
imum
pai
rwis
e di
stan
ce a
mon
g co
ngen
ers,
b =
max
imum
pai
rwis
e di
stan
ce a
mon
g co
nspe
cific
s.
Tabl
e S3
. Int
ersp
ecifi
c an
d in
trasp
ecifi
c (i.
e. c
oale
scen
t dep
ths)
unc
orre
cted
pai
rwis
e di
stan
ces (
%) a
mon
g ha
plot
ypes
of s
peci
es o
f Par
agor
gia
and
Sibo
gago
rgia
.
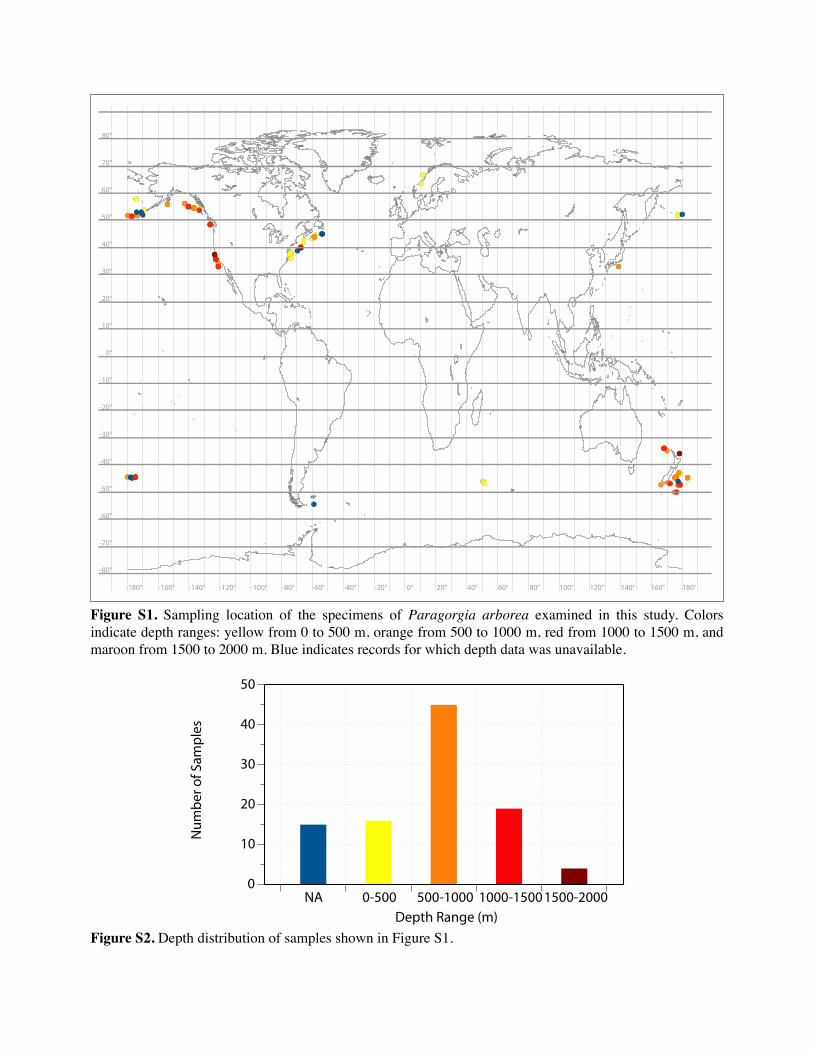
0°
10°
20°
30°
40°
50°
60°
70°
80°
-10°
-20°
-30°
-40°
-50°
-70°
-60°
-80°
0° 20° 40° 60° 80° 100° 120° 140° 160° 180°-20°-40°-60°-80°-100°-120°-140°-160°-180°
Figure S1. Sampling location of the specimens of Paragorgia arborea examined in this study. Colors indicate depth ranges: yellow from 0 to 500 m, orange from 500 to 1000 m, red from 1000 to 1500 m, and maroon from 1500 to 2000 m. Blue indicates records for which depth data was unavailable.
Num
ber o
f Sam
ples
0
10
20
30
40
50
Depth Range (m)NA 0-500 500-1000 1000-15001500-2000
Figure S2. Depth distribution of samples shown in Figure S1.
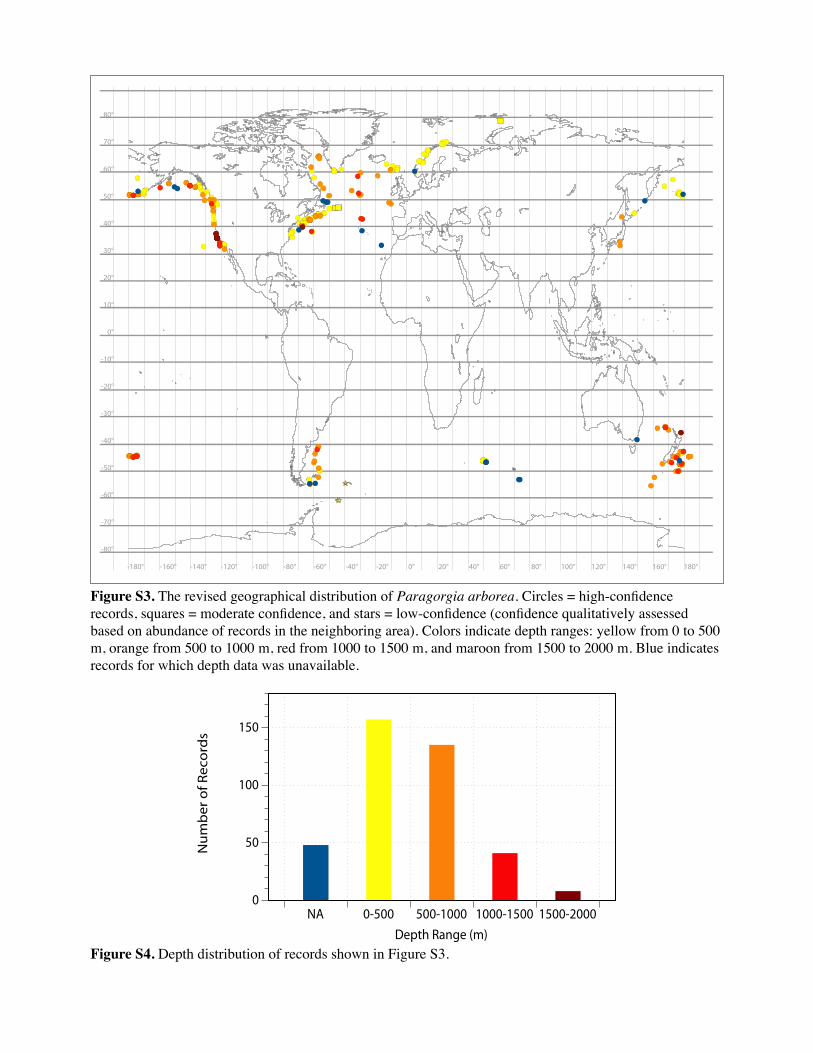
★★
★
0°
10°
20°
30°
40°
50°
60°
70°
80°
-10°
-20°
-30°
-40°
-50°
-70°
-60°
-80°
0° 20° 40° 60° 80° 100° 120° 140° 160° 180°-20°-40°-60°-80°-100°-120°-140°-160°-180°
Figure S3. The revised geographical distribution of Paragorgia arborea. Circles = high-confidence records, squares = moderate confidence, and stars = low-confidence (confidence qualitatively assessed based on abundance of records in the neighboring area). Colors indicate depth ranges: yellow from 0 to 500 m, orange from 500 to 1000 m, red from 1000 to 1500 m, and maroon from 1500 to 2000 m. Blue indicates records for which depth data was unavailable.
Num
ber o
f Rec
ords
0
50
100
150
Depth Range (m)NA 0-500 500-1000 1000-1500 1500-2000
Figure S4. Depth distribution of records shown in Figure S3.
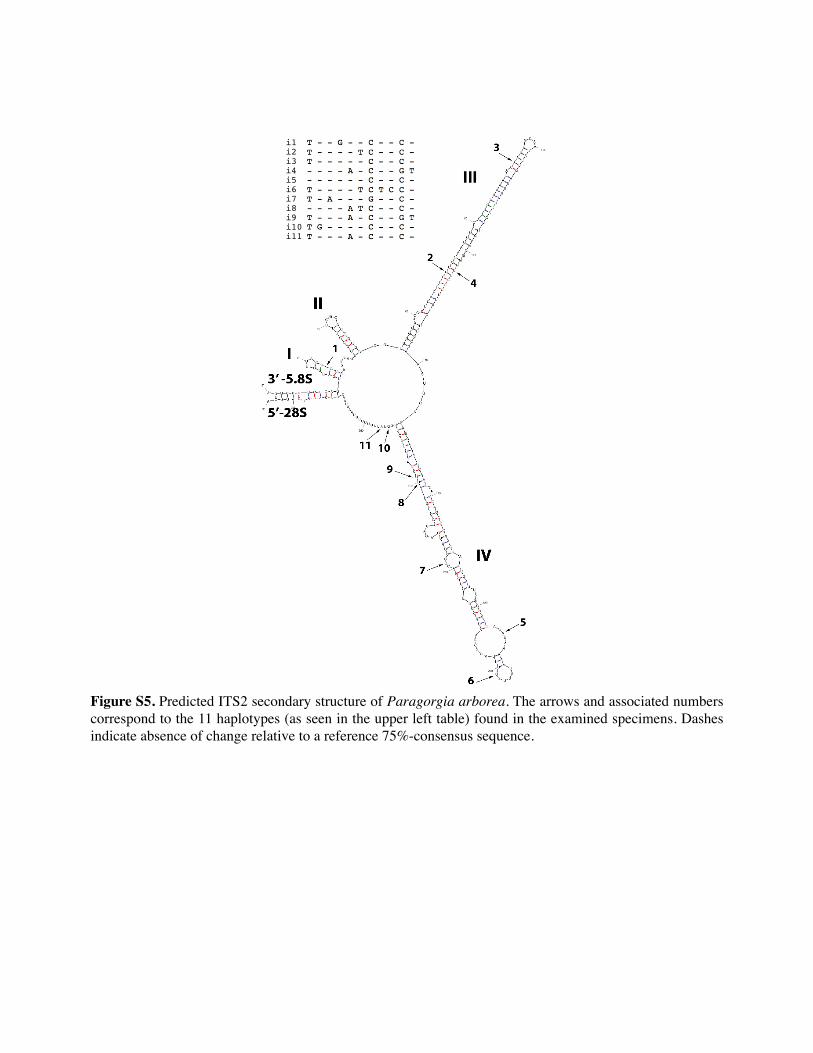
i1i2i3i4i5i6i7i8i9i10i11
Figure S5. Predicted ITS2 secondary structure of Paragorgia arborea. The arrows and associated numbers correspond to the 11 haplotypes (as seen in the upper left table) found in the examined specimens. Dashes indicate absence of change relative to a reference 75%-consensus sequence.
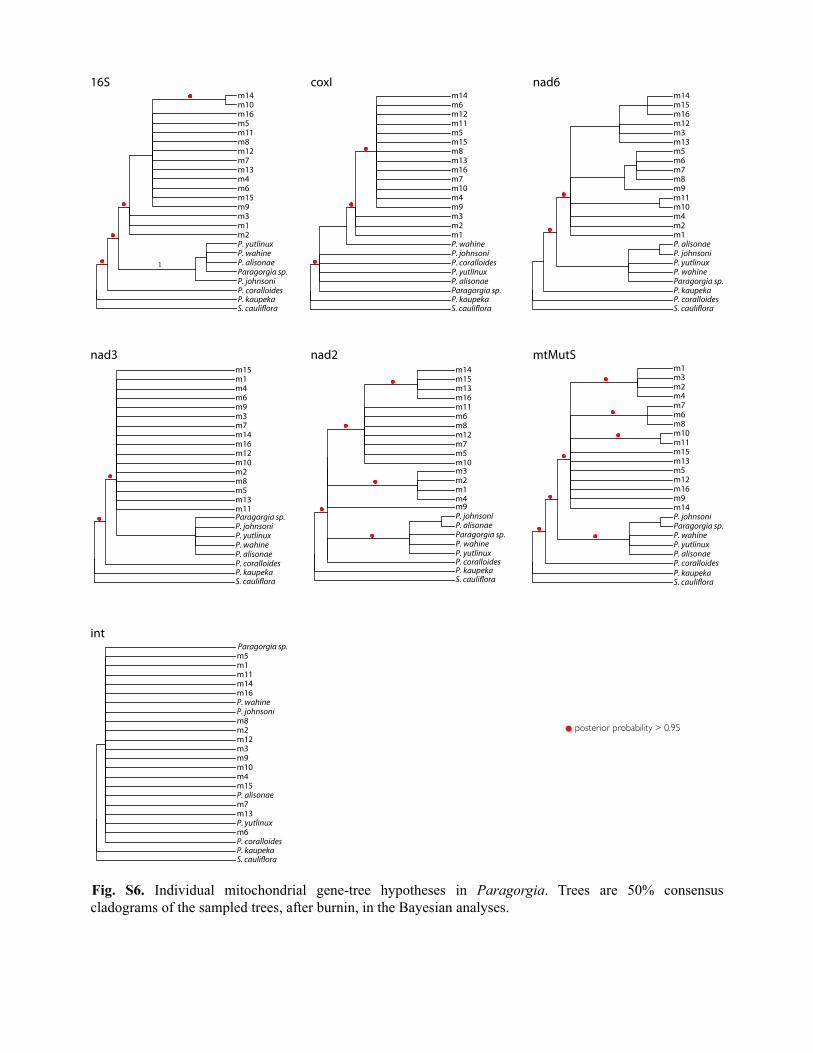
Fig. S6. Individual mitochondrial gene-tree hypotheses in Paragorgia. Trees are 50% consensus cladograms of the sampled trees, after burnin, in the Bayesian analyses.
16S
1
P. kaupekaP. coralloides
m3m1m2
P. johnsoni
m16m5m11m8m12m7m13m4m6m15m9
P. yutlinuxP. wahineP. alisonaeParagorgia sp.
m14m10
S. cauli!ora
coxI
P. kaupeka
P. johnsoniP. coralloidesP. yutlinuxP. alisonaeParagorgia sp.
P. wahine
m3m2m1
m14m6m12m11m5m15m8m13m16m7m10m4m9
S. cauli!ora S. cauli!oraP. coralloidesP. kaupeka
m4m2m1
P. yutlinuxP. wahineParagorgia sp.
m12m3m13
m11m10
m9
P. alisonaeP. johnsoni
m14m15m16
m5m6m7m8
nad6
S. cauli!oraP. kaupekaP. coralloides
m15m1m4m6m9m3m7m14m16m12m10m2m8m5m13m11Paragorgia sp.P. johnsoniP. yutlinuxP. wahineP. alisonae
nad3
S. cauli!oraP. kaupekaP. coralloides
m9
m11m6m8m12m7m5m10m3m2m1m4
m14m15m13m16
Paragorgia sp.P. wahineP. yutlinux
P. johnsoniP. alisonae
nad2m1m3m2
S. cauli!oraP. kaupekaP. coralloides
m15m13m5m12m16m9m14
P. wahineP. yutlinuxP. alisonae
m4m7m6m8m10m11
P. johnsoniParagorgia sp.
mtMutS
Paragorgia sp.
S. cauli!oraP. kaupeka
m5m1m11m14m16P. wahineP. johnsonim8m2m12m3m9m10m4m15P. alisonaem7m13P. yutlinuxm6P. coralloides
int
posterior probability > 0.95
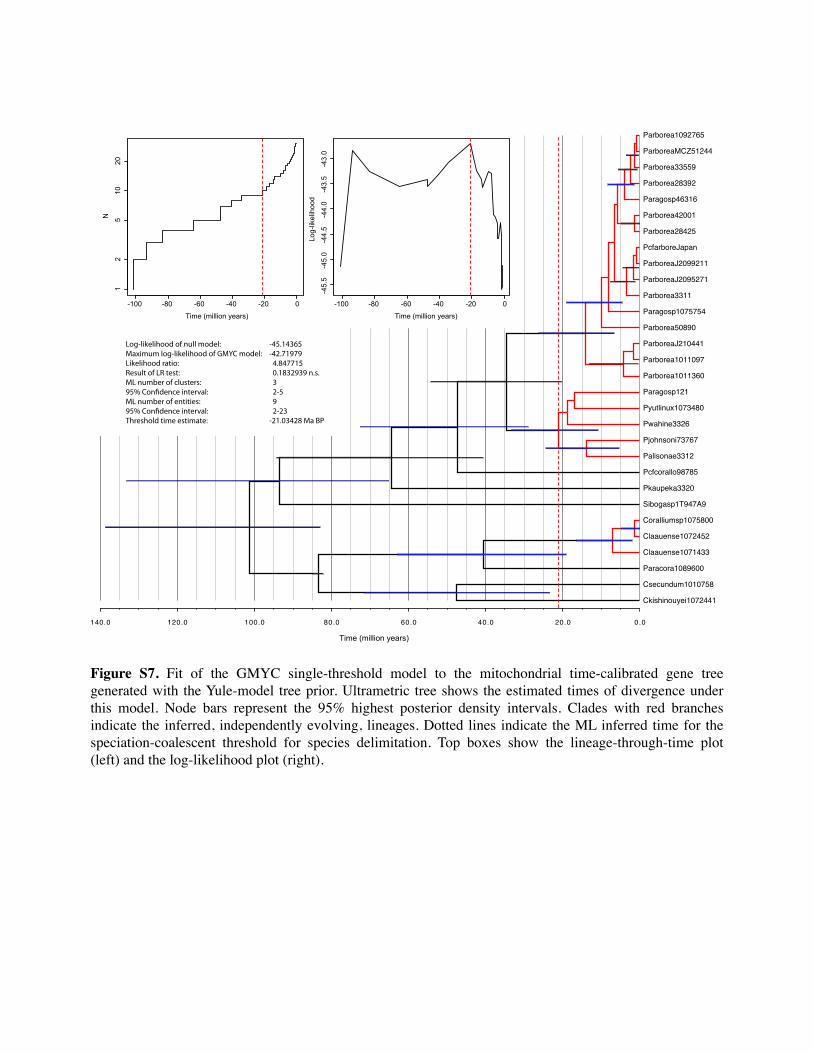
0.020.040.060.080.0100.0120.0140.0
Parborea1011360
Parborea28425
ParboreaJ2099211
ParboreaMCZ51244
Ckishinouyei1072441
Claauense1071433
PcfarboreJapan
Paragosp121
Pkaupeka3320
Paragosp46316
Pwahine3326
Palisonae3312
Pjohnsoni73767
Parborea1011097
Paragosp1075754
Coralliumsp1075800
Claauense1072452
Csecundum1010758
Parborea33559
ParboreaJ2095271
Pcfcorallo98785
Parborea42001
Parborea3311
Parborea28392
Paracora1089600
Parborea1092765
Sibogasp1T947A9
ParboreaJ210441
Parborea50890
Pyutlinux1073480
-100 -80 -60 -40 -20 0
12
510
20
Time (million years)
N
-100 -80 -60 -40 -20 0
-45.
5-4
5.0
-44.
5-4
4.0
-43.
5-4
3.0
Time (million years)Lo
g-lik
elih
ood
Log-likelihood of null model: -45.14365 Maximum log-likelihood of GMYC model: -42.71979 Likelihood ratio: 4.847715 Result of LR test: 0.1832939 n.s. ML number of clusters: 3 95% Con!dence interval: 2-5 ML number of entities: 9 95% Con!dence interval: 2-23 Threshold time estimate: -21.03428 Ma BP
Time (million years)
Figure S7. Fit of the GMYC single-threshold model to the mitochondrial time-calibrated gene tree generated with the Yule-model tree prior. Ultrametric tree shows the estimated times of divergence under this model. Node bars represent the 95% highest posterior density intervals. Clades with red branches indicate the inferred, independently evolving, lineages. Dotted lines indicate the ML inferred time for the speciation-coalescent threshold for species delimitation. Top boxes show the lineage-through-time plot (left) and the log-likelihood plot (right).
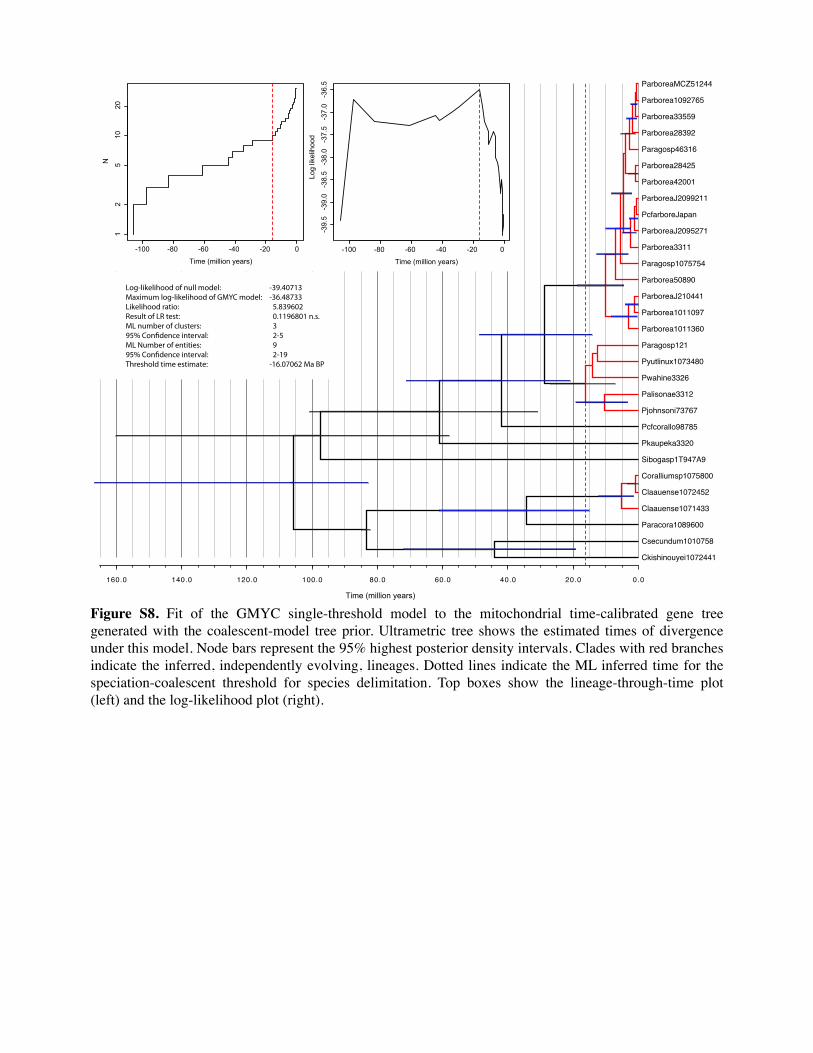
0.020.040.060.080.0100.0120.0140.0160.0
ParboreaJ2099211
Parborea28392
Claauense1072452
Pyutlinux1073480
ParboreaJ210441
ParboreaJ2095271
Parborea33559
Parborea42001
Parborea1092765
Pcfcorallo98785
Parborea1011360
Palisonae3312
Parborea28425
ParboreaMCZ51244
Paragosp121
Pjohnsoni73767
Parborea50890
Sibogasp1T947A9
Ckishinouyei1072441
Parborea3311
Pkaupeka3320
Paracora1089600
Csecundum1010758
Pwahine3326
Claauense1071433
PcfarboreJapan
Paragosp46316
Coralliumsp1075800
Paragosp1075754
Parborea1011097
-100 -80 -60 -40 -20 0
12
510
20
Time (million years)
N
-100 -80 -60 -40 -20 0
-39.
5-3
9.0
-38.
5-3
8.0
-37.
5-3
7.0
-36.
5
Time (million years)
Log
likel
ihoo
d
Log-likelihood of null model: -39.40713 Maximum log-likelihood of GMYC model: -36.48733 Likelihood ratio: 5.839602 Result of LR test: 0.1196801 n.s. ML number of clusters: 3 95% Con!dence interval: 2-5 ML Number of entities: 9 95% Con!dence interval: 2-19 Threshold time estimate: -16.07062 Ma BP
Time (million years)
Figure S8. Fit of the GMYC single-threshold model to the mitochondrial time-calibrated gene tree generated with the coalescent-model tree prior. Ultrametric tree shows the estimated times of divergence under this model. Node bars represent the 95% highest posterior density intervals. Clades with red branches indicate the inferred, independently evolving, lineages. Dotted lines indicate the ML inferred time for the speciation-coalescent threshold for species delimitation. Top boxes show the lineage-through-time plot (left) and the log-likelihood plot (right).
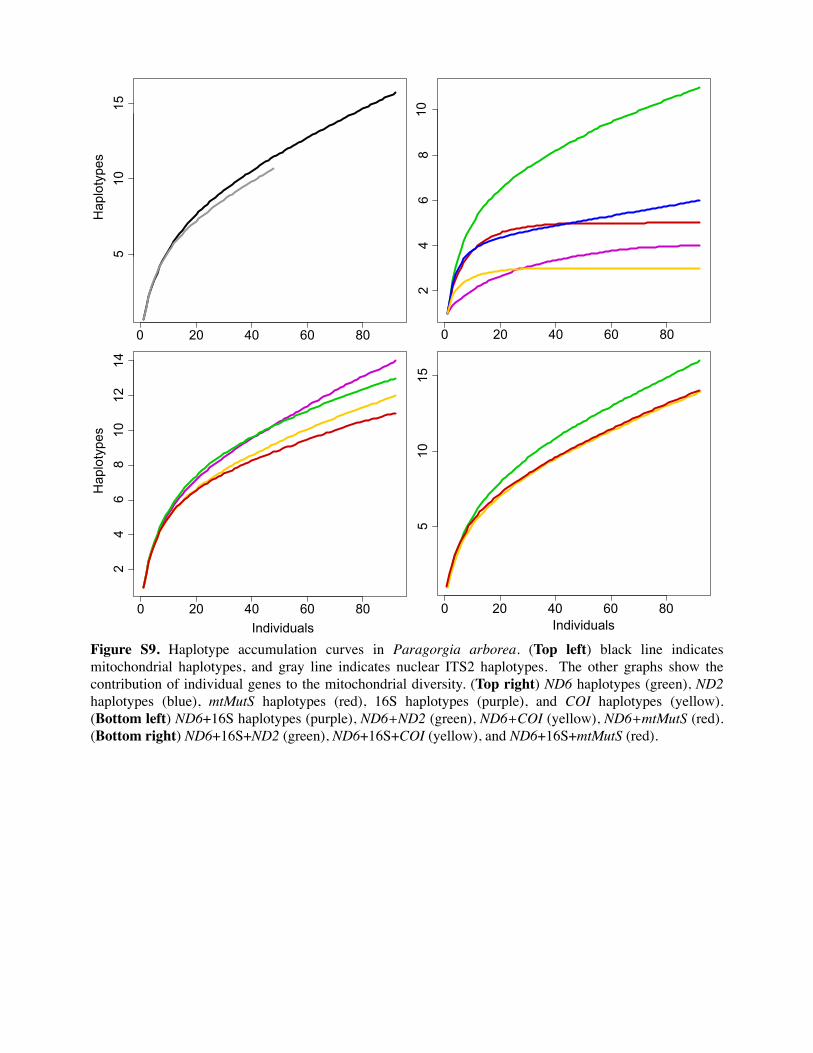
0 20 40 60 80
Haplotypes
510
15
0 20 40 60 80
24
68
10
0 20 40 60 80
24
68
1012
14Haplotypes
Individuals0 20 40 60 80
510
15
Individuals
Figure S9. Haplotype accumulation curves in Paragorgia arborea. (Top left) black line indicates mitochondrial haplotypes, and gray line indicates nuclear ITS2 haplotypes. The other graphs show the contribution of individual genes to the mitochondrial diversity. (Top right) ND6 haplotypes (green), ND2 haplotypes (blue), mtMutS haplotypes (red), 16S haplotypes (purple), and COI haplotypes (yellow). (Bottom left) ND6+16S haplotypes (purple), ND6+ND2 (green), ND6+COI (yellow), ND6+mtMutS (red). (Bottom right) ND6+16S+ND2 (green), ND6+16S+COI (yellow), and ND6+16S+mtMutS (red).
Related Documents