Human–Wildlife Interactions 9(1):119–131, Spring 2015 Spatial and temporal analysis of factors associated with urban deer–vehicle collisions ERIN C. MCCANCE, University of Manitoba-Joro Consultants Inc., 599 Portage Avenue, Winnipeg, Manitoba, R3B 2G3 [email protected] RICHARD K. BAYDACK, University of Manitoba, 255 Wallace Building, Winnipeg, Manitoba, R3T 2N2 DAVID J. WALKER, University of Manitoba, 466 Wallace Building, Winnipeg, Manitoba, R3T 2N2 DEREK N. LEASK, Joro Consultants, 599 Portage Avenue, Winnipeg, Manitoba, R3B 2G3 Abstract: Increasing populations of white-tailed deer (Odocoileus virginianus) in urban areas have resulted in an increase in deer–vehicle collisions (DVCs). Deer–vehicle collisions represent a human–wildlife conflict of serious concern, given that they result, most notably, in significant risk to human safety, deer mortality, and costly vehicle damage. Although many communities have developed databases that track the frequency and location of DVCs, there is a need for analysis of the factors that affect DVC locations in urban areas. Data on deer movement patterns across roads in urban areas are valuable to reduce the occurrence of DVCs on existing roads and to assist planning of future urban road design and placement. Using DVC data from 2005 to 2009 provided by the Manitoba Public Insurance Corporation, we found that DVCs in Winnipeg, Canada, were not spatially or temporally random, and that human-induced deer movement patterns play a role in the frequency and location of DVC occurrence. Deer–vehicle collisions occurred more frequently near suburban areas and grasslands and were clustered near where people provided food for deer. A ban on feeding deer may help reduce the frequency of DVCs. Key words: anthropogenic food sources, deer movement patterns, deer-feeding, deer– vehicle collisions, habitat selection, human–wildlife conflict, GIS, urban white-tailed deer Vehicle accidents involving white-tailed deer (Odocoileus virginianus) occur at an alarming rate throughout North America and are considered a serious problem (Romin and Bissonee 1996, Bissonee et al. 2008). Deer– vehicle collisions may result in significant risk to human safety, deer mortality, and expensive vehicle damage (Finder et al. 1999). Conover et al. (1995) found that 92% of deer hit by a vehicle die. In the United States, estimates suggest that annually >1 million drivers are involved in DVCs, with more than 29,000 human injuries and 200 human fatalities (Conover et al. 1995) resulting in >$1 billion in vehicle damage (Conover 1997). In Canada, approximately 60,000 drivers hit deer each year, costing >$200 million annually (Transport Canada 2013). In Manitoba, Canada, estimates suggest that nearly 300 people are injured annually, some seriously, in DVCs (Manitoba Public Insurance Corporation [MPIC] 2010). Today, MPIC, the sole vehicle insurer in Manitoba province, spends >$30 million per year on automobile insurance claims involving collisions with wildlife; 65% to 85% of these collision claims involve white-tailed deer (Province of Manitoba 2015)). The social costs associated with DVCs also are high and include human trauma, absence from work, and costs associated with those tasked with responding to such collisions (Hansen 1983). The concept of cultural carrying capacity is defined as the maximum wildlife population that a society will accept within a given area (Decker and Purdy 1988, Riley et al. 2002). Cultural carrying capacity is difficult to determine, given that it is based on the views of stakeholders and that the threshold of acceptance is not static (Conover 2002). Stakeholders oſten do not see eye-to-eye on the acceptable wildlife population size or on the course of management action that should be taken to alleviate conflicts (Decker et al. 2001). Wildlife acceptance capacity (Decker and Purdy 1988) has been applied to study overabundant white-tailed deer populations (Decker and Gavin 1987). Studies have explored human perceptions and aitudes with respect to deer-related vehicle accidents (Stout et al. 1993, Marcoux and Riley 2010). A quantitative human dimensions study, conducted within the city of Winnipeg, Canada, investigated resident opinions and tolerances toward the urban deer population; it identified DVCs as

Welcome message from author
This document is posted to help you gain knowledge. Please leave a comment to let me know what you think about it! Share it to your friends and learn new things together.
Transcript
Human–Wildlife Interactions 9(1):119–131, Spring 2015
Spatial and temporal analysis of factors associated with urban deer–vehicle collisions erin C. MCCanCe, University of Manitoba-Joro Consultants Inc., 599 Portage Avenue, Winnipeg,
Manitoba, R3B 2G3 [email protected] k. BaydaCk, University of Manitoba, 255 Wallace Building, Winnipeg, Manitoba, R3T
2N2david J. walker, University of Manitoba, 466 Wallace Building, Winnipeg, Manitoba, R3T 2N2derek n. leask, Joro Consultants, 599 Portage Avenue, Winnipeg, Manitoba, R3B 2G3
Abstract: Increasing populations of white-tailed deer (Odocoileus virginianus) in urban areas have resulted in an increase in deer–vehicle collisions (DVCs). Deer–vehicle collisions represent a human–wildlife conflict of serious concern, given that they result, most notably, in significant risk to human safety, deer mortality, and costly vehicle damage. Although many communities have developed databases that track the frequency and location of DVCs, there is a need for analysis of the factors that affect DVC locations in urban areas. Data on deer movement patterns across roads in urban areas are valuable to reduce the occurrence of DVCs on existing roads and to assist planning of future urban road design and placement. Using DVC data from 2005 to 2009 provided by the Manitoba Public Insurance Corporation, we found that DVCs in Winnipeg, Canada, were not spatially or temporally random, and that human-induced deer movement patterns play a role in the frequency and location of DVC occurrence. Deer–vehicle collisions occurred more frequently near suburban areas and grasslands and were clustered near where people provided food for deer. A ban on feeding deer may help reduce the frequency of DVCs. Key words: anthropogenic food sources, deer movement patterns, deer-feeding, deer–vehicle collisions, habitat selection, human–wildlife conflict, GIS, urban white-tailed deer
Vehicle accidents involving white-tailed deer (Odocoileus virginianus) occur at an alarming rate throughout North America and are considered a serious problem (Romin and Bissonette 1996, Bissonette et al. 2008). Deer–vehicle collisions may result in significant risk to human safety, deer mortality, and expensive vehicle damage (Finder et al. 1999). Conover et al. (1995) found that 92% of deer hit by a vehicle die. In the United States, estimates suggest that annually >1 million drivers are involved in DVCs, with more than 29,000 human injuries and 200 human fatalities (Conover et al. 1995) resulting in >$1 billion in vehicle damage (Conover 1997). In Canada, approximately 60,000 drivers hit deer each year, costing >$200 million annually (Transport Canada 2013).
In Manitoba, Canada, estimates suggest that nearly 300 people are injured annually, some seriously, in DVCs (Manitoba Public Insurance Corporation [MPIC] 2010). Today, MPIC, the sole vehicle insurer in Manitoba province, spends >$30 million per year on automobile insurance claims involving collisions with wildlife; 65% to 85% of these collision claims involve white-tailed deer (Province of Manitoba 2015)). The social costs associated with DVCs
also are high and include human trauma, absence from work, and costs associated with those tasked with responding to such collisions (Hansen 1983).
The concept of cultural carrying capacity is defined as the maximum wildlife population that a society will accept within a given area (Decker and Purdy 1988, Riley et al. 2002). Cultural carrying capacity is difficult to determine, given that it is based on the views of stakeholders and that the threshold of acceptance is not static (Conover 2002). Stakeholders often do not see eye-to-eye on the acceptable wildlife population size or on the course of management action that should be taken to alleviate conflicts (Decker et al. 2001).
Wildlife acceptance capacity (Decker and Purdy 1988) has been applied to study overabundant white-tailed deer populations (Decker and Gavin 1987). Studies have explored human perceptions and attitudes with respect to deer-related vehicle accidents (Stout et al. 1993, Marcoux and Riley 2010). A quantitative human dimensions study, conducted within the city of Winnipeg, Canada, investigated resident opinions and tolerances toward the urban deer population; it identified DVCs as
120 Human–Wildlife Interactions 9(1)
Winnipeg residents’ top deer-related concern (McCance 2009).
Numerous studies have investigated factors correlated with DVCs. The incidence of DVCs has been attributed to deer density (Widenmaier and Fahrig 2005, Sudharsan et al. 2006); season (Allen and McCullough 1976, Sudharsan et al. 2006, Ng et al. 2008); time of day (Marcoux et al. 2005); habitat type near roadways (Sage et al. 1983, Finder et al. 1999, Hussain et al. 2007); number of buildings (i.e., degree of development) near roadways (Neilsen et al. 2003, Hussain et al. 2007, McShea et al. 2008); traffic volume (McShea et al. 2008, Sudharsan et al. 2009); and roadway speed limits (Finder et al. 1999, Ng et al. 2008, Sudharsan et al. 2009).
Several management techniques have been suggested to mitigate, with varying success, the frequency of DVCs. Some of these techniques, aimed at reducing the occurrence of white-tailed deer on roadways, include deer population reduction (Brown et al. 2000, Riley et al. 2003); fencing (Puglisi et al. 1974, Falk et al. 1978, Feldamer et al. 1986, Putman 1997, Clevenger et al. 2001); underpasses and overpasses (Reed et al. 1975, Foster and Humphrey 1995, Rodriguez et al. 1996, Lehnert and Bissonette 1997, Putman 1997, Clevenger and Waltho 2000); intercept feeding (Wood and Wolfe 1998); whistles or repellents (Romin and Dalton 1992, D’Angelo et al. 2006); and reflectors (Schafer and Penland 1985, Romin and Dalton 1992, Vercautern et al. 2006). Other techniques have been aimed at improving a driver’s ability to respond to deer on roadways. These techniques include such measures as reduced speed limits (Allen and McCullough 1976, Case 1978, Bashore et al. 1985); habitat modification (Putman 1997); improved lighting (Carbaugh et al.1975, Allen and McCullough 1976, Reed and Woodard 1981); and warning signs (Romin and Bissonette 1996, Sullivan et al. 2004).
The problem of DVCs in urban areas is a particular concern given high deer densities (Alverson et al. 1988) and high human population density with substantial levels of vehicular traffic (Squires 2002). Winnipeg has experienced a substantial increase in the number of motor vehicle accidents
involving white-tailed deer over the past 3 decades. Winnipeg reported 48 DVCs in 1976 (Shoesmith and Koonz 1977), in comparison to the 464 DVCs reported in 2009 (MPIC, unpublished data). Huijser et al. (2009) estimate that the average DVC in Canada costs $6,600, suggesting that >$3.2 million is spent annually on collisions in Winnipeg alone. The need for direct management strategies to address DVCs is apparent and the cost-benefits of mitigation measures far exceed the costs associated with the status quo (Huijser et al. 2009). Within Winnipeg, a series of management techniques
Table 1. The Canadian Land-Cover Classification (LCC) cover types for the city of Winnipeg study area by percent-age of representation.
LCC cover type Area (km2) % cover typeAnnual crops 8.11 1.72Broad leaf, dense 14.87 3.15Cultivated agricultural land 81.91 17.34Developed 252.99 53.54Exposed land 1.34 0.28Grassland 99.45 21.05Herb 2.47 0.52Mixed wood, dense 0.07 0.01Water 11.20 2.37Total 472.41 100
Table 2: Time of day of DVCs from 2005 to 2009 within the city of Win-nipeg.
Month Sunrise to sunset
Other hours
Jan 18 98Feb 28 59
Mar 25 78
Apr 30 109
May 38 79
Jun 42 89
Jul 43 77
Aug 40 74
Sep 31 123
Oct 110 165
Nov 148 244
Dec 58 157Total 611 1,352
121Urban deer–vehicle collisions • McCance et al.
aimed at improving a driver’s ability to respond to deer have been adopted to mitigate DVCs. These measures include warning signs, speed-limit enforcement, and improved lighting.
Previous research has shown that DVCs are not temporally or spatially random (Bashore et al. 1985, Finder et al. 1999). Gaining more knowledge of the factors that influence deer movement onto and across roadways is needed to guide potential management strategies to mitigate DVCs on existing roads and to plan future road design and placement (Finder et al. 1999). In this study, we examined factors that contribute to the frequency of DVCs within Winnipeg. Our research further explored the temporal occurrences of urban DVCs by month, day of the week, and time of day in which they occurred (Table 2). We also investigated whether DVCs were spatially auto-correlated within Winnipeg, and we examined the land-
cover classification (Table 1) variables associated with high-risk DVC roadways. In combination with these analyses, our study examined the relationship between DVCs and urban deer density. Finally, we investigated whether a positive correlation exists among deer movement, DVC occurrence, and residential feeding sites. Analysis of the factors associated with DVCs may identify opportunities where direct management strategies can be best applied to reduce DVC frequency.
MethodsWinnipeg spans approx-
imately 464.01 km² at an average elevation of 240 m. The city is located in the Red River Valley and is characterized by rich, deep soils, flat topography, and a native tall-grass prairie ecosystem (Scott 2007; Figure 1). The city
has a humid continental climate (Koppen climate classification), with summers typically humid and hot, and temperatures rising to 35° C. Winters are typically dry and cold, with temperatures falling to -35° C (Environment Canada 2012). The human population of Winnipeg was 730,000 during 2010 (Census of Canada 2011).
White-tailed deer have been an integral part of the Winnipeg’s landscape for >100 years (Goulden 1981). Historically, white-tailed deer were observed in small numbers in wooded areas along the Assiniboine and Red rivers and the Charleswood area of the city up until the mid-1970s, with a population estimate of 200 deer at that time (Shoesmith and Koonz 1977). Since then, however, the white-tailed deer population has been increasing. An aerial survey in February 2006 recorded >1,700 deer within Winnipeg and its near surrounding
.
0 2.5 5 7.5 101.25Kilometers
City of Winnipeg: Study Area
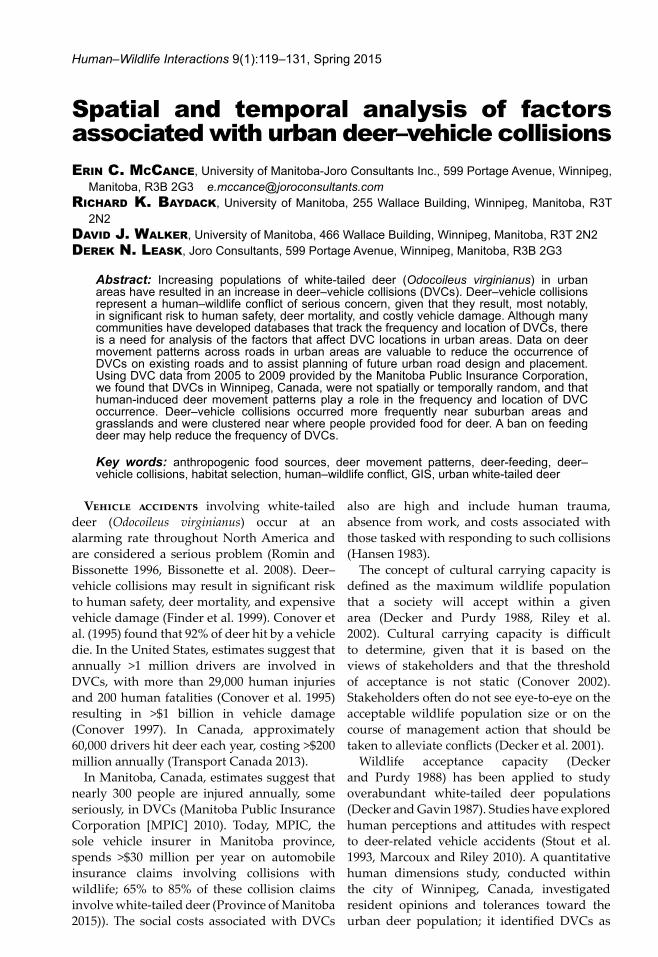
Figure 1. Map of the study area showing Winnipeg, major rivers, major roads, and residential road network. The black dot on the inset (bottom) is the location of the city relative to the province of Manitoba, Canada.
122 Human–Wildlife Interactions 9(1)
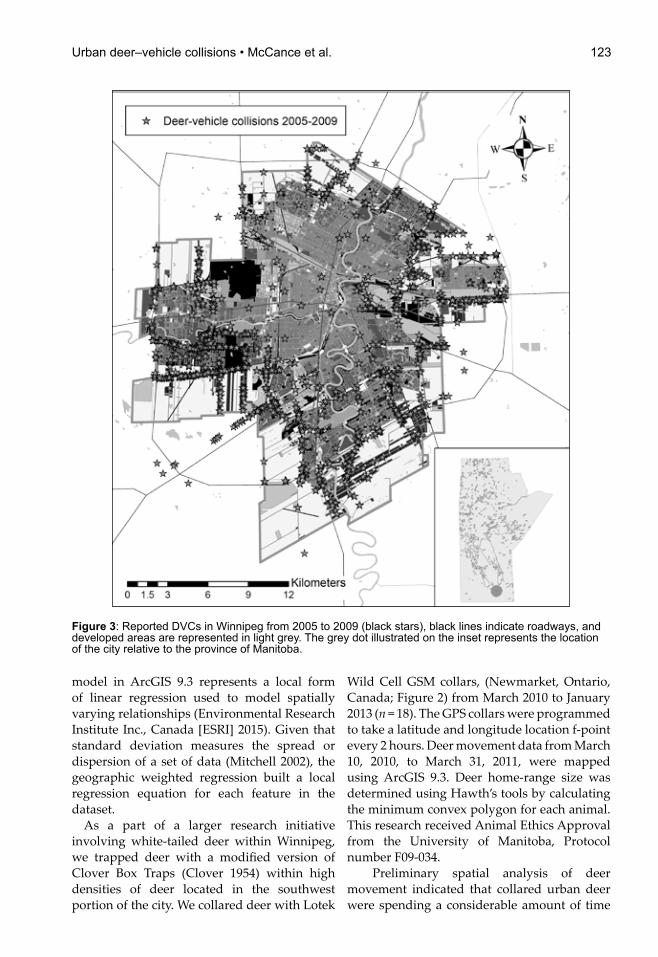
area (Hagglund 2006). Manitoba Public Insurance Corporation provided the DVC data analyzed in this study. Deer–vehicle collisions were recorded as home addresses and street intersections. For this study, all reported DVCs for the city from 2005 to 2009 were geo-located using ArcGIS 9.3 and projected to NAD83 Zone 14 North.
Our study investigated the temporal occurrence of DVCs within Winnipeg. The 1,963 DVCs reported within the city from 2005 to 2009 were separated by month, day of week, and hour of the day in which they occurred. Chi-square testing was used to determine whether DVCs occurred more frequently during certain months and days of the week. Further, the hours of the day were separated into those that fell within an hour of sunrise and within an hour of sunset hour blocks with those that did not. These hours were selected based on the sunrise and sunset times for Winnipeg (World Clock 2015). Using the combined total DVCs/hour for all data from 2005 to 2009 (1,963 collisions), the number of DVCs to fall within an hour of sunrise and sunset were tallied and compared to the number of DVCs to fall within remaining hours of the day. Paired t tests were conducted to assess whether a statistically significant higher number of DVCs occurred during sunrise and sunset. To explore the relationship of the DVCs with respect to each other (spatial auto-correlation), an average nearest neighbor calculation on the 2005 to 2009 DVC data was conducted. Using uniform cells sized at 2.5--2.5-km grid blocks overlaid on the total area of the city space, Moran’s I, a cross-product statistic was carried out to determine whether DVCs were spatially auto-correlated (Dale et al. 2002). A Moran’s I index value near >1 indicates positive auto-correlation (clustered relationship) and near <1 indicates dispersion. To investigate whether DVCs occurred more frequently near certain land-cover types a spatial join was conducted in ArcGIS 9.3 between the 2005 to 2009 DVC locations and the Canadian Land-Cover Classification (LCC) layer. The LCC is a national land-cover spatial database developed by the Canadian federal government with data integrated from the major federal departments involved in land management in Canada, such as Agriculture and Agri-Foods Canada, Canadian Forestry
Service, and the Canadian Center for Remote Sensing, developed at a 25-m resolution. This is the best available land-cover layer available for the city of Winnipeg (Table 1).
We joined the DVC point features to the LCC land-cover data layer. We determined the DVC adjacent to the closest cover type to assess if the observed frequencies and the closest adjacent land-cover types differed from random expectation using 10,000 random points generated along city roadways (Table 1). In order to assess similarities and differences between random points and GPS data, often five times the number of GPS data points is generated as random points for comparative analysis (Johnson and Gillingham 2005). The same methods of analysis were repeated using 10,000 random points along the greater Winnipeg area roadways to determine whether the summary results from the DVC data were independent of what would be observed if the distribution of values were random. To explore the relationship of deer count observations (Hagglund 2006), Moran’s I was conducted on the deer count observation layer (based on the 2006 aerial survey conducted by Manitoba Conservation and Water Stewardship).
We conducted a geographic spatial regression analysis in ArcGIS 9.3, using projected data to investigate the correlation between DVCs and deer observations within each 2.5--2.5-km grid blocks. The geographic weighted regression
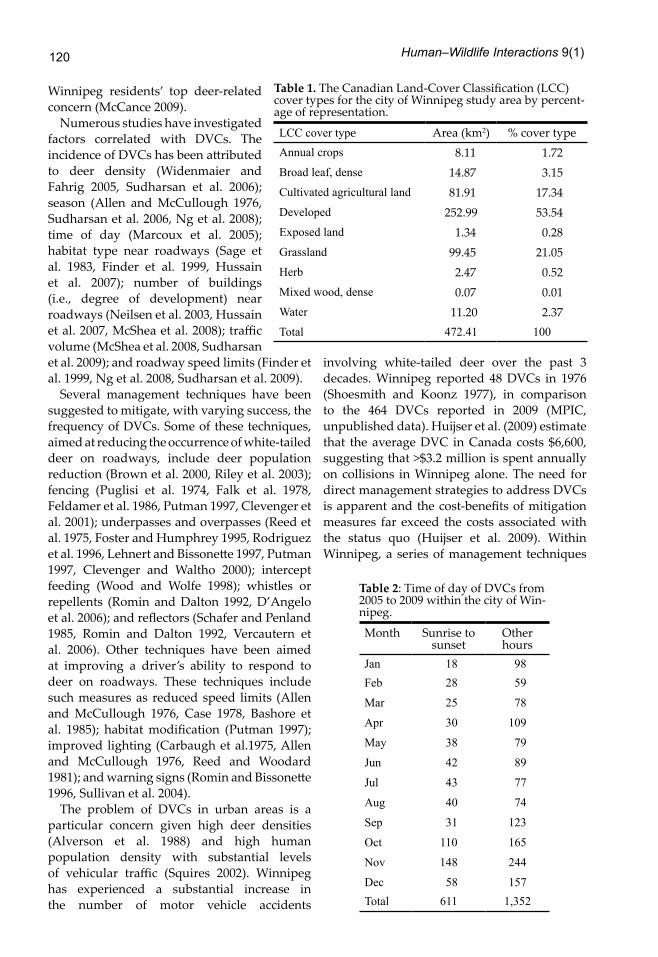
Figure 2. GPS-collared buck.
123Urban deer–vehicle collisions • McCance et al.
model in ArcGIS 9.3 represents a local form of linear regression used to model spatially varying relationships (Environmental Research Institute Inc., Canada [ESRI] 2015). Given that standard deviation measures the spread or dispersion of a set of data (Mitchell 2002), the geographic weighted regression built a local regression equation for each feature in the dataset.
As a part of a larger research initiative involving white-tailed deer within Winnipeg, we trapped deer with a modified version of Clover Box Traps (Clover 1954) within high densities of deer located in the southwest portion of the city. We collared deer with Lotek
Wild Cell GSM collars, (Newmarket, Ontario, Canada; Figure 2) from March 2010 to January 2013 (n = 18). The GPS collars were programmed to take a latitude and longitude location f-point every 2 hours. Deer movement data from March 10, 2010, to March 31, 2011, were mapped using ArcGIS 9.3. Deer home-range size was determined using Hawth’s tools by calculating the minimum convex polygon for each animal. This research received Animal Ethics Approval from the University of Manitoba, Protocol number F09-034.
Preliminary spatial analysis of deer movement indicated that collared urban deer were spending a considerable amount of time
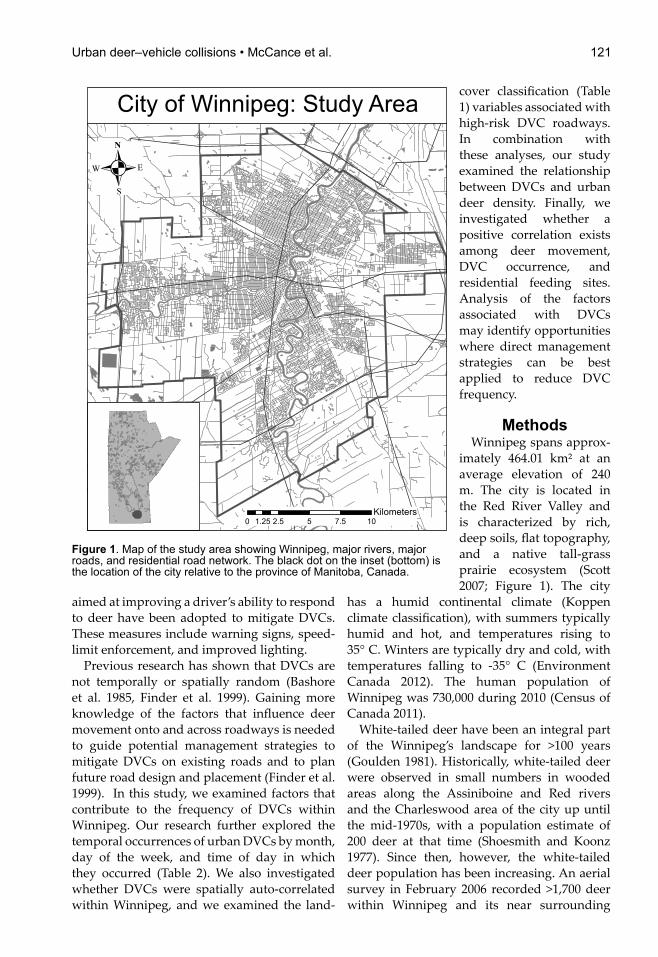
Figure 3: Reported DVCs in Winnipeg from 2005 to 2009 (black stars), black lines indicate roadways, and developed areas are represented in light grey. The grey dot illustrated on the inset represents the location of the city relative to the province of Manitoba.
124 Human–Wildlife Interactions 9(1)
visiting a few residential properties multiple times per day. All of these collared animals (n = 18) were year-round residents within the city, with no seasonal migration events (McCance 2014). We isolated the residential properties showing the greatest density of deer locations per m2 of property for the first 6 months that the deer were collared. We approached the registered owner of the residential property showing the greatest density of deer location points per m2 for each collared deer to explore further why a select number of residential properties were visited often by the collared white-tailed deer. We asked property owners to
participate in a one-on-one personal interview (n = 14). However, only 11 owners agreed to participate. We used a critical case-study approach that was semi-structured, and we adopted a directive style (Denzin and Lincoln 2003). The interviews were conducted to assess whether residents were engaged in actions that may be attracting deer or whether their residential property offered deer protective cover.
Using the Home Range Extension Function in ArcGIS 9.3 (Rodgers et al. 2007), the high-density, core-use areas (using adaptive kernel density analysis and assessing core areas
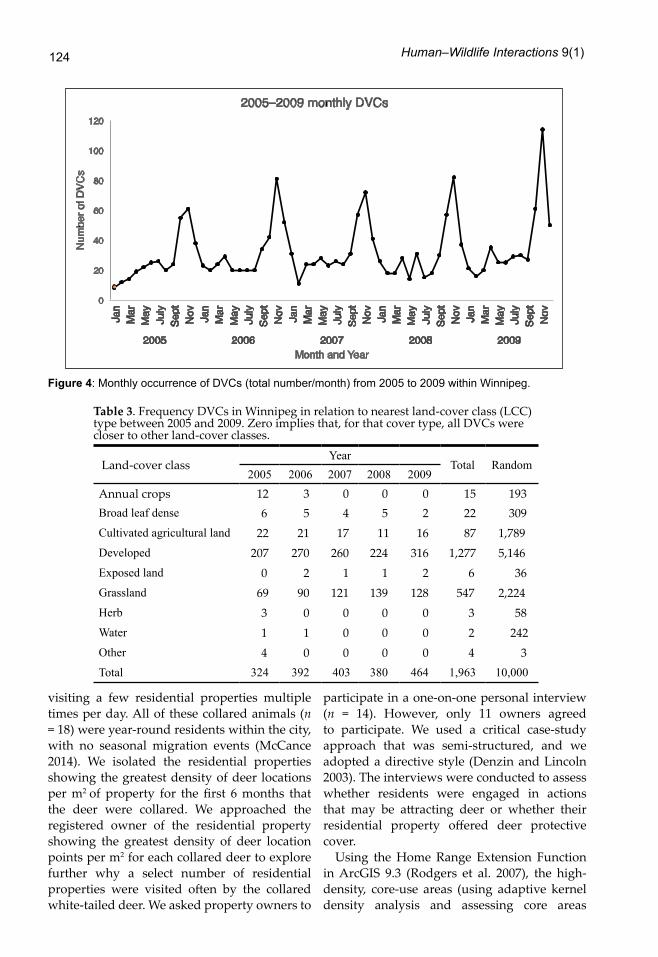
Figure 4: Monthly occurrence of DVCs (total number/month) from 2005 to 2009 within Winnipeg.
Table 3. Frequency DVCs in Winnipeg in relation to nearest land-cover class (LCC) type between 2005 and 2009. Zero implies that, for that cover type, all DVCs were closer to other land-cover classes.
Land-cover classYear
Total Random2005 2006 2007 2008 2009
Annual crops 12 3 0 0 0 15 193Broad leaf dense 6 5 4 5 2 22 309Cultivated agricultural land 22 21 17 11 16 87 1,789Developed 207 270 260 224 316 1,277 5,146Exposed land 0 2 1 1 2 6 36Grassland 69 90 121 139 128 547 2,224Herb 3 0 0 0 0 3 58Water 1 1 0 0 0 2 242Other 4 0 0 0 0 4 3Total 324 392 403 380 464 1,963 10,000
125Urban deer–vehicle collisions • McCance et al.
between the 10 to 70% isopleth) for the deer were mapped in relation to the confirmed cases of DVCs and the confirmed cases of anthropogenic food sources. The latter were identified through personal interviews to assess the locational correlation among deer movement, DVCs, and anthropogenic food sites. We used ArcGIS 9.3 to measure the distance between the DVCs and feeding sites. We then compared these distances to those between DVC sites and 55 random locations. We used Hawth’s Tools of the 11 GPS-collared deer and the confirmed
feed sites associated with these deer, confirmed by the open-ended interviews. A distance-to-feature analysis was conducted between the DVC and the feed site location in comparison to the DVC location and 55 random locations. We used a Wilcox Rank Sum test (R Version 3.0.1) to determine whether DVCs occurred in closer proximity to the feed sites than to the random locations. This research received ap-proval from the Joint-Faculty Research Ethics Board at the University of Manitoba, Protocol number J2009:116. Data gathered from these interviews were transcribed and analyzed.
1-45-1011-1819-2930-52
GF Deer-vehicle collisions 2005-09
GFGFGFGFGFGFGF
GFGF
GF
GFGF
GFGFGFGFGFGF
GFGF
GFGF
GFGF
GF
GFGFGF
GF
GFGF
GF
GFGFGFGFGFGFGFGFGFGFGFGFGFGFGFGF GF
GFGFGFGF
GF
GF GF
GFGF
GF
GFGF
GFGFGFGF
GFGFGF
GF
GFGFGFGFGFGF
GFGF
GFGFGFGFGF
GFGFGFGFGFGF
GFGFGFGFGFGFGF
GF
GFGF GFGFGFGFGF
GF
GF
GFGFGFGFGFGFGF
GF
GF
GF
GFGFGFGFGFGFGFGFGFGF
GF
GFGFGFGFGF
GF
GF
GF
GFGFGFGFGF
GF
GFGFGFGFGFGFGFGFGFGFGFGFGFGFGFGFGFGFGFGFGFGFGFGFGFGFGFGFGFGFGFGFGFGFGFGF
GFGFGFGFGFGFGFGFGFGFGF
GFGFGFGFGFGFGFGFGFGFGFGFGFGF
GFGFGF
GFGFGFGFGFGFGFGFGFGFGFGFGFGFGFGFGFGFGF
GF
GFGFGFGFGFGF
GF
GF
GF
GFGF
GF
GFGF
GFGFGFGFGFGFGFGFGFGFGFGFGFGFGFGFGFGFGFGFGFGFGFGFGFGFGF
GFGF
GFGF
GFGF
GFGFGFGF
GF GFGF GFGFGF
GFGF
GFGFGF
GF
GF
GFGF
GF
GF GF
GFGFGF
GFGF
GFGFGFGFGFGFGF
GFGFGFGFGFGFGFGFGFGFGFGF GFGFGFGF GF
GF
GF
GF GFGFGFGFGF
GF
GFGFGFGFGFGFGFGFGFGFGFGFGFGFGFGFGFGFGFGFGFGFGFGFGF
GF
GF
GF
GFGFGF
GFGF
GF
GFGF
GFGFGFGF
GF
GF
GFGFGF GF
GF
GF
GFGFGF
GFGFGFGFGFGFGFGFGFGFGFGFGFGF
GFGFGFGFGFGFGFGFGF
GFGFGFGFGF
GF
GFGFGF
GFGFGF
GFGFGFGFGFGFGFGFGFGFGF
GF
GF GF GFGFGFGFGF
GF
GF
GF
GFGFGFGFGF
GFGFGFGF
GF
GFGF GFGFGFGF
GFGFGF
GFGFGF
GFGF
GF
GFGF
GF
GF
GFGFGFGF
GFGFGFGF
GFGF
GFGF
GFGF
GFGFGFGFGFGFGFGFGFGFGFGFGFGFGFGFGFGFGFGFGFGFGFGFGFGFGFGFGF
GFGFGFGFGF
GFGF GFGFGFGF GFGFGFGF
GF GFGFGFGFGF
GFGFGF
GF
GFGFGFGFGFGF GF
GFGFGFGFGFGFGF GFGFGFGF
GF
GFGFGF
GF GF
GFGF
GF GF
GFGF
GFGFGFGFGFGF
GFGFGFGF
GF
GFGF
GFGFGFGFGFGF
GFGF
GFGFGF
GFGFGFGFGFGFGFGF GF
GFGFGFGFGF
GF
GF
GF
GF
GFGFGF
GF GFGF
GF
GF
GFGFGF
GFGFGF
GF
GFGFGFGFGFGFGFGFGF
GF GFGF
GF
GFGFGF
GF
GFGFGFGFGFGF GFGFGFGF GFGFGF GFGFGFGFGFGFGFGFGFGFGFGFGF
GFGFGFGFGFGFGF GFGFGF GF
GF
GFGFGFGFGFGFGFGFGFGF GFGFGFGFGFGFGFGFGFGFGFGFGF GF GFGFGFGFGFGFGFGF GFGF GFGFGFGFGFGFGFGFGFGFGFGFGFGFGFGFGF GFGFGFGFGFGFGFGFGFGFGFGFGFGFGFGFGFGFGFGFGFGFGFGFGFGFGFGFGFGFGFGFGFGF GFGFGFGFGFGFGFGFGFGFGFGFGFGFGFGFGFGFGFGFGFGFGFGFGF GFGF
GFGFGFGFGF
GFGF GFGFGFGFGFGFGFGF GFGFGFGFGFGFGFGFGFGFGFGFGFGFGFGFGFGFGFGFGFGFGF
GFGFGF GFGF
GF
GF
GFGFGFGFGFGFGFGFGFGFGFGFGFGFGFGFGF
GFGFGFGFGFGF
GFGFGFGFGFGFGFGF
GF
GF GFGFGFGFGFGFGF GFGFGFGFGFGFGFGF
GFGFGFGF
GF
GFGFGFGF
GF GF
GFGFGFGFGFGFGFGFGFGF
GFGF
GF
GFGFGFGF
GFGF
GFGFGFGFGFGFGFGFGFGFGFGFGFGFGFGFGFGFGFGFGF
GFGFGFGFGFGFGFGFGF
GF
GFGF
GF
GFGF
GFGF
GFGF
GF
GF
GF
GF
GFGFGFGFGFGFGFGFGFGFGFGFGFGFGFGF
GF
GFGFGFGFGFGF
GFGFGF
GFGFGFGFGF
GFGFGFGFGFGFGF
GFGF
GFGFGF
GF
GF
GF
GF
GFGFGFGF GF
GF
GFGFGF
GFGFGF
GFGFGFGF
GF
GFGF
GF
GF GFGF
GF
GF
GFGFGFGFGF GFGFGFGFGFGFGFGFGF
GFGF GF
GF
GFGF GFGFGFGF
GFGFGFGFGFGFGF
GFGF GFGFGFGFGFGFGFGFGFGFGFGF
GF
GF
GF
GFGF
GFGF
GF
GFGFGF
GF
GF
GF
GFGFGFGFGF
GFGF
GF
GF
GFGFGF
GF
GFGF
GF
GF
GFGF
GF
GF
GFGFGFGFGFGF
GFGFGF
GFGFGFGFGFGFGF
GFGFGFGFGFGF
GFGFGFGF
GF
GF
GF
GF
GF GF
GF
GF GF
GF
GFGF
GF
GFGFGFGF
GF
GF
GFGF
GF
GFGFGFGFGFGFGFGFGFGFGF
GFGF
GFGFGFGFGFGFGFGF
GF
GF
GFGFGFGFGFGFGFGFGFGFGF
GF
GF
GF
GF
GF
GFGF
GFGF
GF
GF GFGFGFGFGFGF GFGFGF
GFGF
GFGFGFGFGFGFGFGFGFGFGFGFGFGFGFGF
GFGF
GF
GFGF
GFGFGF
GFGF
GFGF GF
GFGFGFGF GFGF GFGF
GFGF
GF
GFGFGFGF
GFGF
GF
GF
GFGFGF
GFGF
GFGFGFGFGFGFGFGFGFGF
GFGFGF
GF
GFGFGFGF
GFGFGFGFGFGFGFGF
GFGF
GFGF
GF
GFGF
GFGFGFGF
GFGFGFGFGF
GFGF
GF
GFGF
GF
GF
GFGFGFGFGFGFGF GFGFGFGFGFGFGFGFGFGFGFGFGFGFGFGFGFGFGFGFGFGFGFGF
GFGFGF
GFGFGFGFGFGFGFGFGFGF
GF
GFGFGF
GF
GF
GF
GF
GF
GF
GFGFGF
GF
GF
GFGF GFGFGF
GF
GF
GF
GFGF
GF
GFGFGF
GF
GFGF
GFGFGF
GF
GF
GFGFGFGF GFGFGF
GFGFGF
GFGFGF
GF
GF
GFGFGFGFGFGFGFGFGFGFGFGFGFGFGFGFGFGFGFGFGFGFGFGF
GFGFGFGFGFGFGF
GFGFGFGF
GFGF
GFGFGF
GF
GF
GF
GF
GFGF
GFGF
GFGF
GF
GF
GF
GF GFGFGFGFGFGFGFGFGFGFGFGFGFGFGFGFGFGFGFGFGFGFGFGFGFGFGFGFGFGFGFGFGFGFGFGFGFGF
GF
GFGF
GFGFGFGFGFGFGFGFGFGFGFGFGFGFGFGFGFGFGFGFGFGFGFGFGFGFGFGFGFGFGFGFGFGFGFGFGFGFGFGFGFGFGFGFGFGFGFGFGFGF
GF
GF
GFGFGF
GF
GF
GF
GFGF
GF
GFGF
GFGF
GFGF
GFGFGFGFGFGFGFGFGF
GFGF
GF
GFGF
GFGFGF
GFGFGF
GF
GFGFGFGF
GFGFGF GFGFGFGF
GF
GF
GF
GF
GF
GF
GF
GFGF
GFGF
GFGF
GF
GF
GFGF
GFGFGF
GF
GFGFGFGFGFGF
GFGF
GF
GF
GF
GFGFGFGF
GFGF
GF
GF
GF
GFGFGFGFGF
GFGF
GF
GFGFGFGF
GF
GFGF
GFGFGFGFGFGFGFGF
GFGFGFGFGFGF
GF
GF
GF
GFGFGFGFGFGFGFGFGFGFGF
GFGFGFGFGFGFGFGF
GFGF
GFGFGF
GF
GF
GFGFGFGFGFGFGF
GF
GFGFGFGF
GF
GFGFGFGFGFGFGFGFGFGFGF
GF
GFGFGFGFGFGFGFGFGFGFGF
GFGFGFGF GF
GFGFGFGFGFGFGFGFGFGFGFGFGFGFGFGFGFGFGFGFGFGFGFGFGFGFGFGFGFGFGFGFGFGFGFGFGFGFGFGFGFGFGFGFGFGFGFGF
GF
GFGFGF
GF
GFGF
GFGFGFGF
GFGFGF
GFGFGFGFGFGFGFGF
GF
GFGFGF
GFGFGFGFGFGF
GF
GFGFGFGFGFGFGFGF
GFGFGFGF
GFGFGFGFGF
GFGFGFGFGFGF
GF
GF
GFGFGF
GF
GFGFGF GFGF
GF
GFGF
GF
GFGF
GF
GF
GFGF
GF
GF
GF
GFGFGFGF
GFGF
GF GFGF GFGFGFGFGFGFGFGFGFGF
GF
GF
GF
GF
GFGF
GF
GF
GFGFGFGFGF
GFGF
GFGF
GFGFGFGFGFGFGF
GF
GF
GFGF
GFGF
GFGFGFGF
GFGFGFGFGF
GF
GFGFGF
GFGFGFGF
GF
GF
GFGFGF
GF
GF GF
GF
GF
GF
GF
GF
GF
GF
GF
GFGF
GF
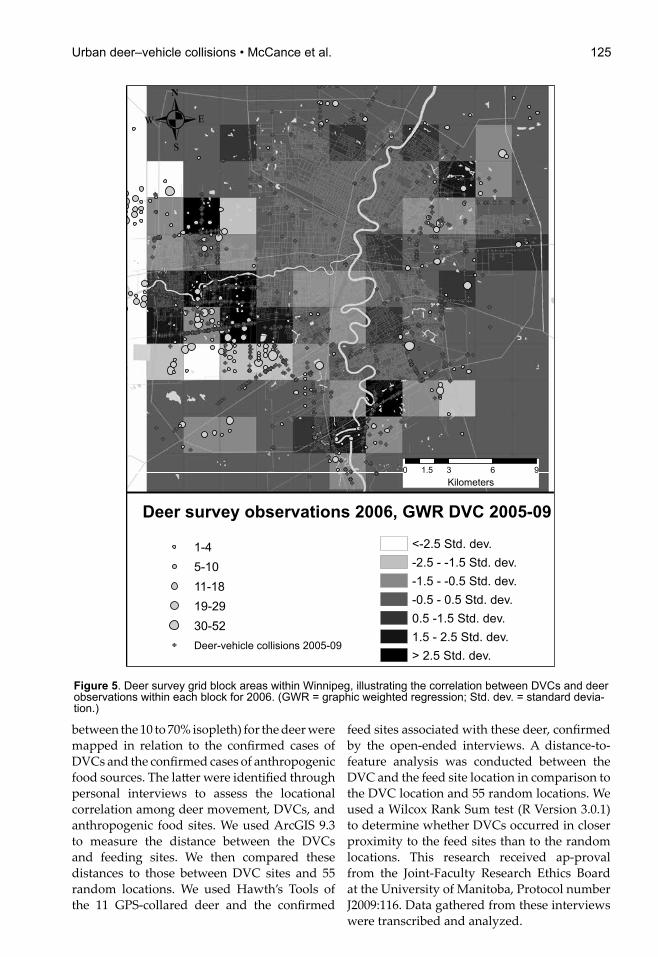
Deer survey observations 2006, GWR DVC 2005-09
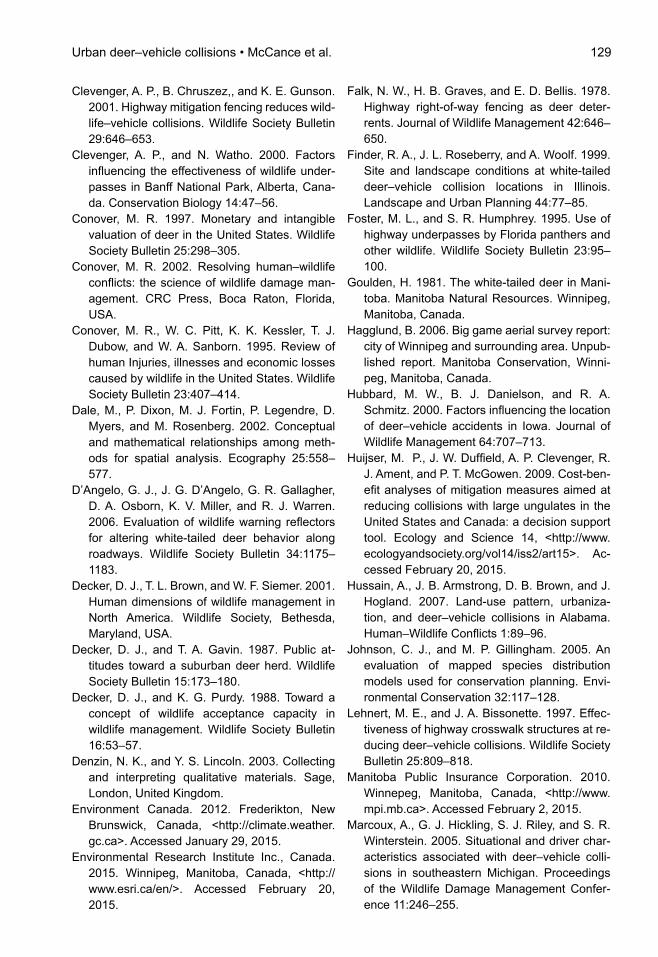
<-2.5 Std. dev.-2.5 - -1.5 Std. dev.-1.5 - -0.5 Std. dev.-0.5 - 0.5 Std. dev.0.5 -1.5 Std. dev.1.5 - 2.5 Std. dev.> 2.5 Std. dev.
0 3 6 91.5Kilometers
.
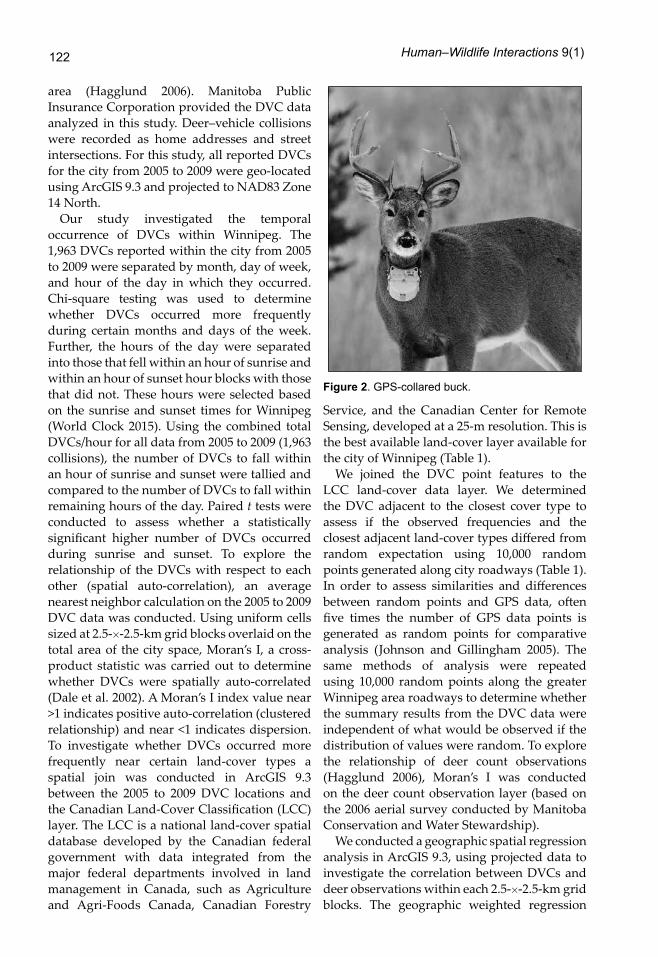
Figure 5. Deer survey grid block areas within Winnipeg, illustrating the correlation between DVCs and deer observations within each block for 2006. (GWR = graphic weighted regression; Std. dev. = standard devia-tion.)
126 Human–Wildlife Interactions 9(1)
ResultsThere were 324, 392, 403, 380, and 464
DVCs annually reported to MPIC between 2005 and 2009 respectively (1,963 total; Figure 3). Occurrence of DVCs peaked during fall, coinciding with the deer rutting season. There were not any significant differences among days of the week (Figure 4).
Thirty-two of the DVCs occurred during the hour of sunrise and the hour of sunset. If the DVCs were evenly distributed over the 24 hour
period of a day, each hour would account for 4% of the total number of DVCs. More DVCs occurred within an hour of sunrise and sunset than during the remaining hours of the day (P = 0.003914).
Based on average nearest-neighbor tests, DVCs were clustered and not randomly dispersed with a Z score of -57.54, observed mean distance/expected mean distance of 0.28, and a significance level of 0.01. Given the average nearest neighbor index (average nearest
_̂
_̂_̂̂_̂_
_̂̂_ _̂
_̂̂_
_̂̂_̂__̂_̂
_̂̂_̂_̂_̂_̂_
_̂
_̂ _̂
_̂
_̂
_̂
_̂_̂
_̂ _̂
_̂̂__̂
_̂
_̂ _̂
_̂
_̂̂_
_̂
_̂̂_̂_
_̂
_̂̂_̂_
_̂_̂ _̂
_̂̂_
_̂̂__̂ _̂_̂̂_̂_̂_
_̂̂_
_̂
_̂_̂̂_̂_
_̂
_̂_̂_̂̂__̂_̂
_̂_̂̂_
_̂_̂_̂̂__̂_̂
_̂
_̂
_̂_̂̂_̂_̂_̂_̂_̂_̂_̂_̂__̂
_̂_̂̂_ _̂ _̂ _̂̂_̂__̂ _̂_̂_̂_̂̂_
_̂
_̂̂_̂_̂__̂̂_̂_̂_̂_̂_̂_̂_̂_̂_̂_̂_̂_̂_̂_̂__̂_̂̂_̂_̂__̂̂_̂_̂__̂̂_̂_̂_̂_̂_̂_̂_̂_̂_̂_̂_
_̂̂_̂_
_̂
_̂
_̂
_̂̂_̂_
_̂
_̂
_̂̂__̂̂_ _̂̂_̂_̂_̂_ _̂̂_̂_̂_
_̂̂_ _̂
_̂̂_̂_̂_̂_̂_
_̂̂_̂_̂_̂_̂_ _̂
_̂̂_̂_
_̂
_̂
_̂
_̂
_̂
_̂̂_̂_̂_̂_̂_̂_̂_̂__̂
_̂
_̂
_̂̂_̂_
_̂
_̂
_̂̂_̂_̂_̂_
_̂
_̂
_̂̂_̂_̂_̂_̂_̂_
_̂_̂
_̂̂__̂̂_̂_̂_̂_̂_̂_̂_̂_̂_̂_̂_̂_
_̂_̂̂__̂
_̂
_̂̂_̂_
_̂
_̂_̂̂_̂_
_̂ _̂̂_̂_̂_̂__̂
_̂
_̂̂_̂_̂_̂_̂_̂_̂_̂_̂_̂_̂_̂_̂_̂_̂_̂_̂_̂_̂_̂_̂_̂_̂_̂_̂_̂_̂_̂_̂_̂_̂_̂_̂_̂_
_̂_̂ _̂̂_̂_̂_̂_̂_̂_̂_̂_̂_̂_̂_̂_̂_̂_̂_̂__̂_̂̂_̂_̂_̂_̂_̂_̂_̂_̂_̂_̂_̂_̂_̂_̂_̂_̂_̂_̂_̂_̂_̂_̂_̂_̂_̂_̂_̂_̂_
_̂
_̂̂_
_̂̂_̂__̂
_̂
_̂_̂ _̂_̂ _̂
_̂
_̂
_̂_̂̂_̂_̂_̂_
_̂̂_̂_̂_
_̂
_̂
_̂_̂
_̂̂__̂
_̂
_̂
_̂
_̂
_̂
_̂_̂
_̂
_̂
_̂
_̂
_̂
#0
#0
#0
#0#0
#0
#0
#0
#0
#0
#0
#0
#0
#0
#0
#0#0
.
0 400 800 1,200200Meters
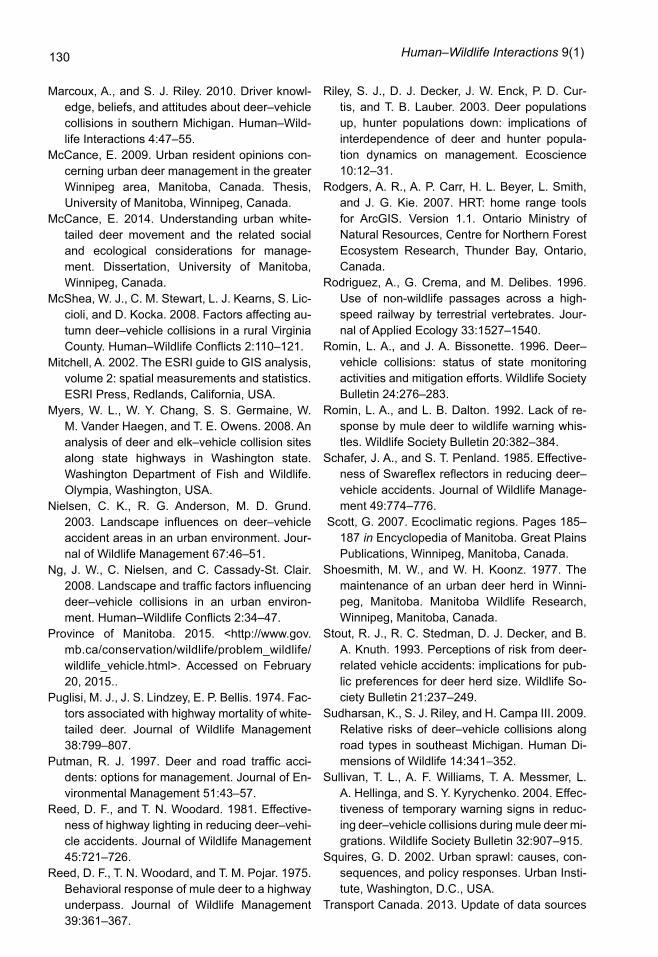
GPS kernel volume10-20%20-40%40-50%50-70%
#0 Feed sites_̂ Deer-vehicle collisions 2005-2009
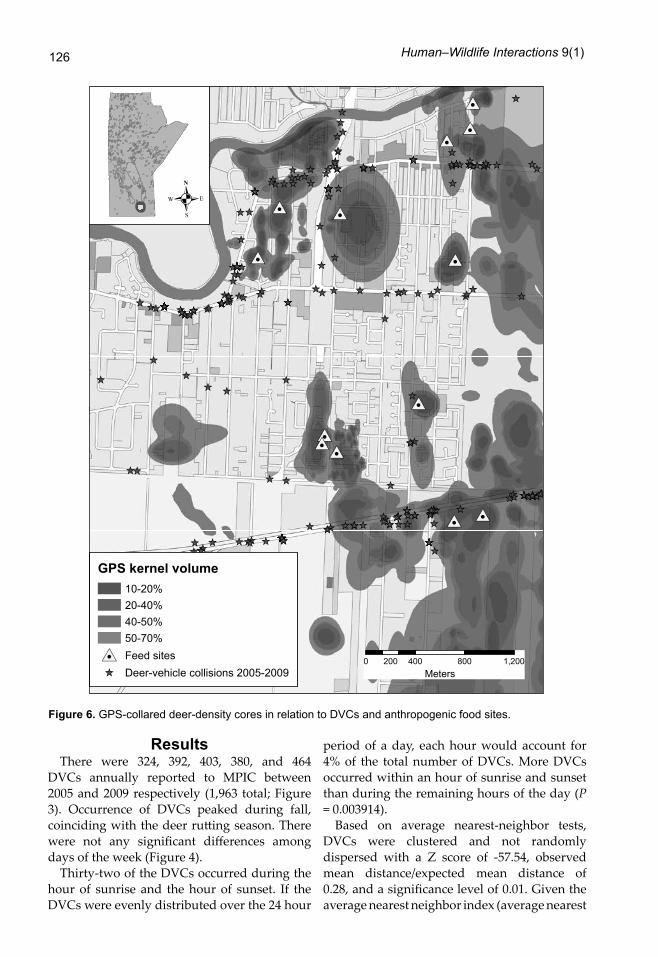
Figure 6. GPS-collared deer-density cores in relation to DVCs and anthropogenic food sites.
127Urban deer–vehicle collisions • McCance et al.
neighbor ratio) was <1, the pattern exhibits clustering. Similarly, using the 2.5--2.5-km grid block approach, DVCs were clustered, with a Moran’s I index of 0.47, Z score of 8.14 and significance level of 0.01.
Most (93%) of the DVCs during 2005 to 2009 occurred adjacent to developed or grassland-cover types (Table 3). The LCC layer and the random points comparison indicated that the 3 habitat types in closest proximity to the random points were developed land (51.5%), grasslands (22%), and cultivated agricultural land (17.9%).
There was a statistically significant difference between DVC proximity to the various LCC types compared and the random points (χ² = 422.02, df = 8, P = 0.0001). Results support that DVCs have a higher probability of occurring near developed land or grassland land-cover types. The locations of white-tailed deer within Winnipeg were clustered at the time they were identified during the 2006 deer survey using a Moran’s I index of 0.11, a Z score of 5.37, and a significance level of 0.01 (Figure 5).
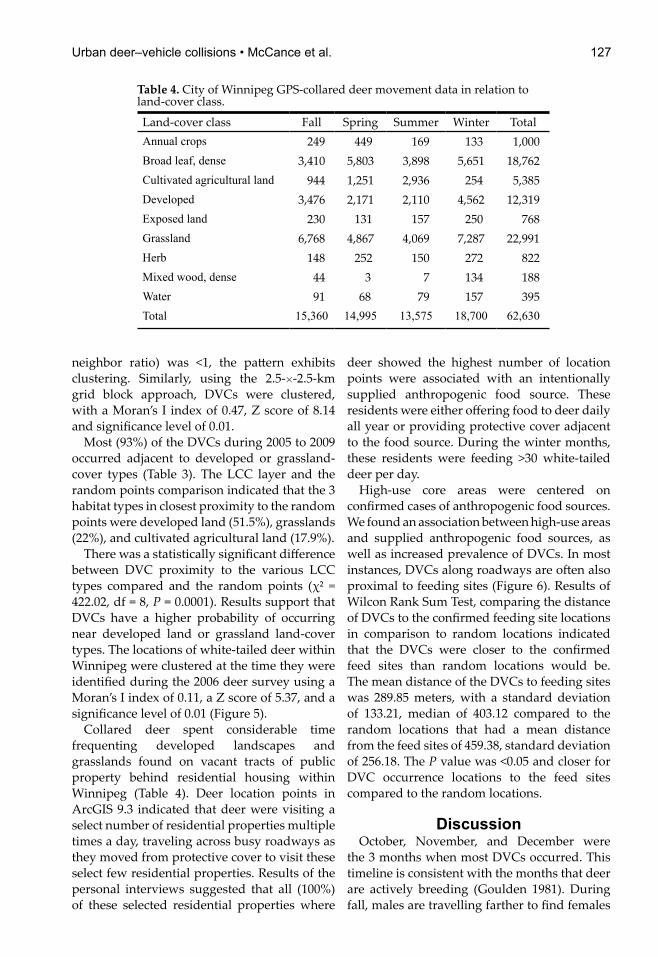
Collared deer spent considerable time frequenting developed landscapes and grasslands found on vacant tracts of public property behind residential housing within Winnipeg (Table 4). Deer location points in ArcGIS 9.3 indicated that deer were visiting a select number of residential properties multiple times a day, traveling across busy roadways as they moved from protective cover to visit these select few residential properties. Results of the personal interviews suggested that all (100%) of these selected residential properties where
deer showed the highest number of location points were associated with an intentionally supplied anthropogenic food source. These residents were either offering food to deer daily all year or providing protective cover adjacent to the food source. During the winter months, these residents were feeding >30 white-tailed deer per day.
High-use core areas were centered on confirmed cases of anthropogenic food sources. We found an association between high-use areas and supplied anthropogenic food sources, as well as increased prevalence of DVCs. In most instances, DVCs along roadways are often also proximal to feeding sites (Figure 6). Results of Wilcon Rank Sum Test, comparing the distance of DVCs to the confirmed feeding site locations in comparison to random locations indicated that the DVCs were closer to the confirmed feed sites than random locations would be. The mean distance of the DVCs to feeding sites was 289.85 meters, with a standard deviation of 133.21, median of 403.12 compared to the random locations that had a mean distance from the feed sites of 459.38, standard deviation of 256.18. The P value was <0.05 and closer for DVC occurrence locations to the feed sites compared to the random locations.
DiscussionOctober, November, and December were
the 3 months when most DVCs occurred. This timeline is consistent with the months that deer are actively breeding (Goulden 1981). During fall, males are travelling farther to find females
Table 4. City of Winnipeg GPS-collared deer movement data in relation to land-cover class.
Land-cover class Fall Spring Summer Winter TotalAnnual crops 249 449 169 133 1,000Broad leaf, dense 3,410 5,803 3,898 5,651 18,762Cultivated agricultural land 944 1,251 2,936 254 5,385Developed 3,476 2,171 2,110 4,562 12,319Exposed land 230 131 157 250 768Grassland 6,768 4,867 4,069 7,287 22,991Herb 148 252 150 272 822Mixed wood, dense 44 3 7 134 188Water 91 68 79 157 395Total 15,360 14,995 13,575 18,700 62,630
128 Human–Wildlife Interactions 9(1)
in estrus, and males looking to breed may “push” females (Beier and McCullough 1990). Similar findings in regard to DVC occurrences during the fall months were documented in Iowa by Hubbard et al. (2000) and in Edmonton, Alberta, Canada, by Ng et al. (2008).
We found a higher occurrence of DVCs during sunrise and sunset. This is not surprising given that white-tail deer are most active during dawn and dusk (Beier and McCullough 1990). Our results are consistent with the earlier works of Bashore et al. (1985), Hubbard et al. (2000), and Nielsen et al. (2003). We documented that DVCs were not spatially random within the city.
Most DVCs in our study area were adjacent to developed or grasslands cover types. Sudharsan et al. (2009) and Myers et al. (2008) found that a higher probability of DVCs occur near heavily populated and agricultural areas. Deer–vehicle collisions were associated with grasslands and wooded areas (Myers et al. 2008). Similarly, other researchers have found a higher occurrence of DVCs near woodlots (Finder et al. 1999, Hussain et al. 2007). However, in our study, increased numbers of DVCs were more associated with developed land cover than woodlots, suggesting perhaps that, for Winnipeg’s urban deer, protective cover and food requirements are being met readily within developed landscapes.
We also found that deer density is heavily influenced by sites where people provide food for them. Deer–vehicle collisions were clustered around these feeding sites. Sudharsan et al. (2009) also found connectivity between high DVC roadways and landscape types where deer access a food source; however, in their research, these collisions were associated with agricultural crops.
Management implicationsOur the results indicate that urban DVCs are
positively correlated to deer density, certain land-cover types, and that they occur more frequently during certain times of the day and months of the year. Deer–vehicle collisions are often located near where people intentionally feed deer. Therefore, the human behavior of providing anthropogenic food sources to urban deer may be influencing DVC location and frequency in Winnipeg. Management strategies, such as a feeding ban, aimed at
reducing the availability of intentionally supplied anthropogenic food within the city may be useful. Management strategies should be specifically designed to focus during the times of day and year when a higher number of DVCs occur. Localized management near key habitat types that are associated with higher numbers of DVCs should be considered.
AcknowledgmentsWe thank Manitoba Public Insurance
Corporation and Manitoba Conservation and Water Stewardship for their support and collaboration in this research, specifically S. Ekdahl and B. Joynt. Thank you is also graciously extended to Tim Davis for his GIS assistance throughout this process.
Literature citedAllen, R. E., and D. R. McCullough. 1976. Deer–
car accidents in southern Michigan. Journal of Wildlife Management 40:317–325.
Alverson, W. S., D. M. Waller, and S. L. Solheim. 1988. Forests too deer: edge effects in northern Wisconsin. Conservation Biology 2:348–358.
Bashore, T. L., W. M. Tzilkowski, and E. D. Bellis. 1985. Analysis of deer–vehicle collision sites in Pennsylvania. Journal of Wildlife Management 49:769–774.
Beier, P., and D. R. McCullough. 1990. Factors in-fluencing white-tailed deer activity patterns and habitat use. Wildlife Monographs 54:1–51.
Bissonette J. A., C. A. Kassar, and L. J. Cook. 2008. Assessment of costs associated with deer–vehicle collisions: human death and in-jury, vehicle damage, and deer loss. Human–wildlife Conflicts 2:17–27.
Brown, T. L., D. J. Decker, S. J. Riley, J. W. Enck, T. B. Lauber, P. D. Curtis, and G. F. Mattfeld. 2000. The future of hunting as a mechanism to control white-tailed deer populations. Wildlife Society Bulletin 28:797–807.
Carbaugh, B., J. P. Vaughan, E. D. Bellis, and H. B. Graves. 1975. Distribution and activity of white-tailed deer along an interstate highway. Journal of Wildlife Management 39:570–581.
Case, R. M. 1978. Interstate highway road-killed animals: a data source for biologists. Wildlife Society Bulletin 6:8–13.
Census of Canada. 2011. Statistics Canada, <http://www12.statcan.ca/census-recense-ment/index-eng.cfm>. Accessed January 29, 2015.
129Urban deer–vehicle collisions • McCance et al.
Clevenger, A. P., B. Chruszez,, and K. E. Gunson. 2001. Highway mitigation fencing reduces wild-life–vehicle collisions. Wildlife Society Bulletin 29:646–653.
Clevenger, A. P., and N. Watho. 2000. Factors influencing the effectiveness of wildlife under-passes in Banff National Park, Alberta, Cana-da. Conservation Biology 14:47–56.
Conover, M. R. 1997. Monetary and intangible valuation of deer in the United States. Wildlife Society Bulletin 25:298–305.
Conover, M. R. 2002. Resolving human–wildlife conflicts: the science of wildlife damage man-agement. CRC Press, Boca Raton, Florida, USA.
Conover, M. R., W. C. Pitt, K. K. Kessler, T. J. Dubow, and W. A. Sanborn. 1995. Review of human Injuries, illnesses and economic losses caused by wildlife in the United States. Wildlife Society Bulletin 23:407–414.
Dale, M., P. Dixon, M. J. Fortin, P. Legendre, D. Myers, and M. Rosenberg. 2002. Conceptual and mathematical relationships among meth-ods for spatial analysis. Ecography 25:558–577.
D’Angelo, G. J., J. G. D’Angelo, G. R. Gallagher, D. A. Osborn, K. V. Miller, and R. J. Warren. 2006. Evaluation of wildlife warning reflectors for altering white-tailed deer behavior along roadways. Wildlife Society Bulletin 34:1175–1183.
Decker, D. J., T. L. Brown, and W. F. Siemer. 2001. Human dimensions of wildlife management in North America. Wildlife Society, Bethesda, Maryland, USA.
Decker, D. J., and T. A. Gavin. 1987. Public at-titudes toward a suburban deer herd. Wildlife Society Bulletin 15:173–180.
Decker, D. J., and K. G. Purdy. 1988. Toward a concept of wildlife acceptance capacity in wildlife management. Wildlife Society Bulletin 16:53–57.
Denzin, N. K., and Y. S. Lincoln. 2003. Collecting and interpreting qualitative materials. Sage, London, United Kingdom.
Environment Canada. 2012. Frederikton, New Brunswick, Canada, <http://climate.weather.gc.ca>. Accessed January 29, 2015.
Environmental Research Institute Inc., Canada. 2015. Winnipeg, Manitoba, Canada, <http://www.esri.ca/en/>. Accessed February 20, 2015.
Falk, N. W., H. B. Graves, and E. D. Bellis. 1978. Highway right-of-way fencing as deer deter-rents. Journal of Wildlife Management 42:646–650.
Finder, R. A., J. L. Roseberry, and A. Woolf. 1999. Site and landscape conditions at white-tailed deer–vehicle collision locations in Illinois. Landscape and Urban Planning 44:77–85.
Foster, M. L., and S. R. Humphrey. 1995. Use of highway underpasses by Florida panthers and other wildlife. Wildlife Society Bulletin 23:95–100.
Goulden, H. 1981. The white-tailed deer in Mani-toba. Manitoba Natural Resources. Winnipeg, Manitoba, Canada.
Hagglund, B. 2006. Big game aerial survey report: city of Winnipeg and surrounding area. Unpub-lished report. Manitoba Conservation, Winni-peg, Manitoba, Canada.
Hubbard, M. W., B. J. Danielson, and R. A. Schmitz. 2000. Factors influencing the location of deer–vehicle accidents in Iowa. Journal of Wildlife Management 64:707–713.
Huijser, M. P., J. W. Duffield, A. P. Clevenger, R. J. Ament, and P. T. McGowen. 2009. Cost-ben-efit analyses of mitigation measures aimed at reducing collisions with large ungulates in the United States and Canada: a decision support tool. Ecology and Science 14, <http://www.ecologyandsociety.org/vol14/iss2/art15>. Ac-cessed February 20, 2015.
Hussain, A., J. B. Armstrong, D. B. Brown, and J. Hogland. 2007. Land-use pattern, urbaniza-tion, and deer–vehicle collisions in Alabama. Human–Wildlife Conflicts 1:89–96.
Johnson, C. J., and M. P. Gillingham. 2005. An evaluation of mapped species distribution models used for conservation planning. Envi-ronmental Conservation 32:117–128.
Lehnert, M. E., and J. A. Bissonette. 1997. Effec-tiveness of highway crosswalk structures at re-ducing deer–vehicle collisions. Wildlife Society Bulletin 25:809–818.
Manitoba Public Insurance Corporation. 2010. Winnepeg, Manitoba, Canada, <http://www.mpi.mb.ca>. Accessed February 2, 2015.
Marcoux, A., G. J. Hickling, S. J. Riley, and S. R. Winterstein. 2005. Situational and driver char-acteristics associated with deer–vehicle colli-sions in southeastern Michigan. Proceedings of the Wildlife Damage Management Confer-ence 11:246–255.
130 Human–Wildlife Interactions 9(1)
Marcoux, A., and S. J. Riley. 2010. Driver knowl-edge, beliefs, and attitudes about deer–vehicle collisions in southern Michigan. Human–Wild-life Interactions 4:47–55.
McCance, E. 2009. Urban resident opinions con-cerning urban deer management in the greater Winnipeg area, Manitoba, Canada. Thesis, University of Manitoba, Winnipeg, Canada.
McCance, E. 2014. Understanding urban white-tailed deer movement and the related social and ecological considerations for manage-ment. Dissertation, University of Manitoba, Winnipeg, Canada.
McShea, W. J., C. M. Stewart, L. J. Kearns, S. Lic-cioli, and D. Kocka. 2008. Factors affecting au-tumn deer–vehicle collisions in a rural Virginia County. Human–Wildlife Conflicts 2:110–121.
Mitchell, A. 2002. The ESRI guide to GIS analysis, volume 2: spatial measurements and statistics. ESRI Press, Redlands, California, USA.
Myers, W. L., W. Y. Chang, S. S. Germaine, W. M. Vander Haegen, and T. E. Owens. 2008. An analysis of deer and elk–vehicle collision sites along state highways in Washington state. Washington Department of Fish and Wildlife. Olympia, Washington, USA.
Nielsen, C. K., R. G. Anderson, M. D. Grund. 2003. Landscape influences on deer–vehicle accident areas in an urban environment. Jour-nal of Wildlife Management 67:46–51.
Ng, J. W., C. Nielsen, and C. Cassady-St. Clair. 2008. Landscape and traffic factors influencing deer–vehicle collisions in an urban environ-ment. Human–Wildlife Conflicts 2:34–47.
Province of Manitoba. 2015. <http://www.gov.mb.ca/conservation/wildlife/problem_wildlife/wildlife_vehicle.html>. Accessed on February 20, 2015..
Puglisi, M. J., J. S. Lindzey, E. P. Bellis. 1974. Fac-tors associated with highway mortality of white-tailed deer. Journal of Wildlife Management 38:799–807.
Putman, R. J. 1997. Deer and road traffic acci-dents: options for management. Journal of En-vironmental Management 51:43–57.
Reed, D. F., and T. N. Woodard. 1981. Effective-ness of highway lighting in reducing deer–vehi-cle accidents. Journal of Wildlife Management 45:721–726.
Reed, D. F., T. N. Woodard, and T. M. Pojar. 1975. Behavioral response of mule deer to a highway underpass. Journal of Wildlife Management 39:361–367.
Riley, S. J., D. J. Decker, J. W. Enck, P. D. Cur-tis, and T. B. Lauber. 2003. Deer populations up, hunter populations down: implications of interdependence of deer and hunter popula-tion dynamics on management. Ecoscience 10:12–31.
Rodgers, A. R., A. P. Carr, H. L. Beyer, L. Smith, and J. G. Kie. 2007. HRT: home range tools for ArcGIS. Version 1.1. Ontario Ministry of Natural Resources, Centre for Northern Forest Ecosystem Research, Thunder Bay, Ontario, Canada.
Rodriguez, A., G. Crema, and M. Delibes. 1996. Use of non-wildlife passages across a high-speed railway by terrestrial vertebrates. Jour-nal of Applied Ecology 33:1527–1540.
Romin, L. A., and J. A. Bissonette. 1996. Deer–vehicle collisions: status of state monitoring activities and mitigation efforts. Wildlife Society Bulletin 24:276–283.
Romin, L. A., and L. B. Dalton. 1992. Lack of re-sponse by mule deer to wildlife warning whis-tles. Wildlife Society Bulletin 20:382–384.
Schafer, J. A., and S. T. Penland. 1985. Effective-ness of Swareflex reflectors in reducing deer–vehicle accidents. Journal of Wildlife Manage-ment 49:774–776.
Scott, G. 2007. Ecoclimatic regions. Pages 185–187 in Encyclopedia of Manitoba. Great Plains Publications, Winnipeg, Manitoba, Canada.
Shoesmith, M. W., and W. H. Koonz. 1977. The maintenance of an urban deer herd in Winni-peg, Manitoba. Manitoba Wildlife Research, Winnipeg, Manitoba, Canada.
Stout, R. J., R. C. Stedman, D. J. Decker, and B. A. Knuth. 1993. Perceptions of risk from deer-related vehicle accidents: implications for pub-lic preferences for deer herd size. Wildlife So-ciety Bulletin 21:237–249.
Sudharsan, K., S. J. Riley, and H. Campa III. 2009. Relative risks of deer–vehicle collisions along road types in southeast Michigan. Human Di-mensions of Wildlife 14:341–352.
Sullivan, T. L., A. F. Williams, T. A. Messmer, L. A. Hellinga, and S. Y. Kyrychenko. 2004. Effec-tiveness of temporary warning signs in reduc-ing deer–vehicle collisions during mule deer mi-grations. Wildlife Society Bulletin 32:907–915.
Squires, G. D. 2002. Urban sprawl: causes, con-sequences, and policy responses. Urban Insti-tute, Washington, D.C., USA.
Transport Canada. 2013. Update of data sources
131Urban deer–vehicle collisions • McCance et al.
erin C. MCCanCe is a partner, project man-ager, and wildlife biologist at Joro Consultants, an
Environmental Consulting Firm that focuses primarily on the biophysical environment. She received her Ph. D. degree from the University of Manitoba (2014) and has worked on several large-scale develop-ment projects, assessing the potential impacts of develop-ment on wildlife, creating
mitigation strategies, and monitoring for predicted effects. She also is a sessional instructor at the Uni-versity of Manitoba, teaching courses in ecosystem management, biogeography, animal geographies, and others.
riChard k. BaydaCk is professor and chair of environmental science and studies at the
University of Manitoba, where he has been on faculty since 1979. He received his Ph.D. degree from the University of Colorado 1986. He has held a number of academic admin-istrative positions at the Uni-versity of Manitoba, including associate dean (academic) of the Clayton H. Riddell Faculty of Environment, Earth, and
Resources; acting head of the Department of Envi-ronment and Geography; associate director of the Natural Resources Institute; chair of the University senate committee on awards; and graduate chair of the Department of Environment and Geography and Natural Resources Institute. He was recently elected 2014–2015 president of the Wildlife Society. He is chair of the annual conference of the Wildlife Society to be held in Winnipeg in October 2015 and co-chair of the International Wildlife Management Congress to be held in Sapporo, Japan, in July 2015.
derek n. leask, is a wildlife biologist and geomatics manager at Joro Consultants, an Envi-
ronmental Consulting Firm that focuses primarily on the biophysical environment. His background includes years of experience working in fisheries, as well as research on terrestrial mammals. He oversees spatial database management systems and has significant skills in GIS technology and analysis
including GIS collars and software. He has years of experience in conducting various forms of biophysi-cal field studies including aerial tracking, telemetry, and recruitment surveys for caribou and wolves, aerial and ground-based surveys for furbearers, and trail camera studies aimed at monitoring ungulate and furbearer populations.
david J. walker specializes in geomatics (GIS, remote sensing, and spatial statistics) and
has experience in statistical analysis of complex physical and human geography data sets. He received his Ph.D. degree from the University of Manitoba (2002). He is a quantitative, terres-trial ecologist with research programs in the Canadian boreal forest and temper-ate grassland, as well as
international projects in the tropics and subtropics. His research interests are primarily in landscape systems, including invasive species research, geographic information systems, data integration and modeling, and spatial methods.
on collisions involving motor vehicles and large animals in Canada, L-P Tardif and Associates Inc. Nepean, Ontario, Canada. <http://www.tc.gc.ca/eng/motorvehiclesafety/tp-tp14798-menu-160.htm >. Accessed February 20, 2015.
Widenmaier, K., and L. Fahrig. 2005. Inferring white-tailed deer (Odocoileus virginianus) population dynamics from wildlife–vehicle col-lisions in the city of Ottawa. Pages 589–602 in Proceedings of the 2005 International Con-ference on Ecology and Transportation, North Carolina State University, Raleigh, North Caro-lina, USA.
Wood, P., and M. L. Wolfe. 1988. Intercept feed-ing as a means of reducing deer–vehicle colli-sions. Wildlife Society Bulletin 16:376–380.
World Clock. 2012. Time and date AS, Stavanger, Norway, <http://www.timeanddate.com/world-clock>. Accessed January 29, 2015.
Related Documents


