Spatial and interspecific variability in phenological responses to warming temperatures Richard B. Primack a , Inés Ibáñez b, * , Hiroyoshi Higuchi c , Sang Don Lee d , Abraham J. Miller-Rushing a,e,f , Adam M. Wilson g , John A. Silander Jr. g a Department of Biology, Boston University, Boston, MA 02215, USA b School of Natural Resources and Environment, University of Michigan, Ann Arbor, MI 48109, USA c Laboratory of Biodiversity Science, University of Tokyo, Tokyo 113-8657, Japan d Department of Environmental Science and Engineering, Ewha Woman’s University, Seoul 120-750, Republic of Korea e The Wildlife Society, Bethesda, MD 20814, USA f USA National Phenology Network, Tucson, AZ 85721, USA g Department of Ecology and Evolutionary Biology, University of Connecticut, Storrs, Connecticut 06269, USA article info Article history: Received 13 May 2009 Received in revised form 1 June 2009 Accepted 2 June 2009 Available online xxxx Keywords: Animal phenology Climate change East Asia Geographic differences Global warning Hierarchical Bayes Plant phenology Spatial variability abstract A comprehensive understanding of species phenological responses to global warming will require obser- vations that are both long-term and spatially extensive. Here we present an analysis of the spring phe- nological response to climate variation of twelve taxa: six plants, three birds, a frog, and two insects. Phenology was monitored using standardized protocols at 176 meteorological stations in Japan and South Korea from 1953 to 2005, and in some cases even longer. We developed a hierarchical Bayesian model to examine the complex interactions of temperature, site effects, and latitude on phenology. Results show species-specific variation in the magnitude and even in the direction of their responses to increasing tem- perature, which also differ from site-to-site. At most sites the differences in phenology among species are forecast to become greater with warmer temperatures. Our results challenge the assertion that trends in one geographic region can be extrapolated to others, and emphasize the idiosyncratic nature of the spe- cies response to global warming. Field studies are needed to determine how these patterns of variation in species response to climate change affect species interactions and the ability to persist in a changing climate. Ó 2009 Elsevier Ltd. All rights reserved. 1. Introduction Phenological dynamics have been recognized as key attributes of plants and animals that are being affected by a warming climate (Parmesan and Yohe, 2003; Root et al., 2003; Cleland et al., 2007; Parmesan, 2007). As a result of rising temperatures, many plant species are leafing out and flowering earlier in the spring, many animals are active earlier, and many migratory birds are arriving earlier at points along their spring migration routes (e.g., Both et al., 2006; Inouye et al., 2000; Fitter and Fitter, 2002; Cotton, 2003; Miller-Rushing and Primack, 2008). However, the changes vary considerably among species; some species are changing dra- matically while other are not changing at all (Fitter and Fitter, 2002; Lehikoinen et al., 2006; Sherry et al., 2007; Miller-Rushing and Primack, 2008). Knowing a particular species’ response to glo- bal warming in the context of its surrounding environment will be crucial for the assessment of the effects of climate change on its populations, the communities to which it belongs, and biodiversity in general. Given data constraints, most phenological studies focus on one or a few species in one or a few sites. More comprehensive studies may include a community of species at one site or examine a single species over a wider geographical area (e.g., Sparks and Carey, 1995; Dunn and Winkler, 1999; Fitter and Fitter, 2002; Doi, 2007; Miller-Rushing and Primack, 2008). However, groups of spe- cies may vary in their responses to climatic variation across a wide geographical range due to genetic and environmental variation (Davis and Shaw, 2001; Etterson and Shaw, 2001). Many species of plants, in particular, require a period of cold (vernalization) be- fore they become fully competent to respond to warming condi- tions in the spring (Michaels and Amasino, 2000). In colder regions, increased temperatures will generally promote earlier leafing out, whereas in warmer regions, increased temperatures may delay leafing out because plants may not experience sufficient cold to overcome their winter chilling requirements (Zhang et al., 2007). In animals as well, species vary in which cues they use to time reproductive activity and other life history stages, and the 0006-3207/$ - see front matter Ó 2009 Elsevier Ltd. All rights reserved. doi:10.1016/j.biocon.2009.06.003 * Corresponding author. Tel.: +1 734 615 8817; fax: +1 734 763 8965. E-mail address: [email protected] (I. Ibáñez). Biological Conservation xxx (2009) xxx–xxx Contents lists available at ScienceDirect Biological Conservation journal homepage: www.elsevier.com/locate/biocon ARTICLE IN PRESS Please cite this article in press as: Primack, R.B., et al. Spatial and interspecific variability in phenological responses to warming temperatures. Biol. Con- serv. (2009), doi:10.1016/j.biocon.2009.06.003

Welcome message from author
This document is posted to help you gain knowledge. Please leave a comment to let me know what you think about it! Share it to your friends and learn new things together.
Transcript
Biological Conservation xxx (2009) xxx–xxx
ARTICLE IN PRESS
Contents lists available at ScienceDirect
Biological Conservation
journal homepage: www.elsevier .com/ locate /biocon
Spatial and interspecific variability in phenological responsesto warming temperatures
Richard B. Primack a, Inés Ibáñez b,*, Hiroyoshi Higuchi c, Sang Don Lee d, Abraham J. Miller-Rushing a,e,f,Adam M. Wilson g, John A. Silander Jr. g
a Department of Biology, Boston University, Boston, MA 02215, USAb School of Natural Resources and Environment, University of Michigan, Ann Arbor, MI 48109, USAc Laboratory of Biodiversity Science, University of Tokyo, Tokyo 113-8657, Japand Department of Environmental Science and Engineering, Ewha Woman’s University, Seoul 120-750, Republic of Koreae The Wildlife Society, Bethesda, MD 20814, USAf USA National Phenology Network, Tucson, AZ 85721, USAg Department of Ecology and Evolutionary Biology, University of Connecticut, Storrs, Connecticut 06269, USA
a r t i c l e i n f o
Article history:Received 13 May 2009Received in revised form 1 June 2009Accepted 2 June 2009Available online xxxx
Keywords:Animal phenologyClimate changeEast AsiaGeographic differencesGlobal warningHierarchical BayesPlant phenologySpatial variability
0006-3207/$ - see front matter � 2009 Elsevier Ltd. Adoi:10.1016/j.biocon.2009.06.003
* Corresponding author. Tel.: +1 734 615 8817; faxE-mail address: [email protected] (I. Ibáñez).
Please cite this article in press as: Primack, R.B.serv. (2009), doi:10.1016/j.biocon.2009.06.003
a b s t r a c t
A comprehensive understanding of species phenological responses to global warming will require obser-vations that are both long-term and spatially extensive. Here we present an analysis of the spring phe-nological response to climate variation of twelve taxa: six plants, three birds, a frog, and two insects.Phenology was monitored using standardized protocols at 176 meteorological stations in Japan and SouthKorea from 1953 to 2005, and in some cases even longer. We developed a hierarchical Bayesian model toexamine the complex interactions of temperature, site effects, and latitude on phenology. Results showspecies-specific variation in the magnitude and even in the direction of their responses to increasing tem-perature, which also differ from site-to-site. At most sites the differences in phenology among species areforecast to become greater with warmer temperatures. Our results challenge the assertion that trends inone geographic region can be extrapolated to others, and emphasize the idiosyncratic nature of the spe-cies response to global warming. Field studies are needed to determine how these patterns of variation inspecies response to climate change affect species interactions and the ability to persist in a changingclimate.
� 2009 Elsevier Ltd. All rights reserved.
1. Introduction
Phenological dynamics have been recognized as key attributesof plants and animals that are being affected by a warming climate(Parmesan and Yohe, 2003; Root et al., 2003; Cleland et al., 2007;Parmesan, 2007). As a result of rising temperatures, many plantspecies are leafing out and flowering earlier in the spring, manyanimals are active earlier, and many migratory birds are arrivingearlier at points along their spring migration routes (e.g., Bothet al., 2006; Inouye et al., 2000; Fitter and Fitter, 2002; Cotton,2003; Miller-Rushing and Primack, 2008). However, the changesvary considerably among species; some species are changing dra-matically while other are not changing at all (Fitter and Fitter,2002; Lehikoinen et al., 2006; Sherry et al., 2007; Miller-Rushingand Primack, 2008). Knowing a particular species’ response to glo-bal warming in the context of its surrounding environment will becrucial for the assessment of the effects of climate change on its
ll rights reserved.
: +1 734 763 8965.
, et al. Spatial and interspecific
populations, the communities to which it belongs, and biodiversityin general.
Given data constraints, most phenological studies focus on oneor a few species in one or a few sites. More comprehensive studiesmay include a community of species at one site or examine a singlespecies over a wider geographical area (e.g., Sparks and Carey,1995; Dunn and Winkler, 1999; Fitter and Fitter, 2002; Doi,2007; Miller-Rushing and Primack, 2008). However, groups of spe-cies may vary in their responses to climatic variation across a widegeographical range due to genetic and environmental variation(Davis and Shaw, 2001; Etterson and Shaw, 2001). Many speciesof plants, in particular, require a period of cold (vernalization) be-fore they become fully competent to respond to warming condi-tions in the spring (Michaels and Amasino, 2000). In colderregions, increased temperatures will generally promote earlierleafing out, whereas in warmer regions, increased temperaturesmay delay leafing out because plants may not experience sufficientcold to overcome their winter chilling requirements (Zhang et al.,2007). In animals as well, species vary in which cues they use totime reproductive activity and other life history stages, and the
variability in phenological responses to warming temperatures. Biol. Con-
2 R.B. Primack et al. / Biological Conservation xxx (2009) xxx–xxx
ARTICLE IN PRESS
relative importance of those cues also varies. For example, somemigratory bird species and populations use day-length to regulatethe timing of migration while others use temperature or a combi-nation of day-length and temperature (Lyon et al., 2008; Morinet al., 2009).
Previous studies of single species have found geographical var-iation in species responses to climate change (e.g., Dunn and Win-kler, 1999; Matsumoto et al., 2003; Doi and Takahashi, 2008), ashas a study of numerous species across Europe (Menzel et al.,2006). However, the generality of this finding across taxonomicgroups and locations is unclear, particularly in light of a recentmeta-analysis of data on 203 species from across the northernhemisphere that found only weak latitudinal variation in theadvancement of spring events (Parmesan, 2007). Discerning geo-graphic variation in phenological change across a range of taxo-nomic groups is difficult because researchers must gatherphenological data for several species in a consistent manner acrossa broad geographical range. Yet this information is critical for pre-dicting species and community responses to future climate changeand for planning actions to protect threatened elements ofbiodiversity.
In this paper, we report on the phenological observations col-lected for 12 plant and animal taxa by the meteorological agenciesof Japan (102 sites since 1953) and Korea (74 sites with some since1921) (Fig. 1a). Given the large spatial and temporal scale of thedata, our goal is to use the information contained in these observa-tions to understand the spatial and interspecific variability of spe-cies phenological response to global warming. The main questionswe aim to answer are: is a species’ phenological response toincreasing temperatures consistent over a large geographic range?Or is it site-specific? Are species at a particular site having a similarphenological response to global warming? Or are the trends idio-syncratic for each species? Answering these questions will helpus to better understand and predict the complex effects of climatechange on natural populations, communities and biodiversity.
2. Materials and methods
2.1. Phenology and climate data
Since 1953 the Weather Service of Japan has been gatheringdata on over 120 phenological events at the grounds of 102 of theirweather stations (data available from Japan MeteorologicalAgency, http://www.jmbsc.or.jp/english/index-e.html). TheWeather Service of Korea has been gathering similar data on 20phenological events at 74 weather stations with some observationsdating from 1921 (data available from Korea MeteorologicalAdministration, http://web.kma.go.kr/edu/unv/agricultural/seaso-nob/1173374_1389.html). Data for certain individual phenologicalevents and sites have been previously analyzed, as reviewed by Kaiet al. (1996) and Chen (2003) with more recent articles by Mat-sumoto et al. (2003), Ho et al. (2006), Doi (2007, 2008), Doi andKatano (2008), Doi and Takahashi (2008), and Doi et al. (2008).These weather stations are located across the latitudinal range ofJapan, from northern Hokkaido (latitude 45�24.90 N) to the south-ern islands (latitude 24�20.20 N), with a corresponding gradientin annual temperatures from subtropical to boreal (Fig. 1a). Koreahas a higher density of weather stations in a more continental areathan Japan. Climate analyses have shown that this region haswarmed in recent years (see also Section 3 and Fig. 1b), and modelsforecast that local temperatures will continue to rise in the futuredue to both global warming and increasing urbanization in the re-gion (IPCC, 2007).
From this data set, we selected species from different trophiclevels for which records of spring phenological observations weremost complete across stations. Five species have records from both
Please cite this article in press as: Primack, R.B., et al. Spatial and interspecificserv. (2009), doi:10.1016/j.biocon.2009.06.003
countries and seven species for Japan only (Table 1). We includedfirst flowering of the widely planted Japanese apricot tree (Prunusmume), first appearance of the common white butterfly (Pieris ra-pae), first arrival of the migratory barn swallow (Hirundo rustica),first singing of the skylark (Alauda arvensis) and first appearanceof black-spotted pond frogs (Rana nigromaculata and Rana porosa,closely related species that are mostly allopatric and are difficultto distinguish using morphological characters (Moriya, 1954;Sumida et al., 1998)). For Japan only, we also included first flower-ing of dandelion (native Taraxacum spp.), native Camellia shrub(Camellia japonica), and native Wisteria vine (Wisteria floribunda),first singing of non-migratory Japanese bush warbler (Cettia di-phone), leaf bud burst of the widely planted, but non-native mai-den hair tree (Ginkgo biloba) and the native mulberry tree (Morusbombycis), and first appearance of paper wasp (Polistes jadwigae).The observations were made by agency employees according tocarefully defined sampling protocols that have remained constantfor the duration of the study period. The protocols directed that asingle individual plant for each species was observed close to eachweather station for activity, and animal species were monitored atspecific sites in the vicinity of each weather station where theywere known to occur. The sampling methods of sites in Japanand South Korea are nearly identical. Given the magnitude (176sites and over five decades of sampling) of the data set we are con-fident our analysis provided us with a reliable estimate of eachspecies’ response to warming temperatures.
2.2. A model for plant and animal phenology
From the data available to us (i.e., monthly mean temperature),we compared the predictive potential of several combinations oftemperature during winter and early spring months in our analy-sis. For the final analysis we used a single fixed period of temper-ature records, mean winter temperature (November–March),which predicted our data best and provided one consistent param-eter across all species, sites and years. This measure of winter tem-perature indicates both the severity of the winter and time and rateof warming in the spring, all of which are important for the springphenology of many plants and animals (Sparks and Carey, 1995;Chuine, 2000). We recognize that certain animal species may bemore sensitive to weather during more specific periods. For exam-ple, birds and amphibians may be sensitive to temperatures justbefore and during the egg-laying period (Dunn and Winkler,1999; Hartel, 2008).
However, this approach of using a single index of mean wintertemperature for all sites and species allowed us to avoid a statisti-cally circular argument where the response variable (phenology)would be defining the explanatory variable (temperature). As databecomes available, we are planning further analyses that will in-volve using daily weather records to develop models for eachspecies.
After trying several phenological models, we found that a two-parameter negative exponential model provided the best overall fitto the data across species (see Table 2 for alternative models wetested). We then modeled phenology at site s in year t as havinga negative exponential response to temperature and a linear rela-tionship with latitude:
Phenologyst ¼ as � eð�bs�temperaturest Þ þ c � latitudes þ est
In the model the error terms were distributed as e � Normalð0;r2e Þ.
We fitted a different curve at each location (parameters as and bs
were estimated for each location). This approach allowed us tomodel the unique response to temperature at each site given bythe particular characteristics of the location (climatic variablesother than temperature, soils, etc.). as and bs were estimated fromas � Normalða;r2
aÞ and bs � Normalðb;r2bÞ, respectively. Parameter
variability in phenological responses to warming temperatures. Biol. Con-
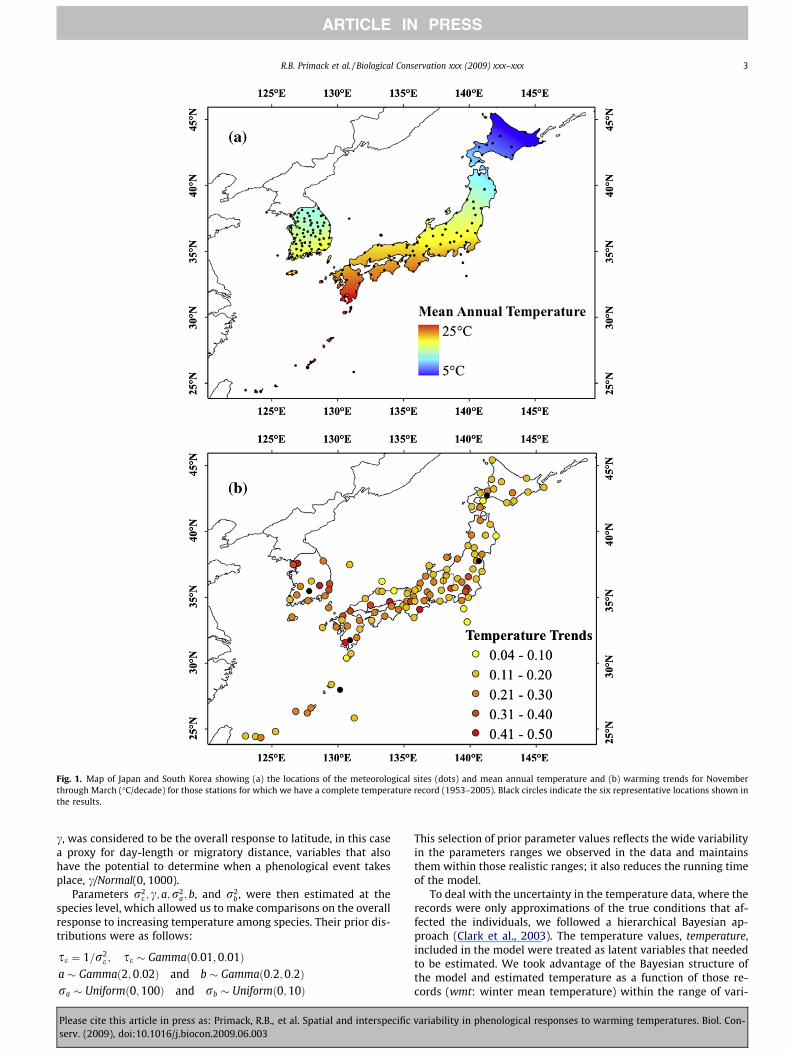
Fig. 1. Map of Japan and South Korea showing (a) the locations of the meteorological sites (dots) and mean annual temperature and (b) warming trends for Novemberthrough March (�C/decade) for those stations for which we have a complete temperature record (1953–2005). Black circles indicate the six representative locations shown inthe results.
R.B. Primack et al. / Biological Conservation xxx (2009) xxx–xxx 3
ARTICLE IN PRESS
c, was considered to be the overall response to latitude, in this casea proxy for day-length or migratory distance, variables that alsohave the potential to determine when a phenological event takesplace, c/Normal(0, 1000).
Parameters r2e ; c; a;r2
a ; b, and r2b , were then estimated at the
species level, which allowed us to make comparisons on the overallresponse to increasing temperature among species. Their prior dis-tributions were as follows:
se ¼ 1=r2e ; se � Gammað0:01;0:01Þ
a � Gammað2;0:02Þ and b � Gammað0:2;0:2Þra � Uniformð0;100Þ and rb � Uniformð0;10Þ
Please cite this article in press as: Primack, R.B., et al. Spatial and interspecificserv. (2009), doi:10.1016/j.biocon.2009.06.003
This selection of prior parameter values reflects the wide variabilityin the parameters ranges we observed in the data and maintainsthem within those realistic ranges; it also reduces the running timeof the model.
To deal with the uncertainty in the temperature data, where therecords were only approximations of the true conditions that af-fected the individuals, we followed a hierarchical Bayesian ap-proach (Clark et al., 2003). The temperature values, temperature,included in the model were treated as latent variables that neededto be estimated. We took advantage of the Bayesian structure ofthe model and estimated temperature as a function of those re-cords (wmt: winter mean temperature) within the range of vari-
variability in phenological responses to warming temperatures. Biol. Con-
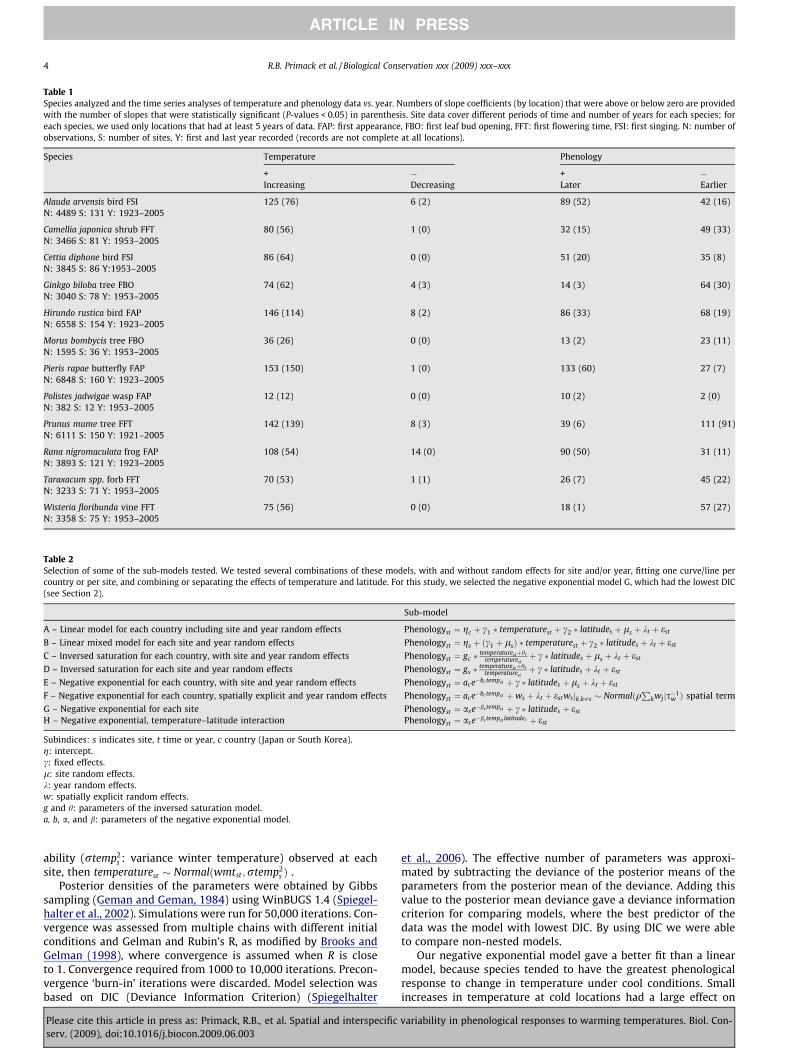
Table 1Species analyzed and the time series analyses of temperature and phenology data vs. year. Numbers of slope coefficients (by location) that were above or below zero are providedwith the number of slopes that were statistically significant (P-values < 0.05) in parenthesis. Site data cover different periods of time and number of years for each species; foreach species, we used only locations that had at least 5 years of data. FAP: first appearance, FBO: first leaf bud opening, FFT: first flowering time, FSI: first singing. N: number ofobservations, S: number of sites, Y: first and last year recorded (records are not complete at all locations).
Species Temperature Phenology
+ � + �Increasing Decreasing Later Earlier
Alauda arvensis bird FSI 125 (76) 6 (2) 89 (52) 42 (16)N: 4489 S: 131 Y: 1923–2005
Camellia japonica shrub FFT 80 (56) 1 (0) 32 (15) 49 (33)N: 3466 S: 81 Y: 1953–2005
Cettia diphone bird FSI 86 (64) 0 (0) 51 (20) 35 (8)N: 3845 S: 86 Y:1953–2005
Ginkgo biloba tree FBO 74 (62) 4 (3) 14 (3) 64 (30)N: 3040 S: 78 Y: 1953–2005
Hirundo rustica bird FAP 146 (114) 8 (2) 86 (33) 68 (19)N: 6558 S: 154 Y: 1923–2005
Morus bombycis tree FBO 36 (26) 0 (0) 13 (2) 23 (11)N: 1595 S: 36 Y: 1953–2005
Pieris rapae butterfly FAP 153 (150) 1 (0) 133 (60) 27 (7)N: 6848 S: 160 Y: 1923–2005
Polistes jadwigae wasp FAP 12 (12) 0 (0) 10 (2) 2 (0)N: 382 S: 12 Y: 1953–2005
Prunus mume tree FFT 142 (139) 8 (3) 39 (6) 111 (91)N: 6111 S: 150 Y: 1921–2005
Rana nigromaculata frog FAP 108 (54) 14 (0) 90 (50) 31 (11)N: 3893 S: 121 Y: 1923–2005
Taraxacum spp. forb FFT 70 (53) 1 (1) 26 (7) 45 (22)N: 3233 S: 71 Y: 1953–2005
Wisteria floribunda vine FFT 75 (56) 0 (0) 18 (1) 57 (27)N: 3358 S: 75 Y: 1953–2005
Table 2Selection of some of the sub-models tested. We tested several combinations of these models, with and without random effects for site and/or year, fitting one curve/line percountry or per site, and combining or separating the effects of temperature and latitude. For this study, we selected the negative exponential model G, which had the lowest DIC(see Section 2).
Sub-model
A – Linear model for each country including site and year random effects Phenologyst ¼ gc þ c1 � temperaturest þ c2 � latitudes þ ls þ kt þ est
B – Linear mixed model for each site and year random effects Phenologyst ¼ gs þ ðc1 þ lsÞ � temperaturest þ c2 � latitudes þ kt þ est
C – Inversed saturation for each country, with site and year random effects Phenologyst ¼ gc �temperaturestþhc
temperaturestþ c � latitudes þ ls þ kt þ est
D – Inversed saturation for each site and year random effects Phenologyst ¼ gs �temperaturestþhs
temperaturestþ c � latitudes þ kt þ est
E – Negative exponential for each country, with site and year random effects Phenologyst ¼ ace�bc tempst þ c � latitudes þ ls þ kt þ est
F – Negative exponential for each country, spatially explicit and year random effects Phenologyst ¼ ace�bc tempst þws þ kt þ estwsjk;k–s � NormalðqP
kwj js�1w Þ spatial term
G – Negative exponential for each site Phenologyst ¼ ase�bs tempst þ c � latitudes þ est
H – Negative exponential, temperature–latitude interaction Phenologyst ¼ ase�bs tempst latitudes þ est
Subindices: s indicates site, t time or year, c country (Japan or South Korea).g: intercept.c: fixed effects.l: site random effects.k: year random effects.w: spatially explicit random effects.g and h: parameters of the inversed saturation model.a, b, a, and b: parameters of the negative exponential model.
4 R.B. Primack et al. / Biological Conservation xxx (2009) xxx–xxx
ARTICLE IN PRESS
ability (rtemp2s : variance winter temperature) observed at each
site, then temperaturest � Normalðwmtst;rtemp2s Þ .
Posterior densities of the parameters were obtained by Gibbssampling (Geman and Geman, 1984) using WinBUGS 1.4 (Spiegel-halter et al., 2002). Simulations were run for 50,000 iterations. Con-vergence was assessed from multiple chains with different initialconditions and Gelman and Rubin’s R, as modified by Brooks andGelman (1998), where convergence is assumed when R is closeto 1. Convergence required from 1000 to 10,000 iterations. Precon-vergence ‘burn-in’ iterations were discarded. Model selection wasbased on DIC (Deviance Information Criterion) (Spiegelhalter
Please cite this article in press as: Primack, R.B., et al. Spatial and interspecificserv. (2009), doi:10.1016/j.biocon.2009.06.003
et al., 2006). The effective number of parameters was approxi-mated by subtracting the deviance of the posterior means of theparameters from the posterior mean of the deviance. Adding thisvalue to the posterior mean deviance gave a deviance informationcriterion for comparing models, where the best predictor of thedata was the model with lowest DIC. By using DIC we were ableto compare non-nested models.
Our negative exponential model gave a better fit than a linearmodel, because species tended to have the greatest phenologicalresponse to change in temperature under cool conditions. Smallincreases in temperature at cold locations had a large effect on
variability in phenological responses to warming temperatures. Biol. Con-
R.B. Primack et al. / Biological Conservation xxx (2009) xxx–xxx 5
ARTICLE IN PRESS
phenology, while similar changes in warm locations had less orno effect on phenology (see Fig. 2). We tested elevation as anadditional explanatory variable but it did not improve our pre-dictions, probably due to the high correlation between tempera-ture and elevation. As a preliminary analysis of spatial andtemporal autocorrelation we ran models with location and yearrandom effects (Table 2 models A–F). We also tested a spatiallyexplicit model (Table 2 model F), in which the error term, w, re-flected the latitudinal pattern. However, these models performedno better than our simpler negative exponential model (Table 2model G).
3. Results
3.1. Changes in temperature over time
Winter temperatures (November–March) have risen by an aver-age of 1.2 �C over the region from 1953 to 2005 (Fig. 1b, Table 1).There was no obvious correlation of greater temperature increaseswith higher latitudes (temperature increase vs. latitude R2 = 0.01,not shown). However, temperature increases were significantlycorrelated with the size of the human population in the city ofthe weather station (p < 0.001; R2 = 0.40), reflecting the local im-pact of the urban heat island effect. Temperatures increased byan annual average of 0.017 �C (±0.007 SD) in cities with popula-
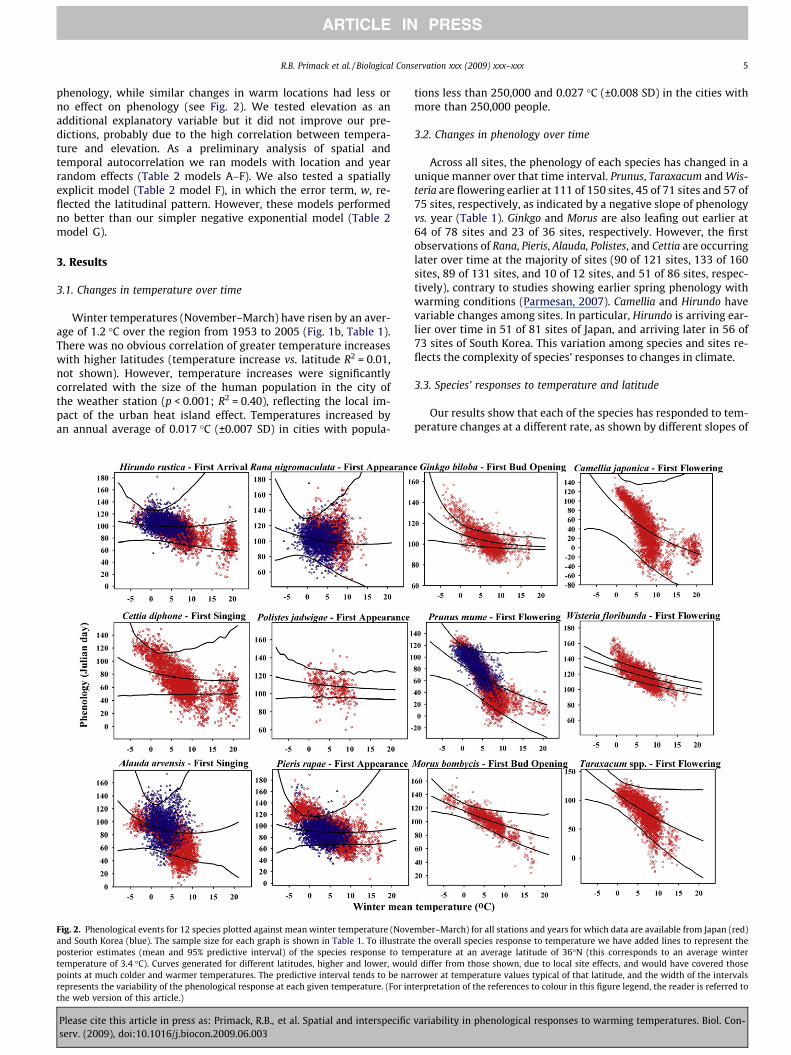
Fig. 2. Phenological events for 12 species plotted against mean winter temperature (Noveand South Korea (blue). The sample size for each graph is shown in Table 1. To illustrateposterior estimates (mean and 95% predictive interval) of the species response to temtemperature of 3.4 �C). Curves generated for different latitudes, higher and lower, woulpoints at much colder and warmer temperatures. The predictive interval tends to be narrepresents the variability of the phenological response at each given temperature. (For inthe web version of this article.)
Please cite this article in press as: Primack, R.B., et al. Spatial and interspecificserv. (2009), doi:10.1016/j.biocon.2009.06.003
tions less than 250,000 and 0.027 �C (±0.008 SD) in the cities withmore than 250,000 people.
3.2. Changes in phenology over time
Across all sites, the phenology of each species has changed in aunique manner over that time interval. Prunus, Taraxacum and Wis-teria are flowering earlier at 111 of 150 sites, 45 of 71 sites and 57 of75 sites, respectively, as indicated by a negative slope of phenologyvs. year (Table 1). Ginkgo and Morus are also leafing out earlier at64 of 78 sites and 23 of 36 sites, respectively. However, the firstobservations of Rana, Pieris, Alauda, Polistes, and Cettia are occurringlater over time at the majority of sites (90 of 121 sites, 133 of 160sites, 89 of 131 sites, and 10 of 12 sites, and 51 of 86 sites, respec-tively), contrary to studies showing earlier spring phenology withwarming conditions (Parmesan, 2007). Camellia and Hirundo havevariable changes among sites. In particular, Hirundo is arriving ear-lier over time in 51 of 81 sites of Japan, and arriving later in 56 of73 sites of South Korea. This variation among species and sites re-flects the complexity of species’ responses to changes in climate.
3.3. Species’ responses to temperature and latitude
Our results show that each of the species has responded to tem-perature changes at a different rate, as shown by different slopes of
mber–March) for all stations and years for which data are available from Japan (red)the overall species response to temperature we have added lines to represent theperature at an average latitude of 36�N (this corresponds to an average winter
d differ from those shown, due to local site effects, and would have covered thoserower at temperature values typical of that latitude, and the width of the intervals
terpretation of the references to colour in this figure legend, the reader is referred to
variability in phenological responses to warming temperatures. Biol. Con-
6 R.B. Primack et al. / Biological Conservation xxx (2009) xxx–xxx
ARTICLE IN PRESS
the exponential curves (Table 3, Fig. 2). In particular, for three plantspecies, Prunus, Taraxacum and Camellia, flowering times occurredmuch earlier for each degree increase in temperature (>4.0 daysearlier/�C) (Table 3). For Hirundo and Rana, two animal species,temperature seems to have had a negligible effect on changes inspring activity (slope < 1.0 day earlier/�C). The other seven speciesshifted their timing of activity at intermediate rates (Table 3,Fig. 2). Note that the lines in Fig. 2 represent the posterior esti-mates (mean and 95% predictive interval) of the species responsesto temperature at an average latitude of 36�N; these estimates arenot calibrated for latitudes with warmer and colder temperatures.Consequently, these overall lines do not fit the entire data set. Theparticular curves from more northern and southern latitudeswould fit the data for colder and warmer temperatures.
In addition, our results show that phenological responses totemperature vary among locations for each species (Fig. 3). Thislikely occurred because the response to temperature at each loca-tion interacted with other factors characteristic of the site (e.g.,precipitation, snow cover, soil type, wind, and population genet-ics). In summary, the hierarchical structure of the model allowedus to evaluate the overall species response to warming conditions(Fig. 2) while still incorporating site-specific patterns (Fig. 3).
The response to latitude also varied among species (Table 3). Inour analysis we found both positive and negative c parameters(estimates of the effect of latitude on phenology). Positive c valuesindicate that for a given temperature, phenology occurs later athigher latitudes. Negative c values indicate the opposite trend,with phenology occurring earlier at higher latitudes for a giventemperature. Importantly, though, the model uses both latitudeand temperature to predict phenology.
To evaluate the fit of our models we also assess observed datavs. predicted phenology for each of the species (Fig. 4). Not surpris-ingly, plant species responses are much better explained by tem-perature than are the responses of birds, butterflies, wasps, andfrogs.
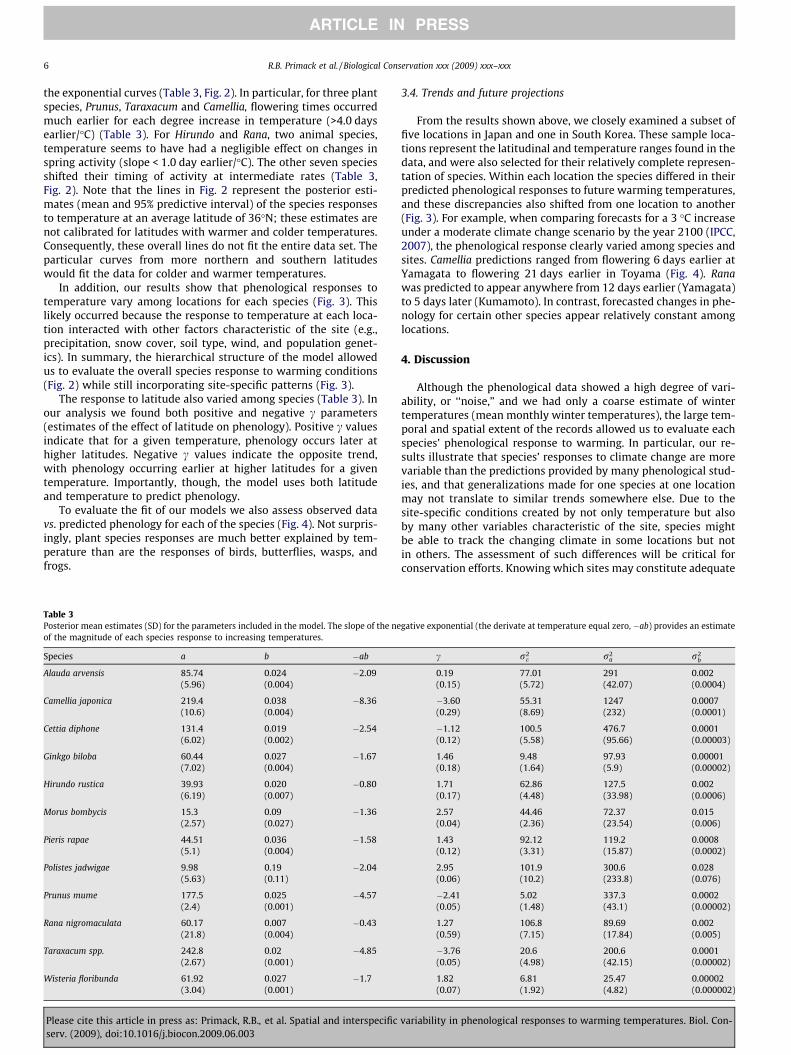
Table 3Posterior mean estimates (SD) for the parameters included in the model. The slope of the neof the magnitude of each species response to increasing temperatures.
Species a b �ab
Alauda arvensis 85.74 0.024 �2.09(5.96) (0.004)
Camellia japonica 219.4 0.038 �8.36(10.6) (0.004)
Cettia diphone 131.4 0.019 �2.54(6.02) (0.002)
Ginkgo biloba 60.44 0.027 �1.67(7.02) (0.004)
Hirundo rustica 39.93 0.020 �0.80(6.19) (0.007)
Morus bombycis 15.3 0.09 �1.36(2.57) (0.027)
Pieris rapae 44.51 0.036 �1.58(5.1) (0.004)
Polistes jadwigae 9.98 0.19 �2.04(5.63) (0.11)
Prunus mume 177.5 0.025 �4.57(2.4) (0.001)
Rana nigromaculata 60.17 0.007 �0.43(21.8) (0.004)
Taraxacum spp. 242.8 0.02 �4.85(2.67) (0.001)
Wisteria floribunda 61.92 0.027 �1.7(3.04) (0.001)
Please cite this article in press as: Primack, R.B., et al. Spatial and interspecificserv. (2009), doi:10.1016/j.biocon.2009.06.003
3.4. Trends and future projections
From the results shown above, we closely examined a subset offive locations in Japan and one in South Korea. These sample loca-tions represent the latitudinal and temperature ranges found in thedata, and were also selected for their relatively complete represen-tation of species. Within each location the species differed in theirpredicted phenological responses to future warming temperatures,and these discrepancies also shifted from one location to another(Fig. 3). For example, when comparing forecasts for a 3 �C increaseunder a moderate climate change scenario by the year 2100 (IPCC,2007), the phenological response clearly varied among species andsites. Camellia predictions ranged from flowering 6 days earlier atYamagata to flowering 21 days earlier in Toyama (Fig. 4). Ranawas predicted to appear anywhere from 12 days earlier (Yamagata)to 5 days later (Kumamoto). In contrast, forecasted changes in phe-nology for certain other species appear relatively constant amonglocations.
4. Discussion
Although the phenological data showed a high degree of vari-ability, or ‘‘noise,” and we had only a coarse estimate of wintertemperatures (mean monthly winter temperatures), the large tem-poral and spatial extent of the records allowed us to evaluate eachspecies’ phenological response to warming. In particular, our re-sults illustrate that species’ responses to climate change are morevariable than the predictions provided by many phenological stud-ies, and that generalizations made for one species at one locationmay not translate to similar trends somewhere else. Due to thesite-specific conditions created by not only temperature but alsoby many other variables characteristic of the site, species mightbe able to track the changing climate in some locations but notin others. The assessment of such differences will be critical forconservation efforts. Knowing which sites may constitute adequate
gative exponential (the derivate at temperature equal zero, �ab) provides an estimate
c r2e r2
a r2b
0.19 77.01 291 0.002(0.15) (5.72) (42.07) (0.0004)
�3.60 55.31 1247 0.0007(0.29) (8.69) (232) (0.0001)
�1.12 100.5 476.7 0.0001(0.12) (5.58) (95.66) (0.00003)
1.46 9.48 97.93 0.00001(0.18) (1.64) (5.9) (0.00002)
1.71 62.86 127.5 0.002(0.17) (4.48) (33.98) (0.0006)
2.57 44.46 72.37 0.015(0.04) (2.36) (23.54) (0.006)
1.43 92.12 119.2 0.0008(0.12) (3.31) (15.87) (0.0002)
2.95 101.9 300.6 0.028(0.06) (10.2) (233.8) (0.076)
�2.41 5.02 337.3 0.0002(0.05) (1.48) (43.1) (0.00002)
1.27 106.8 89.69 0.002(0.59) (7.15) (17.84) (0.005)
�3.76 20.6 200.6 0.0001(0.05) (4.98) (42.15) (0.00002)
1.82 6.81 25.47 0.00002(0.07) (1.92) (4.82) (0.000002)
variability in phenological responses to warming temperatures. Biol. Con-
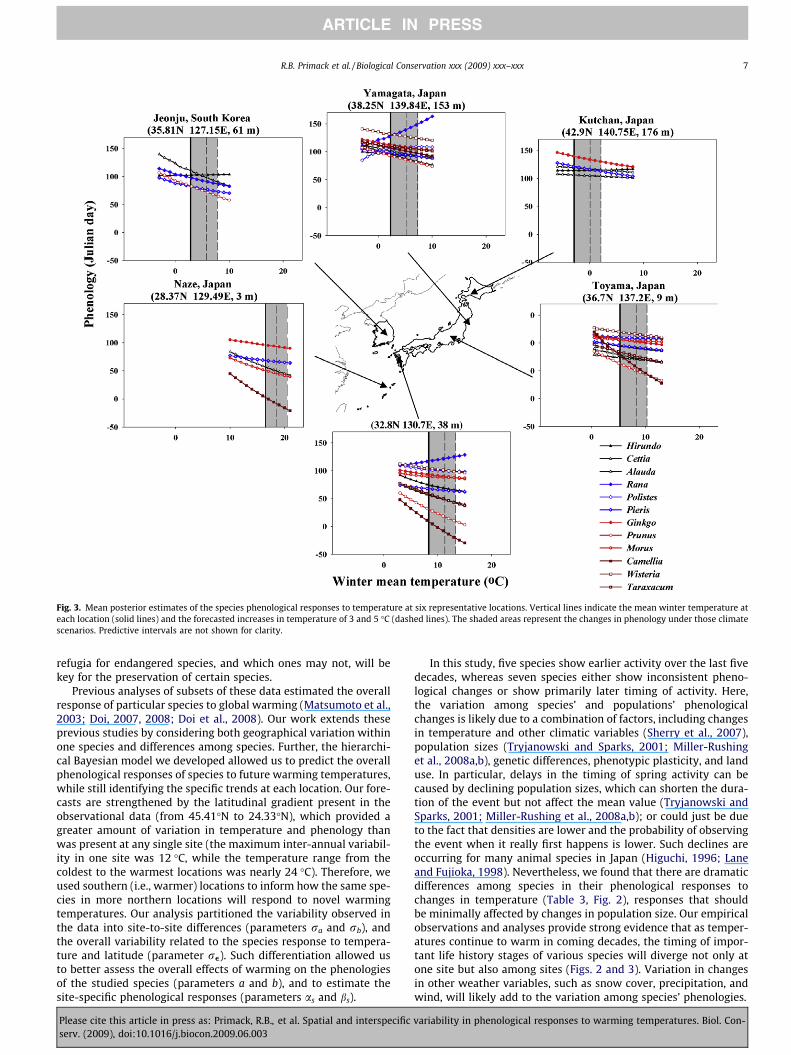
Fig. 3. Mean posterior estimates of the species phenological responses to temperature at six representative locations. Vertical lines indicate the mean winter temperature ateach location (solid lines) and the forecasted increases in temperature of 3 and 5 �C (dashed lines). The shaded areas represent the changes in phenology under those climatescenarios. Predictive intervals are not shown for clarity.
R.B. Primack et al. / Biological Conservation xxx (2009) xxx–xxx 7
ARTICLE IN PRESS
refugia for endangered species, and which ones may not, will bekey for the preservation of certain species.
Previous analyses of subsets of these data estimated the overallresponse of particular species to global warming (Matsumoto et al.,2003; Doi, 2007, 2008; Doi et al., 2008). Our work extends theseprevious studies by considering both geographical variation withinone species and differences among species. Further, the hierarchi-cal Bayesian model we developed allowed us to predict the overallphenological responses of species to future warming temperatures,while still identifying the specific trends at each location. Our fore-casts are strengthened by the latitudinal gradient present in theobservational data (from 45.41�N to 24.33�N), which provided agreater amount of variation in temperature and phenology thanwas present at any single site (the maximum inter-annual variabil-ity in one site was 12 �C, while the temperature range from thecoldest to the warmest locations was nearly 24 �C). Therefore, weused southern (i.e., warmer) locations to inform how the same spe-cies in more northern locations will respond to novel warmingtemperatures. Our analysis partitioned the variability observed inthe data into site-to-site differences (parameters ra and rb), andthe overall variability related to the species response to tempera-ture and latitude (parameter re). Such differentiation allowed usto better assess the overall effects of warming on the phenologiesof the studied species (parameters a and b), and to estimate thesite-specific phenological responses (parameters as and bs).
Please cite this article in press as: Primack, R.B., et al. Spatial and interspecificserv. (2009), doi:10.1016/j.biocon.2009.06.003
In this study, five species show earlier activity over the last fivedecades, whereas seven species either show inconsistent pheno-logical changes or show primarily later timing of activity. Here,the variation among species’ and populations’ phenologicalchanges is likely due to a combination of factors, including changesin temperature and other climatic variables (Sherry et al., 2007),population sizes (Tryjanowski and Sparks, 2001; Miller-Rushinget al., 2008a,b), genetic differences, phenotypic plasticity, and landuse. In particular, delays in the timing of spring activity can becaused by declining population sizes, which can shorten the dura-tion of the event but not affect the mean value (Tryjanowski andSparks, 2001; Miller-Rushing et al., 2008a,b); or could just be dueto the fact that densities are lower and the probability of observingthe event when it really first happens is lower. Such declines areoccurring for many animal species in Japan (Higuchi, 1996; Laneand Fujioka, 1998). Nevertheless, we found that there are dramaticdifferences among species in their phenological responses tochanges in temperature (Table 3, Fig. 2), responses that shouldbe minimally affected by changes in population size. Our empiricalobservations and analyses provide strong evidence that as temper-atures continue to warm in coming decades, the timing of impor-tant life history stages of various species will diverge not only atone site but also among sites (Figs. 2 and 3). Variation in changesin other weather variables, such as snow cover, precipitation, andwind, will likely add to the variation among species’ phenologies.
variability in phenological responses to warming temperatures. Biol. Con-
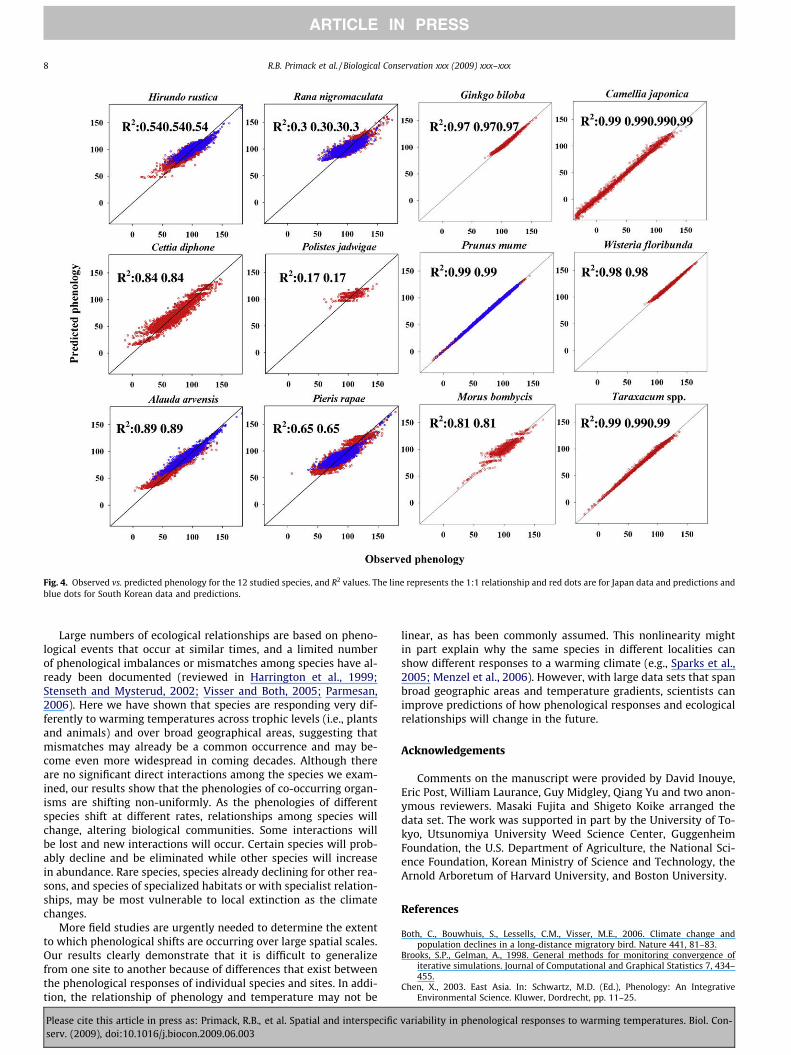
Fig. 4. Observed vs. predicted phenology for the 12 studied species, and R2 values. The line represents the 1:1 relationship and red dots are for Japan data and predictions andblue dots for South Korean data and predictions.
8 R.B. Primack et al. / Biological Conservation xxx (2009) xxx–xxx
ARTICLE IN PRESS
Large numbers of ecological relationships are based on pheno-logical events that occur at similar times, and a limited numberof phenological imbalances or mismatches among species have al-ready been documented (reviewed in Harrington et al., 1999;Stenseth and Mysterud, 2002; Visser and Both, 2005; Parmesan,2006). Here we have shown that species are responding very dif-ferently to warming temperatures across trophic levels (i.e., plantsand animals) and over broad geographical areas, suggesting thatmismatches may already be a common occurrence and may be-come even more widespread in coming decades. Although thereare no significant direct interactions among the species we exam-ined, our results show that the phenologies of co-occurring organ-isms are shifting non-uniformly. As the phenologies of differentspecies shift at different rates, relationships among species willchange, altering biological communities. Some interactions willbe lost and new interactions will occur. Certain species will prob-ably decline and be eliminated while other species will increasein abundance. Rare species, species already declining for other rea-sons, and species of specialized habitats or with specialist relation-ships, may be most vulnerable to local extinction as the climatechanges.
More field studies are urgently needed to determine the extentto which phenological shifts are occurring over large spatial scales.Our results clearly demonstrate that it is difficult to generalizefrom one site to another because of differences that exist betweenthe phenological responses of individual species and sites. In addi-tion, the relationship of phenology and temperature may not be
Please cite this article in press as: Primack, R.B., et al. Spatial and interspecificserv. (2009), doi:10.1016/j.biocon.2009.06.003
linear, as has been commonly assumed. This nonlinearity mightin part explain why the same species in different localities canshow different responses to a warming climate (e.g., Sparks et al.,2005; Menzel et al., 2006). However, with large data sets that spanbroad geographic areas and temperature gradients, scientists canimprove predictions of how phenological responses and ecologicalrelationships will change in the future.
Acknowledgements
Comments on the manuscript were provided by David Inouye,Eric Post, William Laurance, Guy Midgley, Qiang Yu and two anon-ymous reviewers. Masaki Fujita and Shigeto Koike arranged thedata set. The work was supported in part by the University of To-kyo, Utsunomiya University Weed Science Center, GuggenheimFoundation, the U.S. Department of Agriculture, the National Sci-ence Foundation, Korean Ministry of Science and Technology, theArnold Arboretum of Harvard University, and Boston University.
References
Both, C., Bouwhuis, S., Lessells, C.M., Visser, M.E., 2006. Climate change andpopulation declines in a long-distance migratory bird. Nature 441, 81–83.
Brooks, S.P., Gelman, A., 1998. General methods for monitoring convergence ofiterative simulations. Journal of Computational and Graphical Statistics 7, 434–455.
Chen, X., 2003. East Asia. In: Schwartz, M.D. (Ed.), Phenology: An IntegrativeEnvironmental Science. Kluwer, Dordrecht, pp. 11–25.
variability in phenological responses to warming temperatures. Biol. Con-
R.B. Primack et al. / Biological Conservation xxx (2009) xxx–xxx 9
ARTICLE IN PRESS
Chuine, I., 2000. A unified model for budburst of trees. Journal of Theoretical Biology207, 337–347.
Clark, J.S., Mohan, J., Dietze, M., Ibáñez, I., 2003. Coexistence: how to identify trophictrade-offs. Ecology 84, 17–31.
Cleland, E.E., Chuine, I., Menzel, A., Mooney, H.A., Schwartz, M.D., 2007. Shiftingplant phenology in response to global change. Trends Ecology and Evolution 22,357–365.
Cotton, P.A., 2003. Avian migration phenology and global climate change.Proceedings of the National Academy of Sciences, USA 100, 12219–12222.
Davis, M.B., Shaw, R.G., 2001. Range shifts and adaptive responses to quaternaryclimate change. Science 292, 673–679.
Doi, H., 2007. Winter flowering phenology of Japanese apricot Prunus mume reflectsclimate change across Japan. Climate Research 34, 99–104.
Doi, H., 2008. Delayed phenological timing of dragonfly emergence in Japan overfive decades. Biology Letters 4, 388–391.
Doi, H., Katano, I., 2008. Phenological timings of leaf budburst with climate changein Japan. Agricultural and Forest Meteorology 148, 512–516.
Doi, H., Takahashi, M., 2008. Latitudinal patterns in the phenological responses ofleaf colouring and leaf fall to climate change in Japan. Global Ecology andBiogeography 17, 556–561.
Doi, H., Gordo, O., Katano, I., 2008. Heterogeneous intra-annual climatic changesdrive different phenological responses at two trophic levels. Climate Research36, 181–190.
Dunn, P.O., Winkler, D.W., 1999. Climate change has affected the breeding date oftree swallows throughout North America. Proceedings of the Royal Society ofLondon B 266, 2487–2490.
Etterson, J.R., Shaw, R.G., 2001. Constraint to adaptive evolution in response toglobal warming. Science 294, 151–154.
Fitter, A.H., Fitter, R.S.R., 2002. Rapid changes in flowering time in British plants.Science 296, 1689–1691.
Geman, S., Geman, D., 1984. Stochastic relaxation, Gibbs distributions, and theBayesian restoration of images. IEEE T Pattern Analysis 6, 721–741.
Harrington, R., Woiwod, I., Sparks, T., 1999. Climate change and trophic interactions.Trends Ecology and Evolution 14, 146–150.
Hartel, T., 2008. Within pond variation of the egg deposition site in Rana dalmatina.Biologia 3, 439–443.
Higuchi, H. (Ed.), 1996. Conservation Biology. University of Tokyo Press, Tokyo.Ho, C.-H., Lee, E.-J., Lee, I., Jeong, S.-J., 2006. Earlier spring in Seoul, Korea.
International Journal of Climatology 26, 2117–2127.Inouye, D.W., Barr, B., Armitage, K.B., Inouye, B.D., 2000. Climate change is affecting
altitudinal migrants and hibernating species. Proceedings of the NationalAcademy of Sciences, USA 97, 1630–1633.
IPCC., 2007. Climate change 2007: the physical science basis. In: Solomon, S., Qin, D.,Manning, M., et al. (Eds.), Cambridge University Press, New York.
Kai, K., Kainuma, M., Murakoshi, N., 1996. Effects of global warming on thephenological observation in Japan. In: Omasa, K., Kai, K., Taoda, H., Uchijima, Z.,Yoshino, M. (Eds.), Climate Change and Plants in East Asia. Springer, Tokyo, pp.85–92.
Lane, S.J., Fujioka, M., 1998. The impact of changes in irrigation practices on thedistribution of foraging egrets and herons (Ardeidae) in the rice fields of centralJapan. Biological Conservation 83, 221–230.
Lehikoinen, E., Sparks, T.H., Zalakevicius, M., 2006. Arrival and departure dates. In:Møller, A.P., Fiedler, W., Berthold, P. (Eds.), Birds and Climate Change. Elsevier,Amsterdam, pp. 1–31.
Lyon, B.E., Chaine, A.S., Winkler, D.W., 2008. A matter of timing. Science 321, 1051–1052.
Matsumoto, K., Ohta, T., Irasawa, M., Nakamura, T., 2003. Climate change andextension of the Ginkgo biloba L. growing season in Japan. Global ChangeBiology 9, 1634–1642.
Please cite this article in press as: Primack, R.B., et al. Spatial and interspecificserv. (2009), doi:10.1016/j.biocon.2009.06.003
Menzel, A., Sparks, T.H., Estrella, N., Koch, E., Aasa, A., Ahas, R., Alm-Kübler, K.,Bissolli, P., Braslavská, O., Briede, A., Chmielewski, F.M., Crepinsek, Z., Curnel, Y.,Dahl, A., Defila, C., Donnelly, A., Filella, Y., Jatczak, K., Måge, F., Mestre, A., Nordli,Ø., Peñuelas, J., Pirinen, P., Remisova, V., Scheifinger, H., Striz, M., Susnik, A., VanVliet, A.J.H., Wielgolaski, F.-E., Zach, S., Zust, A., 2006. European phenologicalresponse to climate change matches the warming pattern. Global ChangeBiology 12, 1969–1976.
Michaels, S., Amasino, R., 2000. Memories of winter: vernalization and thecompetence to flower. Plant Cell and Environment 23, 1145–1153.
Miller-Rushing, A.J., Primack, R.B., 2008. Global warming and flowering times inThoreau’s concord: a community perspective. Ecology 89, 332–341.
Miller-Rushing, A.J., Inouye, D.W., Primack, R.B., 2008a. How well do first floweringdates measure plant responses to climate change? The effects of population sizeand sampling frequency. Journal of Ecology 96, 1289–1296.
Miller-Rushing, A.J., Lloyd-Evans, T.L., Primack, R.B., Satzinger, P., 2008b. Birdmigration times, climate change, and changing population sizes. Global ChangeBiology 14, 1959–1972.
Morin, X., Lechowicz, M.J., Augspurger, C., O’Keefe, J., Viner, D., Chuine, I., 2009. Leafphenology in 22 North American tree species during the 21st century. GlobalChange Biology 15, 961–975.
Moriya, K., 1954. Studies on the five races of the Japanese pond frog, Rananigromaculata Hallowell. I. Differences in the morphological characters. Journalof Science of Hiroshima University Series B, Division 1 15, 1–21.
Parmesan, C., 2006. Ecological and evolutionary responses to recent climate change.Annual Review of Ecology, Evolution, and Systematics 37, 637–669.
Parmesan, C., 2007. Influences of species, latitudes and methodologies on estimates ofphenological response to global warming. Global Change Biology 13, 1860–1872.
Parmesan, C., Yohe, G., 2003. A globally coherent fingerprint of climate changeimpacts across natural systems. Nature 421, 37–42.
Root, T.L., Price, J.T., Hall, K.R., Schneider, S.H., Rosenzweig, C., Pounds, J.A., 2003.Fingerprints of global warming on wild animals and plants. Nature 421, 57–60.
Sherry, R.A., Zhou, X., Gu, S., Snone, J.A., Schimel, D.S., Verburg, P.S., Wallace, L.L.,Luo, Y., 2007. Divergence of reproductive phenology under climate warming.Proceedings of the National Academy of Sciences, USA 104, 198–202.
Sparks, T.H., Carey, P.D., 1995. The responses of species to climate over twocenturies: an analysis of the Marsham phenological record, 1736–1947. Journalof Ecology 83, 321–329.
Sparks, T.H., Bairlein, F., Bojarinova, J.G., Huppop, O., Lehikoinen, E.A., Rainio, K.,Sokolov, L.V., Walker, D., 2005. Examining the total arrival distribution ofmigratory birds. Global Change Biology 11, 22–30.
Spiegelhalter, D.J., Best, N., Carlin, B.P., van der Linde, A., 2002. Bayesian measures ofmodel complexity and fit. Journal of the Royal Statistics Society B 64, 583–639.
Spiegelhalter, D.J., Thomas, N., Best, N., Gilks, W., 2006. BUGS 0.5: BayesianInference Using Gibbs Sampling-manual. Version ii. Medical Research CouncilBiostatistics Unit, Cambridge.
Stenseth, N.C., Mysterud, A., 2002. Climate, changing phenology, and other lifehistory traits: nonlinearity and match-mismatch to the environment.Proceedings of the National Academy of Sciences, USA 99, 13379–13381.
Sumida, M., Ogata, M., Kaneda, H., Yonekawa, H., 1998. Evolutionary relationshipsamong Japanese pond frogs from mitochondrial DNA sequences of cytochromeb and 12S ribosomal RNA genes. Genes and Genetic Systems 73, 121–133.
Tryjanowski, P., Sparks, T.H., 2001. Is the detection of the first arrival date ofmigrating birds influenced by population size? A case study of the red-backedshrike Lanius collurio. International Journal of Biometeorology 45, 217–219.
Visser, M.E., Both, C., 2005. Shifts in phenology due to global climate change: theneed for a yardstick. Proceedings of the Royal Society B 272, 2561–2569.
Zhang, X., Tarpley, D., Sullivan, J.T., 2007. Diverse responses of vegetation phenologyto a warming climate. Geophysical Research Letters 34, L19405. doi:10.1029/2007GL031447.
variability in phenological responses to warming temperatures. Biol. Con-
Related Documents