Spatial and bathymetric trends in Harpacticoida (Copepoda) community structure in the Northern Gulf of Mexico deep-sea Jeffrey G. Baguley a, ⁎ ,1 , Paul A. Montagna a , Woncheol Lee b , Larry J. Hyde a , Gilbert T. Rowe c a The University of Texas at Austin, Marine Science Institute, 750 Channel View Drive, Port Aransas, TX 78373, United States b Hanyang University, Department of Life Sciences, Seoul, 133-791, Korea c Texas A&M University at Galveston, Department of Marine Biology, Galveston, TX 77553, United States Received 27 May 2005; received in revised form 25 November 2005; accepted 15 December 2005 Abstract Harpacticoid copepod community structure was analyzed at 43 stations in the northern Gulf of Mexico deep-sea to test regional and bathymetric patterns of diversity in relation to environmental variables and topographic complexity of the continental slope. Depth, longitude, and proximity to the Florida Escarpment significantly affect average phylogenetic diversity, but basins and canyons do not. Multivariate analysis reveals a significant inverse relationship between diversity and POM flux, which is confirmed by significant region-scale depth and longitude differences. Although species richness declines linearly with increasing depth, the expected number of species (rarefraction) is maximized at approximately 1200 m, and average taxonomic and phylogenetic diversity continue to increase with depth, suggesting greater morphological or functional harpacticoid diversity with increasing depth. Most stations have unique species compositions, suggesting high regional (2200 species) and global (10 5 –10 6 species) diversity by extrapolation. Therefore, processes maintaining harpacticoid diversity in the northern Gulf of Mexico deep- sea seem to rely on both small-scale dispersal and large-scale food supply mechanisms. © 2006 Elsevier B.V. All rights reserved. Keywords: Benthos; Biodiversity; Deep-sea; Environmental variables; Gulf of Mexico; Meiofauna; Multivariate 1. Introduction Deep-sea species diversity has been a topic of much interest and debate since Hessler and Sanders (1967) first suggested that these communities are more diverse than those in shallow water environments. Several hypotheses have been presented during the past 35 years of research attempting to explain why an oligotrophic environment, in which virtually all the fauna rely on few labile components of surface-derived detritus for nutrition (Sanders and Hessler, 1969; Hessler and Jumars, 1974; Gage and Tyler, 1991), and that is apparently less structurally complex than a typical “high diversity” environment, can support such a rich fauna. Etter and Mullineaux (2001) summarized some recent hypotheses attempting to answer this question: 1) local spatial heterogeneity (MacArthur, 1972; Tilman, 1982), 2) nonequilibrium dynamics (Cas- well, 1978; Armstrong and McGehee, 1980), 3) Journal of Experimental Marine Biology and Ecology 330 (2006) 327 – 341 www.elsevier.com/locate/jembe ⁎ Corresponding author. Tel.: +1 803 777 3941; fax: +1 803 777 3935. E-mail address: [email protected] (J.G. Baguley). 1 Present address: University of South Carolina, Baruch Institute for Marine and Coastal Sciences, Columbia, SC 29208, United States. 0022-0981/$ - see front matter © 2006 Elsevier B.V. All rights reserved. doi:10.1016/j.jembe.2005.12.037

Welcome message from author
This document is posted to help you gain knowledge. Please leave a comment to let me know what you think about it! Share it to your friends and learn new things together.
Transcript

y and Ecology 330 (2006) 327–341www.elsevier.com/locate/jembe
Journal of Experimental Marine Biolog
Spatial and bathymetric trends in Harpacticoida (Copepoda)community structure in the Northern Gulf of Mexico deep-sea
Jeffrey G. Baguley a,⁎,1, Paul A. Montagna a, Woncheol Lee b,Larry J. Hyde a, Gilbert T. Rowe c
a The University of Texas at Austin, Marine Science Institute, 750 Channel View Drive, Port Aransas, TX 78373, United Statesb Hanyang University, Department of Life Sciences, Seoul, 133-791, Korea
c Texas A&M University at Galveston, Department of Marine Biology, Galveston, TX 77553, United States
Received 27 May 2005; received in revised form 25 November 2005; accepted 15 December 2005
Abstract
Harpacticoid copepod community structure was analyzed at 43 stations in the northern Gulf of Mexico deep-sea to test regionaland bathymetric patterns of diversity in relation to environmental variables and topographic complexity of the continental slope.Depth, longitude, and proximity to the Florida Escarpment significantly affect average phylogenetic diversity, but basins andcanyons do not. Multivariate analysis reveals a significant inverse relationship between diversity and POM flux, which isconfirmed by significant region-scale depth and longitude differences. Although species richness declines linearly with increasingdepth, the expected number of species (rarefraction) is maximized at approximately 1200 m, and average taxonomic andphylogenetic diversity continue to increase with depth, suggesting greater morphological or functional harpacticoid diversity withincreasing depth. Most stations have unique species compositions, suggesting high regional (2200 species) and global (105–106
species) diversity by extrapolation. Therefore, processes maintaining harpacticoid diversity in the northern Gulf of Mexico deep-sea seem to rely on both small-scale dispersal and large-scale food supply mechanisms.© 2006 Elsevier B.V. All rights reserved.
Keywords: Benthos; Biodiversity; Deep-sea; Environmental variables; Gulf of Mexico; Meiofauna; Multivariate
1. Introduction
Deep-sea species diversity has been a topic of muchinterest and debate since Hessler and Sanders (1967) firstsuggested that these communities are more diverse thanthose in shallow water environments. Several hypotheses
⁎ Corresponding author. Tel.: +1 803 777 3941; fax: +1 803 7773935.
E-mail address: [email protected] (J.G. Baguley).1 Present address: University of South Carolina, Baruch Institute for
Marine and Coastal Sciences, Columbia, SC 29208, United States.
0022-0981/$ - see front matter © 2006 Elsevier B.V. All rights reserved.doi:10.1016/j.jembe.2005.12.037
have been presented during the past 35 years of researchattempting to explain why an oligotrophic environment, inwhich virtually all the fauna rely on few labile componentsof surface-derived detritus for nutrition (Sanders andHessler, 1969; Hessler and Jumars, 1974; Gage andTyler, 1991), and that is apparently less structurallycomplex than a typical “high diversity” environment, cansupport such a rich fauna. Etter and Mullineaux (2001)summarized some recent hypotheses attempting to answerthis question: 1) local spatial heterogeneity (MacArthur,1972; Tilman, 1982), 2) nonequilibrium dynamics (Cas-well, 1978; Armstrong and McGehee, 1980), 3)
328 J.G. Baguley et al. / Journal of Experimental Marine Biology and Ecology 330 (2006) 327–341
interactions among three or more trophic levels (Janzen,1970), and 4) recruitment limitation (Tilman, 1994; Hurttand Pacala, 1995). However, all of these hypotheses seemto be explainable by the balance between competitiveexclusion and frequency of disturbance, which results inpatchiness on biologically influential scales, i.e. millimeter-to-meter (Grassle and Sanders, 1973; Grassle, 1989;Lambshead, 1993) leading to microhabitat specialization(Jumars, 1975, 1976; Thistle, 1983, 1998; Thistle andEckman, 1990).
Meiobenthic community structure is regulated onsmall spatial scales (mm to cm) where patch dynamicsare a function of biogenic structures (Thistle, 1983;Thistle and Eckman, 1990), and conversely on largerscales (m to km) where benthic currents (Hicks, 1988;Thistle, 1998) and shifts in sediment grain size (Gray,1968, 1974) regulate community structure. However,the majority of deep-sea diversity studies, and hypoth-eses of mechanisms maintaining deep-sea diversity,have come from studies of macro- or megafaunal-sizedorganisms (Etter and Mullineaux, 2001). But, meio-fauna live on much smaller spatial and temporal scales(Bell, 1980; Schwinghamer, 1981), and mechanismsmaintaining meiofauna diversity may be different thanthose for the larger-sized fauna. Meiofauna lackplanktonic larval forms and therefore have limiteddispersal capabilities, which makes them useful forstudies of deep-sea diversity maintenance (Thistle,2003) over both evolutionary and ecological time scales.
Harpacticoida, an order within the subclass Cope-poda, may be well suited for deep-sea diversity studies.In addition to the aforementioned meiofauna life historycharacteristics, harpacticoid copepods have the ability toinhabit multiple habitat types (Hicks and Coull, 1983,Dahms and Qian, 2004). Harpacticoid copepods areubiquitous in marine soft-sediment habitats, and gener-ally the second most abundant meiobenthic taxon afterthe numerically dominant Nematoda (Coull and Bell,1979; Hicks and Coull, 1983; Higgins and Thiel, 1988;Giere, 1993). Harpacticoid copepod ubiquity extendsinto deep-sea environments where they have beenshown to have morphological adaptations (Montagna,1982), have proportionally increasing abundance com-pared to macrobenthos (Thistle, 2001), and exhibit highdiversity (Coull, 1972; Thistle, 1978).
Although much work has been accomplished de-scribing meiofauna community structure on smallspatial scales, few studies have addressed large region-scale patterns. More specifically, the knowledge ofregional species pools, processes structuring communi-ties on various scales, and the distributions of organismsand how they respond to topographic, geochemical, and
physical oceanographic forcing is largely unknown fordeep-sea environments (Etter and Mullineaux, 2001). Thepresent study focuses on harpacticoid copepod communitystructure in the northern Gulf of Mexico (NGOM) deep-sea. The sampling design was formulated based on thefollowing six null hypotheses: H01) there is no difference inharpacticoid diversity with depth, H02) there is nodifference in harpacticoid diversity with longitude, H03)there is no difference in harpacticoid diversity in versus outof submarine basins, H04) there is no difference inharpacticoid diversity in versus out of submarine canyons,H05) there is no difference in harpacticoid diversity withrespect to escarpments, and H06) there is no difference inharpacticoid diversity with respect to overlying watercolumn primary production. Processes affecting overlyingprimary production and interactions among physicaloceanographic process, sediment geologic and geochemicalproperties, and sea floor topography, likely affect harpacti-coid species diversity. Therefore, univariate and multivar-iate statistical methods were used to integrate regionaldifferences in the physical environment with environmentalvariables in order to more fully understand the processescontrolling harpacticoid copepod diversity in the northernGulf of Mexico deep-sea.
2. Methods
2.1. Field and laboratory methods
Harpacticoid copepod samples from 43 stations inthe northern Gulf of Mexico were collected during themonths of May and June 2000. Meiofauna werecollected by a 5.5 cm inner diameter (i.d.) core tubethat was mounted inside the GOMEX boxcorer (Bolandand Rowe, 1991). One core sample was taken from eachboxcore sample, and stored for meiofaunal communityanalysis. Five replicate cores, from separate boxcores,were taken at each station. The top 3 cm of sediment wasextruded and stored for meiofaunal community analysis.After core sections were collected, meiofauna werenarcotized in 7% MgCl2 (isotonic to seawater).Narcotizing meiofauna is necessary to minimize bodyshape distortion during the preservation process.Samples were then preserved in an equal volume of10% buffered formalin (yielding a final concentration of5% formalin) (Hulings and Gray, 1971).
In the laboratory, meiofauna were extracted fromsediment using the Ludox centrifugation technique(deJonge and Bouwman, 1977), and harpacticoidcopepods were separated from the bulk meiofaunasample by manual picking. Animals were identified tospecies using standard morphological characteristics.

329J.G. Baguley et al. / Journal of Experimental Marine Biology and Ecology 330 (2006) 327–341
Species were differentiated according to the twostandard taxonomic dichotomous keys for marineHarpacticoida (Wells, 1976; Huys et al., 1996), selectedreference texts (Huys and Boxshall, 1991, amongothers), and numerous descriptions of new speciesfrom peer reviewed journals.
2.1.1. Environmental variablesA suite of sedimentary environmental variables
were analytically measured from 5 replicate cores(6.7 cm i.d.), from separate boxcores. All chemical,geochemical, and geological analyses were performedby collaborators at Texas A&M University. Detaildescription of analytical methodology can be found inBaguley (2004). The complete environmental variabledata set is accessible at http://www.gerg.tamu.edu,with permission from G.T. Rowe.
2.2. Experimental design and statistical analyses
The sampling design included a total of 43 stations,from seven transects, along the northern continentalslope and abyssal plain of the northern Gulf of Mexicodeep-sea (Fig. 1). In the northwest (RW) region, sevenstations were sampled, including one station in the
Fig. 1. Harpacticoid copepods were identified to species at 43 stations froBathymetry is courtesy of Dr. William Bryant, Texas A&M University. High
Alaminos canyon (AC1). An additional western (W)transect was included, which was a transect from aprevious study (Pequegnat et al., 1990). In the west-central region (WC) two stations from a previous studywere included (Pequegnat et al., 1990), but stations inthis region were mainly designed to test for faunaldifferences between basin (B) and non-basin (NB)locations. The central transect (C) was also sampled byPequegnat et al. (1990), and was sampled to test fordifferences from the adjacent Mississippi Trough (MT)transect. In the northeast region 10 stations, from twotransects, were sampled perpendicular to the Floridaslope and escarpment (S).
2.2.1. Hypothesis testingSix hypotheses were investigated for differences in
harpacticoid copepod diversity. Univariate diversitydifferences were tested using at two-way completelyrandom analysis of variance (ANOVA) that is describedby the following model:
Yijk ¼ lþ aj þ bk þ abjk þ eiðjkÞ
where Yijk is the measurement for each individualreplicate, μ is the overall sample mean, αj and βk are the
m the northern Gulf of Mexico continental slope and abyssal plain.lighted contour lines are at 300 and 3000 m.
330 J.G. Baguley et al. / Journal of Experimental Marine Biology and Ecology 330 (2006) 327–341
main effects, αβjk is the interaction term, and ει(jk) is therandom error for each replicate measurement.
Five transects, RW, W, C, MT and S, were includedin the test for depth and longitude differences (H01 andH02), ranging from the Texas slope in the West to theFlorida Escarpment in the east (Fig. 1). Five stationswere included per transect, over five depth zones,consistent between transects. To test the basin hypoth-esis (H03), three basins and three adjacent non-basinstations on the Texas/Louisiana slope (Fig. 1). Theexperimental design blocked basin and non-basinstations (B1 with NB2, B2 with NB3, and B3 withNB4), to control for differing distances from shore. Thecanyon hypothesis (H04) was formulated to test fordiversity differences between stations located in theMississippi Trough (MT) compared to adjacent stationsin the central transect (C) (Fig. 1). Five MTstations werepaired with five C stations at five common depth zones,thus removing the effect of depth. The escarpmenthypothesis (H05) compared the escarpment transect to anorthwestern Gulf transect (W) that experienced agradual and relatively constant depth increase (Fig. 1).Six stations per transect were paired at equal distancefrom shore to remove this effect. The primaryproduction hypothesis (H06) was tested with multivar-iate procedures (see below).
2.3. Multivariate analysis
Abiotic variables are often correlated, so it isnecessary to create reduced data sets that remove thisautocorrelation. The reduced data sets can then becorrelated with patterns of biotic responses (e.g.,diversity). Principal component analysis reduces alarge set of intercorrelated variables into a smaller setof orthogonal (completely uncorrelated) variables. Eachnew variable (principal component) accounts for apercentage of the total variance in the original data set.The new variables are extracted in decreasing order ofvariance, such that the first few principal components(PC) explain most of the variation in the data set. Thecontribution of each environmental variable to the newPC is called a load. Typically, new PC loads can beinterpreted to indicate structure in the data set. Eachobservation contributing to the PC is called a score.Thus, the main advantage of PCA is the generation ofstation scores, which are interpretable, and can subse-quently be used in other analyses (i.e. correlation orregression with diversity).
Environmental variables included in the environ-mental PCA included chlorophyll-a (Chla) (a proxy forPOM flux) in the overlying water column as measured
from SeaWIFS satellite images. Chla was adjusted forremineralization with increasing water depth by appli-cation of the exponential model proposed by Betzer etal. (1984), and updated by Berger et al. (1988). Theamount of surface Chla reaching the sea floor isdescribed by the equation:
JðzÞ ¼ 0:409PP1:41=Z0:628
where J(z) is the flux of Chla transported downwardsthrough some depth Z, and PP is the overlying watercolumn Chla concentration. The remaining variableswere all from sediments and included grain size (sand,silt, and clay content), total polycyclic aromatichydrocarbons (PAH) excluding perylene, the tracemetals calcium (Ca), chromium (Cr), tin (Sn), andstrontium (Sr), total organic nitrogen (OrgN), particulateorganic carbon (POC), dissolved organic carbon (DOC),ammonium (NH4), urea, and nitrate (NO3).
One common problem with environmental data isthat many variables measuring the same effects canskew the result. Thus, pre-analysis was performed todetermine if certain classes of variables could bedropped from the analysis. Only the total PAH's withoutperylene was used because it served as a proxy for allorganic contaminants. A total of 29 metals weremeasured and had to be reduced for the final analysisusing an initial PCA of metals only. The first metalsprincipal component (PC1) accounted for 70.1% of thetotal variance in the metals data set, and was the only PCwith an eigenvalue greater than one. Thus, four metals,the two with highest positive and negative loadings,were chosen for the final PCA analysis. These served asa proxy for the general trace metal pattern seen at allstations.
Prior to analysis all data were transformed to validateassumptions of parametric tests, and to weight thecontribution of high or low measurements. The angulartransformation (x=arcsin sqrt[y]) was used for sedimentgrain size data, and a natural logarithm transformation(x=loge[y+1]) was used on all other data.
The non-parametric procedures multidimensionalscaling (MDS), analysis of similarity (ANOSIM), andthe biological–environmental comparison (BIOENV)were used to compare station similarity based on speciescomposition, and for further comparison with environ-mental variables (Clarke et al., 2005). Data were 4th roottransformed to deemphasize the contribution of abun-dant species. Samples were compared with clusteranalysis and MDS using both the Bray–Curtis similarityindex and taxonomic dissimilarity (Clarke et al., 2005).Stations were grouped into “zones” where station

331J.G. Baguley et al. / Journal of Experimental Marine Biology and Ecology 330 (2006) 327–341
similarity was greater than or equal to 20% of thespecies composition, based on cluster analysis.Stations less than 20% similar to any other stationwere identified as unique zones. GIS-based analyseswere performed (ArcView 8.0, ESRI) to analyzeharpacticoid community zonation over the entirenorthern GOM. Stations were plotted and labeledwith the appropriate “zone” to identify region-scalesimilarities in species composition. ANOVA and PCAprocedures were accomplished using SAS statisticalsoftware (SAS Institute Inc., 1991). Non-parametricsimilarity, MDS, cluster analysis, and BIOENVprocedures were conducted with Primer v5 and v6(Primer-E, Ltd.).
2.4. Diversity estimates
Rarefraction was used to estimate the expectednumber of species, thus, accounting for differences inabundance due to bathymetric gradients. Hurlbert(1971) describes the model as calculating the proportionof potential inter-individual encounters in a givensample. The model is described by the equation:
EðSnÞ ¼XSi¼1
l �N�N1
n
� �Nn
� �" #
E(Sn) describes the expected number of species found ina sample of n individuals drawn from a population of Ntotal individuals distributed among S species.
Harpacticoid diversity was also estimated with newlydeveloped diversity indices that are based on phyloge-netic structure within the sample (Clarke and Warwick,2001), and therefore give a measure of relativefunctional diversity. Average taxonomic diversity (Δ)is defined as (Warwick and Clarke, 1995):
D ¼ ½RRibj�=½NðN � 1Þ=2�where the double summation is over all pairs of species iand j, and N is the total number of individuals in thesample. “Simply put, average taxonomic diversity canbe thought of as the average taxonomic distance apart ofevery pair of individuals in the sample, or the expectedpath length between any two individuals chosen atrandom” (Clarke and Warwick, 2001). Similarly,average phylogenetic diversity (Φ+):
Uþ ¼ PD=S
is the cumulative branch length of a sample's phyloge-netic tree (PD), divided by the number of species (S) inthe sample (Clarke and Warwick, 2001). Average
phylogenetic diversity can be thought of as the “totalevolutionary history, genetic turnover, or morphologicalrichness” represented within the sample (Clarke andWarwick, 2001). Determination of Δ and Φ+ was basedon a 4-level taxonomic scheme, from species to order.All diversity indices were calculated in Primer 5.0(Primer-E Ltd.).
2.5. Regional and global biodiversity estimates
Regional and global species richness was estimatedby extrapolation. This method uses a single survey,from a single region of the world, to plot speciesfound versus sample number (Lambshead and Bou-cher, 2003). When the species number reaches amaximal accumulation rate it is possible to estimatethe rate of encounter of new species with distancetraveled. This rate can be expanded to the area of thegeographic region sampled, allowing for furtherextrapolation to global scales. Extrapolation estimatesgenerally require large data sets, preferably from thedeep-sea, which accounts for the majority of marinesurface area and probably the majority of benthicmarine species. Harpacticoid copepod species abun-dance was analyzed for DGoMB stations along with aprevious study on the Texas continental shelf(Montagna and Harper, 1996) in order to estimatethe entire northern Gulf of Mexico species pool.Species accumulations curves were constructed usingColwell's EstimateS 6.1 program, with fifty randomizedruns (http://viceroy.eeb.uconn.edu/EstimateS). A sig-moidal growth model [y=(ab+cxd) / (b+xd)] was fittedto each data set in order to extrapolate regional diversity(Hyams Curve Expert 1.3, http://www.ebicom.net/~dhyams/cvxpt.htm) (see also Lambshead, in press).
3. Results
3.1. General results
In total 12,480 harpacticoid individuals were col-lected, of which 7667 were in the copepodite stage, 1159were damaged adults (unidentifiable), and 3654 wereadult specimens suitable for identification. Of 3654individuals, 696 species were identified from 22families and 175 genera. Nine families accounted forapproximately 93% of all harpacticoida (Table 1), andtwo, Tisbidae and Ectinosomatidae, accounted for 46%.Approximately 3% of these species have been formallydescribed in the literature.
Average abundance over all stations (from fivepooled replicate cores=118.8 cm2) was 172±94, with

Table 1Percent contribution of Harpacticoida families to total harpacticoidabundance
Family AA Contrib.% T%
Tisbidae 40.19 32.98 32.98Ectinosomatidae 24.12 13.27 46.24Diosaccidae 19.74 9.84 56.09Ameiriidae 15.71 8.24 64.33Argestidae 11.00 8.08 72.41Paranannopidae 9.15 6.50 78.91Canthocamptidae 12.38 6.03 84.95Paramesochriidae 6.73 4.15 89.10Cletodidae 6.62 3.42 92.52Neobradyidae 2.73 1.39 93.91Thalestridae 2.34 1.09 95.00Normanellidae 2.41 1.09 96.08Cerviniidae 2.55 1.05 97.13Danielssenidae 3.55 0.93 98.06Huntemannidae 1.70 0.93 98.99Unid. family 1.79 0.61 99.60Ancorabolidae 1.21 0.32 99.93Laophontidae 0.42 0.03 99.96Canuellidae 0.28 0.03 99.99Darcythompsonidae 0.19 0.01 100.0Longipedidae 0.16 0.00 100.0Euterpinidae 0.05 0.00 100.0
AA=Average abundance, Contrib.%=percent contribution of family,T%=cumulative percent contribution of families.
Table 2Total species (S) and total individuals (N) per five pooled replicatescores (=118.8 cm2)
Station Depth S N ES(30) Δ Φ+
AC1 2440 51 114 24.91 102.14 59.79B1 2253 27 74 19.56 105.25 70.97B2 2635 32 90 20.27 102.51 62.74B3 2600 37 108 21.00 96.59 64.92C1 336 51 195 19.70 96.85 58.63C12 2924 34 125 17.34 95.37 70.14C14 2495 33 118 17.37 93.49 66.12C4 1463 56 148 23.98 101.77 63.23C7 1066 74 212 24.64 96.27 54.62MT1 482 69 322 22.68 91.44 57.51MT2 677 67 338 21.45 92.72 53.06MT3 990 81 418 21.68 92.99 55.02MT4 1401 53 144 23.80 101.76 63.93MT5 2267 44 110 23.35 102.31 62.27MT6 2743 23 54 18.92 111.88 79.92NB2 1530 40 112 22.14 99.71 64.78NB3 1875 50 120 24.02 101.57 63.81NB4 2020 39 108 21.76 100.51 63.91NB5 2065 36 94 21.90 101.88 65.86RW1 212 66 240 23.54 95.83 57.38RW2 950 57 178 23.41 97.50 59.27RW3 1340 61 174 23.47 95.49 57.34RW4 1575 57 148 24.28 101.27 65.85RW5 1620 43 112 22.56 101.49 66.40RW6 3000 49 130 22.99 96.16 61.75S35 668 89 388 23.02 93.75 54.72S36 1826 74 306 23.14 95.58 56.98S37 2387 70 198 24.49 99.48 60.17S38 2627 44 108 23.36 100.96 63.09S39 3000 38 96 21.85 102.23 66.89S40 2972 30 78 19.94 105.63 71.18S41 2974 31 84 20.69 104.42 72.10S42 763 58 178 23.33 98.33 57.55S43 362 57 178 23.17 95.31 56.08S44 212 41 133 20.14 99.64 64.76W1 420 94 306 25.46 96.45 56.50W2 625 65 214 23.12 97.02 56.36W3 875 65 212 23.55 96.13 57.16W4 1460 52 146 23.79 100.75 66.58W5 2750 35 86 22.10 101.27 64.93W6 3150 33 108 17.39 90.01 68.15WC12 1175 52 180 21.75 98.55 62.62WC5 348 104 412 25.26 96.28 55.24
Species diversity indices: expected species per 30 individuals [ES(30)], average taxonomic diversity (Δ), and average phylogeneticdiversity (Φ+) at each of the 43 stations where harpacticoid copepodswere identified to species.
332 J.G. Baguley et al. / Journal of Experimental Marine Biology and Ecology 330 (2006) 327–341
maximum and minimum values of 412 and 54, found atstations WC5 and MT6, respectively (Table 2). Theaverage number of species was 52±19 (from pooledreplicate cores) with maximum and minimum values of104 and 23, found at stations WC5 and MT6,respectively (Table 2). Total abundance (N) and speciesrichness (S) decrease significantly (R2 =0.466 and0.495, respectively) with increasing water depth (Fig.2A,B). The number of species is highly correlated to thenumber of individuals encountered (r=0.91).
The expected number of species per 30 harpacticoidindividuals [ES(30)] shows a moderate non-linear,unimodal relationship with depth (R2 = 0.312,P=0.0006, Fig. 3). Mean ES(30) was 22.24 withstandard deviation of 2.08 (calculated from Table 2).Maximum values of ES(30) are found at stations WC5and W1, while minimum values are found at stationsC12, C14, and W6. Although the relationship ismoderately significant, ES(30) is highly variable atboth shallow and deep stations (Fig. 3).
Average taxonomic diversity (Δ) increases withincreasing water depth (R2 =0.185, P=0.004, Fig.4A). Δ had a mean value of 98.76 and standarddeviation of 4.24 (calculated from Table 2). Highestaverage taxonomic diversity was found at station MT6(111.88), with lowest values at station MT1 (91.44).
Although the relationship is moderately significant,variance in Δ increases at deep stations (Fig. 4A).Average phylogenetic diversity (Φ+) shows a strong, andhighly significant, increasing trend with depth(R2 =0.500, Pb0.0001, Fig. 4B). The mean value ofaverage phylogenetic diversity was 62.33 with standard

Fig. 2. (A) Harpacticoid copepod abundance (N) and (B) speciesrichness (S), adjusted to the number per 10 cm2, as a function of depth.Abundance and richness are highly correlated (r=0.91).
Fig. 4. (A) Average taxonomic diversity (Δ), and (B) averagephylogenetic diversity (Φ+) for pooled replicate core samples ofharpacticoid copepods.
333J.G. Baguley et al. / Journal of Experimental Marine Biology and Ecology 330 (2006) 327–341
deviation of 5.73 (calculated from Table 2). Maxi-mum average phylogenetic diversity of 79.92 wasfound at station MT6, while the minimum was 54.62at station C7 (Table 2). Both Δ and Φ+ suggest aproportionally greater number of higher order taxa(genera and families) per individual with increasingdepth.
Fig. 3. Expected number of harpacticoid species per 30 individuals[ES(30)], for pooled replicate core samples of harpacticoid copepods.
3.2. Univariate analysis
In the test for differences in average phylogeneticdiversity over depth and longitude (H01 and H02), ahighly significant depth main effect was observed(Pb0.0001, Table 3), but a weak significant interactionwas also observed (P=0.0203, Table 3). Overall,harpacticoid Φ+ responded similarly over most transectswith a small peak in Φ+ at mid depths (approx.1500 m)followed by relatively constant diversity until a secondpeak at depths greater than 3000 m. The eastern stations(S transect) have a decrease in Φ+ at shallow depths (S44to S35), but then a constant increase in Φ+ withincreasing depth.
In the test for differences in Φ+ between basin andnon-basin stations (H03) no significant differences wereobserved for main effects, and no interaction wasobserved (Table 3). Similarly, in the test for canyoneffects (H04) no significant difference in Φ+ wasobserved between canyon and non-canyon transects,but a significant depth effect was observed (Pb0.0001,Table 3). No significant canyon by depth interaction wasobserved between (Table 3). In the test for escarpmenteffects on Φ+, a weak transect main effect was observed

Fig. 5. Regression of average phylogenetic diversity (Φ+) as a functionof (A) environmental PC1 and (B) PC2. Φ+ is not significantly relatedto sediment properties (PC1), but is significantly related to POM flux(PC2).
Table 3ANOVA results of test for differences in Harpacticoida diversity
Source DF SS MS F value PrNF
H01 and 02
Transect 4 110.02 27.51 0.50 0.7332Depth 4 2198.28 549.57 10.06 b .0001T⁎depth 16 1749.36 109.34 2.00 0.0203Error 96 5243.96 54.62
H03
Treatment 1 16.45 16.45 0.18 0.6711DFS 2 109.87 54.93 0.62 0.5479T⁎DFS 2 57.33 28.67 0.32 0.7277Error 23 2045.74 88.95
H04
Transect 1 2.67 2.67 0.05 0.8312Depth 4 1870.96 467.74 8.08 b .0001T⁎depth 4 302.41 75.60 1.31 0.2855Error 37 2141.06 57.87
H05
Transect 1 241.31 241.31 4.73 0.0347DFFS 5 56.15 11.23 0.22 0.9521T⁎DFFS 5 1450.89 290.18 5.69 0.0003Error 47 2396.81 50.99
Dependent variable is average phylogenetic diversity (Φ+). DFS=dis-tance from shore; DFFS=distance from first station.
334 J.G. Baguley et al. / Journal of Experimental Marine Biology and Ecology 330 (2006) 327–341
(P=0.035, Table 3) but strongly significant interactionbetween transect and distance from first station wasobserved (P=0.0003, Table 3). There is a peak indiversity at the two deep stations below the FloridaEscarpment (S40 and S41), and then a decrease indiversity moving away from the escarpment (S39). Thewestern (W) transect had a peak in Φ+ at approximately1500 m (W4), and a second peak at the deepest station(W6).
3.3. Multivariate analysis
Complete details the environmental PCA, includingeigenvalues of the correlation matrix, percentage of totalvariance accounted for by each PC, and variable loadscan be found in Baguley (2004). Briefly, PC1 wasinterpreted as sediment properties. Highly positivestation scores (N1) on PC1 characterized stations nearMississippi River outflow with high silt, Cr, Sn and totalPAH. Station scores between 1 and −1 represented thegeneral offshore environment with moderate silt, clay,sand, Ca, and Sr. Stations with highly negative scores onPC1 (b−1) had a high sand fraction relative to silt andclay. PC2 was interpreted as POM flux. Highly positivestation scores on PC2 (N1) were those near MississippiRiver outflow in the northeastern GOM. Stations scoresb1 and moving in the negative direction were deeperand further away from Mississippi River outflow. PC1through PC4 were regressed against average phyloge-
netic diversity (Φ+) to determine the percentage ofvariance within the diversity data set that is accountedfor by environmental variables. PC1 had a non-significant relationship with Φ+ (Fig. 5A), but revealsthe overall homogeneity in sediment properties in thenorthern GOM; with the exception of a few stations nearMississippi River outflow with high silt (MT1-3, C1),and a few stations in the west (W3, W4) and east (S43,S44) with high sand. Conversely, PC2 (POM flux) wasstrongly related to average phylogenetic diversity (Φ+),with highest values of diversity corresponding to lowestvalues of POM flux (Fig. 5B, R2 =0.316, P=0.0002).
Non-parametric comparisons of the biotic and abioticmatrices yielded constrasting results. No strong correla-tions were observed between harpacticoid communitystructure and the environmental variables, but a weakcorrelation (0.228) was found between the biotic dataand five environmental variables (%sand, %clay, %silt,Chla, and OrgN).
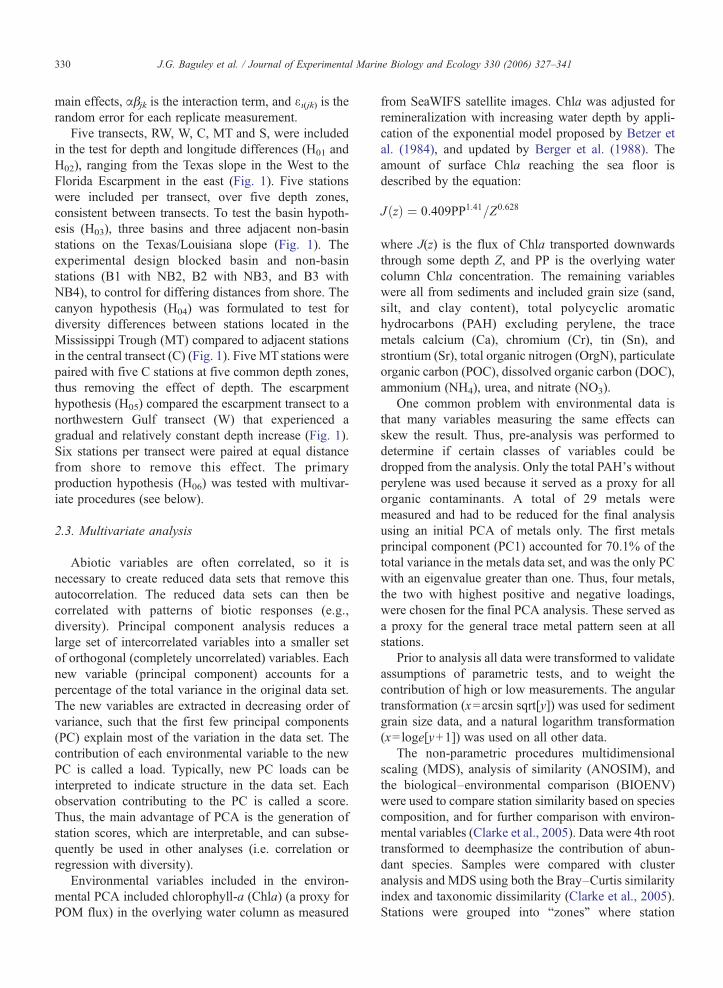
MDS plots showed moderate differences betweenstations at depth zones of 1000 m increments (Fig. 6A,B). However, group differences were more distinct
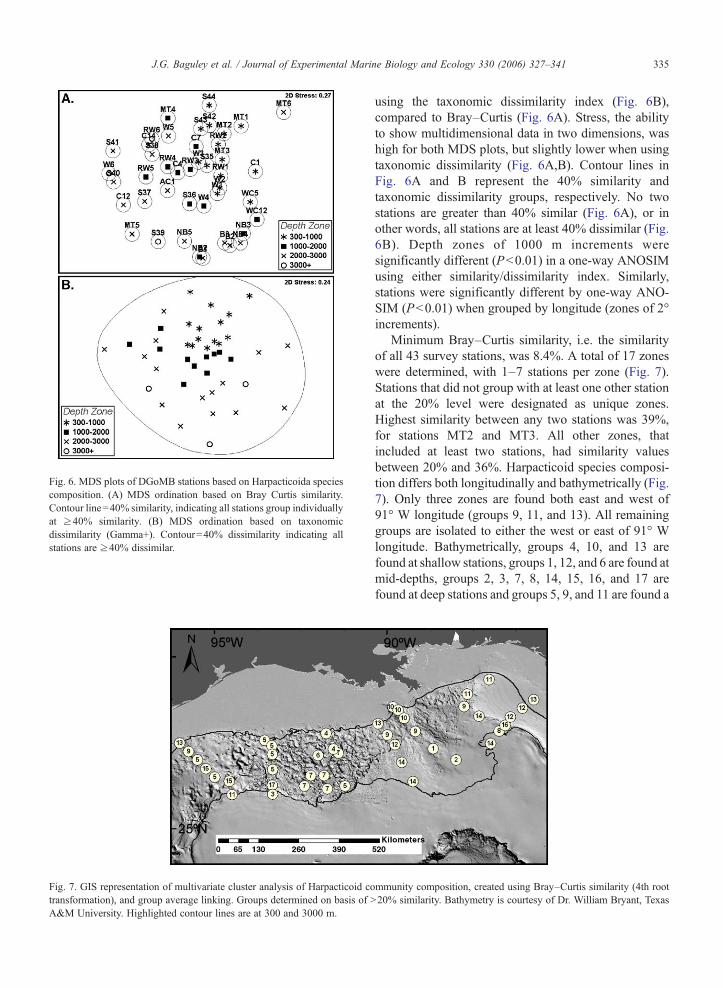
Fig. 6. MDS plots of DGoMB stations based on Harpacticoida speciescomposition. (A) MDS ordination based on Bray Curtis similarity.Contour line=40% similarity, indicating all stations group individuallyat ≥40% similarity. (B) MDS ordination based on taxonomicdissimilarity (Gamma+). Contour=40% dissimilarity indicating allstations are ≥40% dissimilar.
Fig. 7. GIS representation of multivariate cluster analysis of Harpacticoid cotransformation), and group average linking. Groups determined on basis of NA&M University. Highlighted contour lines are at 300 and 3000 m.
335J.G. Baguley et al. / Journal of Experimental Marine Biology and Ecology 330 (2006) 327–341
using the taxonomic dissimilarity index (Fig. 6B),compared to Bray–Curtis (Fig. 6A). Stress, the abilityto show multidimensional data in two dimensions, washigh for both MDS plots, but slightly lower when usingtaxonomic dissimilarity (Fig. 6A,B). Contour lines inFig. 6A and B represent the 40% similarity andtaxonomic dissimilarity groups, respectively. No twostations are greater than 40% similar (Fig. 6A), or inother words, all stations are at least 40% dissimilar (Fig.6B). Depth zones of 1000 m increments weresignificantly different (Pb0.01) in a one-way ANOSIMusing either similarity/dissimilarity index. Similarly,stations were significantly different by one-way ANO-SIM (Pb0.01) when grouped by longitude (zones of 2°increments).
Minimum Bray–Curtis similarity, i.e. the similarityof all 43 survey stations, was 8.4%. A total of 17 zoneswere determined, with 1–7 stations per zone (Fig. 7).Stations that did not group with at least one other stationat the 20% level were designated as unique zones.Highest similarity between any two stations was 39%,for stations MT2 and MT3. All other zones, thatincluded at least two stations, had similarity valuesbetween 20% and 36%. Harpacticoid species composi-tion differs both longitudinally and bathymetrically (Fig.7). Only three zones are found both east and west of91° W longitude (groups 9, 11, and 13). All remaininggroups are isolated to either the west or east of 91° Wlongitude. Bathymetrically, groups 4, 10, and 13 arefound at shallow stations, groups 1, 12, and 6 are found atmid-depths, groups 2, 3, 7, 8, 14, 15, 16, and 17 arefound at deep stations and groups 5, 9, and 11 are found a
mmunity composition, created using Bray–Curtis similarity (4th root20% similarity. Bathymetry is courtesy of Dr. William Bryant, Texas

336 J.G. Baguley et al. / Journal of Experimental Marine Biology and Ecology 330 (2006) 327–341
virtually all depths. Seven stations are characterized aszone 5 in the northwestern GOM, but these stations areall less than 40% similar. In total, 77 species are found inzone 5, with 5 species accounting for 34% of the totalabundance (Halectinosoma aff. gothiceps, Tisbidae sp.1,Tisbidae sp.2 Bradya aff. congenera, Ameira aff.parvula). Tisbidae sp.1, Tisbidae sp. 2, Halectinosomaaff. gothiceps, and Bradya aff. congenera, are cosmo-politan over all stations, accounting for 25% of the totalabundance; and together with Tachidiopsis aff. bozici,Halectinosoma aff.herdmani, Paraleptopsyllus sp.Zosime aff. mediterranea, and Zosime aff. incrassata,account for 40% of the total abundance at all 43 stations.
3.4. Regional and global biodiversity estimates
Two Gulf of Mexico data sets were analyzed in orderto extrapolate to regional and global scales. Speciesaccumulation curves (Fig. 8) were constructed for eachdata set. The convex nature of the curves suggests thatan asymptote exists, given an unlimited sample pool(Lambshead and Boucher, 2003). The sigmoidal growthmodel parameters for the two data sets were as follows:NGOM, a=−16.6, b=541.1, c=1739.7, and d=0.72;NWGOM, a=−2.28, b= 166.08, c= 457.06, andd=0.57. The models for both NGOM and NWGOMfitted the data very closely, R2 =0.99996 and 0.99980,respectively. The model interpolation indicates thatasymptotes exist at 1740 and 457 species for deep-sea(NGOM) and shallow (NWGOM) regions of the Gulf ofMexico respectively. Species accumulation curvesbecome linear as they approach the asymptotes(estimates of regional diversity), and thus suggest the
Fig. 8. Harpacticoida species accumulation curves for shallow water(NWGOM) and deep water (NGOM) regions in the northern Gulf ofMexico. Note: greater species richness for deep-sea environmentdespite nearly 10× fewer individuals collected.
rate of encounter of new species is relatively constantwith increasing geographic distance or area sampled.Summing the shelf and deep-sea estimates yields theregional biodiversity of the entire Gulf of Mexico atapproximately 2200 species, assuming there is nooverlap between shallow shelf and deep-sea species.The approximate area of the Gulf of Mexico is 1.5×10⁶
km2, which is about 0.4% of the world's oceans.Assuming the rate of increase of new species with arearemains constant then extrapolation suggests a globalspecies richness of 5.5×10⁵ for the Harpacticoida.
4. Discussion
Harpacticoida abundance (N) and species richness(S) decrease in strong linear relationships with depth(Fig. 2A,B), as observed in previous deep-sea investi-gations (Tietjen, 1971; Coull et al., 1977; Shirayama,1984; Soltwedel, 2000 and reference therein). Howev-er, the rate of decrease is approximately five timesgreater for abundance than richness (comparison ofslopes, N /S=−0.068 /−0.014). Gray et al. (1997)reviewed several studies and found the number ofmacrofauna species per individual was comparable incoastal and deep-sea environments; with the exceptionof a deep-sea data set by Etter and Grassle (1992), whichshowed much higher S :N ratios in the deep-sea. Theoverall ratio of species to individuals (696 /3680)reveals a new species being encountered in one out ofevery five individuals.
The expected number of harpacticoid species per 30individuals [ES(30)] follows the typical unimodalrelationship (Paterson and Lambshead, 1995; Etter andMullineaux, 2001; Lambshead et al., 2002; and others)with a maximum diversity found at approximately 1200m water depth and decreasing diversity moving intodeeper water (Fig. 2, R2 =0.312, P=0.0006). Coull(1972) used rarefaction curves to compare continentalshelf and deep-sea harpacticoid species in the northAtlantic and found maximum diversity at 3000 m, withdecreasing diversity thereafter. Macrofaunal diversity inthe north Atlantic has been shown to peak at 1250 musing the Hurlbert rarefraction method (Maciolek-Blakeet al., 1985; Maciolek et al., 1987). Similarly,polychaete diversity in the northeast Atlantic peaksbetween 1000 and 2000 m (Paterson and Lambshead,1995).
Perhaps the best approach to comparing communitystructure over large bathymetric gradients is by ameasure of taxonomic distances (Warwick and Clarke,1995), such as average taxonomic diversity (Δ) andaverage phylogenetic diversity (Φ+) (Clarke and

337J.G. Baguley et al. / Journal of Experimental Marine Biology and Ecology 330 (2006) 327–341
Warwick, 2001). Average taxonomic diversity is samplesize independent, and reflects the average branch lengthbetween any two individuals chosen at random from agiven sample, provided they are not from the samespecies (Clarke and Warwick, 2001). Average phyloge-netic diversity (the total branch length of the phyloge-netic tree) is not sample size independent, but correctsfor sample size differences by dividing by the number ofspecies in the sample. Average taxonomic and phylo-genetic diversity both increase linearly increasing waterdepth (Fig. 4A and B), although average taxonomicdiversity shows considerably more variance at depths ofapproximately 3000 m. Spatial and bathymetric trendsin harpacticoid diversity exist in the northern Gulf ofMexico deep-sea, as confirmed by the significant depth(H01) by longitude (H02) interaction (P=0.0203, Table3). These results suggest an increase in harpacticoidmorphological or functional diversity with increasingdepth due to proportionally more higher-order taxa(genera and families) per individual with increasingwater depth.
Average phylogenetic diversity was not significantlydifferent between basin and adjacent non-basin stations(H03); suggesting communities located in the west-central Gulf have similar morphological complexity.Although they reside in contrasting topographic envir-onments, basin and non-basin stations have comparablesediment structure and receive comparable POM flux(Fig. 5A). Average phylogenetic diversity is notsignificantly different between canyon and non-canyonstations (H04) (Table 3), however, a significant deptheffect does suggest that morphological complexityincreases similarly with depth along the MT and Ctransects.
Average phylogenetic diversity changed differentlywith depth between escarpment (H05) and non-escarp-ment transects (P=0.0003), which may be attributed tostrong hydrodynamic regimes resulting from LoopCurrent impingement on the escarpment. Strong hydro-dynamic regimes can significantly alter abundance anddiversity of meiofauna (Thistle et al., 1985, 1991, 1999).Stations along the Florida Escarpment transect S39–S44, especially S40–S42, experience strong currentregimes due to impingement by the Loop Current (Roweet al., in preparation), and have a high sand fractionwithin the sediment structure, compared to otherDGoMB stations. In a study of the Fieberling Guyot, aphysically reworked site, Thistle et al. (1999) foundlower abundance of surface-dwelling harpacticoids, ahigher proportion of interstitial harpacticoids, and ahigher harpacticoid to nematode ratio. Sediments at theFieberling Guyot are dominated by sand (greater than
90% by mass), whereas sediments along the FloridaEscarpment transect are comprised of 20% to 50% sandmass. Station in the northern GOM are comprised of 2%to 20% sand mass. The dynamic conditions associatedwith loop current interaction with the Florida escarp-ment, rapid increase in water column depth, and highsand fraction are likely responsible for the increase inharpacticoid diversity at stations directly below theescarpment.
Because most deep-sea communities are reliant uponsinking POM derived from surface water production,food resources should play a significant role in thenumber and types of species present in a community.Comparing environmental principal components (PC1and PC2) to a single diversity index (Φ+) reveals norelationship with sediment characteristics (PC1), but aninverse relationship between POM flux (PC2) andfunctional diversity (Fig. 5A and B). The availability offood resources has been used to explain both bathymet-ric (Rex, 1981; Levin et al., 1994) and geographic(Levin et al., 1991; Rex et al., 1993; Lambshead et al.,2000, 2002) diversity patterns. The general consensus isthat increased POM flux results in increased abundance,a shift towards dominance, and therefore a decrease indiversity. Short-term laboratory experiments of organicenrichment (Grassle and Morse-Porteous, 1987; Snel-grove et al., 1996) confirm what has been observed inseveral field experiments (Schaff et al., 1992; Rex et al.,1993; Levin et al., 1994; Levin and Gage, 1998), thatdiversity is maximized at moderate levels of organicenrichment. Large-scale bathymetric and latitudinaldiversity patterns are generally unimodal, with highestdiversity at intermediate levels of production (depth,latitude, etc.) (Rex, 1981; Levin and Gage, 1998), whichis corroborated here (Fig. 5B). The mechanism fordecrease in diversity at high levels of production isthought to result from competitive exclusion due toincreased dominance (Levin and Gage, 1998), but couldalso result from chemical stress associated withincreased biological oxygen demand (Levin et al.,2000).
Although phylogenetic-based diversity indices areuseful for understanding higher taxonomic or morpho-logical diversity, they do not differentiate on the basis ofactual species composition. Therefore, to compare manystations on a regional scale it is necessary to employmultivariate procedures to analyze similarities betweenstations, based on their species composition (Warwickand Clarke, 1991; Montagna and Harper, 1996). Therelatively small similarity between stations (10–40%) isdue to the existence of a few (apparently) cosmopolitanspecies. The 20% similarity benchmark was sufficient to

338 J.G. Baguley et al. / Journal of Experimental Marine Biology and Ecology 330 (2006) 327–341
differentiate between the northeastern and northwesternGulf of Mexico, with only three similar zones found onboth sides of the 91° W longitude boundary (Zones 9, 11and 13; Fig. 7). Virtually all stations were different withrespect to harpacticoid species composition. On thecontrary, recent analysis of nematode diversity from thenorth-central equatorial Pacific revealed 71% of allspecies being found at four stations spanning more than3000 km of abyssal plain (Brown, 1998; Lambshead etal., 2003; Lambshead and Boucher, 2003), suggesting anincrease in cosmopolitan species at abyssal depths. Thisis consistent with previously observed bathymetricdiversity patterns where diversity is maximized in thebathyal and decreases in the abyssal (Maciolek-Blake etal., 1985; Maciolek et al., 1987; Paterson and Lambs-head, 1995; Etter and Mullineaux, 2001; Lambshead etal., 2002). Our data, however, suggests very little overlapbetween stations on spatial scales of less than 50 km.
On global scales, macrobenthos diversity has beenestimated to be at least 5×10⁵–10×107 species (Grassleand Maciolek, 1992; May, 1992; Poore and Wilson,1993), with meiofauna diversity equaling or exceedingthat estimate by one to two orders of magnitude(potentially 109 species) (Lambshead, in press). It isestimated that harpacticoid regional species richnesswithin the northern Gulf of Mexico is approximately2200 species. Furthermore, estimates of global speciesrichness, by extrapolation from regional species accu-mulation (sensu Lambshead and Boucher, 2003) ofHarpacticoida suggest between 105 and 106 harpacti-coid species. Although estimates are dramatically higherthan the number of described species (4500, for marineand freshwater species), they are in line with globalestimates of other highly diverse taxa, e.g., Nematoda(May, 1988; Lambshead and Boucher, 2003).
Several hypotheses have been formulated to explainthe mechanisms regulating high deep-sea diversity, butthe fall under two broad categories: 1) small-scale patchdynamics and 2) large-scale regional processes (for athorough review see Etter and Mullineaux, 2001).Recently, Rex et al. (2005) proposed a source-sinkhypothesis for the maintenance of macrofaunal abyssalbiodiversity, which states that reproductively unstableabyssal populations are maintained by immigrants frommore reproductively stable bathyal populations. How-ever, this hypothesis is dependent upon planktoniclarval dispersal, which may be able to transportplanktonic larvae several hundred to thousands ofkilometers on deep-water currents (Rex et al., 2005).The source-sink hypothesis does not adequately explainmeiofauna deep-sea diversity maintenance, becausemeiofauna lack planktonic dispersal.
Harpacticoida, and other meiofauna, have shortergeneration times than macrofauna or megafauna, haveslower movement, have non-planktonic larvae, and withsmaller body sizes live on ecologically smaller scales(Hicks and Coull, 1983; Higgins and Thiel, 1988; Giere,1993; Thistle, 2003). Without planktonic larval stages,harpacticoid dispersal is dependent upon suspension andtransport by current flow, turbidity currents, or someother transport mechanism. The rate of dispersal ofmeiofaunal organisms on a global scale is unknown.Limited evidence suggests harpacticoid patchiness on100 m, meter, and centimeter scales (Thistle, 1978) isconsistent with Jumar's (1975) grain matching hypoth-esis, and such patchiness should result in speciesdispersions on these scales (Thistle, 1978). Furthermore,genetic evidence suggests the existence of crypticspecies within previously assumed cosmopolitan popu-lations (Schizas et al., 1999; Rocha-Olivares et al.,2001), and small-scale (100 m) dispersion patterns ofgenetic haplotypes within populations (Street andMontagna, 1996). Therefore, it is unlikely that meio-faunal diversity is maintained by source-sink dynamics.
Although diversity maintenance and speciation havebeen historically discussed as separate topics, recenttheoretical evidence suggests that species diversity mayactually drive speciation (Emerson and Kolm, 2005),that is, diversification may be strongly related to thenumber of species present. Given what we know ofharpacticoid ecology (Hicks and Coull, 1983), and theirubiquity and abundance, the potential for speciation ishigh. Meiofauna are proportionally more abundant(m−2) in deep-sea sediments than macrofaunal (Pequeg-nat et al., 1990; Rowe et al., in preparation). The totalnumber of Harpacticoida species collected (696)exceeds the number of macrofaunal invertebrate speciescollected as part of the DGoMB program (Amphipoda,118 species; Cumacea, 119 species; Isopoda, 132species; Mollusca, 118 species; Polychaeta, 498 species)(Rowe et al., in preparation). Therefore, it is areasonable a priori assumption that meiofauna rates ofspeciation exceed those of macrofaunal invertebrates.Furthermore, given recent acceptance that speciesrichness may drive diversification (Emerson andKolm, 2005), meiofaunal diversity maintenance in thedeep-sea may be largely a function of speciation.
The results of this study allow for a few conclusionsto be made regarding processes structuring deep-seaharpacticoid communities. First, α-diversity (local, orper core species richness) decreases with depth (Fig.2B), therefore high deep-sea diversity may be a functionof the deep-sea's vast area (Abele and Walters, 1979).Thus, deep-sea soft-sediment communities are not

339J.G. Baguley et al. / Journal of Experimental Marine Biology and Ecology 330 (2006) 327–341
space-limited, as animal abundances are one to twoorders of magnitude lower than that observed in shallowwater systems (Coull, 1999). Low station similaritiessuggest low rates of dispersal and potentially high ratesof speciation. Few cosmopolitan species observed Gulf-wide indicate small between-station similarities. There-fore, β- (rate of encounter of new species) and γ-diversity (the regional or global species pool) are large(Figs. 6 and 7), reinforcing our regional diversityestimate of at least 2200 species, and global estimateof 105–106 species. Morphological complexity isinversely related to POM flux and increases withdepth. Therefore, processes maintaining harpacticoiddiversity in the northern GOM likely rely on both large-scale food supply mechanisms and small-scale dispersalmechanisms that result in diversity creation andmaintenance through speciation.
Acknowledgments
For many hours of lab work, we thank Rick Kalke,Chris Kalke, and Kristi Jones. We thank the captain andcrew of the R/V Gyre for their assistance. Chemical,geochemical, and geological data was provided by Drs.Luis Cifuentes, Bobby J. Presley, William Bryant, TerryWade, John Morse, Doug Biggs, and their respectiveassociates at Texas A&M University. We would like tothank the captain and crew of the R/V Gyre for theirassistance. This research was funded in part by the U.S.Department of Interior, Minerals Management Service,Contract No. 1435-01-99-CT-30991 via a subcontractfrom the Texas Engineering Experiment Station. Theresearch is part of the Deepwater Program: NorthernGulf of Mexico Continental Slope Habitats and BenthicEcology (DGoMB, Deep Gulf of Mexico Benthos, G.T.Rowe PI). Other partial support was provided by theUniversity of Texas Marine Science Institute via a LundGraduate Fellowship. This manuscript was derived fromthe primary author's doctoral dissertation.[SS]
References
Abele, L.G., Walters, K., 1979. Marine benthic diversity—critique andalternative explanation. J. Biogeogr. 6, 115–126.
Armstrong, R.A., McGehee, R., 1980. Competetive exclusion. Am.Nat. 115, 151–170.
Baguley, J.G. 2004. Meiofauna community structure and function inthe northern Gulf of Mexico deep sea. Ph.D. Thesis. TheUniversity of Texas at Austin, USA. 201 pp.
Bell, S.S., 1980. Meiofauna–macrofauna interactions in a high salt-marsh habitat. Ecol. Monogr. 50, 487–505.
Berger, W.H., Fischer, K., Lai, C., Wu, G., 1988. Ocean carbon flux:maps of primary production and export production. In: Agegian,
C.R. (Ed.), Biogeochemical Cycling and Fluxes Between theDeep Euphotic Zone and Other Oceanic Realms. NOAA,Washington D.C., pp. 131–176.
Betzer, P.R., Showers, W.J., Laws, E.A., Winn, C.D., DiTullio, G.R.,Kroopnick, P.M., 1984. Primary productivity and particle fluxes ona transect of the equator at 153EW in the Pacific Ocean. Deep-SeaRes. 31, 1–11.
Boland, G.S., Rowe, G.T., 1991. Deep-sea benthic sampling with theGOMEX box corer. Limnol. Oceanogr. 36, 1015–1020.
Brown, C.J. 1998. Effects of a Phytodetrital Input on NematodeCommunities of the Abyssal, Equatorial Pacific. Ph.D. disserta-tion. University of Southampton, UK.
Caswell, H., 1978. Predator-mediated coexistence: a nonequilibriummodel. Am. Nat. 112, 127–153.
Clarke, K.R., Warwick, R.M., 2001. Change in Marine Communities:An Approach to Statistical Analysis and Interpretation. Primer-ELtd, Plymouth, UK.
Clarke, K.R., Warwick, R.M., Somerfield, P.J., Gorley, R.N., 2005.Change in Marine Communities: An Approach to StatisticalAnalysis and Interpretation, 3rd edition. PRIMER-E Ltd,Plymouth.
Coull, B.C., 1972. Species diversity and faunal affinities ofmeiobenthic Copepoda in the deep sea. Mar. Biol. 14, 48–51.
Coull, B.C., 1999. Role of meiofauna in estuarine soft-bottom habitats.Aust. J. Ecol. 24, 327–343.
Coull, B.C., Bell, S.S., 1979. Perspectives of marine meiofaunaecology. In: Livingston, R.J. (Ed.), Ecological Processes in Coastaland Marine Systems. Plenum Publishing Corp, New York.
Coull, B.C., Ellison, R.L., Fleeger, J.W., Higgins, R.P., Hope, W.D., Hummon, W.D., Rieger, R.M., Sterrer, W.E., Thiel, H.,Tietjen, J.H., 1977. Quantitative estimates of meiofauna fromthe deep-sea off North Carolina, USA. Mar. Biol. 39,233–240.
Dahms, H.U., Qian, P.Y., 2004. Life histories of the Harpacticoida(Copepoda, Crustacea): a comparison with meiofauna andmacrofauna. J. Nat. Hist. 38, 1725–1734.
deJonge, V.N., Bouwman, L.A., 1977. A simple density separationtechnique for quantitative isolation of meiobenthos using thecolloidal silica Ludox-TM. Mar. Biol. 42, 143–148.
Emerson, B.C., Kolm, N., 2005. Species diversity can drive speciation.Nature 434, 1015–1017.
Etter, R.J., Grassle, J.F., 1992. Patterns of species-diversity in the deep-sea as a function of dediment particle-size diversity. Nature 360,576–578.
Etter, R.J., Mullineaux, L.S., 2001. Deep-sea communities. In:Bertness, M.D., Gaines, S.D., Hay, M.E. (Eds.), Marine Commu-nity Ecology. Sinauer Associates, Inc., Sunderland.
Gage, J.D., Tyler, P.A., 1991. Deep-sea Biology: A Natural History ofOrganisms at the Deep-sea Floor. Cambridge University Press,Cambridge.
Giere, O., 1993. Meiobenthology: The Microscopic Fauna in AquaticSediments. Springer-Verlag, Berlin. pp. 328.
Grassle, J.F., 1989. Species-diversity in deep-sea communities. TrendsEcol. Evol. 4, 12–15.
Grassle, J.F., Maciolek, N.J., 1992. Deep-sea species richness—regional and local diversity estimates from quantitative bottomsamples. Am. Nat. 139, 313–341.
Grassle, J.F., Morse-Porteous, L.S., 1987. Macrofaunal colonization ofdisturbed deep-sea environments and the structure of deep-seabenthic communities. Deep-Sea Res. 34, 1911–1950.
Grassle, J.F., Sanders, H.L., 1973. Life histories and the role ofdisturbance. Deep-Sea Res. 20, 643–659.

340 J.G. Baguley et al. / Journal of Experimental Marine Biology and Ecology 330 (2006) 327–341
Gray, J.S., 1968. An experimental approach to the ecology of theharpacticoid Leptastacus constrictus Lang. J. Exp. Mar. Biol. Ecol.2, 278–292.
Gray, J.S., 1974. Animal–sediment relationship. Oceanogr. Mar. Biol.Ann. Rev. 12, 223–261.
Gray, J.S., Poore, G.C.B., Ugland, K.I., Wilson, R.S., Olsgard, F.,Johannessen, O., 1997. Coastal and deep-sea benthic diversitiescompared. Mar. Ecol. Prog. Ser. 159, 97–103.
Hessler, R.R., Jumars, P.A., 1974. Abyssal community analysis fromreplicate box cores in the central North Pacific. Deep-Sea Res. 21,185–209.
Hessler, R.R., Sanders, H.L., 1967. Faunal diversity in the deep-sea.Deep-Sea Res. 14, 65–78.
Hicks, G.R.F., 1988. Harpacticoid copepods from biogenic substrata inoffshore waters of New Zealand: 1. New species of Paradactylo-podia, Stenhelia, and Laophonte. J. Roy. Soc. New Zeal. 18,437–452.
Hicks, G.R.F., Coull, B.C., 1983. The ecology of marine meiobenthicharpacticoid copepods. Oceanogr. Mar. Biol. Ann. Rev. 21,67–175.
Higgins, R.P., Thiel, H., 1988. Introduction to the Study of Meiofauna.Smithsonian Institution Press, Washington D.C. p. 488.
Hulings, N.C., Gray, J.S., 1971. Physical factors controllingabundance of meiofauna on tidal and atidal beaches. Mar. Biol.34, 77–83.
Hurlbert, S.H., 1971. The nonconcept of species diversity: a critiqueand alternative parameters. Ecology 52, 577–586.
Hurtt, G.C., Pacala, S.W., 1995. The consequences of recruitmentlimitation: reconciling chance, history, and competitive differencesbetween plants. J. Theor. Biol. 176, 1–16.
Huys, R., Boxshall, G.A., 1991. Copepod Evolution. The Ray Society,London. pp. 468.
Huys, R., Gee, J.M., Moore, C.G., Hamond, R., Geddes, D.C., 1996.Marine and brackish water harpacticoid copepods, part 1. In:Barnes, R.S.K., Crothers, J.H. (Eds.), Synopses of the BritishFauna (New Series) No. 51. Field Studies Council, Shrewsbury,U.K.
Janzen, D.H., 1970. Herbivores and the number of trees species intropical forests. Am. Nat. 104, 501–528.
Jumars, P.A., 1975. Environmental grain and polychaete species'diversity in a bathyal benthic community. Mar. Biol. 30, 253–266.
Jumars, P.A., 1976. Deep-sea species diversity—does it have acharacteristic scale. J. Mar. Res. 34, 217–246.
Lambshead, P., 1993. Recent developments in marine benthicbiodiversity research. Oceanis 19, 5–24.
Lambshead, P.J.D., in press. Marine nematode biodiversity. In: Chen,Z.X., Chen, S.Y., Dickson, D.W. (Eds.) Nematology, Advancesand Perspectives. ACSE-TUP Book Series.
Lambshead, P.J.D., Boucher, G., 2003. Marine nematode deep-seabiodiversity—hyperdiverse or hype? J. Biogeogr. 30, 475–485.
Lambshead, P.J.D., Tietjen, J., Ferrero, T., Jensen, P., 2000. Latitudinaldiversity gradients in the deep sea with special reference to NorthAtlantic nematodes. Mar. Ecol. Prog. Ser. 194, 159–167.
Lambshead, P.J.D., Brown, C.J., Ferrero, T.J., Mitchell, N.J., Smith,C.R., Hawkins, L.E., Tietjen, J., 2002. Latitudinal diversitypatterns of deep-sea marine nematodes and organic fluxes: a testfrom the central equatorial Pacific. Mar. Ecol. Prog. Ser. 236,129–135.
Lambshead, P.J.D., Brown, C.J., Ferrero, T.J., Hawkins, L.E., Smith,C.R., Mitchell, N.J., 2003. Biodiversity of nematode assemblagesfrom the region of the Clarion-Clipperton Fracture Zone, an area ofcommercial mining. BMC Ecol. 3, 1–12.
Levin, L.A., Gage, J.D., 1998. Relationships between oxygen, organicmatter and the diversity of bathyal macrofauna. Deep-Sea Res. 45,129–163.
Levin, L.A., Mccann, L.D., Thomas, C.L., 1991. The ecology ofpolychaetes on deep seamounts in the eastern Pacific Ocean.Ophelia 5, 467–476.
Levin, L.A., Leithold, E.L., Gross, T.F., Huggett, C.L., Dibacco, C.,1994. Contrasting effects of substrate mobility on infaunalassemblages inhabiting 2 high-energy settings on FieberlingGuyot. J. Mar. Res. 52, 489–522.
Levin, L.A., Gage, J.D., Martin, C., Lamont, P.A., 2000. Macrobenthiccommunity structure within and beneath the oxygen minimumzone, NWArabian Sea. Deep-Sea Res. 47, 189–226.
MacArthur, R.H., 1972. Geographical Ecology. Harper and Row, NewYork. 269 pp.
Maciolek, N.J., Grassle, J.F., Hecker, B., Boehm, P.D., Brown, B.,Dade, B., Steinhaur, W.G., Babtiste, E., Ruff, R.E., andPetrecca, R. 1987. Study of Biological Processes on the U.S.Mid-Atlantic Slope and Rise. Phase 2. Final Report. Washing-ton, D.C., U.S. Dept. of Interior, Minerals ManagementService.
Maciolek-Blake, N.J., Grassle, J.F., Blake, J.A., and Neff, J.M. 1985.Georges Bank in Fauna Monitoring Program: Final Report for theThird Year of Sampling. Washington D.C., U.S. Dept. of Interior,Minerals Management Service.
May, R.M., 1988. How many species are there on earth? Science 241,1441–1449.
May, R.M., 1992. Bottoms up for the oceans. Nature 357, 278–279.Montagna, P.A., 1982. Morphological adaptation in the deep-sea
benthic harpacticoid copepod family Cerviniidae. Crustaceana 42,37–43.
Montagna, P.A., Harper, D.E., 1996. Benthic infaunal long termresponse to offshore production platforms in the Gulf of Mexico.Can. J. Fish. Aquat. Sci. 53, 2567–2588.
Paterson, G.L.J., Lambshead, P.J.D., 1995. Bathymetric patterns ofpolychaete diversity in the Rockall-Trough, northeast Atlantic.Deep-Sea Res. 42, 1199–1214.
Pequegnat, W.E., Gallaway, B.J., Pequegnat, L.H., 1990. Aspects ofthe ecology of the deepwater fauna of the Gulf of Mexico. Am.Zool. 30, 45–64.
Poore, G.C.B., Wilson, G.D., 1993. Marine species richness. Nature361, 597–598.
Rex, M.A., 1981. Community structure in the deep-sea benthos. Annu.Rev. Ecol. Sys. 12, 331–353.
Rex, M.A., Stuart, C.T., Hessler, R.R., Allen, J.A., Sanders, H.L.,Wilson, G.D.F., 1993. Global-scale latitudinal patterns of speciesdiversity in the deep-sea benthos. Nature 365, 636–639.
Rex, M.A., McClain, C.R., Johnson, N.A., Etter, R.J., Allen, J.A.,Bouchet, P., Warén, A., 2005. A source-sink hypothesis for abyssalbiodiversity. Am. Nat. 165, 163–178.
Rocha-Olivares, A., Fleeger, J.W., Foltz, D.W., 2001. Decoupling ofmolecular and morphological evolution in deep lineages of ameiobenthic harpacticoid copepod. Mol. Biol. Evol. 18,1088–1102.
Rowe G.T., et al., in preparation. Deepwater Program: Northern Gulfof Mexico Continental Slope Habitats and Benthic Ecology. Finalreport. Minerals Management Service, US Department of theInterior.
Sanders, H.L., Hessler, R.R., 1969. Ecology of the deep-sea benthos.Science 163, 1419–1423.
SAS Institute Inc., 1991. SAS/STAT Guide for Personal Computers.SAS Institute Inc., Cary, North Carolina.

341J.G. Baguley et al. / Journal of Experimental Marine Biology and Ecology 330 (2006) 327–341
Schaff, T., Levin, L., Blair, N., Demaster, D., Pope, R., Boehme, S.,1992. Spatial heterogeneity of benthos on the Carolina continental-slope-large (100-Km)-scale variation. Mar. Ecol. Prog. Ser. 88,143–160.
Schizas, N.V., Street, G.T., Coull, B.C., Chandler, G.T., Quattro, J.M., 1999. Molecular population structure of the marine benthiccopepod (Microarthridion littorale) along the southeastern andGulf coasts of the United States. Mar. Biol. 135, 399–405.
Schwinghamer, P., 1981. Characteristic size distributions of integralbenthic communities. Can. J. Fish. Aquat. Sci. 38, 1255–1263.
Shirayama, Y., 1984. Vertical distribution of meiobenthos in thesediment profile in bathyal, abyssal and hadal deep sea systems ofthe Western Pacific. Oceanol. Acta 7, 123–129.
Snelgrove, P.V.R., Grassle, J.F., Petrecca, R.F., 1996. Experimentalevidence for aging food patches as a factor contributing tohigh deep-sea macrofaunal diversity. Limnol. Oceanogr. 41,605–614.
Soltwedel, T., 2000. Metazoan meiobenthos along continentalmargins: a review. Prog. Oceanogr. 46, 59–84.
Street, G.T., Montagna, P.A., 1996. Loss of genetic diversity inHarpacticoida near offshore platforms. Mar. Biol. 126, 271–282.
Thistle, D., 1978. Harpacticoid dispersion patterns—implications fordeep-sea diversity maintenance. J. Mar. Res. 36, 377–397.
Thistle, D., 1983. The role of biologically produced habitatheterogeneity in deep-sea diversity maintenance. Deep-Sea Res.30, 1235–1245.
Thistle, D., 1998. Harpacticoid copepod diversity at two physicallyreworked sites in the deep sea. Deep-Sea Res. 45, 13–24.
Thistle, D., 2001. Harpacticoid copepods are successful in the soft-bottom deep sea. Hydrobiologia 453, 255–259.
Thistle, D., 2003. On the utility of metazoan meiofauna for studyingthe soft-bottom deep sea. Vie Milieu 53, 97–101.
Thistle, D., Eckman, J.E., 1990. The effect of a biologically producedstructure on the benthic copepods of a deep-sea site. Deep-Sea Res.37, 541–554.
Thistle, D., Yingst, J.Y., Fauchald, K., 1985. A deep-sea benthiccommunity exposed to strong near-bottom currents on the ScotianRise (Western Atlantic). Mar. Geol. 66, 91–112.
Thistle, D., Ertman, S.C., Fauchald, K., 1991. The fauna of the HebbleSite-patterns in standing stock and sediment-dynamic effects. Mar.Geol. 99, 413–422.
Thistle, D., Levin, L.A., Gooday, A.J., Pfannkuche, O., Lambshead,P.J.D., 1999. Physical reworking by near-bottom flow alters themetazoan meiofauna of Fieberling Guyot (northeast Pacific).Deep-Sea Res. 46, 2041–2052.
Tietjen, J., 1971. Ecology and distribution of deep-sea meiobenthos offNorth Carolina. Deep-Sea Res. 18, 941–957.
Tilman, D., 1982. Resource Competition and Community Structure.Princeton University Press, Princeton.
Tilman, D., 1994. Competition and biodiversity in spatially structuredhabitats. Ecology 75, 2–16.
Warwick, R.M., Clarke, K.R., 1991. A comparison of some methodsfor analyzing changes in benthic community structure. J. Mar.Biol. Assoc. UK 71, 225–244.
Warwick, R.M., Clarke, K.R., 1995. New ‘biodiversity’ measuresreveal a decrease in taxonomic distinctness with increasing stress.Mar. Ecol. Prog. Ser. 129, 301–305.
Wells, J.B.J., 1976. Keys to Aid in the Identification of MarineHarpacticoid Copepods. Aberdeen University Press Ltd.,Aberdeen, U.K.
Related Documents