SPATIAL ANALYSIS OF THE LOCATIONAL PATTERN OF FILLING STATIONS IN OYO WEST LOCAL GOVERNMENT AREA. BY TAIWO, ADEDEJI ADESOKAN MATRIC NUMBER: 180238 B.SC GEOGRAPHY BEING AN ORIGINAL ESSAY SUBMITTED TO THE DEPARTMENT OF GEOGRAPHY, FACULTY OF THE SOCIAL SCIENCES, UNIVERSITY OF IBADAN, NIGERIA. IN PARTIAL FULFILLMENT OF THE REQUIREMENT FOR THE AWARD OF A BACHELOR OF SCIENCE JANUARY, 2018.

Welcome message from author
This document is posted to help you gain knowledge. Please leave a comment to let me know what you think about it! Share it to your friends and learn new things together.
Transcript
SPATIAL ANALYSIS OF THE LOCATIONAL PATTERN OF FILLING
STATIONS IN OYO WEST LOCAL GOVERNMENT AREA.
BY
TAIWO, ADEDEJI ADESOKAN
MATRIC NUMBER: 180238
B.SC GEOGRAPHY
BEING AN ORIGINAL ESSAY SUBMITTED TO THE DEPARTMENT OF
GEOGRAPHY, FACULTY OF THE SOCIAL SCIENCES, UNIVERSITY
OF IBADAN, NIGERIA.
IN PARTIAL FULFILLMENT OF THE REQUIREMENT FOR THE
AWARD OF A BACHELOR OF SCIENCE
JANUARY, 2018.
ii
Certification
I certify that this original essay was carried out by TAIWO, ADEDEJI ADESOKAN of the
Department of Geography, University of Ibadan.
…………………………………………………………..
SUPERVISOR
DR. G.O IKWUYATUM

iii
Dedication
This original essay is dedicated to Almighty Allah, the merciful and the giver of wisdom. I also
dedicate this essay to my mother who has been there for me through thick and thin.
iv
Acknowledgment
My utmost gratitude goes to almighty Allah, the most beneficent, the merciful who spared my
life and granted me the grace to sail through this chapter of my academic life. I also extend my
gratitude to my mother who has shown unwavering and unflinching support right from my day
one of admittance into this prestigious department. I pray that Almighty Allah will keep you
alive to eat the fruit of your labour.
I will like to appreciate the effort of my amiable supervisor in person of Dr. G.O Ikwuyatum,
who has painstakingly supervised my essay. May Allah continue to increase you in knowledge
and grant upon you, the bliss of sound health. Also, I will like to appreciate all the teaching staffs
of the Department of Geography. You all have been wonderful teachers. May Allah grant you all,
your inner-most desires and protect your families from the claws of danger.
My appreciation goes to Alhaji D.A Bello, Chief M.O Ogunmola, and D.S.P. Ayoola for their
support at one point or the other, may Allah meet you all at the point of your needs. I also
appreciate the support of my aunt in person of Mrs. Adeleke Kafilat for her unwavering support
over the years, may Allah’s blessing never cease in your life and that of your family. My
gratitude also goes to my siblings in person of Mrs. Ogunlana, Mr. Taiwo Adesokan, Mrs
Adesina, and Miss Kehinde Adesokan, may Allah light your paths and grant you success in your
endeavors. I also appreciate the support of family friends, and colleagues both home and in
school that have accommodated me and supported me throughout the journey, may Allah bless
us all, and may we all be successful in our future endeavours.
v
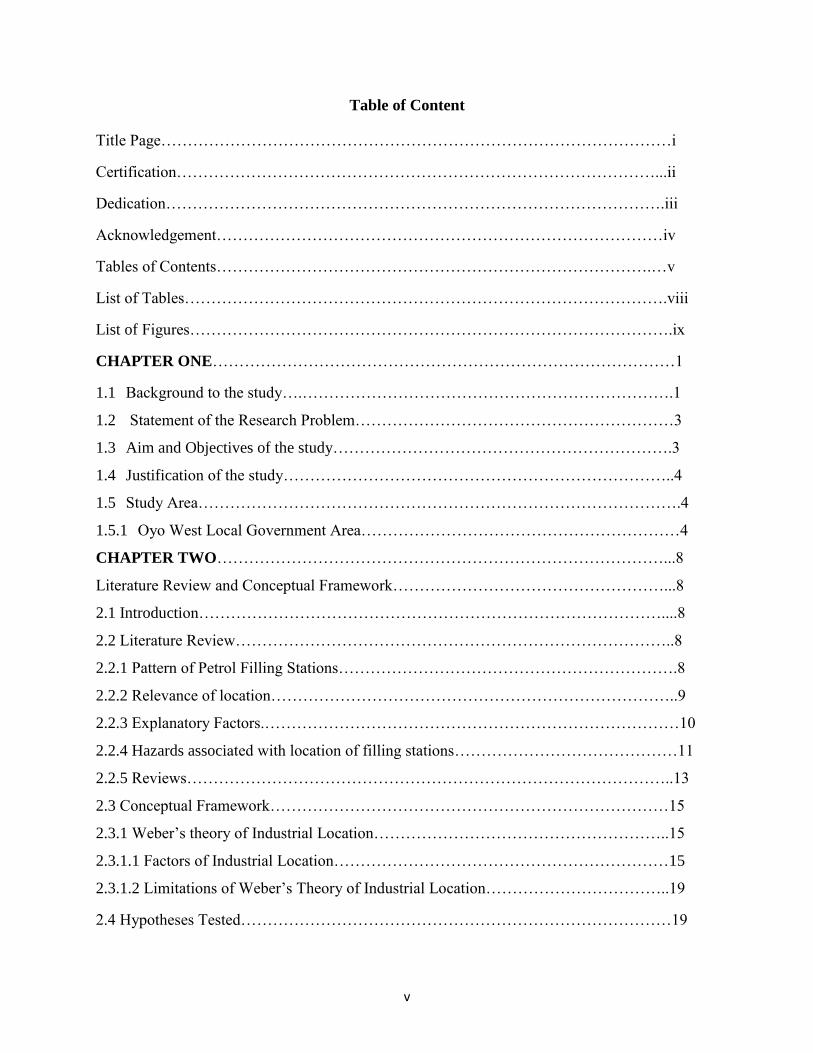
Table of Content
Title Page……………………………………………………………………………………i
Certification………………………………………………………………………………...ii
Dedication………………………………………………………………………………….iii
Acknowledgement…………………………………………………………………………iv
Tables of Contents……………………………………………………………………….…v
List of Tables……………………………………………………………………………….viii
List of Figures……………………………………………………………………………….ix
CHAPTER ONE……………………………………………………………………………1
1.1 Background to the study….…………………………………………………………….1
1.2 Statement of the Research Problem……………………………………………………3
1.3 Aim and Objectives of the study……………………………………………………….3
1.4 Justification of the study………………………………………………………………..4
1.5 Study Area……………………………………………………………………………….4
1.5.1 Oyo West Local Government Area……………………………………………………4
CHAPTER TWO…………………………………………………………………………...8
Literature Review and Conceptual Framework……………………………………………...8
2.1 Introduction……………………………………………………………………………....8
2.2 Literature Review………………………………………………………………………..8
2.2.1 Pattern of Petrol Filling Stations……………………………………………………….8
2.2.2 Relevance of location…………………………………………………………………..9
2.2.3 Explanatory Factors.……………………………………………………………………10
2.2.4 Hazards associated with location of filling stations……………………………………11
2.2.5 Reviews………………………………………………………………………………..13
2.3 Conceptual Framework…………………………………………………………………15
2.3.1 Weber’s theory of Industrial Location………………………………………………..15
2.3.1.1 Factors of Industrial Location………………………………………………………15
2.3.1.2 Limitations of Weber’s Theory of Industrial Location……………………………..19
2.4 Hypotheses Tested………………………………………………………………………19
vi
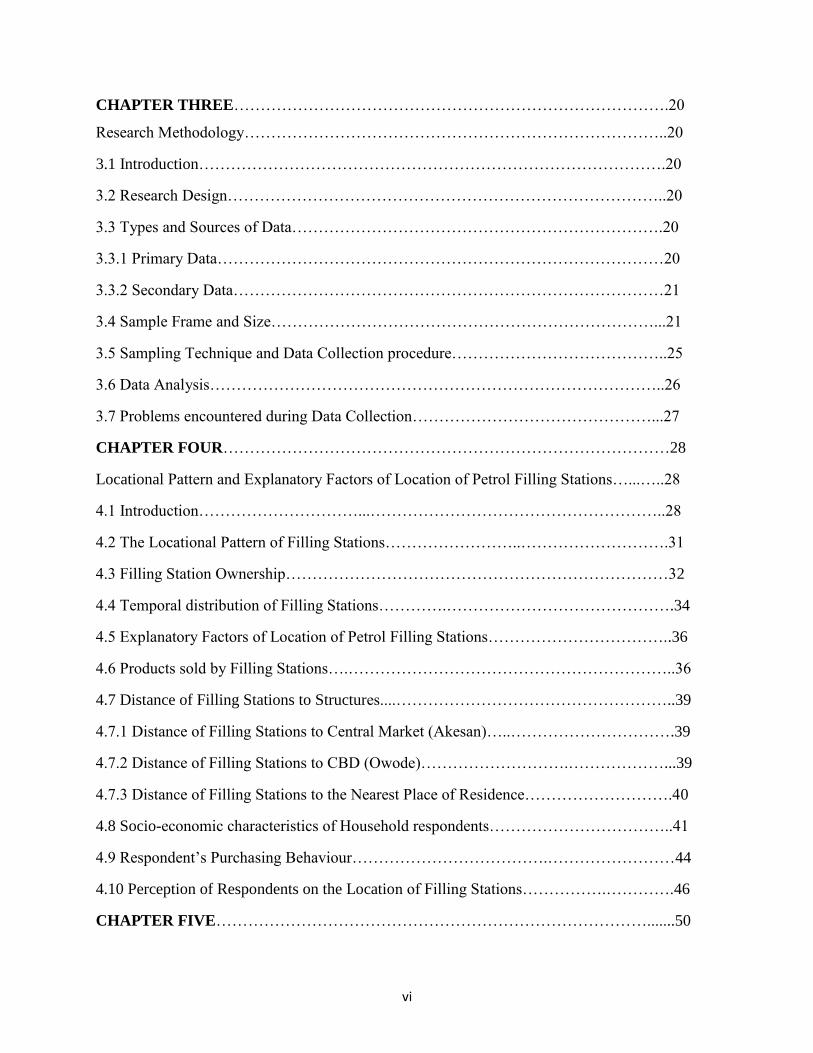
CHAPTER THREE……………………………………………………………………….20
Research Methodology……………………………………………………………………..20
3.1 Introduction…………………………………………………………………………….20
3.2 Research Design………………………………………………………………………..20
3.3 Types and Sources of Data…………………………………………………………….20
3.3.1 Primary Data…………………………………………………………………………20
3.3.2 Secondary Data………………………………………………………………………21
3.4 Sample Frame and Size………………………………………………………………...21
3.5 Sampling Technique and Data Collection procedure…………………………………..25
3.6 Data Analysis…………………………………………………………………………..26
3.7 Problems encountered during Data Collection………………………………………...27
CHAPTER FOUR…………………………………………………………………………28
Locational Pattern and Explanatory Factors of Location of Petrol Filling Stations…...…..28
4.1 Introduction…………………………...………………………………………………..28
4.2 The Locational Pattern of Filling Stations……………………..……………………….31
4.3 Filling Station Ownership………………………………………………………………32
4.4 Temporal distribution of Filling Stations………….…………………………………….34
4.5 Explanatory Factors of Location of Petrol Filling Stations……………………………..36
4.6 Products sold by Filling Stations….……………………………………………………..36
4.7 Distance of Filling Stations to Structures....……………………………………………..39
4.7.1 Distance of Filling Stations to Central Market (Akesan)…..………………………….39
4.7.2 Distance of Filling Stations to CBD (Owode)……………………….………………...39
4.7.3 Distance of Filling Stations to the Nearest Place of Residence……………………….40
4.8 Socio-economic characteristics of Household respondents……………………………..41
4.9 Respondent’s Purchasing Behaviour……………………………….……………………44
4.10 Perception of Respondents on the Location of Filling Stations…………….………….46
CHAPTER FIVE……………………………………………………………………….......50
vii
Summary of Research findings, Conclusion, and Recommendations………….……………50
5.1 Introduction……………………………………………………………………………….50
5.2 Summary of Research findings…………………………………………………………..50
5.3 Conclusion………………………………………………………………………………..52
5.4 Recommendations………………………………………………………………………..53
References……………………………………………………………………………….…...54
Appendix i…………………………………………………………………………………….58
Appendix ii……………………………………………………………………………………59
Appendix iii…………………………………………………………………………………...60
viii
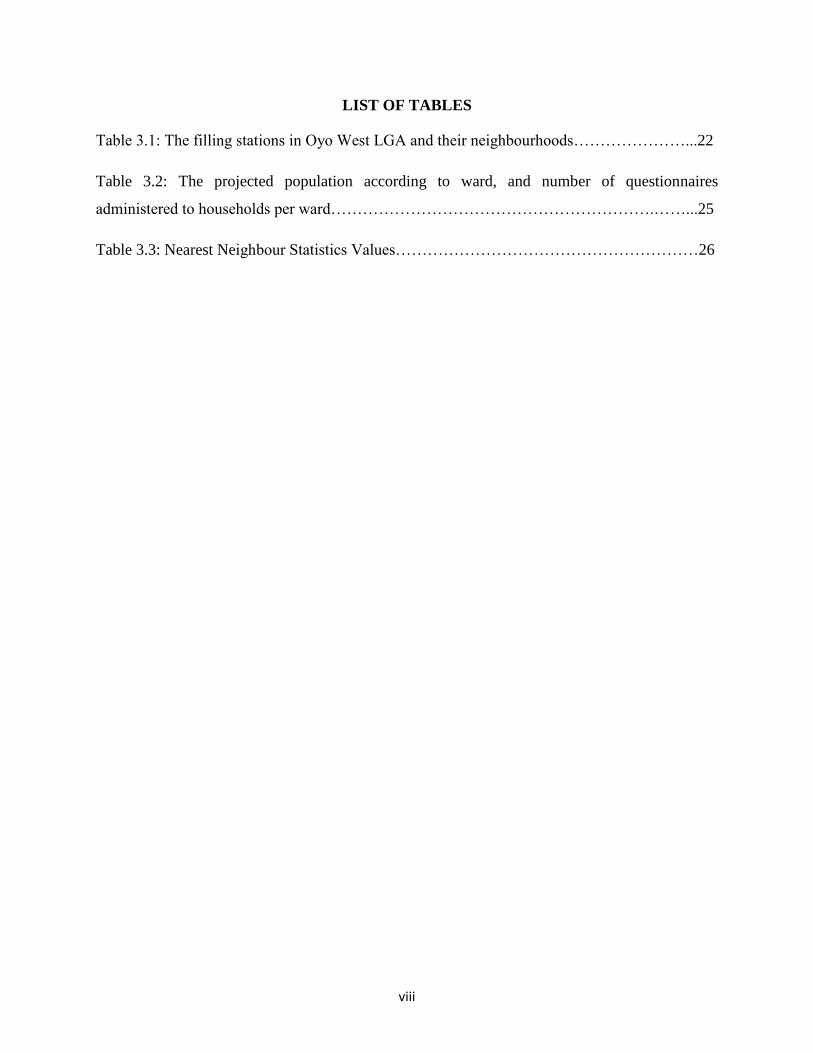
LIST OF TABLES
Table 3.1: The filling stations in Oyo West LGA and their neighbourhoods…………………...22
Table 3.2: The projected population according to ward, and number of questionnaires
administered to households per ward…………………………………………………….……...25
Table 3.3: Nearest Neighbour Statistics Values…………………………………………………26
ix
LIST OF FIGURES
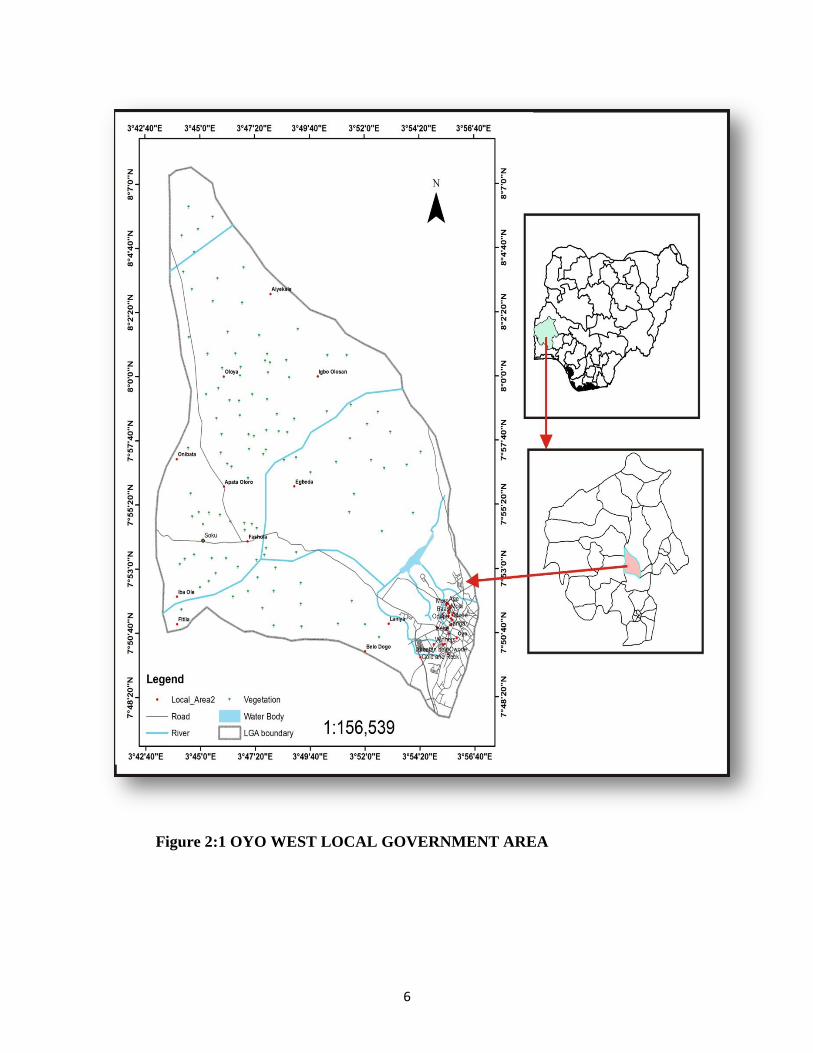
Figure 1:1 Oyo West Local Government Area………………………………………………..6
Figure 2.1: Location triangle……………………………………………………………….....16
Figure 2.2: Isodapane Framework…………………………………………………………….17
Figure 2.3: Multiple isodapane framework explaining agglomeration………………………18
Figure 4.1: The locational Pattern of filling stations in Oyo West LGA……………………...29
Figure 4.2: Percentage of Filling Stations per ward…………………………………………...31
Figure 4.3: Type of ownership of Filling Stations………………………………………….....33
Figure 4.4: The Temporal distribution of Filling Stations………………………………….....35
Figure 4.5: Categories of product sold by Filling Stations……………………………………38
Figure 4.6: Frequency of Purchase of Petroleum products…………………………………...45
Figure 4.7: Consequences of Location of Filling Stations in Neighbourhoods………………49
1
CHAPTER ONE
INTRODUCTION
1.1 BACKGROUND TO THE STUDY
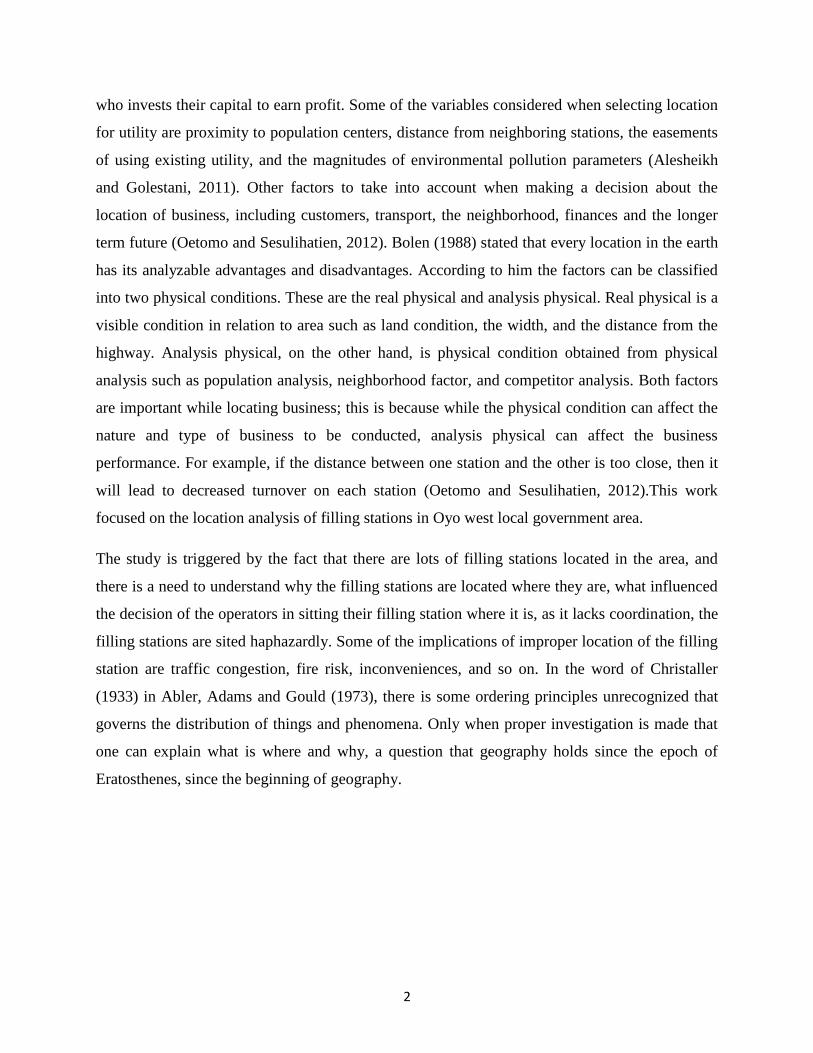
Filling Station is defined as any building or equipment used for the sale or dispensing of petrol or
oil for motor vehicles or incidental there to and includes the whole of the land, building or
equipment whether or not the use as a petrol station is the predominant use or is only a part
thereof (Ayodele 2011). A petrol station is a retail establishment where motor vehicles are
refueled, lubricated, serviced, and sometimes repaired (Friedman, 1978).
American heritage dictionary of English Language (2011) defined filling station as a place where
gasoline and oil are sold and facilities are available for repairing or maintaining automobiles.
Nieminen (2005, p.11) defined Petrol station as an area including fuel equipment and
piping, storage tanks, forecourt and possible building premises for the sale of fuel
(inflammable liquids) to customer’s vehicles. Filling stations sell petrol or diesel, some carry
specialty fuels such as liquefied petroleum gas (LPG), natural gas, hydrogen, biodiesel, kerosene,
or butane while the rest add shops to their primary business (Hamid et al., 2009). Meanwhile,
petrol retailer or entrepreneur is any person who carries on a business which sells petrol for
direct delivery into the fuel tanks of motor vehicles (Sedgwick, 1969).
According to Ehinomen and Adeleke (2012) the petroleum industry can be classified by type of
actors or by sector. The actors in the Nigerian industry consist of both private and public
organizations. The public actors are the government agents and functionaries such as the
Nigerian National Petroleum Corporation (NNPC) and its subsidiaries, the Department of
Petroleum Resources (DPR), the Petroleum Products Pricing Regulatory Authority (PPPRA),
among others. The private segment consists of both indigenous and foreign actors. The
indigenous actor consist of independent marketers which numbered about 1000 in 1979, a year
after formulating the act which established them but increased to 7948 in 2010 and they are
competing with the foreign or multinational marketers (referred to as major marketers) like
Mobil Oil Nigeria Plc., MRS Nigeria Plc., Total Nigeria Plc., Conoil Plc., Oando Nigeria Plc.
and African Petroleum Plc.
Selecting a better site for business enterprise is at mind of every government and entrepreneurs
2
who invests their capital to earn profit. Some of the variables considered when selecting location
for utility are proximity to population centers, distance from neighboring stations, the easements
of using existing utility, and the magnitudes of environmental pollution parameters (Alesheikh
and Golestani, 2011). Other factors to take into account when making a decision about the
location of business, including customers, transport, the neighborhood, finances and the longer
term future (Oetomo and Sesulihatien, 2012). Bolen (1988) stated that every location in the earth
has its analyzable advantages and disadvantages. According to him the factors can be classified
into two physical conditions. These are the real physical and analysis physical. Real physical is a
visible condition in relation to area such as land condition, the width, and the distance from the
highway. Analysis physical, on the other hand, is physical condition obtained from physical
analysis such as population analysis, neighborhood factor, and competitor analysis. Both factors
are important while locating business; this is because while the physical condition can affect the
nature and type of business to be conducted, analysis physical can affect the business
performance. For example, if the distance between one station and the other is too close, then it
will lead to decreased turnover on each station (Oetomo and Sesulihatien, 2012).This work
focused on the location analysis of filling stations in Oyo west local government area.
The study is triggered by the fact that there are lots of filling stations located in the area, and
there is a need to understand why the filling stations are located where they are, what influenced
the decision of the operators in sitting their filling station where it is, as it lacks coordination, the
filling stations are sited haphazardly. Some of the implications of improper location of the filling
station are traffic congestion, fire risk, inconveniences, and so on. In the word of Christaller
(1933) in Abler, Adams and Gould (1973), there is some ordering principles unrecognized that
governs the distribution of things and phenomena. Only when proper investigation is made that
one can explain what is where and why, a question that geography holds since the epoch of
Eratosthenes, since the beginning of geography.
3
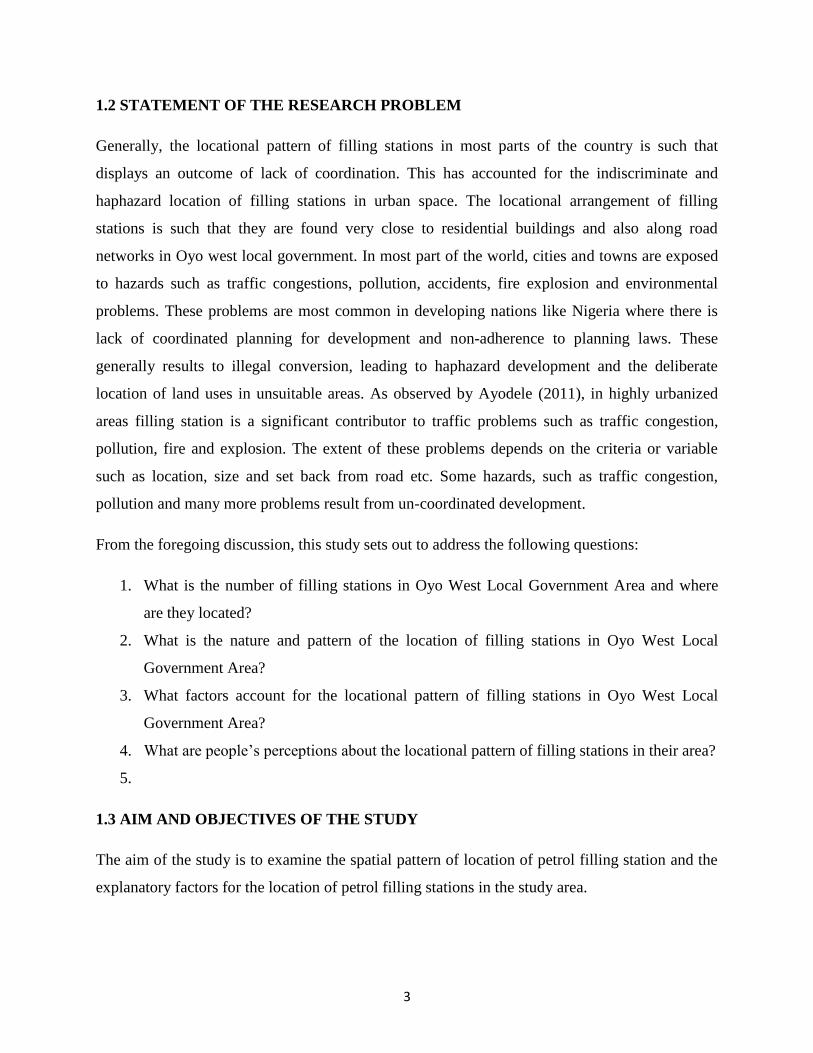
1.2 STATEMENT OF THE RESEARCH PROBLEM
Generally, the locational pattern of filling stations in most parts of the country is such that
displays an outcome of lack of coordination. This has accounted for the indiscriminate and
haphazard location of filling stations in urban space. The locational arrangement of filling
stations is such that they are found very close to residential buildings and also along road
networks in Oyo west local government. In most part of the world, cities and towns are exposed
to hazards such as traffic congestions, pollution, accidents, fire explosion and environmental
problems. These problems are most common in developing nations like Nigeria where there is
lack of coordinated planning for development and non-adherence to planning laws. These
generally results to illegal conversion, leading to haphazard development and the deliberate
location of land uses in unsuitable areas. As observed by Ayodele (2011), in highly urbanized
areas filling station is a significant contributor to traffic problems such as traffic congestion,
pollution, fire and explosion. The extent of these problems depends on the criteria or variable
such as location, size and set back from road etc. Some hazards, such as traffic congestion,
pollution and many more problems result from un-coordinated development.
From the foregoing discussion, this study sets out to address the following questions:
1. What is the number of filling stations in Oyo West Local Government Area and where
are they located?
2. What is the nature and pattern of the location of filling stations in Oyo West Local
Government Area?
3. What factors account for the locational pattern of filling stations in Oyo West Local
Government Area?
4. What are people’s perceptions about the locational pattern of filling stations in their area?
5.
1.3 AIM AND OBJECTIVES OF THE STUDY
The aim of the study is to examine the spatial pattern of location of petrol filling station and the
explanatory factors for the location of petrol filling stations in the study area.
4
The aim of this research will be achieved through the following objectives:
1. To analyse the locational pattern of filling stations in Oyo West local government area.
2. To evaluate the factors responsible for the location of filling stations in the study area.
3. To determine the variation of filling stations in relation to wards.
4. To examine people's perception about the location of filling station in their area.
1.4 JUSTIFICATION OF THE STUDY
The urban space is often a host to a variety of land use. Of all land use to which the urban space
has been put to, there has been more emphasis on residential zones and several researches have
also been carried out in favour of residential zones. This more or less paints a skewed or lopsided
analysis of urban land use in the urban space. There is no gain saying in the fact that land use
such as filling station which is a utility industry is fast claiming the urban space as it serves other
urban land use zones being a utility industry. Therefore there is the need to study the locational
pattern of the existential structures of filling stations that is fast growing in the urban space.
The indiscriminate and haphazard location of filling stations, especially those in residential areas
had necessitated the need to empirically observe the distributional pattern of filling stations, the
underlying factor influencing the location of the filling stations and people's perception about the
location. Hence the geographer is therefore interested in understanding the locational pattern of
the filling stations and the factors influencing the choice of location of the phenomenon under
study.
1.5 STUDY AREA
1.5.1 OYO WEST LOCAL GOVERNMENT AREA
Oyo West Local Government Area is located within latitude 7o47’ and 8
o8’, and longitude 3
o42’
and 3o56’. Oyo west Local Government Area is one of the thirty-three (33) LGAs that constitute
Oyo state and also one of the 3 Local Government Areas in Oyo town. It is the largest of the 3
Local Government Areas with an area extent of 526km². The Local Government was created by
the Federal Military Government in 1996 alongside 9 other Local Government Area in Oyo State
under the leadership of General Sanni Abacha. Oyo West Local Government Area has a total of
ten (10) wards, and has its administrative headquarter at Ojongbodu, along Iseyin road, Oyo. It is
5
bounded in the north by Atiba LGA, in the west by Iseyin LGA, in the east by Oyo East LGA,
and in the South by Afijio LGA. According to the 2006 population census exercise, Oyo West
Local Government Area is said to be populated with 136,457 residents (NPC, 2006).
Land use in the Local Government can be classified broadly into residential, industrial,
Commercial, agricultural, Government acquisition, road networks, recreational, health and
educational land use. In terms of commercial land use in the LGA, commercial activities which
entails buying and selling of both industrial and agricultural produce takes place mainly at
Akesan (Oja Oba), Owode, Irepodun, and Oroki market. Trade and commerce account for the
largest economic activities in the Local Government Area.
In terms of Industrial land use, industrial establishment in the local government includes pure
water factory, Cassava processing factory, Bread factory, Hotels and recreation centers, and
filling stations. Filling station erection takes up a large percentage of industrial land use in the
study area; this is due to the increasing demand for petroleum products as new settlements
emerge over the years.
6
Figure 2:1 OYO WEST LOCAL GOVERNMENT AREA
7
In terms of agricultural land use, the rural space is involved in extensive cultivation of crops
mostly food crops, the areas involved in extensive agricultural production includes villages like
Aba Eleja, Iyabeji, Baabo, Fasola, Aladie and Soku. The local government area used to have a
government farm at Aladie but it's no longer in operation. Recreational centers in the Local
Government Area include Old Oyo National Park, Ojongbodu, and Oyo.
In terms of land use in erecting health facilities, there are a number of health care structures in
the Local Government Area. These include Primary health centers such as Kolobo primary
health centre, Iyaji primary health centre, Iseke Primary health centre, and Staff Clinic,
Ojongbodu. A number of privately owned health structures are also situated in this Local
Government Area.
The Local Government Area has numerous public and privately owned primary and secondary
Schools. Few Tertiary Institutions are also located in the Local Government Area, some of which
are satellite campus for Emmanuel Alayande college of Education at Isokun, Ekiti state
University affiliation programme running in the same school. A private University was also
recently approved; the name is Atiba University which is located at Gedu area. The location of
several educational institutions purveys the educational needs of the residents.
8
CHAPTER TWO
LITERATURE REVIEW AND CONCEPTUAL FRAMEWORK
2.1 INTRODUCTION
This chapter reviews literature on locational analysis of filling stations and also discusses the
conceptual framework employed in the study. The first section of this chapter, literature review,
examines past literature on location analysis of filling stations. The second part of this chapter,
discusses extensively the Weber’s theory of Industrial location.
2.2 LITERATURE REVIEW
This section focuses on reviewing existing literatures that are relevant to the study.
2.2.1 PATTERN OF PETROL FILLING STATIONS
According to Muritala (2012) who analysed the locational pattern of filling stations in Kano
metropolis, the filling station exhibit linear pattern because they are cited mainly on road side
where drivers can easily get the product, the overall pattern off distribution is clustered with
nearest neighbour value (Rn) of 0.3 (less than 1) and z-value of -15. Olapeju (2015) in his study
in Ilaro Ogun state shows that with an Rn value of 0.36, the study amongst others pointedly
reveal that the locational pattern of petrol filling station tends towards clustering.
According to a study by S.A Ogunyemi et al, (2017) in Sango Ota metropolis, the nearest
neighbor analysis for the spatial pattern of petrol service stations in each region revealed three
major spatial distributions. The spatial pattern from Iju to Iyana and Iyana to Ojuore showed
dispersed pattern, Abeokuta highway showed random pattern, while Sango Ota showed clustered
pattern. Ogundahunsi (2014) in his study of the locational pattern of fuel stations in Ilesa, Osun
state, revealed that the computed nearest neighbor index for his study was 0.16 which indicates
that the distribution of pattern of the fuel stations was tending towards clustering which is not an
ideal situation for such a facility in view of the safety implications. In a study carried out by
Oloko-Oba et al (2016) in Ilorin, Kwara state, the result reveals that the spatial pattern of
distribution of filling stations in the study area shows a clustered pattern with nearest neighbour
ratio of 0.43and z-score of -16.14.
Ayodele (2011) examined the spatial distribution of filling stations in Kaduna North. The study
identified the pattern and distribution problem in the area. The study found that there 22 filling
9
stations in the area and the distribution is uneven as the stations are mostly concentrated along
major roads. In addition the study looked at the setbacks and locational situation of the stations
and concluded that 69.5% did not conform to the standard. Though GIS was applied for mapping,
it was not employed for measuring the standards compliances. Similarly a study was carried out
in Agege Local government Area of Lagos State by Abdullahi (2012), the study observed that
filling stations are randomly distributed in the area. The study observed due to land shortage
people build station wherever the land is available and this creates a pseudo development pattern.
2.2.2 RELEVANCE OF LOCATION
Location is an important concept in geography and depending on the scale of observation, a
location could be a point or an area in which human activities takes place (Morril, 1970). The
choice of a location is the most crucial decision retailers and service providers must take
because it is a basic requirement for business success and growth determinant (Jones,
Mothersbaugh and Beatty, 2003; Loof and Nabavi, 2013). It establishes the visibility of
business to potential customers, patronage and level of profitability. In the fuel retailing
business, location is very important because it determines the turnover (Uba, 2013).
Associated with the location decision are consequences which may not be intended or
desirable. Several reports have shown the negative consequences of locating fuel stations
in residential areas (Adewumi, 2013; Adedeji, 2013; Bello, 2013).
Petrol stations are very vulnerable to closure resulting from petrol price competition, regulatory
pressure and non strategic location (Sidaway, 1998). As the classical adage used to advise,
“Location, location, location” remain the most important factors when choosing a home or
positioning our business (Waters, 2003). George Davies made a strong point in his
autobiography that setting a shop in the wrong place is like tying hands behind one’s own back
(Davies, 1991, as cited in Clarke, 1995). Thus, choice of a location is the single most important
decision facing retailers and service providers (Jones et al., 2003). Location is repeatedly stressed
in the business press as a requirement for success in retailing (Chan et al., 2005). This is because
location can affect business competition and performance, hence, level of profitability.
Theoretically, a firm would choose locations that maximize profits. Location should be
considered as a relevant growth determinant (Hoogstra, 2004). It affects many aspects of petrol
station operation and can significantly affect the economy of the local community (Mudambi,
10
1994). Henry (2001) suggested that being an independent business owner or manager, one has to
try to maximize benefits by controlling the location of outlets and market threshold. This was
supported by Kearny (1998) who stated that it was found in the U.S. that site location (71%) is
the primary factor for the drivers to choose a petrol station.
Business profitability of a petrol station is influenced by a number of factors such as property
maintenance and management, neighbourhood business potential, grade of street and topography,
visibility, compatibility of traffic flow, ease of approach, and special features of location
(Friedman,1978). Nieminem (2012) acknowledged that, petroleum is a key driver of industrial
activities. For instance, in the Scandinavian countries particularly in Finland and Sweden,
efforts have been made to remedy the effects of pollutants on air, water and soil within
abandoned petrol filling sites (see Nieminen, 2005). Other factors to take into account
when making a decision about the location of business include customers, transport, the
neighborhood, finances and the longer term future (Oetomo and Sesulihatien, 2012)
Filling stations were traditionally located in largely uninhabited areas (Isabel, et al., 2010,
p.2754). The situation obtaining on the ground proves to be different since many filling
stations are being built within urban areas surrounded by residential and public buildings.
This trend has been observed regardless of the dangers associated with filling stations.
Filling stations come up in newly developed areas only when development reaches a
point at which business potential of the areas can be assessed. A delayed demand for
Service Site is then created and will culminate in request for permits to use sites which
are detrimental to sound development of the area. Preferences for locations on heavily
travelled streets so as to obtain the maximum patronage from local area as well as the
passing traffic results in serious traffic hazards and traffic congestion (Gopalaswamy,
1977).
2.2.3 EXPLANATORY FACTORS
Entrepreneurial preferential location choices are based on profit maximization (O’Sullivan,
2005). The preferential location choices of an entrepreneur which are profit oriented
determine the location of filling stations in Kitwe. According to Iman, et al (2009),
entrepreneurial preferential location choices are determined by volume of traffic flows
passing the site, proximity to a major travel route, visibility from the road, and distance
11
of catchment area from residential neighbourhood areas, and within a residential or
commercial area.
Accessibility is the ease of entry to and exit from a particular site of residential area. It also
measures the ease of entry and exit for motorists on a station’s side of the primary street. Petrol
sales potentially varies depending on such degree of accessibility, but if a station is to achieve its
maximum potential it must be easy for motorists to see it and to enter it (Sedgwick, 1969). Some
researchers claim that location decision involves a large fixed investment (Jones, 2003).
Accessibility in general terms, describes the degree to which a system is usable by as many
people as possible. It is the degree of ease with which to reach certain locations from other
locations and viewed as the ability to access functionality and possible benefit (Oni, 2007).
Accessibility as a property of location may be grouped into general and special accessibility (Oni,
2007). General accessibility, according to Harvey (1999) refers to nearness to rail termini, bus
stations and motorways transport facilities, labour, customers and service facilities such as banks,
and post office. Special accessibility on the other hand exists when complimentary uses are in
close proximity to each other (Harvey, 1999). In this case, the net economic cost of movement
will be lower in terms of distance, time and convenience in addition to greater comparative
advantages given greater accessibility of a location (Balchin et al, 2000)
2.2.4 HAZARDS ASSOCIATED WITH LOCATION OF FILLING STATIONS3
Hazards as viewed by Burton et al (1978) are those elements of all the physical
environments that are harmful to man and are caused by forces extraneous to him.
Hazards also are threat to future source of danger and have the potential to cause harm
to people (death, injury, disease and stress); harm to human activities (economic and
educational activities); harm to property (property damage and economic loss) and
environmental harm (loss of fauna and flora, pollution and loss of amenities). This is in
conformity with EFOA, (1999) that safety of people and protection of the environment
should at all time be the major concerns at petrol stations because they are potentials for
accident especially where the general public has unrestricted access. The necessity
therefore for well designed, construction and operation of such facilities should be of
paramount importance. Noting that, petrol and other fuel are potentially hazardous at
ambient temperature and they give off vapours which when mixed with air in a
12
proportion and ignited, can burn with explosive force. In addition, all petroleum products
are potential pollutants which if released, can cause injury to aquatic life, harmful effects
to humans‟ health and environmental damage if incorrectly handled.
According to a study by Mshelia et al (2015), it therefore indicates that, air pollution has the
highest percent (74%). This implies that air pollution is the highest danger in relation to
the distance between the petrol stations and the residential settlements. That is, the closer
the houses are to petrol stations, the more likely the residents will be exposed to air
pollution as vehicles move in and out of petrol stations to take fuel and the use of
generator to power pumping machines. Traffic accident, traffic congestion and fire
outbreak have 45%, 40% and 30% respectively. This means the three variables are less
severe compared to air pollution.
From another study carried out in Maiduguri and Jere, Borno State, Nigeria, the workers
in the petrol stations and the residents living nearby the petrol stations have in one time
or the other suffer various health effects as a result of working in petrol stations or
being their close (Mshelia, et al, 2015; Afolabi, et al., 2011). The results from Mshelia
et al showed that, respiratory problems (diseases) had the highest percent of 38.05%.
This by implication means, it was the most prevalent health problems affecting both the
workers and some of the residents as a result of the inhalation of fuel contaminated air.
However, skin and sight problems alongside other health complications were also issues
of concern. If the situations continue thereafter, such could lead to narcotics effects with
symptoms including headache, nausea, dizziness and mental confusion (Mshelia, et al,
2015, p.7).
The issue of location preferences of entrepreneurs also features within the literature
(Njoku and Alabge, 2015; Mohammed et al 2014; Afolabi et al., 2011). Njoku and
Alagbe stated that, in as much as petrol filling stations should be located where they can
be easily accessible, the concern had been that there has been over-provision within one
geographical area as well as indiscriminate locations within Oyo town and Nigeria at
large (see also Afolabi et al., 2011). The observed trend within the literature is that,
some owners prefer to select the optimum location to locate their petrol filling station on
the profit maximization principle. Nkoju and Alagbe (2015, p.11), disclosed that, the
13
Commissioner of Physical Planning and Urban Development stated that, “the Government
of the Republic of Nigeria had sometime before the year 2015, imposed a three year ban
on major marketers of petroleum products in the State of Oyo due to their nonchalant
attitude and failure to comply with national government’s call to desist from erecting
illegal petrol filling stations”. Mulroy (2012) in his presentation at an Environmental
Petroleum Seminar in Mitchelstown County Cork disclosed that, petrol filling stations are
an environmental liability as they are a potential hazards to the environment hence, site
investigation and generic risk assessment need to be undertaken in order to institute a
remedial plan for mitigating the significant negative impact that petrol filling station pose
on the environment.
2.2.5 REVIEWS
Sule, Shebe, Bichi and Atiyon (2006) studied the spatial distribution of filling station in Kaduna
Metropolis using ArcView GIS software. The results of the study showed that there are 193
filling stations in the area, and that independent marketers dominate the business with 68% of the
stations. Although the study aimed at inventory and showing the location of the filling stations, it
did not show which stations is where or why, and did not examine the spatial pattern of the
stations.
Blamah, Vivan, Tagwi and Ezemokwe (2012) looked at the locational impact assessment of
gasoline service stations along Abuja-Keffi road and environs in Karu, Abuja, Nigeria. The study
examine the location of petroleum filling station using Site Analysis Report (SAR) of the
seventeen sampled (out fifty) station in the area, a questionnaire was also administered to solicit
people’s perception on the effects of the location of filling stations. The findings of the study
revealed partiality and disregards of planning criteria in locating filling station, that about 82% of
the stations have fallen short in meeting the standards of 450m distance in-between.
As observed by Ayodele (2011), in highly urbanized areas filling station is a significant
contributor to traffic problems such as traffic congestion, pollution, fire and explosion. The
extent of these problems depends on the criteria or variable such as location, size and set back
from road e.t.c. Some hazards, such as traffic congestion, pollution and many more problems
result from un-coordinated development. Apart from these hazards, cities are also confronted
with other problems like accidents, explosion and fire. Another study by Hamid et al (2009)
14
discussed site potentiality for petrol station business based on traffic volume counts using
a regression and Geographic Information System (GIS) based spatial system. The authors
stressed that, site potentiality is an important factor that influences business success of a
petrol station which relies on customer visits (p.10). On this note, Kearny (1998)
disclosed that, it was empirically found in the United States of America that, site location
was the primary factor for drivers to choose a petrol station (see also Hamid et al, 2009,
p.11).
15
2.3 CONCEPTUAL FRAMEWORK
The theory adopted for this study is Weber’s theory of Industrial location. This provides a
framework for studying the locational pattern of filling stations.
2.3.1 WEBER’S THEORY OF INDUSTRIAL LOCATION
The problems of Industrial location have been studied by number of economists. Alfred Weber a
German economist gave for the first time an analytical approach to the problem of industrial
location. He tried to give a modern, systematic and scientific approach for that. It was published
in 1909 in German language in the year of 1929. Weber’s theory of industrial location was
concerned with manufacturing location.
He has classified raw materials into two groups (i) ubiquities and (ii) localized. Ubiquities like
bricks, clay and water are available everywhere but localized material are like wood, coal, or
Iron is available only at certain places. Localised materials are classified into two categories pure
materials and gross materials. The materials like cotton, wood etc. add the whole or bulk of
weight to the finished product and are called “pure” materials. Others like wood, coal, or Iron,
tea and sugarcane that lose their weight in the process of manufacturing are ‘gross’ materials.
Weight losing material attracts the industry to the place where it is available. All localized
materials do no attract industries.
2.3.1.1 FACTORS OF INDUSTRIAL LOCATION
According to Weber’s theory, the two factors that are most important in determining the location
of an industry are (i) Transport cost and (ii) Labour cost.
The industrial units have to choose that location in such a way that its transport costs are minimal.
It is made by two factors, weight of the goods to be transported and distance to be covered.
According to him the location of manufacturing industry is determined by the ratio between the
weight of localized material and weight of product that is known as a ‘material index’. Industries
whose material index is not greater than one usually lie at the place of consumption. If the
localized material is not used in production and only ubiquitous material is used the material
index will be zero; because material index divided by weight of product. The industrial location
is influenced by labour cost, transport cost, agglomerative and deglomerative factors. The
16
transport cost and labour, cost which are called regional factors or primary factors. The
agglomerative and deglomerative factors are known as local factor or secondary factor.
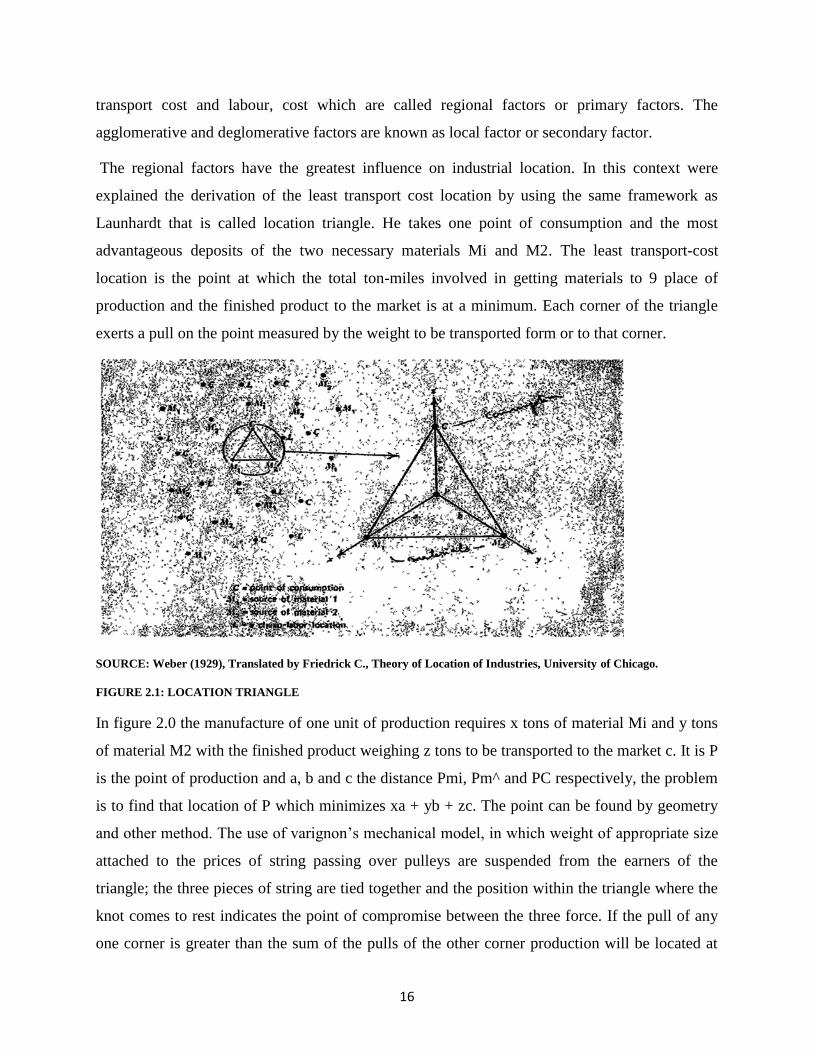
The regional factors have the greatest influence on industrial location. In this context were
explained the derivation of the least transport cost location by using the same framework as
Launhardt that is called location triangle. He takes one point of consumption and the most
advantageous deposits of the two necessary materials Mi and M2. The least transport-cost
location is the point at which the total ton-miles involved in getting materials to 9 place of
production and the finished product to the market is at a minimum. Each corner of the triangle
exerts a pull on the point measured by the weight to be transported form or to that corner.
SOURCE: Weber (1929), Translated by Friedrick C., Theory of Location of Industries, University of Chicago.
FIGURE 2.1: LOCATION TRIANGLE
In figure 2.0 the manufacture of one unit of production requires x tons of material Mi and y tons
of material M2 with the finished product weighing z tons to be transported to the market c. It is P
is the point of production and a, b and c the distance Pmi, Pm^ and PC respectively, the problem
is to find that location of P which minimizes xa + yb + zc. The point can be found by geometry
and other method. The use of varignon’s mechanical model, in which weight of appropriate size
attached to the prices of string passing over pulleys are suspended from the earners of the
triangle; the three pieces of string are tied together and the position within the triangle where the
knot comes to rest indicates the point of compromise between the three force. If the pull of any
one corner is greater than the sum of the pulls of the other corner production will be located at
17
the point or corner of origin of the dominant force. According to Weber’s theory the industry
may not be necessarily centred at the point of minimum transport cost. This way weber states, “A
location can be moved from the point of minimum transport cost. It can be established at the
place where labour cost is minimum to transportation cost to a more favorable labour location,
only if the saving in cost of labour which this new place make possible is larger than the
additional cost of transportation which it involves”.
The labour location and its power to attract industries depends on labour cost index and
locaitonal weight. The ratio between costs of labour per ton of product has been termed by
Weber as the labour cost index and the total weight to be transported during the whole process of
production as the locational weight. The extent of deviation caused by the varying labour costs
can be determined by its “labour co-efficient” that is the rate of labour costs to the location at
weight. The effect of a cheap labour location can be seen in Weber’s isodapane framework.
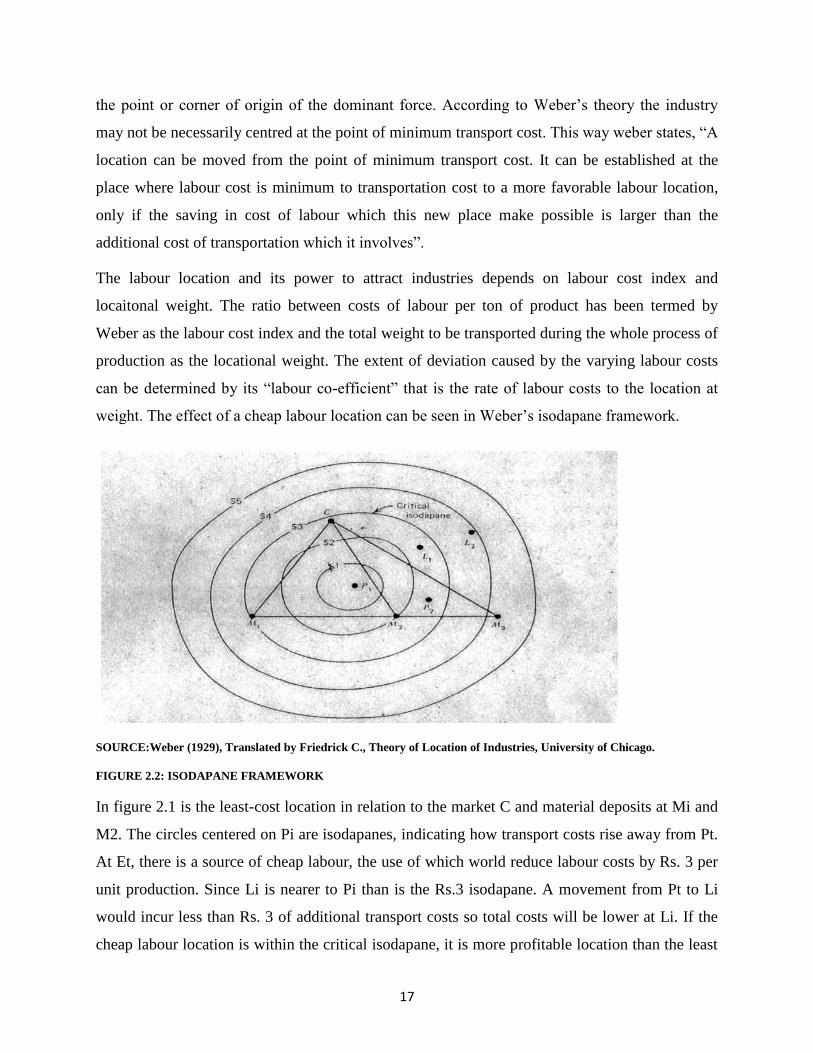
SOURCE:Weber (1929), Translated by Friedrick C., Theory of Location of Industries, University of Chicago.
FIGURE 2.2: ISODAPANE FRAMEWORK
In figure 2.1 is the least-cost location in relation to the market C and material deposits at Mi and
M2. The circles centered on Pi are isodapanes, indicating how transport costs rise away from Pt.
At Et, there is a source of cheap labour, the use of which world reduce labour costs by Rs. 3 per
unit production. Since Li is nearer to Pi than is the Rs.3 isodapane. A movement from Pt to Li
would incur less than Rs. 3 of additional transport costs so total costs will be lower at Li. If the
cheap labour location is within the critical isodapane, it is more profitable location than the least
18
transport cost site that is Li in figure, but if it is outside like L2, Pi will be the best location. But
movement to a cheap labor location may introduce further complication. It can be seen that
figure 2.3 is a deposit of the same material as is found at Mi, and it is obvious that a unit at Li
will prefer to use M3. A new locational triangle will be set up (M2 M3c) and a new transport
cost point at P2 will emerge, which could be a better location than U. The agglomerative and
deglomerative factors are also important for location. These factors are called secondary factors.
The total cost of production of industry has also a strong tendency to move toward
agglomeration location. If the production cost is less than in increasing transportation cost, the
industry will move towards agglomerative location. This way, the weberian theory shows how
these factors like transportation cost, labour cost, agglomerative and deglomerative factors affect
on industrial location. According to Weber’s theory, cost of transportation play predominant role
in industrial location.
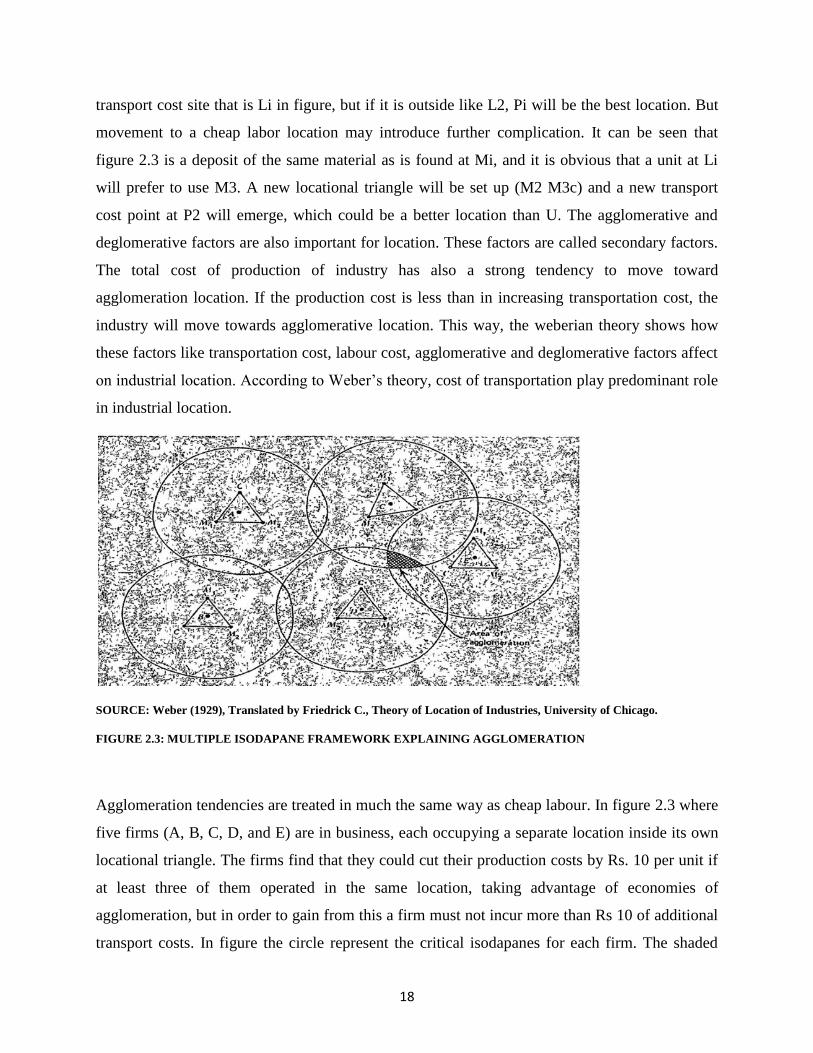
SOURCE: Weber (1929), Translated by Friedrick C., Theory of Location of Industries, University of Chicago.
FIGURE 2.3: MULTIPLE ISODAPANE FRAMEWORK EXPLAINING AGGLOMERATION
Agglomeration tendencies are treated in much the same way as cheap labour. In figure 2.3 where
five firms (A, B, C, D, and E) are in business, each occupying a separate location inside its own
locational triangle. The firms find that they could cut their production costs by Rs. 10 per unit if
at least three of them operated in the same location, taking advantage of economies of
agglomeration, but in order to gain from this a firm must not incur more than Rs 10 of additional
transport costs. In figure the circle represent the critical isodapanes for each firm. The shaded
19
area is the only place where three firms C, D and E can locate together and still each incur less
than Rs. 10 & extra transport costs.
2.3.1.2 LIMITATIONS OF WEBER’S THEORY OF INDUSTRIAL LOCATION
There are some limitations of the Weber’s theory of location. The theory is based on wrong
assumptions about labour supply; he assumed two things fixed labour centres and unlimited
supply of labour. It is not correct because a rise of an industry at a place may create new labour
centres, and unlimited labour supply at any center is also not correct as rapid development of
means of transport and communications is possible, so here alteration is required in weber’s
assumption regarding labour supply. Transportation cost depending only on distance to be
covered and weighs of the material to be carried requires amendment. It depends on the method
of transport, nature of goods also. To make it more realistic, the actual freight rate schedules
fixed for different means of transport must be taken into account. It would be incorrect to assume
fixed points of consumption, it is observed that consumers are spread all over all the country,
location and size of markets may vary with change in the economy. Non economic factors also
exert important influence on industrial location. The theory ignores the role of capital and
entrepreneurship in industrialization. And the classification of material is not proper; Austin
Robinson considers this distinction artificial.
2.4 HYPOTHESES TESTED
In other to achieve the stated objectives, the following hypotheses were formulated and tested;
1. The locational pattern of filling stations is Random.
2. There is no significant relationship between number of filling stations and average
income per ward.
3. There is no significant relationship between cost of transporting product and distance
from Central market
4. There is no significant relationship between type of ownership of filling station and
number of employees.
5. There is a significant variation in the number of filling stations across the ten wards in the
study area.
20
CHAPTER THREE
RESEARCH METHODOLOGY
3.1 INTRODUCTION
This chapter presents the research method used which includes, research design, types and
sources of data, sample frame and size, sampling techniques and data collection procedure, and
data analysis.
3.2 RESEARCH DESIGN
The research was designed to determine the locational pattern of filling stations in the study area,
and to discern explanatory factors responsible for the location pattern observed. Questionnaires
were designed for the purpose of the research work, one was designed to get information from
filling station owners and the other was designed to get information from households. The
questions in the questionnaires were carefully structured in line with the objectives of the study.
3.3 TYPES AND SOURCES OF DATA
The data employed in the study are from both Primary and Secondary sources.
3.3.1 PRIMARY DATA
Primary data are information gotten from questionnaires, interviews, and so on from the sample
population. Reconnaissance survey was carried out in the study area to familiarize the researcher
with the sample population. In this research, the use of questionnaires was adopted and was
divided into two appendixes. Appendix I was distributed to filling station owners or managers in
Oyo West LGA. This was divided into various sections, with section A capturing information
about the filling stations, and section B capturing the perception of respondents on the location of
filling stations with regards to reasons for locating filling stations where they are located.
Appendix II was shared to households in Oyo West LGA, this was divided into various sections,
with section A capturing information about the Location details of households, section B
capturing the socio-economic characteristics of respondents, section C capturing information on
petroleum products purchased by households, and section D capturing information on perception
of respondents on the location of filling stations.
21
3.3.2 SECONDARY DATA
Secondary data are information gotten from other sources published or in government/private
sectors. Other relevant sources of information such as text materials, archives, thesis, map, online
materials, articles, and published journals which will all be used to complement the already
obtained primary data.
The secondary data sources that were consulted include, LGA ward classification data, locality
data of the LGA from 1991 population census (NPC, 1991), text materials, and published
journals.
3.4 SAMPLE FRAME AND SIZE
A sample frame is a complete list of all the members of the population that we wish to study. For
appendix I, the totality of all filling stations in the study area constitute the sample frame. Also,
for appendix ii, the residents of Oyo West LGA constitute the sample frame.
Sample size determination refers to the act of choosing the number of observations or replicates
to include in statistical sample. For the purpose of the study, in choosing the sampling size and
securing representative responses, the Taro Yamane sample size method was employed to get the
projected population of 2017 from the 1999 population census data for the local government area
which gave us a total of 400 questionnaires for households, of which 2 questionnaires got
missing. A field survey was carried out to ascertain the total number of filling stations in the
LGA, a total of 42 filling stations was documented. As such, one questionnaire was administered
to the owner/manager of each filling station to make a total of 42 questionnaires for filling
stations.
Below are the formula employed in getting projected population census from 1991 population
census data, and Sample Size for the household survey.
Taro Yameni Sample Size formula (n)= N/(1 + (N x (e²))
Where n= sample size
22
N= Population under study
e= margin error (0.05)
Projected Population formula (PP) = (1 + GR) ^yr × CP
Where pp= projected population
GR= current growth rate or decrease rate of the population
Yr= interval between the year of the current population and the year of the projected
population.
CP= Current population.
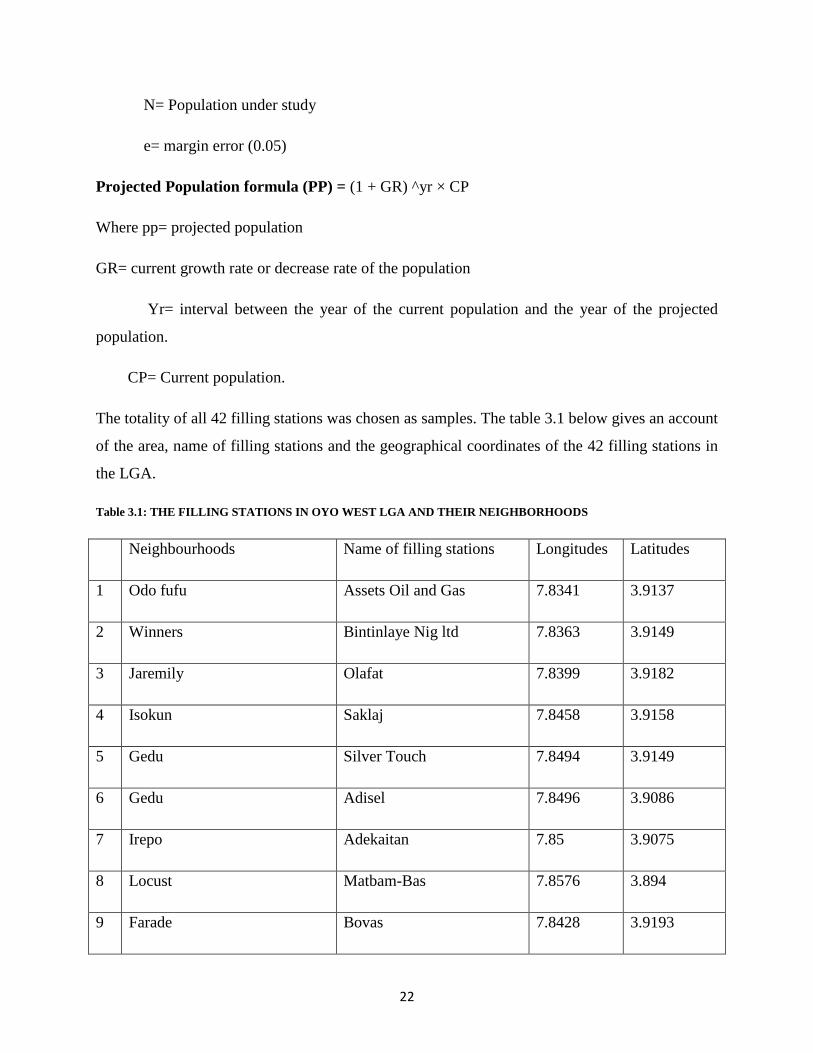
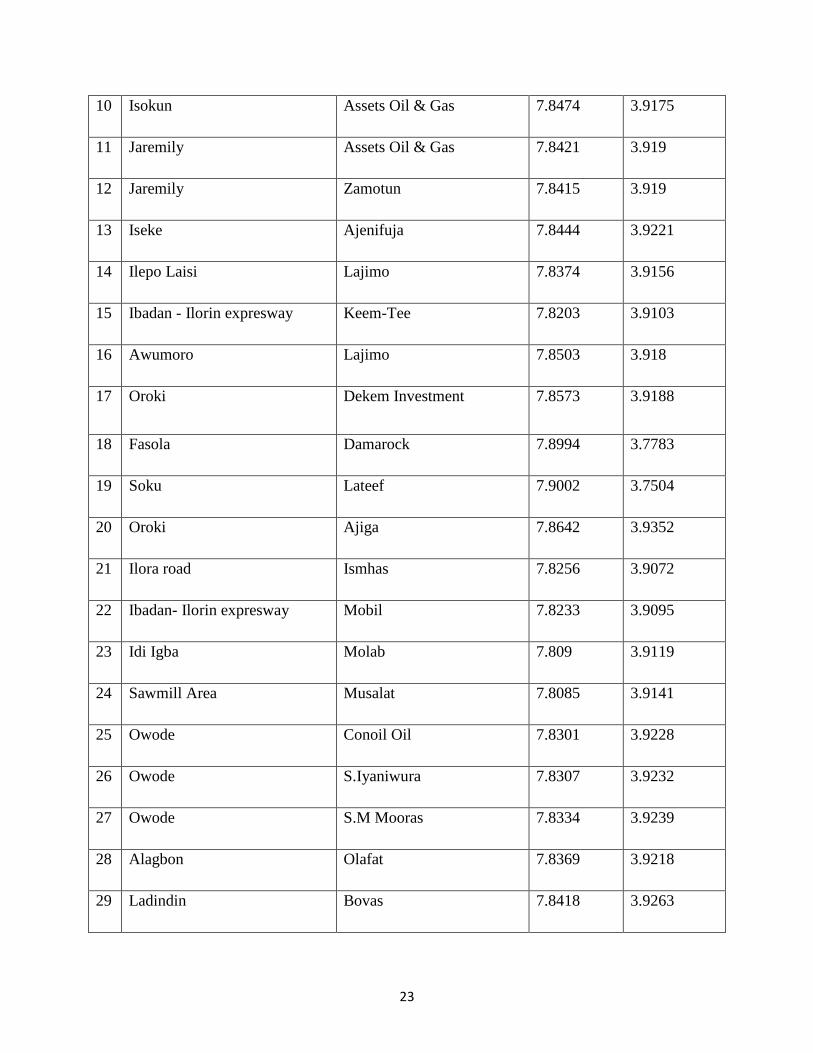
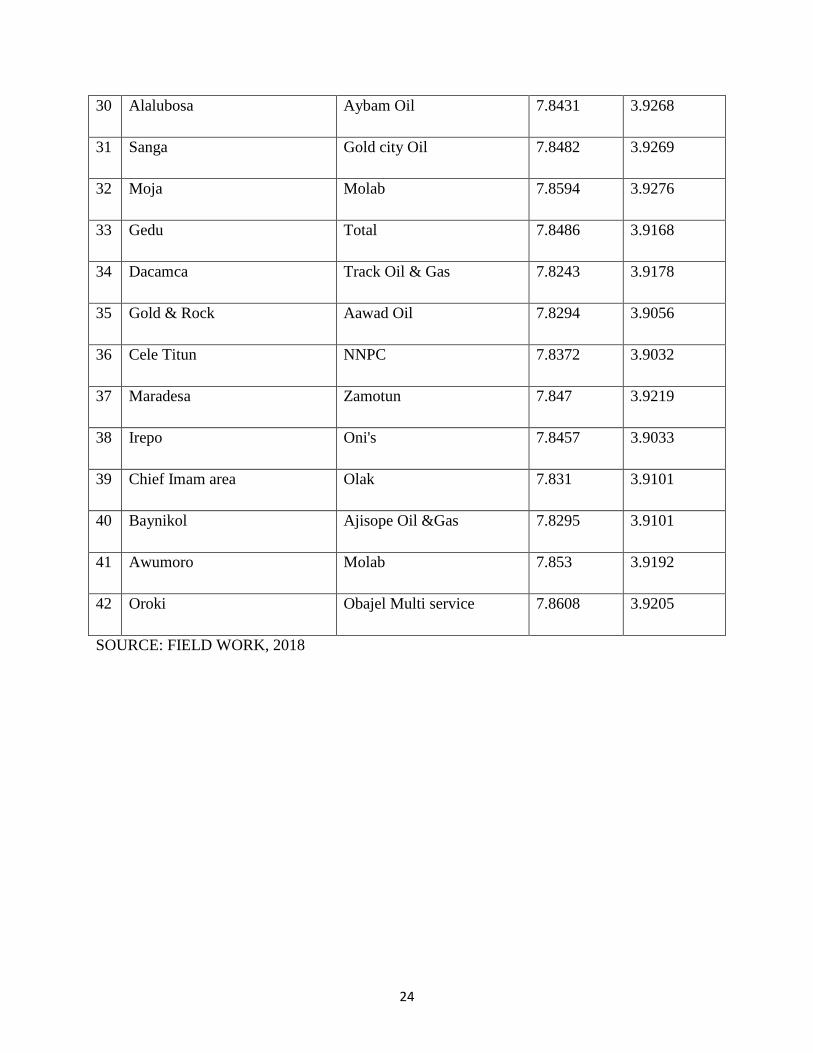
The totality of all 42 filling stations was chosen as samples. The table 3.1 below gives an account
of the area, name of filling stations and the geographical coordinates of the 42 filling stations in
the LGA.
Table 3.1: THE FILLING STATIONS IN OYO WEST LGA AND THEIR NEIGHBORHOODS
Neighbourhoods Name of filling stations Longitudes Latitudes
1 Odo fufu Assets Oil and Gas 7.8341 3.9137
2 Winners Bintinlaye Nig ltd 7.8363 3.9149
3 Jaremily Olafat 7.8399 3.9182
4 Isokun Saklaj 7.8458 3.9158
5 Gedu Silver Touch 7.8494 3.9149
6 Gedu Adisel 7.8496 3.9086
7 Irepo Adekaitan 7.85 3.9075
8 Locust Matbam-Bas 7.8576 3.894
9 Farade Bovas 7.8428 3.9193
23
10 Isokun Assets Oil & Gas 7.8474 3.9175
11 Jaremily Assets Oil & Gas 7.8421 3.919
12 Jaremily Zamotun 7.8415 3.919
13 Iseke Ajenifuja 7.8444 3.9221
14 Ilepo Laisi Lajimo 7.8374 3.9156
15 Ibadan - Ilorin expresway Keem-Tee 7.8203 3.9103
16 Awumoro Lajimo 7.8503 3.918
17 Oroki Dekem Investment 7.8573 3.9188
18 Fasola Damarock 7.8994 3.7783
19 Soku Lateef 7.9002 3.7504
20 Oroki Ajiga 7.8642 3.9352
21 Ilora road Ismhas 7.8256 3.9072
22 Ibadan- Ilorin expresway Mobil 7.8233 3.9095
23 Idi Igba Molab 7.809 3.9119
24 Sawmill Area Musalat 7.8085 3.9141
25 Owode Conoil Oil 7.8301 3.9228
26 Owode S.Iyaniwura 7.8307 3.9232
27 Owode S.M Mooras 7.8334 3.9239
28 Alagbon Olafat 7.8369 3.9218
29 Ladindin Bovas 7.8418 3.9263
24
30 Alalubosa Aybam Oil 7.8431 3.9268
31 Sanga Gold city Oil 7.8482 3.9269
32 Moja Molab 7.8594 3.9276
33 Gedu Total 7.8486 3.9168
34 Dacamca Track Oil & Gas 7.8243 3.9178
35 Gold & Rock Aawad Oil 7.8294 3.9056
36 Cele Titun NNPC 7.8372 3.9032
37 Maradesa Zamotun 7.847 3.9219
38 Irepo Oni's 7.8457 3.9033
39 Chief Imam area Olak 7.831 3.9101
40 Baynikol Ajisope Oil &Gas 7.8295 3.9101
41 Awumoro Molab 7.853 3.9192
42 Oroki Obajel Multi service 7.8608 3.9205
SOURCE: FIELD WORK, 2018
25
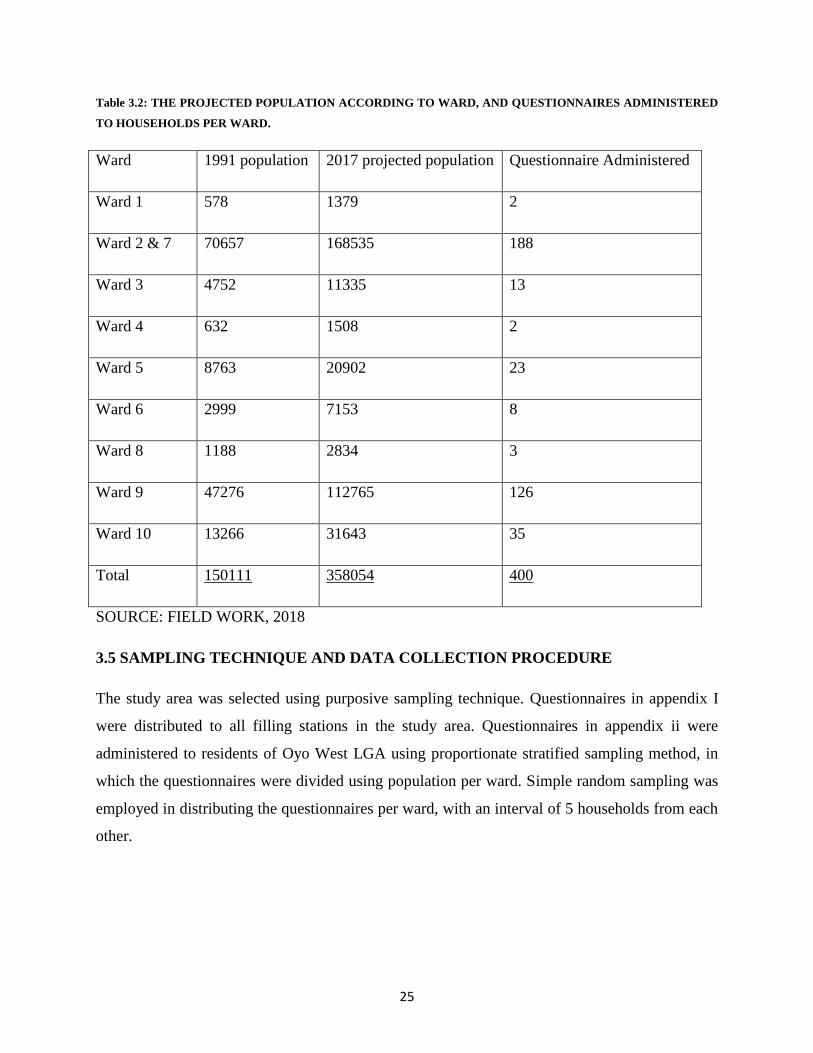
Table 3.2: THE PROJECTED POPULATION ACCORDING TO WARD, AND QUESTIONNAIRES ADMINISTERED
TO HOUSEHOLDS PER WARD.
Ward 1991 population 2017 projected population Questionnaire Administered
Ward 1 578 1379 2
Ward 2 & 7 70657 168535 188
Ward 3 4752 11335 13
Ward 4 632 1508 2
Ward 5 8763 20902 23
Ward 6 2999 7153 8
Ward 8 1188 2834 3
Ward 9 47276 112765 126
Ward 10 13266 31643 35
Total 150111 358054 400
SOURCE: FIELD WORK, 2018
3.5 SAMPLING TECHNIQUE AND DATA COLLECTION PROCEDURE
The study area was selected using purposive sampling technique. Questionnaires in appendix I
were distributed to all filling stations in the study area. Questionnaires in appendix ii were
administered to residents of Oyo West LGA using proportionate stratified sampling method, in
which the questionnaires were divided using population per ward. Simple random sampling was
employed in distributing the questionnaires per ward, with an interval of 5 households from each
other.
26
3.6 DATA ANALYSIS
In analyzing the data collected, a series of statistical tools and methods were employed. The data
derived from the administered questionnaire were allowed to be defined by appropriate
descriptive and inferential statistical methods of analysis. The descriptive statistics involve the
use of frequency tables, percentages, pie charts and bar charts. The data derived from the field
survey will be converted to measurable data and then coded. The statistical package for social
sciences (SPSS) version 20.0 was employed to statistically analyze the data obtained from the
field survey. In addition to the descriptive statistics used, inferential statistical techniques were
also employed in the course of the analysis.
In terms of hypotheses testing, hypothesis 1 which states that the locational pattern of filling
stations is random was tested using the statistical technique of nearest neighbor analysis to
determine the spatial pattern of distribution of filling stations in the LGA. This was done via the
aid of geographical positioning system (GPS) to collect the geographical coordinate data of the
filling stations in the LGA and the use of Arc GIS 10.3 software to run the analysis. The
boundary of the study area was also digitized from a geo-referenced map. The coordinate as well
as the vector boundary shape files of the study area was projected to UTM Zone 31 N (Projected
coordinate) for accurate result of the analysis. Average Nearest Neighbor analysis in spatial
analysis extension of ArcGIS 10.3 was used to analyze the data.
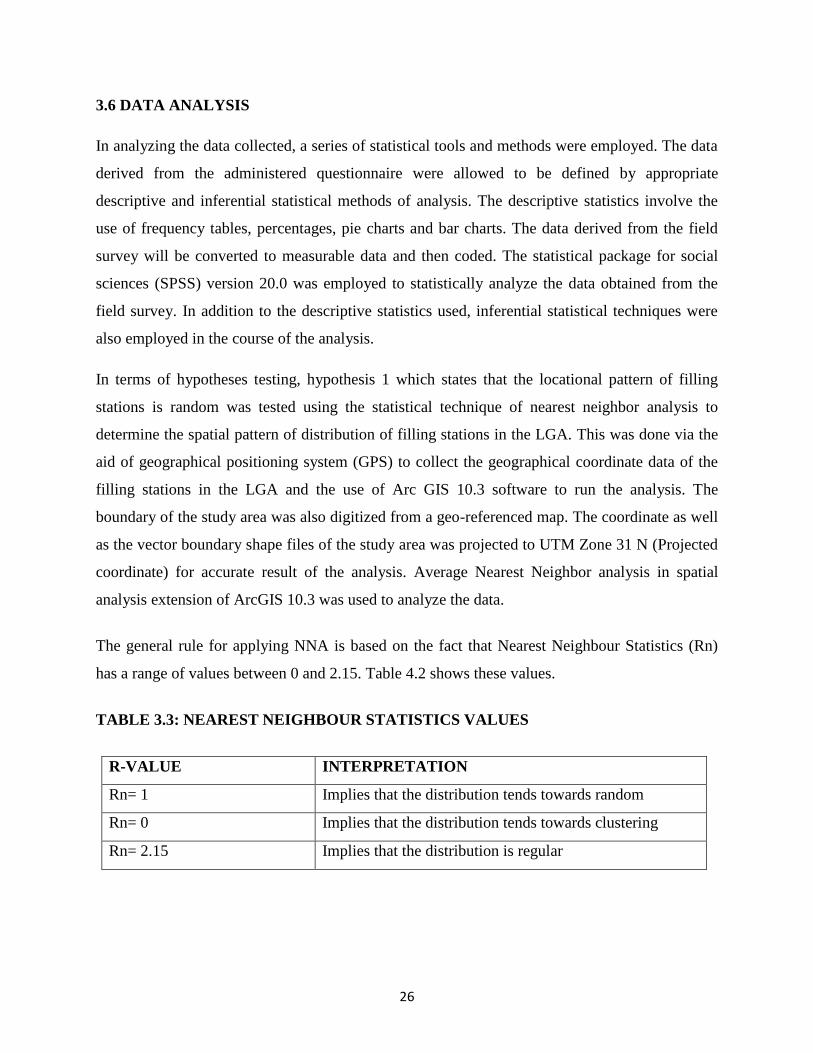
The general rule for applying NNA is based on the fact that Nearest Neighbour Statistics (Rn)
has a range of values between 0 and 2.15. Table 4.2 shows these values.
TABLE 3.3: NEAREST NEIGHBOUR STATISTICS VALUES
R-VALUE INTERPRETATION
Rn= 1 Implies that the distribution tends towards random
Rn= 0 Implies that the distribution tends towards clustering
Rn= 2.15 Implies that the distribution is regular
27
Hypothesis 2 which states that there is no significant relationship between number of filling
stations and average income per ward was tested using Pearson correlation because of the
parametric characteristics of the variables under consideration. Hypothesis 3 which states that
there is no significant relationship between cost of transporting product and distance from central
market was tested using Pearson correlation because of the parametric characteristics of the
variables under consideration. Hypothesis 4 which states that there is no significant relationship
between type of ownership of filling station and number of employees was tested using
Independent Samples T-test. Hypothesis 5 which states that there is no significant variation in
the number of filling stations across the ten wards in the study area was tested using One way
analysis of variance (ANOVA).
3.7 PROBLEMS ENCOUNTERED DURING DATA COLECTION
My first visit to the study area was aimed at performing a reconnaissance survey of all the filling
stations in Oyo West Local Government Area. The very first difficulty confronted with has to do
with capturing the entire filling stations in the LGA. Some filling stations were located in places
I am not familiar with and some are located in villages in which I had to travel a long distance to
capture them. However with the help of locals and repetitive series of survey, a total of forty-two
(42) filling stations were recorded.
In terms of questionnaire administration, the first challenge posed was perhaps the unavailability
of managers or filling station owners on getting to the filling stations, and since most are not
formally educated, it appeared quite irrational to drop my questionnaires. As a result I had to go
back very early around 6:30am and late in the night around 8:00pm to 8:30pm when they will be
available, since they will be exercising their managerial duty at the said time. Some manager or
filling station owners despite going at the time claim they are busy and instruct me to come back
some other days which I did, and some claim they need to inform the owner first before granting
me audience. On the part of the respondents to the household survey, majority of them
responded enthusiastically to my interview while some displayed apathetic attitudes. Collectively,
all these challenges more or less delayed the process of smooth data collection.
28
CHAPTER FOUR
LOCATIONAL PATTERN AND EXPLANATORY FACTORS OF LOCATION OF
PETROL FILLING STATIONS
4.1 INTRODUCTION
This chapter discusses the locational pattern of filling stations, information about filling station,
factors of location and the temporal distribution of filling station.
Also, this chapter discusses the social-economic characteristics of household respondents,
composition of those using petroleum products, products used, frequency of purchase, reasons
for patronizing filling station of choice, perception of the location of filling station, benefit of the
location of filling station, and consequences of the location of filling stations in the
neighbourhood.
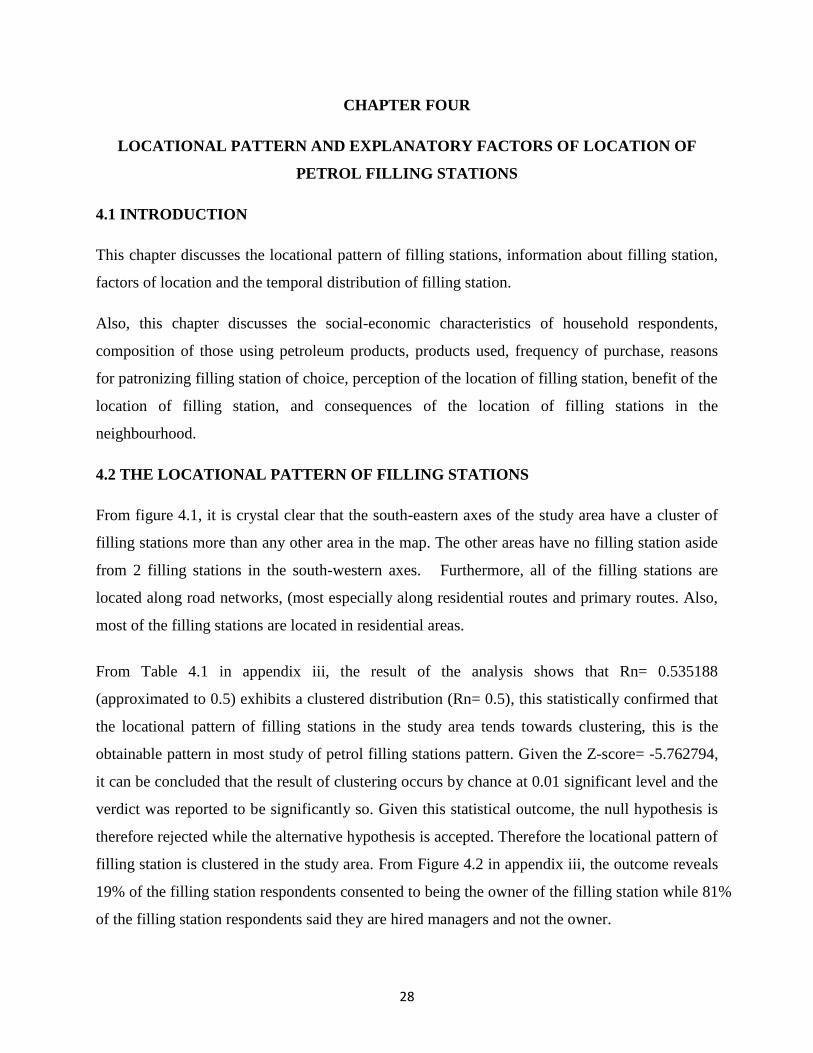
4.2 THE LOCATIONAL PATTERN OF FILLING STATIONS
From figure 4.1, it is crystal clear that the south-eastern axes of the study area have a cluster of
filling stations more than any other area in the map. The other areas have no filling station aside
from 2 filling stations in the south-western axes. Furthermore, all of the filling stations are
located along road networks, (most especially along residential routes and primary routes. Also,
most of the filling stations are located in residential areas.
From Table 4.1 in appendix iii, the result of the analysis shows that Rn= 0.535188
(approximated to 0.5) exhibits a clustered distribution (Rn= 0.5), this statistically confirmed that
the locational pattern of filling stations in the study area tends towards clustering, this is the
obtainable pattern in most study of petrol filling stations pattern. Given the Z-score= -5.762794,
it can be concluded that the result of clustering occurs by chance at 0.01 significant level and the
verdict was reported to be significantly so. Given this statistical outcome, the null hypothesis is
therefore rejected while the alternative hypothesis is accepted. Therefore the locational pattern of
filling station is clustered in the study area. From Figure 4.2 in appendix iii, the outcome reveals
19% of the filling station respondents consented to being the owner of the filling station while 81%
of the filling station respondents said they are hired managers and not the owner.
29
Figure 4.1: THE LOCATIONAL PATTERN OF FILLING STATIONS IN OYO WEST LGA
30
From table 4.12 in appendix iii, it was observed that the number of filling stations varied
significantly across the wards. This means that there is a wide gap between the wards of the
study area in terms of number of filling stations located in them. This shows that there is uneven
distribution of filling stations across the 10 wards of the study area in which some wards have
more filling stations than others. The null hypothesis is hereby accepted as there is a significant
variation in the number of filling stations across the ten wards in Oyo West LGA.
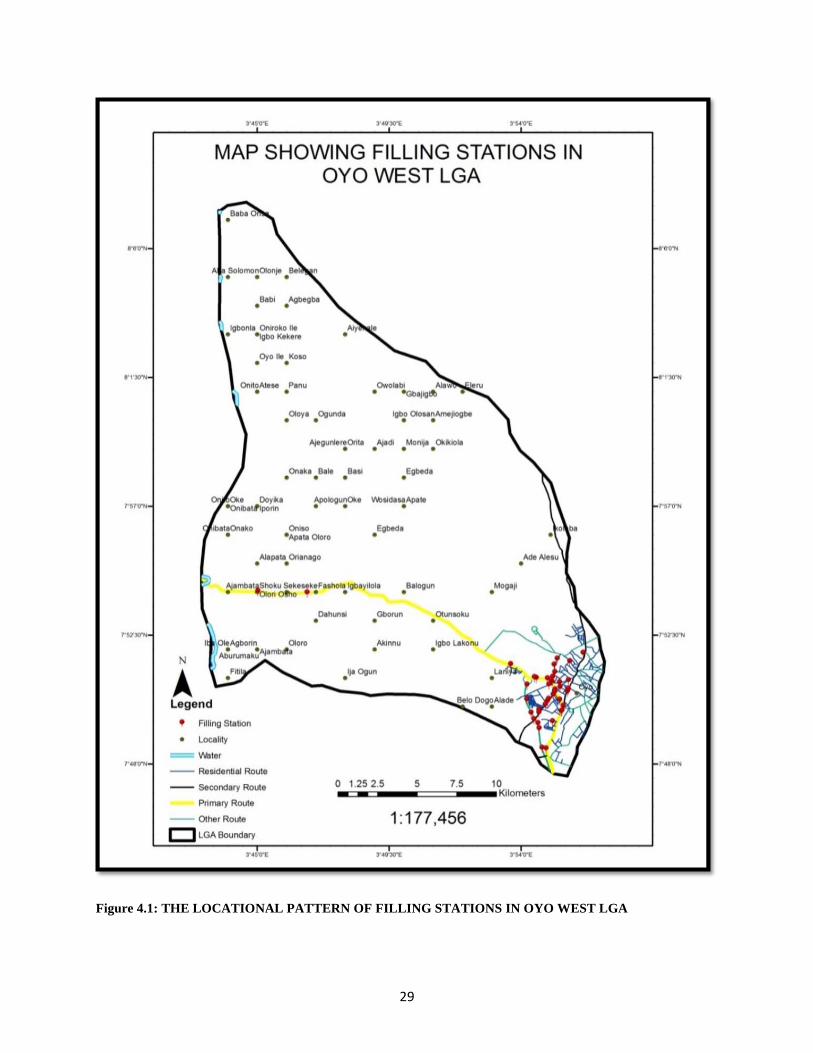
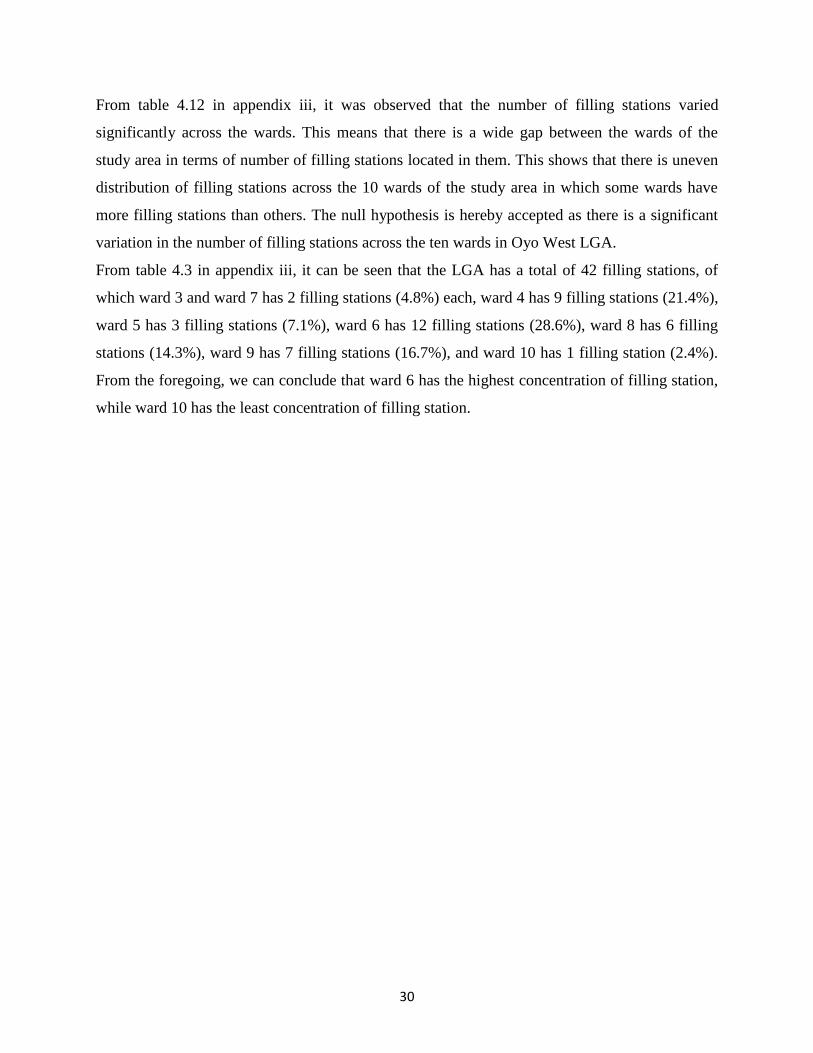
From table 4.3 in appendix iii, it can be seen that the LGA has a total of 42 filling stations, of
which ward 3 and ward 7 has 2 filling stations (4.8%) each, ward 4 has 9 filling stations (21.4%),
ward 5 has 3 filling stations (7.1%), ward 6 has 12 filling stations (28.6%), ward 8 has 6 filling
stations (14.3%), ward 9 has 7 filling stations (16.7%), and ward 10 has 1 filling station (2.4%).
From the foregoing, we can conclude that ward 6 has the highest concentration of filling station,
while ward 10 has the least concentration of filling station.
31
FIGURE 4.2: THE PERCENTAGE OF FILLING STATIONS PER WARD
4.8
21.4
7.1
28.6
4.8
14.3
16.7
2.4
0
5
10
15
20
25
30
35
3 4 5 6 7 8 9 10
PER
CEN
TAG
E O
F F
ILLI
NG
ST
ATI
ON
S
WARDS
Percent
32
From table 4.4 in appendix iii, it can be observed that out of the total 42 filling stations in the
study area, 27 neighbourhoods have 1 filling station (2.4%) each, 3 neighbourhoods have 2
filling stations each (4.8%), and 3 other neighbourhoods have 3 filling stations (7.1%).
4.3 FILLING STATION OWNERSHIP
Also, from table 4.5 in appendix iii, Awad Oil Nig. Ltd, Adekaitan Company Nig. Ltd, Adisel,
Ajenifuja Global Concept, Ajiga, Ajisope, Aybam Oil & Gas, Bintinlaye Energy Res, Conoil Oil,
Damarok Nig. Ltd, Dekem, Gold City Oil, Ismhas, Keem-Tee Inv. Res Ltd, Lateef Temitope
Ventures, MATBAMBAS, Mobil, Musalat, NNPC, Obajel, Olak Comm. Ent. Nig. Ltd, Onis
Global Concepts, S.M Mooras, Saklaj Unique Concept Ltd, Silver Touch Ind. Ltd, Sola
Iyaniwura, Total, and Track Oil and Gas have 1 filling station (2.4%) each. Bovas filling station,
Olafat, Lajimo, and amotun Ind. Ltd have 2 filling stations (4.8%) each. while Assets Oil & Gas
and Molab Nig. Ltd has the highest holding of filling stations in the study area, they have 3
filling stations (7.1%) each.
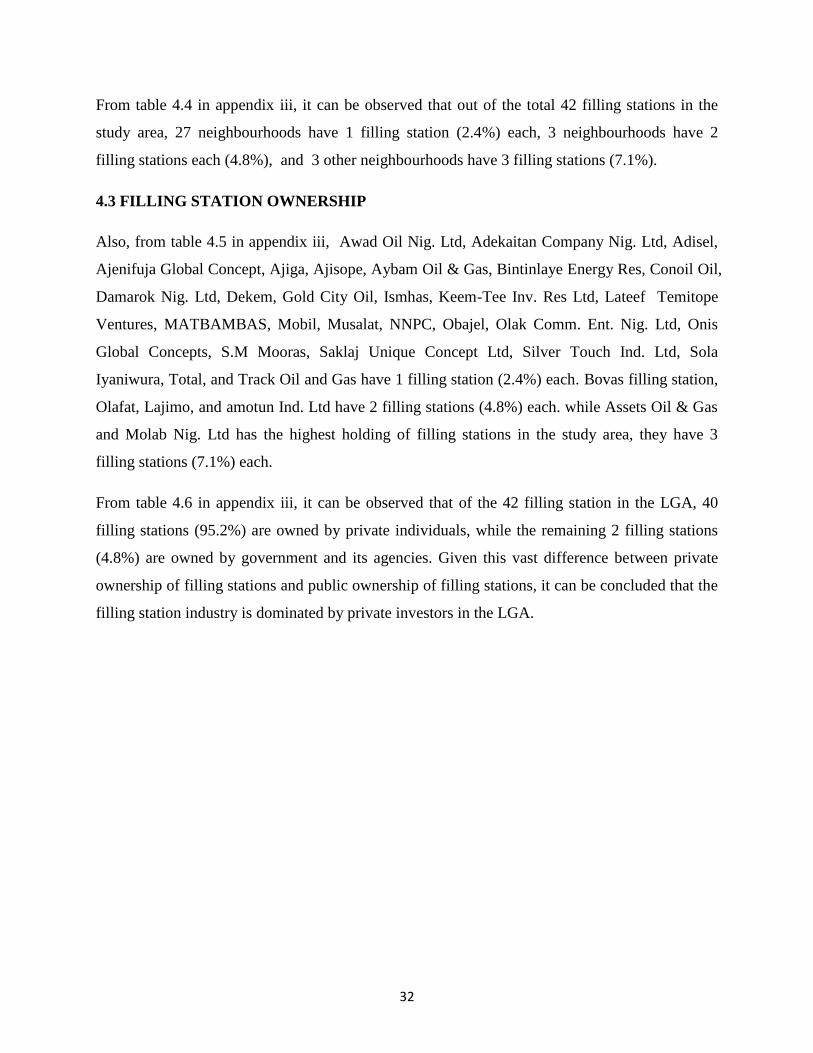
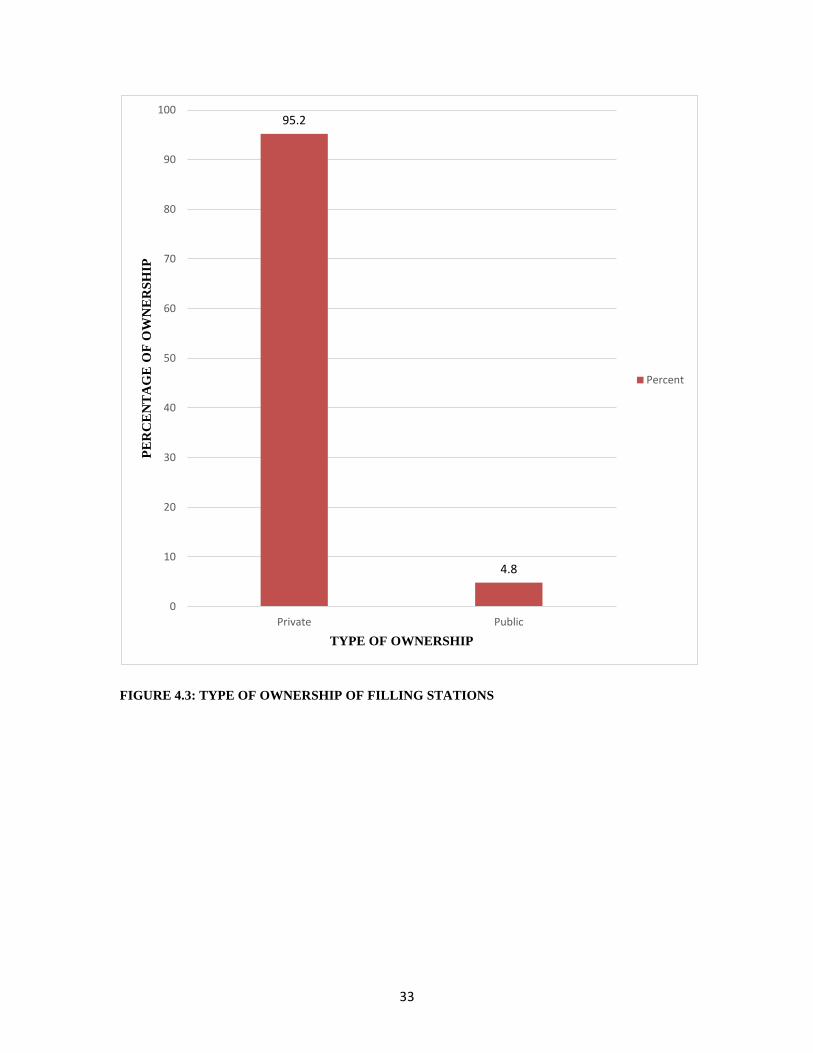
From table 4.6 in appendix iii, it can be observed that of the 42 filling station in the LGA, 40
filling stations (95.2%) are owned by private individuals, while the remaining 2 filling stations
(4.8%) are owned by government and its agencies. Given this vast difference between private
ownership of filling stations and public ownership of filling stations, it can be concluded that the
filling station industry is dominated by private investors in the LGA.
33
FIGURE 4.3: TYPE OF OWNERSHIP OF FILLING STATIONS
95.2
4.8
0
10
20
30
40
50
60
70
80
90
100
Private Public
PE
RC
EN
TA
GE
OF
OW
NE
RS
HIP
TYPE OF OWNERSHIP
Percent
34
From table 4.11 in appendix iii, it can be observed that there is no significant relationship
between the type of ownership and number of employees as reported by filling station owners in
Oyo West LGA. This means that the type of ownership of petrol filling stations does not in any
way determine the number of employees that is employed by the filling stations in the study area.
Thus, the null hypothesis which states that, “There is no significant relationship between type of
ownership and number of employees” is hereby accepted.
4.4 TEMPORAL DISTRIBUTION OF FILLING STATIONS
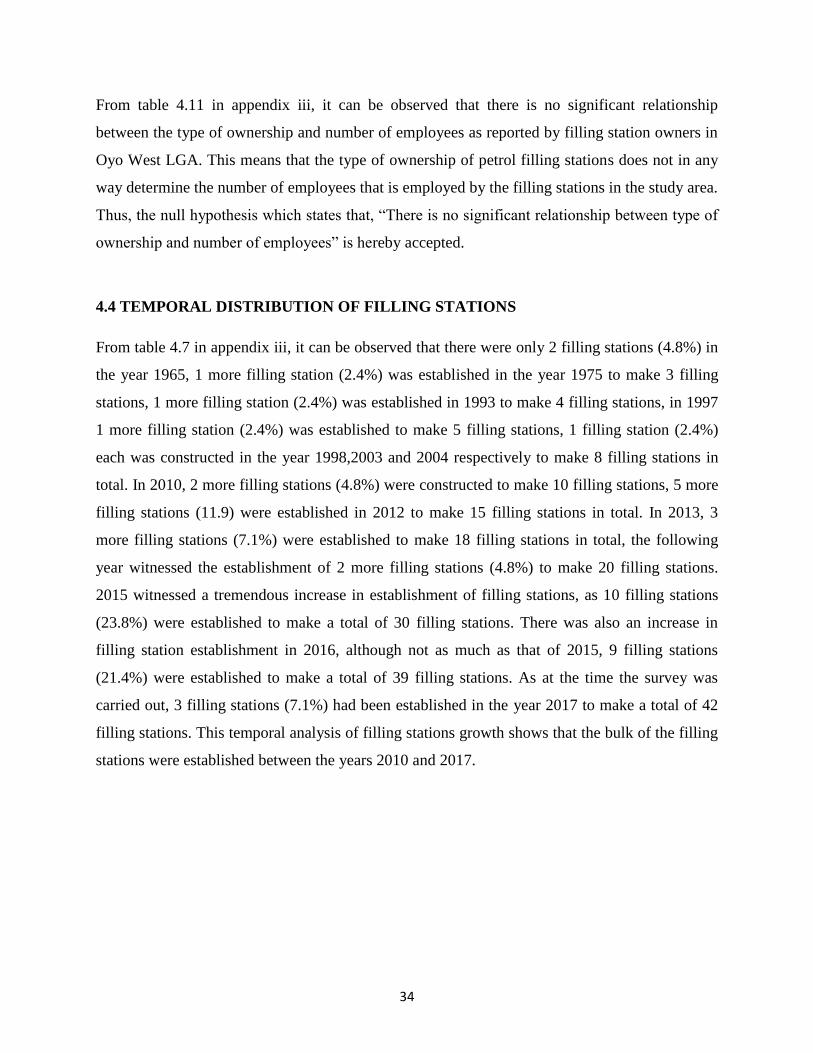
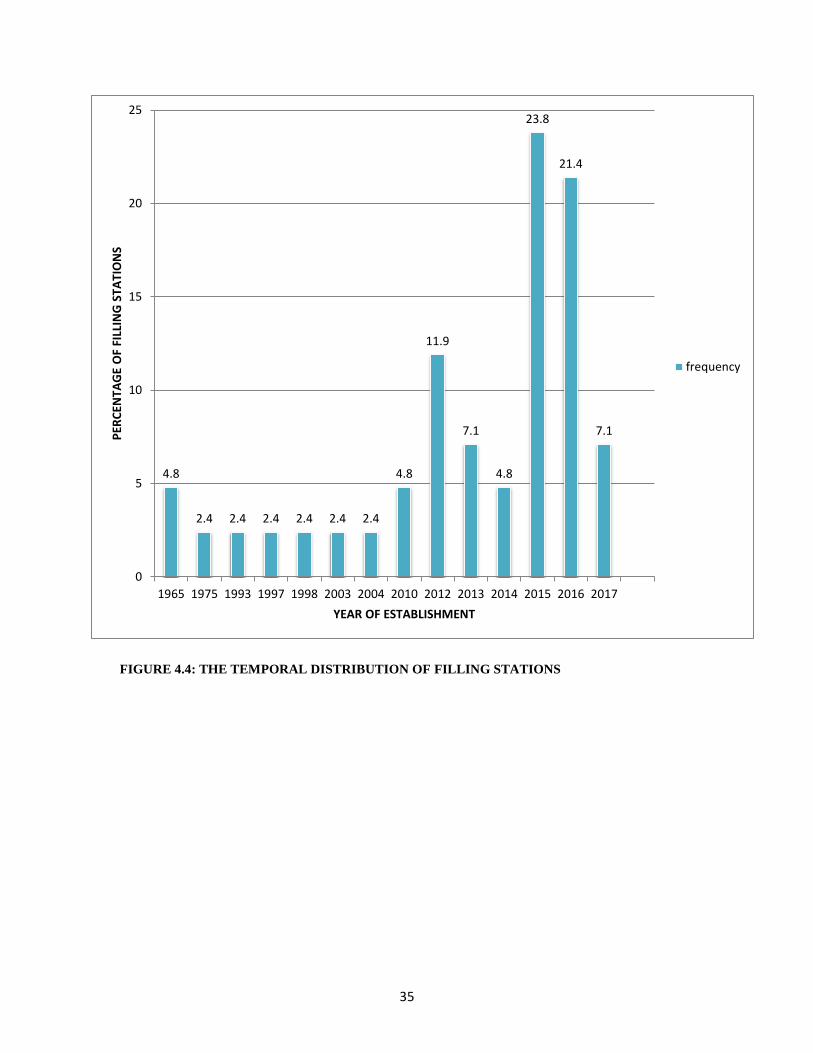
From table 4.7 in appendix iii, it can be observed that there were only 2 filling stations (4.8%) in
the year 1965, 1 more filling station (2.4%) was established in the year 1975 to make 3 filling
stations, 1 more filling station (2.4%) was established in 1993 to make 4 filling stations, in 1997
1 more filling station (2.4%) was established to make 5 filling stations, 1 filling station (2.4%)
each was constructed in the year 1998,2003 and 2004 respectively to make 8 filling stations in
total. In 2010, 2 more filling stations (4.8%) were constructed to make 10 filling stations, 5 more
filling stations (11.9) were established in 2012 to make 15 filling stations in total. In 2013, 3
more filling stations (7.1%) were established to make 18 filling stations in total, the following
year witnessed the establishment of 2 more filling stations (4.8%) to make 20 filling stations.
2015 witnessed a tremendous increase in establishment of filling stations, as 10 filling stations
(23.8%) were established to make a total of 30 filling stations. There was also an increase in
filling station establishment in 2016, although not as much as that of 2015, 9 filling stations
(21.4%) were established to make a total of 39 filling stations. As at the time the survey was
carried out, 3 filling stations (7.1%) had been established in the year 2017 to make a total of 42
filling stations. This temporal analysis of filling stations growth shows that the bulk of the filling
stations were established between the years 2010 and 2017.
35
FIGURE 4.4: THE TEMPORAL DISTRIBUTION OF FILLING STATIONS
4.8
2.4 2.4 2.4 2.4 2.4 2.4
4.8
11.9
7.1
4.8
23.8
21.4
7.1
0
5
10
15
20
25
1965 1975 1993 1997 1998 2003 2004 2010 2012 2013 2014 2015 2016 2017
PER
CEN
TAG
E O
F FI
LLIN
G S
TATI
ON
S
YEAR OF ESTABLISHMENT
frequency
36
4.5 EXPLANATORY FACTORS OF LOCATION OF PETROL FILLING STATIONS
As accounted for in figure 4.8 in appendix iii, it can be seen that a total number of 8 filling
stations (19.0%) were located primarily because of cheap land value. Also, in similar fashion 11
filling stations (26.2%) located where they because of proximity to market place. And 23 filling
stations (54.8%) located where they are because the location is profitable. Given the statistics, it
can be concluded that most of the filling stations in Oyo West LGA located where they are
because the location is profitable, without considering the health impact.
From the correlation analysis between number of filling stations and average income per ward in
table 4.9 in appendix iii, it was observed that there is a significant relationship between the
number of filling stations and the average monthly income of respondents in Oyo West LGA,
this means that average income per ward is one of the factors that influence the location of filling
stations in the study area. That is, wards with a higher average income do have a higher
concentration of petrol filling stations than those with lower average income. Thus, the null
hypothesis which states that, “there is no significant relationship between number of filling
stations and average income per ward” is hereby rejected and the alternative accepted as there is
a significant relationship as revealed by the test statistics.
From table 4.10 in appendix iii, it can be observed that there is no significant relationship
between the cost of transporting product and distance from central market as reported by filling
station owners in Oyo West LGA. This means that the distance of petrol filling stations from
central market (Akesan) does not influence the cost of transporting petroleum products from the
source of supply. It then means that the distance of petrol filling stations from central market
does not increase or decrease the cost of transporting petroleum products from the source of
supply. Thus, the null hypothesis which states that, “there is no significant relationship between
cost of transporting product and distance from central market” is hereby accepted.
4.6 PRODUCTS SOLD BY FILLING STATIONS
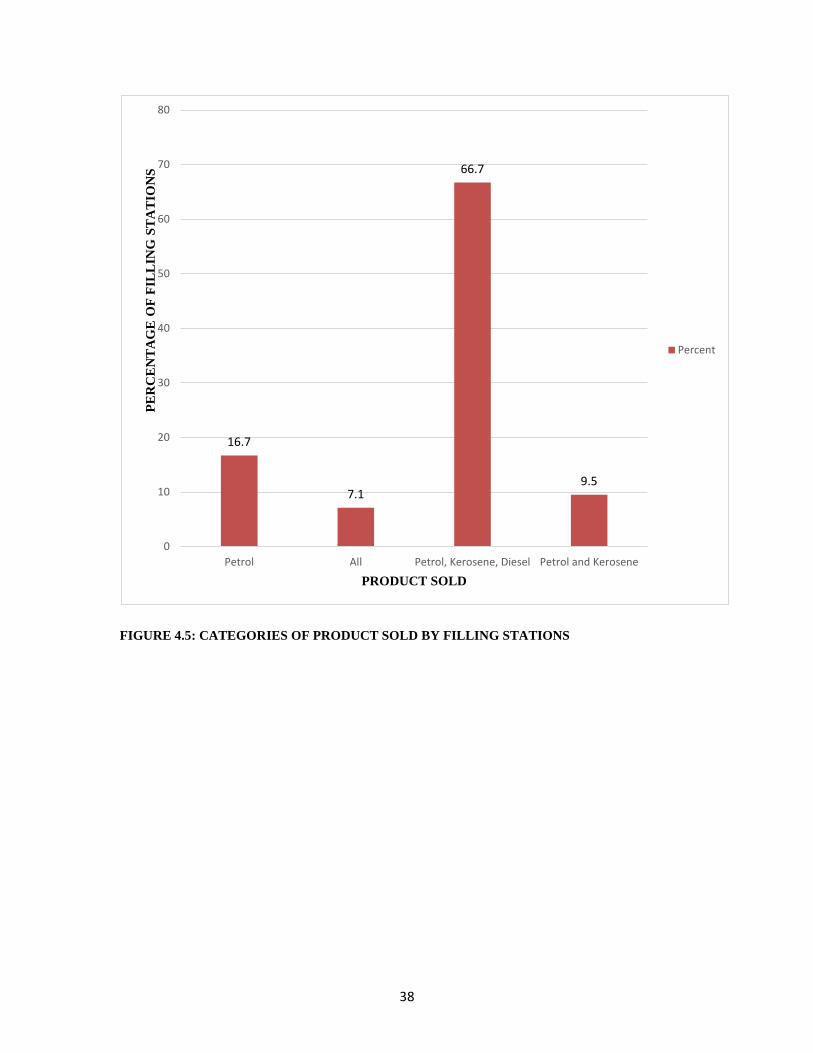
From table 4.13 in appendix iii, it can be observed that 7 filling stations (16.7%) sell only petrol
or PMS. Also, only 3 filling stations (7.1%) sell all products (petrol, kerosene, diesel, Gas and
lubricants) out of all filling stations in the LGA. It was also revealed that 28 filling stations
(66.7%) sell petrol, kerosene and diesel. Also, 4 filling stations (9.5%) sell just petrol and

37
kerosene in Oyo West LGA. Therefore, it can be concluded from the statistics that majority of
the filling station sell just petrol, kerosene and diesel.
38
FIGURE 4.5: CATEGORIES OF PRODUCT SOLD BY FILLING STATIONS
16.7
7.1
66.7
9.5
0
10
20
30
40
50
60
70
80
Petrol All Petrol, Kerosene, Diesel Petrol and Kerosene
PE
RC
EN
TA
GE
OF
FIL
LIN
G S
TA
TIO
NS
PRODUCT SOLD
Percent
39
4.7 DISTANCE OF FILLING STATIONS TO STRUCTURES
This section discusses the proximity of filling stations to structures such as Central market,
central business district, and nearest place of residence in the LGA. Out of the 10 wards of Oyo
West LGA, only 8 of the wards have filling stations which are ward 3 to 10, and the distances are
explained in relation to each of these wards i.e. from ward 3 to 8 respectively.
4.7.1 DISTANCE OF FILLING STATIONS TO CENTRAL MARKET (AKESAN)
From table 4.14 in appendix iii, it can be seen that out of the total 42 filling stations in Oyo West
LGA, 12 filling stations (28.6%) fall within the distance of 500-3900 meters from central market
(of which ward 4 has 3 filling stations (7.1%), ward 5, 6, 7, and 9 has 2 filling stations (4.8%)
each, and ward 8 has 1 filling station (2.4%). Also 28 filling stations (66.7%) falls within the
distance of 4000-9000 meters from central market (of which ward 4 has 6 fillings stations
(14.3%), ward 5 and 10 has 1 filling station (2.4%) each, ward 6 has 10 filling stations (23.8%),
and ward 8 and 9 has 5 filling stations (11.9%) each.
The table also reveals that only 2 filling stations (4.8%) fall within 10000 meters and above from
central market (of which the two filling stations are in ward 2. It can be concluded that ward 3
has all of its filling stations within 10000 meters and above from central market, ward 4 has most
of its filling stations within 4000-9000 meters from central market, ward 5 has most of its filling
stations within 500-3900 meters from central market, ward 6 has most of its filling stations
within 4000-9000 meters from central market, ward 7 has all of its filling stations with 500-3900
meters from central market, ward 8 has most of its filling stations within 4000-9000 meters from
central market, ward 9 has most of its filling stations within 4000-9000 meters from central
market, and ward 10 has all its filling station within 4000-9000 meters from central market. In
all we have most of the filling stations fall within the distance of 4000-9000 meters distance to
central market.
4.7.2 DISTANCE OF FILLING STATIONS TO CENTRAL BUSINESS DISTRICT
(OWODE)
From table 4.15 in appendix iii, it can be observed that out of the total 42 filling stations in the
study area, only 3 filling stations (7.1%) fall within the distance of below 500 meters from CBD
40
(of which the 3 filling stations are in ward 9). It is also revealed that 10 filling stations (23.8%)
fall within 500-3900 meters from CBD (of which ward 4, 5, 7 and 9 has 2 filling station (4.8%)
each, ward 6 and 8 has 1 filling station (2.4%) each). Also, 27 filling stations (64.3%) fall within
4000-9000 meters distance from CBD (of which ward 4 has 7 filling stations (16.7%), ward 5
and 10 has 1 filling station (2.4%) each, ward 6 has 11 filling stations (26.2%), ward 8 has 5
filling stations (11.9%), and ward 9 has 2 filling stations (4.8%).
It also revealed that 2 filling stations (4.8%) fall within 10000 meters and above distance from
CBD (of which ward 3 has all the filling stations). It can be concluded that all filling stations in
ward 3 falls within 10000 meters and above from CBD, ward 4 has most of its filling stations fall
within 4000-9000 meters from CBD, ward 5 has most of its filling stations fall within 500-3900
meters from CBD, ward 6 has most of its filling stations fall within 4000-9000 meters from CBD,
ward 7 has most of its filling stations fall within 500-3900 meters from CBD, ward 8 has most of
its filling stations fall within 4000-9000 meters from CBD, ward 9 has most of its filing stations
fall within less than 500 meters from CBD, and ward 10 has its only filling station within 4000-
9000 meters from CBD. In all, most of the filling stations in Oyo West LGA fall within 4000-
9000 meters distance from CBD.
4.7.3 DISTANCE OF FILLING STATIONS TO THE NEAREST PLACE OF
RESIDENCE
From table 4.16 in appendix iii, it can be observed that 4 filling stations (9.5%) falls within less
down 5 meters distance from nearest place of residence (of which ward 4 and ward 7 has 1
filling station (2.4%) each, and ward 6 has 2 filling stations (4.8%). Also 21 filling stations
(50.0%) fall within 5-10 meters distance from nearest place of residence (of which ward 3, 7 and
10 have 1 filling station (2.4%) each, ward 4 has 5 filling stations (11.9%), ward 5 has 2 filling
stations (4.8%), ward 6 and 9 has 4 filling stations (9.5%) each, and ward 8 has 3 filling stations
(7.1%). Table 4.5 also reveals that 12 filling stations (28.6%) falls within 11-15 meters distance
from the nearest place of residence ( of which ward 3, 5,and 9 has 1 filling station (2.4%) each,
ward 4 has 2 filing stations (4.8%), ward 6 has 4 filling stations (9.5%), and ward 8 has 3 filling
stations (7.1%).
Also 5 filling stations (11.9%) fall within 16 meters and above distance from nearest place of
residence ( of which ward 4 has 1 filling station (2.4%), ward 6 and 9 have 2 filling stations
41
(4.8%) each. In conclusion, ward 3 has all its filling stations within 10 meters distance from
nearest place of residence, ward 4 has most of its filling stations within 5-10 meters distance
from nearest place of residence, ward 5 has most of its filling station within 5-10 meters from
nearest place of residence, ward 6 has most of its filling station within 5-15 meters distance from
nearest place of residence, ward 7 has all of its filling stations within 10 meters from the nearest
place of residence, ward 8 has all of its filling station within 5-15 meters from the nearest place
of residence, ward 9 has most of its filling station within 5-10 meters from nearest place of
residence, and ward 10 has its only filling station within 5-10 meters from nearest places of
residence. In all we could see that most filling station in Oyo West LGA fall within 5-10 meters
distance from nearest place of residence.
According to DPR manual (2007), before operating filling station one has to certify some
physical planning standards, one of the standard is that “A petrol station should be sited 50
meters away in all angles of the built-up areas to create a buffer zone for the residential house;
the buffer zone can be devoted to any non-residential land use”. From the DPR guideline stated,
we can conclude that all filling stations in Oyo West LGA do not conform to it, and as a result
the filling stations pose a danger of fire outbreak for the residence in the LGA, and as such a
review should be made by the necessary government bodies to curtail the uncoordinated location
of filling stations.
4.8 SOCIO-ECONOMIC CHARACTERISTICS OF HOUSEHOLD RESPONDENTS
This section discusses the socio-economic characteristics of household respondents such as sex,
marital status, ethic group, age, education, monthly income, religion, and nationality.
From table 4.17 in appendix iii, it can be observed that out of the 398 persons interviewed in the
LGA, there are 197 male respondents (49.5%) in Oyo West LGA, and 201 female respondents
(50.5%) in the LGA. We can then conclude that we have more of female residents in Oyo West
LGA. Also, from table 4.18, it can be seen that out of the total 398 persons interviewed, 100
respondents (25.1%) are single, 227 respondents (57%) are married, 25 respondents (6.3%) are
divorced/separated, and 46 respondents (11.6%) are widow/ widower. It can thus be concluded
that the population of Oyo West LGA is dominated by married individuals, followed by
individuals that are single. Divorced/ separated and widow/ widower constitute only a small
42
percentage of residents of Oyo West LGA. According to the result from table 4.19 in appendix iii,
it can be observed that out of the 398 respondents, 333 respondents (83.7%) are Yoruba, 29
respondents (7.3%) are Igbo, 24 respondents (6%) are of Hausa ethnic group, and the remaining
12 respondents are of other ethnic groups. It can be concluded that the LGA is largely dominated
by the Yoruba ethnic group, and this can be traced back to the historical nature of the region
(Oyo town) being the seat of Yoruba empire. Other ethnic groups constitute a very low
percentage of the residents of the LGA.
From table 4.20 in appendix 3, it can be observed that only 1 respondent (0.3%) fall within the
age range of below 18 years, 220 respondents (55.3%) fall within the age range of 18-36 years, a
total number of 153 respondents (38.4%) fall within the age range of 37-56 years, and it can also
be seen that a total of 24 respondents (6.0%) fall within 56 years and above. Ward 1 has all of its
respondents within age 18-36, ward 2 has most of its residents within age range of 37-56 years,
ward 3 has most of its residents between the age of 37-56 and 56 years above, ward 4 has its
respondents within age range of below 18 and 18-36, ward 5 has most of its residence within age
range of 37-56 years, ward 6 has most of its filling station within age range of 18-36 years, ward
7 has most of its residents within age range of 18-36 years, ward 8 has most of its filling station
within the age range of 18-36 years, ward 9 has most of its filling station within the age range of
18-36 years, and ward 10 has most of its filling station within age range of 18-36 years. From the
foregoing, it can be concluded that most of the residents in Oyo West LGA fall within the age
range of 18-36 years.
Table 4.21 in appendix iii reveals that of all the 398 respondents, a total of 48 respondents
(12.1%) responded that they don’t have any formal education, 47 respondents (11.8%) said they
only attended primary schools, also a total of 144 respondents (36.2%) stated that they are
secondary school leavers, and the remaining 159 respondents (39.9%) said they attended tertiary
institutions which includes Colleges of education, Polytechnics, and Universities. From the
foregoing, it can then be concluded majority of the residents of Oyo West LGA have attained
higher educational qualification, as most of them are graduate of tertiary institutions and
secondary school leavers. The percentage of persons with no formal education and primary
education is very low.
43
Table 4.22 in appendix iii shows that out of the total 398 respondents, 30 respondents earns
monthly income of less than 10000 naira Also a total of 249 respondents (62.6%) earn
monthly income within 10000-39000 naira. It is also revealed that a total of 84 respondents
earn monthly income of between 40000-69000 naira. Also, a total number of 24 respondents
(6.0%) earn a monthly income of between 70000-99000 naira. Finally a total of 10
respondents (2.5%) earn monthly income of 100000 naira and above. It can also be observed
that all respondents from ward 1 earn between 10000-39000 naira as monthly income, also
most of the respondents in ward 2 earn between 10000-39000 naira monthly, likewise a
larger percentage of respondents in ward 3 earn between 10000-39000 naira monthly.
Also, ward 4 has 1 of its respondent earns between 10000-39000 naira and the other
respondent earns between 70000-99000 naira. It can also be observed that most of the
respondents in ward 5 earn between 10000-39000 naira monthly. Also, most respondents in
ward 6 earns between 10000-39000 naira monthly. Likewise in ward 7, a larger percentage of
respondents earns between 10000-39000 naira monthly. The trend continues in which most
of the respondents in ward 8, 9, and 10 earn between 10000-39000 naira monthly. It can then
be concluded that majority of residents in Oyo west LGA earns between 10000-39000 naira
monthly as income.
Table 4.23 in appendix iii shows that out of the total 398 respondents, 161 respondents
(40.5%) stated that they practice Christianity as their religion (making them the second
largest religious group in the study area, 222 respondents (55.8%) declared that they are
Muslims i.e. they practice Islam (making them the largest religious group in the study area)
and the remaining 15 respondents (3.8%) stated that they are traditional worshipers (making
them the religious group with the lowest congregation). These traditional religious groups
include Sango, Ifa, and Esu worshippers, etc). From the foregoing, it can be concluded that
Oyo West LGA is dominated by Muslims.

44
4.9 RESPONDENTS’ PURCHASING BEHAVIOUR
This section discuss households that does or does not use petroleum products, types of petroleum
products used, frequency of purchase, distance to the nearest filling station, and reasons for
patronizing filling station of choice.
Figure 4.24 below shows that out of the total 398 respondents, only 3 respondents (0.8%) stated
that they don’t use any petroleum products, while the remaining 395 respondents (99.2%) stated
emphatically that they use petroleum products, this petroleum products include petrol(PMS),
GAS, Kerosene, and Lubricants. From the foregoing, it can be concluded that almost all residents
of Oyo West LGA depends on petroleum products for their domestic and economic activities. As
a result we could then emphasize that in this century, the use of petroleum products still plays a
very important role in the daily activities of individual households.
Table 4.25 in appendix iii shows that of the total 398 respondents, 3 respondents (0.8%) stated
that they never purchase petroleum products in their household, 54 respondents (13.6%) stated
that they use to purchase petroleum products daily in their households. Also, 68 respondents
(17.1%) stated that they always buy petroleum products in their households on weekly basis.
Also, a total of 22 respondents (5.5%) said that they used to buy petroleum products in their
households on monthly basis. The remaining 251 respondents (63.1%) stated that they buy
petroleum products in their households as occasion demands i.e. they buy petroleum products as
at when there is a need for it.
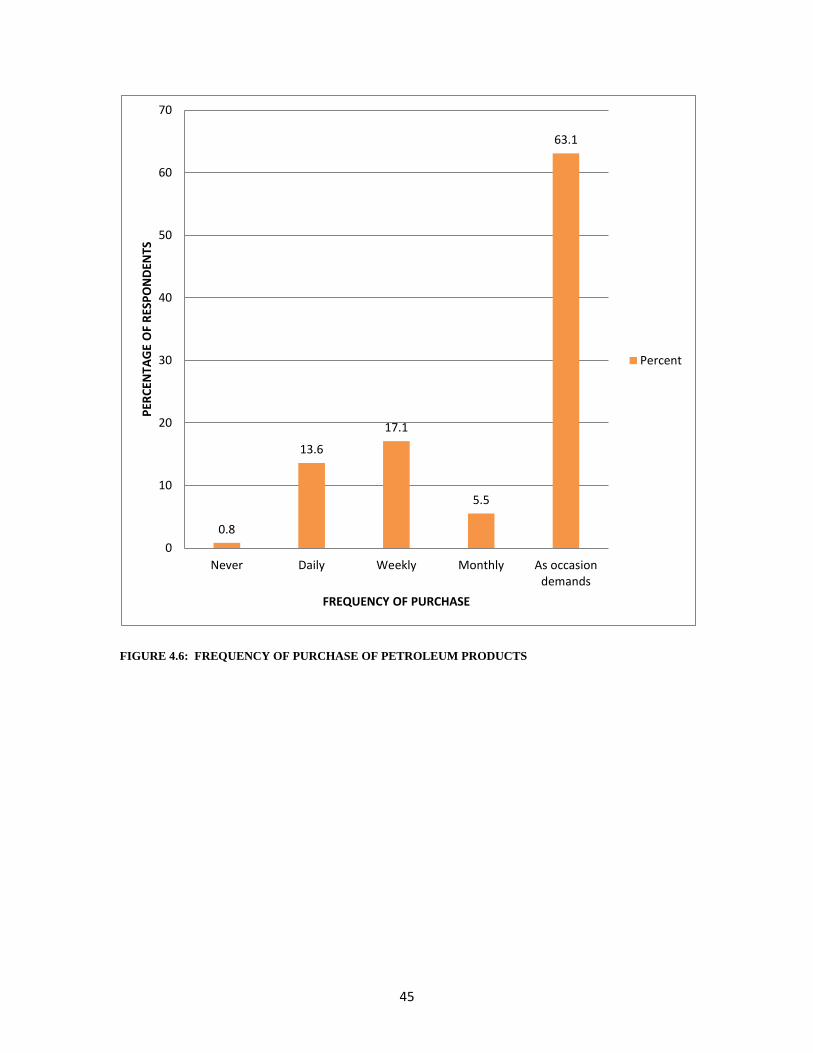
45
FIGURE 4.6: FREQUENCY OF PURCHASE OF PETROLEUM PRODUCTS
0.8
13.6
17.1
5.5
63.1
0
10
20
30
40
50
60
70
Never Daily Weekly Monthly As occasiondemands
PER
CEN
TAG
E O
F R
ESP
ON
DEN
TS
FREQUENCY OF PURCHASE
Percent
46
From table 4.26 in appendix iii, it can be observed that out of the total 398 respondents, 122
respondents (30.7%) stated that there households are located within less than 10 minutes walk
from the nearest filing station. Also, a total number of 167 respondents (42.0%) have their
households located within 10-19 minutes walk from the nearest filling station. Also, it can be
seen that 102 respondents (25.6%) have their households located within 20-29 minutes walk
from the nearest filling station. And the remaining 7 respondents said they have their households
located within 30 minutes walk and above from the nearest filling station. It can be seen from the
table that most households are located within 10-19minutes walk from nearest filling station.
Table 4.27 in appendix shows that 158 respondents (40.1%) chose proximity to residence as their
reason for patronizing the filling station of choice, also 99 respondents (25.1%) chose good
gauge as their reason for patronizing filling station of choice. A total of 57 respondents (14.5%)
chose good quality product as their reason for patronizing the filling station of their choice. Also,
a total of 24 respondents chose good price as their reason for patronizing the filling station of
their choice. 56 respondents (14.2%) in all gave good customer service as their reason for
patronizing the filling station of their choice. In all, it can be seen that a larger percentage of
respondents gave proximity to residence as their reason for patronizing the filling station of their
choice.
4.10 PERCEPTION OF RESPONDENTS ON THE LOCATION OF FILLING
STATIONS
This section discusses perception of residence of Oyo West LGA on the location of filling
stations in their neighbourhoods, benefits and consequences associated with the location of
filling station in their neighbourhoods.
Table 4.28 in appendix reveals that out of the total 398 respondents, 17 respondents (4.3%) said
the location of filling stations is not easily accessible. 162 respondents (40.7%) perceived the
location of filling stations in their neighbourhood as being too close to residential building. Also,
219 respondents perceived the location of filling stations in their neighbourhood as a good
location i.e. it is well located in terms of accessibility. It can be observed that in ward 1 all
respondents perceived the location of filling stations to be good. In ward 2 most of the
47
respondents also perceived the location of filling stations to be good, likewise in ward 3, 4, 5, 6,
7 and 10. But a larger percentage of respondents in ward 8 and 9 perceived the location of filling
stations in their neighbourhood as being too close to residential building. From the foregoing, it
can be observed that a larger percentage of residents in Oyo West LGA perceives the location of
filling stations in the neighbourhood as a good location, this shows that majority of residents are
not well informed as regards the danger of locating filling stations close to residential areas.
Figure 4.29 in appendix iii shows that out of the total 398 respondents, 18 respondents (4.5%)
said they fetch water from tap water in filling stations, 99 respondents (24.9%) said that the
filling stations in their neighbourhoods serve as a place for charging their electrical devices when
there is no light, 227 respondents (57%) said that the location of filling stations in their
neighbourhoods gives them easy access to petroleum products as at when needed, 10 respondents
(2.5%) said that filling stations in their neighbourhood renders religious benefits (such as
availability of Mosque to observe their daily prayers), 32 respondents (8%) said that filling
stations provide employment opportunities to members of the community (some emphasized that
their family members work as managers, and some as attendants in the filling stations), the
remaining 12 respondents (3%) said that they enjoy free gifts during festivity period from filling
stations in their neighbourhood. It can be observed that majority of the residents in Oyo West
LGA see easy access to petroleum products as the main benefit derived.
Table 4.30 in appendix iii reveals that out of the total 398 respondents, only 210 of them
responded as regards consequences of location of filling stations in the neighbourhood. 114
respondents (54.3%) said noise pollution is the problem they encounter as a result of the location
of filling stations in their neighbourhoods, 67 respondents (31.9%) said air pollution is the
problem they encounter as a result of location of filling stations in their neighbourhoods, 11
respondents (5.2%) said oil spillage/land pollution is the consequence they face as a result of
location of filling stations in their neighbourhoods, 14 respondents said they encounter busy
traffic/ traffic congestion as a result of the location of filling stations in their neighbourhoods, 4
respondents (1.9%) said fire outbreak is the consequence associated with the location of filling
stations in their neighbourhood. The remaining 188 respondents did not account for the
consequences associated with location of filling stations in their neighbourhoods. From the

48
foregoing, it can be observed that noise pollution accounts for the largest share of consequences
associated with location of filling station in neighbourhoods.
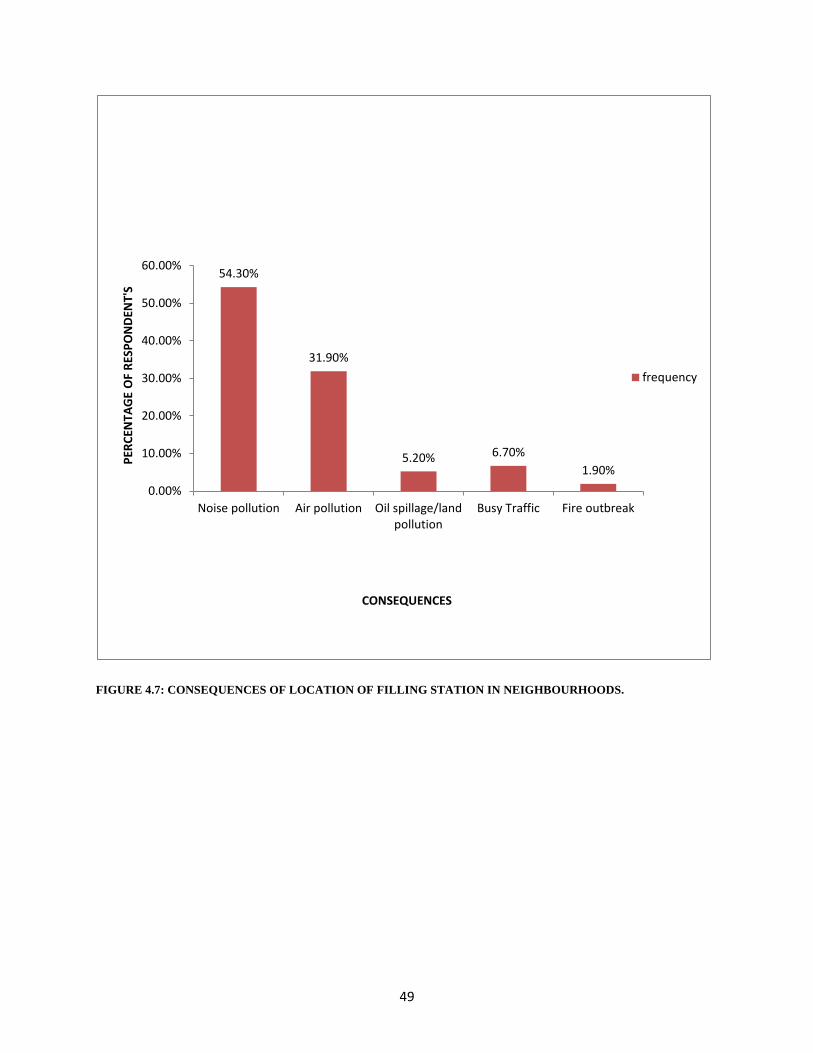
49
FIGURE 4.7: CONSEQUENCES OF LOCATION OF FILLING STATION IN NEIGHBOURHOODS.
54.30%
31.90%
5.20% 6.70%
1.90%
0.00%
10.00%
20.00%
30.00%
40.00%
50.00%
60.00%
Noise pollution Air pollution Oil spillage/landpollution
Busy Traffic Fire outbreak
PER
CEN
TAG
E O
F R
ESP
ON
DEN
T'S
CONSEQUENCES
frequency
50
CHAPTER FIVE
SUMMARY OF RESEARCH FINDINGS, CONCLUSION AND
RECOMMENDATIONS
5.1 INTRODUCTION
This chapter focuses on the summary of findings and result from the analysis of filling stations in
the study area. Also in this chapter, recommendation will be provided, and conclusions will be
made.
5.2 SUMMARY OF RESEARCH FINDINGS
This study was designed to look into the locational pattern of filling stations in Oyo West LGA.
The result revealed that the locational pattern of filling stations exhibit a cluster. This means that
means that every area in the neighbourhoods of the study area does not have equal chance of
being selected for the erection of filling stations. The ownership of filling stations in the LGA is
between private individuals and public corporations, in which private individuals dominate the
scene with ownership of 40 filling stations while public corporation own only 2 filling stations.
Also there are filling stations in only 8 wards of the study area out of the total of 10 wards, ward
1 and ward 2 has no filling station. Also, the vast number of filling stations is concentrated in
ward 6, 4, 9 and 8, while other wards have pockets of filling stations.
The study also revealed that most of the filling stations (66.7%) in the LGA sell petrol, kerosene,
and diesel. Only few (7.1%) sell all petroleum products including lubricants, while others sell
either petrol or petrol and kerosene. Also, most of the filling stations (28 filling stations (66.7%)
falls within the distance of 4000-9000 meters from central market. The result further revealed
that most of the filling stations (27 filling stations (64.3%) fall within 4000-9000 meters distance
from CBD (Owode). The result also revealed that most filling stations in the study area (21
filling stations (50.0%) fall within 5-10 meters distance from nearest place of residence. This
indicates that most filling stations in the study area do not meet the minimum requirement of
buffer zone for residential zone as stipulated by DPR, 2007.
Factors that influence the location of filling stations in Oyo West local government includes
cheap land value, proximity to market, and profitable location. Most of the filling stations
51
(54.8%) locate as a result of profitable location; this is peculiar to all filling stations in most part
of the LGA. The temporal distribution of filling stations in the LGA also reveals that the number
of filling stations in the LGA is growing tremendously over time with an increasing trend of
growth of filling stations witnessed in the year 2010 till date.
The result of the socio-economic characteristics of residents of Oyo West LGA reveals that in
terms of sex, most of the respondents were female with 50.5%. Most of the respondents are
married with 57%. Majority of residents of the LGA are Yoruba with 83.7%. The respondents
were people aged between 18-36 and 37-56 with 55.3% and 38.4% value respectively. A larger
percentage of respondents are have finished from secondary school and tertiary institution with
36.2% and 39.9% value respectively. A larger percentage of respondents in the LGA earn
between 10,000-39000 naira with 62.6%. Most of the respondents are Muslims with 55.8%,
followed by Christians with 40.5%, while the last 3.8 percent are traditional worshippers.
The result further shows that majority of the respondents purchase petroleum products as
occasion demands with 63.1%. Also, majority of respondents declared that there houses are
located very close to filling stations. Also, the result shows that majority of respondents
patronize filling station of choice because of proximity to residence and good gauge with 40.1%
and 25.1% respectively.
The result further shows that majority of respondents (55%) perceives the location of filling
station in the LGA as a good location, 40.7% of respondents feels the location of the filling
stations in the LGA are too close to residential area, while others feel the location of the filling
stations are not very accessible. This shows that majority of the residents are not educated on the
dangers of filling stations being located too close to residential areas. Also, majority of
respondents said ‘easy access to petroleum products’ and ‘charging when there is no light’ are
the benefits derived from the location of filling stations in their neighbourhood with 57% and
24.9% respectively. Others said location of filling stations benefitted them in terms of
employment, free gift, and religious benefits (mosques). The result also shows that majority of
respondents perceive the consequence of location of filling station in their neighbourhood to be
noise pollution and air pollution, with 54.3% and 31.9% value. Other consequences given
include Oil spillage/ land pollution, busy traffic and fire outbreak.
52
5.3 CONCLUSION
The study revealed that the locational pattern of filling station in Oyo West Local Government
Area exhibits a cluster. The implication of this result may be easily translated to mean that every
land in each neighbourhood that makes up the LGA does not have equal chance of being chosen
as a location to erect a filling station. The spatial implication is that residents in the LGA do not
have equal accessibility to filling station services. The situation is such that there is functional
duplicity in which one particular neighbourhood has more filling stations than it needs due to
some advantage inherent in the location.
53
5.4 RECCOMENDATIONS
Overtime, filling stations have been a very important service industry as it provides larger
percentage of energy sources consumed in day to day activities of human being. Such activities
in which energy is exerted for includes transiting goods and persons, manufacturing, cooking,
preparing fields for farming, lightning, etc. As such, construction of filling stations in our
neighbourhoods is inevitable. Therefore, in light of my findings, the following recommendations
are being proposed.
1. Looking at the result on the perception of residents on location of filling stations in their
neighbourhoods, the majority of residents perceived the location of filling stations as being
a good location. This shows that the majority of residents of Oyo west LGA are not well
informed of the dangers of having filling stations locate very close to their houses, as such
there is the need to sensitize the residents of the LGA on the dangers of such actions. As
this will prevent or reduce further sale of land by residents to filling stations developers.
Ministry of Environment in collaboration with all the petrol stations should constantly
mount public enlightenment campaign using posters, bill boards and media houses to
educate the public on the hazards associated with petroleum products with respect to
human health and the environment so as to discourage residents close to petrol stations.
2. Also, the result revealed that almost all the filling stations does not provide buffer zone of
50 meters for residential buildings as stipulated by DPR (2007) in its guidelines for
construction of filling station and other government agencies. As such, the government
and its agencies should stiffen its policy execution as regards indiscriminate construction
of filling stations in Oyo West LGA and its environs.
3. Government and its agencies should come up with a policy that helps allocate lands for
location of filling station in such a way that residents of the LGA have equal accessibility
to filling station services, rather than a cluster of this service industry in some particular
neighbourhoods such that have more than abundance of filling stations.
54
REFERENCES
Abdullahi K. (2012).Spatial distribution of filling stations in agege local government lagos
state. Unpublished research essay submitted to the Department of Geography,
Bayero University, Kano.
Abdullahi K. (2012) Spatial Distribution of Filling Stations in Agege Local Government Lagos
State. Unpublished Research Essay Submitted to the Department of Geography, Bayero
University Kano (BUK).
Adewumi, Solomon, (2013, April 13) “OYO: Petro stations compete for space with
houses”. Liberty Reports.Akure.Retrieved from http://myondostate.com/w3/oyo-
petrolstations-compete-for-space-with-houses-by-solomon-adewumi.
Anayo Okoli (Nigeria News), February 11, 2014, Fire Razes Filling Station InAbia;
http://www.codewit.com/nigeria-news/4111nigeria-fire-razes-filling-station-in-abia
Anon.(2003).Oxford Dictionary of English.SecondEdition.OxfordUniversityPress.2088 pp.
Anon.(2004).The American Heritage Dictionary of the English Language. Fourth Edition.
Houghton Mifflin Company.
Ayodele S. J (2011). Spatial distribution of petroleum filling station in Kaduna north.
Retrieved on 5th March, 2013 from www.srib.com/samuel_ayodele1 .
Birkin, M., Clarke, G., and Clarke, M.(2002).Retail Geography and Intelligent Network
Planning. Chischester, UK: John Willey and Sons.
Birkin, M.C., Clarke, G.M. & Wilson, A. (1996).Intelligent GIS, location decisions and
strategic planning. New York : John Wiley and Sons.
Blaikie, P., Cannon, T., Davis, I. and Wisner, B. (1994). Risk, Natural Hazards, People’s
Vulnerability and Disaster. London: Routledge. Pp. 66 – 67.
Blamah N.V., Vivan E.L., Tagwi M.U. and Ezemokwe I.U. (2012). Locational impact
assessment of gasoline service stations along Abuja-Keffi road and environs in
Karu, Abuja, Nigeria. Journal of environmental management and safety, Vol. 3, No.
5, (2012) 106-123, available at www.cepajournal.com .
55
Burrough, P.A. and McDonnell, R. (1998). Principles of geographical information systems,
Oxford: Oxford University Press.
Burton, I., Kates, R. W. and White G. F. (1978). Environment as Hazard. New York: Oxford
University Press. Pp. 1 – 3.
Clark, Philip; Evans, Francis (1954). "Distance to nearest neighbor as a measure of
spatial relationships in populations". Ecology (Ecological Society of America) 35 (4):
445453.
Cointreau, S. J. (1982). “Environmental Management of Urban Solid Wastes in Development: A
Project Guide”. Urban Development Department, World Bank.
http://www.worldbank.org/html/fpd/urban/solid-wm/trechpaper5.pdf
Construct and Operate Petroleum Products Retail Outlets. Issued by DPR, Ministry of Petroleum
Department of Petroleum Resource, DPR (2007). Procedure guide for grant of and
approval to construct and operate petroleum products retail outlets. Issued by DPR,
Ministry of Petroleum Resources.
Department of Petroleum Resource, DPR (2007) Procedure Guide for Grant of and Approval to
Doublegist (2013). Marketing petroleum products in Nigeria: A case study of selected
independent marketing firm in Portharcourt. Doublegist.com Published June 2013
retrieved on 31/03/14 from www.doublegist.com.
Environmental Safety Requirements In Obio Akpor Lga, Nigeria. International Journal of
Scientific Research and Innovative Technology. 2015; 2(11):21-39.
Haggett, P. (1965). Locational analysis in human geography. Edward Arnold, London.
JonesM.A.,MothersbaughD.L.,andBeattyS.E.(2003).TheEffectsofLocational
ConvenienceonCustomerRepurchaseIntentionsAcrossServiceTypes.Journal of Service
Marketing.17(7):701–712.
Karen K. Kemp (Editor), 2008,Encyclopedia of geographic information science (SAGE
Publications, Inc., Page 21, 66, 192)
56
Mennecke,B.E.(1996).UnderstandingtheRoleofGeographicInformationTechnologiesin
Business:ApplicationsandResearchDirections.Journal of Geographic Information and
Decision Analysis.1(1):4468.
Mohammed M.U, Musa I.J. Jeb D.N. GIS-Based Analysis of the Location of Filling Stations in
Metropolitan Kano against the Physical Planning Standards. American Journal of
Engineering Research (AJER). 2014; 3(9):147-158.
Mshelia A.M, John A, Emmanuel D.D. (2015) Environmental Effects of Petrol Stations at Close
Proximities to Residential Buildings in Maiduguri and Jere, Borno State, Nigeria. IOSR
Journal Of Humanities And Social Science (IOSR-JHSS).20(4):1-8.
National Buruea of Statistics (2008). Nigeria annual abstract statistics. National Bureau of
Statistics, Nigeria.
National population Commission, NPC (2006). Report of Nigeria’s National Population
Commission on 2006 Census. National Bureau of Statistics, Nigeria.
Nigerian National Petroleum Company, NNPC (2006). NNPC Statistical Bulletin Abuja
retrieved fromhttp://www.nnpcgroup.com .
Oloko-Oba O. Mustapha, Ogunyemi S. Akintunde, A. T. Alaga, R. A. Badru, J. O. Ogbole,
Popoola O. Samuel and Samson A. Samuel. (2016). Spatial Distribution of Primary
Schools in Ilorin West Local Government Area, Kwara State, Nigeria. Journal of
Scientific Research & Reports. 9(6): 1-10,
Papadopoulou M. P. and Antoniou C (2014). Environmental impact assessment
methodological framework for liquefied natural gas terminal and transport network
planning. Elservier Energy Policy 68 (2014) 306–319. Retrieved on 31/03/14,
Available online at www.elsevier.com/locate/enpol.
Procedure and Conditions for Granting Approvals for the Construction and Operation of a
Station retrieved on 3/04/2013
www.dprnigeria.com/forms_procedures/petrolprodctstosales.rt. from.
Resources.
57
S. Ahmed et al; Health, Risk and Safety of Petrol Stations in Minna Town, an
Overview, World Applied Sciences Journal, 32(4), 2014, 655-660
Samuel B. A, Ogoro M, Amanoritsewo O. J. Petrol Filling Stations’ Location and Minimum
Samuel, J. A. (2011) Spatial Location of Filling stations in Kaduna. Kaduna: Scribid Inc.
Sebastine Obasi, Why Petrol Stations are sited in Illegal Places – DPR; Sourced from:
Vanguard News, 26thNovember2013, http://www.vanguardngr.com/2013/11/petrol-
stations-sited-illegal-places-dpr/
Tellier, Luc-Normand, 1972, "The Weber Problem: Solution and Interpretation", Geographical
Analysis, vol. 4.
The American heritage dictionary of English language(2000). Fourth Edition by Houghtoun
Mifflin Company.
Udoh N. (2013). Petroleum Marketing in Nigeria. BRANDIQ Pan-African Summit for Media
and Communication, Nirobi, Kenya.
Ujjwal S. and Sokhi B.S. (2006). GIS city hazard petrol station vicinity vulnerability
assesment. GIM International Vol. 20 Issue 8.
Weber (1929), Translated by Friedrick C., Theory of Location of Industries, University of
Chicago, P.139.
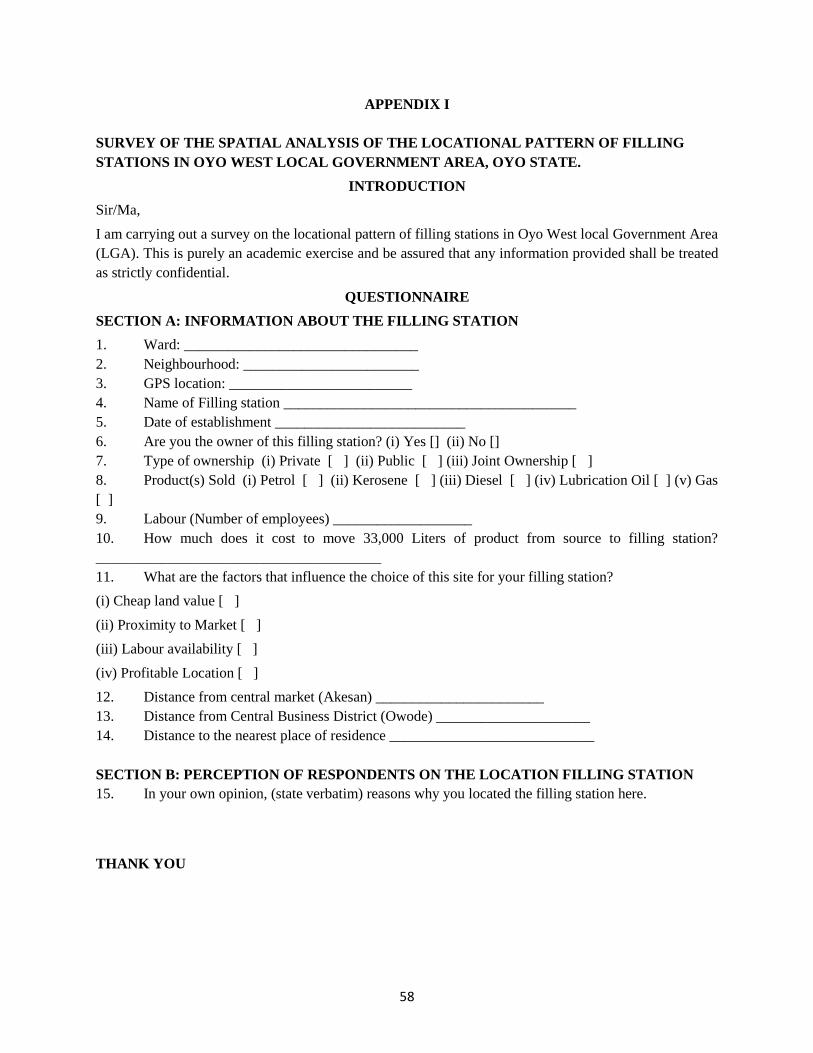
58
APPENDIX I
SURVEY OF THE SPATIAL ANALYSIS OF THE LOCATIONAL PATTERN OF FILLING
STATIONS IN OYO WEST LOCAL GOVERNMENT AREA, OYO STATE.
INTRODUCTION
Sir/Ma,
I am carrying out a survey on the locational pattern of filling stations in Oyo West local Government Area
(LGA). This is purely an academic exercise and be assured that any information provided shall be treated
as strictly confidential.
QUESTIONNAIRE
SECTION A: INFORMATION ABOUT THE FILLING STATION
1. Ward: ________________________________
2. Neighbourhood: ________________________
3. GPS location: _________________________
4. Name of Filling station ________________________________________
5. Date of establishment __________________________
6. Are you the owner of this filling station? (i) Yes [] (ii) No []
7. Type of ownership (i) Private [ ] (ii) Public [ ] (iii) Joint Ownership [ ]
8. Product(s) Sold (i) Petrol [ ] (ii) Kerosene [ ] (iii) Diesel [ ] (iv) Lubrication Oil [ ] (v) Gas
[ ]
9. Labour (Number of employees) ___________________
10. How much does it cost to move 33,000 Liters of product from source to filling station?
_______________________________________
11. What are the factors that influence the choice of this site for your filling station?
(i) Cheap land value [ ]
(ii) Proximity to Market [ ]
(iii) Labour availability [ ]
(iv) Profitable Location [ ]
12. Distance from central market (Akesan) _______________________
13. Distance from Central Business District (Owode) _____________________
14. Distance to the nearest place of residence ____________________________
SECTION B: PERCEPTION OF RESPONDENTS ON THE LOCATION FILLING STATION
15. In your own opinion, (state verbatim) reasons why you located the filling station here.
THANK YOU
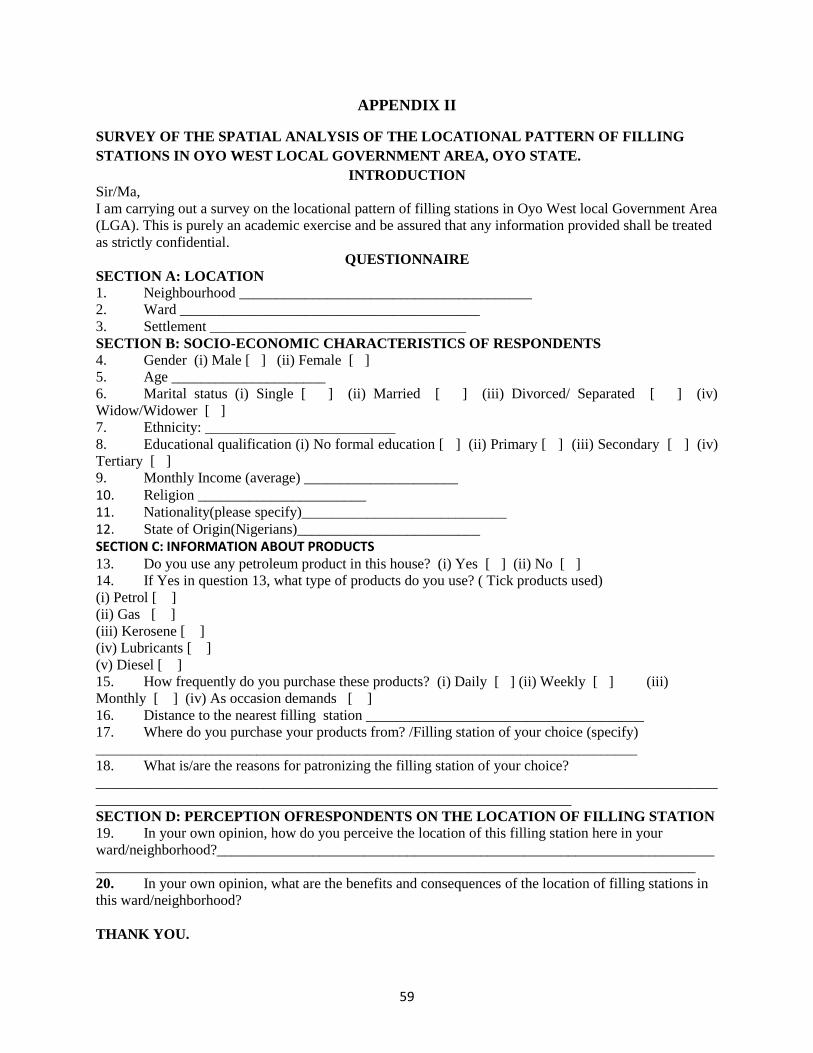
59
APPENDIX II
SURVEY OF THE SPATIAL ANALYSIS OF THE LOCATIONAL PATTERN OF FILLING
STATIONS IN OYO WEST LOCAL GOVERNMENT AREA, OYO STATE.
INTRODUCTION
Sir/Ma,
I am carrying out a survey on the locational pattern of filling stations in Oyo West local Government Area
(LGA). This is purely an academic exercise and be assured that any information provided shall be treated
as strictly confidential.
QUESTIONNAIRE
SECTION A: LOCATION
1. Neighbourhood ________________________________________
2. Ward _________________________________________
3. Settlement ___________________________________
SECTION B: SOCIO-ECONOMIC CHARACTERISTICS OF RESPONDENTS
4. Gender (i) Male [ ] (ii) Female [ ]
5. Age _____________________
6. Marital status (i) Single [ ] (ii) Married [ ] (iii) Divorced/ Separated [ ] (iv)
Widow/Widower [ ]
7. Ethnicity: __________________________
8. Educational qualification (i) No formal education [ ] (ii) Primary [ ] (iii) Secondary [ ] (iv)
Tertiary [ ]
9. Monthly Income (average) _____________________
10. Religion _______________________ 11. Nationality(please specify)____________________________ 12. State of Origin(Nigerians)_________________________ SECTION C: INFORMATION ABOUT PRODUCTS 13. Do you use any petroleum product in this house? (i) Yes [ ] (ii) No [ ]
14. If Yes in question 13, what type of products do you use? ( Tick products used)
(i) Petrol [ ]
(ii) Gas [ ]
(iii) Kerosene [ ]
(iv) Lubricants [ ]
(v) Diesel [ ]
15. How frequently do you purchase these products? (i) Daily [ ] (ii) Weekly [ ] (iii)
Monthly [ ] (iv) As occasion demands [ ]
16. Distance to the nearest filling station ______________________________________
17. Where do you purchase your products from? /Filling station of your choice (specify)
__________________________________________________________________________
18. What is/are the reasons for patronizing the filling station of your choice?
_____________________________________________________________________________________
_________________________________________________________________
SECTION D: PERCEPTION OFRESPONDENTS ON THE LOCATION OF FILLING STATION
19. In your own opinion, how do you perceive the location of this filling station here in your
ward/neighborhood?____________________________________________________________________
__________________________________________________________________________________
20. In your own opinion, what are the benefits and consequences of the location of filling stations in
this ward/neighborhood?
THANK YOU.
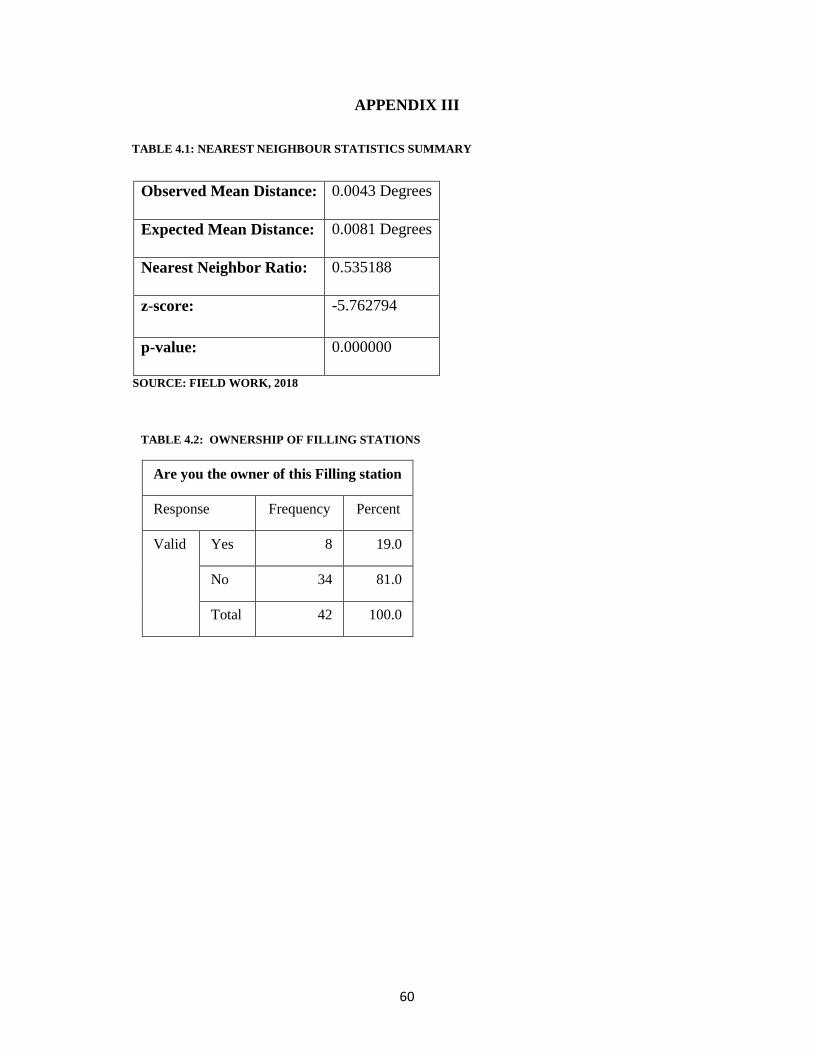
60
APPENDIX III
TABLE 4.1: NEAREST NEIGHBOUR STATISTICS SUMMARY
Observed Mean Distance: 0.0043 Degrees
Expected Mean Distance: 0.0081 Degrees
Nearest Neighbor Ratio: 0.535188
z-score: -5.762794
p-value: 0.000000
SOURCE: FIELD WORK, 2018
TABLE 4.2: OWNERSHIP OF FILLING STATIONS
Are you the owner of this Filling station
Response Frequency Percent
Valid Yes 8 19.0
No 34 81.0
Total 42 100.0
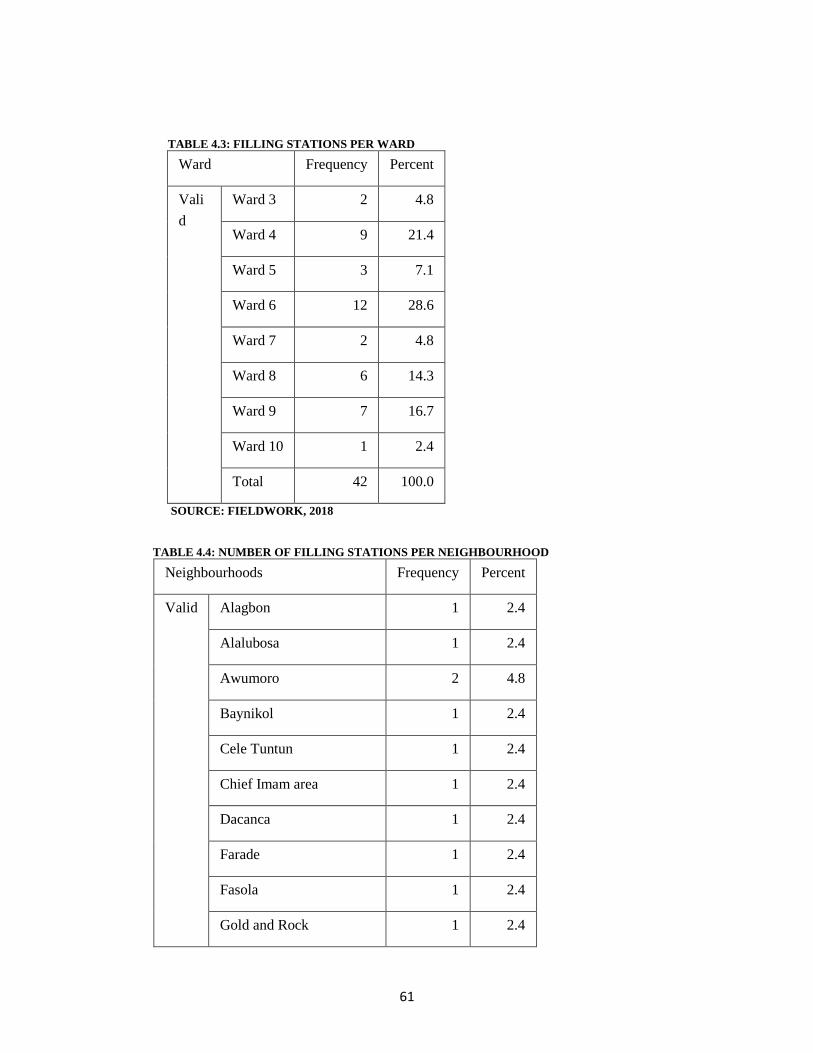
61
TABLE 4.3: FILLING STATIONS PER WARD
Ward Frequency Percent
Vali
d
Ward 3 2 4.8
Ward 4 9 21.4
Ward 5 3 7.1
Ward 6 12 28.6
Ward 7 2 4.8
Ward 8 6 14.3
Ward 9 7 16.7
Ward 10 1 2.4
Total 42 100.0
SOURCE: FIELDWORK, 2018
TABLE 4.4: NUMBER OF FILLING STATIONS PER NEIGHBOURHOOD
Neighbourhoods Frequency Percent
Valid Alagbon 1 2.4
Alalubosa 1 2.4
Awumoro 2 4.8
Baynikol 1 2.4
Cele Tuntun 1 2.4
Chief Imam area 1 2.4
Dacanca 1 2.4
Farade 1 2.4
Fasola 1 2.4
Gold and Rock 1 2.4
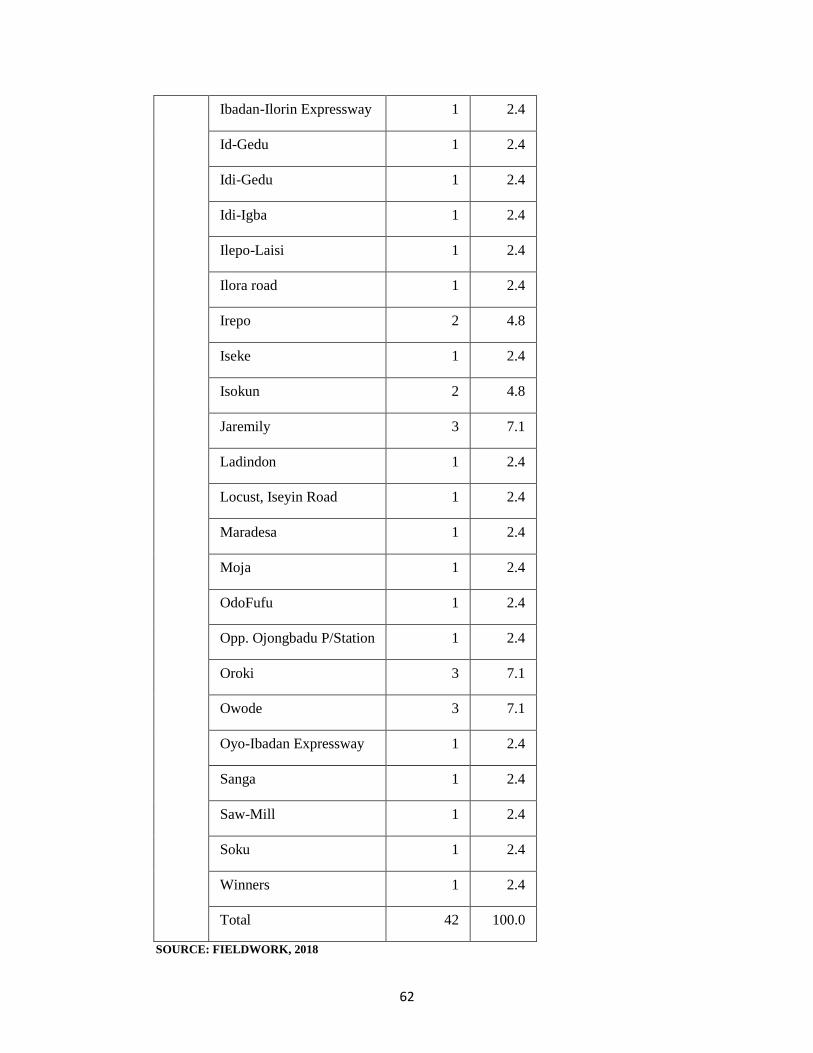
62
Ibadan-Ilorin Expressway 1 2.4
Id-Gedu 1 2.4
Idi-Gedu 1 2.4
Idi-Igba 1 2.4
Ilepo-Laisi 1 2.4
Ilora road 1 2.4
Irepo 2 4.8
Iseke 1 2.4
Isokun 2 4.8
Jaremily 3 7.1
Ladindon 1 2.4
Locust, Iseyin Road 1 2.4
Maradesa 1 2.4
Moja 1 2.4
OdoFufu 1 2.4
Opp. Ojongbadu P/Station 1 2.4
Oroki 3 7.1
Owode 3 7.1
Oyo-Ibadan Expressway 1 2.4
Sanga 1 2.4
Saw-Mill 1 2.4
Soku 1 2.4
Winners 1 2.4
Total 42 100.0
SOURCE: FIELDWORK, 2018
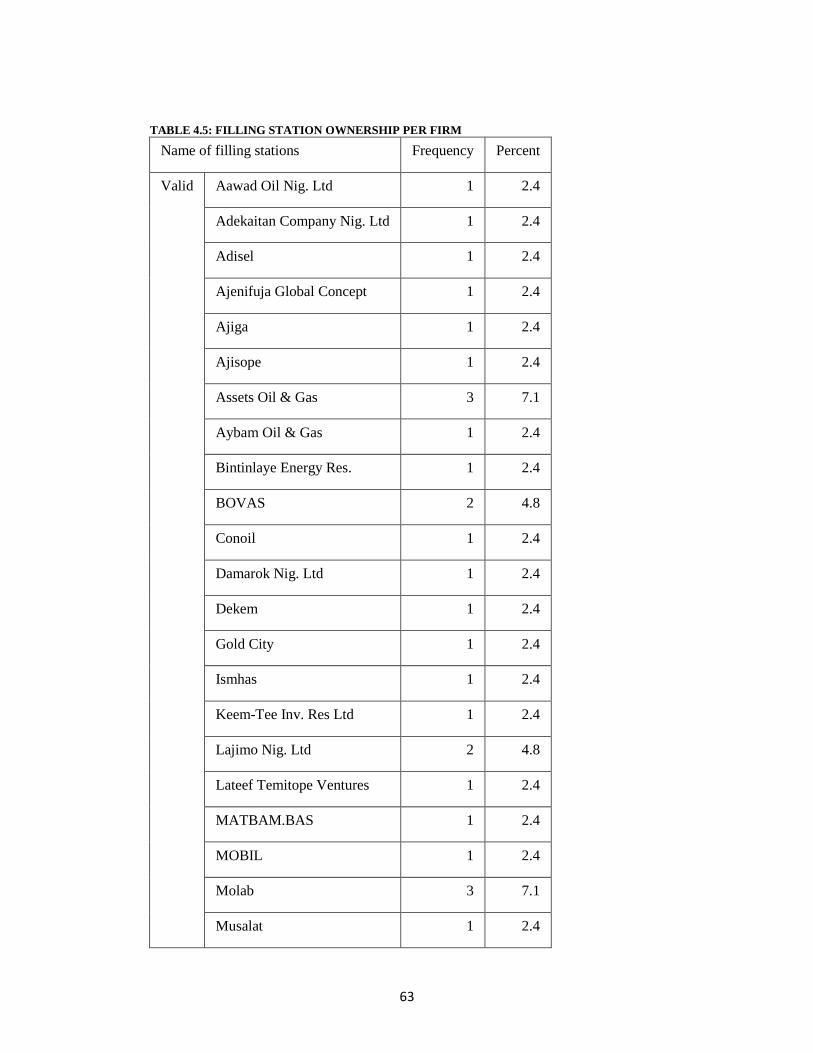
63
TABLE 4.5: FILLING STATION OWNERSHIP PER FIRM
Name of filling stations Frequency Percent
Valid Aawad Oil Nig. Ltd 1 2.4
Adekaitan Company Nig. Ltd 1 2.4
Adisel 1 2.4
Ajenifuja Global Concept 1 2.4
Ajiga 1 2.4
Ajisope 1 2.4
Assets Oil & Gas 3 7.1
Aybam Oil & Gas 1 2.4
Bintinlaye Energy Res. 1 2.4
BOVAS 2 4.8
Conoil 1 2.4
Damarok Nig. Ltd 1 2.4
Dekem 1 2.4
Gold City 1 2.4
Ismhas 1 2.4
Keem-Tee Inv. Res Ltd 1 2.4
Lajimo Nig. Ltd 2 4.8
Lateef Temitope Ventures 1 2.4
MATBAM.BAS 1 2.4
MOBIL 1 2.4
Molab 3 7.1
Musalat 1 2.4
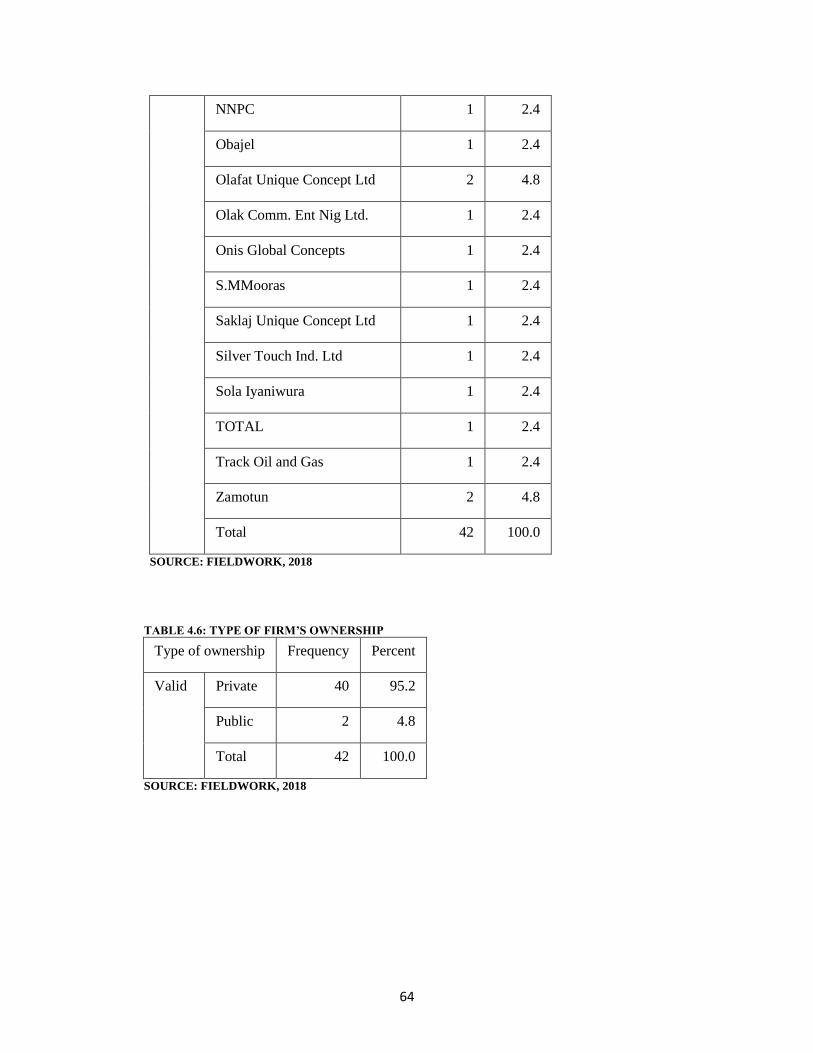
64
NNPC 1 2.4
Obajel 1 2.4
Olafat Unique Concept Ltd 2 4.8
Olak Comm. Ent Nig Ltd. 1 2.4
Onis Global Concepts 1 2.4
S.MMooras 1 2.4
Saklaj Unique Concept Ltd 1 2.4
Silver Touch Ind. Ltd 1 2.4
Sola Iyaniwura 1 2.4
TOTAL 1 2.4
Track Oil and Gas 1 2.4
Zamotun 2 4.8
Total 42 100.0
SOURCE: FIELDWORK, 2018
TABLE 4.6: TYPE OF FIRM’S OWNERSHIP
Type of ownership Frequency Percent
Valid Private 40 95.2
Public 2 4.8
Total 42 100.0
SOURCE: FIELDWORK, 2018
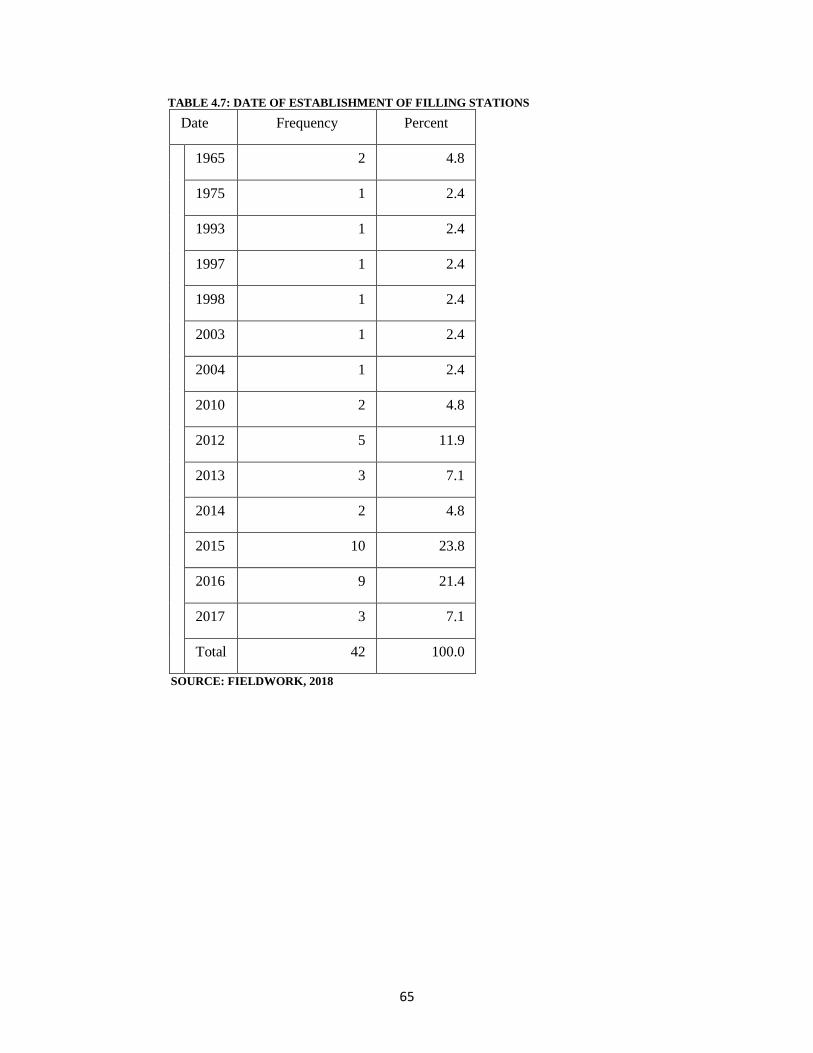
65
TABLE 4.7: DATE OF ESTABLISHMENT OF FILLING STATIONS
Date Frequency Percent
1965 2 4.8
1975 1 2.4
1993 1 2.4
1997 1 2.4
1998 1 2.4
2003 1 2.4
2004 1 2.4
2010 2 4.8
2012 5 11.9
2013 3 7.1
2014 2 4.8
2015 10 23.8
2016 9 21.4
2017 3 7.1
Total 42 100.0
SOURCE: FIELDWORK, 2018
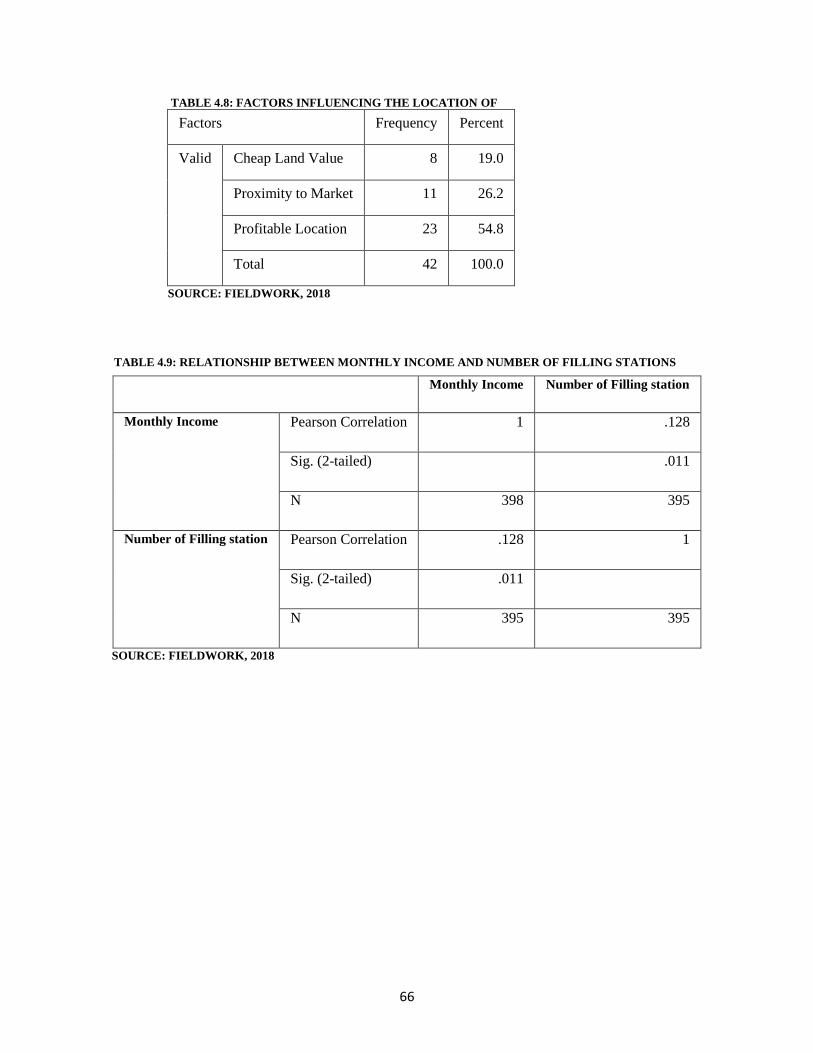
66
TABLE 4.8: FACTORS INFLUENCING THE LOCATION OF
Factors Frequency Percent
Valid Cheap Land Value 8 19.0
Proximity to Market 11 26.2
Profitable Location 23 54.8
Total 42 100.0
SOURCE: FIELDWORK, 2018
TABLE 4.9: RELATIONSHIP BETWEEN MONTHLY INCOME AND NUMBER OF FILLING STATIONS
Monthly Income Number of Filling station
Monthly Income Pearson Correlation 1 .128
Sig. (2-tailed) .011
N 398 395
Number of Filling station Pearson Correlation .128 1
Sig. (2-tailed) .011
N 395 395
SOURCE: FIELDWORK, 2018
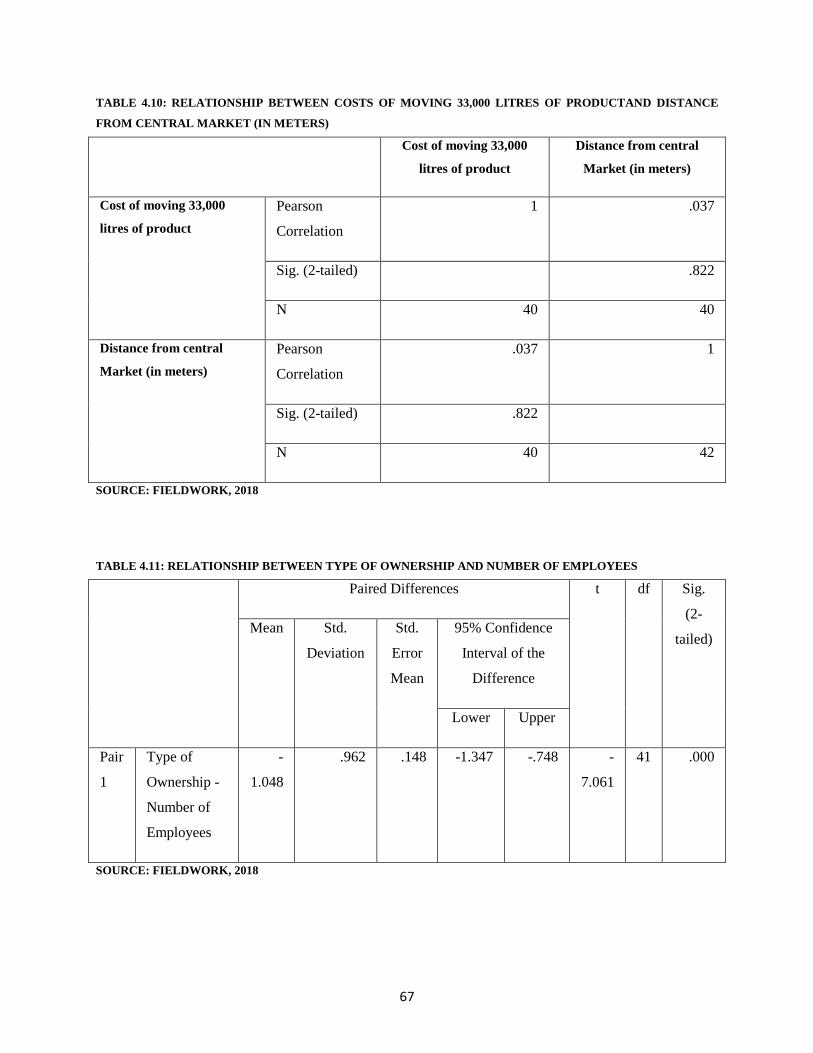
67
TABLE 4.10: RELATIONSHIP BETWEEN COSTS OF MOVING 33,000 LITRES OF PRODUCTAND DISTANCE
FROM CENTRAL MARKET (IN METERS)
Cost of moving 33,000
litres of product
Distance from central
Market (in meters)
Cost of moving 33,000
litres of product
Pearson
Correlation
1 .037
Sig. (2-tailed) .822
N 40 40
Distance from central
Market (in meters)
Pearson
Correlation
.037 1
Sig. (2-tailed) .822
N 40 42
SOURCE: FIELDWORK, 2018
TABLE 4.11: RELATIONSHIP BETWEEN TYPE OF OWNERSHIP AND NUMBER OF EMPLOYEES
Paired Differences t df Sig.
(2-
tailed) Mean Std.
Deviation
Std.
Error
Mean
95% Confidence
Interval of the
Difference
Lower Upper
Pair
1
Type of
Ownership -
Number of
Employees
-
1.048
.962 .148 -1.347 -.748 -
7.061
41 .000
SOURCE: FIELDWORK, 2018
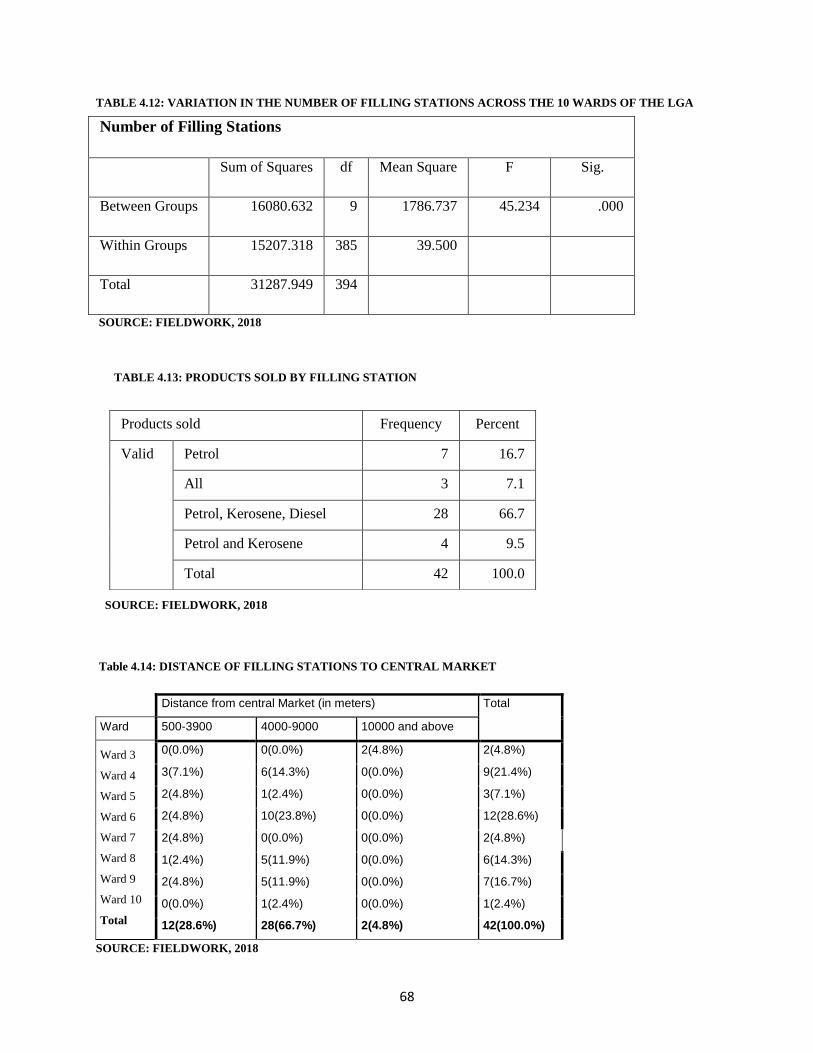
68
TABLE 4.12: VARIATION IN THE NUMBER OF FILLING STATIONS ACROSS THE 10 WARDS OF THE LGA
Number of Filling Stations
Sum of Squares df Mean Square F Sig.
Between Groups 16080.632 9 1786.737 45.234 .000
Within Groups 15207.318 385 39.500
Total 31287.949 394
SOURCE: FIELDWORK, 2018
TABLE 4.13: PRODUCTS SOLD BY FILLING STATION
SOURCE: FIELDWORK, 2018
Table 4.14: DISTANCE OF FILLING STATIONS TO CENTRAL MARKET
SOURCE: FIELDWORK, 2018
Products sold Frequency Percent
Valid Petrol 7 16.7
All 3 7.1
Petrol, Kerosene, Diesel 28 66.7
Petrol and Kerosene 4 9.5
Total 42 100.0
Distance from central Market (in meters) Total
Ward 500-3900 4000-9000 10000 and above
Ward 3
Ward 4
Ward 5
Ward 6
Ward 7
Ward 8
Ward 9
Ward 10
Total
0(0.0%) 0(0.0%) 2(4.8%) 2(4.8%)
3(7.1%) 6(14.3%) 0(0.0%) 9(21.4%)
2(4.8%) 1(2.4%) 0(0.0%) 3(7.1%)
2(4.8%) 10(23.8%) 0(0.0%) 12(28.6%)
2(4.8%) 0(0.0%) 0(0.0%) 2(4.8%)
1(2.4%) 5(11.9%) 0(0.0%) 6(14.3%)
2(4.8%) 5(11.9%) 0(0.0%) 7(16.7%)
0(0.0%) 1(2.4%) 0(0.0%) 1(2.4%)
12(28.6%) 28(66.7%) 2(4.8%) 42(100.0%)
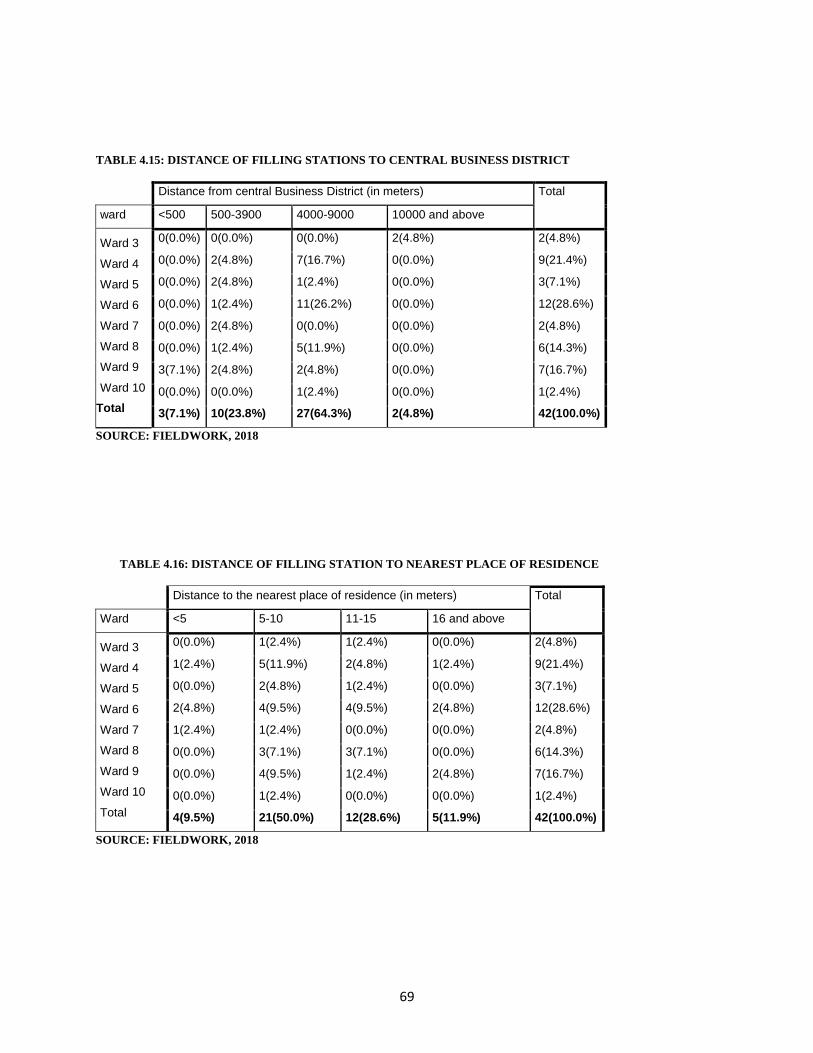
69
TABLE 4.15: DISTANCE OF FILLING STATIONS TO CENTRAL BUSINESS DISTRICT
Distance from central Business District (in meters) Total
ward <500 500-3900 4000-9000 10000 and above
Ward 3
Ward 4
Ward 5
Ward 6
Ward 7
Ward 8
Ward 9
Ward 10
Total
0(0.0%) 0(0.0%) 0(0.0%) 2(4.8%) 2(4.8%)
0(0.0%) 2(4.8%) 7(16.7%) 0(0.0%) 9(21.4%)
0(0.0%) 2(4.8%) 1(2.4%) 0(0.0%) 3(7.1%)
0(0.0%) 1(2.4%) 11(26.2%) 0(0.0%) 12(28.6%)
0(0.0%) 2(4.8%) 0(0.0%) 0(0.0%) 2(4.8%)
0(0.0%) 1(2.4%) 5(11.9%) 0(0.0%) 6(14.3%)
3(7.1%) 2(4.8%) 2(4.8%) 0(0.0%) 7(16.7%)
0(0.0%) 0(0.0%) 1(2.4%) 0(0.0%) 1(2.4%)
3(7.1%) 10(23.8%) 27(64.3%) 2(4.8%) 42(100.0%)
SOURCE: FIELDWORK, 2018
TABLE 4.16: DISTANCE OF FILLING STATION TO NEAREST PLACE OF RESIDENCE
SOURCE: FIELDWORK, 2018
Distance to the nearest place of residence (in meters) Total
Ward <5 5-10 11-15 16 and above
Ward 3
Ward 4
Ward 5
Ward 6
Ward 7
Ward 8
Ward 9
Ward 10
Total
0(0.0%) 1(2.4%) 1(2.4%) 0(0.0%) 2(4.8%)
1(2.4%) 5(11.9%) 2(4.8%) 1(2.4%) 9(21.4%)
0(0.0%) 2(4.8%) 1(2.4%) 0(0.0%) 3(7.1%)
2(4.8%) 4(9.5%) 4(9.5%) 2(4.8%) 12(28.6%)
1(2.4%) 1(2.4%) 0(0.0%) 0(0.0%) 2(4.8%)
0(0.0%) 3(7.1%) 3(7.1%) 0(0.0%) 6(14.3%)
0(0.0%) 4(9.5%) 1(2.4%) 2(4.8%) 7(16.7%)
0(0.0%) 1(2.4%) 0(0.0%) 0(0.0%) 1(2.4%)
4(9.5%) 21(50.0%) 12(28.6%) 5(11.9%) 42(100.0%)
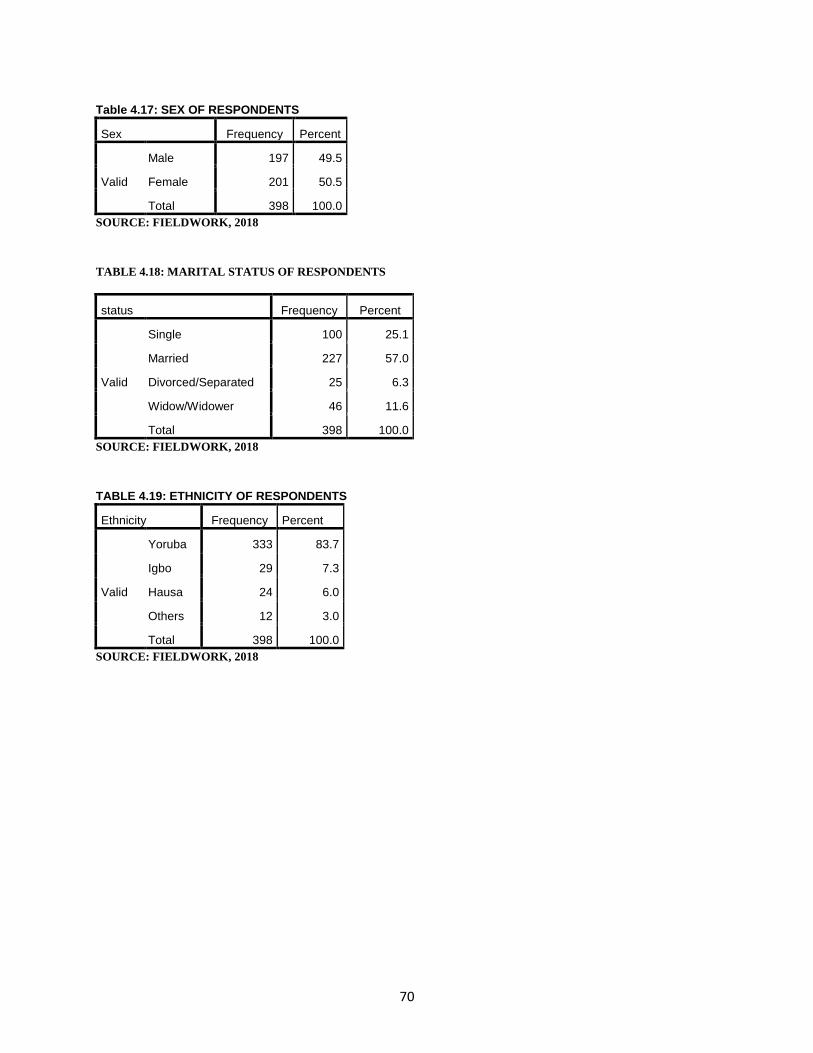
70
Table 4.17: SEX OF RESPONDENTS
Sex Frequency Percent
Valid
Male 197 49.5
Female 201 50.5
Total 398 100.0
SOURCE: FIELDWORK, 2018
TABLE 4.18: MARITAL STATUS OF RESPONDENTS
status Frequency Percent
Valid
Single 100 25.1
Married 227 57.0
Divorced/Separated 25 6.3
Widow/Widower 46 11.6
Total 398 100.0
SOURCE: FIELDWORK, 2018
TABLE 4.19: ETHNICITY OF RESPONDENTS
Ethnicity Frequency Percent
Valid
Yoruba 333 83.7
Igbo 29 7.3
Hausa 24 6.0
Others 12 3.0
Total 398 100.0
SOURCE: FIELDWORK, 2018
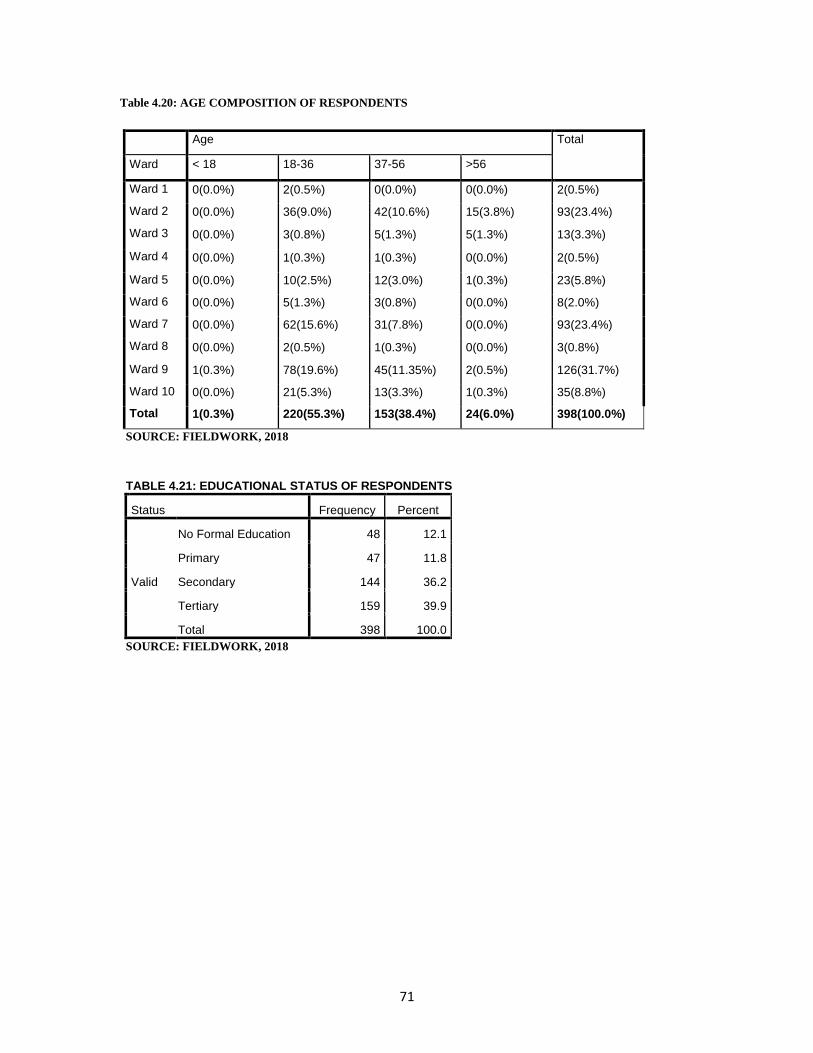
71
Table 4.20: AGE COMPOSITION OF RESPONDENTS
Age Total
Ward < 18 18-36 37-56 >56
Ward 1 0(0.0%) 2(0.5%) 0(0.0%) 0(0.0%) 2(0.5%)
Ward 2 0(0.0%) 36(9.0%) 42(10.6%) 15(3.8%) 93(23.4%)
Ward 3 0(0.0%) 3(0.8%) 5(1.3%) 5(1.3%) 13(3.3%)
Ward 4 0(0.0%) 1(0.3%) 1(0.3%) 0(0.0%) 2(0.5%)
Ward 5 0(0.0%) 10(2.5%) 12(3.0%) 1(0.3%) 23(5.8%)
Ward 6 0(0.0%) 5(1.3%) 3(0.8%) 0(0.0%) 8(2.0%)
Ward 7 0(0.0%) 62(15.6%) 31(7.8%) 0(0.0%) 93(23.4%)
Ward 8 0(0.0%) 2(0.5%) 1(0.3%) 0(0.0%) 3(0.8%)
Ward 9 1(0.3%) 78(19.6%) 45(11.35%) 2(0.5%) 126(31.7%)
Ward 10 0(0.0%) 21(5.3%) 13(3.3%) 1(0.3%) 35(8.8%)
Total 1(0.3%) 220(55.3%) 153(38.4%) 24(6.0%) 398(100.0%)
SOURCE: FIELDWORK, 2018
TABLE 4.21: EDUCATIONAL STATUS OF RESPONDENTS
Status Frequency Percent
Valid
No Formal Education 48 12.1
Primary 47 11.8
Secondary 144 36.2
Tertiary 159 39.9
Total 398 100.0
SOURCE: FIELDWORK, 2018
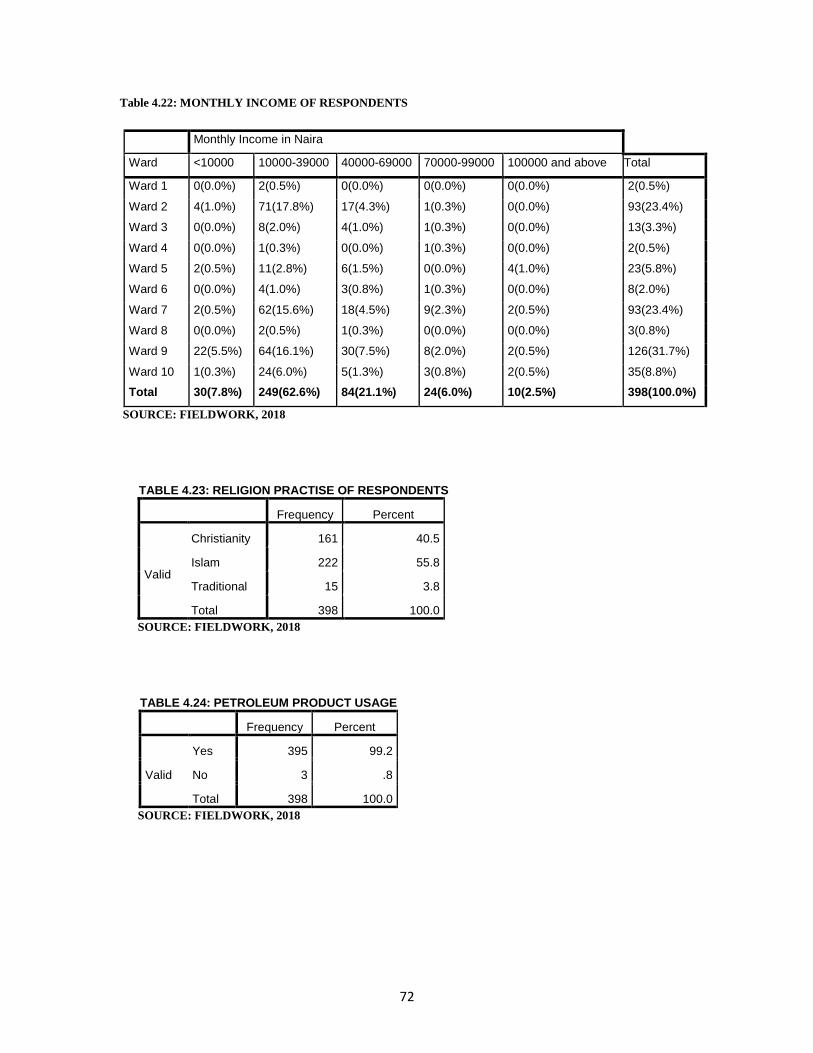
72
Table 4.22: MONTHLY INCOME OF RESPONDENTS
Monthly Income in Naira
Ward <10000 10000-39000 40000-69000 70000-99000 100000 and above Total
Ward 1 0(0.0%) 2(0.5%) 0(0.0%) 0(0.0%) 0(0.0%) 2(0.5%)
Ward 2 4(1.0%) 71(17.8%) 17(4.3%) 1(0.3%) 0(0.0%) 93(23.4%)
Ward 3 0(0.0%) 8(2.0%) 4(1.0%) 1(0.3%) 0(0.0%) 13(3.3%)
Ward 4 0(0.0%) 1(0.3%) 0(0.0%) 1(0.3%) 0(0.0%) 2(0.5%)
Ward 5 2(0.5%) 11(2.8%) 6(1.5%) 0(0.0%) 4(1.0%) 23(5.8%)
Ward 6 0(0.0%) 4(1.0%) 3(0.8%) 1(0.3%) 0(0.0%) 8(2.0%)
Ward 7 2(0.5%) 62(15.6%) 18(4.5%) 9(2.3%) 2(0.5%) 93(23.4%)
Ward 8 0(0.0%) 2(0.5%) 1(0.3%) 0(0.0%) 0(0.0%) 3(0.8%)
Ward 9 22(5.5%) 64(16.1%) 30(7.5%) 8(2.0%) 2(0.5%) 126(31.7%)
Ward 10 1(0.3%) 24(6.0%) 5(1.3%) 3(0.8%) 2(0.5%) 35(8.8%)
Total 30(7.8%) 249(62.6%) 84(21.1%) 24(6.0%) 10(2.5%) 398(100.0%)
SOURCE: FIELDWORK, 2018
TABLE 4.23: RELIGION PRACTISE OF RESPONDENTS
Frequency Percent
Valid
Christianity 161 40.5
Islam 222 55.8
Traditional 15 3.8
Total 398 100.0
SOURCE: FIELDWORK, 2018
TABLE 4.24: PETROLEUM PRODUCT USAGE
Frequency Percent
Valid
Yes 395 99.2
No 3 .8
Total 398 100.0
SOURCE: FIELDWORK, 2018
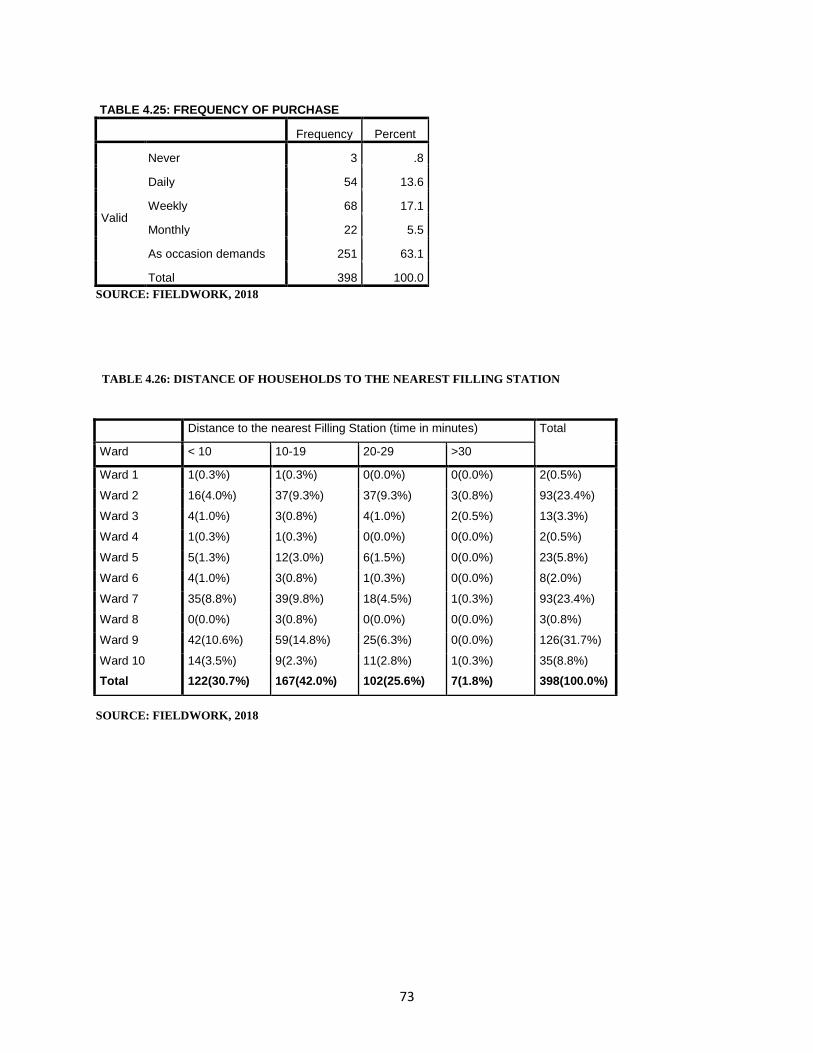
73
TABLE 4.25: FREQUENCY OF PURCHASE
Frequency Percent
Valid
Never 3 .8
Daily 54 13.6
Weekly 68 17.1
Monthly 22 5.5
As occasion demands 251 63.1
Total 398 100.0
SOURCE: FIELDWORK, 2018
TABLE 4.26: DISTANCE OF HOUSEHOLDS TO THE NEAREST FILLING STATION
SOURCE: FIELDWORK, 2018
Distance to the nearest Filling Station (time in minutes) Total
Ward < 10 10-19 20-29 >30
Ward 1 1(0.3%) 1(0.3%) 0(0.0%) 0(0.0%) 2(0.5%)
Ward 2 16(4.0%) 37(9.3%) 37(9.3%) 3(0.8%) 93(23.4%)
Ward 3 4(1.0%) 3(0.8%) 4(1.0%) 2(0.5%) 13(3.3%)
Ward 4 1(0.3%) 1(0.3%) 0(0.0%) 0(0.0%) 2(0.5%)
Ward 5 5(1.3%) 12(3.0%) 6(1.5%) 0(0.0%) 23(5.8%)
Ward 6 4(1.0%) 3(0.8%) 1(0.3%) 0(0.0%) 8(2.0%)
Ward 7 35(8.8%) 39(9.8%) 18(4.5%) 1(0.3%) 93(23.4%)
Ward 8 0(0.0%) 3(0.8%) 0(0.0%) 0(0.0%) 3(0.8%)
Ward 9 42(10.6%) 59(14.8%) 25(6.3%) 0(0.0%) 126(31.7%)
Ward 10 14(3.5%) 9(2.3%) 11(2.8%) 1(0.3%) 35(8.8%)
Total 122(30.7%) 167(42.0%) 102(25.6%) 7(1.8%) 398(100.0%)
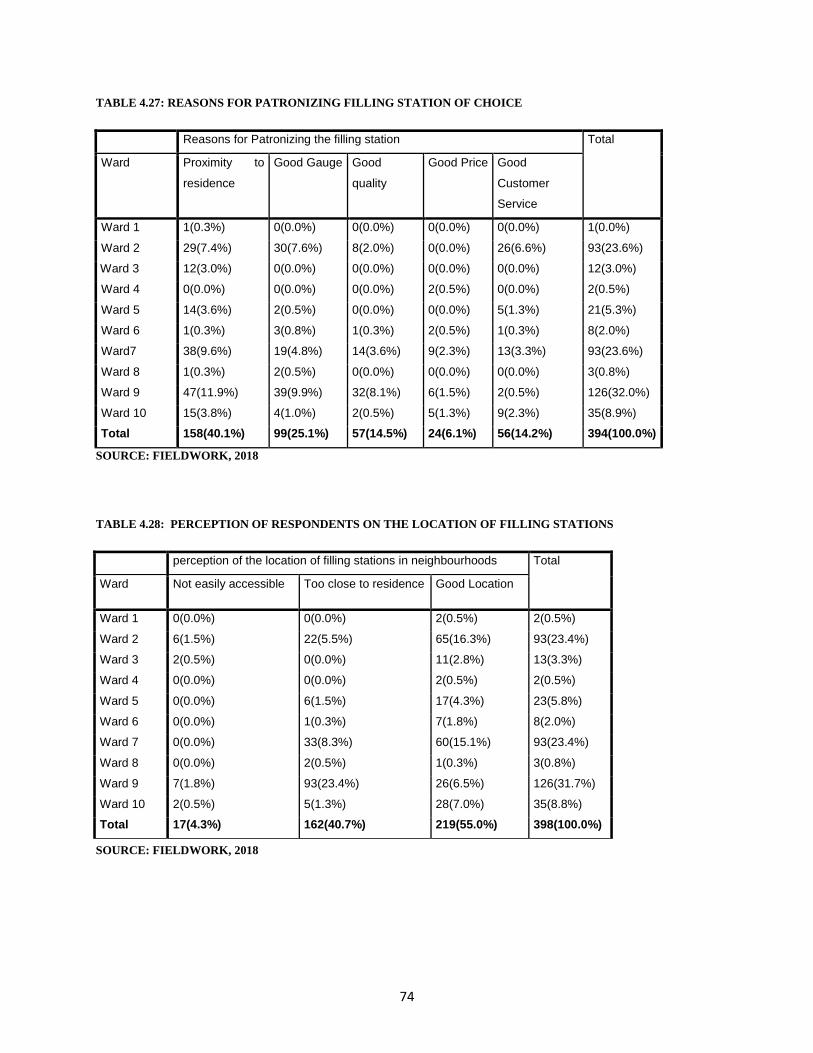
74
TABLE 4.27: REASONS FOR PATRONIZING FILLING STATION OF CHOICE
Reasons for Patronizing the filling station Total
Ward Proximity to
residence
Good Gauge Good
quality
Good Price Good
Customer
Service
Ward 1 1(0.3%) 0(0.0%) 0(0.0%) 0(0.0%) 0(0.0%) 1(0.0%)
Ward 2 29(7.4%) 30(7.6%) 8(2.0%) 0(0.0%) 26(6.6%) 93(23.6%)
Ward 3 12(3.0%) 0(0.0%) 0(0.0%) 0(0.0%) 0(0.0%) 12(3.0%)
Ward 4 0(0.0%) 0(0.0%) 0(0.0%) 2(0.5%) 0(0.0%) 2(0.5%)
Ward 5 14(3.6%) 2(0.5%) 0(0.0%) 0(0.0%) 5(1.3%) 21(5.3%)
Ward 6 1(0.3%) 3(0.8%) 1(0.3%) 2(0.5%) 1(0.3%) 8(2.0%)
Ward7 38(9.6%) 19(4.8%) 14(3.6%) 9(2.3%) 13(3.3%) 93(23.6%)
Ward 8 1(0.3%) 2(0.5%) 0(0.0%) 0(0.0%) 0(0.0%) 3(0.8%)
Ward 9 47(11.9%) 39(9.9%) 32(8.1%) 6(1.5%) 2(0.5%) 126(32.0%)
Ward 10 15(3.8%) 4(1.0%) 2(0.5%) 5(1.3%) 9(2.3%) 35(8.9%)
Total 158(40.1%) 99(25.1%) 57(14.5%) 24(6.1%) 56(14.2%) 394(100.0%)
SOURCE: FIELDWORK, 2018
TABLE 4.28: PERCEPTION OF RESPONDENTS ON THE LOCATION OF FILLING STATIONS
SOURCE: FIELDWORK, 2018
perception of the location of filling stations in neighbourhoods Total
Ward Not easily accessible Too close to residence Good Location
Ward 1 0(0.0%) 0(0.0%) 2(0.5%) 2(0.5%)
Ward 2 6(1.5%) 22(5.5%) 65(16.3%) 93(23.4%)
Ward 3 2(0.5%) 0(0.0%) 11(2.8%) 13(3.3%)
Ward 4 0(0.0%) 0(0.0%) 2(0.5%) 2(0.5%)
Ward 5 0(0.0%) 6(1.5%) 17(4.3%) 23(5.8%)
Ward 6 0(0.0%) 1(0.3%) 7(1.8%) 8(2.0%)
Ward 7 0(0.0%) 33(8.3%) 60(15.1%) 93(23.4%)
Ward 8 0(0.0%) 2(0.5%) 1(0.3%) 3(0.8%)
Ward 9 7(1.8%) 93(23.4%) 26(6.5%) 126(31.7%)
Ward 10 2(0.5%) 5(1.3%) 28(7.0%) 35(8.8%)
Total 17(4.3%) 162(40.7%) 219(55.0%) 398(100.0%)
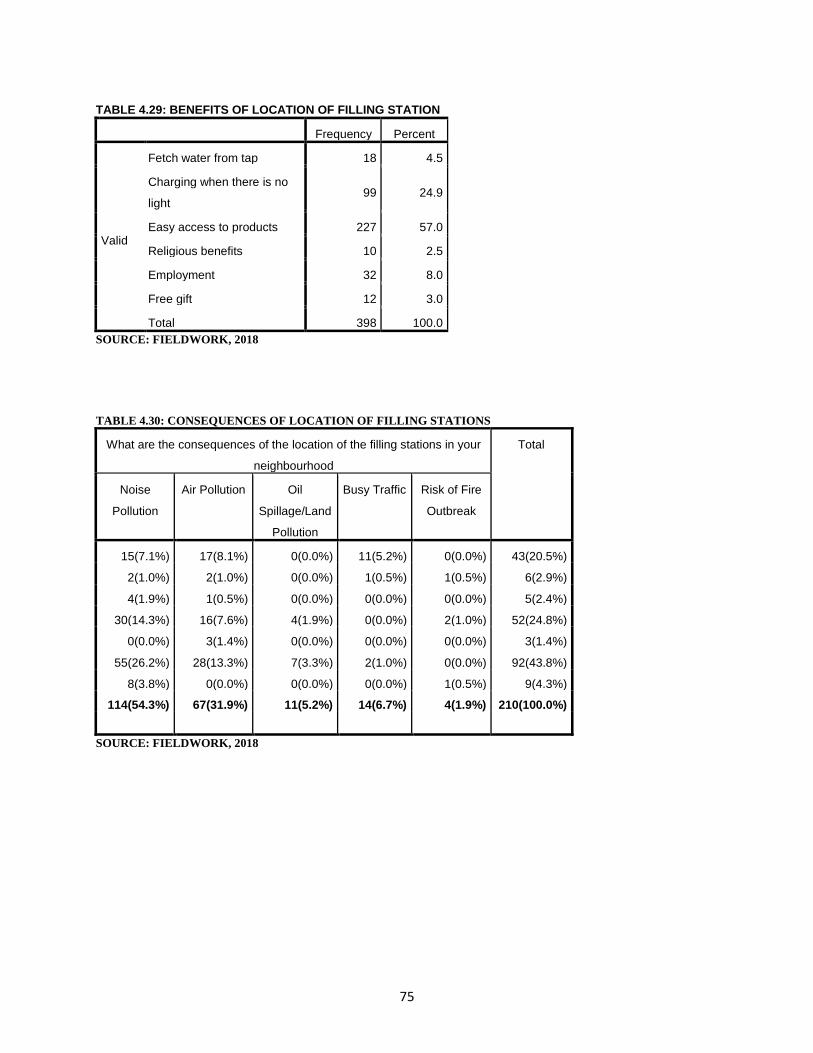
75
TABLE 4.29: BENEFITS OF LOCATION OF FILLING STATION
Frequency Percent
Valid
Fetch water from tap 18 4.5
Charging when there is no
light 99 24.9
Easy access to products 227 57.0
Religious benefits 10 2.5
Employment 32 8.0
Free gift 12 3.0
Total 398 100.0
SOURCE: FIELDWORK, 2018
TABLE 4.30: CONSEQUENCES OF LOCATION OF FILLING STATIONS
What are the consequences of the location of the filling stations in your
neighbourhood
Total
Noise
Pollution
Air Pollution Oil
Spillage/Land
Pollution
Busy Traffic Risk of Fire
Outbreak
15(7.1%) 17(8.1%) 0(0.0%) 11(5.2%) 0(0.0%) 43(20.5%)
2(1.0%) 2(1.0%) 0(0.0%) 1(0.5%) 1(0.5%) 6(2.9%)
4(1.9%) 1(0.5%) 0(0.0%) 0(0.0%) 0(0.0%) 5(2.4%)
30(14.3%) 16(7.6%) 4(1.9%) 0(0.0%) 2(1.0%) 52(24.8%)
0(0.0%) 3(1.4%) 0(0.0%) 0(0.0%) 0(0.0%) 3(1.4%)
55(26.2%) 28(13.3%) 7(3.3%) 2(1.0%) 0(0.0%) 92(43.8%)
8(3.8%) 0(0.0%) 0(0.0%) 0(0.0%) 1(0.5%) 9(4.3%)
114(54.3%) 67(31.9%) 11(5.2%) 14(6.7%) 4(1.9%) 210(100.0%)
SOURCE: FIELDWORK, 2018
Related Documents