Spatial Analysis of Shallow Slope Instability Incorporating an Engineering Geological Ground Model B. Mackenzie, J. Hooper, and D. Rushton Abstract Within a GIS (geographical information system), spatial analysis techniques can be used to apply deterministic methods for identifying and mapping areas susceptible to shallow submarine mass movements. This paper describes such a method which allows spatially widespread, rapid, repeatable and cost-effective evaluation of shallow submarine slope risk. A deterministic approach has the advantage of providing a quantitative output; useful in subsequent project risk assessment. The use of GIS in this way is well established. Many of the method limitations described in the literature can now be overcome. This paper describes some advances through which these limitations are being addressed, and the com- promises that still need to be made. The paper places emphasis on GIS modeling of the full three-dimensional variation of geotechnical input parameters. This approach allows the type of sophisticated ground model now becoming available from regional engineering geological and geohazard studies to be harnessed and exploited. The approach described in the paper has been applied on deepwater oil and gas projects having development areas of over 1,000 km 2 . Keywords Submarine landslide • geographical information system • GIS • shallow slope stability • soil model • ground model • geotechnical spatial variability • risk assessment 1 Introduction Submarine slope instability is a risk to many offshore oil and gas developments, particularly in deepwater areas. Authors have described risks and associated mitigating measures in various deepwater regions (Jeanjean et al. 2005; B. Mackenzie (), J. Hooper, and D. Rushton Fugro GeoConsulting Limited, Fugro House, Hithercroft Road, Wallingford, Oxfordshire, OX10 9RB, UK e-mail: [email protected] D.C. Mosher et al. (eds.), Submarine Mass Movements and Their Consequences, 365 Advances in Natural and Technological Hazards Research, Vol 28, © Springer Science + Business Media B.V. 2010

Welcome message from author
This document is posted to help you gain knowledge. Please leave a comment to let me know what you think about it! Share it to your friends and learn new things together.
Transcript
Spatial Analysis of Shallow Slope Instability Incorporating an Engineering Geological Ground Model
B. Mackenzie, J. Hooper, and D. Rushton
Abstract Within a GIS (geographical information system), spatial analysis techniques can be used to apply deterministic methods for identifying and mapping areas susceptible to shallow submarine mass movements. This paper describes such a method which allows spatially widespread, rapid, repeatable and cost-effective evaluation of shallow submarine slope risk. A deterministic approach has the advantage of providing a quantitative output; useful in subsequent project risk assessment. The use of GIS in this way is well established. Many of the method limitations described in the literature can now be overcome. This paper describes some advances through which these limitations are being addressed, and the com-promises that still need to be made. The paper places emphasis on GIS modeling of the full three-dimensional variation of geotechnical input parameters. This approach allows the type of sophisticated ground model now becoming available from regional engineering geological and geohazard studies to be harnessed and exploited. The approach described in the paper has been applied on deepwater oil and gas projects having development areas of over 1,000 km2.
Keywords Submarine landslide • geographical information system • GIS • shallow slope stability • soil model • ground model • geotechnical spatial variability • risk assessment
1 Introduction
Submarine slope instability is a risk to many offshore oil and gas developments, particularly in deepwater areas. Authors have described risks and associated mitigating measures in various deepwater regions (Jeanjean et al. 2005;
B. Mackenzie (�), J. Hooper, and D. RushtonFugro GeoConsulting Limited, Fugro House, Hithercroft Road, Wallingford, Oxfordshire, OX10 9RB, UKe-mail: [email protected]
D.C. Mosher et al. (eds.), Submarine Mass Movements and Their Consequences, 365Advances in Natural and Technological Hazards Research, Vol 28,© Springer Science + Business Media B.V. 2010
366 B. Mackenzie et al.
Hooper and Prior 1989 (Gulf of Mexico); Kvalstad et al. 2002 (Norwegian Sea); Evans et al. 2007 (West Nile Delta); Orren and Hamilton 1998 (Caspian Sea) ).
In order to design, install and successfully bring onstream an oil and gas development in an area of potential submarine slide activity, the slide instability risks must not only be understood, but must be quantified. This is the only way that the project can relate and balance the risks, and mitigating effort, to the overall project value.
The overall quantified slope instability risk is an aggregate of component proba-bilities and consequences, including: (i) the probability of slide occurrence, (ii) the probability of the slide then spatially impacting development infrastructure, and (iii) the probability that this impact will cause damage having a cost. This paper focuses on the first stage of this quantitative risk assessment process – the prediction of slide occurrence. However, it will be seen that, if a predictive method can also output key physical slide attributes such as spatial extent and thickness, then the method also helps quantify the damage consequence, another step in the risk assessment process.
2 Landslide Prediction Methods and GIS Applicability
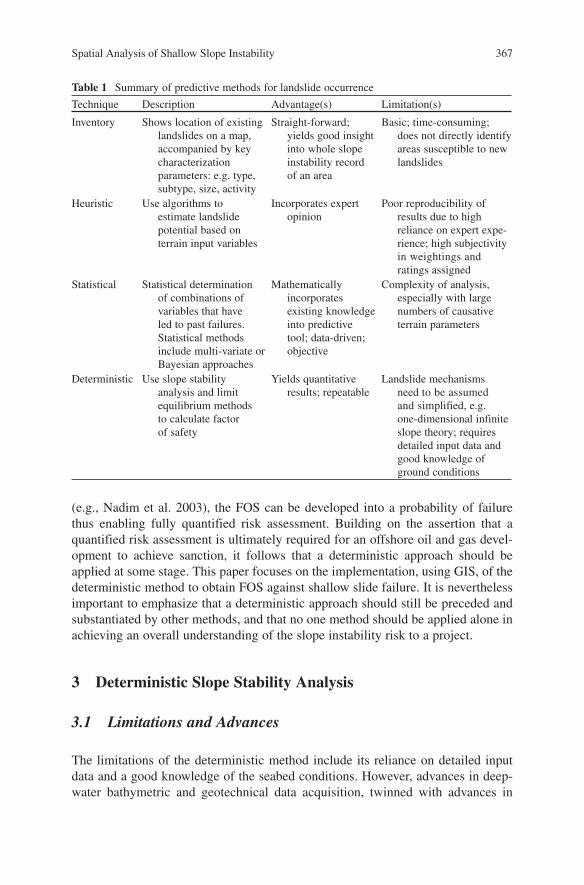
Different techniques exist to predict slide occurrence. Some authors (Soeters and Van Westen 1996; Van Westen et al. 1997; Dai and Lee 2001) have placed these techniques into four categories: inventory, heuristic, statistical and deterministic. Each method has its relative merits and limitations, as summarized in Table 1.
All the techniques originate from methods first developed for slope stability assessment in onshore environments. However, they are also generally applicable in the submarine environment, for instance by using high resolution seabed bathymetry data in place of aerial imagery to perform submarine slide inventory mapping.
Table 1 can be viewed as showing a progression, from top to bottom, from quali-tative to quantitative stability risk assessment. All of the methods also lend them-selves to GIS implementation. In the simplest case, a GIS represents an ideal tool to compile, manage and present a landslide inventory, with the added advantage that that the accompanying slide parameters can be included in a GIS attribute table. Hitchcock et al. (2006) describe the implementation of a heuristic approach using GIS technology to map mudflow susceptibility in the Gulf of Mexico. Here, the relative contributions of geology, slope, and bathymetric drivers were ranked and captured in an expert-assigned scoring system. These scores were then aggre-gated and assigned a mudflow susceptibility class (low, moderate, high, very high) which was then mapped over the study area.
Authors have previously described the use of GIS to apply deterministic slope stability methods (Graham 1984; Wu and Sidle 1995; Dai and Lee 2001). Jeanjean et al. (2005) describe the application of a deterministic method to identify areas having a low safety factor against shallow slope failure, over an entire field of inter-est. The input soil strength varied over the field, but was a constant value with depth at any given location. In the case of the deterministic method, GIS spatial analysis techniques can be used directly to realize the method’s key advantage - the calculation of factors of safety (FOS) against slide failure. Via probabilistic methods
Spatial Analysis of Shallow Slope Instability 367
(e.g., Nadim et al. 2003), the FOS can be developed into a probability of failure thus enabling fully quantified risk assessment. Building on the assertion that a quantified risk assessment is ultimately required for an offshore oil and gas devel-opment to achieve sanction, it follows that a deterministic approach should be applied at some stage. This paper focuses on the implementation, using GIS, of the deterministic method to obtain FOS against shallow slide failure. It is nevertheless important to emphasize that a deterministic approach should still be preceded and substantiated by other methods, and that no one method should be applied alone in achieving an overall understanding of the slope instability risk to a project.
3 Deterministic Slope Stability Analysis
3.1 Limitations and Advances
The limitations of the deterministic method include its reliance on detailed input data and a good knowledge of the seabed conditions. However, advances in deep-water bathymetric and geotechnical data acquisition, twinned with advances in
Table 1 Summary of predictive methods for landslide occurrence
Technique Description Advantage(s) Limitation(s)
Inventory Shows location of existing landslides on a map, accompanied by key characterization parameters: e.g. type, subtype, size, activity
Straight-forward; yields good insight into whole slope instability record of an area
Basic; time-consuming; does not directly identify areas susceptible to new landslides
Heuristic Use algorithms to estimate landslide potential based on terrain input variables
Incorporates expert opinion
Poor reproducibility of results due to high reliance on expert expe-rience; high subjectivity in weightings and ratings assigned
Statistical Statistical determination of combinations of variables that have led to past failures. Statistical methods include multi-variate or Bayesian approaches
Mathematically incorporates existing knowledge into predictive tool; data-driven; objective
Complexity of analysis, especially with large numbers of causative terrain parameters
Deterministic Use slope stability analysis and limit equilibrium methods to calculate factor of safety
Yields quantitative results; repeatable
Landslide mechanisms need to be assumed and simplified, e.g. one-dimensional infinite slope theory; requires detailed input data and good knowledge of ground conditions
368 B. Mackenzie et al.
engineering geology and geohazard assessment (e.g., Thomas et al. 2009) are reducing the uncertainties inherent with these limitations. These advances are leading to the availability of sophisticated and spatially resolute terrain and soil models for many of the world’s slide-prone deepwater development areas. The amount of information available would form an overwhelming dataset for interpretation in anything other than a GIS-based terrain analysis.
Another previously noted limitation of GIS implementation of deterministic models is the inability to model the influence of neighboring pixels (neighbor-hood operations), and the inability to model the third dimension (depth). This need no longer be a limitation, as will be described, with an emphasis on modeling depth variability.
Table 1 also notes that landslide mechanisms need to be simplified for imple-mentation in a numerical-based GIS mapping algorithm. This might be true for a solution performed completely within GIS. However, parallel advances using hybrid solutions are reducing the reliance on simplified models. Xie at al. (2003) describe a method enabling full 3D analysis through a combination of GIS spatial analysis and an external column-based 3D slope stability model.
Overall, GIS implementation of a deterministic slope analysis remains a technical compromise, but one in which not all of the current limitations need apply. In the analysis described herein, the modeled landslide is maintained at a relatively simple level (one-dimensional infinite slope), but incorporates a complex, spatially reso-lute and depth-dependent ground model. The use of numerical-based mapping methods in GIS enables this analysis to be performed rapidly over wide areas. Furthermore, despite the complexity of the ground model, it remains a model and is consequently subject to uncertainty. However, the use of GIS also allows the rapid design and execution of sensitivity studies in which the ground model can be parametrically varied.
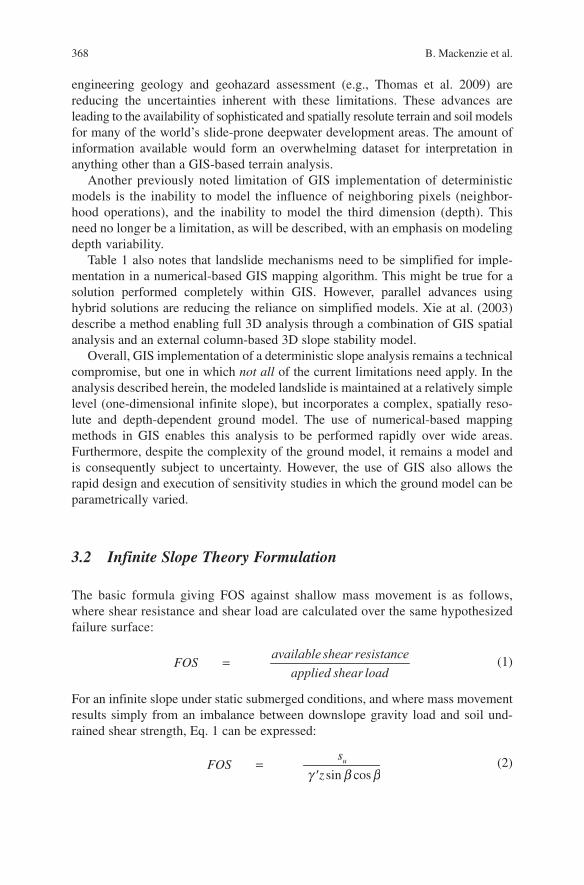
3.2 Infinite Slope Theory Formulation
The basic formula giving FOS against shallow mass movement is as follows, where shear resistance and shear load are calculated over the same hypothesized failure surface:
available shear resistance
=FOSapplied shear load
(1)
For an infinite slope under static submerged conditions, and where mass movement results simply from an imbalance between downslope gravity load and soil und-rained shear strength, Eq. 1 can be expressed:
sin cos
usFOS
zg b b=
' (2)
Spatial Analysis of Shallow Slope Instability 369
where: su = soil undrained shear strength (kPa) at depth z
z = depth of failure plane below, and parallel to, seabed (m)g ' = soil submerged unit weight, average to depth z (kN/m3)b = seabed slope (°)
Equation 2 can be further modified to model drained soil response, and also to incorporate non-static loading such as the effect of a downslope seismic accelera-tion, as follows:
( ) ( )2
2
/ cos cos sin tan
cos sin cosu seis
seis
s z kFOS
k
g b g b b f
g b b g b
+ −=
+
' ''
(3)
where: g = soil total unit weight (kN/m3)f' = soil effective friction angle (°)k
seis = seismic acceleration coefficient (-)The product of the seismic acceleration coefficient, k
seis, and the acceleration due
to gravity gives the seismic acceleration. The use of the seismic acceleration coefficient in this way represents a recognized simplification where the additional downslope load is applied as a quasi-static load equal to the product of the soil mass and its resolved downslope acceleration.
Further adaptations can be made to Eq. 3 to incorporate the effects of excess pore-water pressure in the soil, and also the influence of external loads, such as might be imposed by seabed structures or pipelines on the seabed. Equation 3, and variants, allowing for external structure loading and excess pore-water pressure, have been used by the author in region-wide GIS assessments of seabed susceptibility to shallow mass movements. These assessments have used, as their input, GIS ground models derived from regional engineering geological studies. A description of the type of ground model typically now available is given below, followed by a description of its actual implementation in a GIS slope stability assessment.
4 GIS Ground Model Availability – State of the Art
4.1 Ground Model Components
The term ground model, in this context, encompasses the data required to characterize seabed topography and the geotechnical and geological conditioning factors, including the temporal element. Combined, these govern the occurrence, size and extent of shallow slide events. A typical process for the development of the ground model is described by Thomas et al. (2009). Seabed topography is now typically available to the slope stability engineer as a digital three-dimensional surface derived from ultra-ultra high resolution autonomous underwater vehicle (AUV) survey data. AUV bathymetry data typically exist at a resolution of 2.5 m, or finer, for today’s deepwater development projects.
370 B. Mackenzie et al.
The geotechnical and geological conditioning factors are those parameters required to compute soil shear resistance and loading, the balance between which governs stability. With reference to Eqs. 2 and 3, these include undrained shear strength (s
u), total and submerged unit weight (g, g '), and effective friction
angle (f').
4.2 Representation of Full Spatial Variability
In reality the above parameters vary spatially as a function of depth as well as loca-tion. The seabed model sourced by the GIS stability analysis should ideally reflect this. A convenient means of defining the geotechnical variability across a site is to use terrain systems or soil provinces (Campbell 1984). A soil province is defined as an area within which soil conditions share a similar stratigraphic sequence; usually the soils within a given soil province have shared a similar geological and geomor-phological history. There is often a visible correlation between soil province mapping and bathymetry, since the seabed bathymetry can reveal much about the process by which the soil has arrived at its present state.
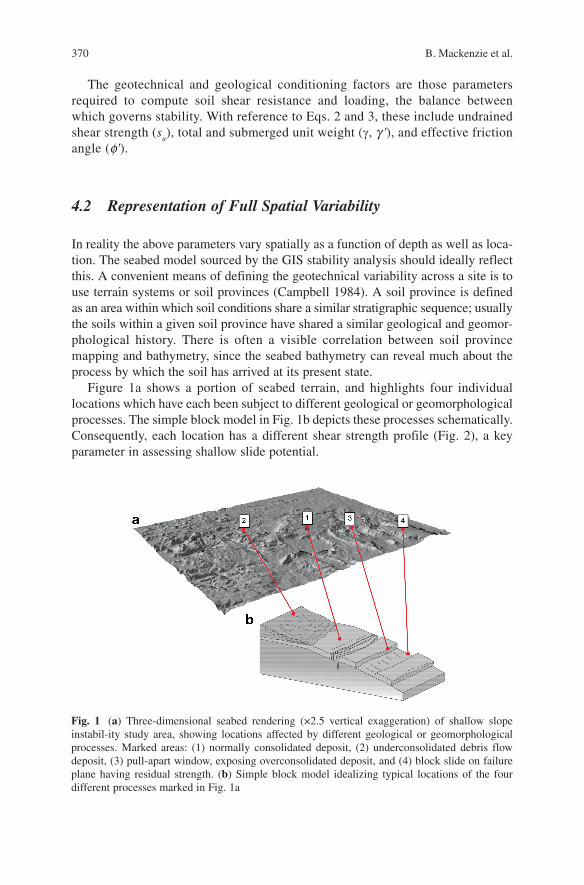
Figure 1a shows a portion of seabed terrain, and highlights four individual locations which have each been subject to different geological or geomorphological processes. The simple block model in Fig. 1b depicts these processes schematically. Consequently, each location has a different shear strength profile (Fig. 2), a key parameter in assessing shallow slide potential.
Fig. 1 (a) Three-dimensional seabed rendering (×2.5 vertical exaggeration) of shallow slope instabil-ity study area, showing locations affected by different geological or geomorphological processes. Marked areas: (1) normally consolidated deposit, (2) underconsolidated debris flow deposit, (3) pull-apart window, exposing overconsolidated deposit, and (4) block slide on failure plane having residual strength. (b) Simple block model idealizing typical locations of the four different processes marked in Fig. 1a
Spatial Analysis of Shallow Slope Instability 371
On Fig. 1a, Location 1 sits in a normally consolidated depositional environment, for which one would expect a low shear strength at the immediate seabed, below which the strength would increase linearly with depth (constant shear strength gradient). Location 2 represents an underconsolidated deposit. Here, owing to recent higher deposition rates, or in this case loading from an earlier mass movement
Undrained Shear Strength, Su (kPa)0
0
4
8
12Dep
th (
m)
16
20
10 20 30 40Undrained Shear Strength, Su (kPa)
00
4
8
12Dep
th (
m)
16
20
10 20 30 40
Undrained Shear Strength, Su (kPa)0
0
4
8
12Dep
th (
m)
16
20
10 20 30 40Undrained Shear Strength, Su (kPa)
00
4
8
12Dep
th (
m)
16
20
10 20 30 40
hh
a b
c d
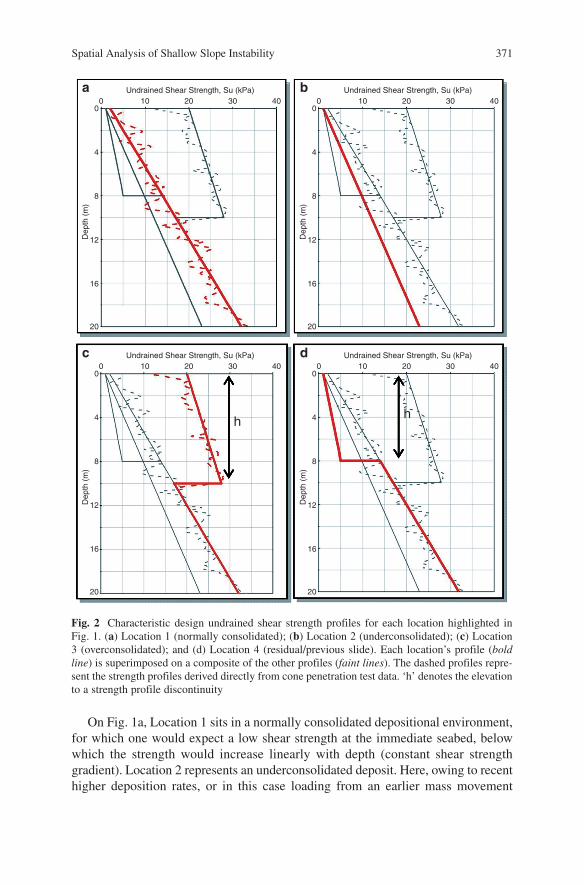
Fig. 2 Characteristic design undrained shear strength profiles for each location highlighted in Fig. 1. (a) Location 1 (normally consolidated); (b) Location 2 (underconsolidated); (c) Location 3 (overconsolidated); and (d) Location 4 (residual/previous slide). Each location’s profile (bold line) is superimposed on a composite of the other profiles (faint lines). The dashed profiles repre-sent the strength profiles derived directly from cone penetration test data. ‘h’ denotes the elevation to a strength profile discontinuity
372 B. Mackenzie et al.
event, the soil contains excess pore-water pressure and hence exhibits a lower strength than if normally consolidated. At Location 3 the soils are slightly overcon-solidated; here surface soil has been removed by previous slide activity and the underlying unloaded soil is slowly weakening, just like an excavation on land – but remains stronger than a normally consolidated seabed soil. Location 4 has been subject to previous slide movement, and comprises a layer of disturbed, weaker mass flow deposit separated from the underlying soil by a shear plane.
Examination of the seabed and sub-seabed in this way, especially if assisted by shallow geophysical and geotechnical site investigation data, allows delineation into soil provinces. These provinces lend themselves to GIS mapping and subse-quent spatial analysis of the seabed and sub-seabed extremely well. An important point to note is that, within any soil province, the layer change elevations (denoted at depth ‘h’ in Fig. 2c, d) need not be a fixed GIS attribute for that soil province. Rather, and better still, these elevations are themselves defined in a GIS isopach layer resulting from a geophysical interpretation. In other words, although the soil layering follows a set sequence within a soil province, the layer thicknesses and hence the soil parameters are fully spatially variable. The cross-referencing of stratigraphic elevations from isopach maps allows for computational efficiency, as opposed to storing depth-variable data on a per-location basis.
5 GIS Implementation and Results
5.1 Implementation
The required numeric seabed model parameters are captured in a suite of GIS raster surfaces. A raster surface is a grid of pixels, or raster cells, where each cell has a value assigned based on the soil province in which the cell lies (or based on an isopach layer in the case of continuously mapped stratigraphic elevation).
For the depth-variable parameters such as undrained shear strength (su), raster
surfaces defining su at the top of each stratigraphic layer, and defining the gradient
of su within each layer, are produced. These are readily generated from a GIS soil
province map, likely to have initially been created as a vector map with lines or polygons delineating the soil provinces. A GIS soil province vector map is a convenient and effective data management tool, since all key parameters can be captured as data attributes.
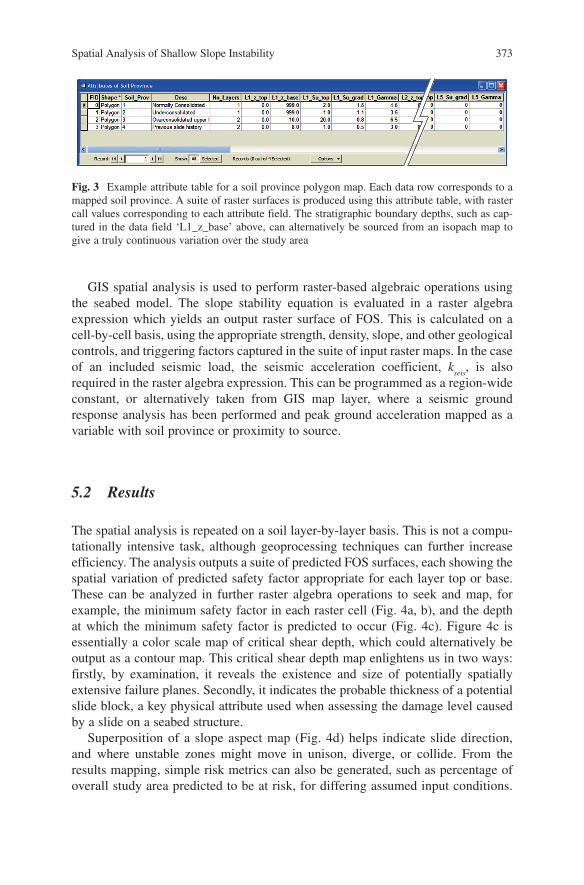
Figure 3 reproduces the GIS attribute table for the study area introduced earlier in Fig. 1. The soil province map, and its underlying attribute table, is then used to spawn individual parameter surfaces on a stratigraphic layer-by-layer basis. At the same time, these individual parameter surfaces are converted into raster format. Through the resulting suite of raster surfaces, the GIS then has the full ‘picture’ of the spatial variability of the key parameters over the study area, including buried strength discontinuities on previous slide planes.
Spatial Analysis of Shallow Slope Instability 373
GIS spatial analysis is used to perform raster-based algebraic operations using the seabed model. The slope stability equation is evaluated in a raster algebra expression which yields an output raster surface of FOS. This is calculated on a cell-by-cell basis, using the appropriate strength, density, slope, and other geological controls, and triggering factors captured in the suite of input raster maps. In the case of an included seismic load, the seismic acceleration coefficient, k
seis, is also
required in the raster algebra expression. This can be programmed as a region-wide constant, or alternatively taken from GIS map layer, where a seismic ground response analysis has been performed and peak ground acceleration mapped as a variable with soil province or proximity to source.
5.2 Results
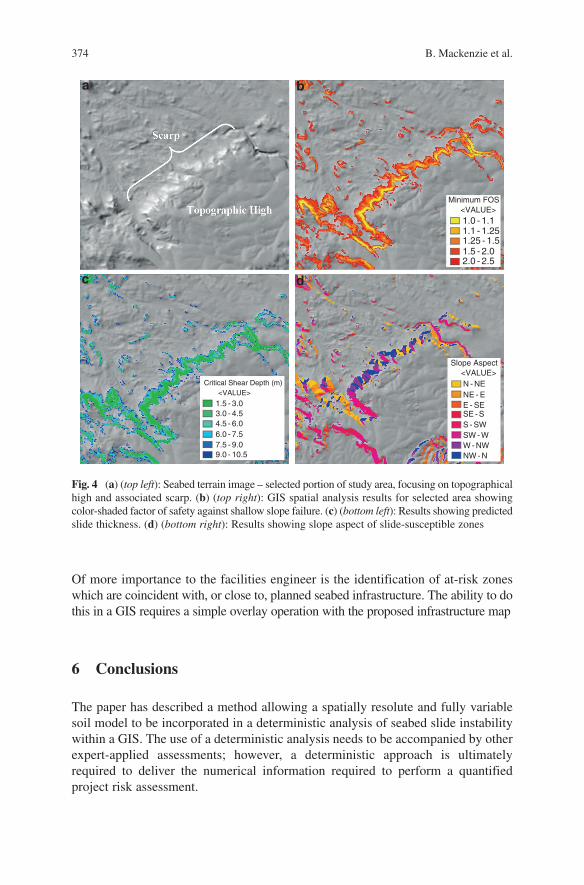
The spatial analysis is repeated on a soil layer-by-layer basis. This is not a compu-tationally intensive task, although geoprocessing techniques can further increase efficiency. The analysis outputs a suite of predicted FOS surfaces, each showing the spatial variation of predicted safety factor appropriate for each layer top or base. These can be analyzed in further raster algebra operations to seek and map, for example, the minimum safety factor in each raster cell (Fig. 4a, b), and the depth at which the minimum safety factor is predicted to occur (Fig. 4c). Figure 4c is essentially a color scale map of critical shear depth, which could alternatively be output as a contour map. This critical shear depth map enlightens us in two ways: firstly, by examination, it reveals the existence and size of potentially spatially extensive failure planes. Secondly, it indicates the probable thickness of a potential slide block, a key physical attribute used when assessing the damage level caused by a slide on a seabed structure.
Superposition of a slope aspect map (Fig. 4d) helps indicate slide direction, and where unstable zones might move in unison, diverge, or collide. From the results mapping, simple risk metrics can also be generated, such as percentage of overall study area predicted to be at risk, for differing assumed input conditions.
Fig. 3 Example attribute table for a soil province polygon map. Each data row corresponds to a mapped soil province. A suite of raster surfaces is produced using this attribute table, with raster call values corresponding to each attribute field. The stratigraphic boundary depths, such as cap-tured in the data field ‘L1_z_base’ above, can alternatively be sourced from an isopach map to give a truly continuous variation over the study area
374 B. Mackenzie et al.
Of more importance to the facilities engineer is the identification of at-risk zones which are coincident with, or close to, planned seabed infrastructure. The ability to do this in a GIS requires a simple overlay operation with the proposed infrastructure map
6 Conclusions
The paper has described a method allowing a spatially resolute and fully variable soil model to be incorporated in a deterministic analysis of seabed slide instability within a GIS. The use of a deterministic analysis needs to be accompanied by other expert-applied assessments; however, a deterministic approach is ultimately required to deliver the numerical information required to perform a quantified project risk assessment.
Minimum FOS<VALUE>1.0 - 1.1
2.0 - 2.51.5 - 2.01.25 - 1.51.1 - 1.25
Critical Shear Depth (m)<VALUE>
1.5 - 3.0
9.0 - 10.57.5 - 9.06.0 - 7.54.5 - 6.03.0 - 4.5
a b
dc
Slope Aspect<VALUE>N - NENE - EE - SESE - SS - SWSW - WW - NWNW - N
Fig. 4 (a) (top left): Seabed terrain image – selected portion of study area, focusing on topographical high and associated scarp. (b) (top right): GIS spatial analysis results for selected area showing color-shaded factor of safety against shallow slope failure. (c) (bottom left): Results showing predicted slide thickness. (d) (bottom right): Results showing slope aspect of slide-susceptible zones
Spatial Analysis of Shallow Slope Instability 375
The ability to capture the full depth variability in the ground model, including strength profile discontinuities, represents a key advance. This approach allows the analysis to estimate the likelihood of slide re-activation as well as new movements. It also allows estimation of slide thickness. Slide thickness is a key parameter used in the soil-structure interaction analysis to assess the damage consequence for sea-bed structures.
Simplifications regarding slide mechanics still currently need to be made in order to implement a deterministic slide analysis in a GIS. However, this compro-mise is balanced by the ability of the method to analyze rapidly such large extents of seabed, while using a more representative ground model. This makes it a cost-effective option for performing parametric sensitivity studies, arguably not possible by any other means.
Acknowledgements The authors acknowledge the valuable opportunities and input given by individuals from external organizations over the years, and the assistance and discussion provided by colleagues in the Fugro Group, together which have enabled the production of this manuscript.
References
Campbell KJ (1984) Predicting offshore soil conditions. Proc Offshore Technol Conf, Houston, Texas.
Dai FC, Lee CF (2001) Terrain-Based Mapping of Landslide Susceptibility using a Geographical Information System: a Case Study. Can Geotech J 38:911–923.
Evans T, Usher N, Moore R (2007) Management of Geotechnical and Geohazard Risks in the West Nile Delta. Proceed 6th Intern Offshore Site Investigation and Geotechnics Conf: Confronting New Challenges and Sharing Knowledge, Soc Underwater Technol, Lond.
Graham J (1984) Methods of Slope Stability Analysis. In: Brunsden D, Prior DB (Eds) Slope Instability, Wiley, New York, pp. 171–215.
Hitchcock C, Givler R, Angell M, Hooper JR (2006) A Pilot Study for Regionally-Consistent Hazard Susceptibility Mapping of Submarine Mudslides. OTC 18323, Proc Offshore Technol Conf, Houston, Texas.
Hooper JR, Prior DB (1989) Regional Analysis of Slope Stability for Deepwater Engineering. Oceans 09, sponsored by the Mar Technol Soc & Oceanic Eng Soc IEEE 5:1536–1540.
Jeanjean P, Liedtke E, Clukey E, Hampson K, Evans T (2005) An Operator’s Perspective on Offshore Risk Assessment and Geotechnical Design in Geohazard-Prone Areas. Frontiers in Offshore Geotech: ISFOG 2005.
Kvalstad T, Gauer P, Kayina AM, Nadim F, Bryn P (2002) Slope Stability at Ormen Lange. Conference Proc Offshore Site Investigation and Geotechnics: Diversity and Sustainability, Soc Underwater Technol, Lond.
Nadim F, Krunic D, Jeanjean P (2003) Probabilistic Slope Stability Analyses of the Sigsbee Escarpment. OTC 15203, Proc Offshore Technol Conf, Houston, Texas.
Orren R, Hamilton I (1998) Frontier Geohazard Site Investigations – Experiences from the Caspian Sea. Offshore Site Investigation and Foundation Behaviour: New Frontiers, Soc Underwater Technol, Lond.
Soeters R, Van Westen CJ (1996) Slope Instability Recognition, Analysis, and Zonation. Landslides: Investigation and Mitigation, NERC Transportation Res Board Spec Rep 247:129–177.

376 B. Mackenzie et al.
Thomas S, Hooper JR, Clare M (2009) Constraining Submarine Geohazards to the Past: A Conceptual Review of the Assessment of the Potential Impact of Submarine Mass Movements on the Planning of Seabed Developments. Proc 4th Intern Symp on Submari Mass Movements and their Consequences, Austin, Texas.
Van Westen CJ, Rengers N, Terlien MTJ, Soeters R (1997) Prediction of the Occurrence of Slope Instability Phenomena through GIS-Based Hazard Zonation. Geologische Rundschau 86:404–414.
Wu W, Sidle R (1995) A Distributed Slope Stability Model for Steep Forested Basins. Water Resour Res 31:2097–2110.
Xie M, Esaki T, Zhou G, Mitani Y (2003) Geographical Information Systems-Based Three-Dimensional Critical Slope Stability Analysis and Landslide Hazard Assessment. J Geotech Geoenviron Eng 129:1109–1118.
Related Documents