The author(s) shown below used Federal funds provided by the U.S. Department of Justice and prepared the following final report: Document Title: Spatial Analysis of Crime in Appalachia: Executive Summary Author(s): James G. Cameron Document No.: 189560 Date Received: August 6, 2001 Award Number: 1999-LT-VX-0001 This report has not been published by the U.S. Department of Justice. To provide better customer service, NCJRS has made this Federally- funded grant final report available electronically in addition to traditional paper copies. Opinions or points of view expressed are those of the author(s) and do not necessarily reflect the official position or policies of the U.S. Department of Justice.

Welcome message from author
This document is posted to help you gain knowledge. Please leave a comment to let me know what you think about it! Share it to your friends and learn new things together.
Transcript

The author(s) shown below used Federal funds provided by the U.S.Department of Justice and prepared the following final report:
Document Title: Spatial Analysis of Crime in Appalachia:Executive Summary
Author(s): James G. Cameron
Document No.: 189560
Date Received: August 6, 2001
Award Number: 1999-LT-VX-0001
This report has not been published by the U.S. Department of Justice.To provide better customer service, NCJRS has made this Federally-funded grant final report available electronically in addition totraditional paper copies.
Opinions or points of view expressed are thoseof the author(s) and do not necessarily reflect
the official position or policies of the U.S.Department of Justice.

A Spatial Analysis of Crime in Appalachia By James G. Cameron
ISSUES AND FINDINGS
Discussed in this Brief: A research project designed to demonstrate the contributions that Geographic Information Systems (GIS) and spatial analysis procedures can make to the study of crime patterns in a largely nonmetropolitan region of the United States. The project examines the extent to which the relationship between various structural factors and crime vary across metropolitan and nonmetropolitan locations in Appalachia between 1980 and 1990. Exploratory spatial data analysis (ESDA) and confirmatory spatial data analysis (CSDA) procedures are also applied to identify patterns of spatial autocorrelation and spatial heterogeneity in the distribution of crime.
Key Issues: One common denominator throughout much of the empirical work on aggregate patterns of crime is an almost exclusive focus on urban and metropolitan settings. By comparison, there have been relatively few attempts to look at rural or nonmetropolitan crime. The spatial dynamics of crime in nonmetropolitan locations can be understood as a product of social, economic, and demographic influences, that are often unique to those areas. Thus there is a need for research on nonmetropolitan crime that takes location and geographic context seriously. In this report, GIS and spatial analysis applications are used to examine the effects of location in a more systematic way. t
Key Findings: Integrating georeferenced data from the FBI Uniform Crime Reports, the Decennial Census of the United States, The Department of Agriculture, and the Appalachian Regional Commission into a GIS database, it was found that:
0 Appalachia is a region characterized by a substantial amount of demographic diversity and socioeconomic change. This study documents the large and often growing spatial inequalities in aggregate characteristics and indicators of well being between counties and subregions. Economic decline and population loss in
Nevertheless, a majority of Appalachia’s population continues to reside in counties characterized by economic distress and poverty. In spite of growing diversity in the region, a majority of the population resides in counties designated as having a distress ranking characterized by one or more of the following: at least 150 percent of the U.S. unemployment rate, at least 150 percent of the U.S. unemployment rate, or less than 67 percent of the U.S. per capita market income. Regional crime rates in Appalachia are lower than those for the nation as a whole. While the social and economic distress experienced by much of Appalachia would seem to make the region particularly vulnerable to increasing rates of crime and violence, crime rates in Appalachia are only about 50 percent (for violent crime) to 65 percent (for property crime) of the national levels.
2 j
5% ~ $ ;2: one location is often offset by economic vitality and population growth in another. 0
(A m
-I
PROPERTY QF N a t i ~ ~ - ~ . l Criminal Justice Reference service (NCJRS)
Rockvdle. h4D 20849-tjoo~ A- - 1 Box6000
This document is a research report submitted to the U.S. Department of Justice. This report has not been published by the Department. Opinions or points of view expressed are those of the author(s) and do not necessarily reflect the official position or policies of the U.S. Department of Justice.
e Crime has been increasing at a faster rate in Appalachia than for the nation as a whole. Between 1980 and 1995, violent crime rates have increased from 47 percent to 53 percent of the national average and property crime rates have increased from 58 percent to 65 percent of the national average. Furthermore, between 1980 and 1995, violent crime exhibited a substantially larger percentage increase than property crime throughout the region. The spatial autocorrelation patterns of both violent crime and property crime indicate that these spatial patterns are not random. In some locations, the spatial autocorrelation of crime remains significant even across several levels of contiguity. These patterns of spatial autocorrelation persist even after controlling for the effects of various structural factors. This indicates that crime rates are influenced by more than just the internal characteristics of any given location. Instead, levels of crime are strongly influenced by conditions in neighboring locations as well. The spatial autocorrelation patterns for violent crime are indicative of a possible diffusion process. While violent crime has steadily decreased in larger metropolitan areas, large percentage increases have been taking place in nonmetropolitan counties adjacent to metro locations as well as in completely rural counties. There are significant model outcome differences for metropolitan and nonmetropolitan locations. Significant coefficient differences between metropolitan and nonmetropolitan locations provide evidence of substantial spatial heterogeneity based on spatial scale. These model outcome differences
ad ica t e that different mechanisms may be operating with regard to levels of violent crime and property crime in metropolitan and nonmetropolitan locations. There are significant subregional differences in model outcomes for structural effects as well as spatial effects. In addition to subregional differences in the effects of various demographic and socioeconomic predictors of crime, there are also significant subregional differences in the clustering and spread of crime.
e
e
0
0
INTRODUCTION
The search for relationships between the ecological characteristics of places and levels of crime has a long and rich history in criminological research. Theoretical traditions rooted in social disorganization, economic strain, and spatial inequality have established a number of structural characteristics that vary systematically between locations and which are often highly correlated with rates of serious crime. The structural factors used to explain variations in crime often include measures of stratification (poverty, income inequality, residential segregation), racial composition (percent black, racial and ethnic diversity), and social disorganization (family disruption, residential mobility, unemployment).
The focus of this report is on the application of Geographic Information System (GIS) technologies and spatial analysis procedures to the study of aggregate crime patterns in Appalachia. The main advantage of using GIS and related technologies is that it enables the researcher to look more rigorously at the spatial patterns and ecological contexts of
2
This document is a research report submitted to the U.S. Department of Justice. This report has not been published by the Department. Opinions or points of view expressed are those of the author(s) and do not necessarily reflect the official position or policies of the U.S. Department of Justice.
crime. Just as longitudinal study designs allow the researcher to take the dimension of time seriously, so does the use of GIS and spatial analytic procedures allow the researcher to take the dimension of space seriously. A common theme in the work of those who use GIS technologies is an appreciation for the fact that spatial and ecological analysis is not merely a poor substitute for individual-level analysis. Rather, the geographic context is seen as important in its own right as a distinct source of influences, outcomes, and structural effects. Thus the most obvious advantage of using GIS throughout the data analysis process is that it gives the researcher an opportunity to examine the effects of location in a more systematic way. In addition, the analytical applications of GIS can be used in either an exploratory or confirmatory capacity. As an exploratory data analysis tool, GIS can be used to examine data visually, as a way of generating new hypotheses from the data, or as a way of identifying unexpected spatial patterns. As a confirmatory data analysis tool, GIS has been given increased analytical power with the introduction and development of various spatial statistical packages.
To investigate the spatial patterns of crime for this project, a georeferenced data set has been compiled at the county level for each of the 399 counties comprising the Appalachian Region. The data comes from numerous secondary data sources including the FBI Uniform Crime Reports, the Decennial Census of the United States, the Department of Agriculture, and the Appalachian Regional Commission. Dependent variables are the index crime rates derived from the Uniform Crime Reports, with separate analyses for violent cnme and property crime. Independent and contextual variablGs include: +
Appalachian Subregions consisting of North, Central, and South Appalachia
Beale County Code Classifications based on metro-nonmetro distinctions, population size, and adjacency to metropolitan areas
Distressed County Indicators based on measures of poverty, unemployment, and per capita income
Demographic Distribution Indicators including population size and metro- nonmetro Census classifications
Demographic Change Indicators including population growth and residential mobility
Demographic Composition Indicators including age structure and racial/ethnic diversity
Social Well-Being Indicators including educational attainment, family stability, and changing household structures
Socioeconomic Indicators including poverty, unemployment, and changing industrial composition
Appalachia has historically been identified as a region plagued by poverty and related social problems. While poverty and economic disadvantage have traditionally been
3
This document is a research report submitted to the U.S. Department of Justice. This report has not been published by the Department. Opinions or points of view expressed are those of the author(s) and do not necessarily reflect the official position or policies of the U.S. Department of Justice.
linked to crime in the social ecology literature, the spatial pattern of this relationship is often complex. Furthermore, most of this literature has been limited to urban crime and it may be that the link between poverty and crime is different in urban and rural areas. Appalachia poses the additional challenge of being a region characterized by a rich diversity of people and places. Economic depression in one location may be offset by economic growth in another. This rich diversity in topography, economic variability, and demographic change are what make Appalachia such a challenging region to characterize with regard to shifting patterns of crime.
DEMOGRAPHIC AND SOCIOECONOMIC PROFILE
Appalachia’s character varies widely by subregion, evidenced by substantial variations in population growth, population composition, social well-being, and economic conditions. Nevertheless, certain key patterns can also be discerned.
Areas experiencing population decline are often characterized by declines in social and economic well-being as well. Residents in these areas have low levels of educational attainment, high unemployment, and high rates of poverty. Industrial restructuring is often characterized by the loss of key industries, usually in mining or manufacturing, without corresponding shifts to comparable jobs in other sectors. Counties experiencing demographic, social, and economic decline are:
0 more likely to be found in Central Appalachia, 0 more likely to be rural and not adjacent to metropolitan areas, 0 &ore likely to be reliant on mining and extractive industries, and 0 more likely to be defined as Distressed Counties.
Approximately 10 percent of the population in Appalachia resides in these counties.
Other parts of the region, on the other hand, have experienced rapid demographic, social, and economic growth. These areas are often characterized by high levels of educational attainment, low unemployment and low rates of poverty. Industrial restructuring is characterized by relatively smooth transitions from goods producing to services producing economies. Counties experiencing rapid growth are:
0
0
more likely to be found in Southern Appalachia, especially near the larger metropolitan areas, and more likely to be defined as Competitive and Attainment Counties.
About 25 percent of the population in Appalachia resides in these counties.
While parts of the Region are experiencing growing spatial inequalities characterized by tremendous economic, social, and demographic disparities, at least 65 percent of the population live in counties lying somewhere between these extremes. Yet it is also true that a majority of Appalachia’s population continues to reside in counties designated as having a distress ranking characterized by one or more of the following characteristics: at least 150 percent of the U.S. unemployment rate, at least 150 percent of the U.S. poverty rate, or less than 67 percent of the U.S. per capita market income. While there does appear to be some shifting of the population towards economically prosperous locations,
4
This document is a research report submitted to the U.S. Department of Justice. This report has not been published by the Department. Opinions or points of view expressed are those of the author(s) and do not necessarily reflect the official position or policies of the U.S. Department of Justice.

a majority still lives in substantial poverty and economic hardship compared with the rest of the nation.
All Index Crimes
CRIME IN APPALACHIA: A DESCRIPTIVE OVERVIEW
While crime in Appalachia is low compared to national averages (see Exhibit l), part of this is due to the predominately nonmetropolitan character of the Region. Crime levels in nonmetropolitan areas in every part of the country are almost always well below those of metropolitan locations. Nevertheless, crime rate patterns over time also suggest that crime has been increasing at a faster rate in Appalachia than for the nation as a whole. Between 1980 and 1995, violent crime rates have increased from 47 percent to 53 percent of the national average and property crime rates have increased from 58 percent to 65 percent of the national average (see Exhibit 2). Furthermore, between 1980 and 1995, violent crime has exhibited a substantially larger percentage increase than property crime throughout the region (see Exhibit 3).
Exhibit 1. Crime Rates in Appalachia (U.S.): 1980,1990 and 1995 1980 1990 1995
3284.6 (5786.4) 3458.5 (6230.2) 3421.0 (5385.6) Violent Crimes Murder
261.1 (561.3) 356.1 (739.4) 376.6 (710.8) 6.7 (10.1) 5.8 (9.6) 5.2 (8.6)
Rape Robbary Assault
Burglary Larceny Auto Theft
a Property Crimes
Exhibit 2. Crime Rates in Appalachia as Percentage of U.S. Rates:
a
17.2 (36.0) 26.4 (39.4) 26.3 (37.5) 75.7 (226.9) 80.5 (266.1) 83.6 (236.8)
161.6 (288.3) 243.3 (424.4) 261.5 (427.8) 3023.5 (5225.1) 3102.4 (5490.8) 3044.4 (4674.8) 968.4 (1621.7) 853.1 (1276.8) 712.4 (1016.3)
1785.5 (3123.9) 1957.3 (3399.1) 2080.6 (3068.5) 269.7 (479.4) 292.0 (8 14.9) 25 1.3 (590.0)
5
This document is a research report submitted to the U.S. Department of Justice. This report has not been published by the Department. Opinions or points of view expressed are those of the author(s) and do not necessarily reflect the official position or policies of the U.S. Department of Justice.
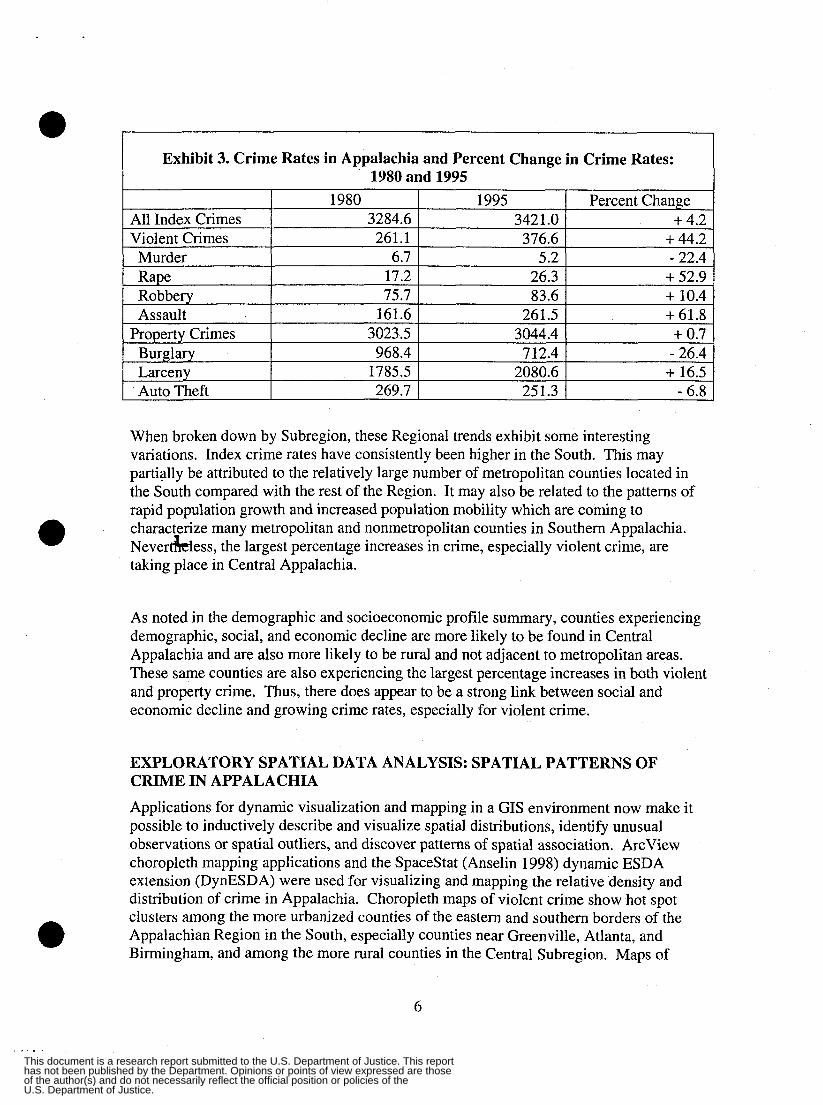
1980 1995 I Percent Change All Index Crimes Violent Crimes
3284.6 342 1 .O + 4.2 261.1 376.6 + 44.2
Murder Rape
When broken down by Subregion, these Regional trends exhibit some interesting variations. Index crime rates have consistently been higher in the South. This may partially be attributed to the relatively large number of metropolitan counties located in the South compared with the rest of the Region. It may also be related to the patterns of rapid population growth and increased population mobility which are coming to characterize many metropolitan and nonmetropolitan counties in Southern Appalachia. Neverhess , the largest percentage increases in crime, especially violent crime, are taking place in Central Appalachia.
6.7 5.2 - 22.4 17.2 26.3 + 52.9
As noted in the demographic and socioeconomic profile summary, counties experiencing demographic, social, and economic decline are more likely to be found in Central Appalachia and are also more likely to be rural and not adjacent to metropolitan areas. These same counties are also experiencing the largest percentage increases in both violent and property crime. Thus, there does appear to be a strong link between social and economic decline and growing crime rates, especially for violent crime.
Robbery Assault
EXPLORATORY SPATIAL DATA ANALYSIS: SPATIAL PATTERNS OF CRIME IN APPALACHIA Applications for dynamic visualization and mapping in a GIS environment now make it possible to inductively describe and visualize spatial distributions, identify unusual observations or spatial outliers, and discover patterns of spatial association. ArcView choropleth mapping applications and the Spacestat (Anselin 1998) dynamic ESDA extension (DynESDA) were used for visualizing and mapping the relative density and distribution of crime in Appalachia. Choropleth maps of violent crime show hot spot clusters among the more urbanized counties of the eastern and southern borders of the Appalachian Region in the South, especially counties near Greenville, Atlanta, and Birmingham, and among the more rural counties in the Central Subregion. Maps of
75.7 83.6 + 10.4 161.6 261.5 + 61.8
6
Property Crimes Burglary Larceny Auto Theft
3023.5 3044.4 + 0.7
1785.5 2080.6 + 16.5 968.4 7 12.4 - 26.4
269.7 25 1.3 - 6.8
This document is a research report submitted to the U.S. Department of Justice. This report has not been published by the Department. Opinions or points of view expressed are those of the author(s) and do not necessarily reflect the official position or policies of the U.S. Department of Justice.
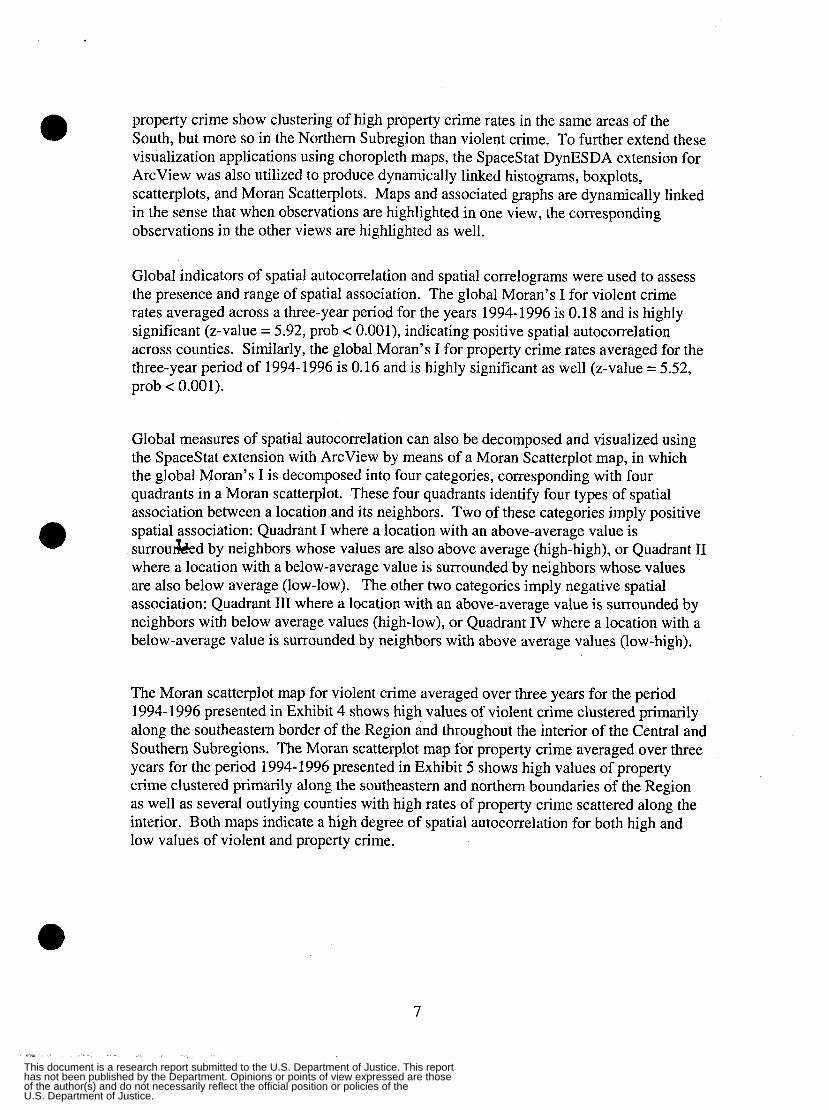
property crime show clustering of high property crime rates in the same areas of the South, but more so in the Northern Subregion than violent crime. To further extend these visualization applications using choropleth maps, the Spacestat DynESDA extension for ArcView was also utilized to produce dynamically linked histograms, boxplots, scatterplots, and Moran Scatterplots. Maps and associated graphs are dynamically linked in the sense that when observations are highlighted in one view, the corresponding observations in the other views are highlighted as well.
Global indicators of spatial autocorrelation and spatial correlograms were used to assess the presence and range of spatial association. The global Moran’s I for violent crime rates averaged across a three-year period for the years 1994-1996 is 0.18 and is highly significant (2-value = 5.92, prob < O.OOl), indicating positive spatial autocorrelation across counties. Similarly, the global Moran’s I for property crime rates averaged for the three-year period of 1994-1996 is 0.16 and is highly significant as well (z-value = 5.52, prob < 0.001).
Global measures of spatial autocorrelation can also be decomposed and visualized using the Spacestat extension with ArcView by means of a Moran Scatterplot map, in which the global Moran’s I is decomposed into four categories, corresponding with four quadrants in a Moran scatterplot. These four quadrants identify four types of spatial association between a location and its neighbors. Two of these categories imply positive spatial association: Quadrant I where a location with an above-average value is s u r r o u h d by neighbors whose values are also above average (high-high), or Quadrant I1 where a location with a below-average value is surrounded by neighbors whose values are also below average (low-low). The other two categories imply negative spatial association: Quadrant I11 where a location with an above-average value is surrounded by neighbors with below average values (high-low), or Quadrant IV where a location with a below-average value is surrounded by neighbors with above average values (low-high).
The Moran scatterplot map for violent crime averaged over three years for the period 1994-1996 presented in Exhibit 4 shows high values of violent crime clustered primarily along the southeastern border of the Region and throughout the interior of the Central and Southern Subregions. The Moran scatterplot map for property crime averaged over three years for the period 1994-1996 presented in Exhibit 5 shows high values of property crime clustered primarily along the southeastern and northern boundaries of the Region as well as several outlying counties with high rates of property crime scattered along the interior. Both maps indicate a high degree of spatial autocorrelation for both high and low values of violent and property crime.
7
This document is a research report submitted to the U.S. Department of Justice. This report has not been published by the Department. Opinions or points of view expressed are those of the author(s) and do not necessarily reflect the official position or policies of the U.S. Department of Justice.
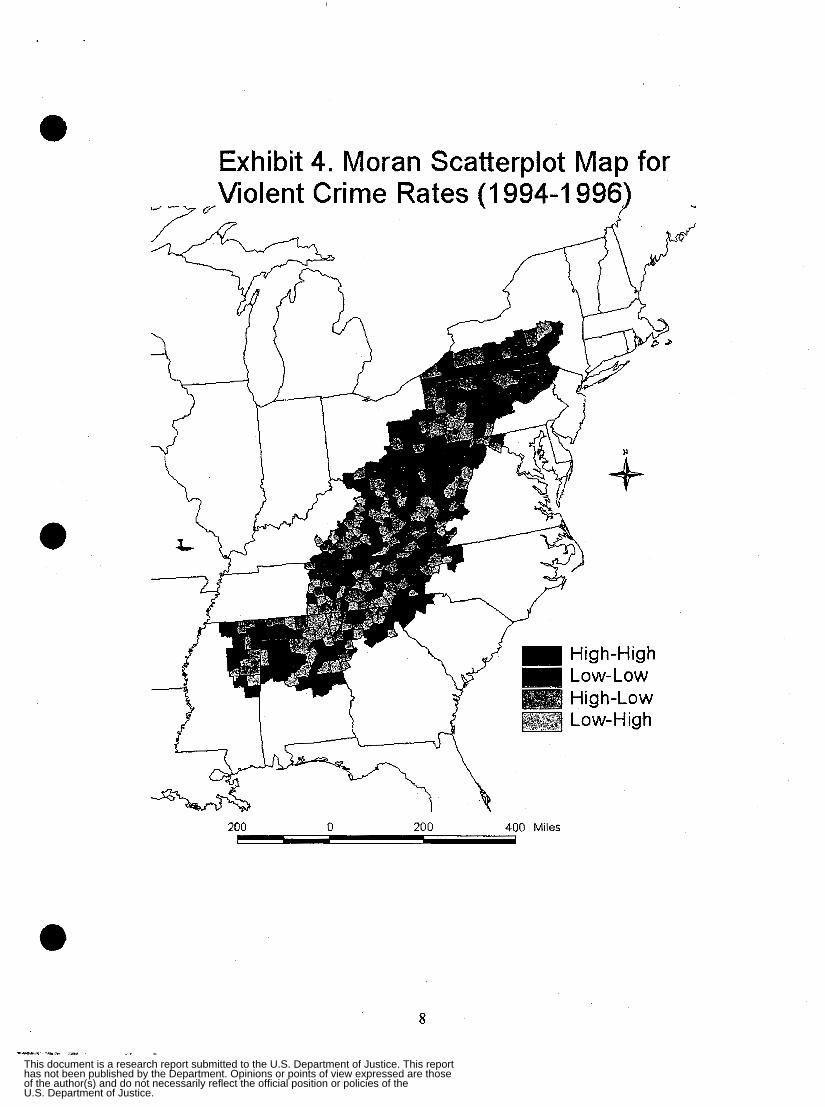
Exhibit 4. Moran Scatterplot Map for Violent Crime Rates (I 994-1 996)
%
d
200 0 20 0 400 Miles
8
This document is a research report submitted to the U.S. Department of Justice. This report has not been published by the Department. Opinions or points of view expressed are those of the author(s) and do not necessarily reflect the official position or policies of the U.S. Department of Justice.
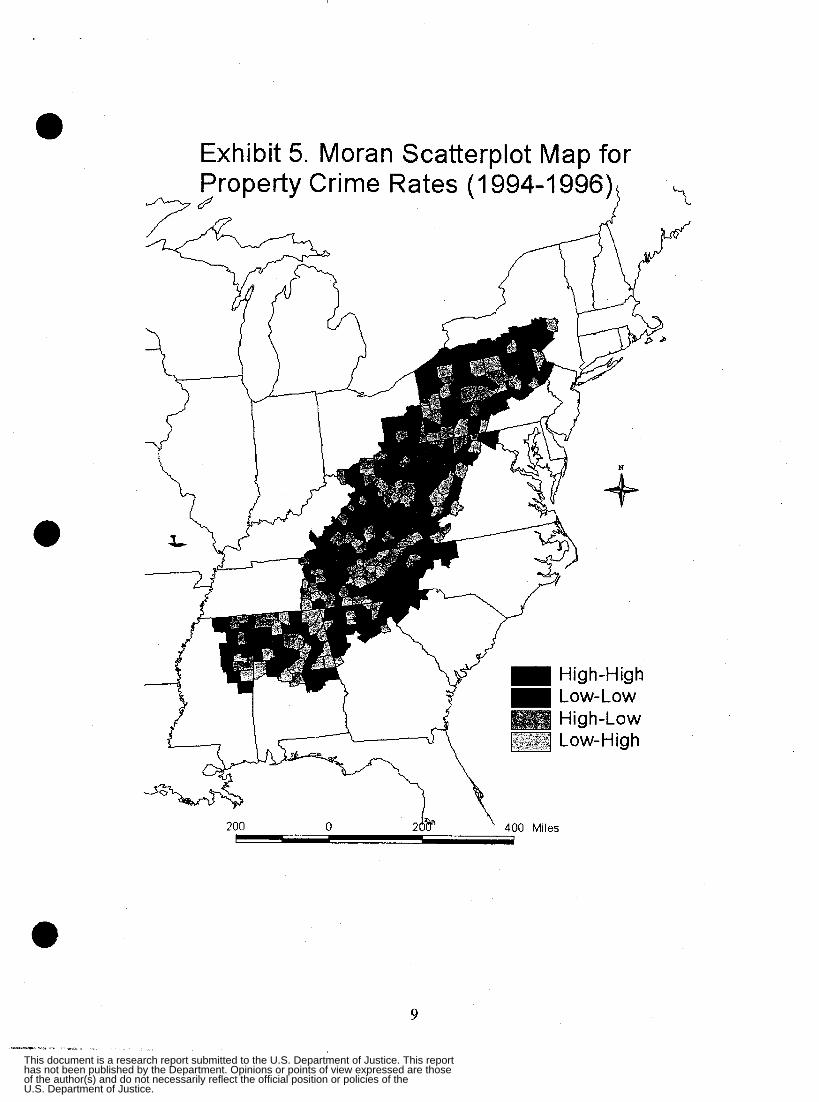
Exhibit 5. Moran Scatterplot Map for Property Crime Rates (I 994-1 996)
*# d
9
This document is a research report submitted to the U.S. Department of Justice. This report has not been published by the Department. Opinions or points of view expressed are those of the author(s) and do not necessarily reflect the official position or policies of the U.S. Department of Justice.

Spatial correlograms were also used to model the spatial-temporal patterns of crime across different levels of contiguity. Moran’s I coefficients (standardized as z-values) were graphed at increasing levels of contiguity to reveal the extent to which spatial autocorrelation varies and changes according to distance. By plotting correlograms separately for each Subregion, it also becomes possible to identify whether there is evidence of spatial heterogeneity in the data. In the Northern Subregion, there is a steady decline in the spatial autocorrelation of violent crime over time, with autocorrelation patterns approaching nonsignificance for all levels of contiguity by 1995. While property crime continues to exhibit significant positive spatial autocorrelation up to the third level of contiguity, there is a visible decline in the strength of this relationship over time. In the Central Subregion, the spatial autocorrelation measures for violent crime increase across the first three levels of contiguity between 1980 and 1990, peaking at the third level of contiguity. This may point to a diffusion process operating between 1980 and 1990. Between 1990 and 1995, however, the spatial autocorrelation of violent crime in Central Appalachia slips into nonsignificance. Property crime in the Central Subregion, on the other hand, exhibits no significant spatial autorrelation patterns for any of the three time periods. In the Southern Subregion, the spatial autocorrelation of violent crime increases slightly between the first two levels of contiguity over time. The spatial autocorrelation of property crime, while stronger than that of violent crime, exhibits a similar pattern of increase between the first two levels of contiguity over time as well.
With larger data sets, the assessment of global spatial autocorrelation needs to be supplemented by local measures of spatial dependence as well. According to Anselin (1995)&ocal indicators of spatial autocorrelation achieve two objectives: (1) they can be used to identify significant patterns of spatial association around individual locations, such as hot spots or spatial outliers; and (2) they can be used to assess the extent to which the global pattern of spatial association is spread uniformly throughout the data or whether there are significant types of locations affecting the computation of Moran’s I. Measures of local spatial autocorrelation can be visualized by means of LISA local Moran maps. The local Moran map for violent crime shows that a significant clustering pattern is present in two locations, both located in the South near Greenville and Birmingham. The local Moran map for property crime echoes the patterns found on the local Moran map for violent crime with the addition of a third cluster further north near the Virginia-West Virginia border.
At least two summary findings emerge from this application of ESDA to county-level rates of violent and property crime in Appalachia. First, the strong spatial autocorrelation patterns of both violent and property crime indicate clearly that these spatial patterns are not random. In some locations, the spatial autocorrelation of crime remains significant even across several levels of contiguity. Spatially significant clusters of both violent and property crime are also observed in many of the mapping applications. This robust and significant relationship across several “high crime” clusters thus provides empirical support for the hypothesis that the spatial patterns of violent and property crime are positively related to the unique characteristics and spatial proximity of particular locations. Second, while significant spatial autocorrelation trends are evident in several “high profile” locations throughout the Region, substantial Subregional variations in the
10
This document is a research report submitted to the U.S. Department of Justice. This report has not been published by the Department. Opinions or points of view expressed are those of the author(s) and do not necessarily reflect the official position or policies of the U.S. Department of Justice.

spatial-temporal patterns of violent and property crime exist as well. This indicates that perhaps different spatial processes may be operating in different Subregional locations. Thus, the data also provide empirical support for the hypothesis that spatial and temporal patterns of violent and property crime vary by Subregional location.
CONFIRMATORY SPATIAL DATA ANALYSIS: SPATIAL REGRESSION MODELS OF CRIME
GIS offers opportunities for enhanced spatial modeling through the use of confirmatory spatial data analysis (CSDA) procedures. According to Anselin and Getis (1992), the standard tools of CSDA consist of four broad categories of methods: (1) diagnostics for the presence of spatial dependence and spatial heterogeneity in regression analysis; (2) methods to estimate regression models that explicitly take into account spatial effects; (3) methods to estimate models that are robust to the presence of spatial effects; and (4) spatial measures of model validity.
In spatial regression analysis, two methodological concerns are central to the specification of appropriate models: (1) testing for spatial dependence by means of appropriate diagnostics for spatial lag and spatial error effects, and (2) implementing alternative estimation techniques when structural instability and spatial heterogeneity occur in the data. Models for spatial heterogeneity were implemented by jointly estimating coefficients for metropolitan and nonmetropolitan locations. Although not shown here, additional tests for spatial heterogeneity were also implemented by jointly e s t imam coefficients for each of the three Subregions as well.
Bivariate Model Results Spacestat software (Anselin 1998) in an ArcView GIS environment was used to run a series of bivariate regression models regressing both violent crime rates and property crime rates for 1980 and 1990 on: residential mobility, percent Black, percent of the population ages 15 to 29, High School drop-out rates, percent divorced, percent female headed households, percent unemployed, and percent of families below poverty. For violent crime, the nonspatial OLS results indicate that percent Black, percent divorced, and percent female headed households are positively related to violent crime in both 1980 and 1990. These are all significant predictors of violent crime in both metropolitan and nonmetropolitan locations. Residential mobility and percent of families below poverty, on the other hand, are not significant predictors of violent crime in either metro or nonmetro locations. Percent of the population ages 15 to 29 becomes less significant as a predictor of violent crime in metropolitan areas between 1980 and 1990 but substantially increases as a predictor of violent crime in nonmetropolitan locations between1980 and 1990. High School drop-out rates and percent unemployed are negatively related to violent crime in metropolitan locations only. The negative relationship between these proxies for relative resource deprivation and levels of crime are surprising, but it may be family and community stability are more directly related to levels of crime while these indicators of relative resource deprivation are operating indirectly through family and community stability.
This document is a research report submitted to the U.S. Department of Justice. This report has not been published by the Department. Opinions or points of view expressed are those of the author(s) and do not necessarily reflect the official position or policies of the U.S. Department of Justice.

The Lagrange Multiplier (LM) tests for the presence of spatial autocorrelation are significant for the presence of both spatial lag and spatial error autocorrelation in every case. When tests for both spatial lag and spatial error dependence have high values, the one with the highest value will tend to indicate the correct alternative. For four of the models (percent black, High School drop out rates, percent divorced, and percent female headed households) the spatial error model is specified as the correct model, while for the other four models (residential mobility, percent ages 15 to 29, percent unemployed, and percent of families below poverty) the spatial lag model is the more appropriate alternative. When the LM tests provide stronger evidence for the spatial lag model, spatial autocorrelation takes on more substantive meaning and must be modeled with a lag specification for the dependent variable. The inclusion of a spatial lag operator in the model indicates the presence of significant spatial autocorrelation effects in the dependent variable so that violent crime rates in one location are significantly and positively related to property crime rates in neighboring locations, even after controlling for the effects of the other predictor(s) in the model.
For property crime, the nonspatial OLS regression models again indicate slightly different outcomes for metropolitan and nonmetropolitan locations. While percent Black and percent female headed households are positively related to property crime in metropolitan areas, residential mobility (in 1980) is positively related to property crime in nonmetropolitan locations only. These findings are further substantiated by the significant Chow test results for the stability of the individual coefficients across metro- nonmetro locations in these models.
The LM tests for the presence of spatial autocorrelation are significant for the presence of both spatial lag and spatial error autocorrelation for all models. For each of these models, the spatial lag model is also specified as the more appropriate alternative. Nevertheless, substantial spatial error effects remain for five of the eight models (residential mobility, percent ages 15 to 29, High School drop out rates in 1980, percent divorced in 1980, and percent unemployed), even in the presence of significant spatial lag terms. For all but one of these (percent ages 15 to 29), the residual spatial error effects can partially be accounted for by significant lagged predictors in the OLS spatial predictor models. For these models with significant spatially lagged predictor variables, the need for a mixed model is also substantiated by significant results on the tests for the Common Factor Hypothesis.
t
The spatial lag models indicate that property crime is significantly and positively related to property crime in neighboring locations, even after controlling for the effects of the predictor variable of interest in each of the bivariate models where a spatial lag model is designated. In the spatial predictor models, the significance of the spatially lagged predictor variables provide evidence for significant spatial effects operating through both the dependent and independenr variables. Interestingly, the “local” effects of percent Black, percent divorced, and percent female headed households on property crime is positive, while the “neighborhood effects” of the surrounding counties is negative. On the other hand, the “local” effects of High School drop out rates and percent of families below poverty on property crime is negative, while the “neighborhood effects” of the
12
This document is a research report submitted to the U.S. Department of Justice. This report has not been published by the Department. Opinions or points of view expressed are those of the author(s) and do not necessarily reflect the official position or policies of the U.S. Department of Justice.
surrounding counties is positive. This type of reversal in spatial effects may indicate a type of buffering effect in the case where the relationship goes from positive to negative. In the case where spatial effects go from negative in the “local” context to positive in the “neighborhood” context, this may point to a type of diffusion process operating across county boundaries. In either case, significant spatial lag terms for the explanatory variables provide evidence for substantial “spillover” effects with regard to the relationship between dependent and independent variables and the degree to which they may covary spatially.
Multivariate Model Results
In developing the multivariate models, two concerns were addressed. First, the high degree of multicollinearity between several variables necessitated using a reduced number of predictors. Due to the relative racial homogeneity of the nonmetropolitan parts of the Region, as well as multicollinearity issues, percent Black was dropped from the multivariate models. The high degree of multicollinearity between unemployment and poverty, and the theoretical interest in the role of poverty on crime in Appalachia, resulted in the unemployment rate being omitted from the multivariate models also. Finally, population size was included instead of residential mobility in order to capture differences within, as well as between, metropolitan and nonmetropolitan categories. Second, evidence of positive spatial autocorrelation necessitated the use of spatial diagnostics in order to investigate the extent to which this spatial dependence may be explained by the various structural covariates in the multiple regression models. As with the bivziate regression models, this is accomplished by testing for the presence of residual spatial autocorrelation and evaluating whether this indicates the presence of spatial error or spatial lag effects.
As shown in Exhibit 6, the OLS models for violent crime in 1980 and 1990 show consistent positive effects for population size and percent female headed households in both metropolitan and nonmetropolitan locations. In metropolitan locations, the High School drop out rate goes from nonsignificance in 1980 to positive significance in 1990, while the divorce rate goes from positive significance in 1980 to nonsignificance in 1990. In nonmetropolitan locations, both the percent of the population ages 15 to 29 and the High School drop out rate go from nonsignificance in 1980 to positive significance in 1990, while the divorce rate goes from positive significance in 1980 to nonsignificance in 1990. The negative coefficients for the percent of families below poverty is counterintuitive but may suggest that higher poverty rates are correlated with reduced opportunities for violent crime once other indicators of social and economic deprivation are controlled for.
The spatial Chow tests for the stability of individual coefficients across metropolitan- nonmetropolitan locations show significant differences between metropolitan and nonmetropolitan counties for the effects of percent of the population ages 15 to 29 and percent female headed households on violent crime in 1980 and for the effects of population size, percent of the population ages 15 to 29, percent female headed households, and percent of families below poverty on violent crime in 1990. These
13
This document is a research report submitted to the U.S. Department of Justice. This report has not been published by the Department. Opinions or points of view expressed are those of the author(s) and do not necessarily reflect the official position or policies of the U.S. Department of Justice.

diagnostics substantiate significant model outcome differences between metropolitan and nonmetropolitan locations and thus point to the need to adequately model variation across metro-nonmetro categories.
The Lagrange Multiplier (LM) tests for the presence of spatial autocorrelation indicate the need for a spatial error specification in 1980 but a spatial lag model in 1990. The change from a spatial error specification in 1980 to a spatial lag specification in 1990 suggests that a process of diffusion may be operating with regard to violent crime. Specifically, the evidence from the spatial diagnostics and the estimates of the spatial models reveal a high degree of spatial autocorrelation in the data, even after controlling for the effects of various demographic and socioeconomic predictors of violent crime. Furthermore, this process appears to be increasing over time, indicating a pattern of increased clustering and outward spread.
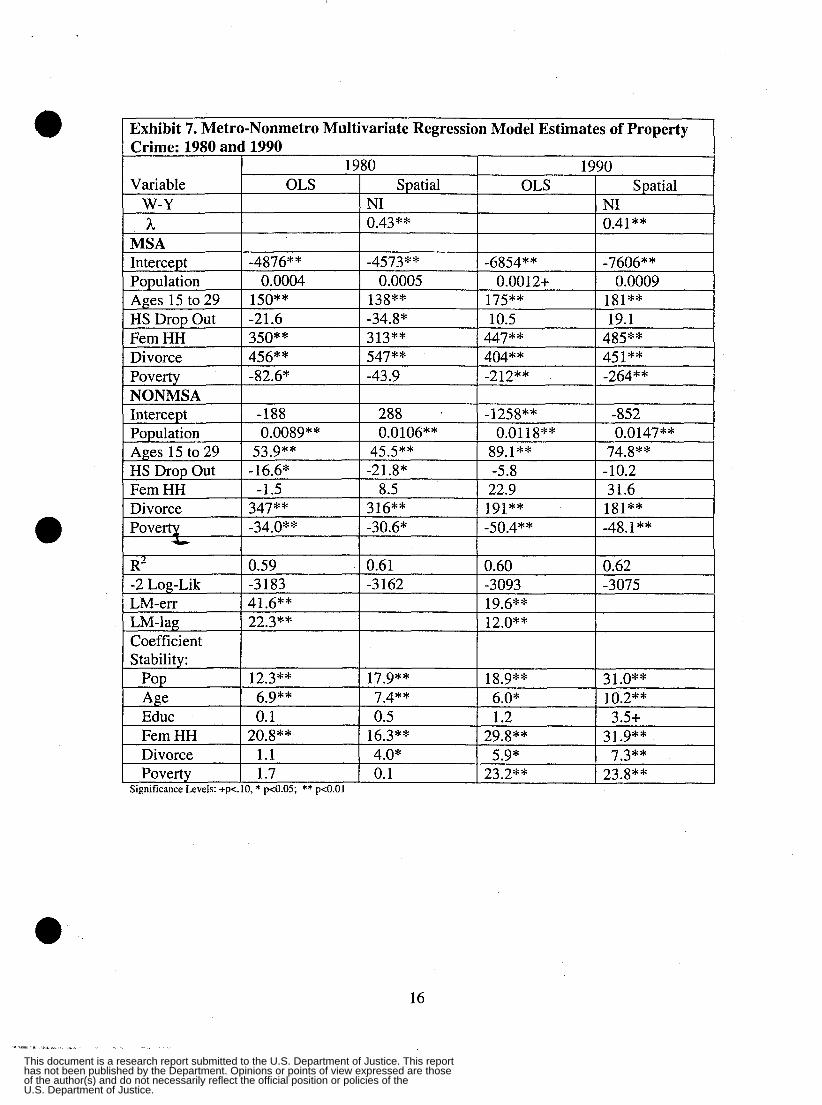
Exhibit 7 contains the OLS and spatial multivariate models regressing property crime rates on population size, percent of the population ages 15 to 29, High School drop out rates, percent female headed households, divorce rates, and poverty rates for 1980 and 1990 across metropolitan and nonmetropolitan locations. The OLS models for 1980 and 1990 show consistent positive effects for percent ages 15 to 29 and the divorce rate and consistent negative effects for the poverty rate in both metropolitan and nonmetropolitan locations. In metropolitan locations, there are also consistent positive effects for percent female headed households. In nonmetropolitan locations, there are also consistent positive effects for population size, while the High School drop out rate goes from negatissignificance in 1980 to nonsignificance in 1990.
The spatial Chow tests for the stability of individual coefficients across metropolitan- nonmetropolitan locations show significant differences between metropolitan and nonmetropolitan counties for the effects of population size, percent of the population ages 15 to 29, and percent female headed households on property crime in 1980 and for the effects of population size, percent of the population ages 15 to 29, percent female headed households, the divorce rate, and percent of families below poverty on property crime in 1990. Again, as with the metro-nonmetro model outcomes for violent crime, these diagnostics substantiate significant model outcome differences between metropolitan and nonmetropolitan locations and thus point to the need to adequately model variation across metro-nonmetro categories.
The Lagrange Multiplier (LM) tests for the presence of spatial autocorrelation indicate the need for a spatial error specification in both 1980 and 1990. The evidence from the spatial diagnostics thus suggest that a lag, or diffusion process, better describes violent crime patterns than property crime patterns in Appalachia for the periods under study. While there is evidence of substantial spatial autocorrelation for violent crime rates in the sense that levels of violent crime in neighboring locations affect one another, the spatial autocorrelation for property crime is primarily limited to the error term. This suggests that the appearance of spatial clustering for property crime results primarily from a spatial similarity in the ignored variables represented by the error term.
14
This document is a research report submitted to the U.S. Department of Justice. This report has not been published by the Department. Opinions or points of view expressed are those of the author(s) and do not necessarily reflect the official position or policies of the U.S. Department of Justice.

Significance Levels: +p<.10, * p<0.05; ** p<O.Ol
15
This document is a research report submitted to the U.S. Department of Justice. This report has not been published by the Department. Opinions or points of view expressed are those of the author(s) and do not necessarily reflect the official position or policies of the U.S. Department of Justice.
Variable w-Y h
MSA
1980 1990 OLS Spatial OLS Spatial
NI NI 0.43"" 0.41""
Intercept Population
-4876"" -4573"" -6854"" -7606"" 0.0004 0.0005 0.0012+ 0.0009
16
Educ Fern HH
0.1 0.5 1.2 3.5+ 20.8"" 16.3"" 29.8"" 31.9""
Divorce Poverty
1.1 4.0" 5.9" 7.3"" 1.7 0.1 23.2"" 23.8**
This document is a research report submitted to the U.S. Department of Justice. This report has not been published by the Department. Opinions or points of view expressed are those of the author(s) and do not necessarily reflect the official position or policies of the U.S. Department of Justice.

Summary The application of confirmatory spatial data analysis (CSDA) procedures to county-level rates of violent and property crime in Appalachia yield several summary findings. First, neither violent crime nor property crime is randomly distributed geographically. For both 1980 and 1990, county-level crime rates exhibit significant positive spatial autocorrelation patterns. Both the spatial regression modeling results, as well as the exploratory spatial data analysis (ESDA) applications, reveal a distinct pattern of spatial clustering and spread in the data. Although the spatial autocorrelation patterns for violent crime are more substantial than those for property crime, both types of crime exhibit significant spatial groupings characterized by regional hot spots and shifting concentrations of crime density.
Second, these patterns of spatial autocorrelation persist even after controlling for a number of theoretically relevant demographic and socioeconomic predictors of crime. This suggests that crime rates are influenced by more than just the internal characteristics of any given location. Instead, levels of crime are strongly affected by conditions in neighboring locations as well. This means that modeling efforts must explicitly include spatial parameters in the form of either spatial error or spatial lag specifications in order to adequately capture these spatial autocorrelation effects.
Third, after controlling for the effects of these demographic and socioeconomic predictors of crime, various diagnostic tests for spatial dependence indicate that the spatial effects for property crime are primarily residual in nature while those for violent crime e more substantial. This indicates that while a spatial error model may be sufficient for addressing the residual spatial autocorrelation patterns of property crime, a spatial lag model is needed to capture the more substantial spatial autocorrelation patterns of violent crime. These findings further suggest that processes of diffusion may be operating with regard to violent crime in the Region.
%.
Fourth, there are significant outcome differences for metropolitan and nonmetropolitan locations. One implication of this finding is that different theoretical constructs of crime may need to be applied in metropolitan and nonmetropolitan locations. This further suggests that global theories of crime may need to be modified to accommodate geographic heterogeneity and variations based on spatial scale.
Finally, there are significant regional differences in model outcomes for structural effects as well as spatial effects. In addition to Subregional differences in the effects of various demographic and socioeconomic predictors of crime, there are also significant Subregional differences in the clustering and spread of crime. Overall, these findings lend support to prior studies that have found higher rates of violent crime in the South. Spatial concentrations of both violent crime and property crime tend to be more pronounced in the South as well.
In summary, the bivariate and multivariate spatial regression model results demonstrate the existence of meaningful spatial patterns of violent and property crime at the county level in Appalachia. These spatial effects include patterns of both spatial dependence and
17
This document is a research report submitted to the U.S. Department of Justice. This report has not been published by the Department. Opinions or points of view expressed are those of the author(s) and do not necessarily reflect the official position or policies of the U.S. Department of Justice.

spatial heterogeneity. Patterns of spatial dependence point to the existence of clustering and possible diffusion processes, especially in the case of violent crime. Patterns of spatial heterogeneity point to the existence of significant differences in levels of crime based on regional location or spatial scale.
IMPLICATIONS The findings contained in this study demonstrate the importance of incorporating spatial effects into empirical models of crime. A related implication is that global theories of crime may need to be further modified or expanded in order to take spatial patterns and spatial dynamics more explicitly into account. Given recent developments in GIS technology and spatial analysis applications, there is now available a rich array of tools that can be applied to the study of crime in its spatial context. This opens the door for new ways to explore, visualize, and understand hot spots and clusters of crime, spatial diffusion processes, and differences based on spatial scale or location.
The results of this study thus have both theoretical and methodological implications and point to several directions for future research. First, the results indicate that different processes may be operating in metropolitan and nonmetropolitan locations. While a number of factors have traditionally been linked to crime in the social ecology literature, the spatial pattern of these relationships is often complex. Furthermore, most of this literature has been limited to urban crime and it may be that the link between various ecological characteristics and crime are different in urban and rural locations. In fact, it could be said that one of the least understood topics in the field of criminology is that of rural and nonmetropolitan crime. Thus, there is a need for further research on rural crime which a e s location and geographic context seriously. Future studies may therefore need to address the spatial dynamics of crime in rural locations as a product of social, economic, and demographic factors which are often unique to those areas.
Second, these findings also point to the need for spatially-informed theory construction in the field of Criminology. Recent studies on the social ecology of crime have tended to operationalize the relationship between communities and crime from either a stratification perspective (e.g. Blau and Blau 1982) or else from a social control perspective (e.g. Kornhauser 1978). Those who have taken a stratification perspective have emphasized structural factors such as income inequality and residential segregation to explain variations in the rate of crime. Those who have taken a social control perspective have emphasized the relative capacity of communities and various social institutions to produce normative conformity and social integration.
Ecological studies in the stratification tradition have searched for links between structural socioeconomic conditions and variations in aggregate crime rates. Krivo and Peterson (1996) found that extremely disadvantaged neighborhoods have higher levels of crime and that these patterns are consistent for both whites-and blacks. On the other hand, Blau and Blau (1982) argue that high rates of violent crime result from relative income inequality rather than absolute disadvantage, especially relative inequality between racial groups. Other studies in the stratification tradition have examined the links between crime and spatial stratification, especially the extreme residential segregation of blacks. Peterson and Krivo (1993), using race-specific crime rates, have found that racial
18
This document is a research report submitted to the U.S. Department of Justice. This report has not been published by the Department. Opinions or points of view expressed are those of the author(s) and do not necessarily reflect the official position or policies of the U.S. Department of Justice.
segregation is associated with higher rates of black urban homicide. Logan and Messner (1987) found that racial residential segregation is associated with violent crime in suburban neighborhoods as well. Shihadeh and Flynn (1996) have further contended that the multidimensional nature of segregation needs to be taken into account in order to disentangle the links between hypersegregation and crime. Thus, in addition to the Index of Dissimilarity, which measures the degree of unevenness in the spatial distribution of blacks versus whites, Massey and Denton (1988) have identified several other dimensions of racial segregation as well, including exposure, clustering, concentration, and centralization. According to Shihadeh and Flynn (1996), these each need to be examined in order to see how spatial and economic stratification has taken on a multidimensional character in the black community and how this process of hypersegregation has contributed to the overall increase in rates of black urban violence.
Ecological studies in the social control tradition have searched for links between aggregate crime rates and measures of social-disorganization such as formal and informal community-level social controls, family disruption, and residential mobility. Some studies in the social control tradition have looked at the dynamics of community change and population mobility and the implications these processes have had for the spatial distribution of high crime areas (Bursik and Webb 1982; Schuerman and Kobrin 1986). Others have examined the effect of family disruption on crime and delinquency rates at the community level. Sampson (1987) found that the effect of black male unemployment on black violent crime is primarily mediated by its effect on family disruption. Shihadeh and Steffensmeier (1994) also found that the effect of economic inequality on black urban 'olence is primarily mediated by family disruption.
These two ecological approaches to the study of crime may provide fruitful theoretical directions for studying the spatial dynamics of crime. Testing the relative merits of the stratification and social control perspectives from a more spatially informed model- building approach should therefore prove to be a promising direction for future research as well. Based on the implications of the present study, it may well be that a spatially- informed stratification model of crime would be more appropriately applied to the metropolitan and urban context, while a spatially-informed social control perspective might be more applicable to the nonmetropolitan and rural context or to regions such as Appalachia which are primarily nonmetropolitan in character.
L
Finally, the present research shows the value of applying Geographic Information System (GIS) technologies and spatial analytic procedures to the study of aggregate crime patterns. The main advantage of using GIS and related technologies is that it enables the researcher to look more rigorously at the spatial patterns and ecological contexts of crime. Furthermore, the analytical applications of GIS can be used in either an exploratory or confirmatory capacity. As an exploratory data analysis tool, GIS can be used to examine data visually as a way of generating new hypotheses from the data or as a way of identifying unexpected spatial patterns. As a confirmatory data analysis tool, GIS has been given increased analytical power with the introduction and development of spatial statistical packages such as Spaces tat (Anselin 1998) and Crimestat (Levine 1999). Thus, future studies could benefit substantially by systematically investigating the
19
This document is a research report submitted to the U.S. Department of Justice. This report has not been published by the Department. Opinions or points of view expressed are those of the author(s) and do not necessarily reflect the official position or policies of the U.S. Department of Justice.

factors associated with crime from a spatial perspective utilizing the contributions that GIS and geographic information analysis can provide. By employing spatial analytic procedures within a GIS environment, contextual and ecological factors identified as theoretically relevant in studies of crime and delinquency can be linked spatially and thereby examined in ways previously not possible.
a
Overall, the findings of the present study show how important spatial and contextual analysis can be in the study of violent and property crime across various levels of geography. By combining graphical, analytic and statistical tools in a GIS environment, researchers can explore spatial patterns which may warrent further empirical investigation as well as formally test spatially-informed theoretical models for their applicability at different spatial scales and locations.
REFERENCES Anselin, Luc. 1995. ‘2ocal Indicators of Spatial Association - LISA” Geographical
Analysis 27:93-115.
Version I .90. Regional Research Institute, West Virginia University, Morgantown, WV.
Anselin, Luc and Arthur Getis. 1992. “Spatial Statistical Analysis and Geographic Information Systems.” The Annals of Regional Science 26: 19-33.
Blau, Judith R. and Peter M. Blau. 1982. ‘The Cost of Inequality: Metropolitan Structure and Violent Crime.” American Sociological Review 47: 114-129.
Bursik Robert J., Jr. and Jim Webb. 1982. “Community Change and Patterns of
Kornhauser, Ruth. 1978. Social Sources of Delinquency. Chaicago:University of Chicago Press.
Krivo, Lauren J. and Ruth D. Peterson. 1996. “Extremely Disadvantaged Neighborhoods and Urban Crime.” Social Forces 75:619-650.
Levine, Ned. 1999. Crimestat 1.0, A Spatial Statistics Program for the Analysis of Crime Zncident Locations. Washington, DC: National Institute of Justice.
Logan, John R. and Steven F. Messner. 1987. “Racial Residential Segregation and Suburban Violent Crime.” Social Science Quarterly 68:5 10-527.
Massey, Douglas S. and Nancy A. Denton. 1988. “The Dimensions of Residential Segregation.” Social Forces 67:281-315.
Peterson, Ruth D. and Lauren J. Krivo. 1993. “Racial Segregation and Urban Black Homicide.” Social Forces 71:lOOl-1026.
Sampson, Robert J. 1987. “Urban Black Violence: The Effect of Male Joblessness and Family Disruption.” American Journal of Sociology 93 :348-382.
Schuerman, Leo A. and Solomon Kobrin. 1986. “Community Careers in Crime.” Pp. 67- 100 in Communities and Crime, edited by Albert J. Reiss, Jr. and Michael Tonry. Chicago: University of Chicago Press.
of Black Social Isolation on the Rates of Black Urban Violence.” Social Forces
. 1998. Spacestat, A SofhYare Program for the Analysis of Spatial Data,
helinquency.” American Journal of Sociology 88:24-42. a
Shihadeh, Edward S. and Nicole Flynn. 1996. “Segregation and Crime: The Effect
74: 1325- 1352.
PROPERTY OF National Criminal Justice Reference Service (NNRS) Rnckviile. MD 20849-6000
2o Box6000
This document is a research report submitted to the U.S. Department of Justice. This report has not been published by the Department. Opinions or points of view expressed are those of the author(s) and do not necessarily reflect the official position or policies of the U.S. Department of Justice.

Shihadeh, Edward S. and Darrell J. Steffensmeier. 1994. “Economic Inequality, Family Disruption, and Urban Black Violence: Cities as Units of Stratification and Social Control.” Social Forces 73:729-75 1.
e
t
’r
21
This document is a research report submitted to the U.S. Department of Justice. This report has not been published by the Department. Opinions or points of view expressed are those of the author(s) and do not necessarily reflect the official position or policies of the U.S. Department of Justice.
Related Documents