1 Manuscript submitted to Geomorphology: 1 2 Space-for-time substitution and the evolution of a submarine canyon-channel 3 system in a passive progradational margin. 4 5 Aaron Micallef a,b *, Marta Ribó c , Miquel Canals a , Pere Puig c , Galderic Lastras a , Xavier Tubau a 6 7 a GRC Geociències Marines, Facultat de Geologia, Universitat de Barcelona, E-08028 Barcelona, 8 Spain. 9 b Department of Physics, University of Malta, Msida, MSD 2080, Malta. 10 c Institut de Ciències del Mar, CSIC, Passeig Marítim de la Barceloneta 37–49, E-08003 11 Barcelona, Spain. 12 *Corresponding author. Tel: +356 2340 3613. 13 E-mail address: [email protected] (A. Micallef) 14 15 16 17 18 19 20 21 22 23 Manuscript Click here to view linked References

Welcome message from author
This document is posted to help you gain knowledge. Please leave a comment to let me know what you think about it! Share it to your friends and learn new things together.
Transcript
1
Manuscript submitted to Geomorphology: 1
2
Space-for-time substitution and the evolution of a submarine canyon-channel 3
system in a passive progradational margin. 4
5
Aaron Micallefa,b*, Marta Ribóc, Miquel Canalsa, Pere Puigc, Galderic Lastrasa, Xavier Tubaua 6
7
a GRC Geociències Marines, Facultat de Geologia, Universitat de Barcelona, E-08028 Barcelona, 8
Spain. 9
b Department of Physics, University of Malta, Msida, MSD 2080, Malta. 10
c Institut de Ciències del Mar, CSIC, Passeig Marítim de la Barceloneta 37–49, E-08003 11
Barcelona, Spain. 12
*Corresponding author. Tel: +356 2340 3613. 13
E-mail address: [email protected] (A. Micallef) 14
15
16
17
18
19
20
21
22
23
Manuscript
Click here to view linked References
2
Abstract 24
25
Space-for-time substitution is a concept that has been widely applied, but not thoroughly tested 26
in some fields of geomorphology. The objective of this study is to test whether the concept of 27
space-for-time substitution is valid in reconstructing the evolution of a submarine canyon-28
channel system in a passive progradational margin. We use multibeam echosounder data and in 29
situ measurements from the south Ebro Margin to analyse the morphology and morphometry of a 30
sequence of submarine valleys ordered in terms of increasing valley thalweg length. The 31
morphological model of submarine valley evolution that we can propose from this analysis is 32
very similar to established models in the literature, which leads us to conclude that time can be 33
substituted by space when reconstructing the evolution of submarine canyon and channel 34
systems in the south Ebro Margin. By extracting morphometric information from the application 35
of the space-for-time substitution model to our data, we identify a series of morphological 36
patterns as a submarine canyon evolves in a passive progradational margin. These include the 37
geometric similarity of canyon planform shape, an increase in canyon draining efficiency and in 38
the influence of flank slope failures, and an evolution towards equilibrium between canyon form 39
and imposed water and sediment load without net erosion or deposition taking place. We also 40
observe that canyon elongation is higher downslope and that the canyon undergoes an early stage 41
of rapid incision similar to the process of “erosion narrowing” reported in terrestrial rivers. We 42
demonstrate that the conclusions of our study are not limited to submarine valleys in the south 43
Ebro Margin but are applicable to other margins around the world. 44
45
46
3
1. Introduction 47
48
Geoscientists are generally unable to fully observe landscape-forming processes because the 49
time-scale of the observer and the time-scale of many geomorphic phenomena are very different. 50
One approach to solve this issue has been to substitute space for time, which is known as the 51
concept of space-for-time substitution. This concept, which has also been applied in ecology, 52
refers to the inference of long-term landform development from the comparison of similar 53
landforms of different ages or at different stages of evolution (Paine, 1985; Pickett, 1989; Li et 54
al., 2011; Fryirs et al., 2012). Space-for-time substitution was initially used to reconstruct 55
drainage basin evolution and sequential slope development (e.g. Glock, 1931; Schumm et al., 56
1984; Simon and Hupp, 1986). More recently, the concept has been applied to determine how 57
drainage basins evolve towards steady state (Stolar et al., 2007) to identify the erosional and 58
topographic response of drainage basins to tectonic deformation (Hilley and Arrowsmith, 2011), 59
explain the transition from fluvial to glacial landscapes (Kirkbride and Matthews, 1997), 60
reconstruct the evolution of channelled sea cliffs (Leyland and Darby, 2008), infer rates of cliff 61
retreat and talus development (Obanawa et al., 2009), and understand how slope geomorphology 62
and soil change with elevation and precipitation (Huggett, 1998; Schmidt and Meitz, 2000). The 63
application of space-for-time substitution in submarine geomorphology has been sparser and 64
focused almost entirely on submarine canyons. Using side-scan sonar data from the USA 65
Atlantic margin, Twichell and Roberts (1982) and Farre et al. (1983) were able to propose a 66
model of canyon evolution based on the retrogressive failure of the canyon head and walls. In 67
this model, slope-confined canyons, which are considered representative of the immature stages 68
4
in canyon development, eventually evolve headwards into mature canyons that breach the shelf 69
break. 70
71
Despite its accepted use in the geomorphic literature, the concept of space-for-time-substitution 72
is not well proven. The concept is based on ergodic reasoning, which has been developed in 73
physics to establish the spatial distribution of fast moving molecules (Boltzmann, 1871). 74
According to ergodic reasoning, the mean observation of an individual molecule made over time 75
is equal to the mean observations of many molecules at a single moment in time over an area. 76
Thus, observations made at different times can be used as surrogate for the spatial distribution of 77
molecules at a single moment. In geomorphology, ergodicity has not been applied in the original 78
sense of time and space averages; instead, it is based on the use of space as a surrogate of time 79
and the translation of a spatial morphological sequence into a temporal sequence of individual 80
landform evolution and change (Kirkbride and Matthews, 1997; Leyland and Darby, 2008; 81
Obanawa et al., 2009; Hilley and Arrowsmith, 2011). Distance, location, landform dimension 82
and complexity are used as ergodic indicators of landform development to derive the spatial 83
sequence, which was not intended by the original concept. 84
85
The objectives of this paper are: (i) to test whether the concept of space-for-time substitution is 86
valid in submarine geomorphology, specifically in reconstructing the evolution of a submarine 87
canyon-channel system in a passive progradational margin, and (ii) to gain new insights into the 88
morphological evolution of submarine canyon-channel systems. We fulfil these objectives by 89
carrying out morphological, morphometric and allometric analyses of submarine canyons and 90
channels incising the south Ebro Margin, a passive progradational continental margin located in 91
5
the western Mediterranean Sea. This margin provides an ideal site for our study – it has been 92
surveyed with high resolution multibeam echosounders during various research cruises (Amblas 93
et al., 2006), its overall stratigraphy and structure are spatially uniform and well constrained 94
(Alonso et al., 1990; Farrán and Maldonado, 1990; Field and Gardner, 1990), and the margin is 95
presently incised by numerous submarine canyons and canyon-channel systems (Canals et al., 96
2000). 97
98
We focus our study on submarine canyons in passive margins for two reasons. First, submarine 99
canyons play an important role in margin development globally and act as sinks and conduits for 100
sediment particles and associated nutrients, organic carbon and pollutants (Shepard, 1981; 101
Normark and Carlson, 2003; Puig et al., 2004; Allen and Durrieu de Madron, 2009; Harris and 102
Whiteway, 2011; Sànchez-Vidal et al., 2012; Canals et al., 2013). In spite of their relevance and 103
widespread distribution, the genesis and evolution of submarine canyons continues to be debated 104
(Bertoni and Cartwright, 2005; Pratson et al., 2009). We attribute this to three reasons: (i) 105
complexity and diversity of canyon topographies from different continental margins (Harris and 106
Whiteway, 2011); (ii) difficulties faced by geoscientists in observing contemporary sediment 107
transport and canyon formation processes directly on site (see review by Puig et al., 2014); and 108
(iii) the fact that present-day processes may provide limited understanding of canyon evolution 109
because many submarine canyons could be relict features that may only bypass sediment from 110
the continental shelf to the deep basins (Emery and Uchupi, 1972; Vail et al., 1977; Burger et al., 111
2001). Space-for-time substitution can therefore be an important tool to derive information on 112
the changing nature of canyon formation processes and associated morphology with time, which 113
provides a framework for interpreting the relative age of erosion morphologies on continental 114
6
slopes. Secondly, passive margins provide less complicated geological settings than active 115
margins, which simplifies our investigation of the evolution of submarine canyon–channel 116
systems. Passive margins also comprise two-thirds of the world’s continental margins and host 117
40% of global submarine canyons (Harris and Whiteway, 2011). 118
119
2. Regional setting 120
121
The Ebro Margin is a 22,000 km2, NE–SW trending passive margin formed on the western 122
shoulder of the Valencia Trough between the Iberian Peninsula and the Balearic Promontory 123
(Bertoni and Cartwright, 2005; Amblas et al., 2006; Fig. 1). It comprises a progradational shelf–124
slope system that has been active during the Plio-Pleistocene and that is driven by the influx of 125
terrigenous sediment from the Ebro River (Field and Gardner, 1990; Fig. 1). The Ebro Margin 126
consists of stacked shelf-margin deltaic and slope depositional units, which reach a thickness of 127
2.5 km; these units are separated by disconformities and lie above the erosion surface formed 128
during the Messinian Salinity Crisis (Alonso et al., 1990; Farrán and Maldonado, 1990; Kertznus 129
and Kneller, 2009). The growth patterns of the Ebro Margin have been controlled by glacio-130
eustatic sea-level oscillations, subsidence, and changes in sediment type and discharge from the 131
Ebro River, which were up to three times higher during Quaternary lowstands (Farrán and 132
Maldonado, 1990; Canals et al., 2000). During sea-level highstands, such as at present, lower 133
energy hemipelagic sedimentation prevail over the entire margin (Alonso et al., 1990). Currently, 134
most of the sediment supplied by the Ebro River is trapped by dams or in the delta (Palanques et 135
al., 1990). 136
137
7
The Ebro continental shelf consists of a 70 km wide, gently sloping (up to 0.5°), smooth seabed 138
that is disrupted in the south by the small volcanic archipelago of Columbretes Islets (Fig. 1B). 139
The shelf break is almost parallel to the coast and occurs at depths ranging between 100 and 130 140
m. The outer continental shelf is sand-dominated, whereas muddy deltaic deposits cover the 141
inner continental shelf (Díaz et al., 1996). The continental slope is only 10 km wide and has a 142
slope gradient of up to 10°. Numerous canyons are incised in the continental slope and outer 143
continental shelf. Some of these canyons evolve into well-developed turbiditic channel–levée 144
complexes at their lower courses, forming the Ebro turbidite system (Alonso and Maldonado, 145
1990; Field and Gardner, 1990; Canals et al., 2000; Casas et al., 2003; Amblas et al., 2006). 146
Recurrent slope instability failures have interrupted the development of a number of these 147
canyon–channel systems (e.g. Lastras et al., 2002). 148
149
The Ebro continental shelf is a micro-tidal, low energy oceanographic setting. Mesoscale 150
circulation is dominated by the Northern Current, an along-slope, southward flowing, cyclonic 151
steady geostrophic current that flows along the middle to outer continental shelves and slopes 152
(Font et al., 1990). Sediment transport on the Ebro continental shelf is mainly directed towards 153
SSW and the mean along-shelf sediment flux greatly dominates over the mean seaward cross-154
shelf flux, being driven by storm events, strong wind-induced currents and the occurrence of 155
near-inertial internal waves at the base of the thermocline (Cacchione et al., 1990; Puig et al., 156
2001; Palanques et al., 2002). 157
158
Our study area is located in the southern limit of the Ebro Margin, where the shelf break turns 159
landwards to the south of Columbretes Islets (Fig. 1B). There, the continental slope changes its 160
8
orientation from NE–SW to E–W and has a slope gradient that ranges between 5.3° and 6.3°. It 161
is incised by numerous, closely spaced submarine canyons and an NW–SE oriented canyon–162
channel system, which extends from the outer continental shelf to a depth of ~1400 m (Fig. 2). 163
This canyon–channel system is known by the name of South (or Great) Columbretes Canyon 164
(Canals et al., 2012). Similar canyon-channel systems, such as North (or Small) Columbretes 165
Canyon (Fig. 2) and Orpesa Canyon (Amblas et al., 2006), are located north-east of the study 166
area. For ease of simplicity, South and North are utilised to refer to these two canyons from here 167
onwards. 168
169
3. Materials and methods 170
171
3.1 Bathymetric and backscatter data 172
173
We base our study on data collected during six multibeam echosounder surveys on board BIO 174
Hespérides, RV L’Atalante and BO García del Cid. The first dataset, acquired during “BIG’95” 175
cruise in 1995 with a Simrad EM-12S system, covers the eastern part of the study area and the 176
entire canyon–channel system. The second dataset was collected during “CALMAR” cruise in 177
1997 with a Simrad EM-12 system and covers the upper continental slope of the Ebro Margin. 178
The third dataset was acquired from the outer continental shelf during “MATER-2” cruise in 179
1999 using a Simrad EM-1002S system. Bathymetry and backscatter grids of 50 m cell size were 180
generated from these datasets. The fourth dataset was collected during “EUROLEON” cruise in 181
2007 using a Simrad EM-120 system and covers most of the south Ebro Margin. The fifth and 182
sixth bathymetric datasets were acquired with shallow depth Seabeam Elac 1050D 180 kHz 183
9
multibeam echo-sounder during cruises “CASCADES” in 2009 and “COSTEM” in 2010, and 184
covered the outer shelf and upper slope region of the south Ebro Margin. These data sets were 185
processed to generate bathymetry and backscatter grids of 20 m cell size. 186
187
3.2 Nomenclature of seafloor morphology and morphometric measurements 188
189
In this paper we differentiate between three types of seafloor erosional morphologies: gullies, 190
canyons and canyon–channel systems. Gullies are short (<2 km in thalweg length), elongate 191
depressions with little relief (<10 m), whereas canyons are longer and deeper valleys (Field et al., 192
1999; Harris and Whiteway, 2011). Gullies are restricted to the continental slope whereas 193
canyons may also extend into the continental shelf. A canyon–channel system comprises a 194
canyon and its downslope extension across the lower continental slope and continental rise in the 195
form of a channel (Clark and Pickering, 1996). We collectively refer to these three types of 196
seafloor morphologies as valleys. 197
198
To test our hypothesis that space can be substituted for time to reconstruct the evolution of a 199
submarine canyon–channel system, we used valley thalweg length as an ergodic indicator of 200
landform development. We organised the six easternmost valleys into a sequence of increasing 201
valley thalweg length and labelled these valleys as ‘feature’ 1–6 (Figs. 3 and 4). For each feature 202
we mapped the valleys and their tributaries as a network of lineaments and extracted a number of 203
morphometric parameters from the bathymetric datasets (Fig. 5; Table 1). We focused our study 204
on the six easternmost valleys because they exhibit evidence of relatively recent erosional 205
activity. This evidence comprises sharply defined morphologies and high backscatter along the 206
10
valley beds. These characteristics contrast with those of valleys located to the west (e.g. features 207
X–Z in Fig. 3). These valleys display smoother morphologies and low backscatter along the 208
valley axes and their tributaries. 209
210
3.3 Hydrodynamic conditions, sediment fluxes and sediment accumulation rates 211
212
Field measurements of contemporary hydrodynamic conditions and sediment fluxes were carried 213
out with near-bottom instrumented moorings deployed in the heads of two of the studied canyons 214
(Fig. 2). Mooring 1 (M1) was deployed at 300 m depth in the South Columbretes Canyon 215
(feature 6; 39º41.92' N; 0º39.50' E) from October 2008 to January 2009. Mooring 2 (M2) was 216
deployed at a depth of 500 m in one of the branches of feature 5 (39º38.42’ N; 0º30.91’ E) 217
during three consecutive periods between May 2010 to June 2011. M1 was equipped with an 218
Aanderaa RCM-9 current metre with temperature, pressure, conductivity and turbidity sensors 219
placed at 5 m above the bottom (mab). M2 was also equipped with an Aanderaa RCM-9 current 220
metre and included a sequential sediment trap Technicap PPS3 with 12 collecting cups placed at 221
30 mab. Time series for four months and one year were collected from M1 and M2, respectively. 222
The current metres’ sampling interval was set to 30 minutes for both moorings. The sediment 223
trap collection intervals in M2 varied between 9 and 12 days, depending on the deployment 224
period. Turbidity data recorded by current metre sensors were converted from the formazin 225
turbidity units (FTU) into suspended sediment concentration (SSC) following the general 226
equation obtained by Guillén et al. (2000) using in situ measurements from the western 227
Mediterranean: 228
229
11
SSC (mg l−1) = 1.74(FTU − FTUmin) (1) 230
231
where FTUmin is the minimum turbidity recorded by the sensor during a given deployment 232
period. When particulate matter remains suspended in the water column, we can make the 233
assumption that the sediment particles move with the velocity of the water within which they are 234
suspended (Wright, 1995). Therefore, the instantaneous suspended sediment flux can be obtained 235
by multiplying the instantaneous values of the horizontal current velocity components and SSC. 236
In order to obtain the across- and along-canyon sediment fluxes, a clockwise rotation of the 237
coordinates system of 5º in M1 and 25º in M2 was performed using the canyon axis orientations 238
obtained from the multibeam bathymetry data as reference. Based on these rotations, time-239
integrated cumulative across- and along-canyon sediment transport were calculated. 240
241
In the laboratory, M2 sediment trap samples were treated following some of the procedures 242
described by Heussner et al. (1990). Once the particles were settled down in a solution, the 243
supernatant was removed by pipette and stored apart. The living organisms that actively entered 244
the trap were removed from the samples. In order to extract all the sea water, the sieved material 245
was washed with Mili-Q water and centrifuged three times. The sediment trap samples were 246
subsequently frozen and lyophilised. Downward particles fluxes were computed using the total 247
mass weight (in g, extracted from the dry weight of each sample), the trap collecting area (in m2) 248
and the sampling interval (in days). 249
250
In addition, a subsurface sediment core was taken at the site of M2 using a KC multicorer with 251
six collecting tubes. Immediately after retrieval, one of the tubes was sub-sampled in 1 cm slices 252
12
and stored in sealed plastic bags at 4ºC. The sediment accumulation rate from this core was 253
estimated from 210Pb concentration profiles. 210Pb activities were determined through the 254
measurement of its daughter nuclide 210Po, which is assumed to be in radioactive equilibrium 255
with 210Pb in the sediment samples, using a method modified after Nittrouer et al. (1979). 256
Analyses of the sediment samples were performed by total digestion of 200–300 mg using the 257
methodology described by Sanchez-Cabeza et al. (1998). 210Po was added to each sample before 258
digestion, as an internal tracer, and Polonium isotopes were counted with an alpha spectrometer 259
equipped with low-background silicon surface barrier (SSB) detectors (EG&G Ortec). 260
261
4. Results 262
263
4.1 Contemporary current and sediment fluxes within canyon heads 264
265
Time series of current speed, SSC, cumulative transport (along and across-valley) and sediment 266
flux in feature 6 for the period October 2008 to January 2009 and in feature 5 for the period May 267
2010 to June 2011 are shown in Fig. 6. In feature 6, the current speeds reached values of 15–20 268
cm s-1 (Fig. 6A), and the SSC record was considerably low, with values of 0.5 mg l-1 for all the 269
time series (Fig. 6B). Cumulative transport across-valley was in an SSE direction and was 270
slightly lower than the along-valley transport, which reached values of 0.03 T m-2 (Fig. 6C). In 271
feature 5, the current speed time series maintained relatively low values from May 2010 to 272
February 2011, and increased slightly from February to June 2011, reaching values of > 20 cm s-273
1 (Fig. 6D). The SSC record was again considerably low during all the time period, mostly below 274
0.5 mg l-1 (Fig. 6E). Cumulative transport across-valley was also in an SSE direction and almost 275
13
negligible, while cumulative flux along-valley was downslope, reaching values of 0.02 T m-2 276
(Fig. 6F). The sediment transport along feature 5 is much lower than that in feature 6. Low 277
values (<2 g m-2 d-1) were recorded for total mass fluxes in feature 5, accounting for an annual 278
flux of 640 g m-2 y-1 (Fig. 6G). In October 2010, an increase in current speed, caused by an 279
energetic (Hs >4.5 m, Tp >10 s) northern storm affecting the study area, increased the sediment 280
flux to 7.2 g m-2 d-1. The annual downward particle flux for the time period 2010–2011 281
accounted for 640 g m-2 y-1. No comparison can be made with the valley in feature 6 because no 282
downward particle flux data were recorded. A 210Pb-derived sediment accumulation rate of 900 g 283
m-2 y-1 and a sedimentation rate equivalent to 0.137 cm y-1 were calculated for feature 5 at site 284
M2. 285
286
4.2 Valley morphologies 287
288
Fig. 7 presents maps of the different valleys identified in the study area. An individual gully 289
(feature 1) is the smallest erosional morphology identifiable. Its head is defined by a steep, 290
arcuate scarp located on the continental slope 1.3 km down from the continental shelf break at a 291
depth of ~380 m (Figs. 3 and 7). Gullies of equivalent size and form are observed on the 292
continental slope to the east of the study area, at a similar water depth and distance from the shelf 293
break. In features 2 to 5, the valley develops from a gully into a canyon with gullies and smaller 294
canyons as tributaries (Figs. 3 and 7). The thalwegs of the largest features 4 and 5 are located at a 295
distance of 3 km from each other; this is the same distance that separates the three valleys of 296
comparable thalweg length located to the west of the study area (labelled X–Z in Fig. 3). The 297
upslope boundaries of features 3 and 4 are contiguous, whilst the termini of features 2 and 3 298
14
connect with those of features 4 and 5, respectively (Fig. 3). An abandoned canyon can be 299
identified to the west of feature 5 (Fig. 8A). 300
301
In features 2–5, the predominant types of valley head and wall erosional features comprise (i) 302
first to fifth-order gully networks with sharp interfluves, and (ii) smooth and well-defined scars 303
located at, or in the vicinity of, the gully heads and along valley walls (Figs. 3 and 8A). The 304
gully networks are concentrated in the upper valley section (< 800 m depth). The steepest areas 305
within all the valleys are located at the heads of the tributary gullies, scar headwalls, and along 306
the valley walls. Gullies join the main valley axis where the valley depth is largest. The valley 307
axes are characterised by an absence of failure deposits. A series of asymmetric scours are 308
observed close to the valley terminus of feature 5 (Figs. 7 and 8C). The valley courses in features 309
5 and 6 are characterised by hanging gullies and multiple terraces that are up to 80 m high (Fig. 310
8A,D). The valley heads of features 4–6 breach the continental shelf (Figs. 3, 4 and 7). The head 311
of the valley in feature 5 is linked by 100 m wide and 4 m deep elongate depressions to a sand 312
body (Fig. 8B). This sand body is intersected by the head of feature 6, which comprises an 313
extensive canyon–channel system (Fig. 4A and 7). This valley features gullies and failure scars 314
in the upper reaches, whereas it becomes more sinuous downslope, with a hanging ox-bow and 315
levées up to 50 m high (Fig. 8D). 316
317
4.3 Valley morphometrics 318
319
For all features in our study area, axial gradient and valley depth decrease away from the valley 320
head (Fig. 9A–C). Valley downslope profiles are concave and lack knickpoints (Fig. 9A). The 321
15
profile of feature X, in comparison, is convex–concave (Fig. 9D). Gully downslope profiles are 322
steeper (mean gradient of 15°) and less concave than those of the canyons. With increasing 323
thalweg length, the valley cross-sectional shape changes from V- to U-shaped. 324
325
We observe a progressive increase in width, valley depth, width:depth ratio, area, volume, and 326
number and thalweg length of tributary valleys with increasing thalweg length from features 1 to 327
6 (Fig. 10A,B,C,G). The most significant changes in valley dimensions are recorded in valley 328
thalweg length. The majority of across-slope elongation takes place downslope of the valley 329
(Figs. 7 and 10E). Valley axial slope gradient decreases exponentially with thalweg length (Fig. 330
10D). 331
332
Breaching of the shelf break (between features 3 and 4) and connection of the valley head with 333
the outer shelf sand body (features 5 and 6) are associated with significant changes in valley 334
morphology (Fig. 7). Shelf-breaching results in: (i) most of the material being eroded from the 335
upper valley reaches, which is in contrast to what we observe in features 1–3, where the majority 336
of the material is eroded from the lower valley reaches (Fig. 10F); and (ii) temporary reduction 337
in downslope valley elongation and increase in drainage density (Fig. 10D,F). Connection of the 338
valley head with the sand body, on the other hand, results in: (i) a rapid increase in valley area, 339
volume, width, width:depth ratio, depth of the main valley axis, and the number and thalweg 340
length of tributary valleys (between features 4 and 5; Fig. 10A,B,C,G); and (ii) a rapid 341
downslope elongation of the valley in correspondence with unchanging valley width and depth 342
(between features 5 and 6) (Fig. 10A,E). 343
344
16
Prior to the formation of the canyon–channel system (features 1–5), the following relationships 345
are observed: (i) linear length correlates positively with valley width according to a linear 346
equation (Fig. 11C); (ii) valley profile concavity tends to increase asymptotically with thalweg 347
length (Fig. 11D); and (iii) valley thalweg length increases asymptotically with valley area 348
according to a positive power law with an exponent of 0.46 (Fig. 11A). The above morphometric 349
relationships do not apply to feature 6 because of an abrupt increase in thalweg length (Fig. 350
11A,C) and concavity (Fig. 11D). 351
352
With increasing thalweg length, the following changes in canyon network parameters are also 353
observed: (i) bifurcation ratios decrease progressively to a value of 4.2; (ii) drainage density 354
decreases (Fig. 10D); and (iii) slope gradient decreases and thalweg length of valleys and 355
tributaries increases with increasing stream order (Fig. 11B). 356
357
5. Discussion 358
359
5.1 Evolution of the south Ebro Margin submarine canyon–channel system 360
361
5.1.1 Inferred morphological evolution of the canyon–channel system 362
363
Morphologic evidence from the south Ebro Margin leads us to propose that valley evolution 364
starts as a first-order gully eroded on the continental slope that develops into a shelf-breaching 365
dendritic canyon and, finally, into a canyon–channel system extending into the lower continental 366
slope and rise (Fig. 7). The majority of canyon growth involves downslope extension of the 367
17
valley (Fig. 10E). Initially, most of the material is removed from the lower reaches of the valley 368
(Fig. 10F). These initial stages are also dominated by incision, and the rates of changes in valley 369
depth are faster than those in valley width. Upslope elongation also occurs, to a lesser extent, by 370
repeated retrogressive slope failure of the valley head. Valley deepening creates steep walls that 371
fail due to oversteepening and loss of support at their base, as indicated by the numerous scars 372
identified in features 2–5. Flank failures are responsible for widening the valley and introducing 373
material into the valley thalweg. Where the valley has been incised the deepest, the scars of these 374
flank failures develop into long and steep tributary gullies. Valley elongation and widening is 375
also likely responsible for piracy of adjacent sediment drainage. The contiguity of features 2–5 376
and the abandoned canyon leads us to propose that the development of individual valleys has 377
been halted or slowed down by the faster growth of adjacent, larger valleys, which would have 378
captured sediment drainage and focused it along their main conduits. 379
380
We propose that erosion of the valleys is driven by gravity flows triggered in the upper slope. 381
Evidences for this inference include: (i) the decrease of valley depth with distance downslope 382
(Fig. 9B,C) and the concentration of gullies upslope (Fig. 7), which are indicative of an erosive 383
process with a source in the upper valley reaches; (ii) the concave shape of the thalweg 384
downslope profile (Fig. 9A), which is indicative of loss of flow competence from valley head to 385
mouth as it erodes and transports material (Gerber et al., 2009; Covault et al., 2011); (iii) the 386
absence of failure deposits on the valley floor and the high backscatter values along the valley 387
beds, which indicate that the deposits were likely removed by gravity flows (Figs. 3, 4 and 388
8A,D); and (iv) the occurrence of terraces in features 5 and 6, which we interpret as evidence of 389
multiple events of axial incision (Fig. 8A,D; Baztan et al., 2005). The initiation of 390
18
equidimensional gullies on the continental slope at a similar distance from the shelf-break 391
(feature 1) may be explained by two mechanisms. The first is gully incision by unconfined, 392
shelf-originating, downslope-accelerating gravity flows (Micallef and Mountjoy, 2011). These 393
high-density, gravity-driven flows exert tractive forces on the seafloor that increase with distance 394
downslope from the shelf break. When the basal stress is high enough to overcome the shear 395
resistance of the seabed material, the seafloor is eroded and a small irregularity is formed. 396
Channelisation of the unconfined gravity flow into these proto-gullies may occur by either 397
topographic roughness or flow instability (Lastras et al., 2011; Micallef and Mountjoy, 2011). A 398
second mechanism is spring sapping, which involves the discharge of groundwater or another 399
type of fluid from the face of the continental slope at a specific depth or stratigraphic level 400
(Orange et al., 1994; Pratson et al., 2009). Apart from explaining the occurrence of numerous 401
gullies at a similar water depth and distance from the shelf break, this process would also 402
account for the smooth, undisturbed seafloor observed upslope of the gully heads. The lack of 403
direct evidence of fluid sapping may be attributed to seafloor erosion and valley enlargement for 404
features 2–6. The exertion of force from seepage and gravity would cause the sediments on the 405
slope to fail, which would explain the initiation and continued failure at the gully’s head and its 406
upslope growth. For gully downslope elongation to occur, however, erosion by gravity flows is 407
still required. 408
409
The advanced stages of valley development are characterised by a sharp increase in valley 410
growth. First, the valley head breaches the continental shelf break, allowing it to capture large 411
volumes of sediment directly from the shelf, and shifting the locus of erosion to the upper 412
reaches of the valley (features 4–5). This results in pronounced valley deepening, lateral 413
19
widening and increase in the number of tributary valleys in the upper reaches (Fig. 10A,B,G; 414
feature 5). Secondly, the valley head directly connects with the outer shelf sand body (feature 6). 415
This sand body has been interpreted as outer shelf palaeo-delta deposits, with an estimated age of 416
about 11,100 yrs BP, which mark where palaeo-rivers deposited sediment in the outermost shelf 417
and upper slope of the Ebro Margin during sea-level lowstands (Díaz et al., 1990; Farrán and 418
Maldonado, 1990; Lo Iacono et al., 2010; Fig. 8B). Connection with the palaeo-delta could have 419
significantly increased the flow of sediment into the valley head, leading to the formation of the 420
channel at the base of slope (feature 6). The initiation of the channel is marked by the formation 421
of a series of scours at the mouth of the canyon (feature 5), which we interpret as cyclic steps 422
formed by repeated gravity flows evolving from confined to unconfined conditions (Parker and 423
Izumi, 2000). The scours eventually coalesce into a more continuous channel thalweg (feature 6). 424
At this stage, valley development entails extensive valley elongation, with limited widening or 425
deepening, into the gently sloping lower continental slope and continental rise. In the lower 426
reaches of the channel, morphologies associated with channel development and migration 427
develop. These include a sinuous valley course, abandoned channel branches, and hanging ox-428
bow and channel-levée systems (Canals et al., 2000) (Fig. 8D). 429
430
5.1.2 Source of gravity flows 431
432
Processes that trigger the gravity flows that are thought to have driven valley evolution in the 433
south Ebro Margin may include seismic activity associated with regional volcanic and tectonic 434
processes, oversteepening of the prograding upper slope by rapid sedimentation, and cyclic wave 435
loading (Canals et al., 2000). Although seismic activity of small magnitude is present in the Ebro 436
20
Margin (Grünthal et al., 1999), this cannot explain the regularity of canyon occurrence along the 437
entire Ebro Margin. We suggest that the most likely source of gravity flows is oversteepening 438
and failure of the outermost shelf and upper slope due to rapid sedimentation by palaeo-rivers 439
during sea-level lowstands (Farrán and Maldonado, 1990; Piper and Normark, 2009). The 440
heightened sediment supply and depositional oversteepening associated with the palaeo-river 441
delta would have had the potential to frequently trigger gravity flows that would have incised the 442
valleys in our study area. The direct association between the increase in valley development and 443
the connection of the valley with the palaeo-river in feature 5 provides further support to our 444
inference (Figs. 4A and 8B). A second possible mechanism triggering gravity flows during sea-445
level lowstands is the action of waves during storms (Parsons et al., 2006). A recent review of 446
contemporary sediment transport processes in submarine canyons, which includes observations 447
in canyons incised on tectonically active margins or nearby major rivers that may be analogues 448
for sedimentary processes during low-stands of sea level, highlights the combined effect of 449
storms and river floods (concurrent or delayed in time) as an important component for shelf-to-450
canyon sediment-gravity flow transport in many continental margins (Puig et al., 2014). 451
However, wave action has also been shown to be an important process generating sediment 452
gravity flows at present sea-level in submarine canyons whose heads are located at shelf-break 453
depths and far away from the shore (e.g. Puig et al., 2004). 454
455
5.1.3 Timing of valley activity 456
457
The above considerations suggest that valley development in the south Ebro Margin was likely 458
more pronounced during sea-level lowstands, when the shoreline would have been close to, or 459
21
was intersected by, the heads of the more developed canyons at the present shelf break (Figs 1 460
and 2; Lambeck and Bard, 2000). The mid-Pleistocene to Holocene period is associated with 461
rapid high-amplitude sea-level fluctuations and increased sedimentation along the Ebro Margin 462
(Nelson, 1990; Kertznus and Kneller, 2009). Due to their contrasting bathymetric and 463
backscatter signatures, we infer that the valleys to the west of the study area (e.g. features X–Z in 464
Fig. 3) have formed by erosion episodes that pre-date those in the study area; since then, valleys 465
X–Z have undergone subsequent infilling by hemipelagic background sedimentation and margin 466
progradation, as indicated by the convex–-concave downslope profile of valley X (Fig. 9D; 467
Gerber et al., 2009). The valleys in our study area, on the other hand, have been active more 468
recently, most likely during or shortly after the Last Glacial Maximum sea-level lowstand. This 469
difference in the timing of valley activity may be explained by the eastward shift of the palaeo-470
river delta during the same or earlier sea-level lowstands, as has been documented by Farrán and 471
Maldonado (1990). Multiple terraces in features 5 and 6 in our study area, on the other hand, 472
evidence numerous periods of reactivation during the same or different sea-level lowstands 473
(Baztan et al., 2005; Antrobreh and Krastel, 2006). The palaeo-river is likely to have been an 474
extension of the Mijares River, which is the second largest terrestrial fluvial system draining into 475
the Ebro Margin and which is located closer to the study area in comparison to the Ebro River 476
(Farrán and Maldonado, 1990; Field and Gardner, 1990; Urgeles et al., 2011). 477
478
Field observations from instrumented moorings in features 5 and 6 between 2008 and 2011 479
indicate that contemporary sediment transport is relatively small, current velocities are weak and 480
SSC is low (Fig. 6). The major storm event occurring in mid-October 2010 during the 481
deployment in feature 5, which had a recurrence period of more than 4 years (Puertos del Estado, 482
22
2013), did not trigger a sediment gravity flow and only increased the downward particle fluxes 483
within the canyon as a consequence of off-shelf suspended sediment advection (Fig. 6). 484
Furthermore, the mean annual downward particle fluxes measured by sediment traps are similar 485
to the mean sediment accumulation rates measured by 210Pb in the same site (~ 640 vs 900 g m-2 486
y), suggesting a similar sediment transport regime in feature 5 during at least the last century. 487
488
From all of this we can infer that: (i) submarine valley activity across the southern Ebro Margin 489
has been pulsating and correlated with sea-level lowstands; this contrasts with the larger and 490
wider submarine canyons incising the north Catalan margin and located 260 km to the northeast 491
(e.g. Blanes, La Fonera, Cap de Creus canyons), which currently manifest a high degree of 492
activity in terms of water and sediment transport (e.g. Canals et al., 2006; Puig et al., 2008; 493
Zúñiga et al., 2009; Ribó et al., 2011); and (ii) valley morphology in this passive, progradational 494
margin can be maintained over the course of more than one fall and rise in sea-level, in 495
agreement with the conclusions by Amblas et al. (2012). 496
497
5.2 Validity of the space-for-time substitution model 498
499
The inferred model for the morphological evolution of submarine canyons and channels in the 500
south Ebro Margin shows many parallels with established models in the literature. 501
502
In terms of submarine canyon evolution, two models have been widely cited in the literature:- the 503
upslope and downslope erosion models. Observations of canyons on the Atlantic margin of 504
North America have led many scientists to propose a model involving the upslope development 505
23
of a canyon from the continued retrogressive failure of a landslide complex initiated on the 506
continental slope (Shepard and Dill, 1966; Normark and Piper, 1968; Shepard and Buffington, 507
1968; Shepard, 1981; McGregor et al., 1982; Twichell and Roberts, 1982; Farre et al., 1983; 508
Posamentier et al., 1988; Normark and Piper, 1991). More recent studies, based on the 509
investigation of old buried canyon courses and integrating the ideas of Daly (1936), propose the 510
downslope erosion model (Pratson et al., 1994; Pratson and Coakley, 1996). In these works, the 511
authors invoke the need for both gravity flow erosion and retrogressive slope failure for 512
submarine canyon formation. Downslope sediment flow, induced by depositional oversteepening 513
and localised failure of the upper continental slope, is considered the major driver of canyon 514
initiation, which takes place in the upper continental slope through erosion of pre-canyon gullies. 515
These gullies act as topographic constraints from which submarine canyons and channels 516
develop. As these gullies grow into canyons, they widen through localised slope failure of the 517
oversteepened walls caused by destabilisation by sediment flow incision. The upslope advance of 518
the canyon is driven by retrogressive failure of the canyon head by sediment flow erosion. Valley 519
piracy plays an important role in establishing a main sediment drainage conduit in the initial 520
stages of the downslope erosion model. This model has been shown to explain canyon evolution 521
in many margins around the world, e.g. Angolan (Gee et al., 2007); South African (Green et al., 522
2007); Equatorial Guinean (Jobe et al., 2011); Chilean (Laursen and Normark, 2002); 523
Californian (Paull et al., 2003, 2005, 2013); Gulf of Lions (Sultan et al., 2007); and others (e.g., 524
Normark and Carlson, 2003; Pratson et al., 2009)). Our inferred valley evolution model for the 525
south Ebro Margin best corresponds to the downslope erosion model. 526
527
24
Shelf breaching is an important factor in our model. The significance of shelf breaching was first 528
demonstrated by Farre et al. (1983), who showed how connection to shelf-sourced sediment 529
contributes to the development from “youthful” to “mature” canyons. Valley evolution in our 530
study area appears to be most active when sediment influx to the slope is greatest, which 531
coincides with sea-level lowstands. Features 5 and 6, for example, have likely gone through 532
several phases of erosion and deposition as sea-level changed and shelf-edge depocentres shifted. 533
These patterns have been widely reported in the literature (Daly, 1936; Felix and Gorsline, 1971; 534
Twichell et al., 1977; Vail et al., 1977; Stanley et al., 1984; Posamentier et al., 1988; Bertoni and 535
Cartwright, 2005; Pratson et al., 2009). Submarine channel inception via a series of scours has 536
been documented in many recent studies (Pirmez and Imran, 2003; Fildani and Normark, 2004; 537
Fildani et al., 2006; Normark et al., 2009; Kostic, 2011; Covault et al., 2012; Fildani et al., 538
2013), as has the development of channel–levée systems in the channel marginal regions (Fildani 539
et al., 2006, 2013; Armitage et al., 2012). 540
541
Because our inferred model and observations agree with evolution models and case studies 542
reported widely in the literature, we can conclude that our hypothesis is validated and that time 543
can be substituted by space when reconstructing the evolution of submarine canyon and channel 544
systems in the south Ebro Margin. This means that valleys ordered in a sequence of increasing 545
thalweg length represent an evolutionary pathway of stages of increased landform development. 546
Can the space-for-time substitution also be used to infer the age of the submarine valleys? We 547
cannot establish the age of the valleys from our data set, and this would be a difficult endeavour 548
anyhow because submarine valleys are erosive features that cut the sediments accumulated 549
during the onset of their formation (Pratson et al., 2009). There also exists the possibility that the 550
25
valley piracy may have slowed down or halted the development of valleys 2–4. Inferring 551
landform age directly from morphology is therefore difficult. 552
553
There is also the possibility that morphological differences observed in the valleys in our study 554
area are a result of different seafloor processes or conditions rather than extent of landform 555
development or age. We do not think that this is the case. Our study area is relatively small 556
(~500 km2) and the continental slope is characterised by quasi-uniform slope gradient, structure, 557
substrate and oceanographic conditions (Farrán and Maldonado, 1990; Field and Gardner, 1990; 558
Font et al., 1990; Amblas et al., 2006, 2011, 2012; Urgeles et al., 2011). The material being 559
eroded is predominantly Plio-Quaternary shelf-margin deltaic and slope depositional units, 560
whilst the control of extensional and thrust faults on the seafloor is more important further south. 561
Influence from other rivers, such as the Ebro, is unlikely because its mouth was located at least 562
15 km from the head of feature 6 during the last sea level lowstand (Farrán and Maldonado, 563
1990), and because shelf edge depocentres across the Ebro Margin only fed one canyon at a time 564
(Alonso et al., 1990). 565
566
5.3 New insights into submarine canyon-channel system evolution in a passive 567
progradational margin 568
569
Since the space-for-time substitution model can be applied to the south Ebro Margin, we use 570
some of the morphometric results derived in Section 4.3 to identify patterns in the morphological 571
evolution of submarine canyons. These patterns include: 572
573
26
(i) Valley planform shape is geometrically similar at consecutive stages of evolution, as 574
indicated by the isotropic scaling of linear length with width and compliance with 575
Hack’s Law with an exponent <0.5 (Fig. 11A,C; Hack, 1957). This is similar to what has 576
been observed in terrestrial river drainage basins (Montgomery and Dietrich, 1992; 577
Rigon et al., 1996; Dade, 2001). 578
(ii) Canyon longitudinal profiles evolve towards equilibrium between canyon form and 579
imposed water and sediment load, with no net erosion or deposition taking place. This is 580
demonstrated by the exponential decay of thalweg slope gradient and asymptotic growth 581
of profile concavity with increasing thalweg length (Figs. 9A and 10D). This pattern has 582
been reported in submarine channels (Pirmez et al., 2000; Kneller, 2003). 583
(iii) Canyon draining efficiency increases, and energy expenditure is minimised, with 584
evolution, as implied by the decrease in drainage density and bifurcation ratio with 585
increasing thalweg length (Fig. 10D), in spite of increasing water and sediment loads. 586
This has been documented in terrestrial drainage basins (Rinaldo et al., 1992). 587
588
The variations of valley slope gradient and thalweg length with stream order (Fig. 11B) also 589
show that submarine canyons share additional morphologic similarities with terrestrial drainage 590
basins. 591
592
The following three relationships – isotropic scaling of linear length with width, compliance with 593
Hack’s Law, and asymptotic growth of profile concavity with thalweg length – no longer apply 594
when feature 6 is included in the plots (Fig. 11A,C,D). We interpret this as clear evidence of a 595
significant geomorphological system change due to an extrinsic disturbance. This disturbance is 596
27
of the ramp type (Brunsden and Thornes, 1979), involving a sustained increase in sediment flow 597
into the canyon related to the direct connection of the palaeo-river with the canyon head. The 598
response to this disturbance is a considerable change in the valley formation dynamics, entailing 599
a shift from a process domain characterised by deepening and lateral widening of the canyon’s 600
upper reaches, to one dominated by extensive downslope elongation and the formation of a 601
channel and associated deep-water deposits. 602
603
Our study also provides interesting insights into the early stages of canyon development. First, 604
canyon elongation is generally higher downslope, which contrasts with the predominant 605
headward development of submarine canyons reported in numerous models (e.g. Pratson et al., 606
1994, 2009). Second, the canyon goes through an early stage of rapid incision, where the rate of 607
change of depth is much higher than that of the width, and where wall erosion is minimal. This is 608
very similar to the process of “erosion narrowing” reported in terrestrial rivers (Cantelli et al., 609
2004). Third, the increase of the valley to depth ratio from 7.5 to 20.3 (Fig. 10B) indicates that 610
the valley widens more than it deepens with maturity, suggesting that the influence of flank slope 611
failures increases as the valley develops. 612
613
One final consideration relates to the regular spacing observed between features 4, 5, X, Y and Z. 614
We have two explanations for this. The first is that regular spacing emerges over time due to 615
competition for drainage area, as proposed for terrestrial landscapes (Perron et al., 2009). As 616
irregularly spaced incipient valleys grow, competition for drainage area leads some valleys to 617
capture more area. This halts the growth of neighbouring valleys that are either too small or 618
closely spaced, resulting in the topography approaching a deterministic equilibrium where valley 619
28
spacing is approximately uniform (Perron et al., 2008). A second cause of regular spacing may 620
be spring sapping interacting with slope failure processes (Orange et al., 1994). The creation of 621
high head gradients at canyons leads to a reduction in the head gradient in the surrounding 622
seafloor, which results in the fastest growing valleys capturing flow of smaller neighbouring 623
valleys. We therefore propose that the occurrence and extent of regular spacing between valleys 624
across the south Ebro Margin is determined by valley piracy. 625
626
5.4 Applicability of our results to other margins 627
628
The conclusions we have derived so far are likely applicable to the majority of the Ebro Margin 629
because it is characterised by a similar sedimentary and structural setting to that of our study area 630
(Canals et al., 2000). The canyon–channel systems located in this region share similar 631
dimensions and morphologies to those in our study area, including regular spacing and 632
downslope elongation. They locally differ, however, in having been connected to different 633
palaeo-rivers and in their interaction with large-scale slope failures. 634
635
The described patterns in the morphological evolution of submarine canyons may be applicable 636
to other passive margins around the world. The Atlantic passive margin of the USA is 637
comparable to the Ebro Margin; canyons are initiated by sediment flows triggered along the shelf 638
edge and upper slope, and their development was driven by lateral shifts of shelf-edge delta 639
depocentres (Farrán and Maldonado, 1990; Pratson et al., 1994). Examination of published data 640
from the USA mid-Atlantic margin, for instance, reveals that the canyons are regularly spaced 641
and those do not incise the shelf share a similar canyon head depth but different canyon terminus 642
29
depths, indicating that downslope elongation was prevalent (Pratson et al., 1994; Mitchell, 2004; 643
Brothers et al., 2013a,b; Vachtman et al., 2013; Obelcz et al., in press). The above similarities 644
also apply to the Ligurian, north-west Black Sea and Equatorial Guinea margins (Popescu et al., 645
2004; Jobe et al., 2011; Migeon et al., 2011). 646
647
The applicability of the space-for-time-substitution concept is potentially wide. Apart from the 648
USA Atlantic margin, where Twichell and Roberts (1982) and Farre et al. (1983) used the 649
concept to reconstruct canyon evolution by retrogressive failure, space-for-time-substitution 650
appears to be valid in a number of settings recently documented in the literature. High resolution 651
seafloor data sets from offshore La Réunion Island, which comprises a shield volcanic island 652
where a direct connection between terrestrial rivers and submarine canyon exists, show that 653
successive stages of canyon formation can be interpreted from variations in canyon thalweg 654
length and morphologies (Babbonneau et al., 2013). Seafloor data from the Argentine passive 655
continental margin have been interpreted to show how the longer, more developed canyons in the 656
north are likely more long-lived features than the shorter canyons in the south, where canyon 657
formation is more incipient (Lastras et al., 2011). 658
659
6. Conclusions 660
661
In this study we analysed multibeam echosounder data and in situ measurements from the south 662
Ebro Margin to test whether the concept of space-for-time substitution can be used to reconstruct 663
the evolution of a submarine canyon–channel system in a passive progradational margin. By 664
organising selected submarine valleys in a sequence of increasing valley thalweg length and 665
30
analysing their morphology and morphometry, we were able to propose a morphological model 666
of submarine valley evolution. This model entails the development of a first-order gully eroded 667
on the continental slope into a shelf-breaching dendritic canyon and, finally, into a canyon–668
channel system extending into the lower continental slope and rise. Two processes are 669
responsible for valley erosion – gravity flows, likely sourced by failure of the outermost shelf 670
and wave loading during sea-level lowstands, and flank slope failures. The initial stages are 671
dominated by incision and downslope elongation. As the valley develops, shelf breaching and 672
connection with a palaeo-river result in a sharp increase in valley growth in the upper reaches 673
and in the formation of a long, sinuous channel. Since our model shows many parallels with 674
established models in the literature, we conclude that time can be substituted by space when 675
reconstructing the evolution of submarine canyon and channel systems in the south Ebro Margin. 676
This means that valleys ordered in a sequence according to their thalweg length represent 677
evolutionary pathway of stages of increased landform development. 678
679
Morphometric results derived from the application of space-for-time substitution model in the 680
south Ebro Margin allowed us to gain new insights into the morphological evolution of 681
submarine canyons in a passive progradational margin. These include the following: (i) canyon 682
planform shape is geometrically similar at consecutive stages of evolution; (ii) canyon 683
longitudinal profiles evolve towards equilibrium between canyon form and imposed water and 684
sediment load; (iii) canyon draining efficiency increases and energy expenditure is minimised 685
with evolution; (iv) canyon elongation is generally higher downslope; (v) canyons go through an 686
early stage of rapid incision similar to the process of “erosion narrowing” reported in terrestrial 687
rivers; and (vi) the influence of flank slope failures increases as the canyon develops. 688
31
689
We demonstrate that the conclusions of our study are not limited to submarine valleys in the 690
south Ebro Margin but they are applicable to other margins around the world. 691
692
Acknowledgements 693
694
This research was supported by Marie Curie Intra-European Fellowship PIEF-GA-2009-252702, 695
Marie Curie Career Integration Grant PCIG13-GA-2013-618149 and HERMIONE (grant 696
agreement 226354) within the 7th European Community Framework Programme, DOS MARES 697
(CTM2007-66316-C02-01/MAR), GRACCIE-CONSOLIDER (CSD2007-00067), CASCADES 698
(CTM2008-01334-E) and COSTEM (CTM2009-07806) projects. We are indebted to the crew 699
and technicians of BIO Hespérides, RV L’Atalante and BIO García del Cid for their help in 700
collecting the data. 210Pb analysis of sediment samples was conducted at Laboratori de 701
Radioactivitat Ambiental of the Universitat Autònoma de Barcelona (UAB). Lincoln Pratson and 702
David Amblas are thanked for reviewing an earlier version of this manuscript. AM, MC, GL and 703
XT belong to CRG on Marine Geociences, supported by grant 2009 SGR 1305, Generalitat de 704
Catalunya. 705
706
32
References 707
708
Allen, S.E., Durrieu de Madron, X., 2009. A review of the role of submarine canyons in deep-709
ocean exchange with the shelf. Ocean Science 5, 607-620. 710
Alonso, B., Maldonado, A., 1990. Late Quaternary sedimentation patterns of the Ebro turbidite 711
sytems (northwestern Mediterranean): Two styles of deep-sea deposition. Marine 712
Geology 95, 353-377. 713
Alonso, B., Field, M.E., Gardner, J.M., Maldonado, A., 1990. Sedimentary evolution of the 714
Pliocene and Pleistocene Ebro margin, northeastern Spain. Marine Geology 95, 265-288. 715
Amblas, D., Canals, M., Urgeles, R., Lastras, G., Liquete, C., Hughes-Clarke, J.E., Casamor, 716
J.L., Calafat, A.M., 2006. Morphogenetic mesoscale analysis of the northeastern Iberian 717
margin, NW Mediterranean Basin. Marine Geology 234, 3-20. 718
Amblas, D., Gerber, T.P., Canals, M., Pratson, L.F., Urgeles, R., Lastras, G., Calafat, A., 2011. 719
Transient erosion in the Valencia Trough turbidite systems, NW Mediterranean Basin. 720
Geomorphology 130, 173-184. 721
Amblas, D., Gerber, T.P., De Mol, B., Urgeles, R., Garcia-Castellanos, D., Canals, M., Pratson, 722
L.F., Robb, N., Canning, J., 2012. The survival of a submarine canyon during long-term 723
outbuilding of a continental margin. Geology 40, 543-546. 724
Antrobreh, A., Krastel, S., 2006. Morphology, seismic characteristics and development of Cap 725
Timiris Canyon, offshore Mauritania: A newly discovered canyon preserved off a major 726
arid climatic region. Marine and Petroleum Geology 23, 37-59. 727
Armitage, D.A., McHargue, T., Fildani, A., Graham, S.A., 2012. Post-avulsion channel 728
evolution; Niger Delta continental slope. AAPG Bulletin 96, 823-843. 729
33
Babbonneau, N., Delacourt, C., Cancouet, R., Sisavath, E., Bachelery, P., Mazuel, A., Jorry, S.J., 730
Deschamps, A., Ammann, J., Villeneuve, N., 2013. Direct sediment transfer from land to 731
deep-sea: Insights into shallow multibeam bathmetry at La Réunion Island. Marine 732
Geology 346, 47-57. 733
Baztan, J., Berné, S., Olivet, J.L., Rabineau, M., Aslanian, D., Gaudin, M., Réhault, J.P., Canals, 734
M., 2005. Axial incision: The key to understand submarine canyon evolution (in the 735
western Gulf of Lion). Marine and Petroleum Geology 22, 805-826. 736
Bertoni, C., Cartwright, J., 2005. 3D seismic analysis of slope-confined canyons from the Plio-737
Pleistocene of the Ebro Continental Margin (Western Mediterranean). Basin Research 17, 738
43-62. 739
Boltzmann, L., 1871. Einige allgemeine satze uber warmegleichgewicht. Wiener Berichte 63, 740
679-711. 741
Brothers, D.S., Ten Brink, U.S., Andrews, B.A., Chaytor, J.D., 2013a. Geomorphic 742
characterization of the U.S. Atlantic continental margin. Marine Geology 338, 46-63. 743
Brothers, D.S., Ten Brink, U.S., Andrews, B.D., Chaytor, J.D., Twichell, D.C., 2013b. 744
Geomorphic process fingerprints in submarine canyons. Marine Geology 337, 53-66. 745
Brunsden, D., Thornes, J.B., 1979. Landscape sensitivity and change. Transactions of the 746
Institute of British Geographers 4, 463-484. 747
Burger, R.L., Fulthorpe, C.S., Austin, J.A., 2001. Late Pleistocene channel incisions in the 748
southern Eel River basin, Northern California: Implications for tectonic vs. eustatic 749
influences on shelf sedimentation patterns. Marine Geology 177, 317-330. 750
34
Cacchione, D.A., Drake, D.E., Losada, M.A., Medina, R., 1990. Bottom-boundary layer 751
measurements on the continental shelf off the Ebro River, Spain. Marine Geology 95, 752
179-192. 753
Canals, M., Casamor, J.L., Urgeles, R., Lastras, G., Calafat, A.M., De Batist, M., Masson, D.G., 754
Berné, S., Alonso, B., Hughes-Clarke, J.E., 2000. The Ebro Continental Margin, Western 755
Mediterranean Sea: Interplay between canyon-channel systems and mass wasting 756
processes. In: Nelson, C.H., Weimer, P. (Eds.), Deep-Water Reservoirs of the World: 757
GCSSEPM Foundation 20th Annual Research Conference, Houston, USA, pp. 152-174. 758
Canals, M., Amblas, D., Lastras, G., Sànchez-Vidal, A., Calafat, A., Rayo, X., Casamor, J.L., 759
2012. Els canyons submarins, Història Natural dels Països Catalans: La Terra a l’Univers. 760
Fundació Enciclopèdia Catalana, Barcelona, pp. 251-272. 761
Canals, M., Company, J.B., Martin, D., Sanchez-Vidal, A., Ramirez-Llodra, E., 2013. Integrated 762
study of Mediterranean deep sea canyons: Novel results and future challenges. Progress 763
in Oceanography 118, 1-27. 764
Canals, M., Puig, P., Durrieu de Madron, X., Heussner, S., Palanques, A., Fabres, J., 2006. 765
Flushing submarine canyons. Nature 444, 354-357. 766
Cantelli, A., Paola, C., Parker, G., 2004. Experiments on upstream-migrating erosional 767
narrowing and widening of an incisional channel caused by dam removal. Water 768
Resources Research 40, W03304, doi:10.1029/2003WR002940. 769
Casas, D., Ercilla, G., Baraza, J., Alonso, B., Maldonado, A., 2003. Recent mass-movement 770
processes on the Ebro continental slope (NW Mediterranean). Marine and Petroleum 771
Geology 20, 445-457. 772
35
Clark, J.D., Pickering, K.T., 1996. Submarine Channels: Process and Architecture. Vallis Press, 773
London. 774
Covault, J.A., Fildani, A., Romans, B.W., McHargue, T., 2011. The natural range of submarine 775
canyon-and-channel longitudinal profiles. Geosphere 7, 313-332. 776
Covault, J.A., Shelef, E., Traer, M., Hubbard, S.M., Romans, B.W., Fildani, A., 2012. Deep-777
water channel run-out length: Insights from seafloor geomorphology. Journal of 778
Sedimentary Research 82, 25-40. 779
Dade, W.B., 2001. Multiple scales in river basin morphology. American Journal of Science 301, 780
60-73. 781
Daly, R.A., 1936. Origin of submarine "canyons". American Journal of Science 31, 401-420. 782
Díaz, J.I., Nelson, C.H., Barber, J.H., Giró, S., 1990. Late Pleistocene and Holocene sedimentary 783
facies on the Ebro continental shelf. Marine Geology 95, 333-352. 784
Díaz, J.I., Palanques, A., Nelson, C.H., Guillén, J., 1996. Morpho-structure and sedimentology of 785
the Holocene Ebro prodelta mud belt (northwestern Mediterranean Sea). Continental 786
Shelf Research 16, 435-456. 787
Emery, K.O., Uchupi, E., 1972. Western North Atlantic Ocean: Topography, Rocks, Structure, 788
Water, Life and Sediments, Memoir 17, Tulsa. 789
Farrán, M., Maldonado, A., 1990. The Ebro continental shelf: Quaternary seismic stratigraphy 790
and growth patterns. Marine Geology 95, 289-312. 791
Farre, J.A., McGregor, B.A., Ryan, W.B.F., Robb, J.M., 1983. Breaching the shelfbreak: Passage 792
from youthful to mature phase in submarine canyon evolution. Society of Economic 793
Paleontologists and Mineralogists, Special Publication 33, 25-39. 794
36
Felix, D.W., Gorsline, D.S., 1971. Newport submarine canyon, California: An example of the 795
effects of shifting loci of sand supply upon canyon position. Marine Geology 10, 177-796
198. 797
Field, M.E., Gardner, J.V., 1990. Pliocene-Pleistocene growth of the Rio Ebro margin, northeast 798
Spain: A prograding slope model. Geological Society of America Bulletin 102, 721-733. 799
Field, M.E., Gardner, J.V., Prior, D.B., 1999. Geometry and significance of stacked gullies on 800
the northern California slope. Marine Geology 154, 271-286. 801
Fildani, A., Hubbard, S.M., Covault, J.A., Maier, K.L., Romans, B.W., Traer, M., Rowland, J.C., 802
2013. Erosion at inception of deep-sea channels. Marine and Petroleum Geology 41, 48-803
61. 804
Fildani, A., Normark, W.R., 2004. Late Quaternary evolution of channel and lobe complexes of 805
Monterey Fan. Marine Geology 206, 199-223. 806
Fildani, A., Normark, W.R., Kostic, S., Parker, G., 2006. Channel formation by flow stripping: 807
Large-scale scour features along the Monterey East Channel and their relation to 808
sediment waves. Sedimentology 53, 1265-1287. 809
Font, J., Salat, J., Julià, A., 1990. Marine circulation along the Ebro continental margin. Marine 810
Geology 95, 165-178. 811
Fryirs, K., Brierly, G.J., Erskine, W.D., 2012. Use of ergodic reasoning to reconstruct the 812
historical range of variability and evolutionary trajectory of rivers. Earth Surface 813
Processes and Landforms 37, 763-773. 814
Gee, M.J.R., Gawthorpe, R.L., Bakke, K., Friedmann, S.J., 2007. Seismic geomorphology and 815
evolution of submarine channels from the Angolan continental margin. Journal of 816
Sedimentary Research 77, 433-446. 817
37
Gerber, T.P., Amblas, D., Wolinsky, M.A., Pratson, L.F., Canals, M., 2009. A model for the 818
long-profile shape of submarine canyons. Journal of Geophysical Research 114, F03002, 819
doi: 10.1029/2008JF001190.. 820
Glock, W.S., 1931. The development of drainage systems: A synoptic view. Geographical 821
Review 21, 475-482. 822
Green, A.N., Goff, J.A., Uken, R., 2007. Geomorphological evidence for upslope canyon-823
forming processes on the northern KwaZulu-Natal shelf, SW Indian Ocean, South Africa. 824
Geo-Marine Letters 27, 399-409. 825
Grünthal, G., Bosse, C., Sellami, S., Mayer-Rosa, D., Giardini, D., 1999. Compilations of the 826
GSHAP regional seismic hazard for Europe, Africa and the Middle East. Annales 827
Geophysicae 42, 1215-1223. 828
Guillén, J., Palanques, A., Puig, P., Durrieu de Madron, X., Nyffeler, F., 2000. Field calibrations 829
of optical sensors for measuring suspended sediment concentration in the western 830
Mediterranean. Scientia Marina 64, 427-435. 831
Hack, J.T., 1957. Studies of longitudinal stream profiles in Virginia and Maryland. US 832
Geological Survey Professional Paper 294-B, 45-97. 833
Harris, P.T., Whiteway, T., 2011. Global distribution of large submarine canyons: Geomorphic 834
differences between active and passive continental margins. Marine Geology 285, 69-86. 835
Heussner, S., Ratti, C., Carbonne, J., 1990. The PPS3 time-series sediment trap and the trap 836
sample processing techniques used during the ECOMARGE experiment. Continental 837
Shelf Research 10, 943-958. 838
Hilley, G.E., Arrowsmith, 2011. Geomorphic response to uplift along the Dragon's Back 839
pressure ridge, Carrizo Plain, California. Geology 36, 367-370. 840
38
Huggett, R.J., 1998. Soil chronosequences, soil development and soil evolution: A critical 841
review. Catena 32, 155-172. 842
Jobe, Z.R., Lower, D.R., Uchytil, S.J., 2011. Two fundamentally different types of submarine 843
canyons along the continental margin of Equatorial Guinea. Marine and Petroleum 844
Geology 28, 843-860. 845
Kertznus, V., Kneller, B., 2009. Clinoform quantification for assessing the effects of external 846
forcing on continental margin development. Basin Research 21, 738-758. 847
Kirkbride, M., Matthews, D., 1997. The role of fluvial and glacial erosion in landscape 848
evolution: The Ben Ohau Range, New Zealand. Earth Surface Processes and Landforms 849
22, 317-327. 850
Kneller, B., 2003. The influence of flow parameters on turbidite slope channel architecture. 851
Marine and Petroleum Geology 20, 901-910. 852
Kostic, S., 2011. Modeling of submarine cyclic steps: Controls on their formation, migration, 853
and architecture. Geosphere 7, 294-304. 854
Lambeck, K., Bard, E., 2000. Sea-level change along the French Mediterranean coast for the past 855
30000 years. Earth and Planetary Science Letters 175, 203-222. 856
Lastras, G., Acosta, J., Muñoz, A., Canals, M., 2011. Submarine canyon formation and evolution 857
in the Argentine Continental Margin between 44°30'S and 48°S. Geomorphology 128, 858
116-136. 859
Lastras, G., Canals, M., Hughes-Clarke, J.E., Moreno, A., De Batist, M., Masson, D.G., 860
Cochonat, P., 2002. Seafloor imagery from the BIG'95 debris flow, western 861
Mediterranean. Geology 30, 871-874. 862
39
Laursen, J., Normark, W.R., 2002. Late Quaternary evolution of the San Antonio Submarine 863
Canyon in the central Chile forearc ( 33°S). Marine Geology 188, 365-390. 864
Leyland, J., Darby, S.E., 2008. An empirical–conceptual gully evolution model for channelled 865
sea cliffs. Geomorphology 102, 419-434. 866
Li, X., Sun, Y., Mander, U., He, Y., 2011. Effects of land use intensity on soil nutrient 867
distribution after reclamation in an estuary landscape. Landscape Ecology 28, 699-707. 868
Lo Iacono, C., Guillén, J., Puig, P., Ribó, M., Ballesteros, M., Palanques, A., Farrán, M., Acosta, 869
J., 2010. Large-scale bedforms along a tideless outer shelf setting in the western 870
Mediterranean. Continental Shelf Research 30, 1802-1813. 871
McGregor, B.A., Stubblefield, W.L., Ryan, W.B.F., Twichell, D.C., 1982. Wilmington 872
submarine canyon: A marine fluvial-like system. Geology 10, 27-30. 873
Micallef, A., Mountjoy, J.J., 2011. A topographic signature of a hydrodynamic origin for 874
submarine gullies. Geology 39, 115-118. 875
Migeon, S., Cattaneo, A., Hassoun, V., Larroque, C., Corradi, N., Fanucci, F., Dano, A., Mercier 876
de Lepinay, B., Sage, F., Gorini, C., 2011. Morphology, distribution and origin of recent 877
submarine landslides of the Ligurian Margin (North-western Mediterranean): Some 878
insights into geohazard assessment. Mar Geophys Res 32, 225-243. 879
Mitchell, N.C., 2004. Form of submarine erosion from confluences in Atlantic USA continental 880
slope canyons. American Journal of Science 304, 590-611. 881
Montgomery, D.R., Dietrich, W.E., 1992. Channel initiation and the problem of landscape scale. 882
Science 255, 826-830. 883
Nelson, C.H., 1990. Estimated post-Messinian sediment supply and sedimenation rates on the 884
Ebro continental margin. Marine Geology 95, 395-418. 885
40
Nittrouer, C.A., Sternberg, R.W., Carpenter, R., Bennett, J.T., 1979. The use of Pb-210 886
geochronology as a sedimentological tool: application to the Washington continental 887
shelf. Marine Geology 31, 297-316. 888
Normark, W.R., Carlson, P.R., 2003. Giant submarine canyons: Is size any clue to their 889
importance in the rock record? Geological Society of America Special Paper 370, 175-890
190. 891
Normark, W.R., Piper, D.J.W., 1968. Deep-sea fan valleys, past and present. Geological Society 892
of America Bulletin 80, 1859-1866. 893
Normark, W.R., Piper, D.J.W., 1991. Initiation processes and flow evolution of turbidity 894
currents: Implications for the depositional record. In: Osborne, R.E. (Ed.), From 895
Shoreline to Abyss: Contributioons in Marine Geology in Honor of Francis Parker 896
Shepard, pp. 207-230. 897
Normark, W.R., Paull, C.K., Caress, D.W., Sliter, R., 2009. Fine-scale relief related to Late 898
Holocene channel shifting within the floor of the upper Redondo Fan, offshore southern 899
California. Sedimentology 56, 1670-1689. 900
Obanawa, H., Hayakawa, Y.S., Matsukura, Y., 2009. Rates of slope decline, talus growth and 901
cliff retreat along the Shomyo River in central Japan: A space-time substitution approach. 902
Geografiska Annaler 91, 269-278. 903
Obelcz, J., Brothers, D., Chaytor, J.D., ten Brink, U.S., Ross, S.W., Brooke, S., in press. 904
Geomorphic characterization of four shelf-sourced submarine canyons along the U.S. 905
Mid-Atlantic continental margin. Deep-Sea research Part II. 906
Orange, D.L., Anderson, R.S., Breen, N.A., 1994. Regular canyon spacing in the submarine 907
environment: The link between hydrology and geomorphology. GSA Today 4(29), 36-39. 908
41
Paine, D.M., 1985. 'Ergodic' reasoning in geomorphology: Time for a review of the term? 909
Progress in Physical Geography 9, 1-15. 910
Palanques, A., Plana, F., Maldonado, A., 1990. Recent influence of man on the Ebro margin 911
ssedimentation system, northwestern Mediterranean Sea. Marine Geology 95, 247-273. 912
Palanques, A., Puig, P., Guillén, J., Jiménez, J., Gracia, V., Sànchez-Arcilla, A., Madsen, O., 913
2002. Near-bottom suspended sediment fluxes on the microtidal low-energy Ebro 914
continental shelf (NW Mediterranean). Continental Shelf Research 22, 285-303. 915
Parker, G., Izumi, N., 2000. Purely erosional cyclic and solitary steps created by flow over a 916
cohesive bed. Journal of Fluid Mechanics 419, 203-238. 917
Parsons, J.D., Friedrichs, C.T., Mohrig, D., Traykovski, P., Imran, J., Syvitski, J.P., Parker, G., 918
Puig, P., Buttles, J., Garcia, M.H., 2006. The mechanics of marine sediment gravity 919
flows. In: C.A. Nittrouer, J.A. Austin, M. Field, M.S. Steckler, J.P. Syvitski, P.L. Wiberg 920
(Eds.), Continental Margin Sedimentation: From Sediment Transport to Sequence 921
Stratigraphy. Blackwell Publishing, Oxford, pp. 275-338. 922
Paull, C.K., Ussler, W., Greene, H.G., Keaten, R., Mitts, P., Barry, J., 2003. Caught in the act: 923
The 20 December 2001 gravity flow event in Monterey Canyon. Geo-Marine Letters 22, 924
227-232. 925
Paull, C.K., Ussler, W., Greene, H.G., Keaten, R., Mitts, P., Barry, J., 2003. Caught in the act: 926
The 20 December 2001 gravity flow event in Monterey Canyon. Geo-Marine Letters 22, 927
Paull, C.K., Mitts, P., Ussler, W., Keaten, R., Greene, H.G., 2005. Train of sand in the 928
upper Monterey Canyon. Geological Society of America Bulletin 117, 1134-1145. 929
227-232. 930
42
Paull, C.K., Caress, D.W., Lundsten, E., Gwiazda, R., Anderson, K., McGann, M., Conrad, J., 931
Edwards, B., Sumner, E.J., 2013. Anatomy of the La Jolla Submarine Canyon system; 932
offshore southern California. Marine Geology 335, 16-34. 933
Perron, J.T., Dietrich, W.E., Kirchner, J.W., 2008. Controls on the spacing of first-order valleys. 934
Journal of Geophysical Research 113, F04016, doi:10.1029/2007JF000977.. 935
Perron, J.T., Kirchner, J.W., Dietrich, W.E., 2009. Formation of evenly spaced ridges and 936
valleys. Nature 460, 502-505. 937
Pickett, S.T.A., 1989. Space-for-time substitution as an alternative to long term studies. In: 938
Likens, G.E. (Ed.), Long-Term Studies in Ecology. Springer-Verlag, New York, pp. 110-939
135. 940
Piper, D.J.W., Normark, W.R., 2009. Processes that initiate turbidity currents and their influence 941
on turbidites: A marine geology perspective. Journal of Sedimentary Research 79, 347-942
362. 943
Pirmez, C., Beaubouef, R.T., Friedmann, S.J., Mohrig, D.C., 2000. Equilibrium profile and 944
baselevel in submarine channels: Examples from Late Pleistocene systems and 945
implications for the architecture of deep water reservoirs. In: Weimar, P., Slatt, R.M., 946
Coleman, J.M., Rosen, N.C., Nelson, H., Bouma, A.H., Styzen, M.J., Lawrence, D.T. 947
(Eds.), Deep Water Reservoirs of the World. GCSSEPM Foundation 20th Annual 948
Research Conference, pp. 782-805. 949
Pirmez, C., Imran, J., 2003. Reconstruction of turbidity currents in Amazon channel. Marine and 950
Petroleum Geology 20, 823-849. 951
43
Popescu, I., Lericolais, G., Panin, N., Normand, A., Dinu, C., Le Drezen, É., 2004. The Danube 952
submarine canyon (Black Sea): Morphology and sedimentary processes. Marine Geology 953
206, 249-265. 954
Posamentier, H.W., Jervey, M.T., Vail, P.R., 1988. Eustatic controls on clastic deposition, I. 955
Conceptual framework. In: Wilgus, C.K., Hastings, B.S., Kendall, M.A., Posamentier, 956
H.W., Ross, C.A., Van Wagoner, J.C. (Eds.), Sea Level Changes – An Integrated 957
Approach. SEPM Special Publication No. 42, pp. 125-154. 958
Pratson, L.F., Coakley, B.J., 1996. A model for the headward erosion of submarine canyons 959
induced by downslope-eroding sediment flows. Geological Society of America Bulletin 960
108, 225-234. 961
Pratson, L.F., Ryan, W.B.F., Mountain, G.S., Twichell, D.C., 1994. Submarine canyon initiation 962
by downslope-eroding sediment flows: Evidence in late Cenozoic strata on the New 963
Jersey continental slope. Geological Society of America Bulletin 106, 395-412. 964
Pratson, L.F., Nittrouer, C.A., Wiberg, P.L., Steckler, M.S., Swenson, J.B., Cacchione, D.A., 965
Karson, J.A., Murray, A.B., Wolinsky, M.A., Gerber, T.P., Mullenbach, B.L., Spinelli, 966
G.A., Fulthorpe, C.S., O'Grady, D.B., Parker, G., Driscoll, N.W., Burger, R.L., Paola, C., 967
Orange, D.L., Field, M.E., Friedrichs, C.T., Fedele, J.J., 2009. Seascape evolution on 968
clastic continenal shelves and slopes. In: C.A. Nitrouer, J.A. Austin, M.E. Field, J.H. 969
Kravitz, J.P.M. Syvitski, P.L. Wiberg (Eds.), Continental Margin Sedimentation: From 970
Sediment Transport to Sequence Stratigraphy: IAP Special Publication. Blackwell 971
Publishing, Oxford, pp. 339-380. 972
Puertos del Estado, 2013. Extremos Máximos de oleaje (Altura Significante), Boya de Valencia, 973
Periodo 2005-2012. 974
44
Puig, P., Palanques, A., Guillén, J., 2001. Near-bottom suspended sediment variability caused by 975
storms and near-inertial internal waves in the Ebro mid continental shelf (NW 976
Mediterranean). Marine Geology 178, 81-93. 977
Puig, P., Ogston, A.S., Mullenbach, B.L., Nittrouer, C.A., Parson, J.D., Sternberg, R.W., 2004. 978
Storm-induced sediment gravity flows at the head of the Eel submarine canyon, northern 979
California margin. Journal of Geophysical Research 109, C03019, 980
doi:10.1029/2003JC001918.. 981
Puig, P., Palanques, A., Orange, D., Lastras, G., Canals, M., 2008. Dense shelf water cascades 982
and sedimentary furrow formation in the Cap de Creus Canyon, northwestern 983
Mediterranean Sea. Continental Shelf Research 28, 2017-2030. 984
Puig, P., Palanques, A., Martín, J., 2014. Contemporary sediment-transport processes in 985
submarine canyons. Annual Review of Marine Science 6, 53-77. 986
Ribó, M., Puig, P., Palanques, A., Lo Iacono, C., 2011. Dense shelf water cascades in the Cap de 987
Creus and Palamós submarine canyons during winters 2007 and 2008. Marine Geology 988
284, 175-188. 989
Rigon, R., Rodríguez-Iturbe, I., Maritan, A., Giacometti, A., Tarboton, D.G., Rinaldo, A., 1996. 990
On Hack's Law. Water Resources Research 32, 3367-3374. 991
Rinaldo, A., Rodriguez-Iturbe, I., Rigon, R., Bras, R.L., Ijjasz-Vasquez, E., Marani, A., 1992. 992
Minimum energy and fractal structures of drainage networks. Water Resources Research 993
28, 2183-2195. 994
Sanchez-Cabeza, J.A., Masqué, P., Ani-Ragolta, I., 1998. 210Pb and 210Po analysis in sediments 995
and soils by microwave acid digestion. Journal of Radioanalytical and Nuclear Chemistry 996
227, 19-22. 997
45
Sànchez-Vidal, A., Canals, M., Calafat, A., Lastras, G., Pedrosa-Pàmies, R., Menéndez, M., 998
Medina, R., Company, J.B., Hereu, B., Romero, J., Alcoverro, T., 2012. Impacts on the 999
deep-sea ecosystem by a severe coastal storm. PLoS ONE 7, e30395, 1000
doi:10.1371/journal.pone.0030395. 1001
Schmidt, K.H., Meitz, P., 2000. Effects of increasing humidity on slope geomorphology: Cuesta 1002
scarps on the Colorado Plateau, USA, The Hydrology-Geomorphology Interface: 1003
Rainfall, Floods, Sedimentation, Land Use, Jerusalem, pp. 165-181. 1004
Schumm, S.A., Harvey, M.D., Watson, C.C., 1984. Incised Channels: Morphology, Dynamics 1005
and Control. Water Resources Publications, Chelsea, Michigan. 1006
Shepard, F.P., 1981. Submarine canyons: Multiple causes and long-time persistence. American 1007
Association of Petroleum Geologists Bulletin 65, 1062-1077. 1008
Shepard, F.P., Buffington, E.C., 1968. La Jolla submarine fan-valley. Marine Geology 6, 107-1009
143. 1010
Shepard, F.P., Dill, R.F., 1966. Sumbarine Canyons and Other Sea Valleys. Rang McNally, 1011
Chicago. 1012
Simon, A., Hupp, C.R., 1986. Channel evolution in modified Tennessee channels, Proceedings 1013
of the Fourth Federal Interagency Sedimentation Conference. US Government Printing 1014
Office, Washington D.C., pp. 71-82. 1015
Stanley, D.J., Nelsen, T.A., Stuckenrath, R., 1984. Recent sedimentation on the New Jersey 1016
slope and rise. Science 226, 125-133. 1017
Stolar, D.B., Willett, S.D., Montgomery, D.R., 2007. Characterization of topographic steady 1018
state in Taiwan. Earth and Planetary Science Letters 261, 421-431. 1019
46
Strahler, A.N., 1952. Hypsometric (area-altitude) analysis of erosional topography. Geological 1020
Society of America Bulletin 63, 1117-1142. 1021
Sultan, N., Gaudin, M., Berne, S., Canals, M., Urgeles, R., Lafuerza, S., 2007. Analysis of slope 1022
failure in submarine canyon heads: An example from the Gulf of Lions. Journal of 1023
Geophysical Research 112, F01009, doi:10.1029/2005JF000408. 1024
Twichell, D.C., Knebel, H.J., Folger, D.W., 1977. Delaware river: Evidence for its former 1025
extension to Wilmington submarine canyon. Science 195, 483-485. 1026
Twichell, D.C., Roberts, D.G., 1982. Morphology, distribution and development of submarine 1027
canyons on the United States Atlantic continental slope between Hudson and Baltimore 1028
Canyons. Geology 10, 408-412. 1029
Urgeles, R., Camerlenghi, A., Garcia-Castellanos, D., De Mol, B., Garces, M., Verges, J., 1030
Haslam, I., Hardman, M., 2011. New contraints on the Messinian sealevel drawdown 1031
from 3D seismic data of the Ebro Margin, western Mediterranean. Basin Research 23, 1032
123-145. 1033
Vachtman, D., Mitchell, N.C., Gawthorpe, B., 2013. Morphologic signatures in submarine 1034
canyons and gullies, central USA Atlantic continental margins. Marine and Petroleum 1035
Geology 41, 250-263. 1036
Vail, P.R., Mitchum, R.M., Thompson, S., 1977. Seismic stratigraphy and global changes of sea 1037
level; Part 4, Global cycles of relative changes of sea level. In: Payton, C.E. (Ed.), 1038
Memoir: American Association of Petroleum Geologists, pp. 83-97. 1039
Wright, L.D., 1995. Morphodynamics of Inner Continental Shelves. CRC Press, Boca Raton, FL. 1040
Zúñiga, D., Mar Flexas, M., Sanchez-Vidal, A., Coenjaerts, J., Calafat, A., Jordà, G., García-1041
Orellana, J., Puigdefàbregas, J., Canals, M., Espino, M., Sardà, F., Company, J.B., 2009. 1042

47
Particle fluxes dynamics in Blanes submarine canyon (Northwestern Mediterranean). 1043
Progress in Oceanography 82, 239-251. 1044
1045
1046

48
Table captions 1047
1048
Table 1. List and description of morphometric parameters extracted from features 1 – 6. 1049
1050
1051
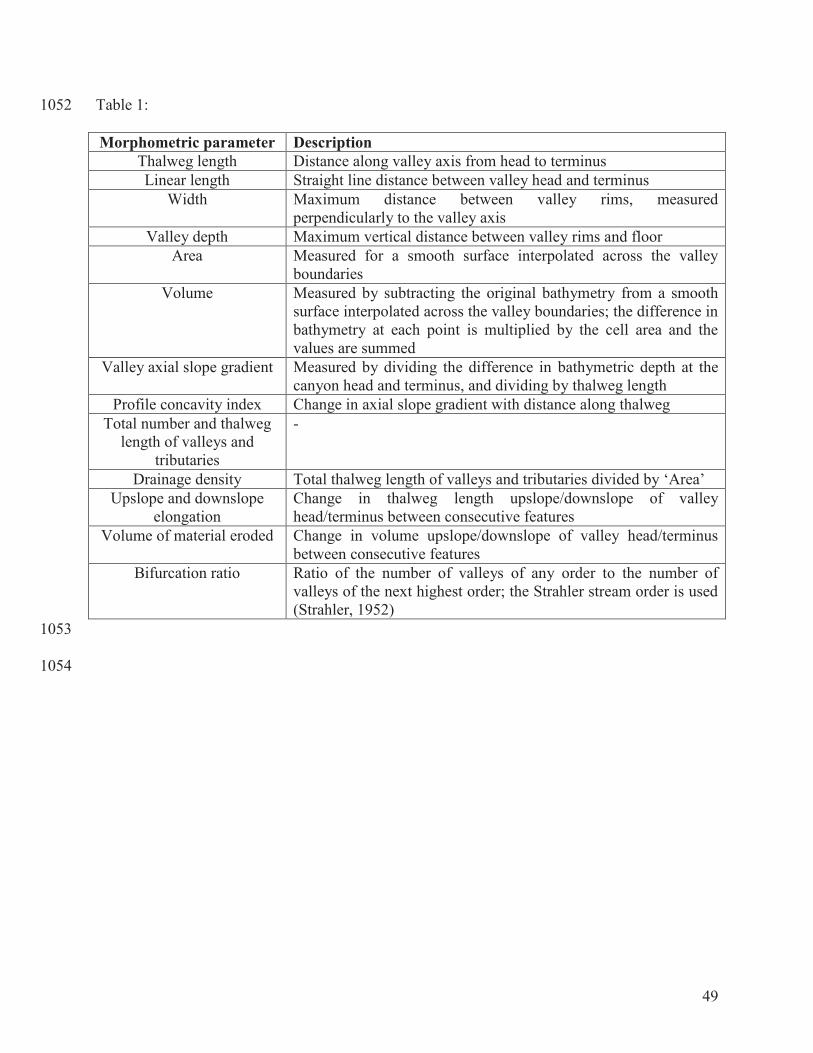
49
Table 1: 1052
Morphometric parameter Description
Thalweg length Distance along valley axis from head to terminus Linear length Straight line distance between valley head and terminus
Width Maximum distance between valley rims, measured perpendicularly to the valley axis
Valley depth Maximum vertical distance between valley rims and floor Area Measured for a smooth surface interpolated across the valley
boundaries Volume Measured by subtracting the original bathymetry from a smooth
surface interpolated across the valley boundaries; the difference in bathymetry at each point is multiplied by the cell area and the values are summed
Valley axial slope gradient Measured by dividing the difference in bathymetric depth at the canyon head and terminus, and dividing by thalweg length
Profile concavity index Change in axial slope gradient with distance along thalweg Total number and thalweg
length of valleys and tributaries
-
Drainage density Total thalweg length of valleys and tributaries divided by ‘Area’ Upslope and downslope
elongation Change in thalweg length upslope/downslope of valley head/terminus between consecutive features
Volume of material eroded Change in volume upslope/downslope of valley head/terminus between consecutive features
Bifurcation ratio Ratio of the number of valleys of any order to the number of valleys of the next highest order; the Strahler stream order is used (Strahler, 1952)
1053
1054
50
Figure captions 1055
1056
Fig. 1. Location of study area. (A) Location map of the Ebro Margin, western Mediterranean 1057
Sea. (B) Bathymetric map of the Ebro Margin (isobaths every 100 m). The sea-level during the 1058
Last Glacial Maximum (LGM) is denoted by a bold isobath (Lambeck and Bard, 2000). The 1059
location of Columbretes Islets (CI) is also indicated. 1060
1061
Fig. 2. Bathymetric and isobath map (100 m intervals) of the south Ebro Margin. The location of 1062
the figure is shown in Fig. 1. M1 and M2 indicate the location of moorings 1 and 2, respectively. 1063
NCC = North Columbretes Canyon; SCC = South Columbretes Canyon. 1064
1065
Fig. 3. Gullies and canyons within the study area. (A) Bathymetric and shaded relief map of 18 1066
gullies and canyons incising the south Ebro Margin. Location is shown in Fig. 2. Five gullies and 1067
canyons considered in this study are outlined in solid black and labelled 1–5. The location of the 1068
outer shelf sand body, interpreted as palaeo-delta deposits, is marked (Díaz et al., 1990; Lo 1069
Iacono et al., 2010). ‘M2’ indicates the location of mooring 2. The location of valleys ‘X-Z’ is 1070
indicated (see main text). (B) Backscatter imagery of the seabed shown in Fig. A. Numbers in 1071
squares denote feature numbers. 1072
1073
Fig. 4. Canyon-channel system within the study area. (A) Bathymetric and shaded relief map of 1074
the canyon-channel system (feature 6). Location is shown in Fig. 2. The location of the outer 1075
shelf sand body, interpreted as palaeo-delta deposits, is marked (Díaz et al., 1990; Lo Iacono et 1076
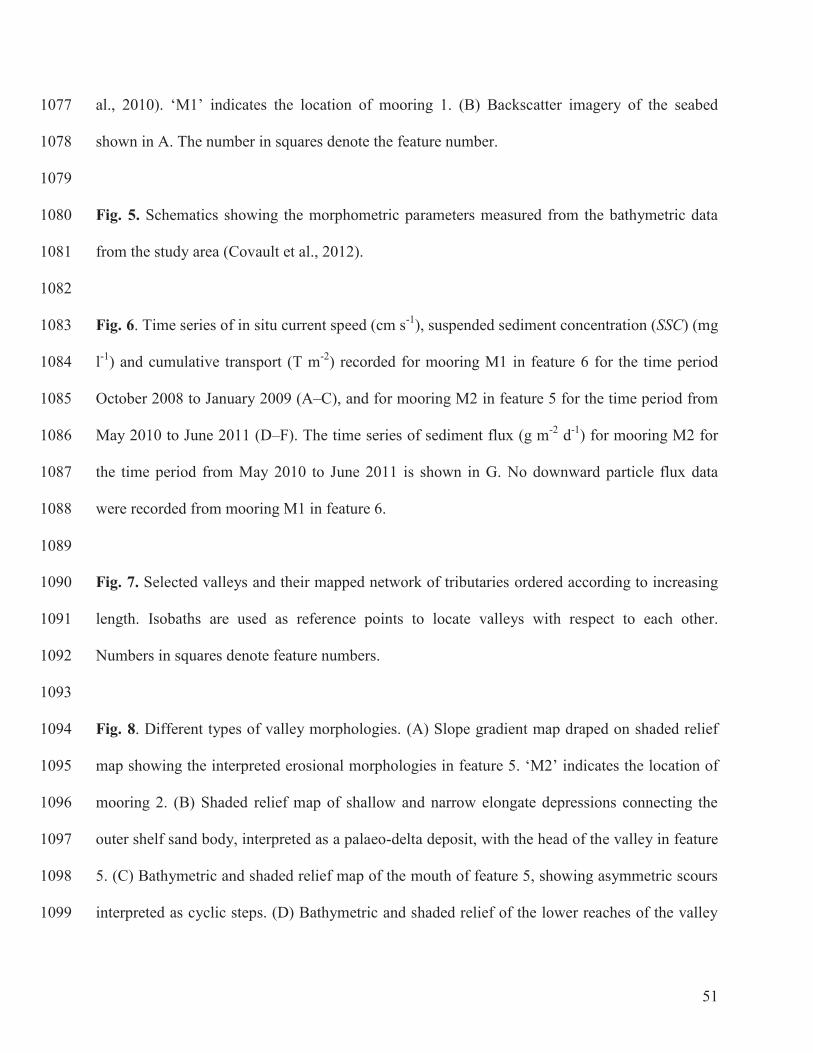
51
al., 2010). ‘M1’ indicates the location of mooring 1. (B) Backscatter imagery of the seabed 1077
shown in A. The number in squares denote the feature number. 1078
1079
Fig. 5. Schematics showing the morphometric parameters measured from the bathymetric data 1080
from the study area (Covault et al., 2012). 1081
1082
Fig. 6. Time series of in situ current speed (cm s-1), suspended sediment concentration (SSC) (mg 1083
l-1) and cumulative transport (T m-2) recorded for mooring M1 in feature 6 for the time period 1084
October 2008 to January 2009 (A–C), and for mooring M2 in feature 5 for the time period from 1085
May 2010 to June 2011 (D–F). The time series of sediment flux (g m-2 d-1) for mooring M2 for 1086
the time period from May 2010 to June 2011 is shown in G. No downward particle flux data 1087
were recorded from mooring M1 in feature 6. 1088
1089
Fig. 7. Selected valleys and their mapped network of tributaries ordered according to increasing 1090
length. Isobaths are used as reference points to locate valleys with respect to each other. 1091
Numbers in squares denote feature numbers. 1092
1093
Fig. 8. Different types of valley morphologies. (A) Slope gradient map draped on shaded relief 1094
map showing the interpreted erosional morphologies in feature 5. ‘M2’ indicates the location of 1095
mooring 2. (B) Shaded relief map of shallow and narrow elongate depressions connecting the 1096
outer shelf sand body, interpreted as a palaeo-delta deposit, with the head of the valley in feature 1097
5. (C) Bathymetric and shaded relief map of the mouth of feature 5, showing asymmetric scours 1098
interpreted as cyclic steps. (D) Bathymetric and shaded relief of the lower reaches of the valley 1099
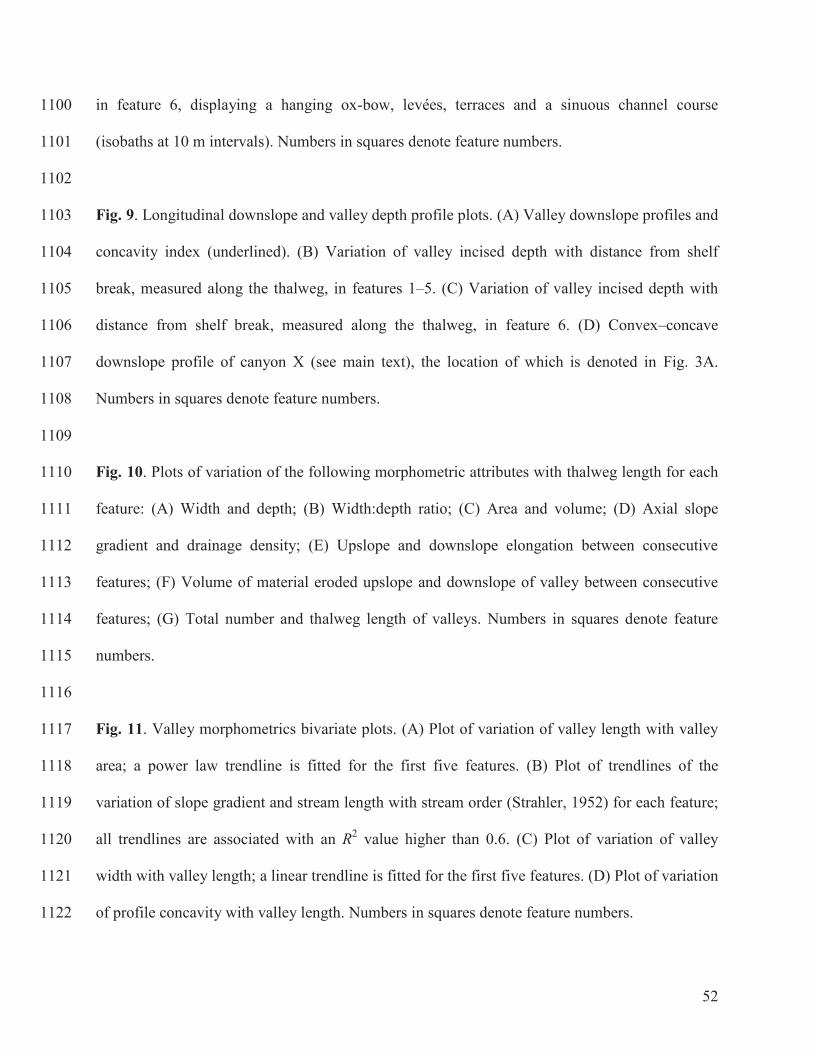
52
in feature 6, displaying a hanging ox-bow, levées, terraces and a sinuous channel course 1100
(isobaths at 10 m intervals). Numbers in squares denote feature numbers. 1101
1102
Fig. 9. Longitudinal downslope and valley depth profile plots. (A) Valley downslope profiles and 1103
concavity index (underlined). (B) Variation of valley incised depth with distance from shelf 1104
break, measured along the thalweg, in features 1–5. (C) Variation of valley incised depth with 1105
distance from shelf break, measured along the thalweg, in feature 6. (D) Convex–concave 1106
downslope profile of canyon X (see main text), the location of which is denoted in Fig. 3A. 1107
Numbers in squares denote feature numbers. 1108
1109
Fig. 10. Plots of variation of the following morphometric attributes with thalweg length for each 1110
feature: (A) Width and depth; (B) Width:depth ratio; (C) Area and volume; (D) Axial slope 1111
gradient and drainage density; (E) Upslope and downslope elongation between consecutive 1112
features; (F) Volume of material eroded upslope and downslope of valley between consecutive 1113
features; (G) Total number and thalweg length of valleys. Numbers in squares denote feature 1114
numbers. 1115
1116
Fig. 11. Valley morphometrics bivariate plots. (A) Plot of variation of valley length with valley 1117
area; a power law trendline is fitted for the first five features. (B) Plot of trendlines of the 1118
variation of slope gradient and stream length with stream order (Strahler, 1952) for each feature; 1119
all trendlines are associated with an R2 value higher than 0.6. (C) Plot of variation of valley 1120
width with valley length; a linear trendline is fitted for the first five features. (D) Plot of variation 1121
of profile concavity with valley length. Numbers in squares denote feature numbers. 1122
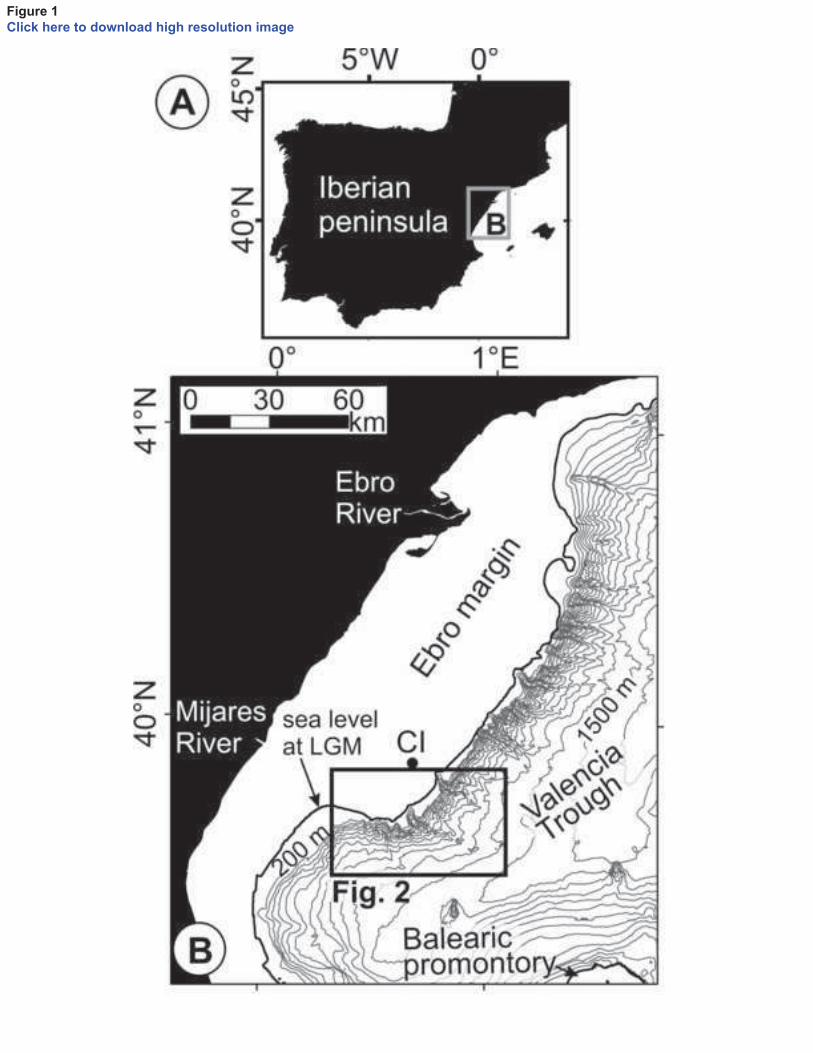
Figure 1
Click here to download high resolution image
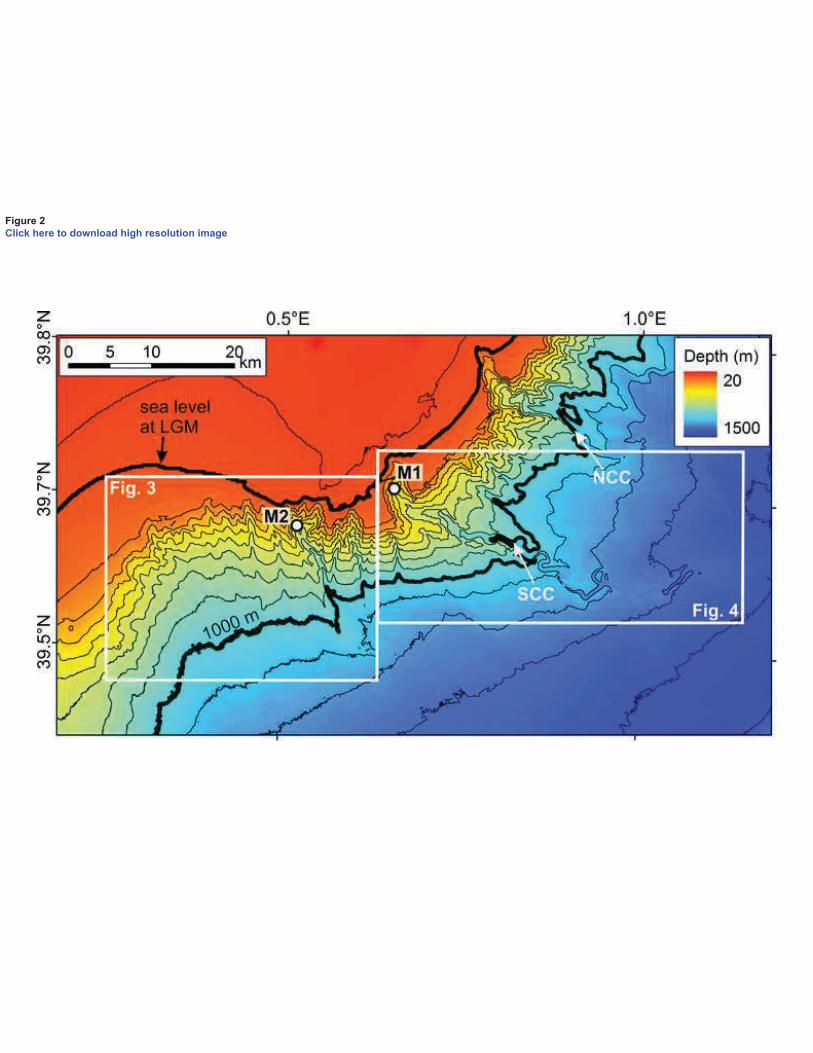
Figure 2
Click here to download high resolution image
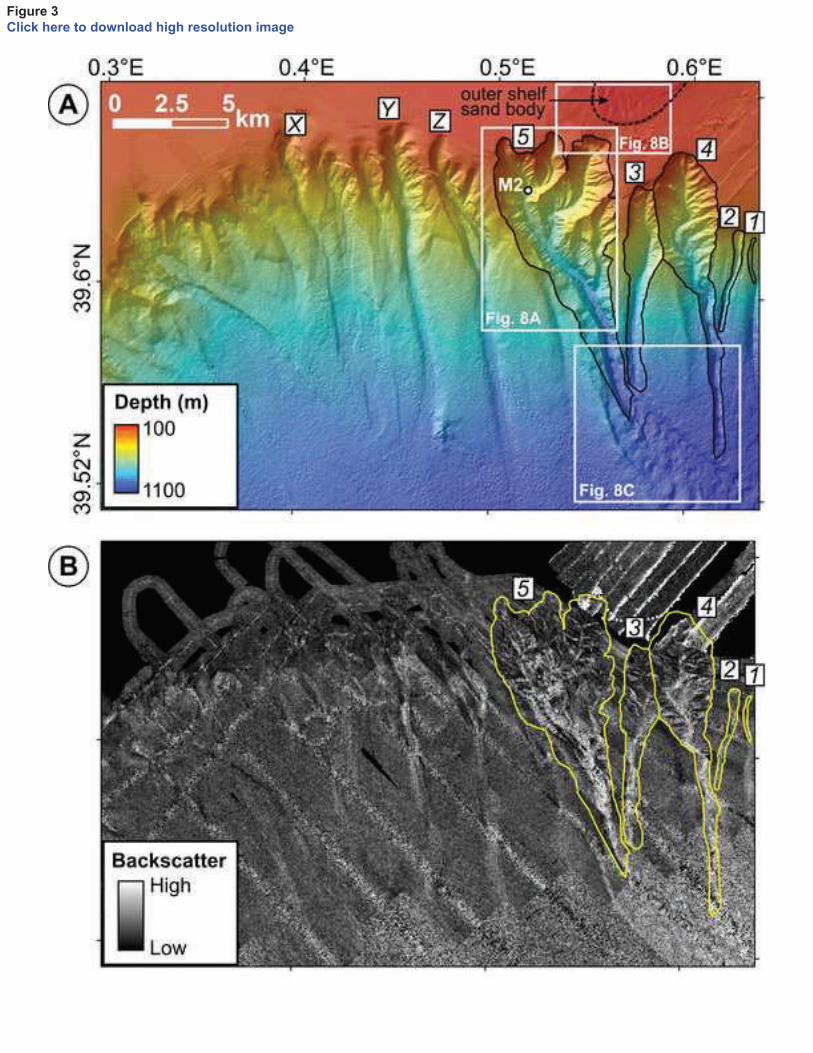
Figure 3
Click here to download high resolution image
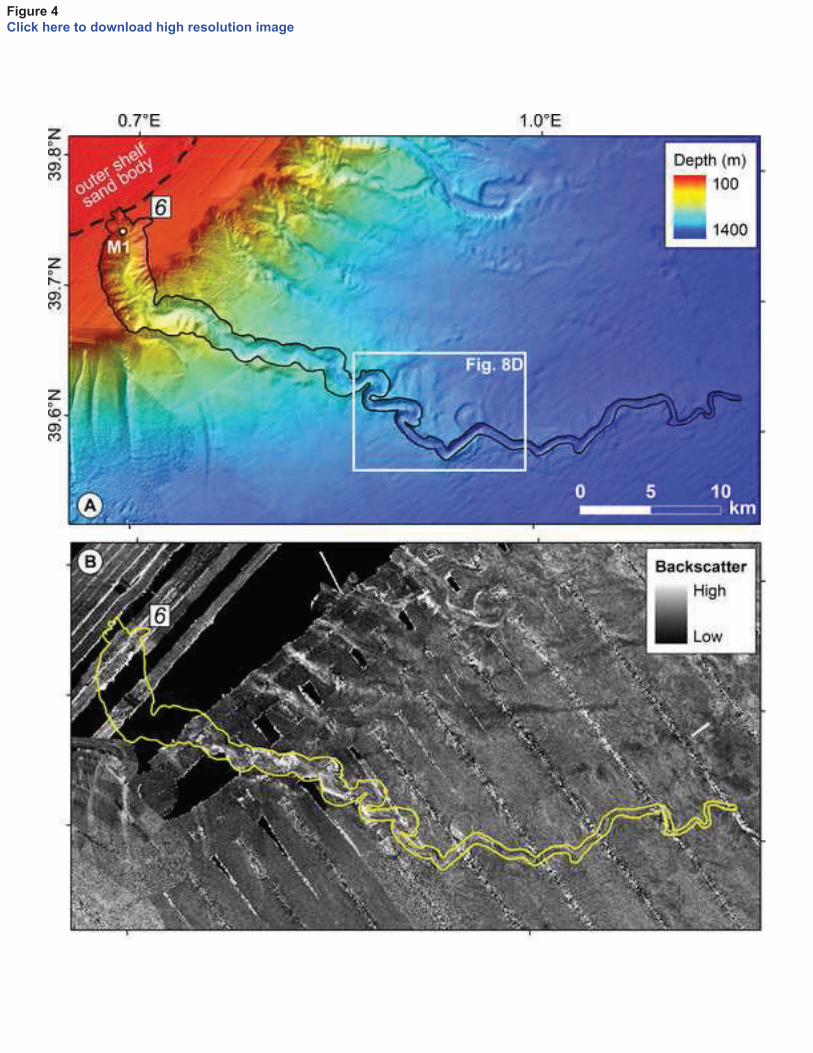
Figure 4
Click here to download high resolution image
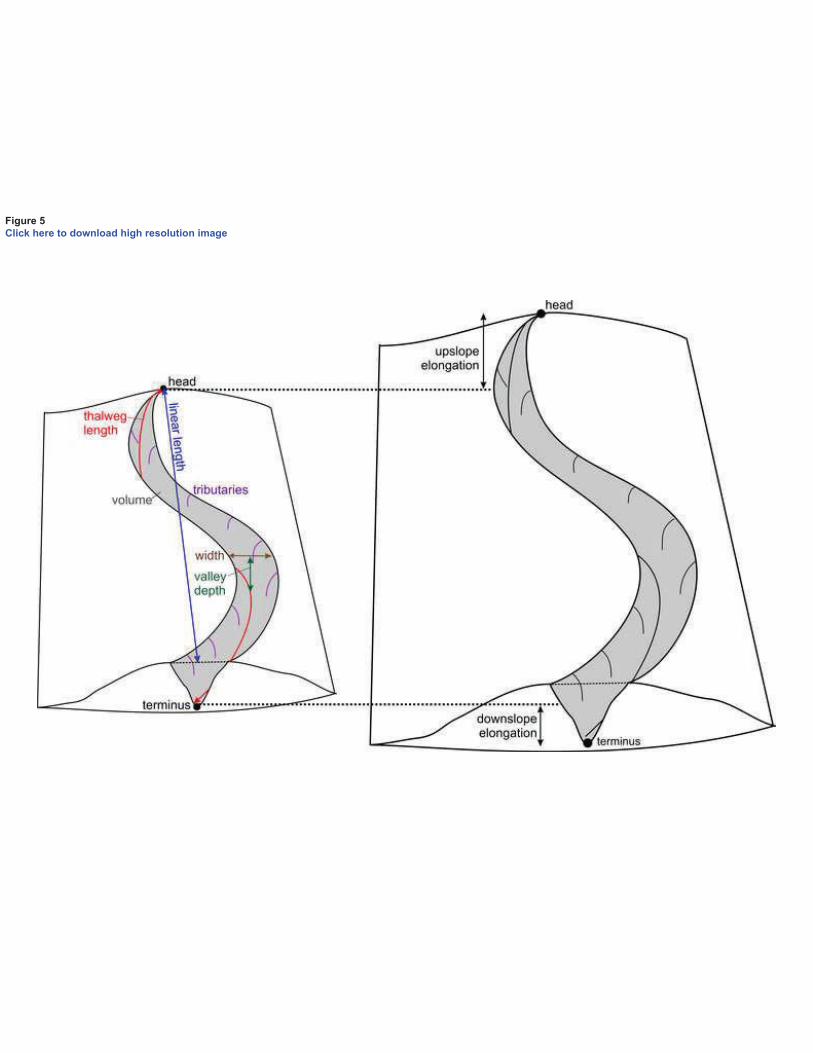
Figure 5
Click here to download high resolution image
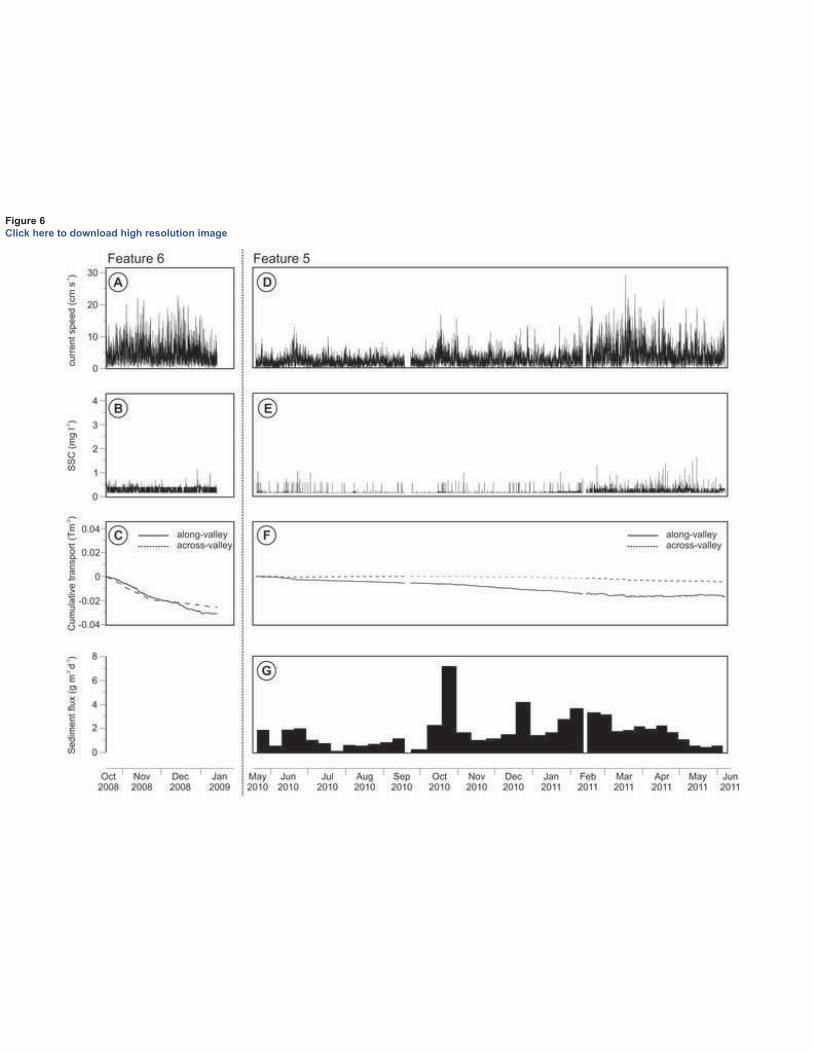
Figure 6
Click here to download high resolution image
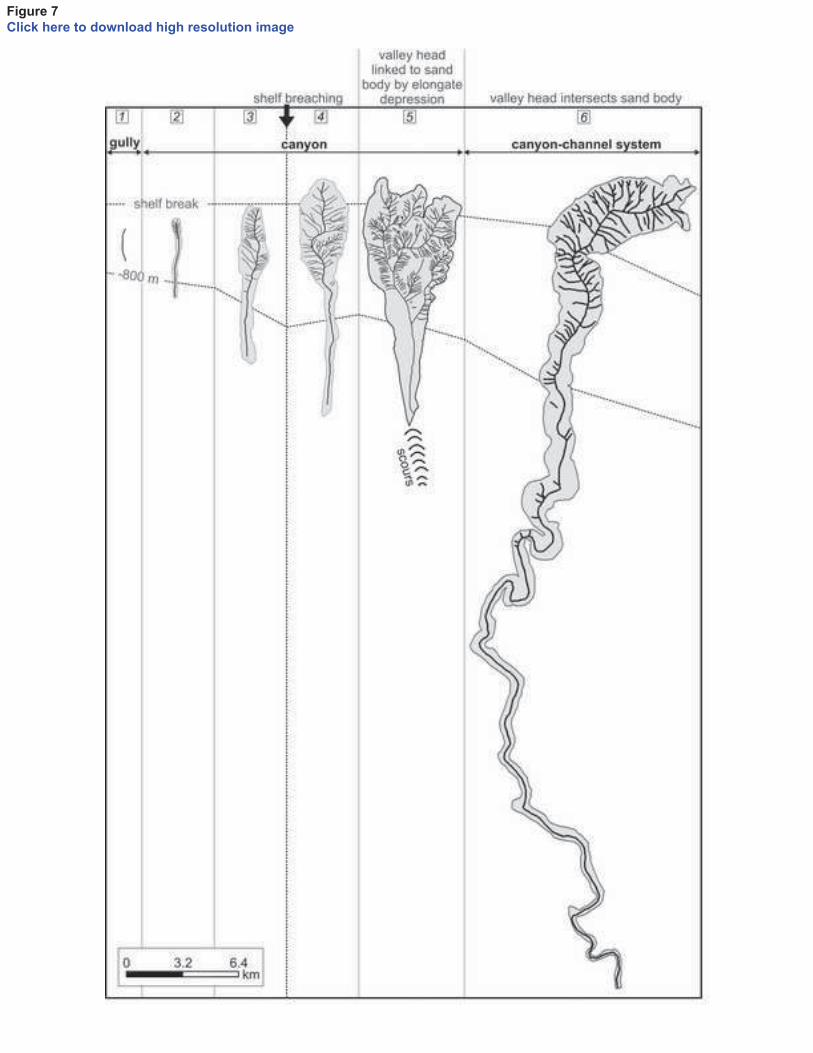
Figure 7
Click here to download high resolution image
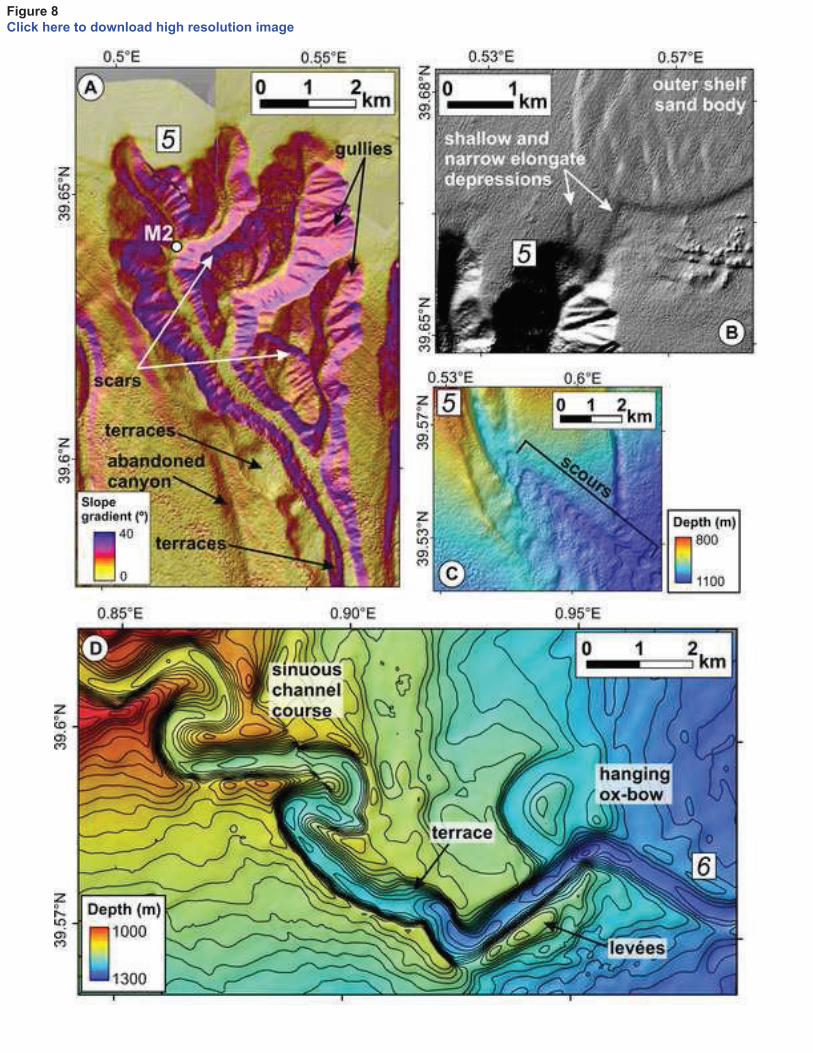
Figure 8
Click here to download high resolution image
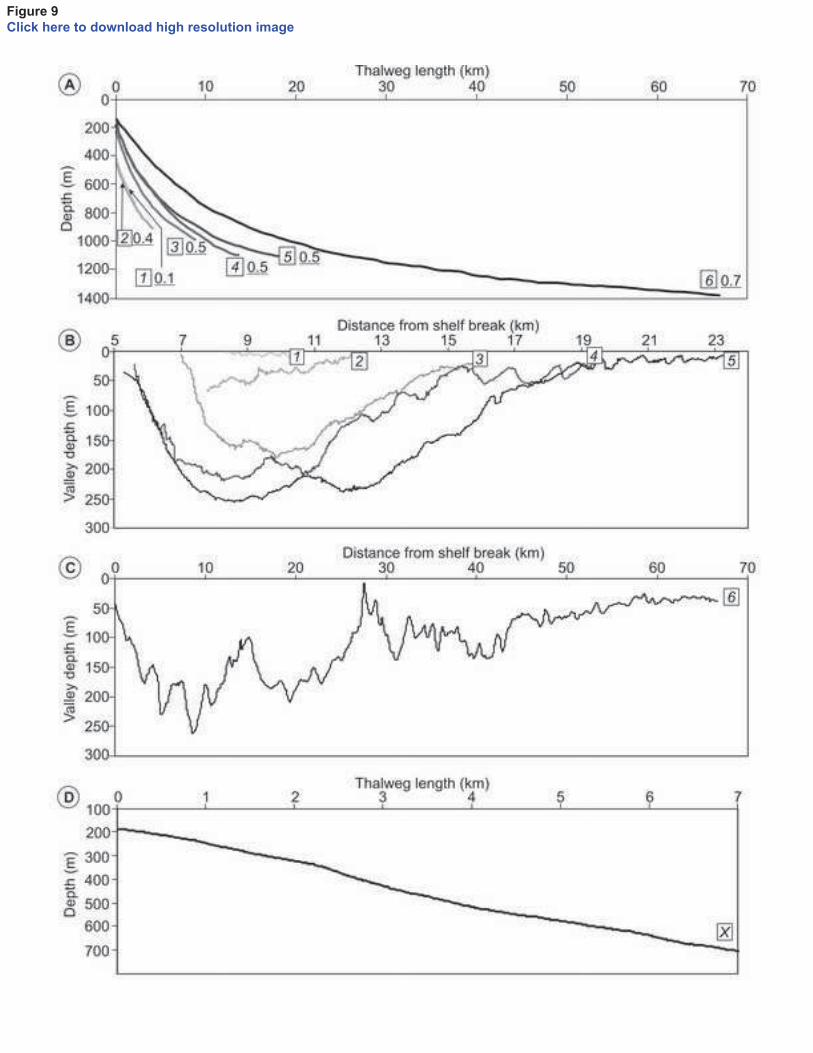
Figure 9
Click here to download high resolution image
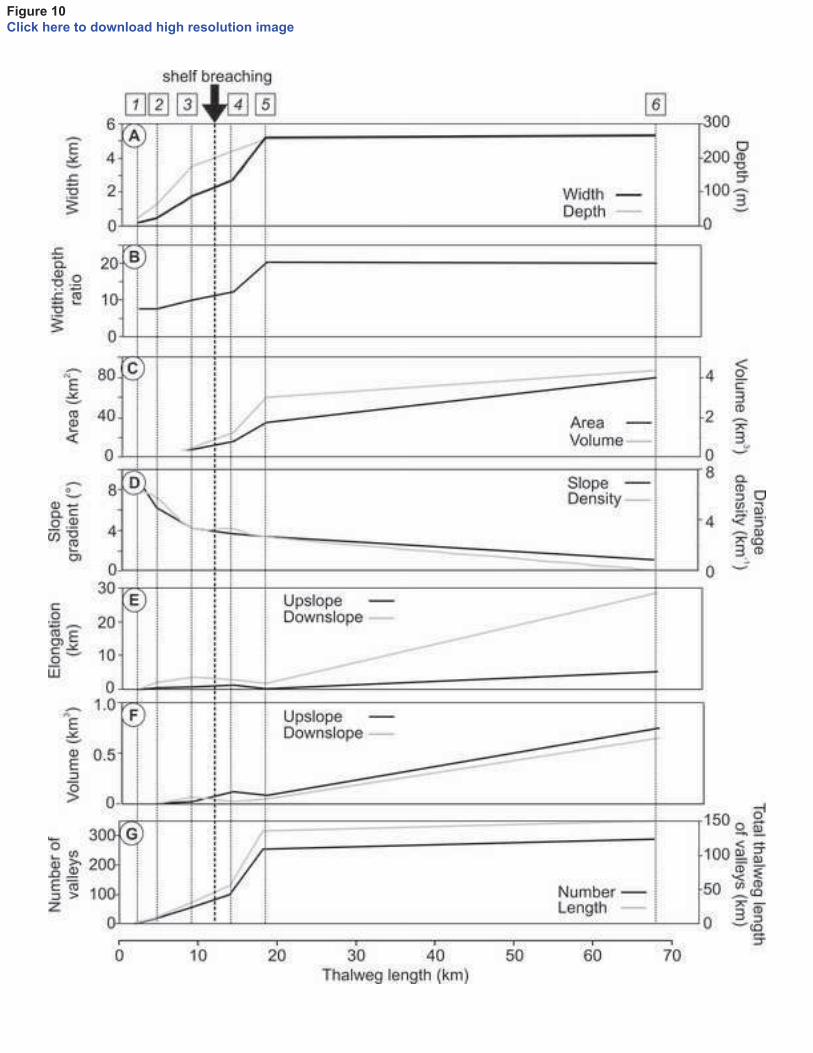
Figure 10
Click here to download high resolution image
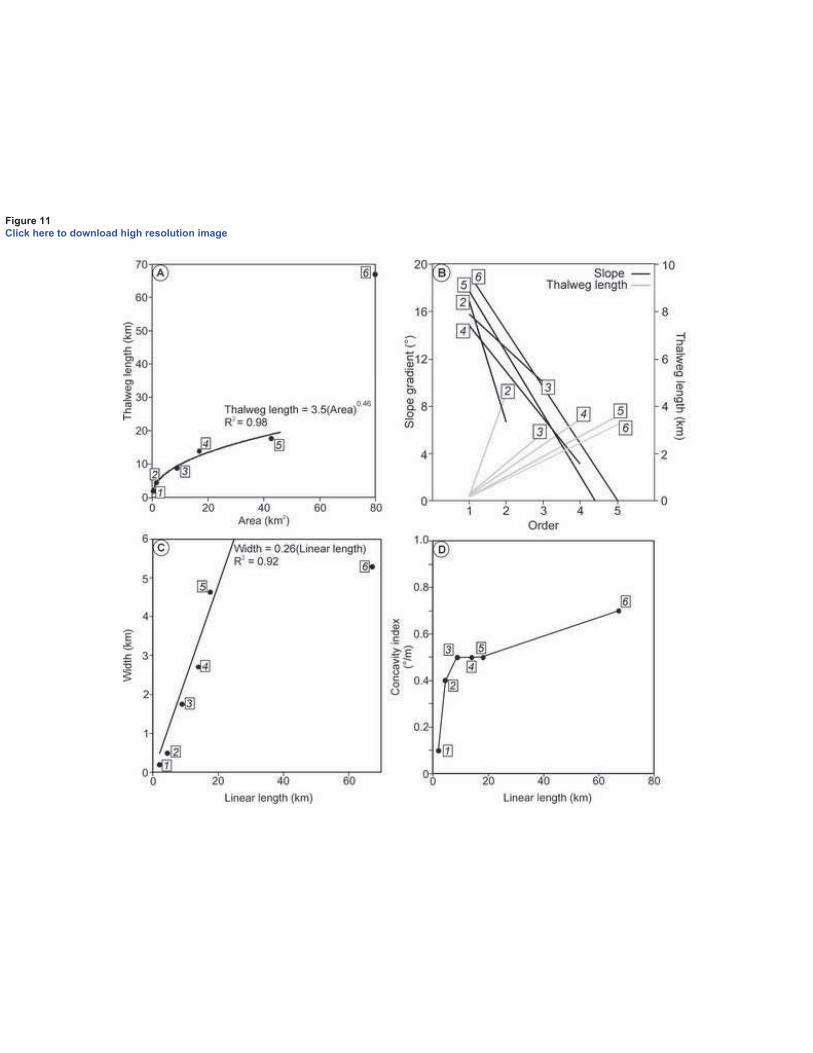
Figure 11
Click here to download high resolution image
Related Documents