45th International Conference on Environmental Systems ICES-2015-291 12-16 July 2015, Bellevue, Washington International Conference on Environmental Systems Space Applications of Torrefaction Processing Michael A. Serio 1 , Joseph E. Cosgrove 2 , and Marek A. Wójtowicz 3 Advanced Fuel Research, Inc., 87 Church Street, East Hartford, CT 06108-3720 USA Jeffrey Lee 4 , Kanapathipillai Wignarajah 5 , and John Fisher 6 NASA Ames Research Center, Moffett Field, CA 94035-1000 USA A recent study addressed the technical feasibility of a torrefaction (mild pyrolysis) processing system that could be used to sterilize feces and related cellulosic biomass wastes (food, paper, wipes, and clothing) in space, while simultaneously recovering moisture, producing additional water, and small amounts of other useful products (e.g., CO 2 , CO, and CH 4 ). This work was done using bench scale torrefaction processing units and examined different modes of heating (conventional and microwave). The amounts of solid vs. gas plus liquid products could be controlled by adjusting the torrefaction conditions, especially the final temperature and holding time. The solid char product from a fecal simulant was a dry, free flowing powder that did not support bacterial growth and was hydrophobic relative to the starting material. The proposed torrefaction approach has potential benefits to NASA in allowing for solid waste sterilization and stabilization, planetary protection, in-situ resource utilization (ISRU) and/or production of chemical feedstocks and carbon materials. In particular, the torrefaction char residue has several potential applications in space. These include production of activated carbon, a nutrient-rich substrate for plant growth, construction material, radiation shielding, storage of elemental carbon, hydrogen, or oxygen, and fuel gas (CH 4 , CO, and H 2 ) production. The current paper provides additional torrefaction data and analysis. It also addresses the potential space applications of torrefaction processing, how it compares to other approaches to solid waste management, its applicability to a range of cellulosic biomass materials, and how the technology could be integrated with existing advanced life support technologies, such as the Heat Melt Compactor (HMC) or the Universal Waste Management System (UWMS). Nomenclature AR = As-Received DAF = Dry, Ash Free DOC = Dissolved Organic Carbon FC = Fixed Carbon FTIR = Fourier Transform Infrared HMC = Heat Melt Compactor ISRU = In-Situ Resource Utilization ISS = International Space Station LPM = Liters per Minute LB = Lysogeny Broth MFC = Mass Flow Controller MFM = Mass Flow Meter 1 President, Advanced Fuel Research, Inc. (AFR), 87 Church Street, East Hartford, CT 06108. 2 Laboratory Manager, AFR, 87 Church Street, East Hartford, CT 06108. 3 Vice President, Clean Energy & Carbon Materials, AFR, 87 Church Street, East Hartford, CT 06108. 4 System Analyst, Bioengineering Branch, MS N239-15, NASA Ames Research Center, Moffett Field, CA 94035. 5 Senior Scientist, SCB Branch, MS 239-8, NASA-Ames Research Center, Moffett Field, CA 94035. 6 Lead Engineer, Exploration Life Support, NASA-Ames Research Center, Moffett Field, CA 94035.

Welcome message from author
This document is posted to help you gain knowledge. Please leave a comment to let me know what you think about it! Share it to your friends and learn new things together.
Transcript
45th International Conference on Environmental Systems ICES-2015-291 12-16 July 2015, Bellevue, Washington
International Conference on Environmental Systems
Space Applications of Torrefaction Processing
Michael A. Serio1, Joseph E. Cosgrove
2, and Marek A. Wójtowicz
3
Advanced Fuel Research, Inc., 87 Church Street, East Hartford, CT 06108-3720 USA
Jeffrey Lee4, Kanapathipillai Wignarajah
5, and John Fisher
6
NASA Ames Research Center, Moffett Field, CA 94035-1000 USA
A recent study addressed the technical feasibility of a torrefaction (mild pyrolysis)
processing system that could be used to sterilize feces and related cellulosic biomass wastes
(food, paper, wipes, and clothing) in space, while simultaneously recovering moisture,
producing additional water, and small amounts of other useful products (e.g., CO2, CO, and
CH4). This work was done using bench scale torrefaction processing units and examined
different modes of heating (conventional and microwave). The amounts of solid vs. gas plus
liquid products could be controlled by adjusting the torrefaction conditions, especially the
final temperature and holding time. The solid char product from a fecal simulant was a dry,
free flowing powder that did not support bacterial growth and was hydrophobic relative to
the starting material. The proposed torrefaction approach has potential benefits to NASA in
allowing for solid waste sterilization and stabilization, planetary protection, in-situ resource
utilization (ISRU) and/or production of chemical feedstocks and carbon materials. In
particular, the torrefaction char residue has several potential applications in space. These
include production of activated carbon, a nutrient-rich substrate for plant growth,
construction material, radiation shielding, storage of elemental carbon, hydrogen, or oxygen,
and fuel gas (CH4, CO, and H2) production. The current paper provides additional
torrefaction data and analysis. It also addresses the potential space applications of
torrefaction processing, how it compares to other approaches to solid waste management, its
applicability to a range of cellulosic biomass materials, and how the technology could be
integrated with existing advanced life support technologies, such as the Heat Melt
Compactor (HMC) or the Universal Waste Management System (UWMS).
Nomenclature
AR = As-Received
DAF = Dry, Ash Free
DOC = Dissolved Organic Carbon
FC = Fixed Carbon
FTIR = Fourier Transform Infrared
HMC = Heat Melt Compactor
ISRU = In-Situ Resource Utilization
ISS = International Space Station
LPM = Liters per Minute
LB = Lysogeny Broth
MFC = Mass Flow Controller
MFM = Mass Flow Meter
1 President, Advanced Fuel Research, Inc. (AFR), 87 Church Street, East Hartford, CT 06108.
2 Laboratory Manager, AFR, 87 Church Street, East Hartford, CT 06108.
3 Vice President, Clean Energy & Carbon Materials, AFR, 87 Church Street, East Hartford, CT 06108.
4 System Analyst, Bioengineering Branch, MS N239-15, NASA Ames Research Center, Moffett Field, CA 94035.
5 Senior Scientist, SCB Branch, MS 239-8, NASA-Ames Research Center, Moffett Field, CA 94035.
6 Lead Engineer, Exploration Life Support, NASA-Ames Research Center, Moffett Field, CA 94035.

International Conference on Environmental Systems
2
NIST = National Institute of Standards and Technology
OMPCV = Orion Multi-Purpose Crew Vehicle
SBIR = Small Business Innovation Research
TG = Thermogravimetic Analyzer
TOC = Total Organic Carbon
UTC = United Technologies Corporation
UWMS = Universal Waste Management System
VM = Volatile Matter
WMS = Waste Management System
I. Introduction
A. The Problem and Technical Approach
New technology is needed to collect, stabilize, recover useful materials, and store human fecal waste and other
spacecraft solid wastes for long duration missions. The motivations include crew safety, comfort and resource
requirements, along with planetary protection [1-4]. The current paper addresses a torrefaction (mild pyrolysis)
processing system that can be used to sterilize feces and related cellulosic biomass wastes (food, paper, wipes, and
clothing) and produce a stable char residue that can be easily stored or recycled, while simultaneously recovering all
of the moisture and producing small amounts of other gases. Previous NASA sponsored work [5,6] demonstrated
that torrefaction processing was effective for a fecal simulant using bench scale experiments with both microwave
and conventional heating. In addition, the torrefaction method could be applied to other types of wet or dry
cellulosic biomass (food, paper, wipes, clothing), which could provide for some redundancy in the Waste
Management System (WMS). It would also be important for a torrefaction processing system to be compatible with
other components of the Advanced Life Support system.
B. Potential Advantages versus Current Solid Waste Management Technology
There are many constraints on the WMS for advanced life support systems that can be used for both short and
long duration flights and space outposts. Such systems should be of low volume, low weight, low power and oxygen
consumption, have the ability to handle a variety of wastes, require low maintenance, and be able to reduce volume
and increase stability of the wastes [7-13]. This is a complex optimization problem, which is why it still remains an
area of active R&D. An additional layer of complexity results from the uncertainty of the NASA near term mission
objective, as going back to the moon will place different demands on the WMS than going to Mars or
Asteroids/Phobos. In addition, the final system will require relatively sophisticated control schemes to ensure that it
operates properly, is integrated with the rest of the life support system, and has some system redundancy to mitigate
risk [14].
As discussed by Fisher et al. [15], the need for waste processing varies greatly, depending on the mission
scenario. The near term needs are for the Orion Multi-Purpose Crew Vehicle (OMPCV), which will provide crewed
missions to the International Space Station (ISS) and beyond. The intermediate term needs are for waste
management technologies that could support missions to the moon and, eventually, the establishment of a habitat on
the moon. The longer term missions would be to establish a long term base on the moon and ultimately to go to
Mars. There has been a lot of NASA supported work (both internal and external) on Waste Management Systems,
with a recent emphasis on the near term mission scenarios. These include testing of a plastic melt waste compactor
[16], use of microwaves to stabilize waste and recover water [17], and evaluating water recovery using a microwave
freeze drying unit, a microwave powered ambient dryer, and a recirculating hot air dryer [18]. This represents a shift
in emphasis away from fully regenerative technologies, such as incineration and supercritical water oxidation, which
received a lot of attention in the 1990s [15].
Solid wastes will include inedible plant biomass, paper, wipes, plastic, cardboard, waste water concentrates,
urine concentrates, feces, etc. It would be desirable to recover usable constituents such as H2O, CO2, nitrogen, fuel
gases, solid inorganics, etc. Any unusable byproducts should be chemically and biologically stable and require
minimal amounts of storage volume. Many different processes have been considered for dealing with these wastes:
incineration, aerobic and anaerobic biodigestion, wet oxidation, supercritical oxidation, steam reforming,
electrochemical oxidation, catalytic oxidation, and heat melt compaction [7-25]. All the above approaches have their
advantages, but also disadvantages which have prevented adoption of any single method. For example, incineration
utilizes a valuable resource, oxygen, and produces undesirable byproducts such as oxides of sulfur and nitrogen. In
International Conference on Environmental Systems
3
addition, incineration will immediately convert all of the waste carbon to CO2, which will require venting excess
CO2.
Pyrolytic waste treatment has several advantages when compared to other possible approaches: 1) it can be used
for all types of solid products [26,27] and can be more easily adapted to changes in feedstock composition than
alternative approaches; 2) the technology is relatively simple and can be made compact and lightweight and thus is
amenable to spacecraft operations; 3) it can be conducted as a batch, low pressure process, with minimal
requirements for feedstock preprocessing; 4) it can produce several usable products from solid waste streams (e.g.,
H2O, CO2, CO, H2O, H2, NH3, CH4, etc.); 5) the technology can be designed to produce minimal amounts of
unusable byproducts; 6) it can produce potentially valuable chemicals, chemical feedstocks, and materials (e.g.,
activated carbon); 7) pyrolysis will reduce the storage volume of the waste materials, while important elements such
as carbon and nitrogen can be efficiently stored in the form of pyrolysis char and later recovered by gasification or
combustion when needed. In addition to being used as a primary waste treatment method, pyrolysis can also be used
as a pretreatment for more conventional techniques, such as combustion or gasification
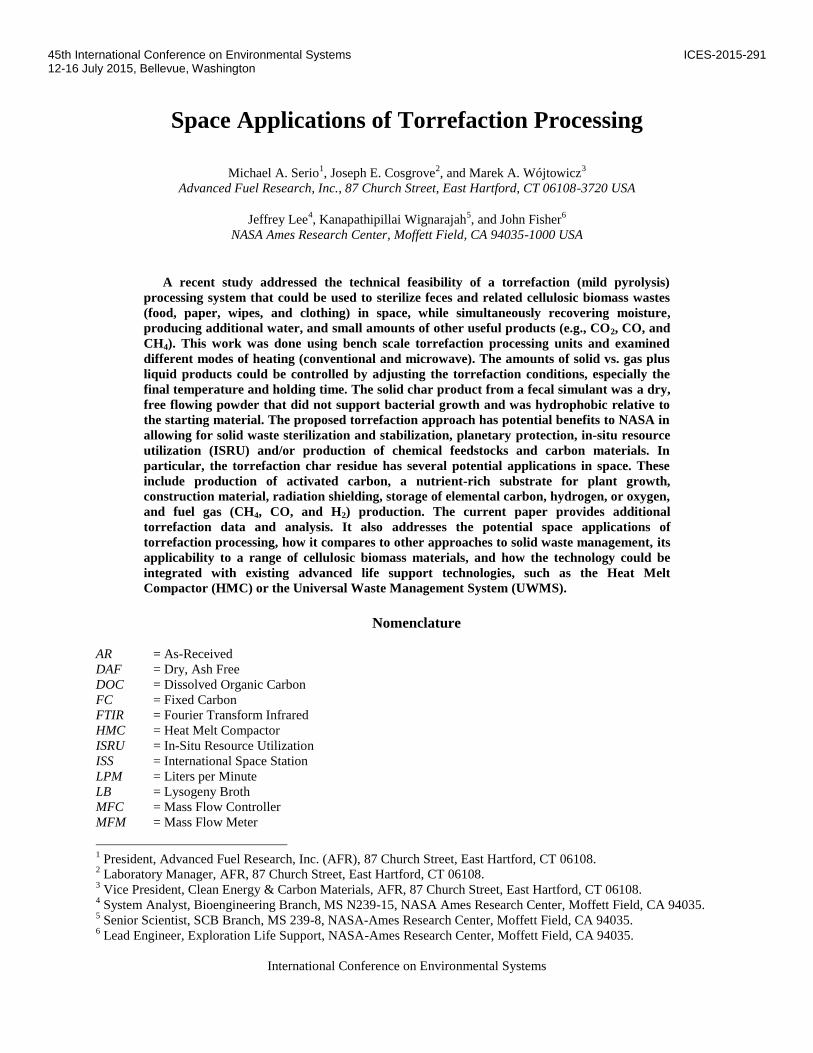
One of the biggest advantages of pyrolysis (or torrefaction) for near term life support is that it can provide the
baseline functions of a WMS, i.e., reduce volume, stabilize, and recover water, along with several enhancements.
These include thermochemical water and oxygen recovery, production of fuels, and multi-purpose carbon, and in-
situ resource utilization, as shown in Figure 1. Consequently, pyrolysis/torrefaction processing can provide a bridge
technology between near term and long term mission scenarios, as discussed below.
Figure 1. Schematic of Waste Management System (WMS) indicating how a pyrolysis/torrefaction-centric
approach impacts near term, intermediate term and long term mission scenarios, including in-situ resource
utilization.
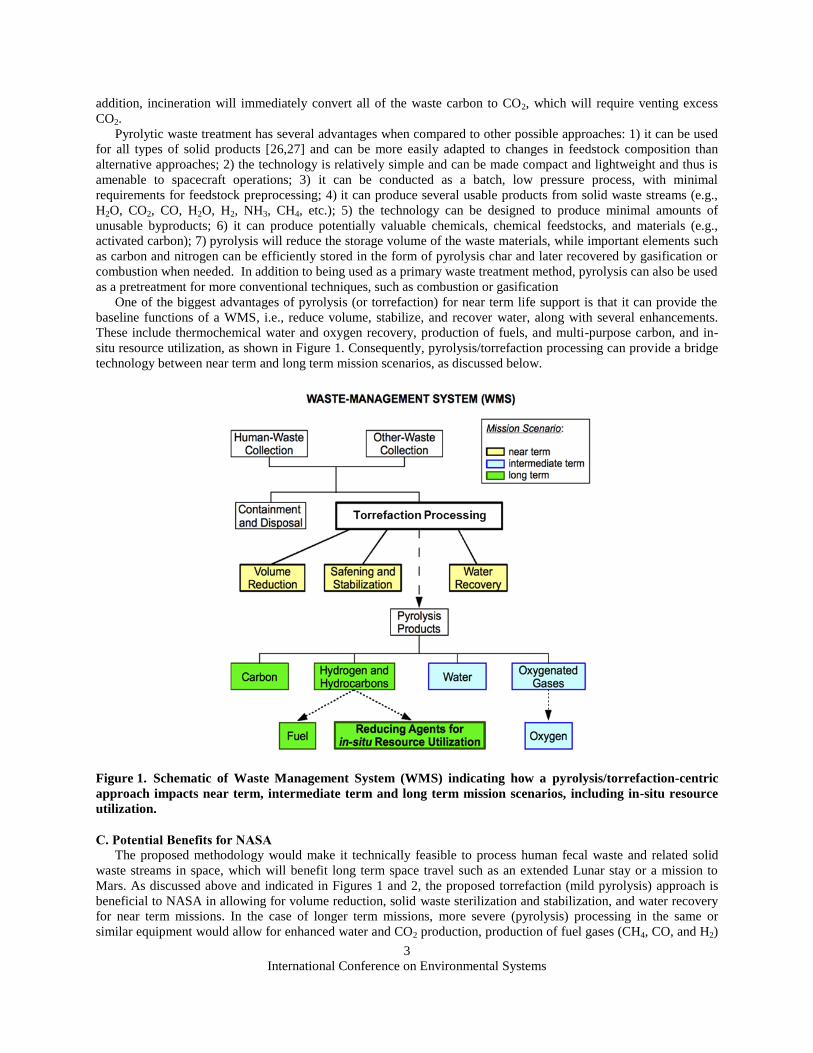
C. Potential Benefits for NASA
The proposed methodology would make it technically feasible to process human fecal waste and related solid
waste streams in space, which will benefit long term space travel such as an extended Lunar stay or a mission to
Mars. As discussed above and indicated in Figures 1 and 2, the proposed torrefaction (mild pyrolysis) approach is
beneficial to NASA in allowing for volume reduction, solid waste sterilization and stabilization, and water recovery
for near term missions. In the case of longer term missions, more severe (pyrolysis) processing in the same or
similar equipment would allow for enhanced water and CO2 production, production of fuel gases (CH4, CO, and H2)
International Conference on Environmental Systems
4
and multi-purpose carbon, along with ISRU. The torrefaction processing system is also complementary to the Heat
Melt Compactor (HMC) [28] and could also be designed to be compatible with the Universal Waste Management
System (UWMS) [29], both now under development by NASA.
The primary purpose of future work will be to further evaluate torrefaction processing for NASA in the hope it
that can ultimately be an important component of a WMS. However, there are also important potential ancillary
benefits in terms of increasing the technology base for stabilization and recycling of human fecal waste, as well as
for biochar production from solid waste streams. The recent Gates Foundation “Reinventing the Toilet Challenge”
supporting documents indicated that more than 2.5 billion people worldwide do not have access to safe and
affordable sanitation [30]. The production of biochar from readily available cellulosic biomass and other waste
materials has the potential to be important in efforts to promote soil fertility and carbon sequestration [31,32]. The
support of such an effort is entirely consistent with NASA’s objective of improving life on earth and being an
incubator of dual-use technologies.
Figure 2. Spacecraft uses for torrefaction char residue. Shading indicates products that can be produced with
additional heat treatment in a more severe (pyrolysis) process.
II. Background
Torrefaction can be viewed as pyrolysis performed under mild conditions [ 33]. It is usually defined as a
thermochemical pre-treatment of biomass at 200–300 °C in the absence of oxygen. The typical heating rates used
are lower than 50 °C/min, and the typical torrefaction time scales are one hour or less. Torrefaction has attracted a
lot of interest in recent years, primarily in Europe, and the main reason seems to be a trend towards more sustainable
power generation, in particular co-firing of biomass pellets with coal, but also rising fuel prices. A good overview of
the torrefaction process and technologies can be found in Energy Research Center of the Netherlands reports [34–
36] that are available from their web site. Torrefaction research is also carried out at the National Renewable Energy
Laboratory in Colorado (Nimlos et al. [37]), at the University of Leeds in the UK (Bridgeman et al. [38]), and also
at the Royal Institute of Technology in Sweden (Pach et al. [39]), among other laboratories. The main advantages of
torrefied biomass are: (1) higher energy density, (2) more homogeneous composition, (3) hydrophobic behavior, (4)
improved grindability, and (5) elimination of biological activity.
An understanding of a key benefit of torrefaction (mild pyrolysis) processing for intermediate term missions in
space can be gained by looking at the results from temperature programmed pyrolysis of a representative biomass
material (wheat straw), shown in Figure 3. These are results for the evolution of major products from a standard
pyrolysis experiment at 30 K/min using (up to 900°C) a thermogravimetric analyzer with FTIR analysis of evolved
gases (TG-FTIR) for a National Institute of Standards and Technology (NIST) wheat straw sample. The plots show
the sample weight loss, as well as both the differential and integral curves for several species (H2O, tars, CO2, CH4,
CO, acetic acid, acetaldehyde. The more than 20% by weight of water that can be produced from pyrolysis of

International Conference on Environmental Systems
5
0
200
400
600
800
1000
0
20
40
60
80
100
120
0 20 40 60 80 100
Temperature and Weight LossT
emp
erat
ure
(oC
)
Rela
tive W
eig
ht (%
)
Time (minutes)
0
1
2
3
4
5
0
5
10
15
20
25
0 200 400 600 800 1000
H2O
Ev
olu
tio
n R
ate
(wt%
/min
)
Yield
(wt%
daf)
Temperature (oC)
0
1
2
3
4
5
6
0
5
10
15
20
25
30
35
0 200 400 600 800 1000
Tars
Ev
olu
tio
n R
ate
(wt%
/min
)
Yield
(wt%
daf)
Temperature (oC)
0.0
0.5
1.0
1.5
2.0
2.5
3.0
0
2
4
6
8
10
12
0 200 400 600 800 1000
CO2
Ev
olu
tio
n R
ate
(wt%
/min
)
Yield
(wt%
daf)
Temperature (oC)
0.00
0.02
0.04
0.06
0.08
0.10
0.12
0.14
0.0
0.2
0.4
0.6
0.8
1.0
1.2
0 200 400 600 800 1000
CH4
Ev
olu
tio
n R
ate
(wt%
/min
)
Yield
(wt%
daf)
Temperature (oC)
0.0
0.2
0.4
0.6
0.8
1.0
1.2
1.4
0
1
2
3
4
5
6
7
0 200 400 600 800 1000
CO
Ev
olu
tio
n R
ate
(wt%
/min
)
Yield
(wt%
daf)
Temperature (oC)
0.0
0.2
0.4
0.6
0.8
1.0
1.2
1.4
0
1
2
3
4
5
0 200 400 600 800 1000
Acetic Acid
Ev
olu
tio
n R
ate
(wt%
/min
)
Yield
(wt%
daf)
Temperature (oC)
0.0
0.5
1.0
1.5
2.0
2.5
3.0
3.5
4.0
0
1
2
3
4
5
6
7
8
0 200 400 600 800 1000
Acetaldehyde
Ev
olu
tio
n R
ate
(wt%
/min
)
Yield
(wt%
daf)
Temperature (oC)
Figure 3. TG-FTIR analysis results for major products from NIST wheat straw sample heated at 30K/min.

International Conference on Environmental Systems
6
many common (dried) biomass materials (see upper right panel in Figure 3) is one of the advantages of pyrolysis
processing of solid wastes, especially for intermediate term missions scenarios. However, the penalty for this
additional water evolution is the production of significant amounts of non-condensable gases (e.g., CO2, CO), along
with significant tar evolution, as shown in Figure 3.
However, it can also be observed in Figure 3 that pyrolysis temperatures below 300 °C, which is the usual upper
limit for torrefaction, produce about 50% of the pyrolytic water evolution, and do not lead to significant evolutions
for most other gases or tars. Exceptions include acetic acid and modest amounts of CO2 and CO. The key for
torrefaction processing of feces and other biomass materials is to remove moisture, produce additional pyrolytic
water (~50% of the maximum amount) but to not transition to active pyrolysis, where tar formation becomes
important. In this case, careful control of the sample temperature becomes important, as indicated in Figure 4, which
illustrates the various regimes in the pyrolysis processing of biomass as described by deWild [40]. For many
biomass materials, torrefaction becomes mildly exothermic in the temperature range 250-300°C, which can make
the temperature control a little bit more challenging [33]. Figure 4 also illustrates how torrefaction is different from
pyrolysis and the role that hemicellulose decomposition plays in initiating the torrefaction process [33-38]. Figure 5
contains a time series spectra from TG-FTIR analysis of pure xylan, a major component of hemicellulose, and
provides some additional detail on the initial products that are evolved under torrefaction conditions (<300 °C).
Figures 3 and 5 both indicate that early evolution of both water and acetic acid is characteristic of the torrefaction
regime for biomass materials. This is consistent with the TG-FTIR results on the fecal simulant used in previous
torrefaction studies [5,6], which are shown as bar graphs in Figure 6 and tabulated in Table 1 on an As-Received
(AR) and a Dry, Ash-Free (DAF) basis. Even though the fecal simulant is not a single component biomass material,
it behaves like most whole biomass materials that we have studied.
Torrefaction for
Enhanced wood fuels (250 – 290 °C)
Fast pyrolysis for
Bio-oil (450 – 500 °C)
Carbonization
for charcoal
100 °C 200 °C 300 °C 400 °C 500 °C 600 °C
Lignin
Cellulose
Hemicellulose
Drying
Figure 4. An example of the thermal fractionation of biomass by a step-wise pyrolysis approach. Adapted
from Reference [40].
Figure 5. FT-IR spectra of products of xylan (hemicellulose) from TG-FTIR pyrolysis experiments.

International Conference on Environmental Systems
7
Figure 6. TG-FTIR analysis of fecal simulant heated at 30K/min to 900°C. The data in blue are for
cumulative product yields at 300°C, while the data in orange are for cumulative product yields at 900°C.
(b)
(a)

International Conference on Environmental Systems
8
Table 1. Results for TG-FTIR analysis of fecal simulant at 300°C and 900°C while heated at 30K/min.
Sample: Standard Feces Simulant
Heating Rate: 30 K/min (300 °C) 30 K/min (900 °C)
Run No. AFR5722 AFR5772
TG-FTIR Profile Used: BIOM30 BIOM30
Drying Regime: 30 min at 80 °C 30 min at 80 °C
Sample Size (mg): 54.81 54.81
Product Yield (wt. %)
300 °C (AR) 300 °C (DAF) 900 °C (AR) 900 °C (DAF)
Moisture 17.53 17.53
Ash (AR) 0 0.00
Ash (dry) 0.00 0.00
VM (from TGA data) 10 12.13 65.81 79.80
Char 72.47 87.87 16.66 20.20
Tar (by difference) 3.35 4.06 46.70 56.63
Water (pyrolytic) 4.30 5.22 9.28 11.25
Carbon Monoxide 0.07 0.08 1.42 1.72
Carbon Dioxide 0.90 1.09 3.47 4.21
Methane 0.02 0.02 0.73 0.88
Ethylene 0.00 0.00 0.09 0.11
Hydrogen Cyanide 0.01 0.01 0.15 0.18
Ammonia 0.00 0.00 0.09 0.11
Isocyanic Acid 0.00 0.00 0.06 0.08
Formaldehyde 0.01 0.01 0.51 0.62
Acetaldehyde 0.00 0.00 1.29 1.56
Formic Acid 0.06 0.07 0.31 0.37
Acetic Acid 0.33 0.40 0.27 0.33
Methanol 0.00 0.00 0.00 0.00
Sulfur Dioxide 0.00 0.00 0.00 0.00
Carbonyl Sulfide 0.01 0.02 0.07 0.08
Phenol 0.00 0.00 0.00 0.00
Acetone 0.12 0.15 1.40 1.70
III. Experimental
A. Experimental Apparatus
The initial work was to design and assemble a laboratory system for torrefaction studies on fecal simulant
samples using different heating methods. A schematic of the torrefaction reactor system that was assembled for this
project is shown in Figure 7. The primary components are the reactor unit and the gas analyzers, which include an
On-Line Technologies, Inc. Model 2100 Process FTIR spectrometer and a Stanford Research Systems QMS 100
mass spectrometer. A two-stage condenser (25°C, 5°C) is employed for collecting condensable products (water and
oil) and a wool filter is used to prevent residual particulate species from contaminating the sampling components of
the gas analysis instrumentation. The FTIR gas analyzer has a frequency range of 700 – 6500 cm-1
with a resolution
of 0.5 cm-1
. The instrument is calibrated for quantitative measurements of CO2, CO, CH4, C2H4 and H2O (which is
not completely condensed). The heated (125°C), single pass gas sampling cell (~ 50 cc volume, pathlength = 4
inches) has an exchange rate of 4-5 seconds and is ideal for observing transients in the various gas evolutions during
the torrefaction experiments. The mass spectrometer is calibrated for H2, CO2, CH4 and C2H2.

International Conference on Environmental Systems
9
Figure 7. Schematic of the experimental apparatus employed for torrefaction experiments.
A primary goal of the study was to evaluate two different heating approaches for torrefaction of fecal simulant
samples: 1) electrical heating using a conventional tube furnace-type heater and 2) microwave heating. The design,
construction, and operation of both reactors was described in some detail in previous publications [5,6]. The
microwave torrefaction system was adapted from a previously constructed microwave pyrolysis prototype [41,42].
B. Materials
The composition of the base fecal simulant samples used for these experiments is shown in Table 2. This is
similar to a formulation developed by Wignarajah et al. [43], the only difference being that E.coli addition was not
used, for safety reasons. The water content, determined by drying in an 80oC oven for a period of 24 hours, is
generally in the range of 20 – 23%, depending on the type of miso used. Because a “standard” miso source was
temporarily unavailable, the initial three experiments used a low-salt alternative, which resulted in a simulant with
slightly higher water content (~ 23%) than that obtained with the standard miso (~ 20%). Water was added to the “as
prepared” simulant to generate levels up to 50% water content for torrefaction experiments.
Table 2. Chemical composition of fecal simulant.
Component Weight Percent
Cellulose 14.3
Polyethylene Glycol 7.1
Peanut Oil 28.6
Miso 42.9
Potassium Chloride 5.7
Calcium Chloride 1.4
Gas
Analyzers
Nitrogen
Carrier Gas
Power
Meter
MFC MFM
Torrefaction
Reactor
Condenser Filter
Computer
Tc

International Conference on Environmental Systems
10
IV. Results and Discussion
A. Torrefaction Experiments
Under the recent project, a total of 27 torrefaction experiments were performed, using both electrical furnace
heating and microwave heating. The project focused mainly on fecal simulants, as described in the previous section,
but other materials were also studied, including Milorganite (a sewage sludge-derived fertilizer product), baby
wipes, and cotton fabric (from tee-shirts), using the microwave reactor. Furnace heating experiments involved
approximately 125 – 170 g sample sizes, depending on the sample moisture content, while microwave heating
experiments generally involved 250 – 335 g samples, again depending on the sample moisture content. In both
cases, the sample was purged with a 1 LPM nitrogen carrier gas for a minimum of 30 minutes prior to heating and
the carrier flow maintained throughout the course of the run. As described above, FTIR and mass spectra were
collected and analyzed continuously throughout each run in order to track CO2, CO, CH4, C2H4, C2H2 and H2O.
After cool down, the reaction vessel, condenser, filter, and gas transfer lines were weighed to determine the
remaining torrefied sample mass and condensate produced during each run. Mass balances were in the range 96 –
98 % for all but the first few runs. It should be noted that ethanol was typically also observed in the spectral data, but
was not quantified. Based on its evolution beginning at low temperatures (<100°C), the ethanol is thought to be a
fermentation product present in the miso, which represents the largest fraction of material in the simulant (excluding
water). In addition, the spectra displayed features consistent with the presence of carbonyl compounds, such as
acetone and acetic acid. Both of these compounds were quantified in the TG-FTIR analyses described above (see
Figure 6 and Table 1).
As discussed above, two modes of heating were employed. In some cases, the furnace or microwave heater was
temperature controlled, using feedback from one of the sample thermocouples or the furnace thermocouple, in the
case of furnace heating. In other cases, the heater was operated in a constant power mode. For microwave heating,
experiments were also conducted with and without the aid of a central microwave susceptor (SiC tube). An example
of a torrefied sample of fecal simulant is shown in Figure 8, which depicts a photograph of the untreated simulant
(20% water content) along with the torrefied residue after heating to ~ 300oC. The untreated sample has the
consistency of moist sand. After heating, the simulant is fully charred and reduced to a mass of less than half of its
initial (as-received) value. The amount of mass loss depends on the final temperature and holding time, as well as
the initial moisture content.
Table 3 summarizes the results for the total liquid yields of the torrefaction experiments that were performed on
the fecal simulant, Milorganite fertilizer, cotton fabric, and baby wipes. It includes the key experimental parameters,
including the sample mass, sample moisture content, measured (maximum) sample temperatures, and calculated
(average) sample temperatures. In addition, Table 3 lists whether furnace or microwave heating was employed. The
table also provides the yields for CO2, which was the major non-condensable gas observed in all runs, the yields of
which are an indicator of the severity of the heating profile. As described above, the liquid yields are determined
gravimetrically. A more complete description of these experiments was provided previously [5,6].
B. Excess Water Production Table 3 also provides a calculated ratio of the water recovered compared to the initial moisture content, in the
next to the last column. The water collected was estimated by assuming that all of the liquid collected was 100 %
water, an assumption that was supported by selected analyses, discussed below in section D. In almost every case,
excess water was formed when compared to the moisture that was in the starting material. As discussed in the
Background section, about half of the ~ 20% by weight of pyrolytic water for most biomass materials is formed
under torrefaction conditions, or about 10 wt. % on a dry basis. If this 10 % assumption is made for all of the
materials that were studied, an expected excess water ratio can be estimated and this is given in the last column in
Table 3. In general, the two columns agree pretty well. The exceptions were mainly the non-standard materials that
were tested, such as the cotton tee-shirts or wipes. There were also a few experiments where the torrefaction
temperature was well above 300 oC, e.g., Run No. 3, and in this case the assumption of the liquid being almost all
water would not be correct. If Run Nos. 3, 22, 23, and 24 are excluded, the average of the actual H2O ratios was
1.33, while the average of the expected H2O ratios was 1.26. The microwave experiments were more in line with
expectations, presumably since the temperature control and uniformity were better. These were also done later in in
the study when the mass balances had improved to generally better than 95%.

International Conference on Environmental Systems
11
Table 3. Summary of liquid yields for all torrefaction experiments. The rows are color-coded based on the
type of material that was torrefied: no shading = fecal simulant, yellow = Milorganite fertilizer, blue = cotton
material and pink = baby wipes.
Run
No.
Sample
Mass
(g)
Moisture
Content
(%)
Heater
Type
Max.
Temp.
(oC)
Ave.
Temp.1
(oC)
Liquid
Yield
(g)
Meas.
CO2
(g)
H2O
Ratio2
(Actual)
H2O
Ratio3
(Expect)
1 126.3 23 Furn. 300 I 34.1 2.55 1.18 1.33
2 125.1 23 Furn. 300 I 35.6 2.95 1.24 1.33
3 125.2 23 Furn. 521 >300 71.3 5.08 2.48 1.33
4 125.6 20 Furn. 310 272 51.6 3.45 2.06 1.40
5 125.2 20 Furn. 310 264 59.9 4.53 2.40 1.40
6 250.2 20 Micro. 342 I 77.6 5.05 1.55 1.40
7 250.2 20 Micro. 202 201 55.9 1.23 1.12 1.40
8 250.8 20 Micro. 274 220 60.4 1.84 1.20 1.40
9 250.5 20 Micro. 341 245 76.0 4.69 1.52 1.40
10 250.2 20 Micro. 304 232 68.4 3.20 1.37 1.40
11 276.9 20 Micro. 320 235 79.5 3.73 1.43 1.40
12 280.8 20 Micro. 304 237 77.2 4.07 1.37 1.40
13 335.9 40 Micro. 311 229 154.4 3.27 1.15 1.15
14 168.1 40 Furn. 334 265 109.6 8.07 1.63 1.15
15 167.9 40 Furn. 211 203 72.2 1.33 1.07 1.15
16 336.1 40 Micro. 235 < 200 141.0 1.49 1.05 1.15
17 168.7 40 Furn. 303 228 106.4 4.76 1.58 1.15
18 327.9 50 Micro. 266 < 200 168.7 0.89 1.03 1.10
19 327.9 50 Micro. 303 232 173.1 2.01 1.06 1.10
20 267.2 40 Micro. 293 240 118.1 0.94 1.10 1.15
21 327.7 50 Micro. 284 232 172.0 2.04 1.05 1.10
22 64.2 4.5 Micro. 278 239 3.8 0.78 1.31 3.10
23 74.6 4.5 Micro. 314 279 21.4 3.40 6.29 3.10
24 163.7 81 Micro. 321 248 129.7 0.65 0.98 1.02
25 300.3 40 Micro. 341 268 141.6 4.17 1.18 1.15
26 301.6 40 Micro. 355 280 141.9 4.06 1.18 1.15
27 302.9 40 Micro. 317 272 142.9 3.55 1.18 1.15
1) Average sample temperature where both sample temperatures are ≥ 200 oC. I = Insufficient data.
2) See Text; 3) See Text
Figure 8. Photograph of a sample of undried fecal simulant (left) and a torrefied (~300 °C) sample (right).

International Conference on Environmental Systems
12
C. Torrefaction of other Cellulosic Biomass Materials Of the other materials that were studied, the Milorganite proved to be the easiest material to heat using
microwave processing. However, after heating it to a temperature of 293°C, it appeared visually unchanged. It was
subsequently learned that, during manufacturing, Milorganite is processed at much higher temperatures, ranging
from ~480 to 650°C. On the other hand, the cotton material proved to be more difficult to heat and was not
converted to a powder at the temperatures that were explored. For Run #22 (max. temp. = 278°C), the temperatures
were not sufficient to completely convert the cotton material to char. For Run #23, the torrefaction temperature was
increased to 314°C and maintained for a much longer period, resulting in nearly complete charring of the tee-shirt
material and ~ 50% weight loss, although the fabric structure still remained largely intact. Baby wipes showed
similar results to the cotton using microwave treatment. Both of these materials are mostly cellulose and do not have
the hemi-cellulose content that initiates the early decomposition and nearly complete disintegration of materials that
contain whole biomass. This is contrary to the results for the fecal simulant or plant biomass materials under
torrefaction conditions [33]. Future work will include a more detailed study of the effects of feedstock composition,
particularly with regard to how it affects the physical structure and the water production. The testing will also
progress to closer analogs of fecal matter, such as sewage sludge and actual fecal material, and mixtures that include
more than one type of biomass material.
D. Char and Liquid Analysis Several samples of char and liquids derived from torrefaction of fecal simulants were analyzed by Huffman
Laboratories, Inc. (Golden, CO), to assess their composition and organic content, respectively. Table 4 lists the
results for the solids analyses, showing the elemental composition (C,H,N,O,S) as well as ash, Volatile Matter (VM)
and Fixed Carbon (FC), along with temperature data. It also lists the starting composition for a raw feces simulant
used in a previous project, but made with the same recipe [41, 42]. Note that the data are listed in order of increasing
maximum torrefaction temperature. In general, the compositions for the four samples generated at temperatures
under 285°C are quite similar and only modestly different than the starting material. The fact that the char product
from the torrefaction process retains a lot of its hydrogen content (see blue shaded column) suggests that it might be
better at radiation shielding than activated carbon, although not as good as polyethylene [44]. Some preliminary
measurements were made in this regard and were discussed previously [6]. For the highest temperature case, higher
nitrogen and ash and a decrease in carbon, hydrogen, oxygen, and VM are observed.
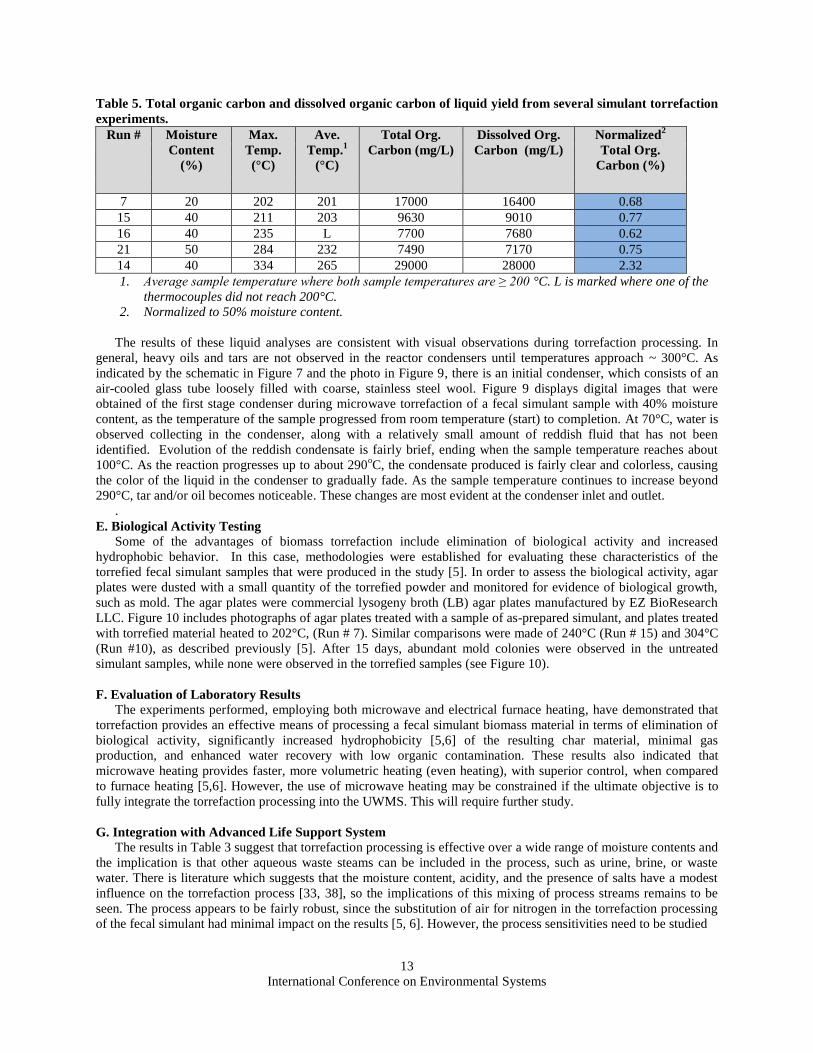
Table 5 lists the results for the liquid analyses in terms of Total Organic Carbon (TOC) and Dissolved Organic
Carbon (DOC). The table also shows the TOC values normalized to a moisture content of 50%, the highest moisture
content that was studied in this project. As was the case for the solids analyses, the four samples generated at
torrefaction temperatures less than 285oC are similar in terms of their normalized TOC, ranging from 0.62 – 0.77 %
(see blue shaded column). Some of the organics may be condensed ethanol that is thought to originate from the miso
in the simulant, as discussed above. Nonetheless, these values are very close to the acceptable limits for water
recycling applications in space. It should be noted that the 50% moisture content used for the normalized TOC
measurements is actually on the low end of the expected moisture contents in human feces (65-85 %) [45]. The
modest TOC amounts confirm that most of the liquid product collected is water and that the amount of water is in
excess of the moisture content (see next-to-last column, Table 3). In fact, excluding the highest temperature and
non-simulant runs, the amount of water collected is close to the sum of the moisture content plus 10 wt. % of the dry
solid mass being converted to additional water (see last column, Table 3).
Table 4. Composition of char from several fecal simulant torrefaction experiments.
Run
#
Moisture
Content
(%)
Max.
Temp.
(°C)
Ave.
Temp.1
(°C)
Composition (%)
C H N O S Ash VM FC
RAW 19 ___ ___ 49.70 7.77 0.97 28.15 0.06 13.35 75.60 11.05
7 20 202 201 52.14 7.46 1.04 25.03 0.08 14.25 73.69 12.06
15 40 211 203 56.68 7.65 1.05 19.63 0.06 14.93 70.61 14.46
16 40 235 L 53.33 7.55 1.02 23.02 0.06 15.02 73.15 11.83
21 50 284 232 55.83 7.61 1.09 19.39 0.06 16.02 71.39 12.59
14 40 334 265 47.33 4.66 1.59 11.76 0.05 34.61 37.11 28.28
1. Average sample temperature where both sample temperatures are ≥ 200 °C. L is marked where one of the
thermocouples did not reach 200°C. The analyses are reported on a dry basis, except for moisture (as
received).
International Conference on Environmental Systems
13
Table 5. Total organic carbon and dissolved organic carbon of liquid yield from several simulant torrefaction
experiments.
Run # Moisture
Content
(%)
Max.
Temp.
(°C)
Ave.
Temp.1
(°C)
Total Org.
Carbon (mg/L)
Dissolved Org.
Carbon (mg/L)
Normalized2
Total Org.
Carbon (%)
7 20 202 201 17000 16400 0.68
15 40 211 203 9630 9010 0.77
16 40 235 L 7700 7680 0.62
21 50 284 232 7490 7170 0.75
14 40 334 265 29000 28000 2.32
1. Average sample temperature where both sample temperatures are ≥ 200 °C. L is marked where one of the
thermocouples did not reach 200°C.
2. Normalized to 50% moisture content.
The results of these liquid analyses are consistent with visual observations during torrefaction processing. In
general, heavy oils and tars are not observed in the reactor condensers until temperatures approach ~ 300°C. As
indicated by the schematic in Figure 7 and the photo in Figure 9, there is an initial condenser, which consists of an
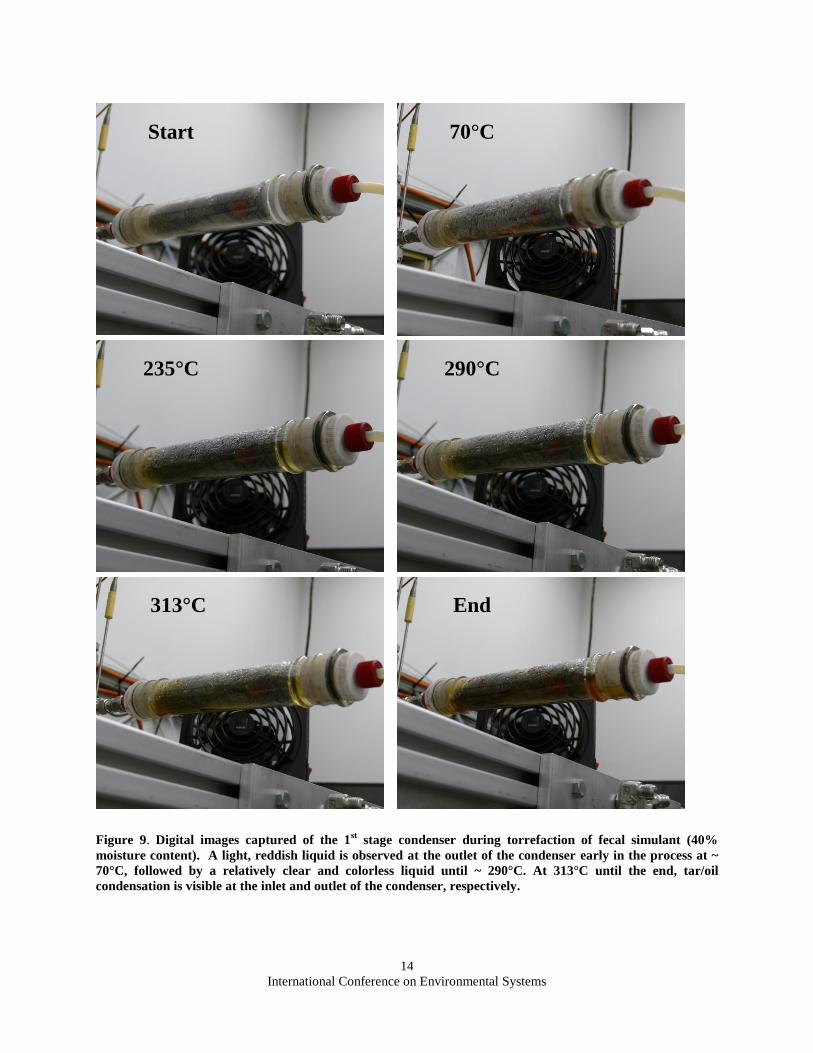
air-cooled glass tube loosely filled with coarse, stainless steel wool. Figure 9 displays digital images that were
obtained of the first stage condenser during microwave torrefaction of a fecal simulant sample with 40% moisture
content, as the temperature of the sample progressed from room temperature (start) to completion. At 70°C, water is
observed collecting in the condenser, along with a relatively small amount of reddish fluid that has not been
identified. Evolution of the reddish condensate is fairly brief, ending when the sample temperature reaches about
100°C. As the reaction progresses up to about 290oC, the condensate produced is fairly clear and colorless, causing
the color of the liquid in the condenser to gradually fade. As the sample temperature continues to increase beyond
290°C, tar and/or oil becomes noticeable. These changes are most evident at the condenser inlet and outlet.
.
E. Biological Activity Testing Some of the advantages of biomass torrefaction include elimination of biological activity and increased
hydrophobic behavior. In this case, methodologies were established for evaluating these characteristics of the
torrefied fecal simulant samples that were produced in the study [5]. In order to assess the biological activity, agar
plates were dusted with a small quantity of the torrefied powder and monitored for evidence of biological growth,
such as mold. The agar plates were commercial lysogeny broth (LB) agar plates manufactured by EZ BioResearch
LLC. Figure 10 includes photographs of agar plates treated with a sample of as-prepared simulant, and plates treated
with torrefied material heated to 202°C, (Run # 7). Similar comparisons were made of 240°C (Run # 15) and 304°C
(Run #10), as described previously [5]. After 15 days, abundant mold colonies were observed in the untreated
simulant samples, while none were observed in the torrefied samples (see Figure 10).
F. Evaluation of Laboratory Results
The experiments performed, employing both microwave and electrical furnace heating, have demonstrated that
torrefaction provides an effective means of processing a fecal simulant biomass material in terms of elimination of
biological activity, significantly increased hydrophobicity [5,6] of the resulting char material, minimal gas
production, and enhanced water recovery with low organic contamination. These results also indicated that
microwave heating provides faster, more volumetric heating (even heating), with superior control, when compared
to furnace heating [5,6]. However, the use of microwave heating may be constrained if the ultimate objective is to
fully integrate the torrefaction processing into the UWMS. This will require further study.
G. Integration with Advanced Life Support System
The results in Table 3 suggest that torrefaction processing is effective over a wide range of moisture contents and
the implication is that other aqueous waste steams can be included in the process, such as urine, brine, or waste
water. There is literature which suggests that the moisture content, acidity, and the presence of salts have a modest
influence on the torrefaction process [33, 38], so the implications of this mixing of process streams remains to be
seen. The process appears to be fairly robust, since the substitution of air for nitrogen in the torrefaction processing
of the fecal simulant had minimal impact on the results [5, 6]. However, the process sensitivities need to be studied
International Conference on Environmental Systems
14
Figure 9. Digital images captured of the 1st stage condenser during torrefaction of fecal simulant (40%
moisture content). A light, reddish liquid is observed at the outlet of the condenser early in the process at ~
70°C, followed by a relatively clear and colorless liquid until ~ 290°C. At 313°C until the end, tar/oil
condensation is visible at the inlet and outlet of the condenser, respectively.
Start
End 313°C
290°C 235°C
70°C

International Conference on Environmental Systems
15
Simulant, Day 1 Torrefied Simulant (202 oC), Day 1
Torrefied Simulant (202 oC), Day 15 Simulant, Day 15
Figure 10. Biological activity testing results using agar plates. After 15 days, mold colonies are easily seen in the
untreated simulant sample. No evidence of mold growth is observed in the torrefied sample briefly heated to 202 oC
(Run #7).

International Conference on Environmental Systems
16
with better solid waste analogs, including actual human fecal waste and actual ALS aqueous process streams. The
effect of torrefaction processing on odors for these more realistic waste streams remains to be studied.
The presence of acetic acid in the torrefaction liquids is interesting, since it has some useful properties. For
example, it is used in laundry water as a clothes softener, is often used to clean washers, and has some antimicrobial
properties.
Torrefaction could also be used to homogenize solid wastes before they are introduced into other devices, such
as the HMC, or as a post-treatment process for feces in the UWMS. The ability of torrefaction processing to
homogenize materials into a uniform powder is partly dependent on the hemi-cellulose content, as discussed above.
How this would be affected by multi-component mixtures remains a subject of future study.
V. Conclusions
A recent project demonstrated that microwave (volumetric) heating allowed for careful control of torrefaction
conditions for a fecal simulant and related cellulosic biomass materials. The net result was complete recovery of
moisture, some additional water production (typically >10 wt. % of the dry biomass weight), which can lead to a
significant percent increase (10 to 40) in the water recovery (depending on the initial moisture content). There was
also a modest reduction of the dry solid mass and small amounts of gas (CO2, CO, CH4) and hydrocarbon liquid
production. The amounts of solid vs. gas plus hydrocarbon liquid products can be controlled by adjusting the
torrefaction conditions (final temperature, holding time). The solid char product from the fecal simulant was a dry,
free flowing powder that did not support bacterial growth and was hydrophobic relative to the starting material [5,
6]. At temperatures less than ~290°C, the condensate was fairly clear and colorless and had a moderate total organic
carbon content (~0.7%). In addition, the torrefaction method can be applied to other types of wet or dry cellulosic
biomass (food, paper, wipes, and clothing), which could provide for some desirable redundancy in the waste
management system. However, the torrefaction behavior is different for cotton and wipes, which are nearly pure
cellulose.
Torrefaction processing is also complementary to the Heat Melt Compactor (HMC) [28] as a biomass
pretreatment step and is compatible with the Universal Waste Management System (UWMS) [29] as a post-
treatment step, both now under development by NASA. A microwave torrefaction process could also be
accomplished with modest energy requirements, which could be improved even further in an optimized prototype
system. However, it should be noted that the use of microwave processing might be constrained by a complete
integration of the torrefaction unit with the UWMS.
The proposed torrefaction approach will make it technically feasible to process human fecal waste and related
cellulosic biomass waste streams and produce additional water and other useful products in space. This will benefit
NASA in allowing for volume reduction, solid waste sterilization and stabilization, and water recovery for near term
missions. In the case of longer term missions, more severe (pyrolysis) processing in the same or similar equipment
would allow for enhanced water and CO2 production, production of fuel gases (CH4, CO, and H2) and multi-purpose
carbon, along with ISRU. In particular, the torrefaction char residue has several potential applications in space.
These include production of activated carbon, a nutrient-rich substrate for plant growth, construction material,
radiation shielding, storage of elemental carbon, hydrogen and oxygen, and fuel gas (CH4, CO, H2) production.
Acknowledgments
The support of this work by the NASA-Ames Research Center under contracts NNX10CA22C and
NNX13PCA54P is gratefully acknowledged. The authors also wish to thank Ms. Emily Serio, who assisted with the
laboratory work. In addition, the authors wish to acknowledge helpful discussions with Tim Nalette and Thomas
Stapleton of UTC Aerospace Systems.
References
1 Metcalf, J., Peterson, L, Carrasquillo, R., and Bagdigian, R., “National Aeronautics and Space Administration (NASA)
Environmental Control and Life Support (ECLS) Integrated Roadmap Development,” AIAA 2012-3444. 2 Carrasquillo, R. and Anderson, M., “Environmental Control and Life Support (ECLS) Hardware Commonality for
Exploration Vehicles,” AIAA 2012-3623. 3 Barta, D.J., Chullen, C., and Pickering, K.D., “Next Generation Life Support Project: Development of Advanced
Technologies for Human Exploration Missions,” AIAA 2012-3446. 4Broyan, J.L., and Ewert, M.K., “Logistics Reduction and Repurposing Beyond Low Earth Orbit,” AIAA 2012-3445.
International Conference on Environmental Systems
17
5 Serio, M.A., Cosgrove, J.E., and Wójtowicz, M.A., “Torrefaction Processing of Human Fecal Waste,” Final Report under
Contract No. NNX13CA54P, November 2013. 6 Serio, M.A., Cosgrove, J.E., Wójtowicz, M.A., Lee, L., Kanapathipilai, W., and Fisher, J., “Torrefaction Processing of
Spacecraft Solid Waste,” 44th International Conference on Environmental Systems ICES-2014-211, Tucson, AZ, July 13-17,
2014. 7 Tri, T.O., Edeen, M.A., and Henninger, D.L., SAE 26th International Conference on Environmental Systems, Monterey, CA,
Paper #961592, 8p. July 8-11,1996. 8 Bubenheim, D.L. and Wydeven, T., Advances In Space Research (ISSN 0273-1177), Vol. 14, No. 11, P.113-123, Nov.
1994. 9 Flynn, M. and Bubenheim, D., Space Technology and Applications International Forum (STAIF-98); Proceedings of The
2nd Conference on Applications of Thermophysics In Microgravity and 3rd Conference on Commercial Development of Space,
Albuquerque, NM, P. 835-839, Jan. 25-29, 1998. 10
Ferrall, J.F., Ganapathi, G.B., Rohatgi, N.K., and Seshan, P.K., Technical Report – NASA-TM-109927; NAS 1.15:109927,
Jet Propulsion Lab., Pasadena, CA. 11
Bilardo, V.J., Jr. and Theis, R.L.A., Engineering, Construction, and Operations In Space III: Space ’92, Vol. 2, P. 1748-
1764, May 31-June 4, 1992. 12 Fisher, J.W., Hogan, J.A., Deizeit, L., Liggett, T. Wignarajah, K., Alba, R., Litwiller, E., Pace, G., and Fox, T.G., “Waste
Management Technology and the Drivers for Space Missions,” SAE 2008-01-2047, presented at the 38th International
Conference on Environmental Systems, San Francisco, CA, 2008. 13
Ewert, M.K. and Broyan, Jr., J.L., “Mission Benefits Analysis of Logistic Reduction Technologies,” AIAA 2013-3383. 14
Jones, H.W., “Space Life Support Risk and Reliability,” AIAA 2013-3315. 15
Fisher, J.W., Hogan, J.A., Deizeit, L., Liggett, T., Fox, T.G., “Waste Management Technology and the Drivers for Space
Missions,” SAE 2008-01-2047. 16
Pace, G.S., Delzeit, L., and Fisher, J., “Testing of a Plastic Melt Waste Compactor Designed for Human Space Exploration
Missions,” SAE 2009-01-2363. 17
Wignarajah, K., Alba, R., Fisher, J.W., Hogan, J.A., and Fox, T., “Investigations into Water Recovery from Solid Wastes
using a Microwave Solid Waste Stablization and Water Recovery System,” SAE 2009-01-2341. 18
Fisher, J.W., Hogan, J.A., Delzeit, L., Wignarajah, K., Alba, R., Pace, G., and Fox, TG., “Water Recovery from Wastes in
Space Habitats – a Comparative Evaluation of SBIR Prototypes,” SAE 2009-01-2342. 19
Hogan, J.A. “Solid Waste Management for Space Missions,” Workshop on Technology Approaches for Current and Future
Base Camp Sustainability,” Raleigh, NC, Sept. 12-14, 2007. 20
Ferrall, J., Rohatgi, N.K., and Seshan, P.K., SAE Paper 921119. 21
Smernoff, D.T., Wharton, R.A., Jr., and Averner, M.M., Sales Agency and Pricing – HC A99/MF A04, P 263-280. 22
Hintze, P.E., Caraccio, A.J., Anthony, S.M., Tsoras, A.N., and Nur, M., “Trash-to-Gas: Using Waste Products to Minimize
Logistical Mass During Long Duration Space Missions,” AIAA Space 2013 Conference, Sept. 10-12, (San Diego, CA). 23
Jones, H.W., Pace, G.S., and Fisher, J.W., “Managing Spacecraft Waste Using the Heat Melt Compactor (HMC),” 43rd
International Conference on Environmental Systems, AIAA 2013-3362. 24
Alba, R., Harris, L., Fisher, J., Wignarajah, K., and Pace, G., “Performance of the Gen 1 Heat Melt Compactor and Lessons
Learned to Enable Further Engineering Development,” 43rd International Conference on Environmental Systems, AIAA 2013-
3363. 25
Hummerick, M.P., Strayer, R.F., McCoy, L.E., Richards, J.T., Ruby, A.M., Wheeler, R., and Fisher, J., “Heat Melt
Compaction as an Effective Treatment for Eliminating Microorganisms for Solid Waste,” 43rd International Conference on
Environmental Systems, AIAA 2013-3364. 26 Serio, M.A., Wójtowicz, M.A. and Charpenay, S., “Pyrolysis,” In Encyclopedia of Energy Technology and The
Environment (A. Bisio and S.G. Boots), John Wiley & Sons, New York, NY, 2281-2308 (1995). 27Bridgewater, A.V., Biomass, 22, (1-4), 279 (1990). 28
Pace, G.S., Delzeit, L., and Fisher, J., “Testing of a Plastic Melt Waste Compactor Designed for Human Space Exploration
Missions,” SAE 2009-01-2363. 29
Stapleton, T.J., Baccus, S., and Broyan, Jr., J.L., “Development of a Universal Waste Management System,” 43rd
International Conference on Environmental Systems, AIAA 2013-3400, Vail, CO, July 14-18, 2013. 30
Bill and Melinda Gates Foundation, “Water, Sanitation, & Hygiene: Reinvent the Toilet Challenge,”
www.gatesfoundation.org, 2011. 31Lehmann, J., Gaunt, J., Rondon, M., “Bio-Char Sequestration in Terrestrial Ecosystems – a Review; Mitigation and
Adaptation Strategies for Global Change,” 11, 403-427, 2004. 32Lehmann, J., “Bio-Energy in the Black,” Frontiers in Ecology and the Environment, 5, 381-387, 2007. 33 Wannapeera, J. Fungtammasan, B., and Worasuwannarak, N., “Effects of Temperature and Holding Time During
Torrefaction on the Pyrolysis Behaviors of Woody Biomass,” Journal of Analytical and Applied Pyrolysis, 92, 99-105, 2011.

International Conference on Environmental Systems
18
34
Bergman, P. C. A., Boersma, A. R., Zwart, R. W. R., and Kiel, J. H. A., Torrefaction for Biomass Co-Firing in Existing
Coal-Fired Power Stations: "BIOCOAL," ECN report No. ECN-C--05-013, 2005. 35
Bergman, P. C. A., Boersma, A. R., Kiel, J. H. A., Prins, M. J., Ptasinski, K. J., and Janssen, F. J. J. G., Torrefaction for
Entrained-Flow Gasification of Biomass, ECN report No. ECN-C--05-067, 2005. 36
Bergman, P. C. A., and Kiel, J. H. A., Torrefaction for Biomass Upgrading, ECN report No. ECN-RX--05-180, 2005. 37
Nimlos, M. N., Brooking, E., Looker, M. J., and Evans, R. J., ACS Div. of Fuel Chem. Preprints, 48, 590-591, 2003. 38
Bridgeman, T. G., Jones, J. M., Shield, I., and Williams, P. T., "Torrefaction of Reed Canary Grass, Wheat Straw and
Willow to Enhance Solid Fuel Qualities and Combustion Properties," Fuel, 87 (6), 844–856, 2008. 39
Pach, M., Zanzi, R., and Bjøenbom, E., "Torrefied Biomass a Substitute for Wood and Charcoal," 6th Asia-Pacific Int.
Symp. on Comb. and Energy Utiliz., Kuala Lumpur, 2002. 40
deWild, P., “Biomass Pyrolysis for Chemicals,” Ph.D Thesis (2011). 41 Serio, M.A., Cosgrove, J.E., Wójtowicz, M.A., Wignarajah, K., and Fisher J., “Pyrolysis Yields from Microwave-Assisted
Heating of Solid Wastes,” 42nd International Conference on Environmental Systems, AIAA 2012-3566. 42 Serio, M.A., Cosgrove, J.E., Wójtowicz, M.A., Wignarajah, K., and Fisher, J., “A Prototype Microwave Pyrolyzer for
Solid Wastes,” 43rd International Conference on Environmental System, AIAA 2013-3371. 43
Wignarajah, K., Hogan, J. A. Fisher, J. W., and Delzeit, L., “Evaluation of the Microwave Enhanced Freeze Drying
Technology for Processing Solid Wastes”, 38th International Conference on Environmental Systems, Paper No. 2008-01-2051. 44
Rubenstein, E. P., Wójtowicz, M. A., Florczak, E., Kroo, E., Townsend, L. W., Wilkins, R., Gersey, B., and Atwell, W.,
"Radiation Shielding and Mechanical Strength Evaluations of Non-Parasitic, Multi-Functional Microporous Carbon For
Aerospace Applications,” SAE Technical Paper No. 2006-01-2104. 45
Schouw, N.L., Danteravanich, S., Mosbaek, H., and Tjell, J.C., “Composition of Human Excreta – A Case Study from
Southern Thailand,” The Science of the Total Environments, 286, 155-166, 2002.
Related Documents


