Augusto Garcia-Hernandez, and Hector Delgado-Garibay Southwest Research Institute ® Eduardo Elias Rayón, Moisés León Dorantes, and Marco Antonio Muñoz Prior PEMEX Exploracion y Produccion

Welcome message from author
This document is posted to help you gain knowledge. Please leave a comment to let me know what you think about it! Share it to your friends and learn new things together.
Transcript

Augusto Garcia-Hernandez, and Hector Delgado-Garibay
Southwest Research Institute®
Eduardo Elias Rayón, Moisés León Dorantes, and Marco Antonio Muñoz Prior
PEMEX Exploracion y Produccion

• Background & Introduction
• Pipeline Model
• Emulsion Viscosity ModelEmulsion Viscosity Model
• Field Activities & TestingP P f• Pump Performance
• Hydraulic Validation
• Modeling Results
• Summary & Conclusions
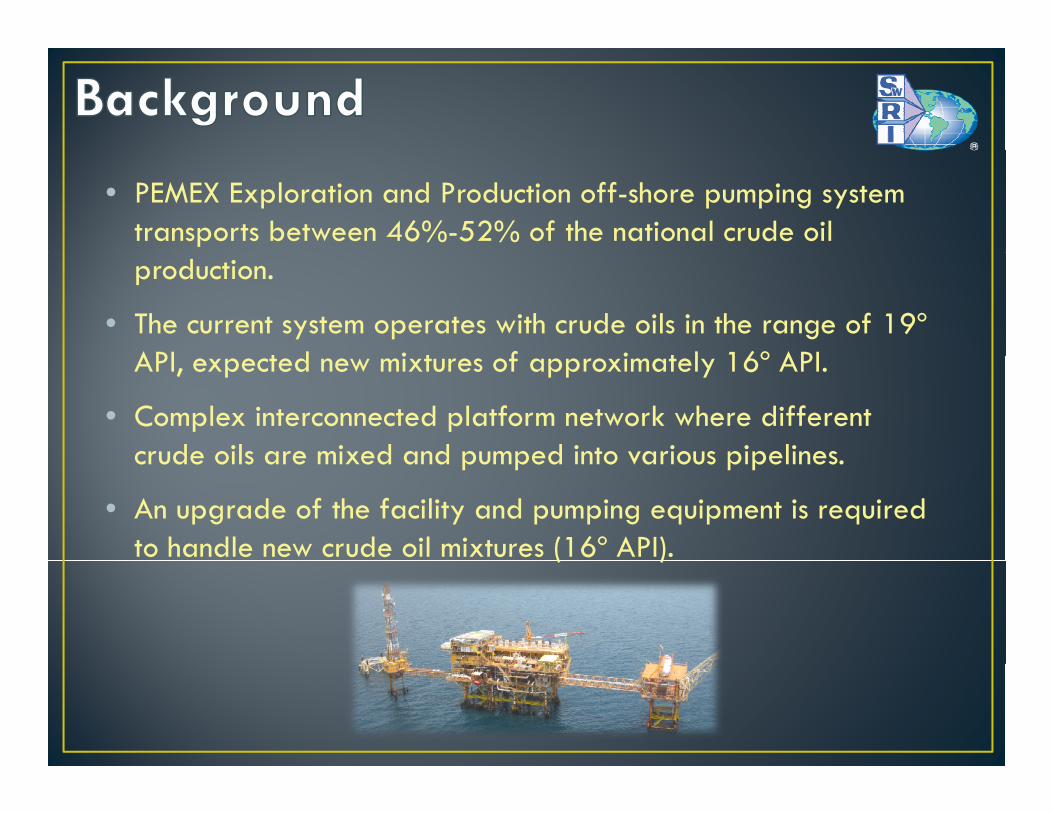
• PEMEX Exploration and Production off-shore pumping system transports between 46%-52% of the national crude oil production.
• The current system operates with crude oils in the range of 19º API t d i t f i t l 16º APIAPI, expected new mixtures of approximately 16º API.
• Complex interconnected platform network where different crude oils are mixed and pumped into various pipelinescrude oils are mixed and pumped into various pipelines.
• An upgrade of the facility and pumping equipment is required to handle new crude oil mixtures (16º API).( )

• Two 36-inch sub-sea pipelines travel 52 milesTh b l f
• Two 36-inch sub-sea pipelines travel 52 miles.
• The booster platform
Cayo ArcasFSO Ta’Kuntah
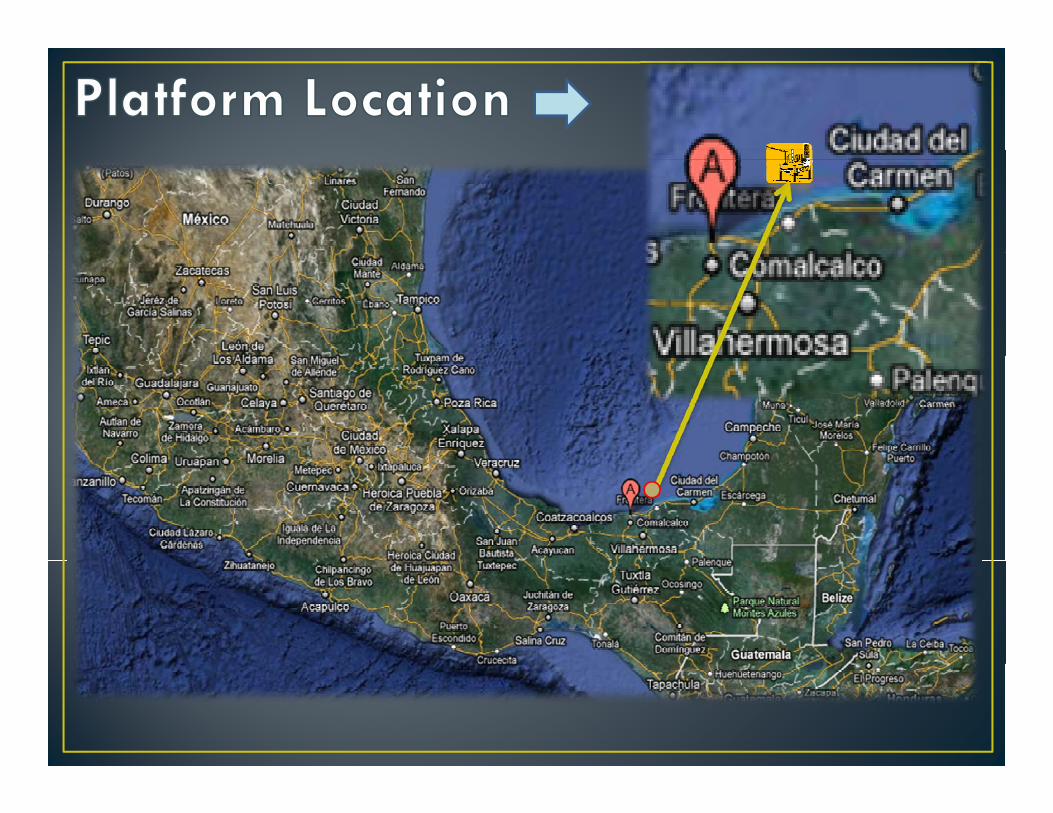
• The booster platform “Rebombeo” is located in the Gulf of Mexico
l 2 l ff
The booster platform “Rebombeo” is located in the Gulf of Mexico approximately 25 miles off-
Akal-N
L-1
L-2
Akal-B
Akal-L36"
36"
36"
36"
24"20"
24"
36"
FPSOYùum
K'ak'náab
FPSO:Ku-S + CLMZaap-C (L276) Nh-A a TMDB
Nh-AKU A (L110):approximately 25 miles off-shore
• Crude oil production from
approximately 25 miles off-shore.
• Crude oil production from
Nohoch-A
L-1
L-2
36"
Akal-JABK-ARMSO
L-3
Akal-C
36"
36"24"
24"
30"
20"
AIKMZKU-A (L164):Ku-A (Perf+Enl)
Ku-SZaap-C (L301)
Akal C1 LigeroAkal C1 + Akal C3
KU-A (L110):CLM (RMSO)
Ku-S
pseveral platforms is collected and transported (19-21º API crude oil emulsions)
several platforms is collected and transported (19-21º API crude oil emulsions).
Rebombeo
POL-A
L-4
36
L-2L-1
L-3)
• Ten centrifugal pumps are installed in the booster platform
• Ten centrifugal pumps are installed in the booster platform
TERMINAL MARITIMA DOS
BOCAS
L 3
36" 36" 36"
L1 = KMZ + AIC= Ku-A + [(Akal-C) +(Nh-A)]= 260 MBD
L2 = AIC= (Akal-J) +
(Akal-B)+(Akal-L/N)+ (Akal-C)+(Nh-A)
=565 MBDplatform platform.

• 1-D pipeline fluid model of the existing facility including
NH-AAKAL-C20”
AKAL-J24”
”
L= 5.2 km
L= 5.3 km
L1, L2, and L3 lines.
• Field measurements of the f
L-1L-2
36”
36
”
L-3INT-26INT-52
INT-27L= 8.6 km
L-3pump performance curves.
• Various emulsion of water-in-oil up to 30% water-cut
REBOMBEO
L 3
oil up to 30% water-cut.
• Flow, pressure, and temperature field data was pused to validate the hydraulic model within 1 12%
Crude Oil Pipeline System from the Production 1.12%.
TMDB
from the Production Platforms to TMDB

• Transported crude oils with different rheological properties, 19 21º API 5% 30%19-21º API, water-cuts 5%-30%.
• Viscosity of water-in-oil emulsions tend to increase with the water-cut. tend to increase with the water cut.
• Field measured fluid properties were used to compare and
lid h l i i i validate the emulsion viscosity models.
• After a detailed comparison, it was After a detailed comparison, it was found that the Phan-Thien & Pham (P-T&P) correlation and Taylor correlation yield very similar correlation yield very similar results.


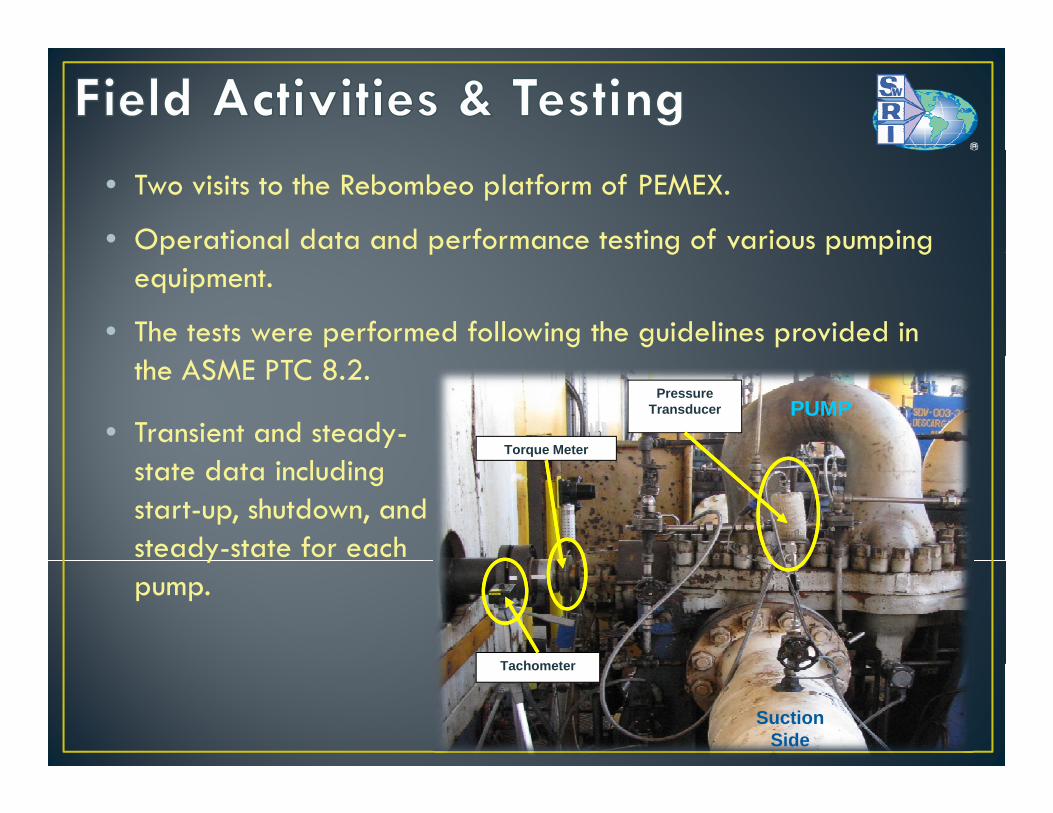
• Two visits to the Rebombeo platform of PEMEX.
• Operational data and performance testing of various pumping p p g p p gequipment.
• The tests were performed following the guidelines provided in the ASME PTC 8.2.
Torque Meter
Pressure Transducer PUMP
• Transient and steady-state data including start-up, shutdown, and steady-state for each
T h t
ypump.
Tachometer
Suction Side
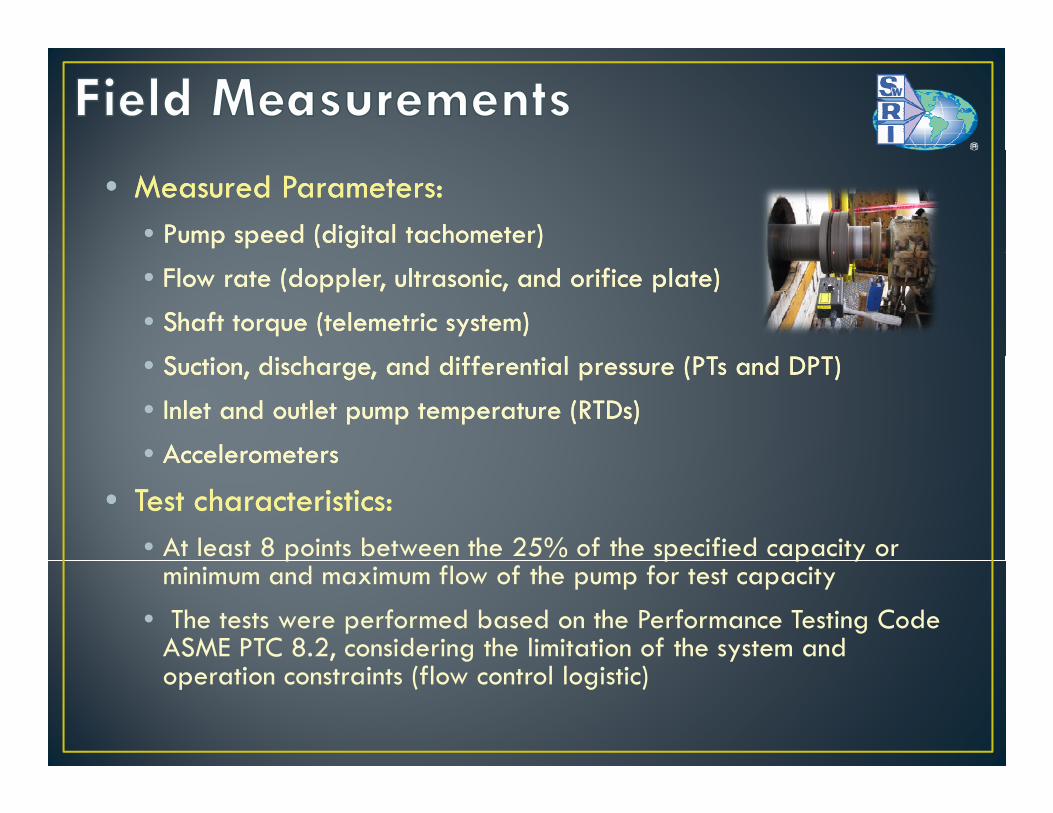
•• Measured Parameters:Measured Parameters:•• Pump Pump speed (digital speed (digital tachometer)tachometer)
•• Flow rate Flow rate ((dopplerdoppler, ultrasonic, and orifice plate), ultrasonic, and orifice plate)
•• Shaft torque (telemetric system)Shaft torque (telemetric system)
•• Suction, Suction, discharge, discharge, and differential pressure (and differential pressure (PTsPTs and and DPTDPT))
•• Inlet and outlet pump temperature (RTDsInlet and outlet pump temperature (RTDs))
•• Accelerometers Accelerometers Accelerometers Accelerometers
•• Test characteristics:Test characteristics:• At least 8 points between the 25% of the specified capacity or p p p y
minimum and maximum flow of the pump for test capacity
• The tests were performed based on the Performance Testing Code ASME PTC 8.2, considering the limitation of the system and operation constraints (flow control logistic)


DH
(ft)
ate
(GPM
)
ic H
ead
TD
Flow
Ra
tal D
ynam
iTo
t
Time
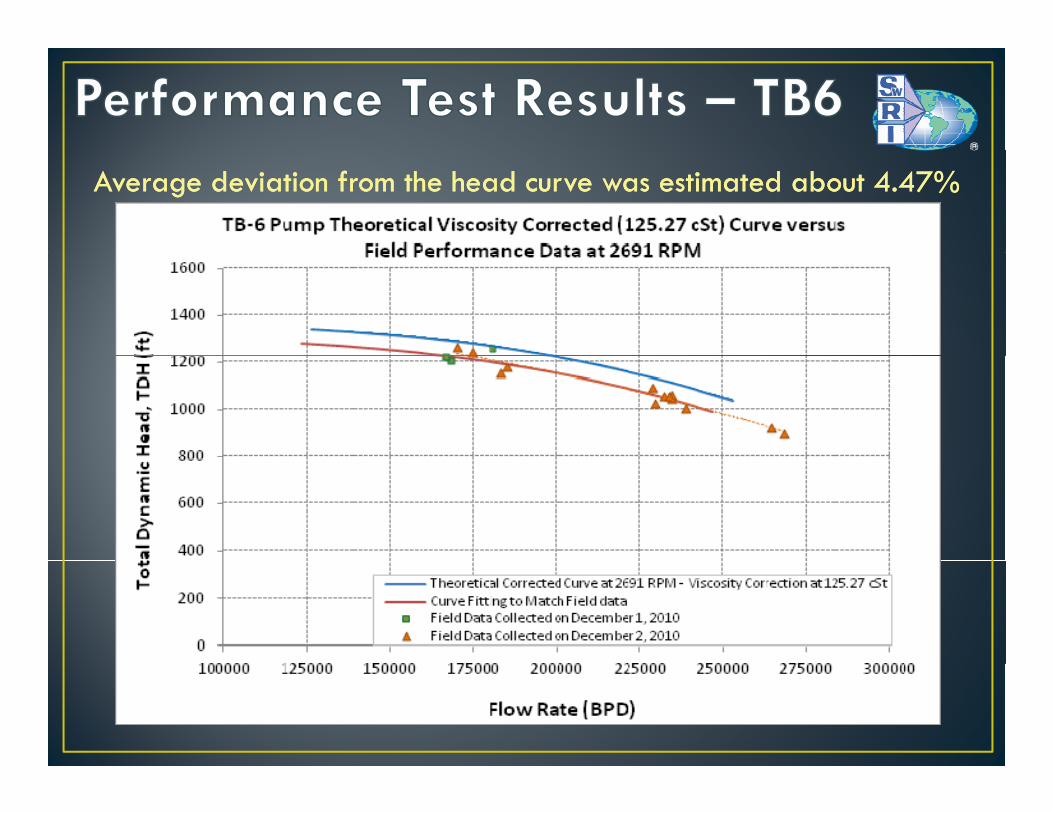
Average deviation from the head curve was estimated about Average deviation from the head curve was estimated about 44..4747%%

Deviation from the theoretical curve was estimated approximately 13.8%, 9%


This values only apply to the frame side (201This values only apply to the frame side (201--208)208)
Classification of
Vibration
Velocity (0-pk),
Inches/sec
Velocity (0-pk),
mm/sec
Smooth < 0.2 < 5.1
Acceptable 0.2 – 0.3 5.1 – 7.6
y pp yy pp y
Acceptable 0.2 0.3 5.1 7.6
Marginal 0.3 – 0.4 7.6 – 10.2
Planned Shutdown
Repairs 0.4 – 0.6 10.2 – 15.2
Immediate Shutdown > 0.6 > 15.2
The maximum obtained vibration values were within 0.1-0.3 ips (inch per seconds) at 1X which are considered low and acceptable

•• The conditions evaluated include:The conditions evaluated include:• Two different crude oils, 16º API and 19º API,
• Two temperatures, 50ºC and 61ºC
• Three water-cuts, 5%, 15%, and 30%
• Two pipeline configurations, L2 and L1+L3
• Two suction pressures, normal (7.5 kg/cm2) and minimum (4.5 kg/cm2)g/ )
•• Equipment configuration:Equipment configuration:• 6 centrifugal pumps (4 low capacity + 2 high capacity)
• 4 low capacity centrifugal pumps
• 4 double screw pumps (future configuration)
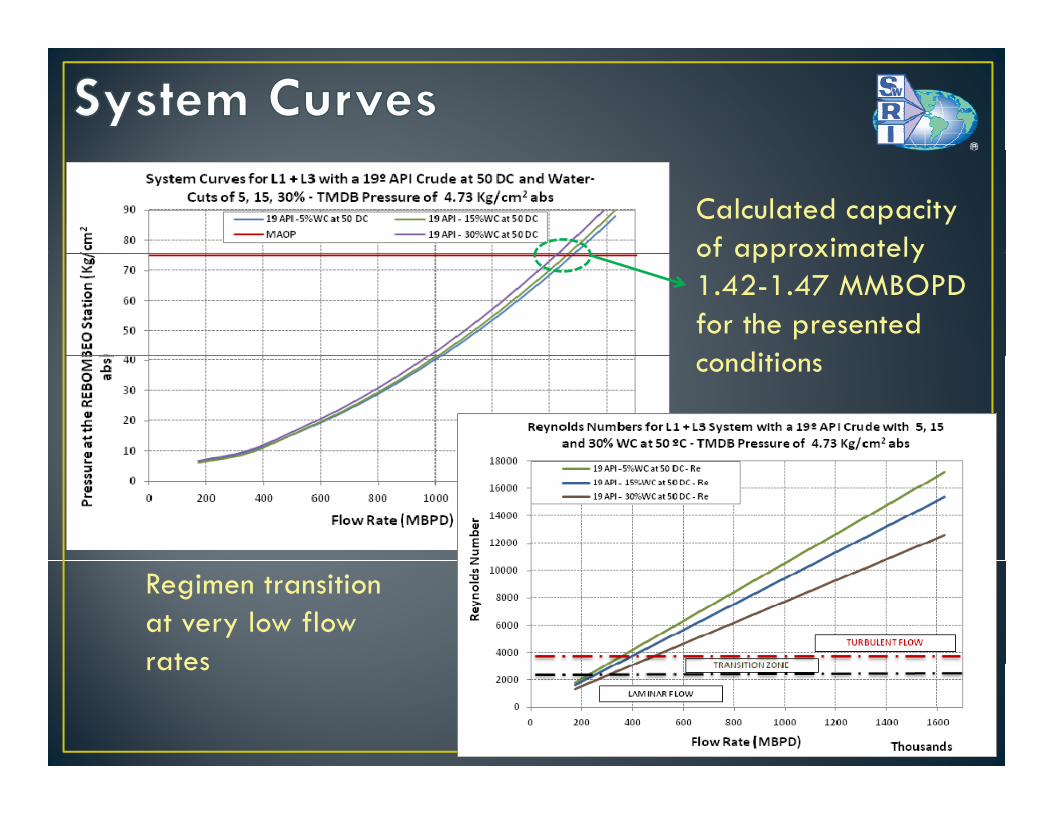
Calculated capacity of approximately of approximately 1.42-1.47 MMBOPD for the presented
diticonditions
Regimen transition at very low flow ratesrates


Flow Rate through L1 and L3 with the LV and HV Pumps Transporting a 19ºAPI Crude Oil at Different Water-Cuts and
1440000
1450000
1460000
D)
Two Temperatures
1410000
1420000
1430000
1440000
ow R
ate
(BPD
1370000
1380000
1390000
1400000
nspo
rted
Flo
1340000
1350000
1360000
370000
Tran
Flow Rate (BPD) at 61ºC Flow Rate (BPD) at 50ºC
13300000 5 10 15 20 25 30 35
Water-Cut (%)

• 4 new double screw pump trains with 19.6º API
• Higher flow rate of about 1.48% to 6.19% with the screw gpumps for water cuts of 5% and 30%, respectively
• 4 new double screw pump trains with 16º API
It was estimated an increase in pumping capacity of
3
4e increase or
ps Capacity
)
Transport Capacity Comparison per Type of Pumping Equipment versus Water ‐Cuts (WC) for a 19 ºAPI Crude Oil Emulsion
capacity of approximately 13.28% with the d bl
‐1
0
1
2
5 % WC15 % WC
30 %WCange
(%), (Flow ra
teto th
e 4 Screw Pum
double screw pumps when the system is operated with 16º API
d 4 LV l ‐6
‐5
‐4
‐3
‐2 30 % WC
ansport C
apacity
Cha
ecrease with
respe
ct
and 4 LV pumps only.‐7
Tra
de
4 Low Volume Pumps (ideal or theoretical)
4 Low Volume Pumps (real with degradation)
4 Screw Pumps

V l d d d h f ld d • Volumetric pumps degradation was measured in the field and incorporated in the hydraulic model.
• High viscosity fluid affect significantly the performance, efficiency, High viscosity fluid affect significantly the performance, efficiency, and power consumption of the centrifugal pumps. The ANSI/HI 9.6.7-2004 provides a good methodology for correcting the performance curves within a 3 5% difference against measured performance curves within a 3-5% difference against measured data.
• Simulation cases allowed calculating the system curves and the current maximum capacity and the forecasted future flow condition with a heavier crude oil.
S t it l l t d ith th i ti t if l • System capacity calculated with the existing centrifugal pumps was compared against new screw pumps yielding a 6.19% and 13.24% increase in capacity for the 19º API and 16º API, respectively.
• The results obtained in this study provided good basics for supporting the selection of the new screw pump equipment.

The authors would like to thank PEMEX Exploration and Production The authors would like to thank PEMEX Exploration and Production f ll h l f h f ll h l f h for allowing us to present the results of this for allowing us to present the results of this project.project.
We We also are grateful to the also are grateful to the RebombeoRebombeo platform personnel that platform personnel that We We also are grateful to the also are grateful to the RebombeoRebombeo platform personnel that platform personnel that supported us during the performance testing and data collection supported us during the performance testing and data collection tasks of this project.tasks of this project.

Related Documents