2010 ISO/RTO Metrics Report 315 Southwest Power Pool (SPP)

Welcome message from author
This document is posted to help you gain knowledge. Please leave a comment to let me know what you think about it! Share it to your friends and learn new things together.
Transcript

2010 ISORTO Metrics Report 315
Southwest Power Pool (SPP)
deber16
Typewritten Text
Appendix I
2010 ISORTO Metrics Report 316
Section 7 ndash SPP Performance Metrics and Other Information
Southwest Power Pool Inc (SPP) is a regional transmission organization (RTO) that coordinates the movement of
electricity in a nine state region ndash Arkansas Kansas Louisiana Mississippi Missouri Nebraska New Mexico
Oklahoma and Texas
Services provided by SPP include
Compliance - The SPP Regional Entity enforces compliance with federal and regional reliability standards
for users owners and operators of the regions bulk power grid
Market Operations - In the Energy Imbalance Service (EIS) market (implemented February 1 2007)
participants buy and sell wholesale electricity in real-time If a utility requires more energy than it scheduled
the market provides the utility another option to buy the extra energy at real-time prices to make up the
difference and meet its demand Participants can use the EIS market to get the least expensive available
energy from other utilities SPPs 2009 wholesale market transactions totaled $114 billion SPP is currently
planning for future energy markets
Regional Scheduling - SPP ensures that the amount of power sent is coordinated and matched with power
received
Reliability Coordination - SPP monitors power flow throughout our footprint and coordinates regional
response in emergency situations or blackouts
Tariff Administration - SPP provides one stop shopping for use of the regions transmission lines and
independently administers an Open Access Transmission Tariff with consistent rates and terms SPPs 2009
transmission market transactions totaled $486 million
Training - SPP offers continuing education for operations personnel at SPP and throughout the region In
2009 the SPP training program awarded ~17000 continuing education hours to 444 operators from 30
member organizations
Transmission Expansion Planning - SPPs planning processes seek to identify system limitations
develop transmission upgrade plans and track project progress to ensure timely completion of system
reinforcements
Contract Services - SPP provides reliability tariff administration and scheduling for non-members on a
contract basis
Southwest Power Pool dates to 1941 when 11 regional power companies joined to keep an Arkansas aluminum
factory powered around the clock to meet critical defense needs After the war SPPs Executive Committee decided
the organization should be retained to maintain electric reliability and coordination
SPP incorporated as an Arkansas not-profit organization in January 1994 The Federal Energy Regulatory
Commission (FERC) approved SPP as a Regional Transmission Organization in 2004 and a Regional Entity in 2007
2010 ISORTO Metrics Report 317
A SPP Bulk Power System Reliability
As of December 31 2009 SPP has not had any investigations or self-reports or audit findings result in violations of
NERC or ERO standards that are public However SPP may have potential violations under review arising from
circumstances prior to January 1 2010
The table below identifies which NERC Functional Model registrations SPP has submitted as effective as of the end
of 2009 Additional the Regional Entity for SPP is noted at the end of the table with a link to the website for the
specific reliability standards
NERC Functional Model Registration SPP
Balancing Authority
Interchange Authority
Planning Authority
Reliability Coordinator
Resource Planner
Transmission Operator
Transmission Planner
Transmission Service Provider
Regional Entity SPP
Standards that have been approved by the NERC Board of Trustees are available at
httpwwwnerccompagephpcid=2|20
Additional standards approved by the SPP Board are available at
httpwwwspporgsectionasppageID=98
2010 ISORTO Metrics Report 318
Dispatch Operations
SPP CPS-1 Compliance 2005-2009
80
100
120
140
160
180
200
2005 2006 2007 2008 2009
Compliance with CPS-1 requires at least 100 throughout a 12-month period SPP was in compliance with CPS-1
for each of the calendar years from 2005 through 2009
SPP CPS-2 Compliance 2005-2009
80
85
90
95
100
2005 2006 2007 2008 2009
Compliance with CPS-2 requires 90 for each month in a 12 month period SPP was in compliance with CPS-2 for
each of the calendar years from 2005 to 2009
2010 ISORTO Metrics Report 319
SPP Transmission Load Relief or Unscheduled Flow Relief Events 2005-2009
0
200
400
600
800
1000
1200
1400
1600
1800
2000
2005 2006 2007 2008 2009
SPP data reflects number of Transmission Load Relief (TLR) events SPPrsquos TLR events were comprised of primarily
level 3 and 4 TLRs with 2 5 4 6 and 5 of level 5 TLRs in 2005 through 2009 respectively The increase in
SPP TLRs reflects an aspect of the Energy Imbalance Services (EIS) Market design One of the objectives of the
EIS Market is to utilize the existing transmission system by providing the most economical energy through the Tariffrsquos
Schedule 4 Energy Imbalance Service The Market System Scheduling amp Pricing Dispatch engine increases flow on
flowgate interfaces by dispatching more efficient resources up and reducing others down The SPP Tariff and Market
protocols currently require SPP issue a TLR in parallel with congestion management in the Market System Loading
flowgate interfaces provides more economical energy however when the loading approaches the constraint
operating limitation a TLR must be issued regardless if schedulestagsexternal are in IDC impact the constraint
being controlled The increase in TLRs is a direct correlation to having issued TLR in order to begin the process of
having the Market System redispatch around a constraint
SPP Energy Market System Availability 2005-2009 (1)
80
85
90
95
100
2005 2006 2007 2008 2009
Availability of the Energy Management System (EMS) is key to reliable monitoring of the electric transmission system
in SPP Since the implementation of the Energy Imbalance Service market in February 2007 the SPP EMS has been
unavailable less than 05 of all hours in each year
2010 ISORTO Metrics Report 320
Load Forecast Accuracy
ISORTO Load Forecasting Accuracy
Reference Point
SPP 600 am prior day
SPP Average Load Forecasting Accuracy 2005-2009 (1)
80
85
90
95
100
2005 2006 2007 2008 2009
For
ecas
t Acc
urac
y
0
1
2
3
4
5
Mea
n A
bsol
ute
Per
cent
age
Err
or
Forecasting Accuracy Mean Absolute Percentage Error
(1) SPP began operation of an Energy Imbalance Service market on February 1 2007
SPP Peak Load Forecasting Accuracy 2005-2009 (1)
80
85
90
95
100
2005 2006 2007 2008 2009
For
ecas
t Acc
urac
y
0
1
2
3
4
5
Mea
n A
bsol
ute
Per
cent
age
Err
or
Forecasting Accuracy Mean Absolute Percentage Error
(1) SPP began operation of an Energy Imbalance Service market on February 1 2007
2010 ISORTO Metrics Report 321
SPP Valley Load Forecasting Accuracy 2005-2009 (1)
80
85
90
95
100
2005 2006 2007 2008 2009
For
ecas
t Acc
urac
y
0
1
2
3
4
5
Mea
n A
bsol
ute
Per
cent
age
Err
or
Forecasting Accuracy Mean Absolute Percentage Error
(1) SPP began operation of an Energy Imbalance Service market on February 1 2007
As stated in the introduction since SPP does not currently have a day-ahead market the prior dayrsquos medium term
load forecast (MTLF) is used as the load forecast accuracy reference point Since SPP does not have a consolidated
Balancing Authority a forecast is calculated for each of the SPP BAs (15 at the end of 2009) Overall the average
load forecasting accuracy for SPP has been right around 97 for each of the past three years that data is available
Peak and valley forecasts see slightly higher error which can be attributed to the number of forecasts that are
required due to having multiple BAs
2010 ISORTO Metrics Report 322
Wind Forecasting Accuracy
SPP does not forecast wind That function is completed by each Balancing Authority in the SPP Region
During 2010 SPP is developing a system for RTO-wide wind forecasts
Unscheduled Flows
Since SPP does not have a consolidated Balancing Authority and is currently (end of 2009) made up of 15 distinct
Balancing Authorities volume of unscheduled flows for SPP system-wide is unavailable For informational purposes
the number of external interfaces and the main interfaces are listed above
2010 ISORTO Metrics Report 323
Transmission Outage Coordination
The SPP OATT does not outline specific timeframes and guidelines for Transmission Outages and Coordination
The OATT states that ―the Transmission Provider will provide the projected status of transmission outage schedules
above 230 kV over the next twelve (12) months or more if available This data shall be updated no less than once
daily for the full posting horizon and more often as required by system conditions The data will include current
accurate and complete transmission facility maintenance schedules including the ―outage date and ―return date of
a transmission facility from a scheduled or forced outage If the status of a particular transmission facility operating at
voltages less than 230 kV is critical to the determination of TTC and ATCAFC of the neighboring transmission
provider the status of this facility will also be provided and ―consistent with the SPP Membership Agreement
Transmission Owners are required to coordinate with the Transmission Provider for all planned maintenance of Tariff
Facilities The Transmission Provider shall notify a Transmission Owner of the need to change previously reviewed
planned maintenance outages
SPP Percentage of gt 200kV planned outages of 5 days or more that are submitted to ISORTO at least 1
month prior to the outage commencement date 2005-2009
0
20
40
60
80
100
2005 2006 2007 2008 2009
SPP Percentage of planned outages studied in the respective ISORTO TariffManual established timeframes 2005-2009
SPP does not have established timeframes in which planned outages must be studied
Percentage of gt 200 kV outages cancelled by ISORTO after having been previously approved 2005-2009
Data for this metric is not available for SPP
2010 ISORTO Metrics Report 324
SPP Percentage of unplanned gt 200kV outages 2005-2009
0
5
10
15
20
25
30
2005 2006 2007 2008 2009
In the 2009 Annual State of the Market Report the SPP Market Monitoring Unit indicated that ―SPP should move to
standardize categories accounting for transmission outages which would allow for the easy reporting of extent
causes and location of such outages At a minimum this type of reporting alleviates concerns of market power
abuses and can enhance SPPrsquos transmission planning and real-time operations This recommendation has been
adopted and its implementation is part of the 2010 Southwest Power Pool Strategic Plan which was adopted by the
SPP Board of Directors on July 27 2010
2010 ISORTO Metrics Report 325
Transmission Planning
SPP Number of Transmission Projects Approved to be Constructed for Reliability Purposes 2005-2009
0
50
100
150
200
250
300
350
400
2005 2006 2007 2008 2009
SPP Percentage of Approved Construction Projects Completed by December 31 2009
0
20
40
60
80
100
SPP
2005 2006 2007 2008 2009
SPPrsquos transmission planning process was a bottom-up top-down approach enabling SPP to provide efficient
reliable and competitive generation market Transmission Services on a non-discriminatory basis The SPP planning
processes took into account its stakeholderrsquos requirements while coordinating with applicable federal state and local
regulatory authorities and also considering potential public policy The SPP Transmission Expansion Plan (STEP)
promotes the efficient expansion of the transmission system under SPPrsquos control and enables competitive generation
markets The STEP identifies potential expansion projects needed to meet reliability standards and to interconnect
2010 ISORTO Metrics Report 326
new generation with consideration for load growth competitive generation market stakeholder input and
transmission service commitments In addition the STEP considers plans for addressing transmission congestion
and the benefits associated with development of new generation as alternatives to transmission expansion
Reliability Planning
As part of the bottom-up approach one component of the STEP is the reliability assessment This process requires
that Transmission Owners continue to develop expansion plans to meet the local needs of their systems and to help
the RTO develop the expansion plan for reliability needs Transmission Owners develop their system specific local
plans which SPP consolidates into the integrated STEP At the same time SPP assesses its system for the ability
to meet applicable reliability standards This process allows for projects with regional and inter-regional impact to be
analyzed for their combined effects It allows the exploration of modifications and alternatives to proposed plans
which may provide more cost effective solutions for regional and as well as local needs
Economic Planning
As part of SPPrsquos top-down approach transmission improvements are considered that provide economic benefit One
specific process is called the Balanced Portfolio The Balanced Portfolio is one SPP strategic initiative to develop a
cohesive grouping of economic upgrades that benefit the SPP region and allocates the cost of those upgrades
regionally Projects in the Balanced Portfolio include transmission upgrades of 345 kV projects that will provide
customers with potential savings that exceed project costs These economic upgrades are intended to reduce
congestion on the SPP transmission system resulting in savings in generation production costs With a goal to
identify upgrades for inclusion in a portfolio that will provide a balanced benefit to customers over a specified ten-year
payback period ―Balanced is defined by the SPP Regional Tariff such that for each Zone the sum of the benefits
of the potential Balanced Portfolio must equal or exceed the sum of the costs Economic upgrades may provide
other benefits to the power grid ie increasing reliability and lowering reserve margins deferring reliability upgrades
and providing environmental benefits due to more efficient operation of assets and greater utilization of renewable
resources
Another example of an economic study is the Priority Projects study This was a one-time analysis conducted in 2009
as a result of the SPP Synergistic Planning Process Team recommendations and is considered a high priority
studies Study assumptions include fuel and emissions costs load and generation forecasts types and locations of
new generation generation retirements market structures and wind profiles Analysis also encompasses a
plausible collection of assumptions for each specific model run including varying levels of Renewable Electricity
Standards demand response energy efficiency fuel prices and governmental regulations Metrics were developed
for qualifying and quantifying the projects for the studies including Adjusted Production Cost impact on losses
reliability and environmental impacts capacity margins and operating reserves
Stakeholders
There are opportunities for stakeholder involvement throughout the SPP planning processes All planning processes
are open and transparent assessments of study assumptions upgrade recommendations and applicable cost
allocation impacts Its implementation is only successful through the commitment of SPP members regulators and
2010 ISORTO Metrics Report 327
other stakeholders Input from the regulators assists SPP in the development of realistic transmission expansion
projects and alternatives to meet rate payer needs as well as those of neighboring regions
Approval
After each analysis the SPP Board of Directors can approve proposed upgrades to begin construction For the
approved upgrades SPP issues Notification To Construct letters to incumbent Transmission Owners notifying them
to build the upgrades SPP then tracks the progress of the upgrades through a quarterly project tracking process
monitoring project schedules and costs and also tracking necessary mitigation plans if project construction schedules
are unable to meet system in-service needs
As part of the 2009 transmission planning efforts SPP completed the following studies reliability ndash AC contingency
dynamic stability and voltage stability studies economic ndash Balanced Portfolio and Priority Projects studies The
results of these studies can be found in the 2009 STEP report available at httpwwwspporgpublications2009-
STEP-Reportpdf
2010 ISORTO Metrics Report 328
Generation Interconnection
SPP Average Generation Interconnection Request Processing Time 2005-2009 (calendar days)
0
200
400
600
800
1000
2005 2006 2007 2008 2009
In 2009 SPP placed a higher emphasis on the timely processing of Generation Interconnection studies as
evidenced by a reduction of more than one-third the number of days required from 2008 to 2009
SPP Planned and Actual Reserve Margins 2005 ndash 2009
0
5
10
15
20
25
30
35
40
2005 2006 2007 2008 2009
Bars Represent Planned Reserve Margins Lines Represent Actual Reserves Procured
2010 ISORTO Metrics Report 329
Interconnection Transmission Service Requests
SPP Number of Study Requests 2005-2009
0
50
100
150
200
250
300
350
400
2005 2006 2007 2008 2009
SPP Number of Studies Completed 2005-2009
0
50
100
150
200
250
300
350
400
2005 2006 2007 2008 2009
2010 ISORTO Metrics Report 330
SPP Average Aging of Incomplete Studies 2005-2009 (calendar days)
0
100
200
300
400
500
600
700
800
2005 2006 2007 2008 2009
SPP Average Time to Complete Studies 2005-2009 (calendar days)
0
100
200
300
400
500
600
700
800
2005 2006 2007 2008 2009
The generation interconnection process includes three potential types of studies ndash feasibility studies system impact
studies and facility studies Feasibility studies assess the practicality and cost transmission system additions or
upgrades required to accommodate the interconnection of the generating unit or increased generating capacity with
the transmission system System impact studies provide refined and comprehensive estimates of cost responsibility
and construction lead times for new transmission facilities and system upgrades that would be required to allow the
new or increased generating capacity to be connected to the transmission system in SPP Facility studies develop
2010 ISORTO Metrics Report 331
the transmission facilities designs for any required transmission system additions or upgrades due to the
interconnection of the generating unit andor increased generating capacity
Average Cost of Each Type of Study
2005 2006 2007 2008 2009
Feasibility Studies $9264 $2491 $6495 $3270 $2888
System Impact Studies $11006 $16280 $17694 $14942 $14050
Facility Studies $10283 $7290 $12495 $16960 (Note 1)
2010 ISORTO Metrics Report 332
Note 1 ndash No facility studies were posted in 2009
From the SPP 2009 Annual State of the Market Report
The high demand for generation interconnection over the past several years placed an enormous amount of
stress on the generation interconnection process causing longer process times for requests and as a result
a backlog in the queue Other RTOs and ISOs also faced similar problems so much so that the FERC held
a technical conference on interconnection queuing practices on December 11 2007 in response to
concerns about the effectiveness of queue management Then following the technical conference on
March 20 2008 the FERC issued an order directing the RTOs and ISOs to work with their stakeholders to
improve their interconnection processes SPP formed the Generation Queuing Task Force (GQTF) to help
reform their process SPP then filed its proposed reform measures and the FERC issued an Order
conditionally accepting SPP‟s proposal thus allowing them to implement the changes (effective June 2
2009)
SPPs new generation interconnection process was designed to improve processing times and give
precedence to more serious projects that are further along in the development process To attain these
goals SPP now has three interconnection queues rather than just one That is interconnection customers
now choose to begin in one of three queues (a) the Feasibility Study Queue (b) the Preliminary
Interconnection System Impact Study (PISIS) Queue and (c) the Definitive Interconnection System Impact
Study (DISIS) Queue The Feasibility Queue and the PISIS Queue are not required for projects seeking
interconnection in SPP Instead they provide an avenue for projects to acquire information that will aid them
in deciding whether to move forward with their projects These two queues require lower deposits and less
strict milestones The DISIS Queue on the other hand is required by SPP and requires that the customers
meet stricter milestones regarding project size project location project site and in some cases a buyer for
the power that would be generated The fact that the DISIS Queue requires strict milestones to be met
discourages projects that are more speculative in nature from clogging the queue and allows those further
along to have priority Once a customer passes through the DISIS Queue the next step is to complete a
Facility Study This study consists of SPP or the Transmission Owner specifying and estimating the cost of
equipment engineering and construction to implement the interconnection Upon completion of the Facility
Study an applicant may proceed to execute a Generation Interconnection Agreement
We believe the reform measures implemented by SPP are constructive because they address the
recommendation from last year regarding the generation interconnection process Specifically in the 2008
State of the Market Report Boston Pacific stated ―We recommend that instead of using a ―first come first
served method SPP should allow advanced projects ndash projects that (a) have already secured a buyer for
output or (b) have met certain milestones ndash to move past projects that are not as far along25hellipat the end
of 2009 313 projects were currently active in the process or had executed an interconnection agreement
representing 60768 MW of capacity This is a significant amount of capacity To put this number in
perspective the peak demand in SPP in 2009 was only 46482 MW Of all the projects in the queue 16744
MW of capacity have fully executed an interconnection agreement Historically as would be expected not
2010 ISORTO Metrics Report 333
all of the capacity that enters the interconnection process ends up being built Going forward we would
expect that the capacity that is most likely to be withdrawn is that in the Feasibility Study Queue and the
PISIS Queue as these queues are not required for interconnection and the requirements are less stringent
than that of the DISIS Queuehellip 33301 MW are in the Feasibility Study and PISIS Queues
Special Protection Schemes
SPP Number of Special Protection Schemes 2009
5
0
10
20
30
40
50
60
70
80
90
100
The SPSs in the SPP Region represent four long-term schemes and one temporary scheme A Special Protection
Systems (SPS) or Remedial Action Scheme (RAS) is designed to detect abnormal system conditions and take
automatic pre-planned coordinated corrective action (other than the isolation of faulted elements) to provide
acceptable system performance SPS actions include among others changes in demand (eg load shedding)
generation or system configuration to maintain system stability acceptable voltages or acceptable facility loadings
All reviews of facilities shall be for those used to monitor and control transmission facilities operated at 100kV or
above
There were no misoperations of SPSs in 2009 in SPP
2010 ISORTO Metrics Report 334
B SPP Coordinated Wholesale Power Markets
The table below shows the split of the nearly $17 billion that was invoiced by SPP in 2009
(dollars in millions) 2009 Dollars Billed
Percentage of 2009
Dollars Billed
Energy Imbalance Market $1144 675
Transmission $486 287 SPP Admin Fee $64 38
Total $1694 1000
2010 ISORTO Metrics Report 335
MMaarrkkeett CCoommppeettiittiivveenneessss
SPP New Entrant Gas-Fired Combustion Turbine (CT) Net Generation Revenues 2005-2009
$0
$50000
$100000
$150000
2005 2006 2007 2008 2009
SPP New Entrant Gas-Fired Combined Cycle (CC) Net Generation Revenues 2005-2009
$0
$50000
$100000
$150000
2005 2006 2007 2008 2009
Net revenues in 2009 were not adequate to cover the fixed costs of either a combined cycle or a combustion turbine
power plant in SPP Net Revenue has dropped by about half from 2008 in large part because of the lower electricity
prices making the margins tighter when the plants were run So while a combined cycle would still have run around
55 it no longer covered 60 of the fixed cost as it did in 2008 but rather less than 30
2010 ISORTO Metrics Report 336
From the SPP 2009 State of the Market Report
In addition to testing revenue adequacy using SPP-wide hourly prices we also wanted test
whether prices in certain areas of SPP might be high enough to justify investment To test this
possibility a Net Revenue calculation for two of the balancing authorities with the highest prices
was calculated as those balancing authorities are most likely to show the need for new plants
hellip we conclude that the net revenue even in these areas was not adequate to cover the fixed
costs of either a combined cycle or a combustion turbine power plant
SPP Real-Time Energy Market Percentage of Unit Hours Offer Capped due to Mitigation 2005-2009
0
1
2
3
4
5
2005 2006 2007 2008 2009
From the SPP 2009 State of the Market Report
Locational Imbalance Prices in SPP are calculated using among other things Market Participant offer
curves Because these offers are a major driver of prices there is a potential concern with market power
through submission of higher than appropriate offer prices The FERC refers to this as Economic
Withholding To mitigate this SPP has in place two different FERC-approved offer caps These caps do not
put a cap on prices but rather limit how high of an offer a Market Participant can submit
The offer cap that we term the ―FERC Cap is a hard offer cap What we mean by this is it (a) is set at a
constant level (b) applies to all resources and (c) applies at all times The FERC Cap is considered to be a
―safety net against extreme cases of economic withholding For the first three months of the EIS Market
the FERC Cap was set at $400MWh Since May 2007 the FERC Cap has been increased to $1000MWh
The cap was set at a tighter level for the first three months of market operation because of the uncertainty
surrounding the start of the market
2010 ISORTO Metrics Report 337
SPP‟s other offer cap is termed the ―SPP Cap Unlike the FERC Cap the level of this cap (a) is resource
specific and (b) varies depending upon market conditions The SPP Cap is designed to balance mitigation
and reliability that is it limits price spikes resulting from market power but at the same time is set at a
level high enough not to discourage new investment
The following three characteristics of the SPP Cap illustrate how this is accomplished First the SPP Cap is
levied only during times of transmission congestion because absent congestion the SPP Market is
structurally competitive Second it is only imposed on those resources that have the potential to wield
market power that is it applies only to resources with a Generator to Load Distribution Factor (GLDF) of
negative 5 or larger (more negative) and on other resources with negative GLDFs owned by that same
company Third the SPP Cap is set at a level that will not discourage new investment The SPP Cap
reflects the total annual fixed and variable costs of a new peaking power plant with the fixed costs spread
over the hours of congestion Therefore the more hours of congestion the tighter the cap becomes
In addition Market Competitiveness as measured by the Herfindahl-Hirschmann Index (HHI) is discussed in the
2009 Annual State of the Market Report
The Herfindahl-Hirschman Index (HHI) is a measure of competitiveness closely related to market shares
Some background on the HHI standard is useful The US Department of Justice has a three-part standard
for HHIs when judging the competitive effect of mergers and acquisitions An HHI at or under 1000 is a
bdquosafe harbor‟ of sorts because the market is said to be unconcentrated If after a merger or acquisition the
HHI is at or below 1000 it is generally thought that there is no competitive harm from the merger or
acquisition that is the merger or acquisition does not make the exercise of market power more likely An
HHI between 1000 and 1800 is said to indicate moderate concentration An HHI over 1800 is said to
indicate a highly concentrated market The FERC uses these same standards when it assesses mergers
and acquisitions However for market-based rate authority the FERC uses a threshold of 2500 for the HHI
in one of its standards
The HHIshellip ranged from 1106 in December to 1604 in March The peak capacity HHI for the year in total
was 1292 lower than that in 2008 (1411) All of these HHI statistics fall within the moderately concentrated
range with the peak for year falling at the lower end of this range
The SPP Annual State of Market Report can be accessed at httpwwwspporgpublicationsSPP-2009-
ASOM-Reportpdf
2010 ISORTO Metrics Report 338
MMaarrkkeett PPrriicciinngg
SPP Average Annual Load-Weighted Wholesale Energy Prices 2005-2009 (1) ($megawatt-hour)
$2749
$0
$10
$20
$30
$40
$50
$60
$70
$80
$90
$100
2005 2006 2007 2008 2009
(1) SPP began operation of an Energy Imbalance Service market on February 1 2007
The SPP average load-weighted energy prices from 2007 ndash 2009 varied due in most part to variances in fuel costs
The chart on the following page from the US Energy Information Administration is a visual representation of the fuel
cost inputs from 2005 ndash 2009 that influenced the energy prices in SPP The consistency in the trends between the
preceding chart and several of the fuel cost trends on the chart on the following page are significant because they
illustrate the high correlation between wholesale energy prices and underlying fuel costs
2010 ISORTO Metrics Report 339
US Nominal Fuel Costs 2005-2009 ($ per million Btu)
$469
$221
$885
$1310
$0
$5
$10
$15
$20
$25
2005 2006 2007 2008 2009
Coal Natural Gas Residuel Fuel Oil Distillate Fuel Oil
Source US Energy Information Administration Independent Statistics and Analysis
2010 ISORTO Metrics Report 340
SPP Average Annual Load-Weighted Fuel-Adjusted Wholesale Spot Energy Prices 2005-2009
($megawatt-hour)
$4988
$0
$10
$20
$30
$40
$50
$60
$70
$80
$90
$100
2005 2006 2007 2008 2009
(1) SPP began operation of an Energy Imbalance Service market on February 1 2007
SPPrsquos base year for fuel-cost references is 2007 as the SPP EIS Market launched on February 1 2007
SPP Wholesale Power Cost Breakdown ($megawatt hour)
SPP only has a real-time energy imbalance service market
2010 ISORTO Metrics Report 341
UUnnccoonnssttrraaiinneedd EEnneerrggyy PPoorrttiioonn ooff SSyysstteemm MMaarrggiinnaall CCoosstt
SPP Annual Average Non-Weighted Unconstrained Energy Portion of the System Marginal Cost 2005-2009 (1)
$0
$10
$20
$30
$40
$50
$60
$70
$80
$90
$100
2005 2006 2007 2008 2009
(1) SPP began operation of an Energy Imbalance Service market on February 1 2007
The unconstrained energy portion of system marginal cost is the marginal price of maintaining balance in the
economic dispatch ignoring transmission limitations This trend chart shows the annual average marginal price of
energy across SPP over all hours The trend closely follows the trend of aggregate fuel prices from 2005 through
2009 which illustrates the fact that marginal energy price fluctuations are primarily driven by fuel prices
2010 ISORTO Metrics Report 342
EEnneerrggyy MMaarrkkeett PPrriiccee CCoonnvveerrggeennccee
Data on price convergence in this section does not include SPP as SPP does not operate a day-ahead energy
market
CCoonnggeessttiioonn MMaannaaggeemmeenntt
SPP does not operate a congestion hedging market
RReessoouurrcceess
SPP Annual Generator Availability 2005 ndash 2009
9510
80
85
90
95
100
2005 2006 2007 2008 2009
Since the implementation of the Energy Imbalance Service market in February 2007 SPP generator availability
continues to be strong More in-depth tracking of generator availability is expected to be implemented in late
2010early 2011 as part of the recently approved SPP Strategic Plan
2010 ISORTO Metrics Report 343
FFuueell DDiivveerrssiittyy
SPP Fuel Diversity 2005-2009
Installed Capacity
0
10
20
30
40
50
60
70
80
90
100
2005 2006 2007 2008 2009
Generation Output
0
10
20
30
40
50
60
70
80
90
100
2005 2006 2007 2008 2009
Coal Gas Nuclear Oil
Hydro and Renewables GasOil Combined Cycle Other
Installed generation capacity in SPP is approximately 40 coal 45 gas 7 nuclear 5 wind and less than 5
from all other fuel sources Actual generation from baseload units (generally coal or nuclear) totals just over 72
with gas accounting for 23 and approximately 5 for other sources of fuel
2010 ISORTO Metrics Report 344
Demand Response
SPP Demand Response Capacity as Percentage of Total Installed Capacity 2005-2009
153
0
2
4
6
8
10
12
2005 2006 2007 2008 2009
SPP Demand Response as a Percentage of Synchronized Reserve Market 2005-2009
SPP does not operate a synchronized reserve market
2010 ISORTO Metrics Report 345
RReenneewwaabbllee RReessoouurrcceess
SPP Renewable Megawatt Hours as a Percentage of Total Energy 2005-2009
0
5
10
15
20
2005 2006 2007 2008 2009
SPP Hydroelectric Megawatt Hours as a Percentage of Total Energy 2005-2009
0
5
10
15
20
2005 2006 2007 2008 2009
2010 ISORTO Metrics Report 346
SPP Renewable Megawatts as a Percentage of Total Capacity 2005-2009
0
5
10
15
20
2005 2006 2007 2008 2009
SPP Hydroelectric Megawatts as a Percentage of Total Capacity 2005-2009
0
5
10
15
20
2005 2006 2007 2008 2009
Energy capacity and production from renewable sources has been growing in SPP over the last several years
especially in wind renewables Wind capacity has more than doubled since the implementation of the EIS market in
February 2007 growing from 1515 MW to 3313 MW of nameplate capacity at the end of 2009
2010 ISORTO Metrics Report 347
C SPP Organizational Effectiveness
AAddmmiinniissttrraattiivvee CCoossttss
SPP Annual Actual Costs as a Percentage of Budgeted Costs 2005-2009
Non-Capital Costs
70
80
90
100
110
120
130
140
2005 2006 2007 2008 2009
Capital Cost Recovery
70
80
90
100
110
120
130
140
2005 2006 2007 2008 2009
Budget $44 $46 $53 $61 $56 Budget $7 $7 $12 $15 $12
Bars Represent of Actual Costs to Approved Budgets Dollar Amounts Represent Approved Budgets (in millions)
SPP is a strong proponent of stakeholder involvement in the establishment and monitoring of its operating and capital
budgets and the monitoring of its financial affairs This level of involvement dates back to the start as a tight power
pool and continues through today as a member-driven Regional Transmission Organization
SPPrsquos annual budget process culminates with the presentation of the budget to the Board of Directors Providing
some background the SPP Board of Directors meets and acts in public open sessions for all items except personnel
issues and legal issues Additionally the SPP Board of Directors always meets in the presence of the Members
Committee which is comprised of 15 representatives from SPPrsquos membership Finally prior to all votes the
Members Committee is asked to indicate their position on each issue through a non-binding straw vote This vote
provides the Board with direct insights as to the positions of the membership on any issue
The chair of the SPP Finance Committee presents the budget to the SPP Board of Directors in open session at the
Boardrsquos October meeting Following the presentation of the budget the Board of Directors solicits comments
regarding the budget from all in attendance (even those who are not members of SPP have the ability to share their
position on the budget) Following the dialogue and assuming there is a motion to approve the budget and a second
of that motion the Board will ask the Members Committee representatives to vote through a show of hands either
―yes ―no or ―abstain Then the Board members will enter their votes (the votes of the individual board members
are via secret ballot and not shared individually)
SPPrsquos budget has a long history prior to arriving at the SPP Board of Directors for action The budget starts
informally at the grassroots of the organization through the work of numerous stakeholder groups that define the
products and services they desire SPP to perform Major changes to SPPrsquos products and services and business
2010 ISORTO Metrics Report 348
practices are approved at the Markets and Operations Policy Committee (―MOPC) The MOPC is a full
representation committee comprised of one representative from each member of SPP The MOPC meets in open
session and reports directly to the SPP Board of Directors
Coincident with the grassroots efforts of SPPrsquos Working Groups and MOPC SPPrsquos Strategic Planning Committee
meets to determine the strategic direction of SPP The Strategic Planning Committee is comprised of three members
of the SPP Board of Directors and eight representatives from SPPrsquos membership The Strategic Planning
Committee meets in open session and reports directly to the SPP Board of Directors
SPP staff compiles the directions from the MOPC Strategic Planning Committee Board of Directors and other
groups to determine the direction of the company during the next fiscal year and the two years beyond SPP staff
determines the resources required to meet the goals of the organization and ultimately prepares a budget designed
to meet those needs This budget is formally presented to the SPP Finance Committee The SPP Finance
Committee is comprised of two members of the SPP Board of Directors and four representatives from the SPP
membership The Finance Committee meets in open sessions and actively seeks input from the stakeholder
representatives on the Committee as well as from other interested parties The Finance Committee diligently reviews
the budget proposed by staff to ensure the resources identified are consistent with the goals and objectives of the
organization and also are prudent and just Once satisfied that the budget meets the needs of the organization the
Finance Committee presents the budget to the SPP Board of Directors for approval
2010 ISORTO Metrics Report 349
SPP Annual Administrative Charges per Megawatt Hour of Load Served 2005-2009 ($megawatt-hour)
$019
$000
$010
$020
$030
$040
$050
$060
$070
$080
$090
$100
2005 2006 2007 2008 2009
The administrative costs per MWhr of load served data in the chart above should be reviewed in the context of the
SPP annual load served as noted in the table below
ISORTO 2009 Annual Load Served
(in terawatt hours)
SPP 324
2010 ISORTO Metrics Report 350
CCuussttoommeerr SSaattiissffaaccttiioonn
SPP Percentage of Satisfied Members 2005-2009
90
0
20
40
60
80
100
2005 2006 2007 2008 2009
SPPrsquos 2009 stakeholder satisfaction survey was an open-ended survey asking for comments on areas of satisfaction
dissatisfaction and general comments No numeric or scoring data was collected
The percentage of satisfied members remains strong in SPP The lowest year for member satisfaction was 2007
which was the year the Energy Imbalance Market was launched As can be expected with a new market coming
online there were many questions and concerns mostly due to the unknown Most significantly however the
satisfaction percentage increased from 84 in 2007 to 90 in 2008 once everyone had experience in the new
market
2010 ISORTO Metrics Report 351
BBiilllliinngg CCoonnttrroollss
ISORTO 2005 2006 2007 2008 2009
SPP
Qualification for
One Control
Objective in SAS
70 Type 1 Audit
Qualification for
Six Control
Objectives in
SAS 70 Type 2
Audit
Qualification for
Six Control
Objectives in
SAS 70 Type 2
Audit
Qualification for
Two Control
Objectives in
SAS 70 Type 2
Audit
Qualification for
Two Control
Objectives in
SAS 70 Type 2
Audit
SPP billing controls have continued to evolve While qualifications have continued to occur improvement over time
has been incremental and the severity of the exceptions leading to qualified opinions has decreased Most
importantly while qualifications have continued there has been no negative settlement or financial impacts to SPPrsquos
members and customers Corrective actions have been undertaken to produce future unqualified opinions
2010 ISORTO Metrics Report 352
D Southwest Power Pool Specific Initiatives
Part of SPPrsquos Value Proposition is being a relationship-based and member-driven organization Over 500
stakeholders are involved in SPPrsquos organizational structure of committees working groups and task forces This
member involvement drives SPPrsquos decisions related to strategic vision budget transmission expansion markets
and other corporate initiatives In the last few years SPP and its members have also worked closely with state
regulators to successfully implement several innovative cost allocation initiatives Because SPP works to gain
consensus from its members and regulators the organization has few protests on its filings From 2006 to mid-2010
for 1154 filings there were only 74 protests and 1 hearing
Regional State Committee Completion of Responsibilities
The SPP Regional State Committee (RSC) provides collective state regulatory agency input on matters of regional
importance related to the development and operation of bulk electric transmission The SPP RSC is comprised of
retail regulatory commissioners from agencies in Arkansas Kansas Missouri Nebraska New Mexico Oklahoma
and Texas In 2004 the RSC adopted a transmission expansion cost allocation proposal commonly referred to as
―Base Plan Fundingrdquo under which 33 of reliability upgrade costs would be allocated regionally Following the
adoption of Base Plan Funding the RSC shifted its focus to cost allocation for economic upgrades with a goal of
promoting investment in transmission facilities that could reduce congestion and result in lower-cost wholesale
electric supply to load-serving entities and ultimately end-use customers and in 2008 advanced the concept that
permit one or more entities to bear a portion or all costs of building a transmission facility called a ―Sponsored
Upgrade in exchange for transmission credits for othersrsquo use of that facility and incrementally focusing on an
approach to developing a portfolio of economic upgrades called the ―Balanced Portfolio
Most recently the RSC adopted the ―HighwayByway cost allocation methodology a methodology which assigns
costs of 300 kV+ ―highway upgrades 100 regionally Costs of ―byway upgrades above 100 kV and below 300 kV
are assigned 33 regionally and 67 zonally ―Byway upgrades below 100 kV are allocated zonally
With the exception of one Regional State Committee member voting ―no on the HighwayByway cost allocation
methodology the other cost allocation proposals were approved unanimously
Progress on Strategic Goals
SPPrsquos Strategic Planning Committee determines the strategic direction of SPP The Committee comprised of three
independent Board members and eight representatives from SPPrsquos membership meets in open session to develop
strategic plans and to continually evaluate the progress of the organization in meeting those plans Working with
stakeholders and the Regional State Committee the organization has accomplished many strategic goals
In 2005 the Board of Directors approved a strategic plan that included six primary areas of focus including markets
development transmission expansion administrative processes retention and addition of participants enhanced
regional planning and long-range planning SPP has made significant progress toward these goals The Energy
Imbalance Service market was implemented in February 2007 and development is underway for the next phases of
market development In 2006 a refocus on certain areas and a desire to engage in a longer-term planning horizon
2010 ISORTO Metrics Report 353
yielded additional focus areas including providing service on contract basis to increase revenue further membership
in SPP and enhance the quality of existing services and an effort to organize as a Regional Entity under the Electric
Reliability Organization (ERO) to perform the delegated responsibilities related to the compliance enforcement and
development of mandatory reliability standards
In 2010 the Committee established a strategic direction for SPP to position it to fulfill its mission statement over the
next decade and beyond The plan creates three foundational strategies building a robust transmission system
developing efficient market processes and creating member value
Member Involvement in Budget Approval
SPP is a strong proponent of stakeholder involvement in the establishment and monitoring of its operating and capital
budgets and the monitoring of its financial affairs The budget starts informally at the grassroots of the organization
through the work of numerous stakeholder groups that define the products and services they desire SPP to perform
and culminates with the presentation of the budget to the Board of Directors Given this direction SPP staff develops
the resources required to meet the goals of the organization and ultimately prepares a budget designed to meet
those needs and formally presents it to the SPP Finance Committee The SPP Finance Committee is comprised of
two members of the SPP Board of Directors and four representatives from the SPP membership The Finance
Committee meets in open sessions and actively seeks input from the stakeholder representatives on the Committee
as well as from other interested parties The Finance Committee diligently reviews the budget proposed by staff to
ensure the resources identified are consistent with the goals and objectives of the organization and also are prudent
and just Once satisfied that the budget meets the needs of the organization the Finance Committee presents the
budget to the SPP Board of Directors for approval
Stakeholder Process in SPP
As noted above because SPP works to gain consensus from its members and regulators in the last 5 years SPP
has made over 1150 filings of which only 74 were protested and 1 went to the hearing phase and that was a ―paper
hearing
Year Filings by SPP SPP Filings that were protested SPP Filings that went to hearing
2006 167 (FERC only) 21 0
2007 176 (FERC only) 12 0
2008 258 14 0
2009 323 19 1
2010 230 (as of 723) 8 0
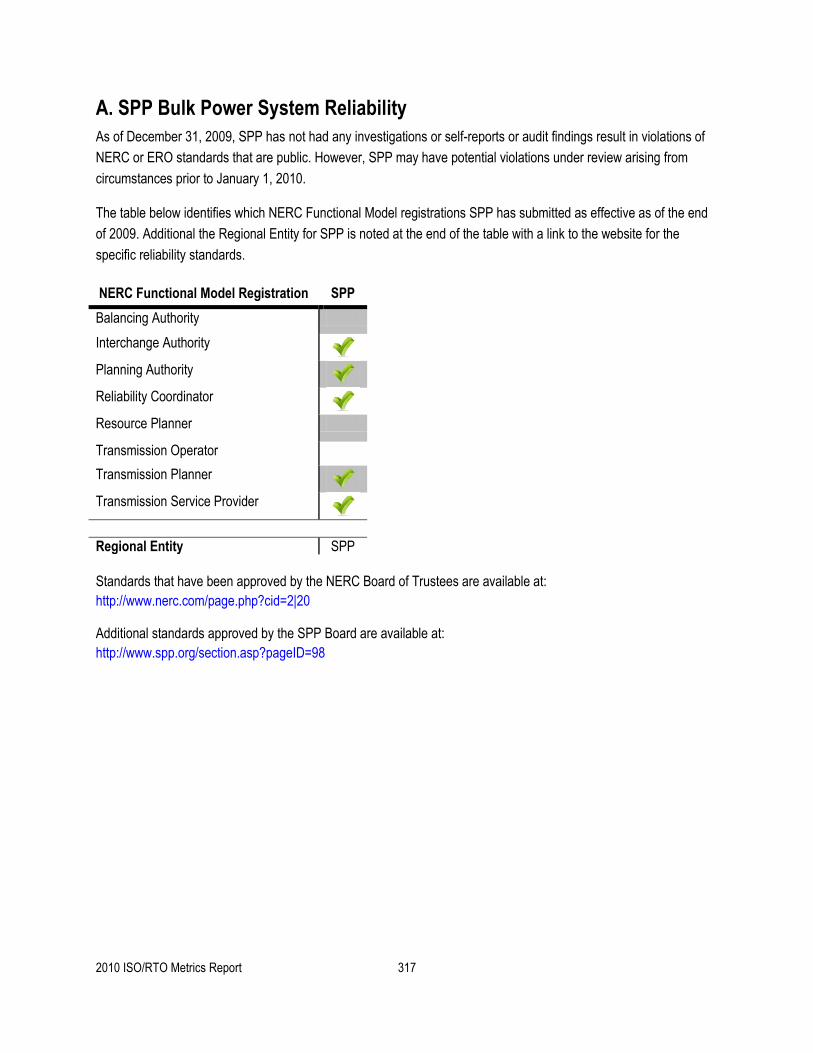
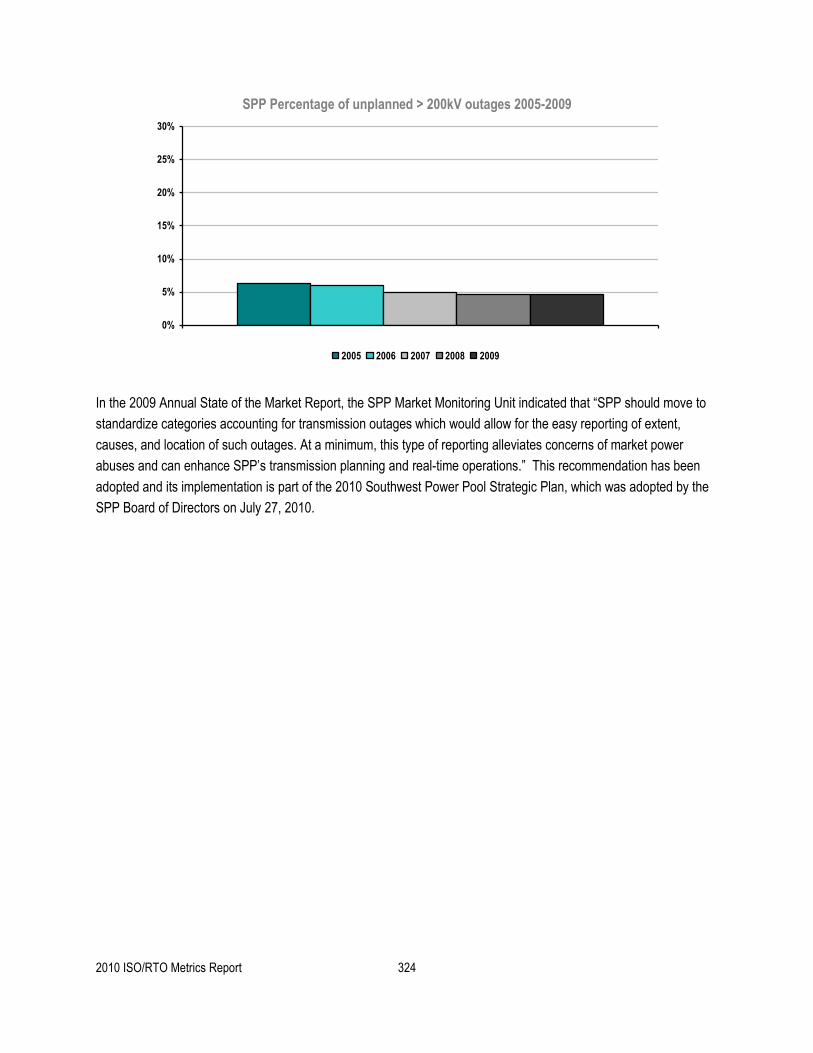
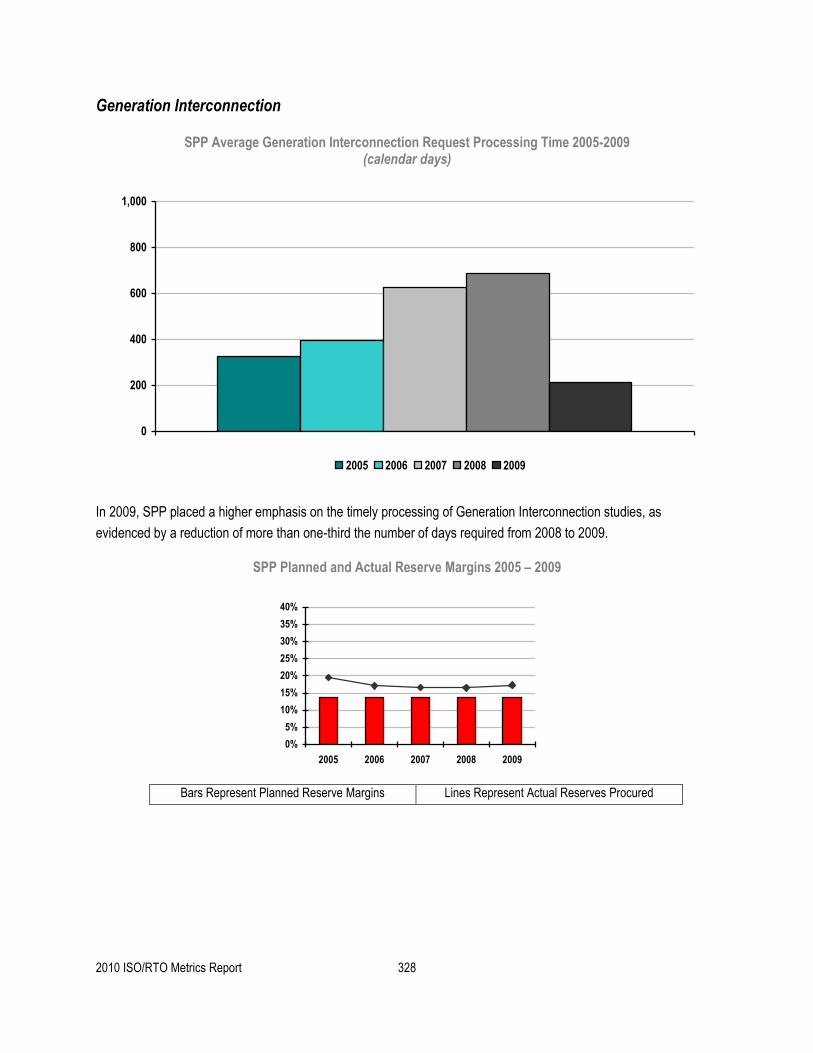
Related Documents