Southern California’s Economy 2012 … Finally Recovery Underway! Economics & Politics,

Southern California’s Economy
Jan 01, 2016
2012 … Finally Recovery Underway!. Southern California’s Economy. John Husing, Ph.D. Economics & Politics, Inc. After Losing 8.74 Million Jobs … U.S. Job Creation Is Crawling Back. 30% of Jobs Regained. Pattern of Likely Recovery. x. x. . U. V. So. California Job Growth/Destruction. - PowerPoint PPT Presentation
Welcome message from author
This document is posted to help you gain knowledge. Please leave a comment to let me know what you think about it! Share it to your friends and learn new things together.
Transcript
Southern California’s Economy
2012 … Finally Recovery Underway!
Economics & Politics, Inc.
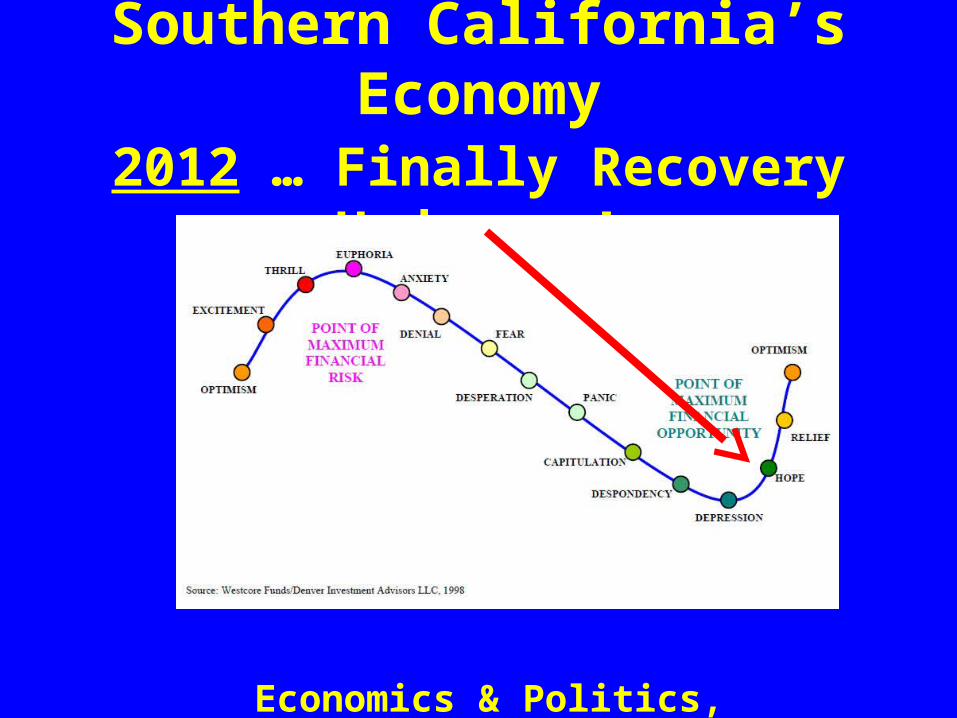
After Losing 8.74 Million Jobs …U.S. Job Creation Is Crawling Back
30% of Jobs Regained

VV Pattern of Likely Recovery
UUxx
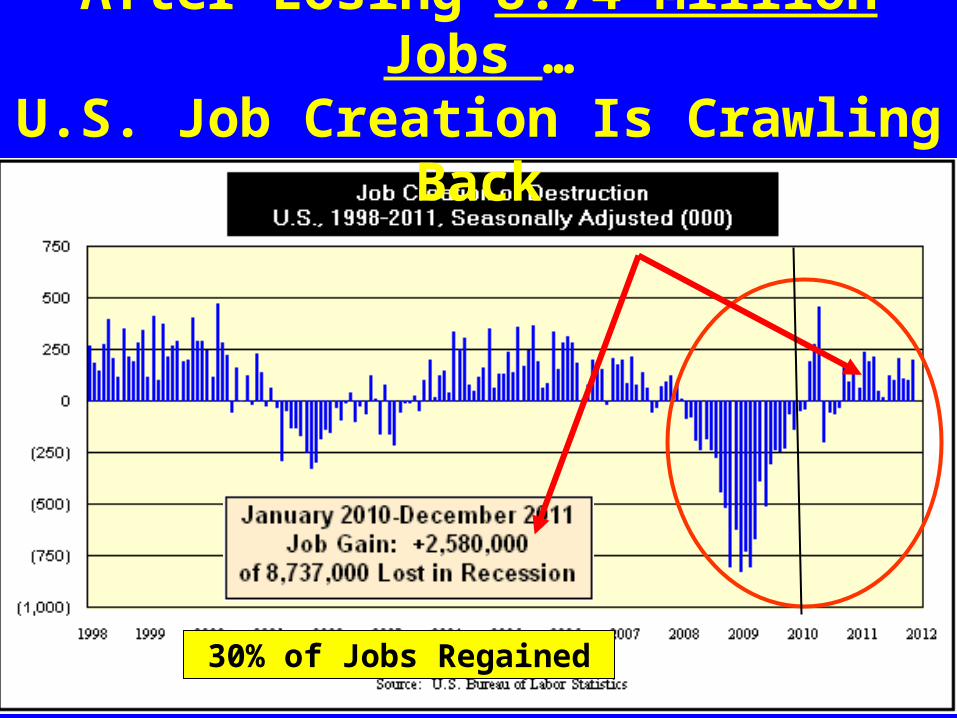
So. California Job Growth/Destruction
2007 2008 2009 2010 2011 2012
(700,000)(650,000)
(600,000)
(550,000)
(500,000)
(450,000)
(400,000)
(350,000)
(300,000)(250,000)
(200,000)
(150,000)
(100,000)
(50,000)
0
50,000
100,000
150,000
Source: CA Employment Development Department
Wage & Salary J ob Creation/DestructionInland Empire, 2007-2011
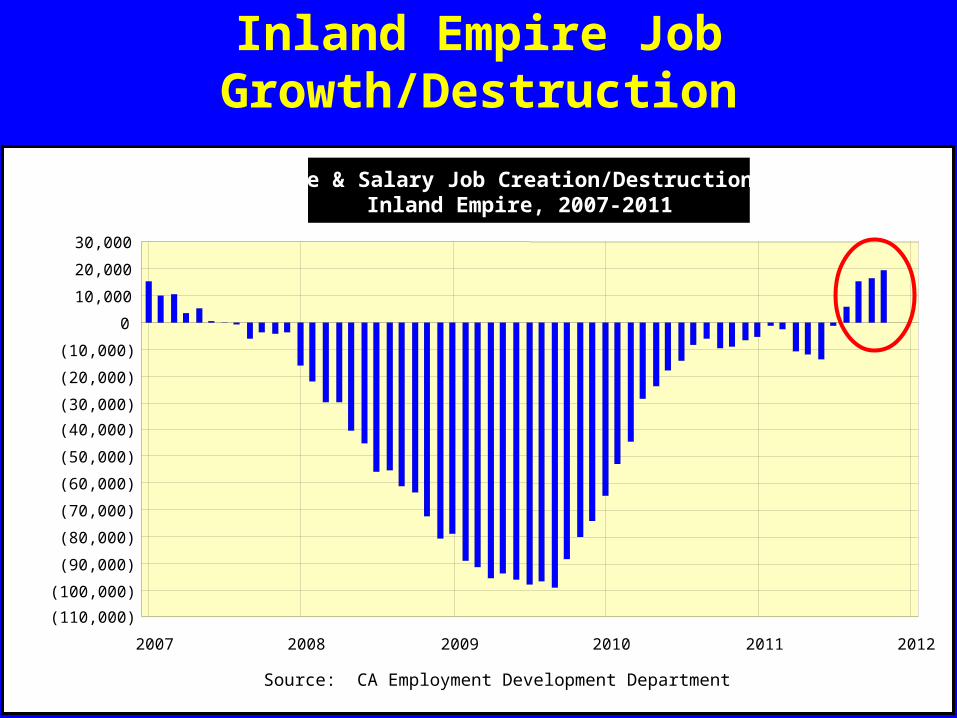
Inland Empire Job Growth/Destruction
2007 2008 2009 2010 2011 2012
(110,000)
(100,000)
(90,000)
(80,000)
(70,000)
(60,000)
(50,000)
(40,000)
(30,000)
(20,000)
(10,000)
0
10,000
20,000
30,000
Source: CA Employment Development Department
Wage & Salary Job Creation/DestructionInland Empire, 2007-2011
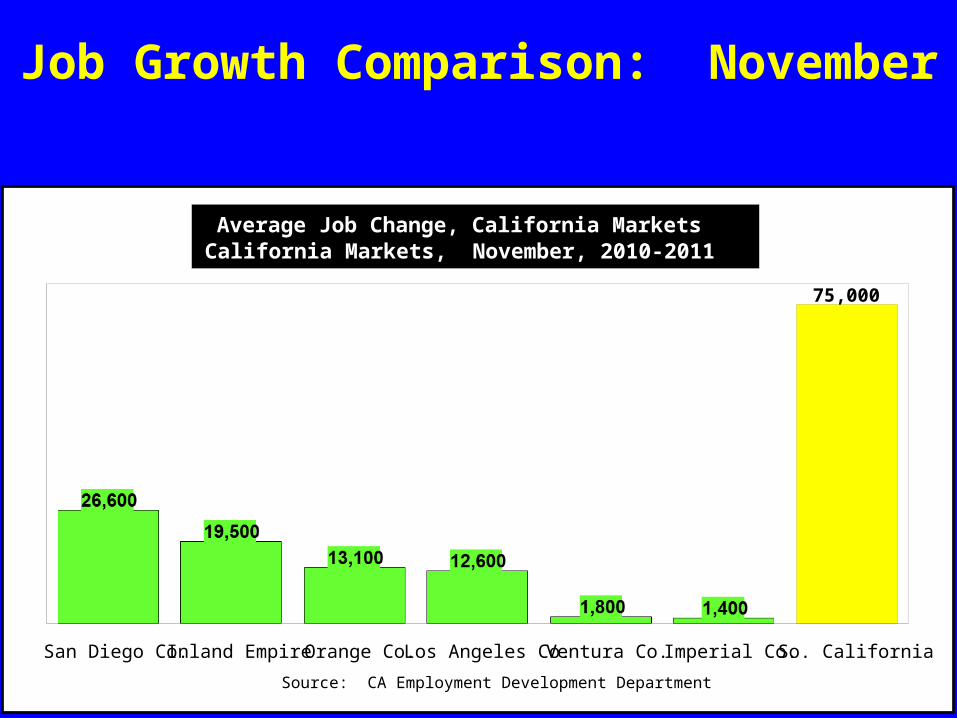
Job Growth Comparison: November
75,000
San Diego Co.Inland EmpireOrange Co.Los Angeles Co.Ventura Co. Imperial Co.So. California
Source: CA Employment Development Department
Average Job Change, California MarketsCalifornia Markets, November, 2010-2011

Still Tough Unemployment Rate
U.S. Unadjusted
8.2%

There is Some Good News Locally
Industrial Vacancy Rate Declining Again!
Inland Empire 2.7% 11.9% 6.8%11.9% 6.8%
Orange Co. 5.4% 7.0%7.0% 5.3% 5.3%
L.A. Co. 2.1% 3.4%3.4% 3.1% 3.1%
San Diego 6.0% 12.0% 10.7%12.0% 10.7%
500,000 sq. ft. + Facilities … Inland Empire Vacancy = 0.0%
2005/2006 20092009 20112011
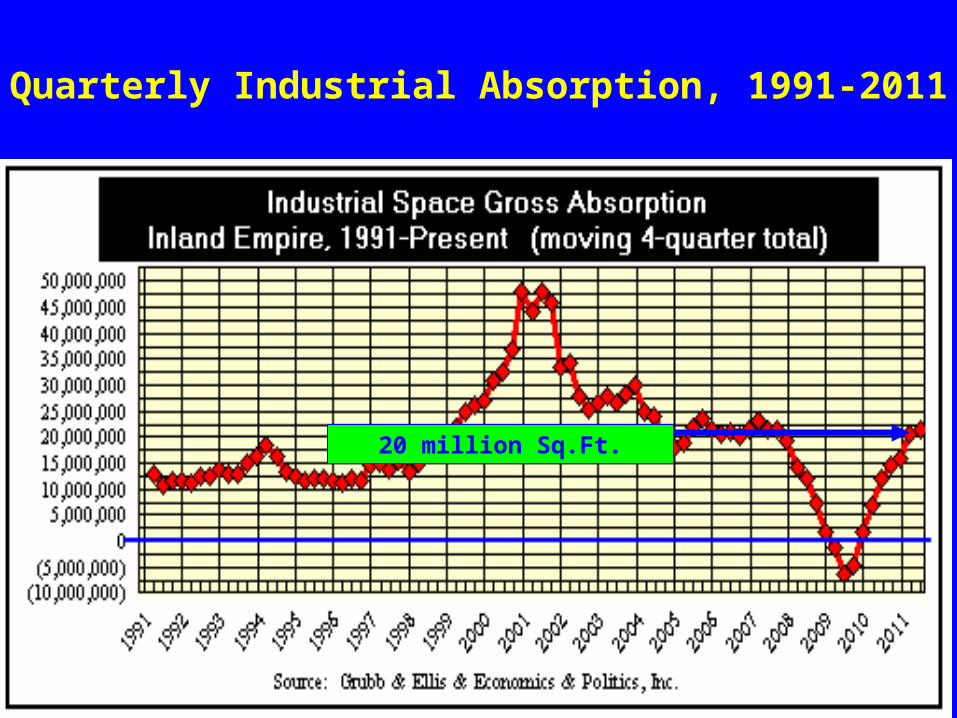
Quarterly Industrial Absorption, 1991-2011
20 million Sq.Ft.

Change In Container Flows
-25.4%
15.3%
1.6 1.6 1.6 1.7 1.82.1 2.3
2.73.1
2.83.1 3.3
4.8 5.0
5.76.0
6.87.2
8.2 8.0
7.2
6.0
6.9 6.9
2000 2001 2002 2003 2004 2005 2006 2007 2008 2009 2010 2011e
Import Export
Source: Port Import Export Reporting Service (PIERS), collected from Vessel
Imported & Exported Container Volume, 2000-2011ePorts of Los Angeles & Long Beach (mil. teus)
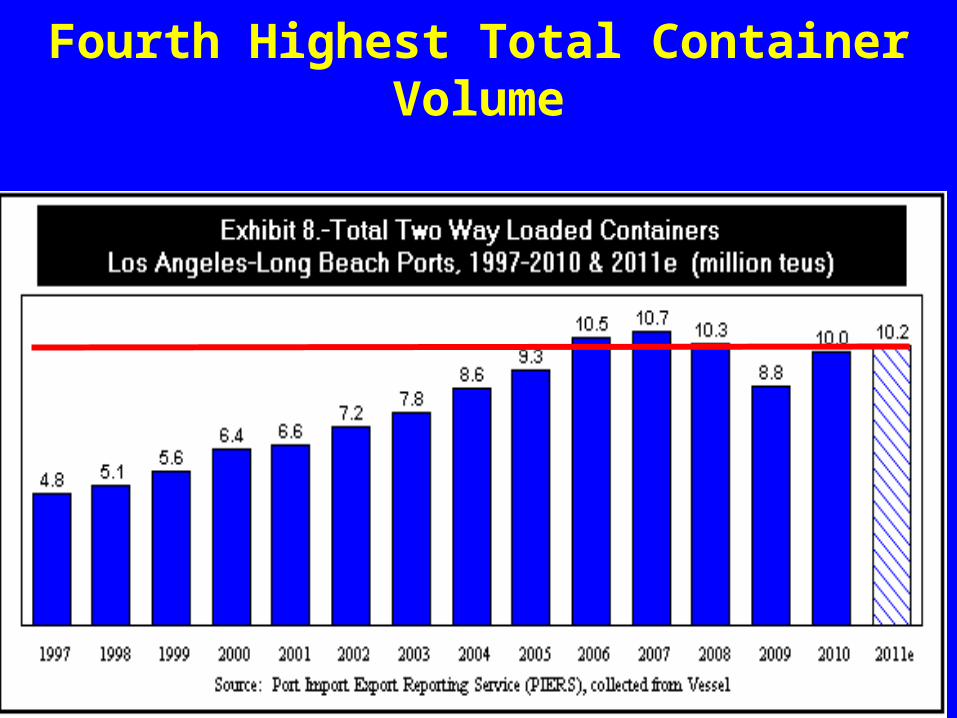
Fourth Highest Total Container Volume
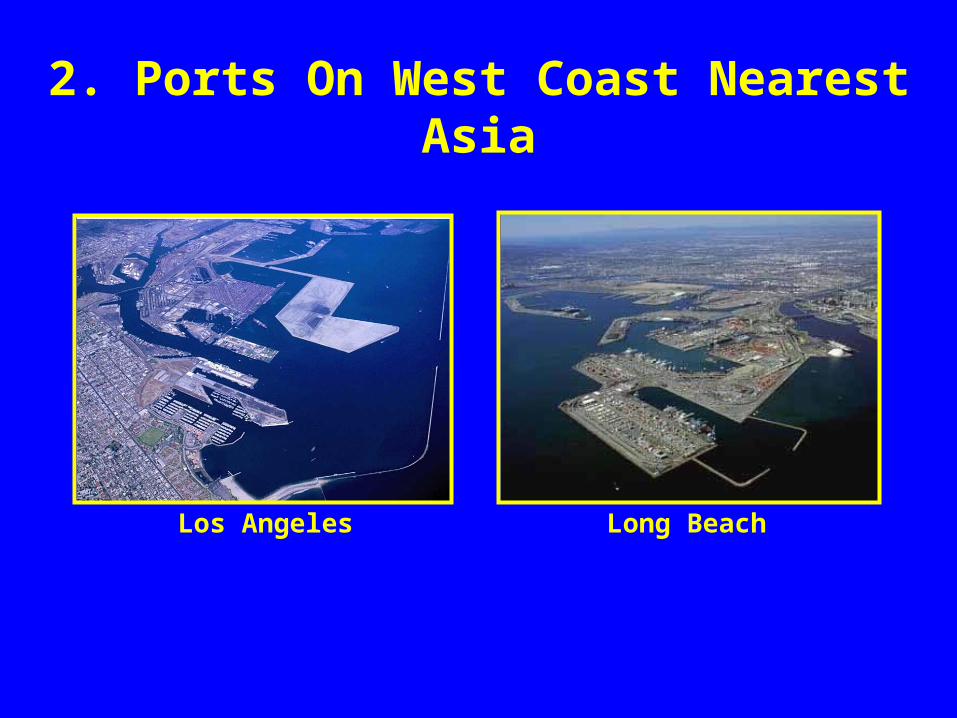
2. Ports On West Coast Nearest Asia
Los Angeles Long Beach
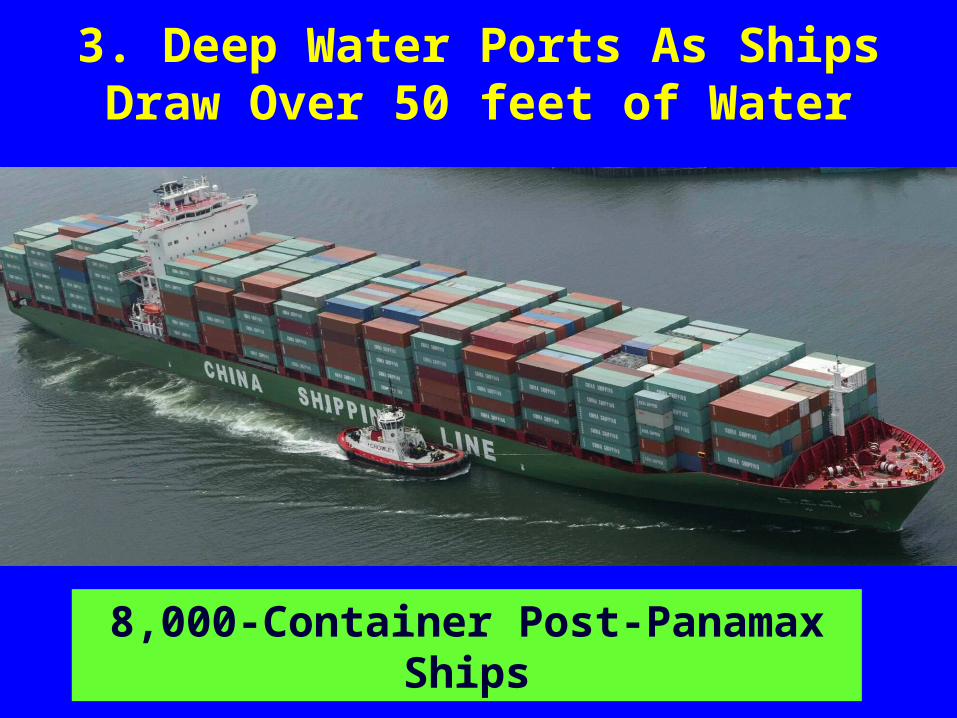
8,000-Container Post-Panamax Ships
3. Deep Water Ports As Ships Draw Over 50 feet of Water
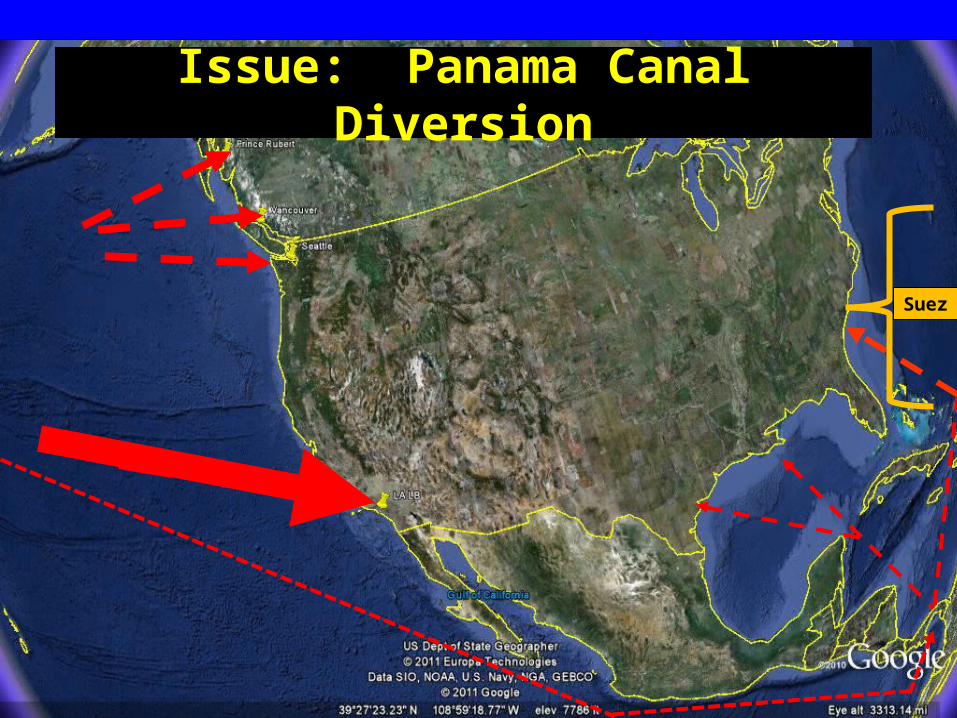
Issue: Panama Canal Diversion
Suez
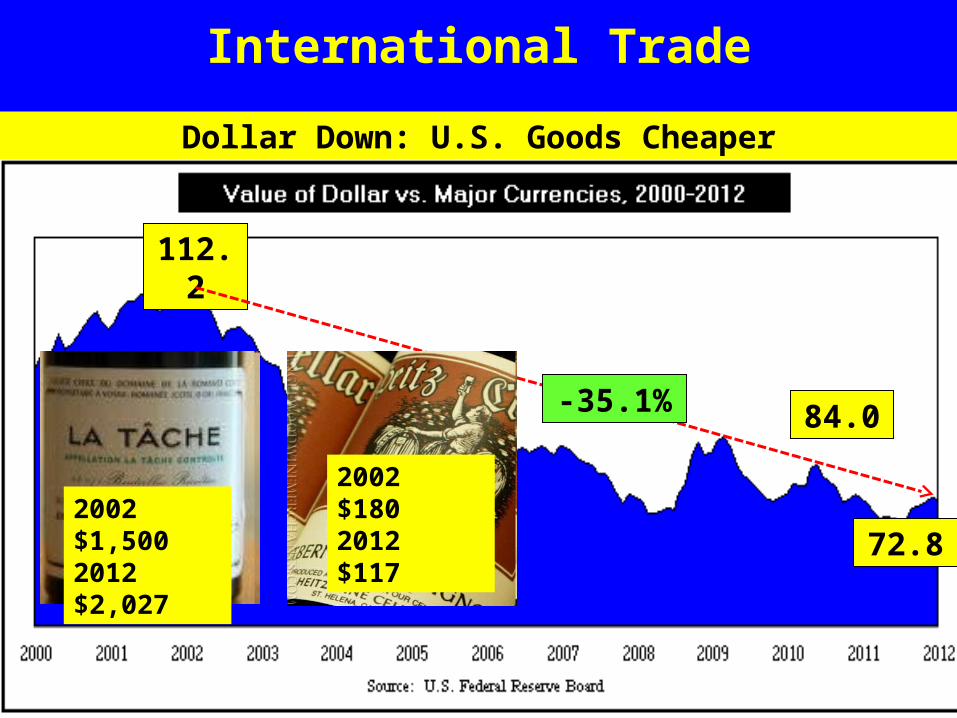
International Trade
112.2
84.0
72.8
-35.1%
Dollar Down: U.S. Goods Cheaper
2002 $1,5002012 $2,027
2002 $1802012 $117

Manufacturing
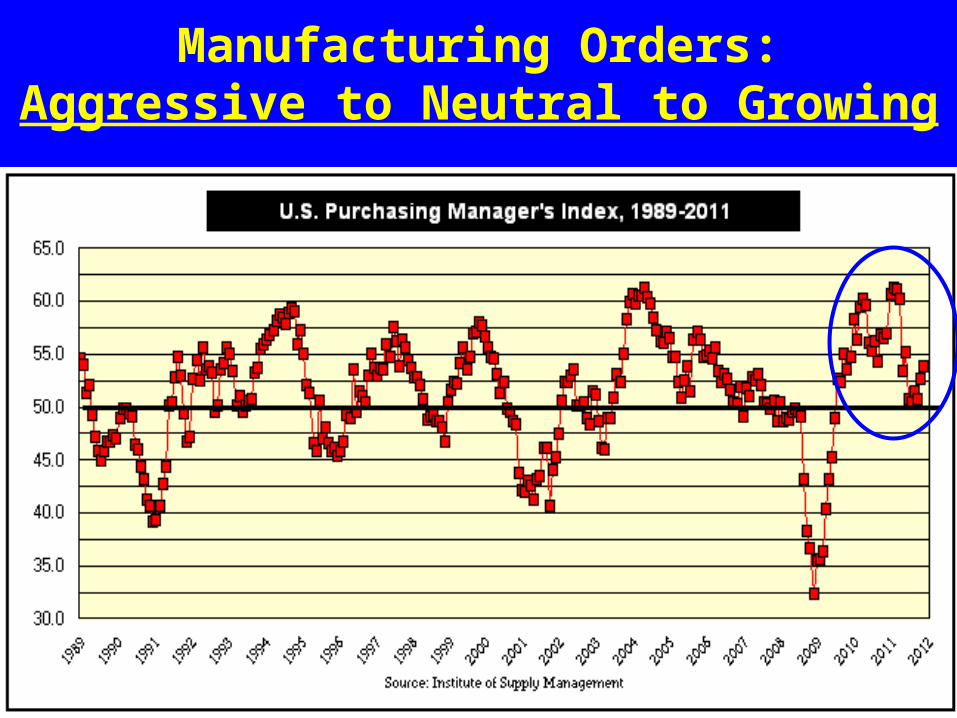
Manufacturing Orders:Aggressive to Neutral to Growing
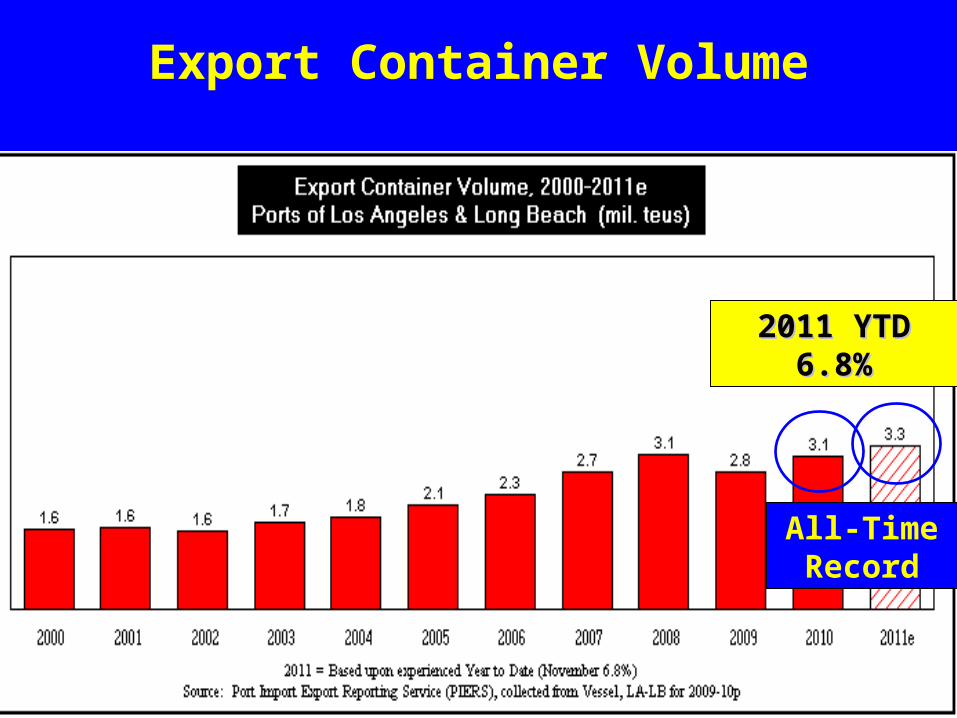
Export Container Volume
2011 YTD2011 YTD6.8%6.8%
All-Time Record
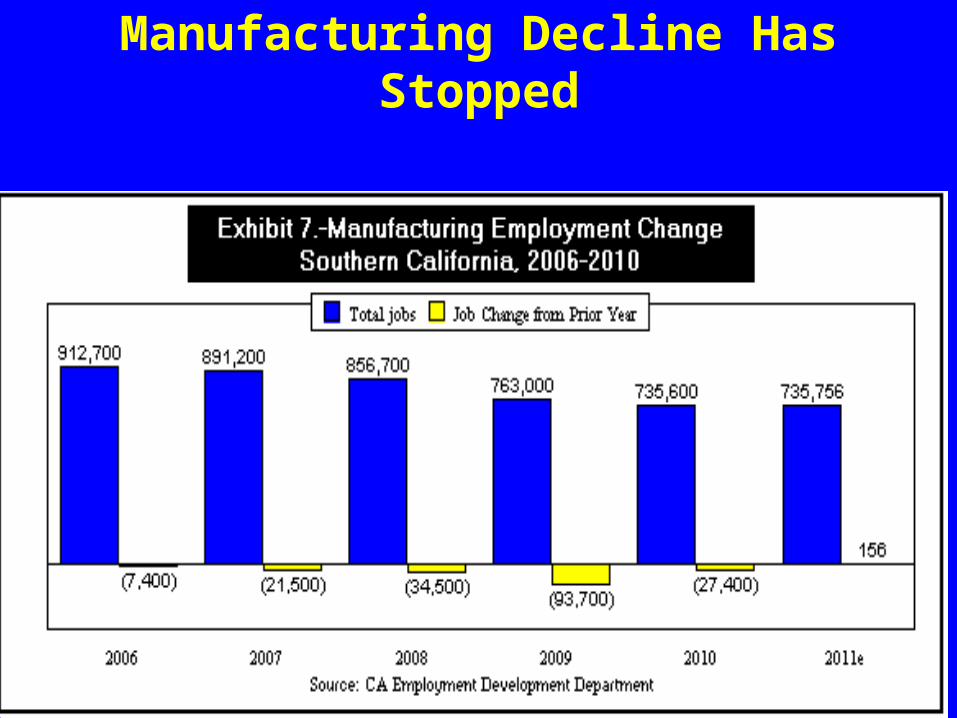
Manufacturing Decline Has Stopped
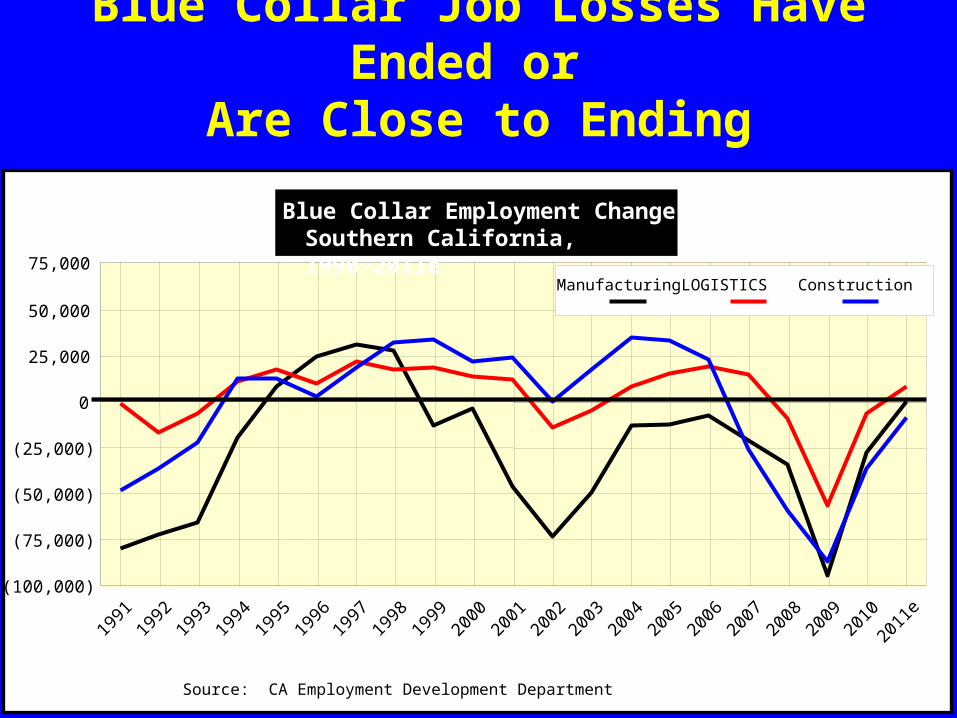
Blue Collar Job Losses Have Ended or Are Close to Ending
1991
1992
1993
1994
1995
1996
1997
1998
1999
2000
2001
2002
2003
2004
2005
2006
2007
2008
2009
2010
2011
e(100,000)
(75,000)
(50,000)
(25,000)
0
25,000
50,000
75,000 Manufacturing LOGISTICS Construction
Source: CA Employment Development Department
Blue Collar Employment ChangeSouthern California, 1990-
2011e
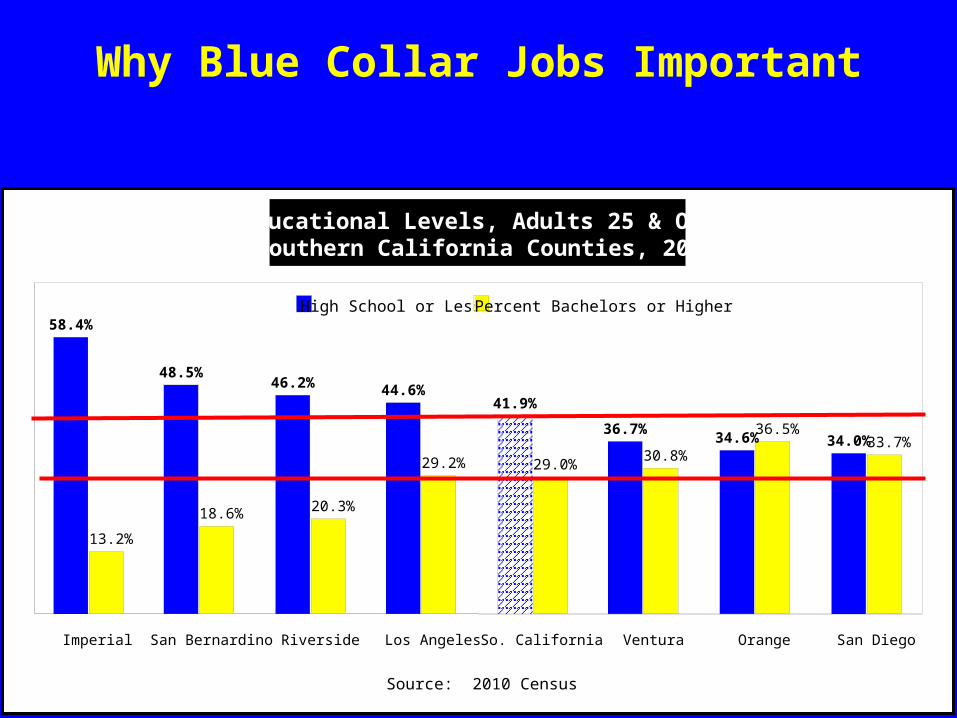
Why Blue Collar Jobs Important
13.2%
18.6% 20.3%
29.2% 29.0% 30.8%
36.5%33.7%
58.4%
48.5%46.2% 44.6%
41.9%
36.7%34.6% 34.0%
Imperial San Bernardino Riverside Los Angeles So. California Ventura Orange San Diego
High School or Less Percent Bachelors or Higher
Source: 2010 Census
Educational Levels, Adults 25 & OverSouthern California Counties, 2010
Policy Conflict:
Environment vs. Blue Collar Jobs
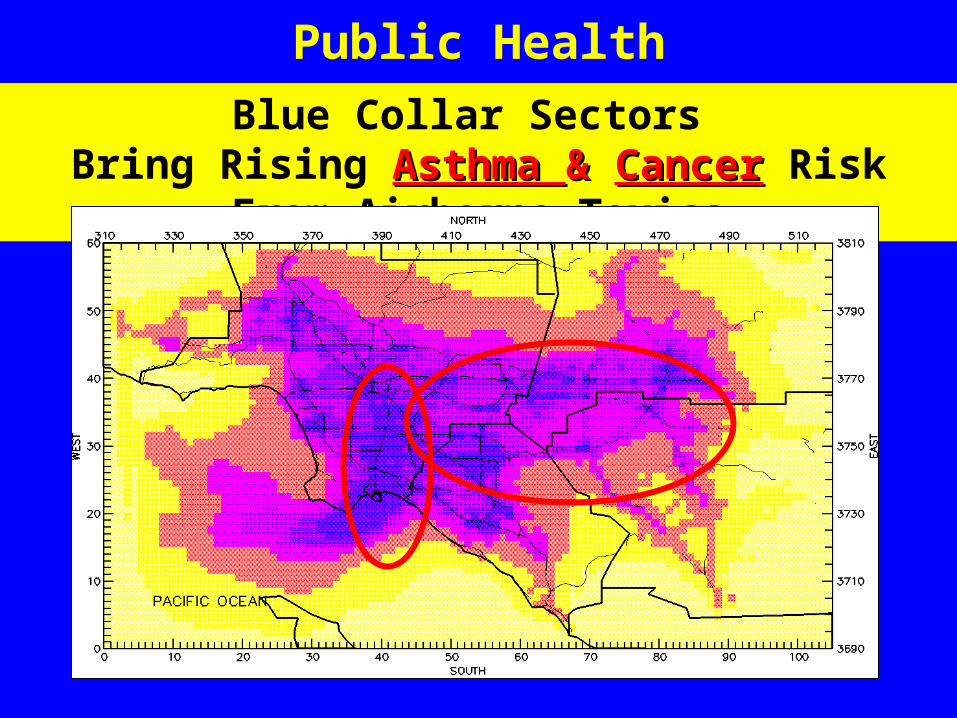
Public Health
Blue Collar Sectors Bring Rising Asthma Asthma & & CancerCancer Risk From Airborne Toxics
California Solution
Single Issue Regulatory Agencies & Processes
CA Air Resources Board
South Coast Air Quality Management District
CA Environmental Protection Agency
CA Water Resources Control Board
CEQA
& More
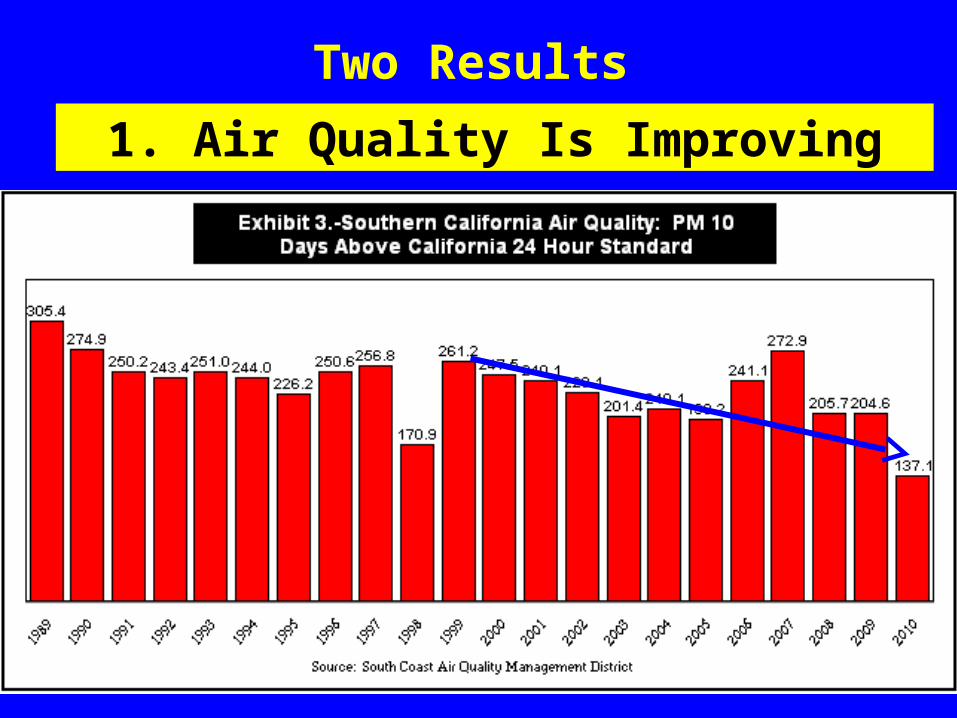
Two Results
1. Air Quality Is Improving
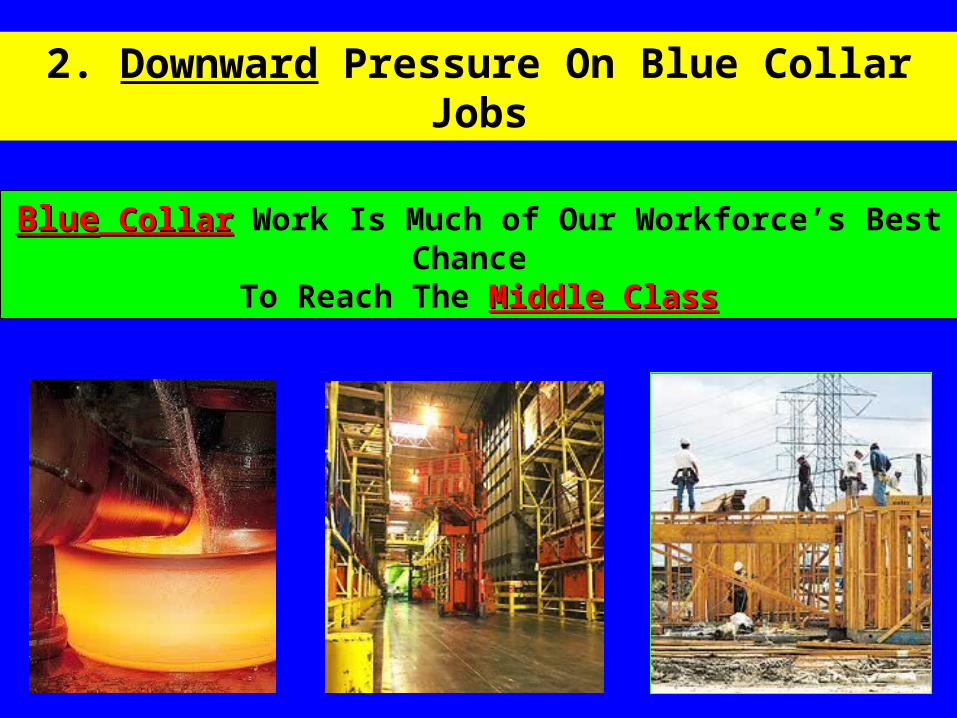
BlueBlue Collar Collar Work Is Much of Our Workforce’s Best Chance To Reach The Middle ClassMiddle Class
2. Downward Pressure On Blue Collar Jobs

Few Training BarriersFew Training Barriers To Beginning Employment
Mining ($65,268) Blue Collar
Wholesale Trade ($51,156) Blue Collar
Manufacturing ($47,933) Blue Collar
Logistics ($45,851) Blue Collar
Construction ($41,076) Blue Collar
Gaming ($37,827)
Retail Trade ($28,824)
Agriculture ($24,552)
Hotel/Motel ($16,026)
Eating & Drinking ($16,026)
Alternative Jobs to Blue Collar
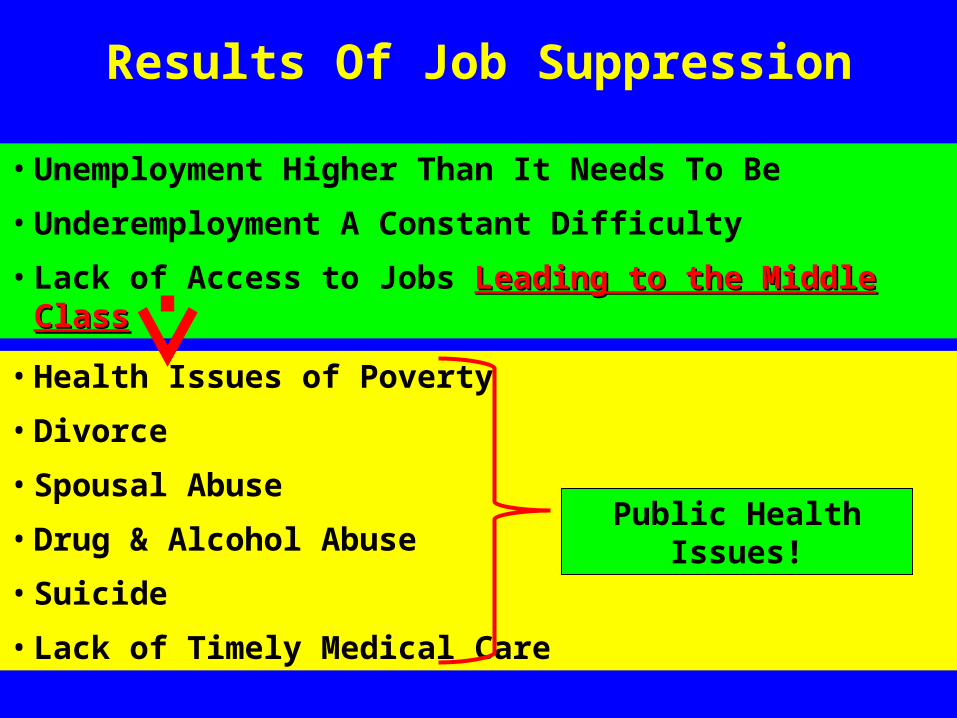
Results Of Job Suppression
• Unemployment Higher Than It Needs To Be
• Underemployment A Constant Difficulty
• Lack of Access to Jobs Leading to the Middle ClassLeading to the Middle Class
• Health Issues of Poverty
• Divorce
• Spousal Abuse
• Drug & Alcohol Abuse
• Suicide
• Lack of Timely Medical Care
Public Health Issues!
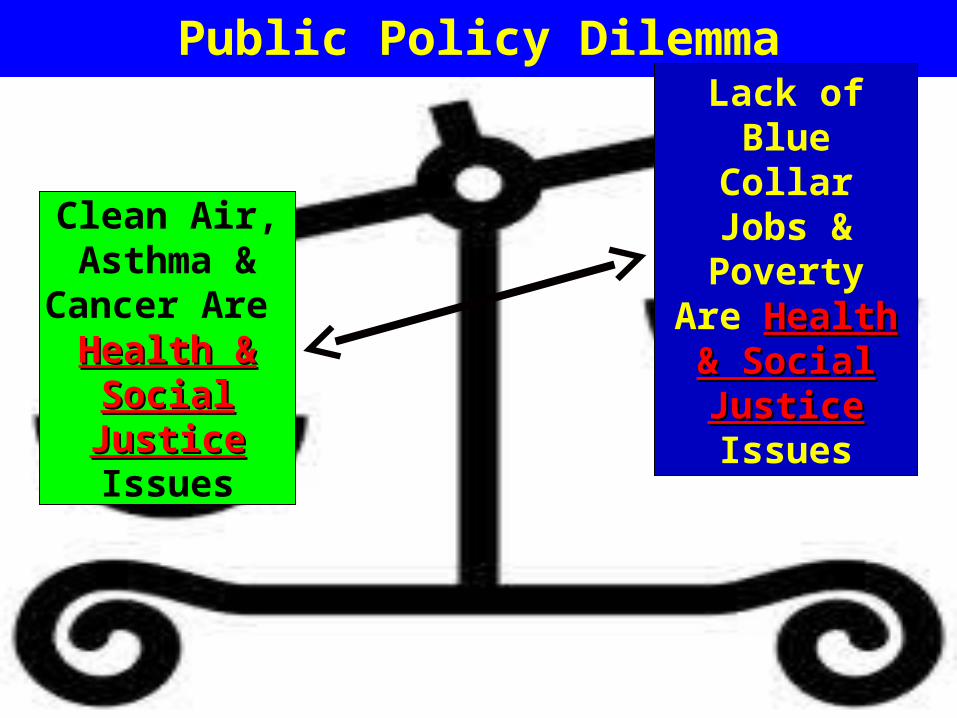
Clean Air, Asthma & Cancer
Are Health & SocialHealth & SocialJusticeJustice Issues
Lack of Blue Collar Jobs & Poverty Are
Health & SocialHealth & SocialJusticeJustice Issues
Public Policy Dilemma
After Years Of Focus on Concentrating Solely On The EnvironmentConcentrating Solely On The Environment
Blue Collar Job Creation Is Our Forgotten PriorityForgotten Priority!!
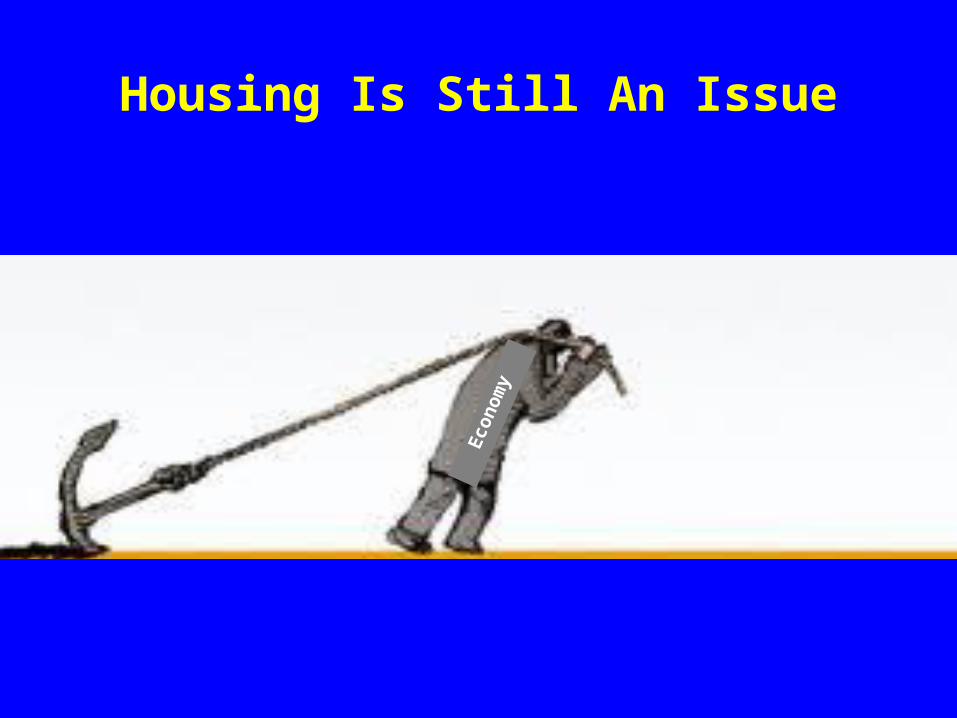
Housing Is Still An Issue
Eco
nom
y
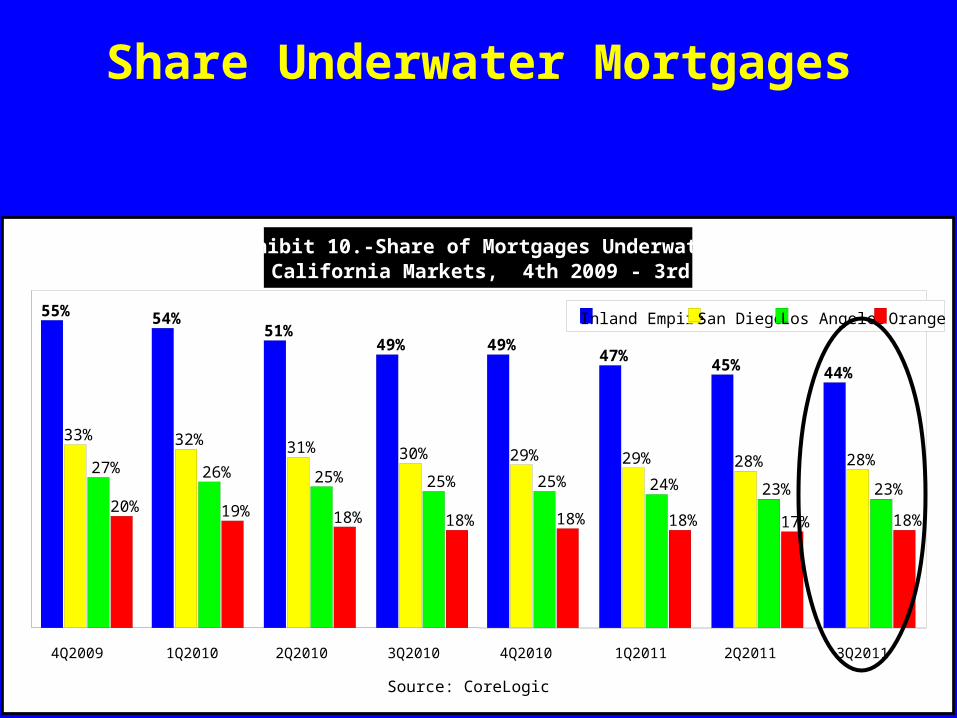
Share Underwater Mortgages
20% 19% 18% 18% 18% 18% 17% 18%
27% 26% 25% 25% 25% 24% 23% 23%
33% 32% 31% 30% 29% 29% 28% 28%
55% 54%51%
49% 49%47%
45% 44%
4Q2009 1Q2010 2Q2010 3Q2010 4Q2010 1Q2011 2Q2011 3Q2011
Inland Empire San Diego Los Angeles Orange
Source: CoreLogic
Exhibit 10.-Share of Mortgages UnderwaterSo. California Markets, 4th 2009 - 3rd 2011
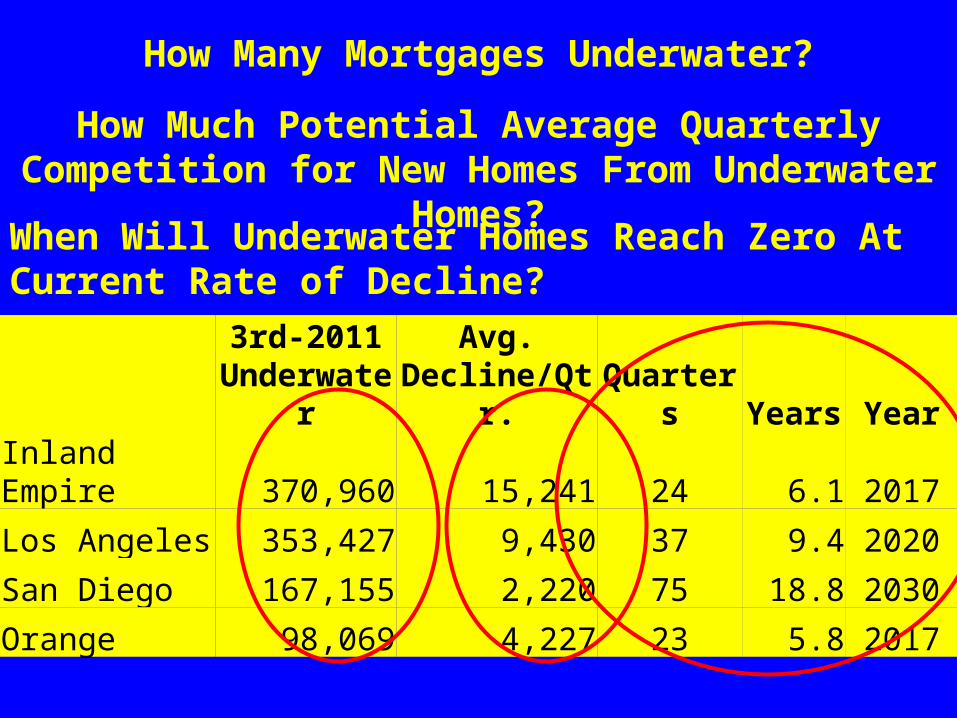
How Many Mortgages Underwater?
3rd-2011
UnderwaterAvg.
Decline/Qtr. Quarters Years Year
Inland Empire 370,960 15,241 24 6.1 2017
Los Angeles 353,427 9,430 37 9.4 2020
San Diego 167,155 2,220 75 18.8 2030
Orange 98,069 4,227 23 5.8 2017
How Much Potential Average Quarterly Competition for New Homes From Underwater Homes?
When Will Underwater Homes Reach Zero At Current Rate of Decline?

Home Sales Volumes Lack of Foreclosure Sales Has Been An Issue
1988
1989
1990
1991
1992
1993
1994
1995
1996
1997
1998
1999
2000
2001
2002
2003
2004
2005
2006
2007
2008
2009
2010
2011
e
0
20,000
40,000
60,000
80,000
100,000
120,000
140,000
160,000
Los Angeles
Orange
San Diego
Inland Empire
Source: Dataquick
All Home Sales TrendsSouthern California, 1988-2011e
IE 63,497LA 57,636SD 25,605OC 21,600

Is There Any Good Housing News?
Last Foreclosure Sold!
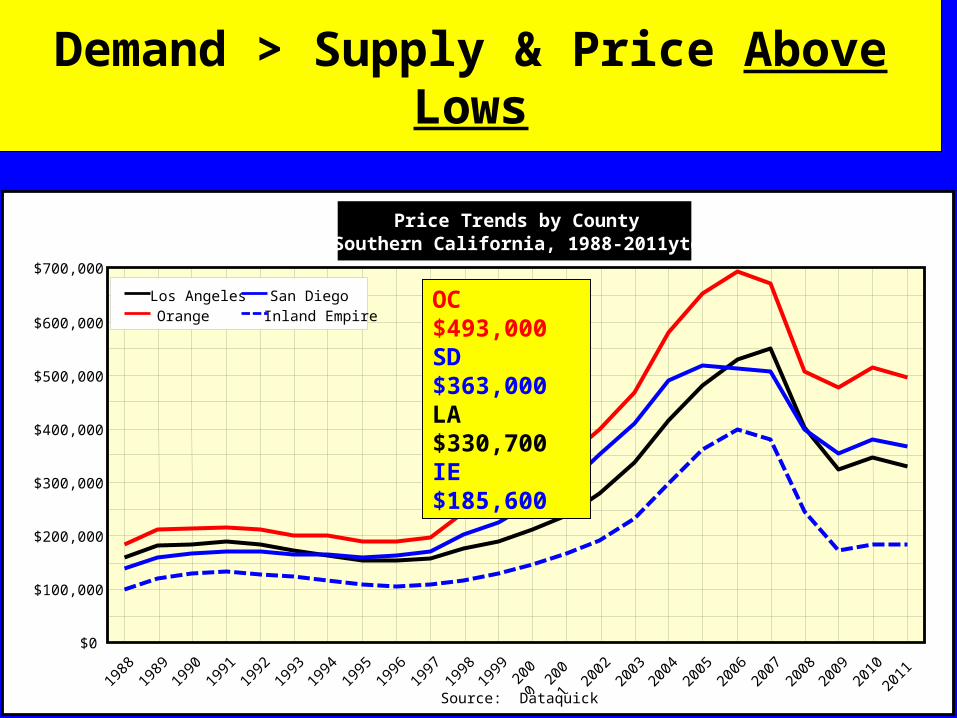
Demand > Supply & Price Above Lows
1988
1989
1990
1991
1992
1993
1994
1995
1996
1997
1998
1999
2000
2001
2002
2003
2004
2005
2006
2007
2008
2009
2010
$0
$100,000
$200,000
$300,000
$400,000
$500,000
$600,000
$700,000
Los AngelesOrange
San DiegoInland Empire
Source: Dataquick
Price Trends by CountySouthern California, 1988-2011ytd
OC $493,000SD $363,000LA $330,700IE $185,600
2011
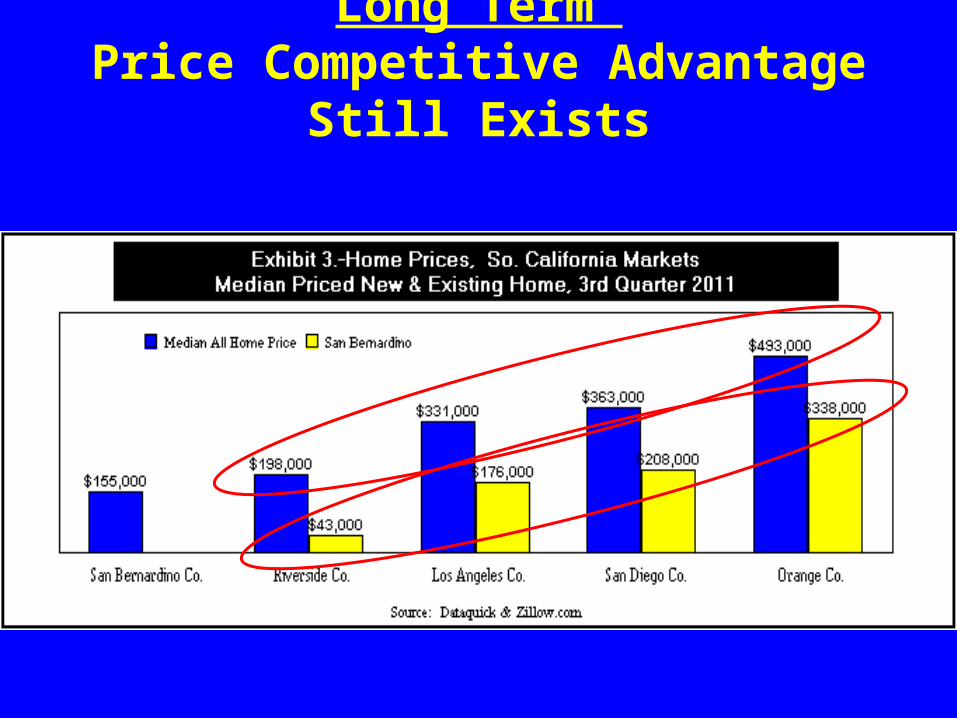
Long Term Price Competitive Advantage Still Exists

Soaring Housing AffordabilityEasily Remains At or Near Record Levels
1988
1989
1990
1991
1992
1993
1994
1995
1996
1997
1998
1999
2000
2001
2002
2003
2004
2005
2006
2007
2008
2009
2010
2011
0%5%
10%15%20%25%30%35%40%45%50%55%60%65%70%75%
Source: CA Association of Realtors
Housing Affordability, So. CaliforniaShare of Families Afford Median Priced Home, 1988-2011
42%
69%
33%
10-11%
15%

BUT . . .
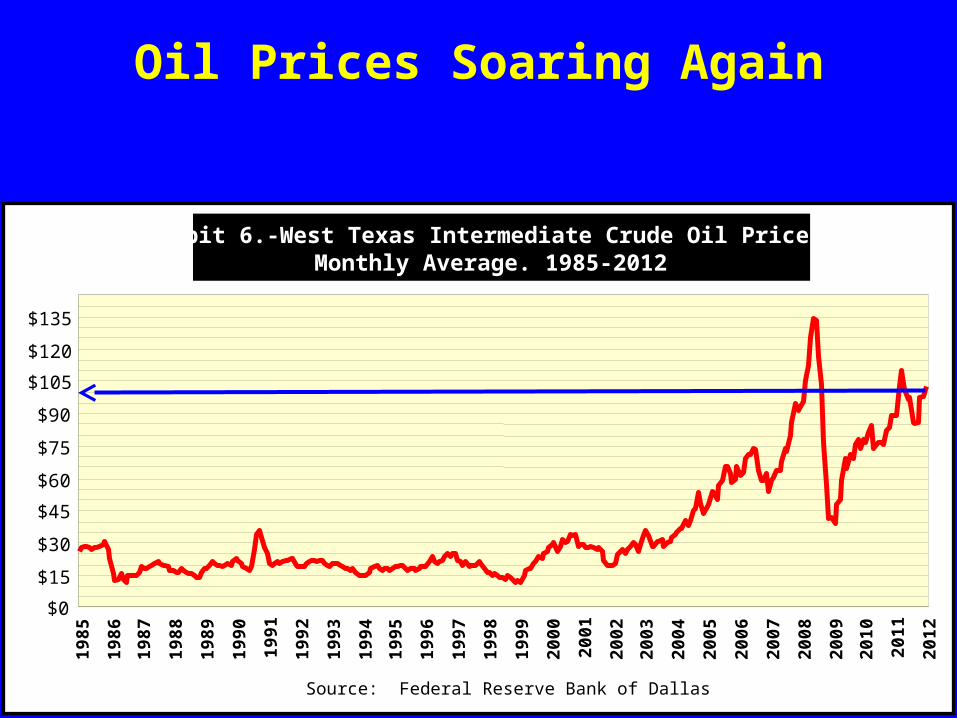
Oil Prices Soaring Again19
85
1986
1987
1988
1989
1990
1991
1992
1993
1994
1995
1996
1997
1998
1999
2000
2001
2002
2003
2004
2005
2006
2007
2008
2009
2010
2011
2012
$0
$15
$30
$45
$60
$75
$90
$105
$120
$135
Source: Federal Reserve Bank of Dallas
Exhibit 6.-West Texas Intermediate Crude Oil PricesMonthly Average. 1985-2012
Congressional Madness

European Debt Crisis
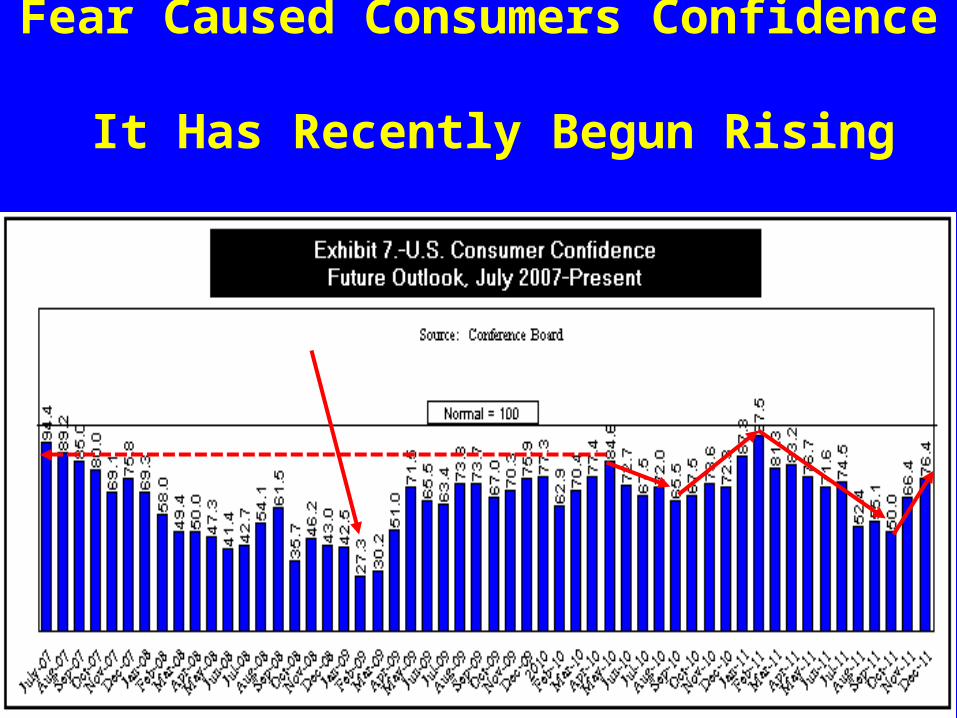
Fear Caused Consumers Confidence It Has Recently Begun Rising
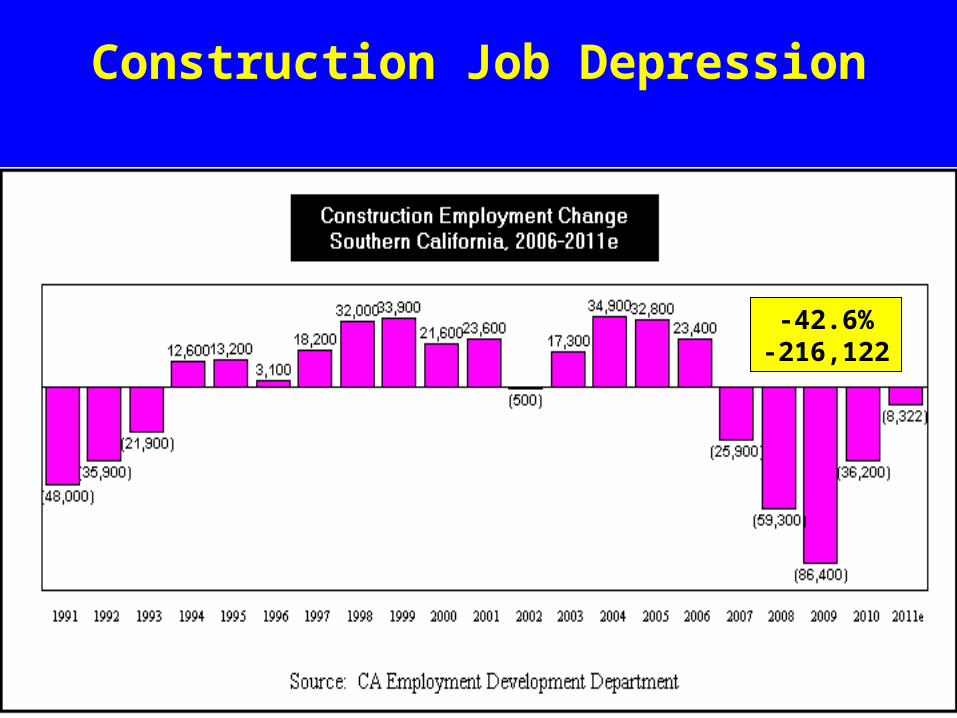
Construction Job Depression
-42.6%-216,122
Housing Slowdown Hurts!
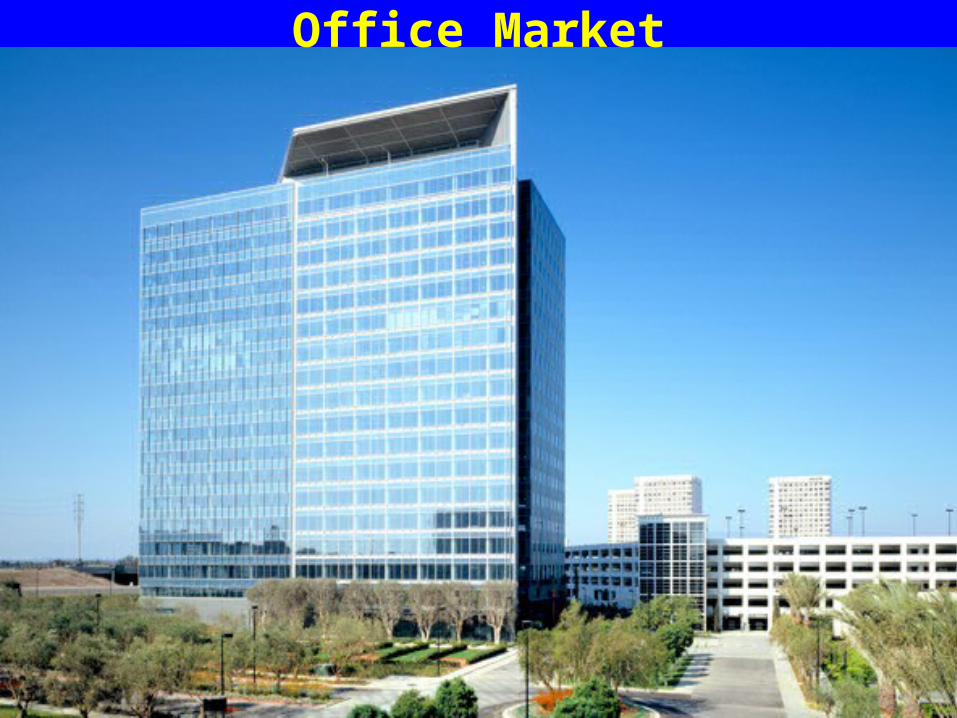
Office Market
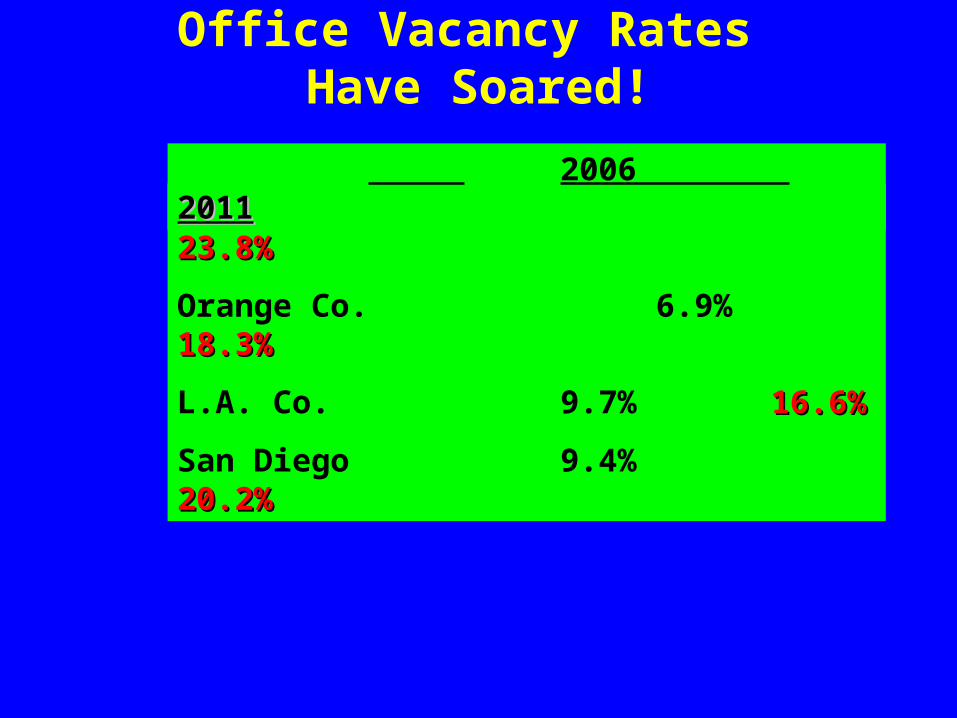
Office Vacancy Rates Have Soared!
Inland Empire 7.3% 23.8%23.8%
Orange Co. 6.9% 18.3% 18.3%
L.A. Co. 9.7% 16.6% 16.6%
San Diego 9.4% 20.2% 20.2%
2006 20112011
Forecast
2012 Better than 2011
Foreclosures A Major Continuing Issue
Complete Recovery 2015-2016??
We Need A Housing Solution!

www.johnhusing.com
Related Documents