Southern California Regional Economic Forecast Lisa M. Grobar, Ph.D. Director, CSULB Economic Forecast Project Office of Economic Research

Welcome message from author
This document is posted to help you gain knowledge. Please leave a comment to let me know what you think about it! Share it to your friends and learn new things together.
Transcript

Southern California Regional
Economic ForecastLisa M. Grobar, Ph.D.
Director, CSULB Economic Forecast Project
Office of Economic Research

Employment Growth Returns to the Region!
-10
-8
-6
-4
-2
0
2
4
07Q1 07Q2 07Q3 07Q4 08Q1 08q2 08Q3 08Q4 09Q1 09Q2 09Q3 09Q4 10Q1 10Q2 10Q3 10Q4 11Q1
Percent

Quarterly Employment Growth Rates
-10
-8
-6
-4
-2
0
2
4
07Q1 07Q3 08Q1 08Q3 09Q1 09Q3 10Q1 10Q3 11Q1
LA OC RSB V
Percent
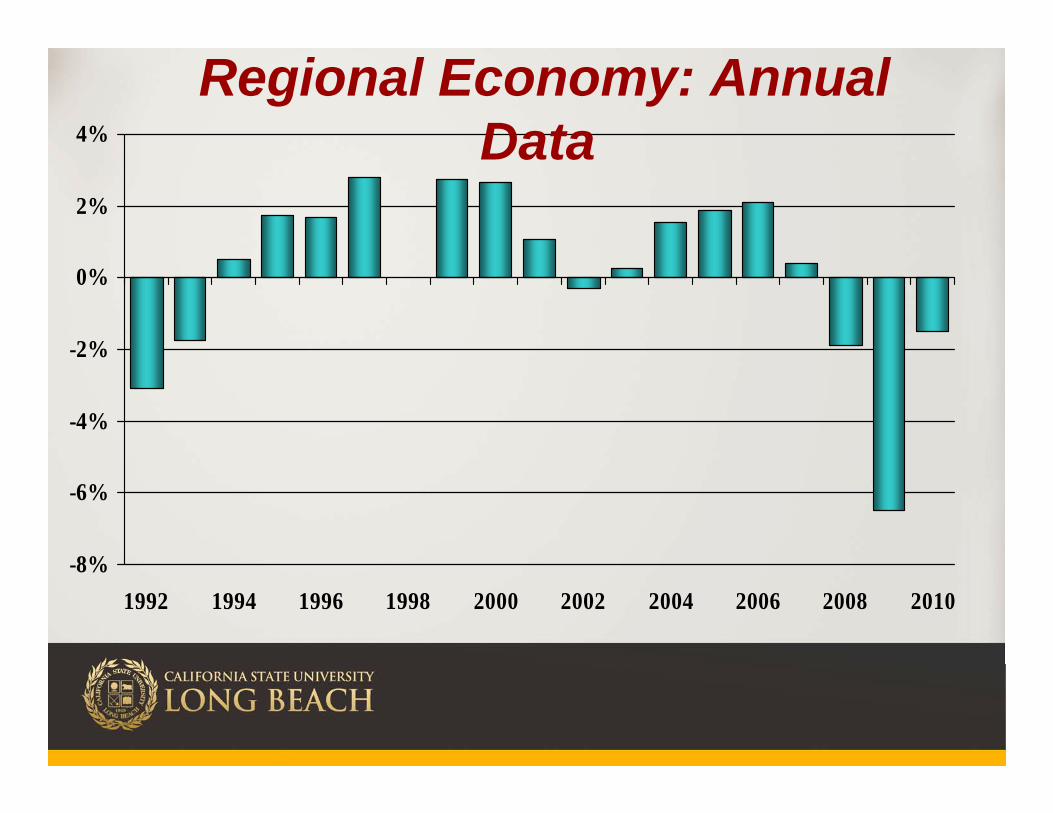
-8%
-6%
-4%
-2%
0%
2%
4%
1992 1994 1996 1998 2000 2002 2004 2006 2008 2010
Regional Economy: Annual Data
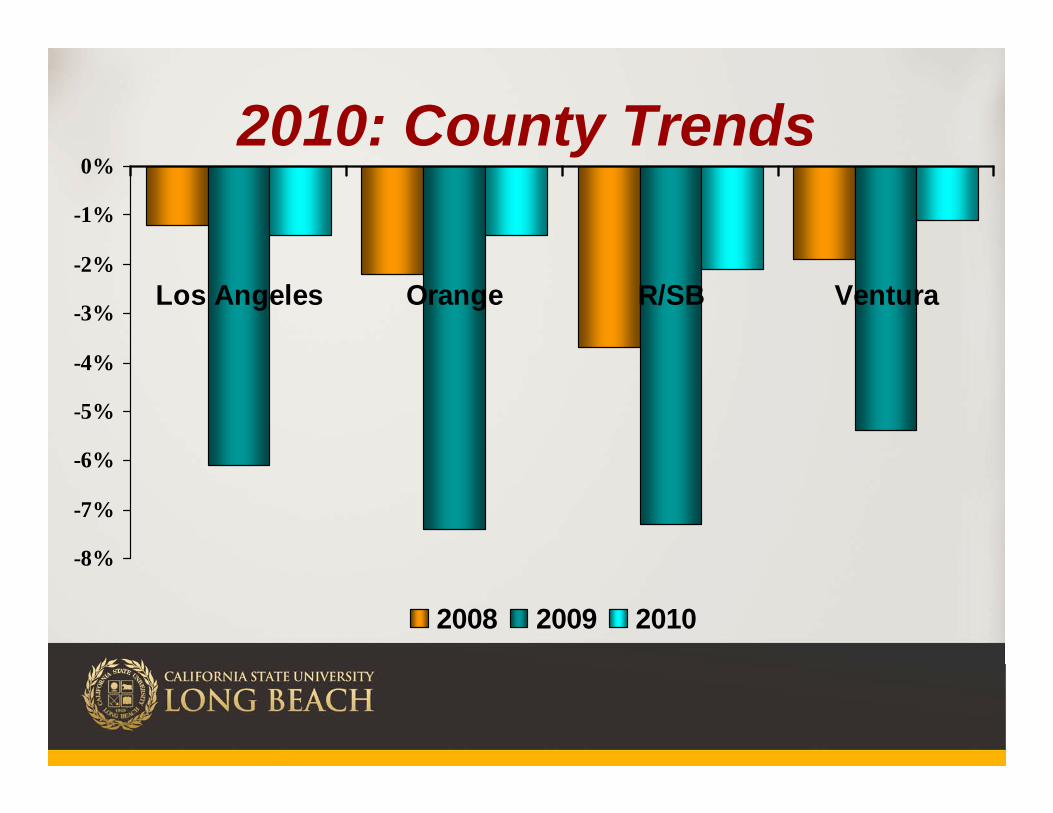
2010: County Trends
-8%
-7%
-6%
-5%
-4%
-3%
-2%
-1%
0%
Los Angeles Orange R/SB Ventura
2008 2009 2010
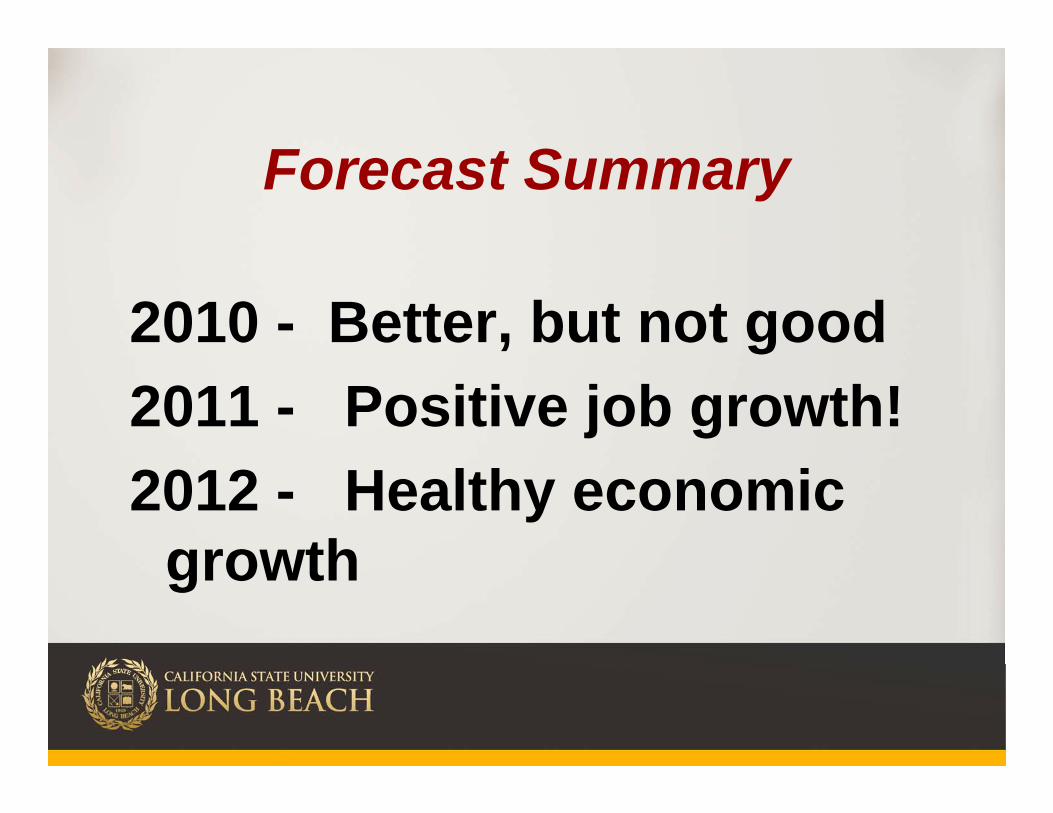
Forecast Summary
2010 - Better, but not good2011 - Positive job growth!2012 - Healthy economic
growth

-7%
-6%
-5%
-4%
-3%
-2%
-1%
0%
1%
2%
3%
2005 2006 2007 2008 2009 2010 2011 2012 2013
Total Nonfarm Employment Growth forecast
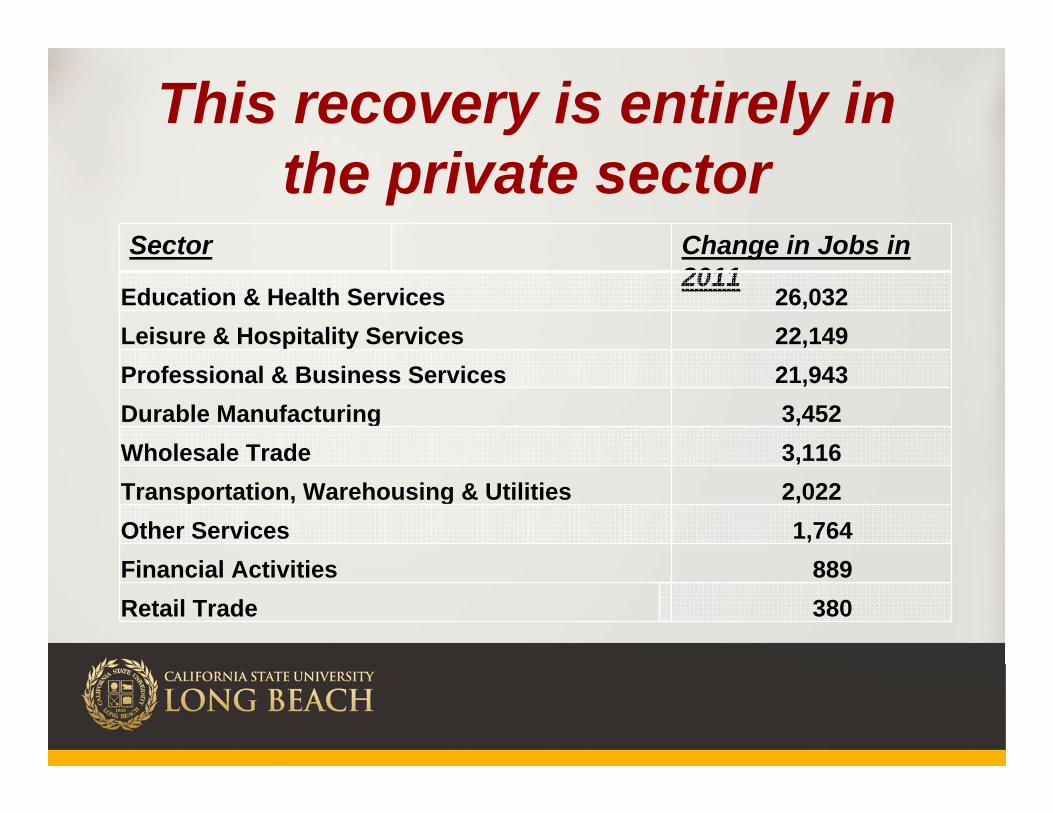
This recovery is entirely in the private sector
Sector Change in Jobs in 2011
Education & Health Services 26,032Leisure & Hospitality Services 22,149Professional & Business Services 21,943Durable Manufacturing 3,452Wholesale Trade 3,116Transportation, Warehousing & Utilities 2,022Other Services 1,764 Financial Activities 889 Retail Trade 380
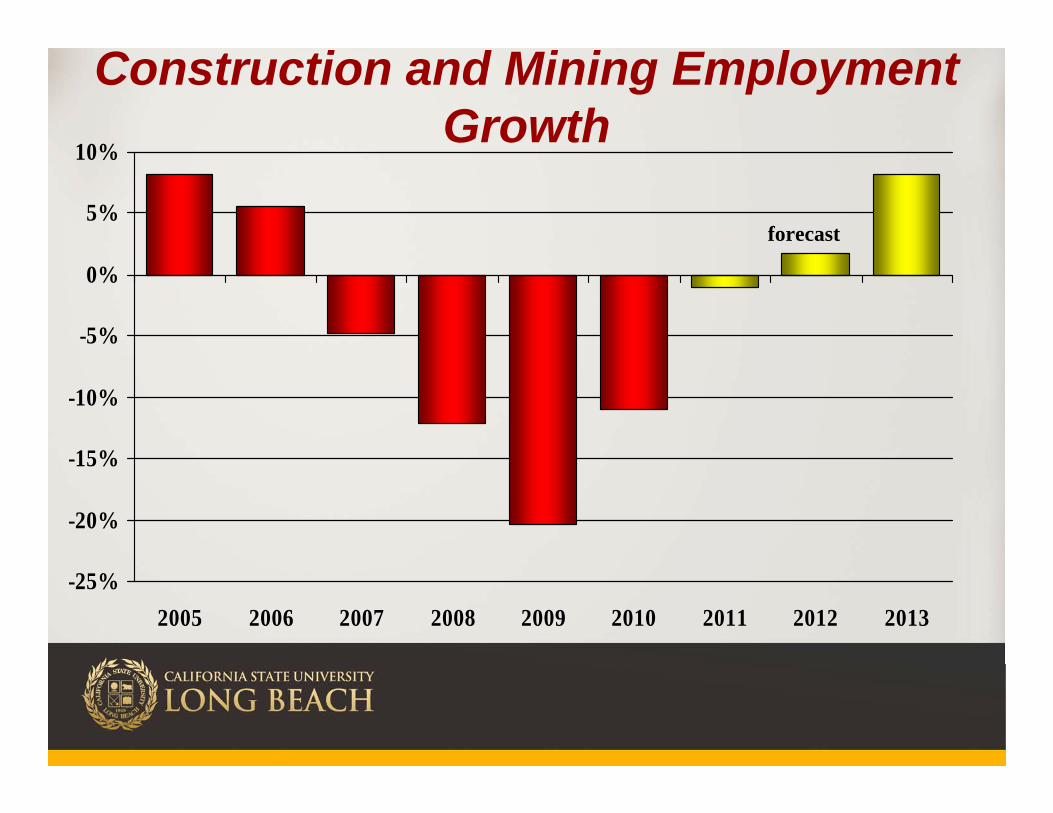
-25%
-20%
-15%
-10%
-5%
0%
5%
10%
2005 2006 2007 2008 2009 2010 2011 2012 2013
Construction and Mining Employment Growth
forecast
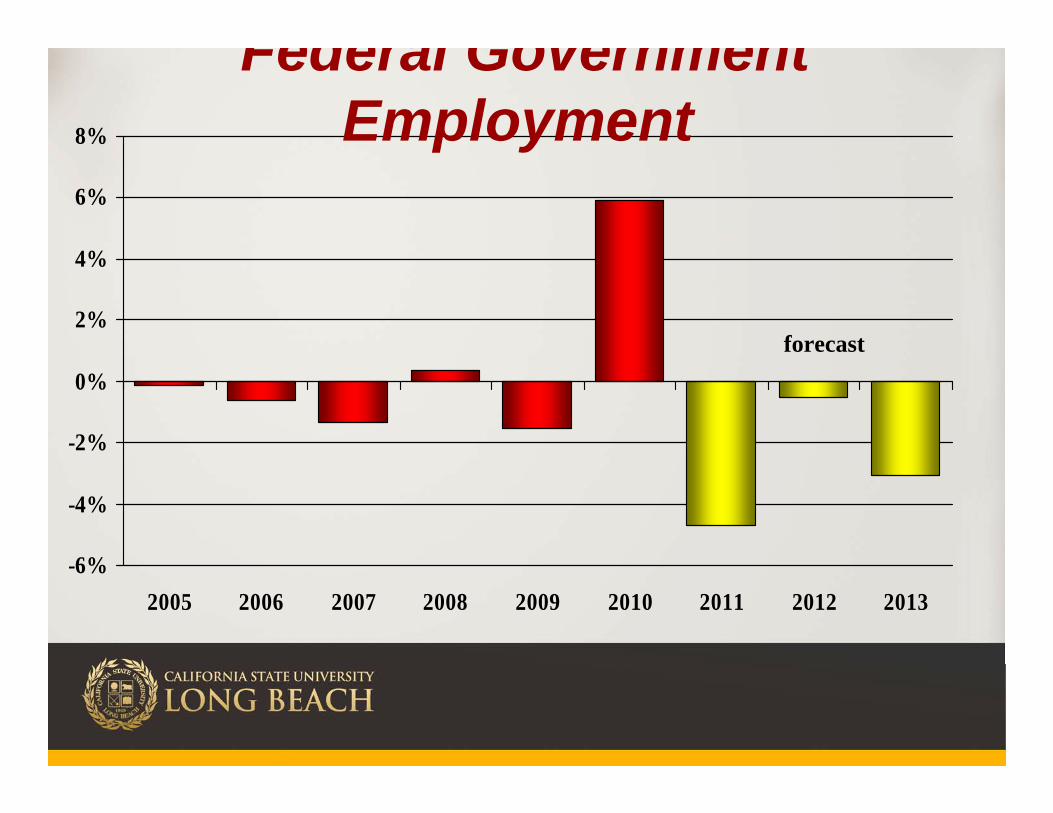
-6%
-4%
-2%
0%
2%
4%
6%
8%
2005 2006 2007 2008 2009 2010 2011 2012 2013
Federal Government Employment
forecast

-4%
-3%
-2%
-1%
0%
1%
2%
3%
4%
2001 2002 2005 2006 2007 2008 2009 2010 2011 2012 2013
State & Local Employment Growth
forecast

-10%
-8%
-6%
-4%
-2%
0%
2%
4%
6%
2004 2005 2006 2007 2008 2009 2010 2011 2012 2013
Regional Professional & Business Services Employment Growth
forecast

Professional & Business Services
• Los Angeles and Orange County– significant growth in Professional,
Scientific & Technical Services• Region
– rapid growth in Administrative & Support Services
– Temporary help services are growing rapidly in the region

Professional & Business Services Average Pay
Average Wage (2009) $61,473
A. Professional, Scientific, and Technical Services $82,252
Accounting, Tax Preparation . Bookkeeping & Payroll $64,494
Engineering Services $107,173Computer Systems Design $88,052Management Consulting $78,588B. Administrative & Support
Services $32,517Temporary Help Services $26,325

-5%
-4%
-3%
-2%
-1%
0%
1%
2%
3%
4%
2005 2006 2007 2008 2009 2010 2011 2012 2013
Leisure & Hospitality Employment Growth forecast

Los Angeles: Tourism Indicators
County Feb. 2010 Feb. 2011LAX Traffic (thousands) 3,960 4,121Hotel rooms sold (thousands)
1,767 1,950Occupancy (%) 64.4 71.0Avg. Room Rate $112.32 $128.51
16
Source: Los Angeles Convention and Visitor’s Bureau

-14%
-12%
-10%
-8%
-6%
-4%
-2%
0%
2%
2000 2001 2005 2006 2007 2008 2009 2010 2011 2012 2013
Durable Manufacturing EmploymentGrowth
forecast

-4%
-3%
-2%
-1%
0%
1%
2%
3%
4%
2005 2006 2007 2008 2009 2010 2011 2012 2013
Regional Transportation, Warehousing & Utilities
forecast
-8%
-6%
-4%
-2%
0%
2%
4%
6%
2005 2006 2007 2008 2009 2010 2011 2012 2013
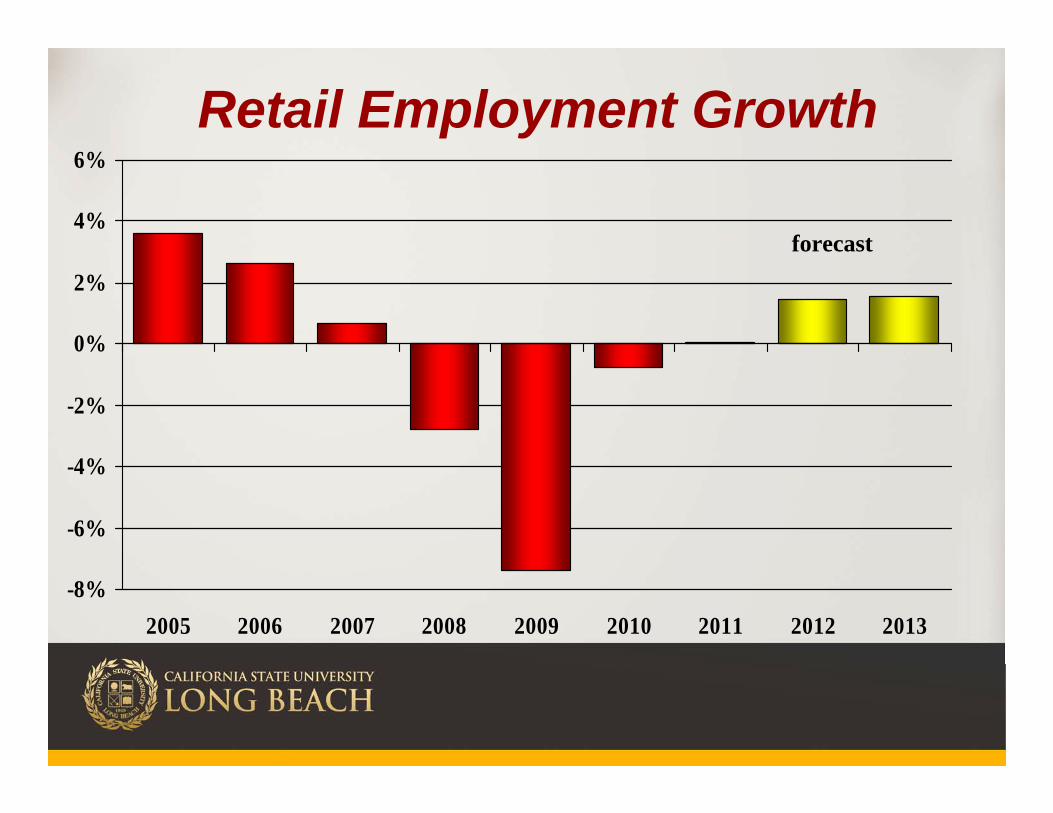
Retail Employment Growth
forecast

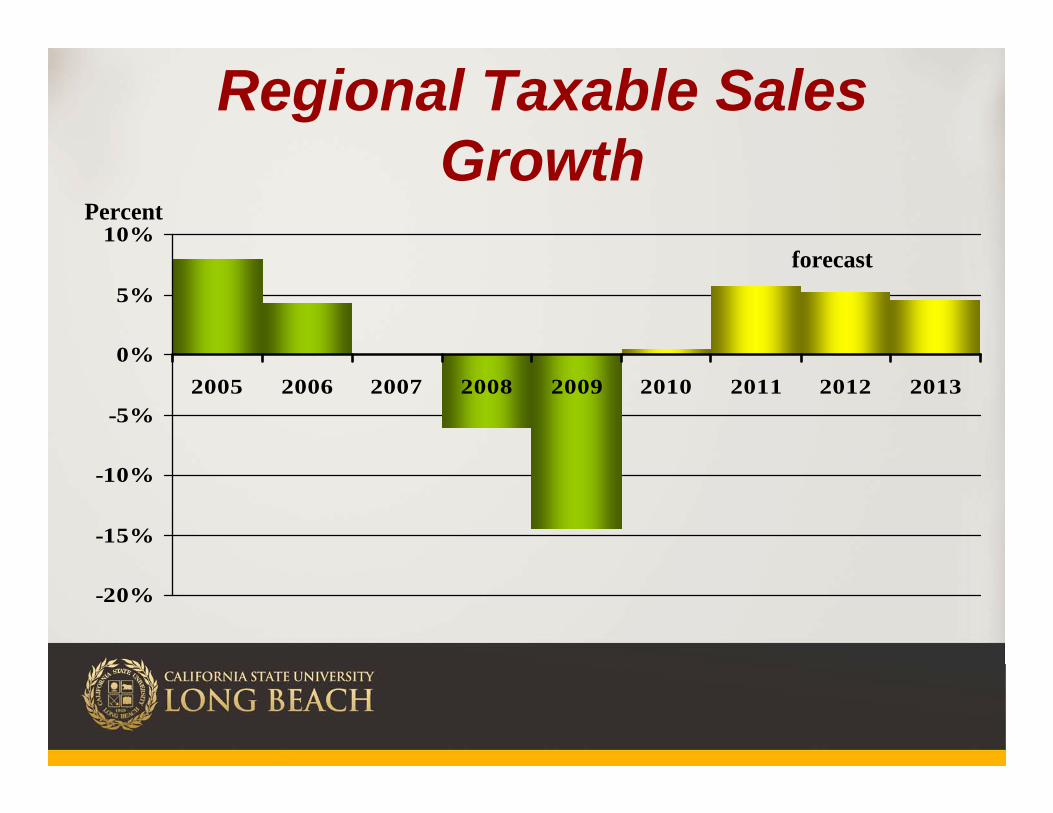
Regional Taxable Sales Growth
-20%
-15%
-10%
-5%
0%
5%
10%
2005 2006 2007 2008 2009 2010 2011 2012 2013
Percent
forecast

Regional Economy Summary
• The regional recovery is finally underway
• 3 of 4 county areas now seeing positive job growth
• The region will see 1.3 % job growth this year
• A return to healthy job formation in 2012-13 with job growth close to 2%

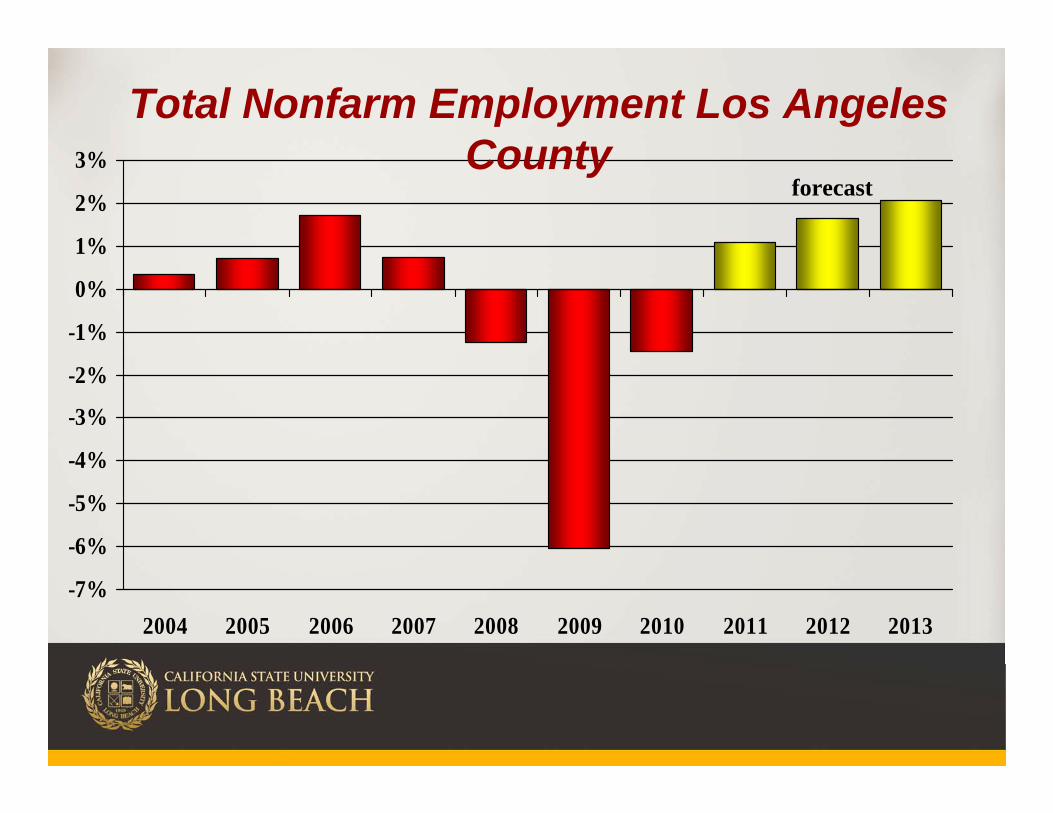
Economic OutlookLos Angeles County
-7%
-6%
-5%
-4%
-3%
-2%
-1%
0%
1%
2%
3%
2004 2005 2006 2007 2008 2009 2010 2011 2012 2013
Total Nonfarm Employment Los Angeles County
forecast
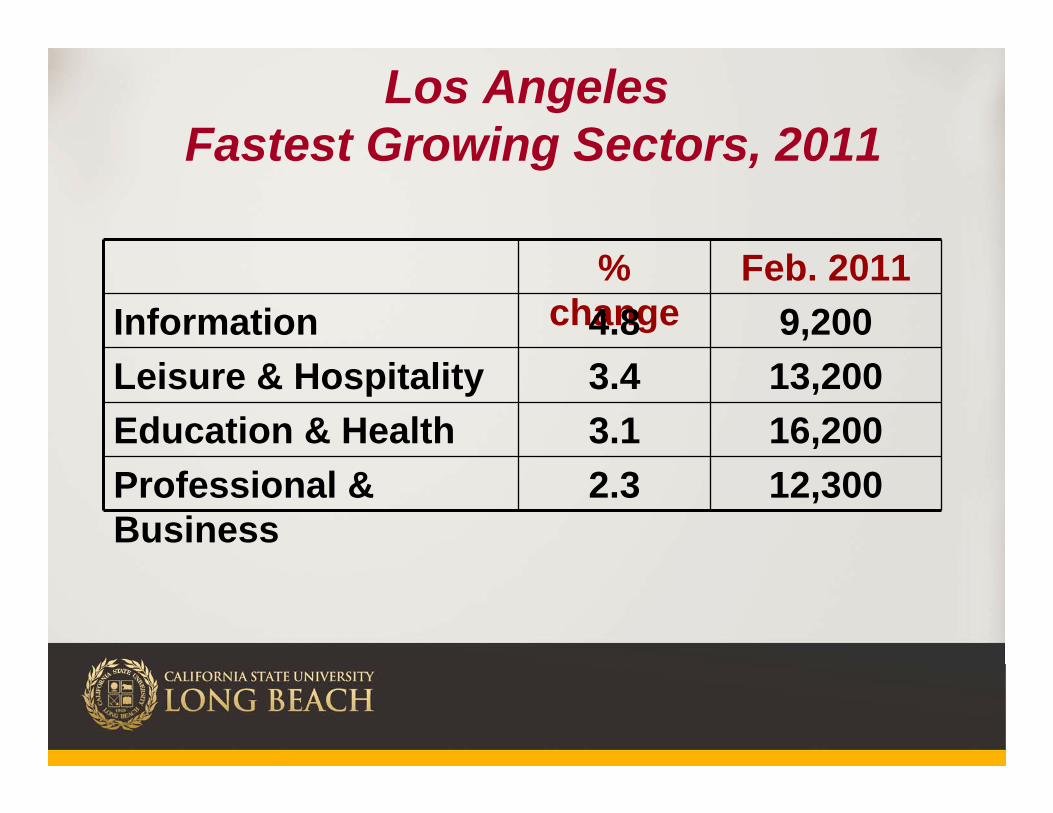
Los AngelesFastest Growing Sectors, 2011
% change
Feb. 2011Information 4.8 9,200Leisure & Hospitality 3.4 13,200Education & Health 3.1 16,200Professional & Business
2.3 12,300
-10%
-8%
-6%
-4%
-2%
0%
2%
4%
6%
2004 2005 2006 2007 2008 2009 2010 2011 2012 2013
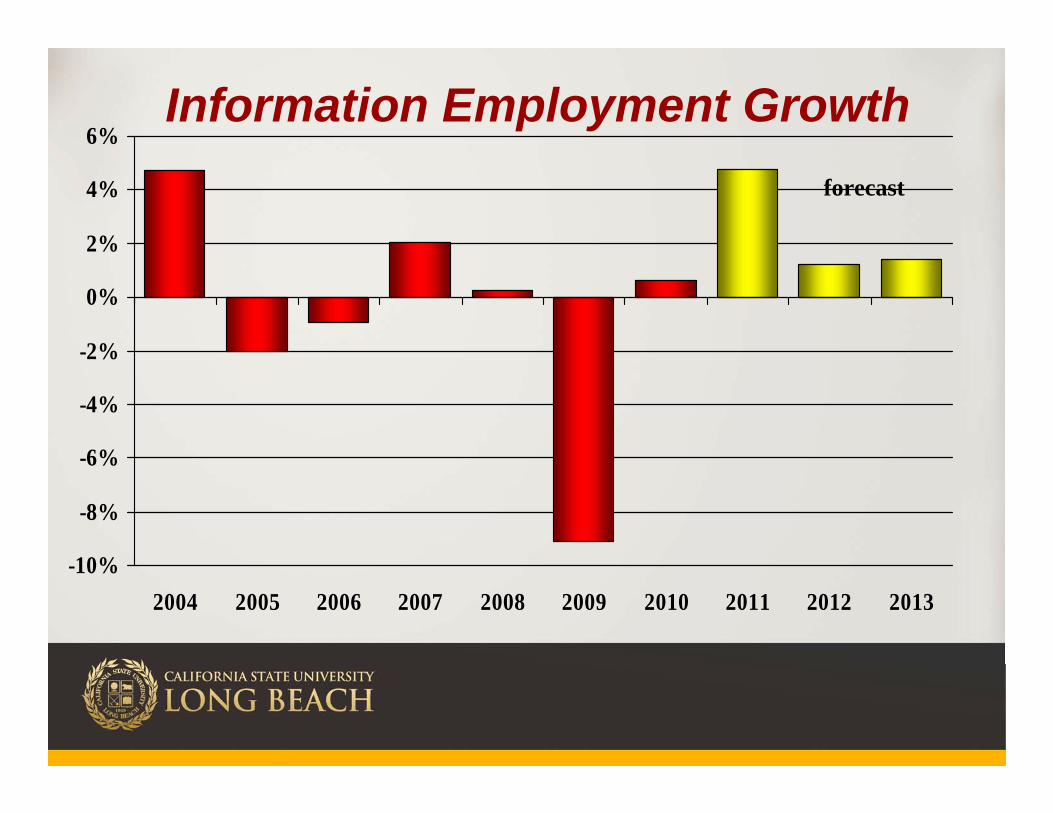
Information Employment Growthforecast

Information• This sector has benefited from film
industry incentives designed to keep production in California
• $100 million annually through 2009-2014
• Motion pictures employment in LA up 12.1% from year-ago levels (15,000 jobs)

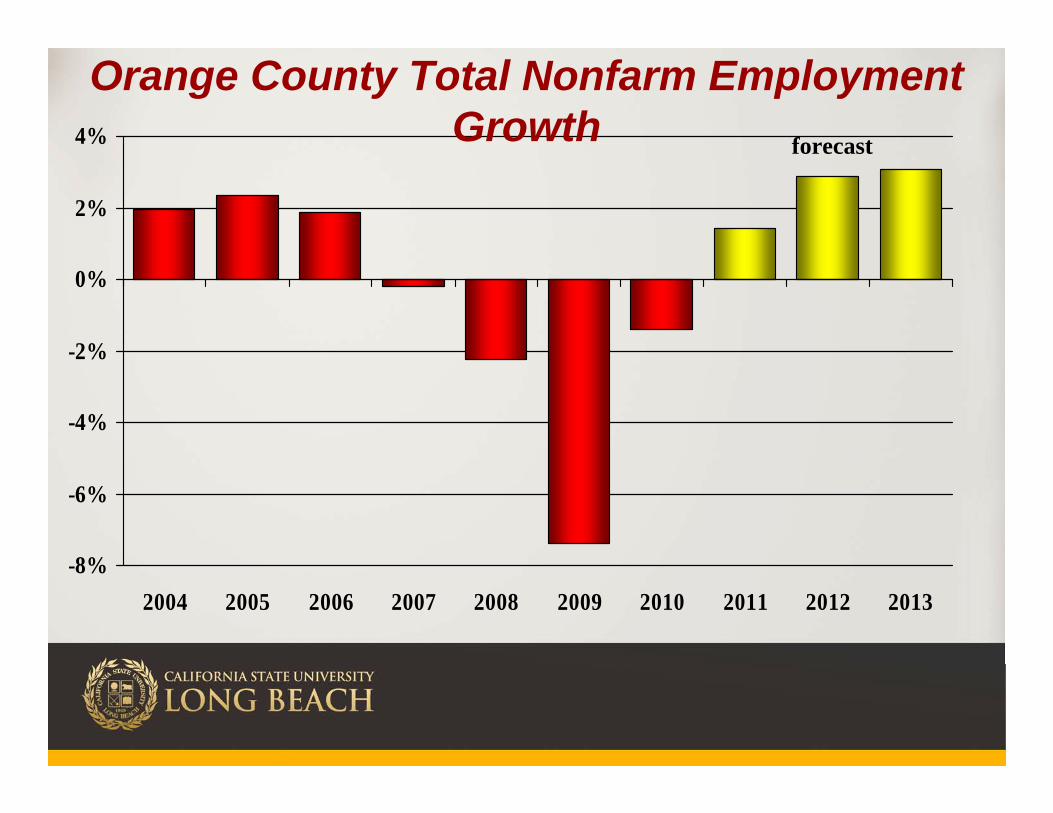
Economic Outlook Orange County
-8%
-6%
-4%
-2%
0%
2%
4%
2004 2005 2006 2007 2008 2009 2010 2011 2012 2013
Orange County Total Nonfarm Employment Growth forecast

-25%
-20%
-15%
-10%
-5%
0%
5%
10%
15%
2004 2005 2006 2007 2008 2009 2010 2011 2012 2013
Orange County Construction Employment Growth
forecast
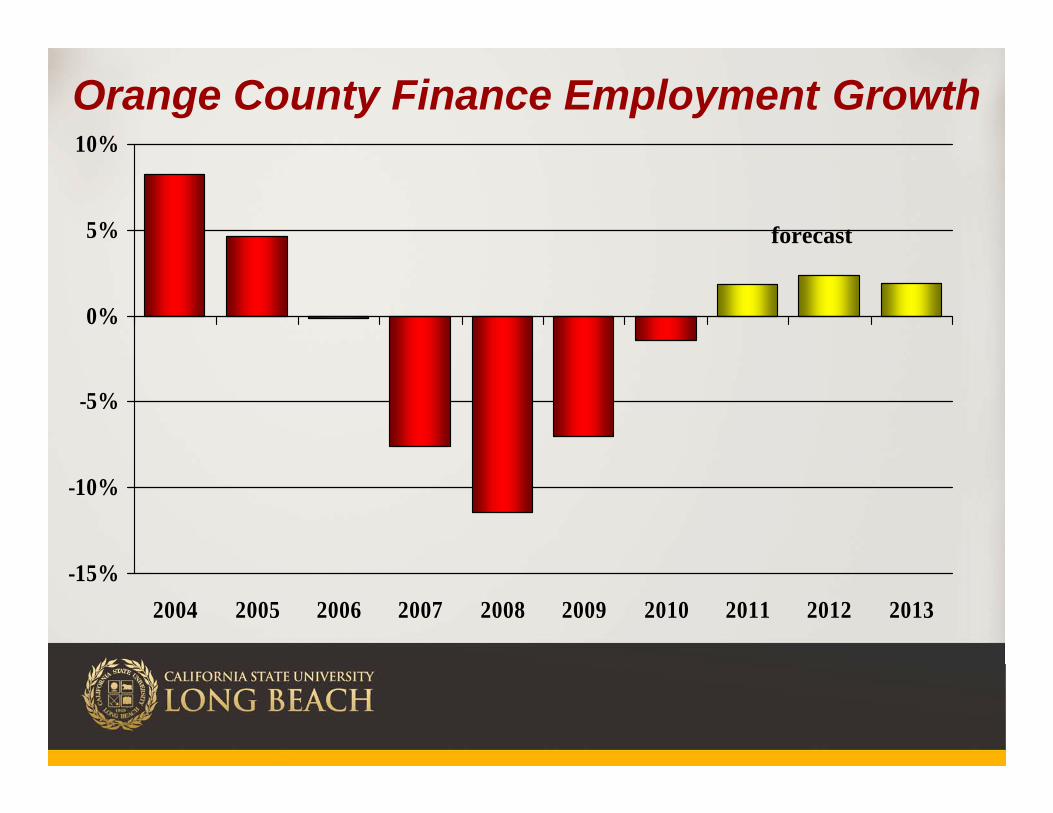
-15%
-10%
-5%
0%
5%
10%
2004 2005 2006 2007 2008 2009 2010 2011 2012 2013
Orange County Finance Employment Growth
forecast

Economic Outlook Riverside/San Bernardino
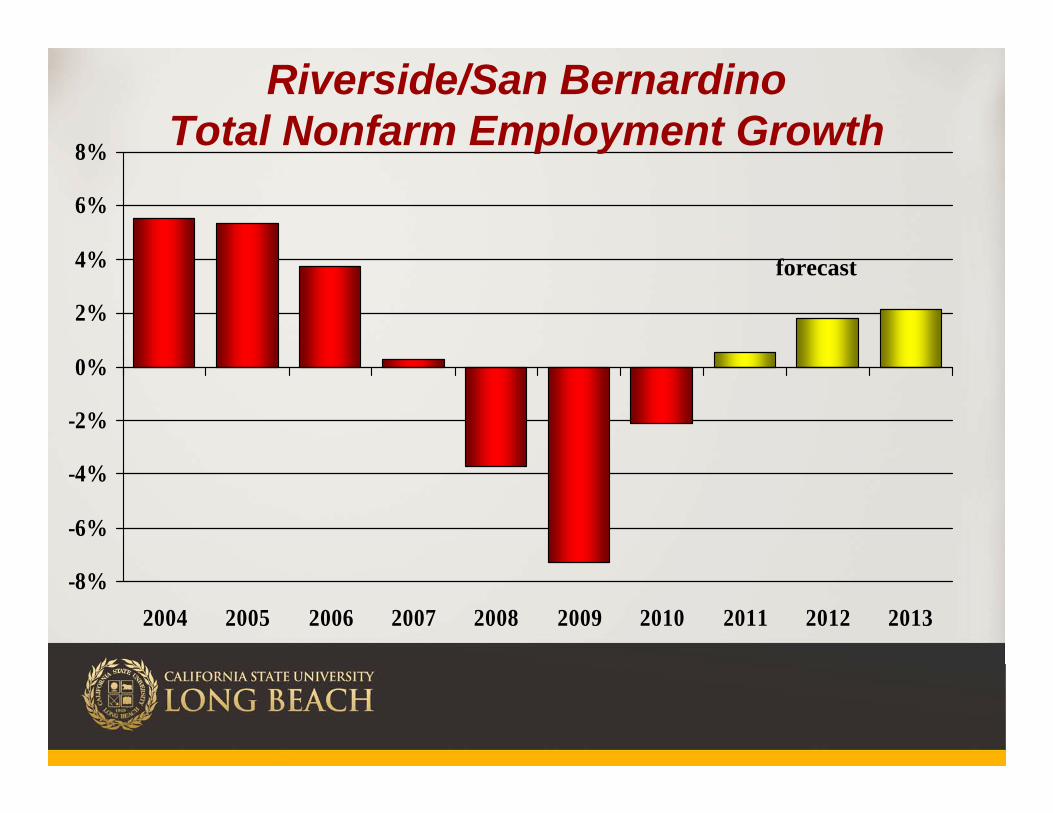
-8%
-6%
-4%
-2%
0%
2%
4%
6%
8%
2004 2005 2006 2007 2008 2009 2010 2011 2012 2013
Riverside/San BernardinoTotal Nonfarm Employment Growth
forecast

Riverside/San Bernardino• This area’s recovery will be aided by
strong growth in the wholesale and transportation, warehousing & utilities sectors
• In 2011 these 2 sectors alone will add over 3,000 jobs
• Other areas of strength will include health and professional & business services
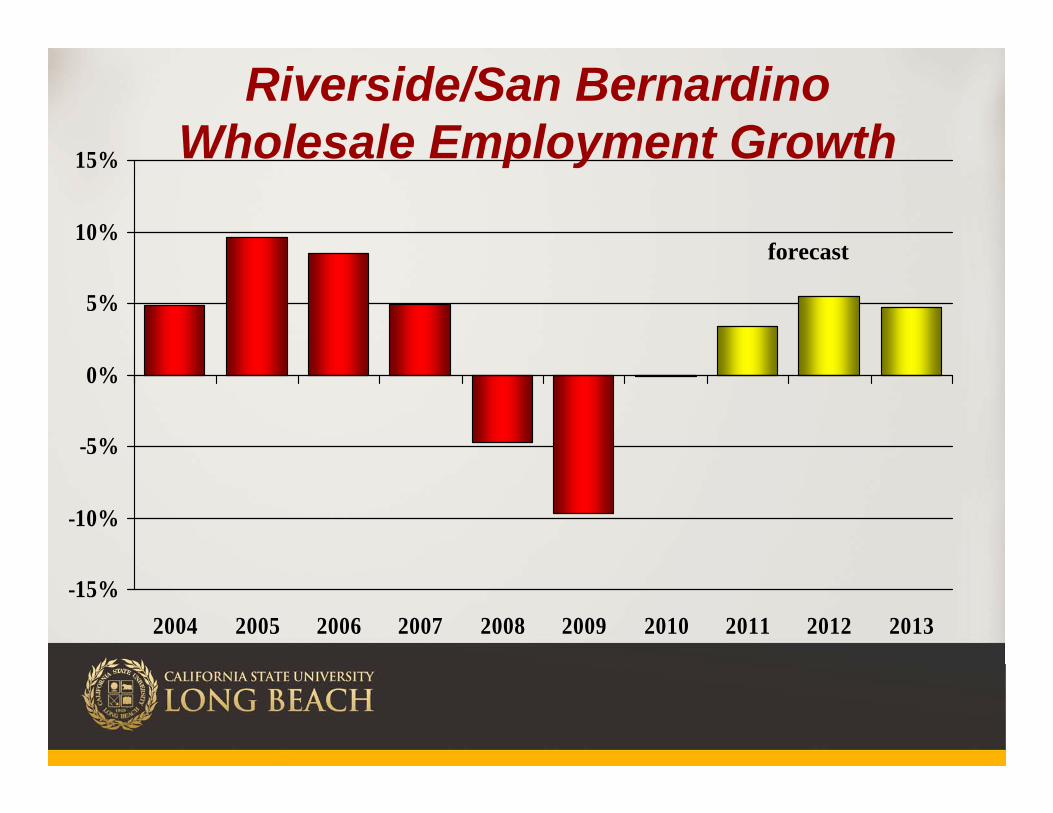
-15%
-10%
-5%
0%
5%
10%
15%
2004 2005 2006 2007 2008 2009 2010 2011 2012 2013
Riverside/San BernardinoWholesale Employment Growth
forecast

-6%
-4%
-2%
0%
2%
4%
6%
8%
10%
12%
2004 2005 2006 2007 2008 2009 2010 2011 2012 2013
Riverside/San BernardinoTWU Employment Growth
forecast

Economic Outlook Ventura County

-6%
-5%
-4%
-3%
-2%
-1%
0%
1%
2%
3%
2004 2005 2006 2007 2008 2009 2010 2011 2012 2013
Ventura CountyTotal Nonfarm Employment Growth
forecast

The Housing Market

The Regional Housing Market
• Starting this year we will present data using the “Case-Shiller index.”
• This index is based on a “repeat-sales” methodology
• Index gives a more accurate read on price appreciation/depreciation than median home price

0
50
100
150
200
250
300
1990 1992 1994 1996 1998 2000 2002 2004 2006 2008 2010
Case-Shiller Index: LA/Orange
Source: Standard & Poor’s
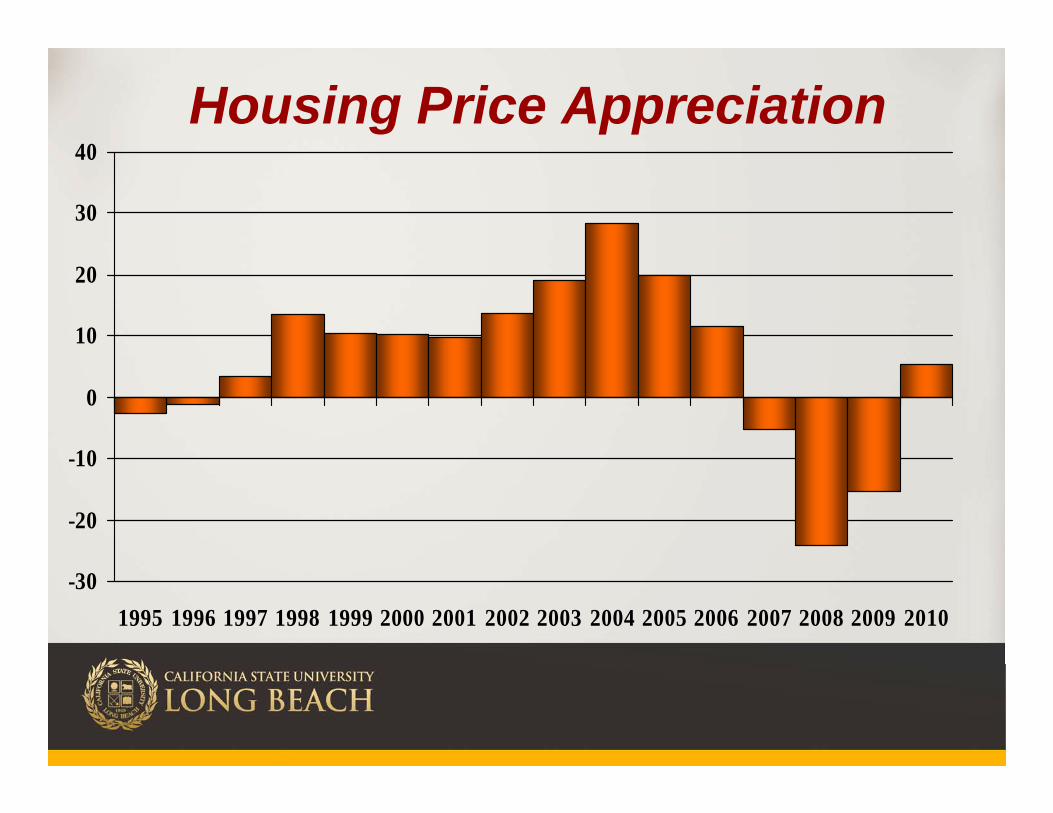
-30
-20
-10
0
10
20
30
40
1995 1996 1997 1998 1999 2000 2001 2002 2003 2004 2005 2006 2007 2008 2009 2010
Housing Price Appreciation

Rate of Housing Price Appreciation
-35
-30
-25
-20
-15
-10
-5
0
5
10
15
07Q1 07Q3 08Q1 08Q3 09Q1 09Q3 10Q1 10Q3 11Q1e
Percent


Notices of Default
County 2010:Q1 2011:Q1 % change 2010-2011Los Angeles 15,797 13,957 -11.6%
Orange 5,270 4,652 -11.7%Riverside 8,474 6,769 -20.1%San Bernardino 6,736 5,514 -18.1%Ventura 1,643 1,437 -12.5%
Source: DQ News.com


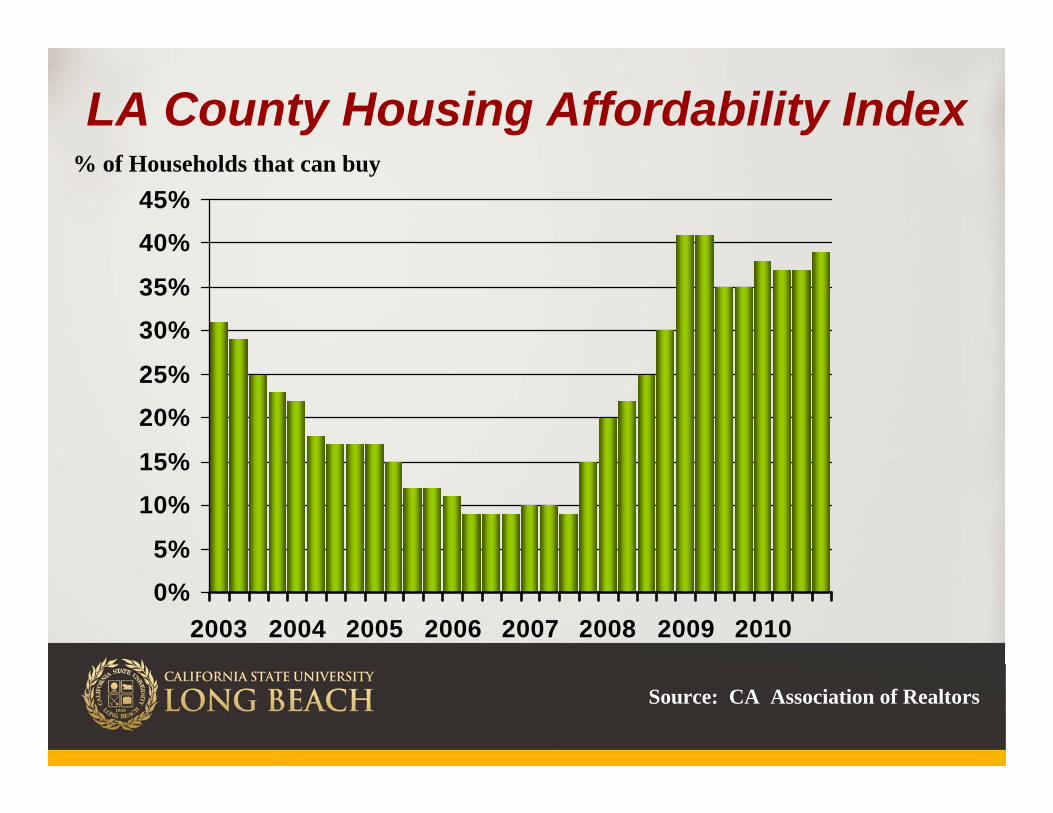
LA County Housing Affordability Index
0%5%
10%15%
20%25%
30%35%
40%45%
2003 2004 2005 2006 2007 2008 2009 2010
Source: CA Association of Realtors
% of Households that can buy

OC County Housing Affordability Index
0%
5%
10%
15%
20%
25%
30%
35%
40%
2003 2004 2005 2006 2007 2009 2009 2010
Source: CA Association of Realtors
% of Households that can buy

The Deflationary Spiral
What Can Interrupt this Deflationary Cycle?
• Government policy/incentives (?)• Expectations of Rising Interest
Rates• Further improvement in
fundamentals, particularly the job market

Housing Market in Near Term• The end of a deflationary cycle is hard
to predict because it depends on a shift in expectations
• Anticipated rate increases by Fed in early 2012 may also help potential buyers to “get off the fence.”
• Most likely result is that we will continue to “bump along the bottom”for some time
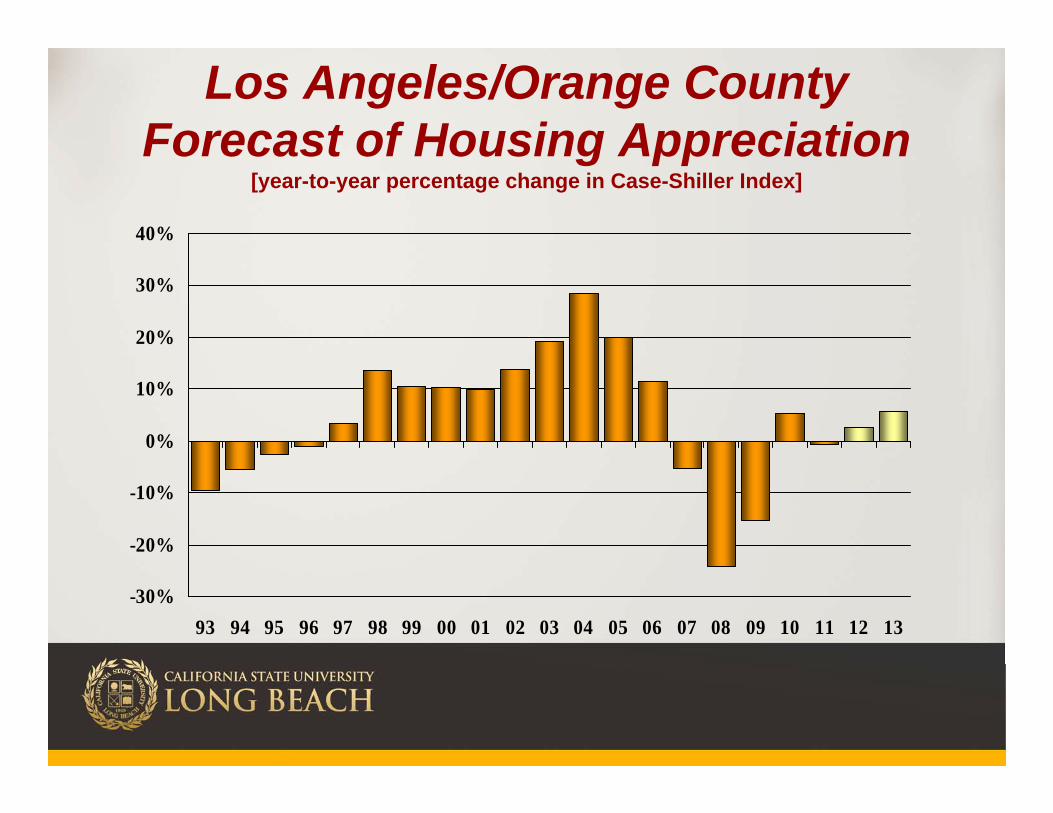
Los Angeles/Orange CountyForecast of Housing Appreciation
[year-to-year percentage change in Case-Shiller Index]
-30%
-20%
-10%
0%
10%
20%
30%
40%
93 94 95 96 97 98 99 00 01 02 03 04 05 06 07 08 09 10 11 12 13
Related Documents