Southeast Asian Solar: Market Outlook and Policy Overview Stefan Robertsson 31 August 2017

Welcome message from author
This document is posted to help you gain knowledge. Please leave a comment to let me know what you think about it! Share it to your friends and learn new things together.
Transcript

Southeast Asian Solar: Market Outlook and Policy Overview
Stefan Robertsson
31 August 2017
Introduction to The Lantau Group31st August 2017
Our name signals our business
focus in the Asia Pacific region
Lantau Peak, on Lantau Island in
Hong Kong, is also known as
Chinese Phoenix Mountain, aptly
reflecting the importance of renewal
and reinvention to meet new
challenges
1
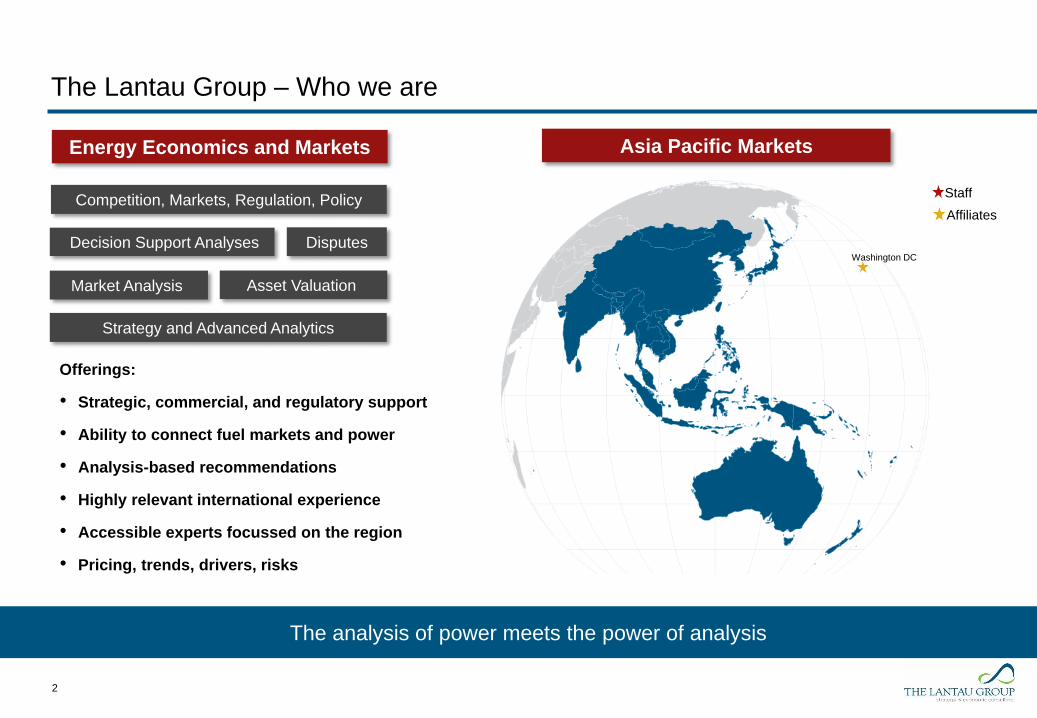
The Lantau Group – Who we are
2
Decision Support Analyses
Asset Valuation
Strategy and Advanced Analytics
Competition, Markets, Regulation, Policy
Disputes
Market Analysis
Energy Economics and Markets
Offerings:
• Strategic, commercial, and regulatory support
• Ability to connect fuel markets and power
• Analysis-based recommendations
• Highly relevant international experience
• Accessible experts focussed on the region
• Pricing, trends, drivers, risks
The analysis of power meets the power of analysis
Asia Pacific Markets
Washington DC
Affiliates
Staff
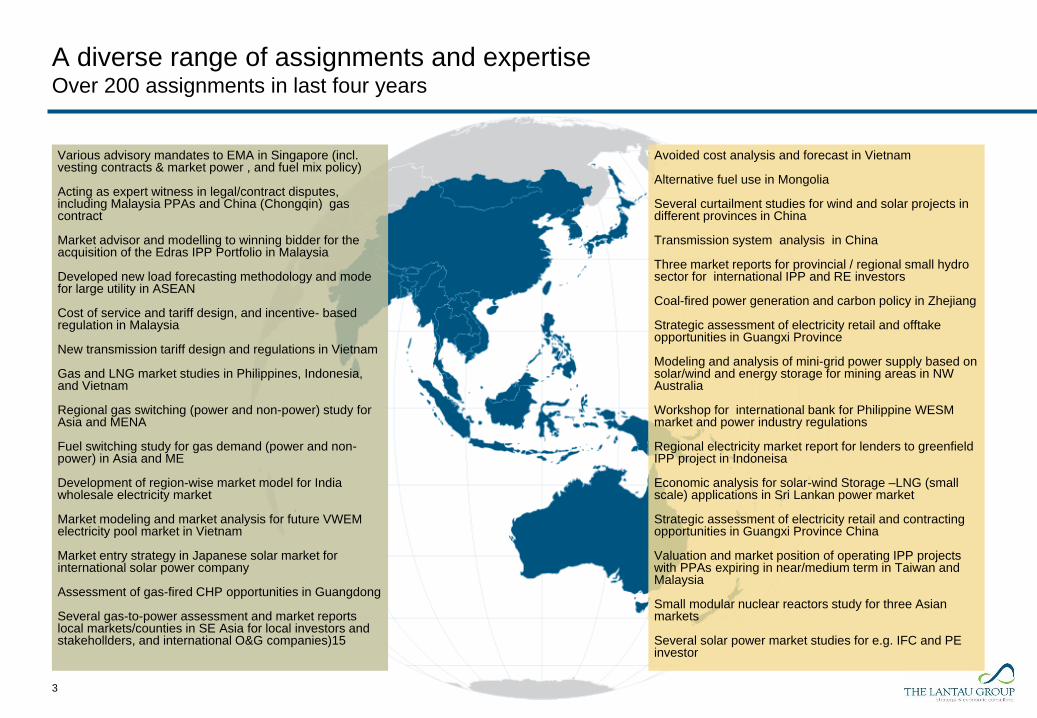
A diverse range of assignments and expertiseOver 200 assignments in last four years
3
Various advisory mandates to EMA in Singapore (incl. vesting contracts & market power , and fuel mix policy)
Acting as expert witness in legal/contract disputes, including Malaysia PPAs and China (Chongqin) gas contract
Market advisor and modelling to winning bidder for the acquisition of the Edras IPP Portfolio in Malaysia
Developed new load forecasting methodology and mode for large utility in ASEAN
Cost of service and tariff design, and incentive- based regulation in Malaysia
New transmission tariff design and regulations in Vietnam
Gas and LNG market studies in Philippines, Indonesia, and Vietnam
Regional gas switching (power and non-power) study for Asia and MENA
Fuel switching study for gas demand (power and non-power) in Asia and ME
Development of region-wise market model for India wholesale electricity market
Market modeling and market analysis for future VWEM electricity pool market in Vietnam
Market entry strategy in Japanese solar market for international solar power company
Assessment of gas-fired CHP opportunities in Guangdong
Several gas-to-power assessment and market reports local markets/counties in SE Asia for local investors and stakehollders, and international O&G companies)15
Avoided cost analysis and forecast in Vietnam
Alternative fuel use in Mongolia
Several curtailment studies for wind and solar projects in different provinces in China
Transmission system analysis in China
Three market reports for provincial / regional small hydro sector for international IPP and RE investors
Coal-fired power generation and carbon policy in Zhejiang
Strategic assessment of electricity retail and offtake opportunities in Guangxi Province
Modeling and analysis of mini-grid power supply based on solar/wind and energy storage for mining areas in NW Australia
Workshop for international bank for Philippine WESM market and power industry regulations
Regional electricity market report for lenders to greenfield IPP project in Indoneisa
Economic analysis for solar-wind Storage –LNG (small scale) applications in Sri Lankan power market
Strategic assessment of electricity retail and contracting opportunities in Guangxi Province China
Valuation and market position of operating IPP projects with PPAs expiring in near/medium term in Taiwan and Malaysia
Small modular nuclear reactors study for three Asian markets
Several solar power market studies for e.g. IFC and PE investor

A broad range of clients
4
Financial Institutions
International Aid Agencies
Government Ministries
Market and System Operators
Regulatory Agencies
Large Users
Oil & Gas Companies
Leading Utilities
Independent Power Producers

• 2016 was a great year for solar power globally – Asia Pac led the world
• But SE Asia was lagging the rest of the world – and 2017 is starting off even weaker
• Despite the excellent fundamentals in SE Asia:
• Inadequate regulatory framework and policy support in SE Asia
– Support for solar and renewables are often weak, designed poorly, or keep changing
– It is not just about the FiT. General industry regulation (and lack of deregulation) often frustrates progress .
• Short term: Exuberance over solar > Action and MW
• Long term: Fundamentals will prevail, and commercial drivers will dominate
• When the solar worm turns, it may do so quickly. But timing is hard to forecast
– Regulations
– Commercial drivers
– And market situation
Key Messages
5
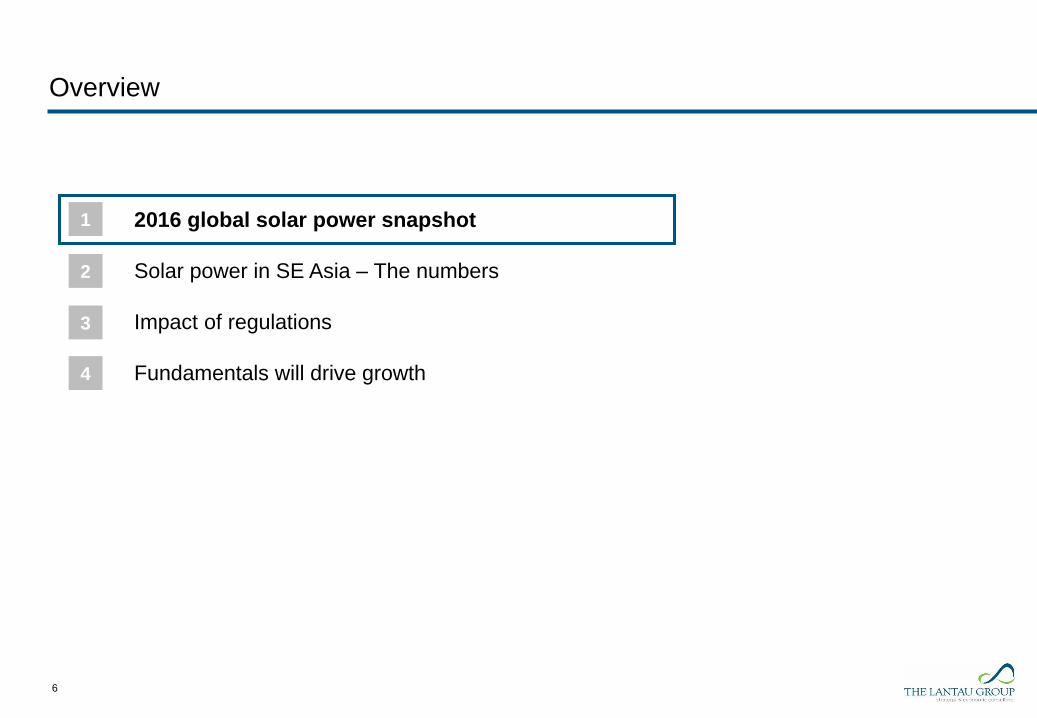
2016 global solar power snapshot
Solar power in SE Asia – The numbers
Impact of regulations
Fundamentals will drive growth
1
2
3
4
Overview
6

China lead the world - Four countries in Asia Pac among top eight
In 2017 China has accelerated, and India has had several record low tariffs
Source: IEA
7
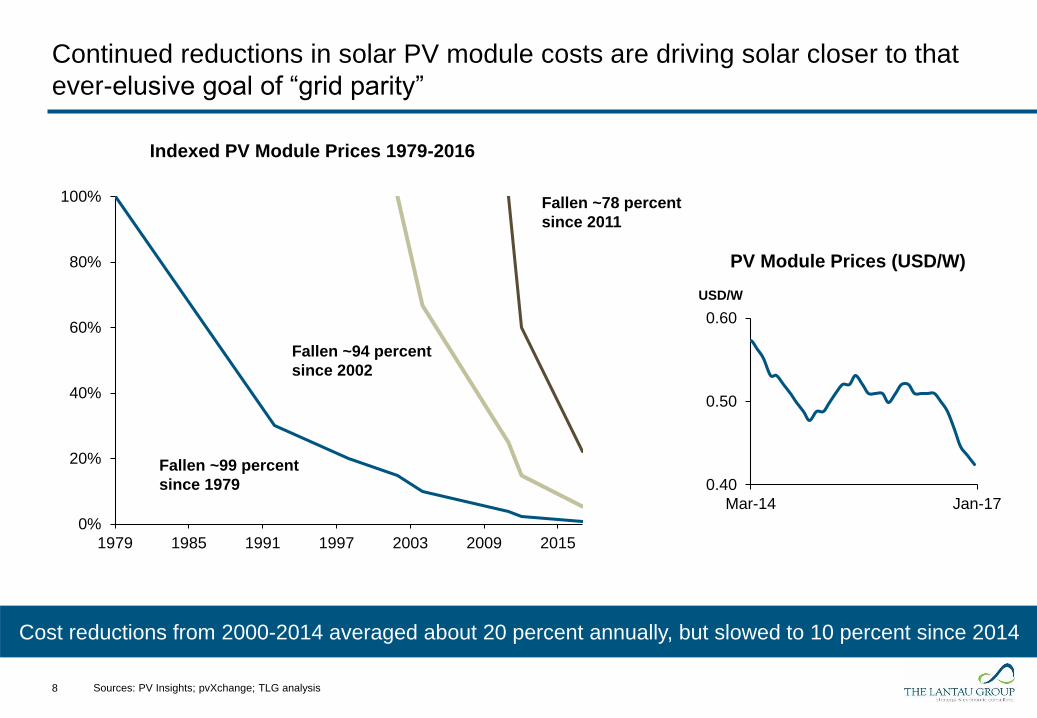
Continued reductions in solar PV module costs are driving solar closer to that
ever-elusive goal of “grid parity”
Cost reductions from 2000-2014 averaged about 20 percent annually, but slowed to 10 percent since 2014
8
Indexed PV Module Prices 1979-2016
0%
20%
40%
60%
80%
100%
1979 1985 1991 1997 2003 2009 2015
Fallen ~99 percent
since 1979
Fallen ~94 percent
since 2002
Fallen ~78 percent
since 2011
USD/W
PV Module Prices (USD/W)
0.40
0.50
0.60
Mar-14 Jan-17
Sources: PV Insights; pvXchange; TLG analysis

0
2
4
6
8
10
12
14
Peru (2016) Dubai(2016)
Dubai(2016)
Mexico(2016)
Dubai(2016)
China(2016)
Chile(2016)
Abu Dhabi(2016)
Denmark(2016)
India(2017)
Lowest Bid Global solar weighted average (2015) Coal/gas average (2015)
Auctions are increasingly displacing FiT regimes – and recent auctions have
yielded bids that appear to undercut traditional thermal resources
US₵/kWh
10 Source: multiple sources for bids; TLG analysis

0
2
4
6
8
10
12
14
Peru (2016) Dubai (2016) Dubai (2016) Mexico(2016)
Dubai (2016) China (2016) Chile (2016) Abu Dhabi(2016)
Denmark(2016)
India (2017)
Lowest Bid Global solar weighted average (2015) Coal/gas average (2015)
2016 was solar par[i]ty time!
US₵/kWh
10
Falling module
costs
Competitive
auctions for
new capacity
Large amounts
of solar panels
and solar MW
Solar tariffs
< 3 US₵/kWh
Source: multiple sources for bids; TLG analysis

2016 global solar power snapshot
Solar power in SE Asia – The numbers
Impact of regulations
Fundamentals will drive growth
1
2
3
4
Overview
11

SE Asia generation mix – Overall diversified but differences between countries
12
Installed Capacity by Fuel Type in 2016
MW
31.5%
36.9%
4.1%
22.1%
1.5%0.5%
3.3%
Fuel Mix (total SE Asia)
Solar power accounts for around 1.5% of total generation capacity in 2016
44,877 44,556 43,707
29,906
20,034
13,502
6,290 5,149
1,657
0
5,000
10,000
15,000
20,000
25,000
30,000
35,000
40,000
45,000
50,000
Vietnam Indonesia Thailand Malaysia Philippines Singapore Laos Myanmar Cambodia
Coal Natural Gas Oil Hydro Solar Wind Other RE
Source: PDP 8, RUPTL 2017, Thailand Power Development Plan 2015-2036, AEDP 2015-2036, Suruhanjaya Tenaga, DoE, EMA, EDC,
Ministry of Energy and Mines; TLG Analysis

13
121%
151%
52%60%
26%
0% 213% 0% 0%0
10,000
20,000
30,000
40,000
50,000
60,000
2017-25 CoalAddition
Existing Coal
SE Asia Coal Existing and Capacity Additions 2017-25
Coal Share of New Capacity in Next 10 years
Despite relatively favorable economics for
solar, the coming decade looks pretty much
like “business as usual”
SE Asia Total Capacity Addition 2017-25
Hydro, 20%
Coal41%
Gas24%
Solar5%
Wind3%
Other RE…
Coal
Official Power development plans suggest a decade of coal coming up
Percentage split
between old and
new coal capacity
Source: PDP 8, RUPTL 2017, Thailand Power Development Plan 2015-2036, AEDP 2015-2036, Suruhanjaya Tenaga, DoE, EMA, EDC,
Ministry of Energy and Mines; TLG Analysis

In terms of SE Asia installed capacity, biomass leads solar and wind combined
14
1%
2%
13%
2%
15%
3%
0% 0% 1%
0
1,000
2,000
3,000
4,000
5,000
6,000
7,000
Vietnam Indonesia Thailand Malaysia Philippines Singapore Laos Myanmar Cambodia
Solar Wind Other RE*
MW
RE Installed Capacity (excl. hydro) in 2016 (percentage relative to total installed capacity)
Excepting Thailand and the Philippines, solar and wind capacity comprise less than
one percent of the total generation capacity in SE Asia
Source: PDP 8, RUPTL 2017, Thailand Power Development Plan 2015-2036, AEDP 2015-2036, Suruhanjaya Tenaga, DoE, EMA, EDC,
Ministry of Energy and Mines; TLG Analysis
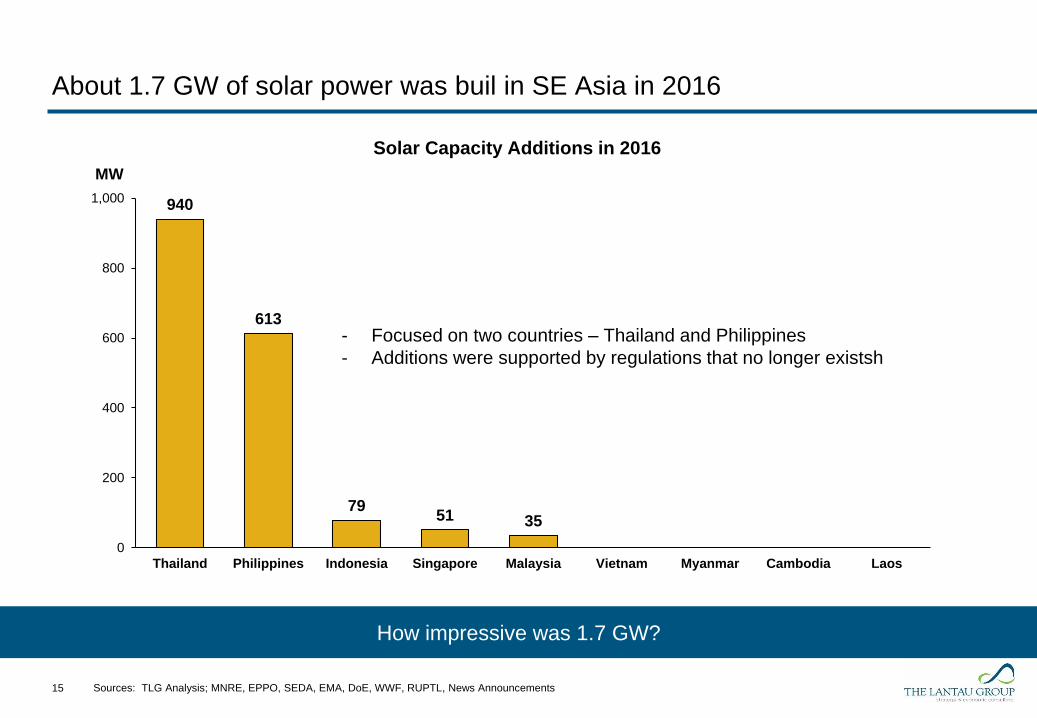
About 1.7 GW of solar power was buil in SE Asia in 2016
15
MW
How impressive was 1.7 GW?
Solar Capacity Additions in 2016
940
613
7951 35
0
200
400
600
800
1,000
Thailand Philippines Indonesia Singapore Malaysia Vietnam Myanmar Cambodia Laos
- Focused on two countries – Thailand and Philippines
- Additions were supported by regulations that no longer existsh
Sources: TLG Analysis; MNRE, EPPO, SEDA, EMA, DoE, WWF, RUPTL, News Announcements
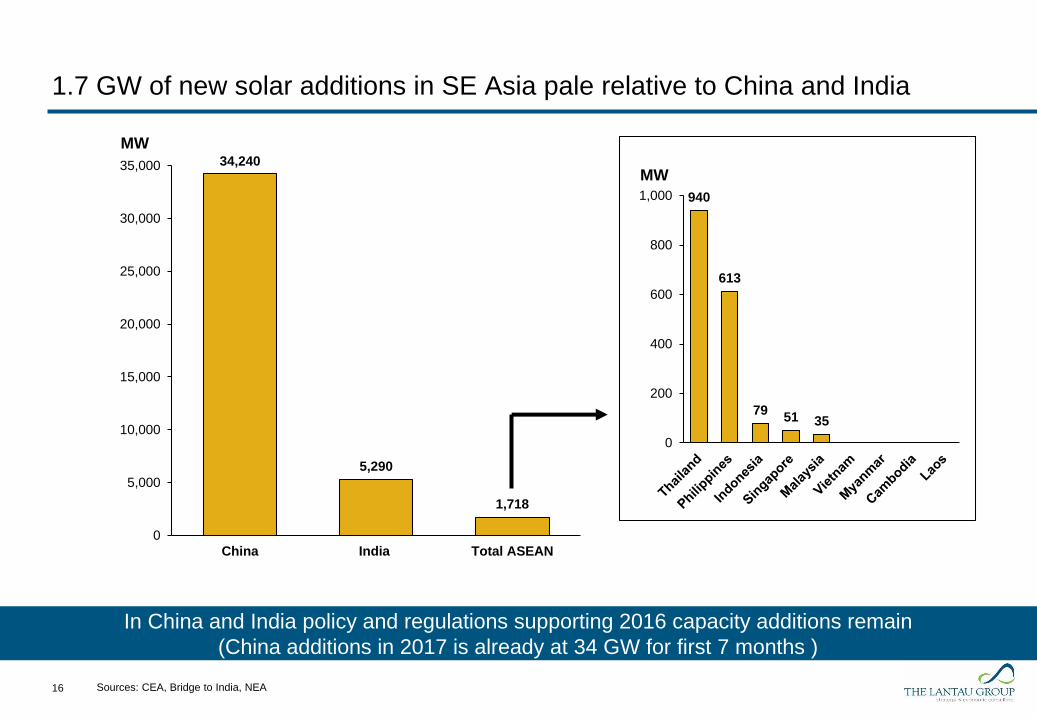
34,240
5,290
1,718
0
5,000
10,000
15,000
20,000
25,000
30,000
35,000
China India Total ASEAN
1.7 GW of new solar additions in SE Asia pale relative to China and India
16
MW
MW
Note: The breakdown of the regional installed capacity is based on data published by government ministry, statistical office or incumbent generators’ publications.
940
613
7951 35
0
200
400
600
800
1,000
In China and India policy and regulations supporting 2016 capacity additions remain
(China additions in 2017 is already at 34 GW for first 7 months )
Sources: CEA, Bridge to India, NEA
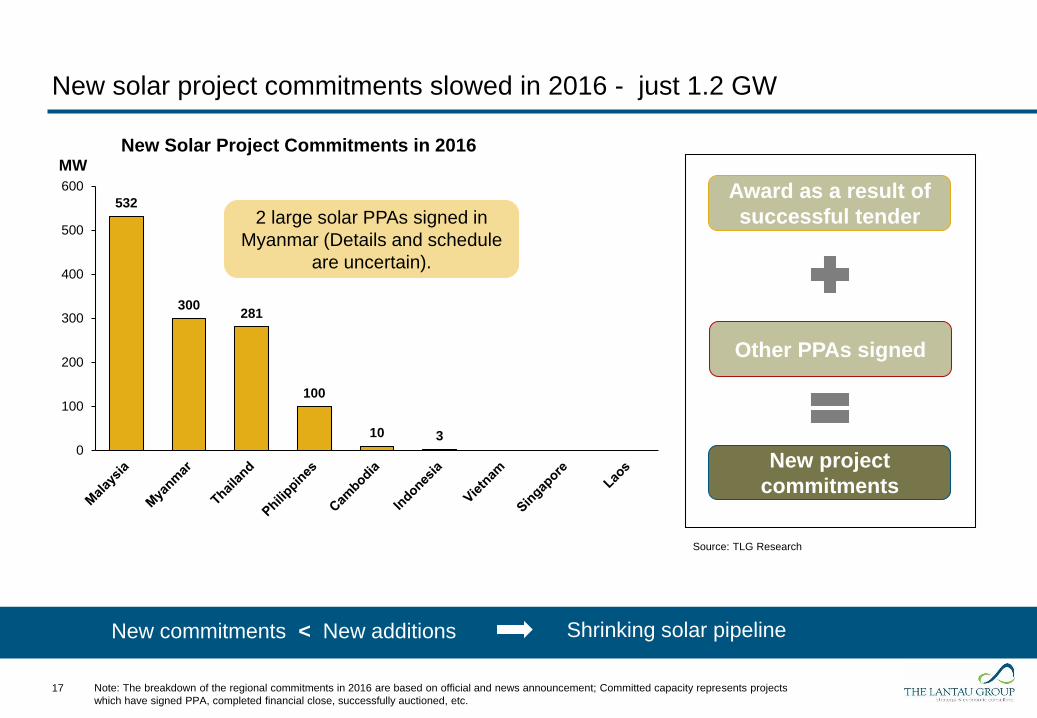
New solar project commitments slowed in 2016 - just 1.2 GW
17
New commitments < New additions
MW
New Solar Project Commitments in 2016
Source: TLG Research
Shrinking solar pipeline
Award as a result of
successful tender
Other PPAs signed
New project
commitments
532
300281
100
10 30
100
200
300
400
500
600
Note: The breakdown of the regional commitments in 2016 are based on official and news announcement; Committed capacity represents projects
which have signed PPA, completed financial close, successfully auctioned, etc.
2 large solar PPAs signed in
Myanmar (Details and schedule
are uncertain).
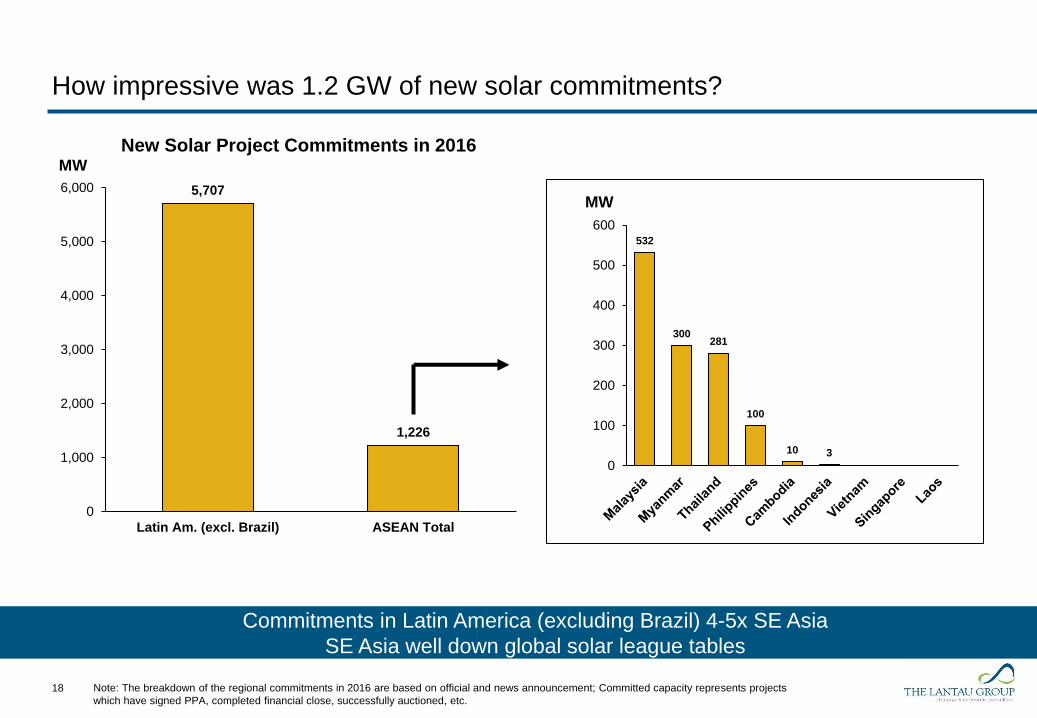
5,707
1,226
0
1,000
2,000
3,000
4,000
5,000
6,000
Latin Am. (excl. Brazil) ASEAN Total
18
MW
How impressive was 1.2 GW of new solar commitments?
Commitments in Latin America (excluding Brazil) 4-5x SE Asia
SE Asia well down global solar league tables
MW
New Solar Project Commitments in 2016
532
300281
100
10 3
0
100
200
300
400
500
600
Note: The breakdown of the regional commitments in 2016 are based on official and news announcement; Committed capacity represents projects
which have signed PPA, completed financial close, successfully auctioned, etc.

And 2017 for solar is off to a slow start…
19
New solar additions across all of SE Asia not much more than 100 MW
MWCapacity Additions in H1 2017
Source: TLG Analysis; EPPO, SEDA, EMA, DoE,
WWF, RUPTL
MW
Committed Capacity in H1 2017
70
20
10
53
0
10
20
30
40
50
60
70
Sources: TLG Analysis; MNRE, EPPO, SEDA, EMA, DoE, WWF, RUPTL, News Announcements
60
172 170
0
20
40
60
80
100
120
140
160
180
200

20
MW
Additional Installed Capacity (2017-2018) for Selected Asian Countries
We project new solar additions through 2018 to be approximately 1.4 GW
Given current slow activity, new capacity additions in 2017-2018 will almost certainly be limited
Source: TLG Analysis; MNRE, EPPO, SEDA, EMA, DoE, WWF, RUPTL, News Announcements
573
322
190
129
8650
3210 0
0
100
200
300
400
500
600
700
Malaysia Thailand Philippines Indonesia Singapore Myanmar Laos Cambodia Vietnam
2017 - 2018
573
322
0
190
50
12986
1032
544
671
847
287
380
200167
10067
0
100
200
300
400
500
600
700
800
900
Malaysia Thailand Vietnam Philippines Myanmar Indonesia Singapore Cambodia Laos
2017 - 2018 2019 - 2020
21
MW
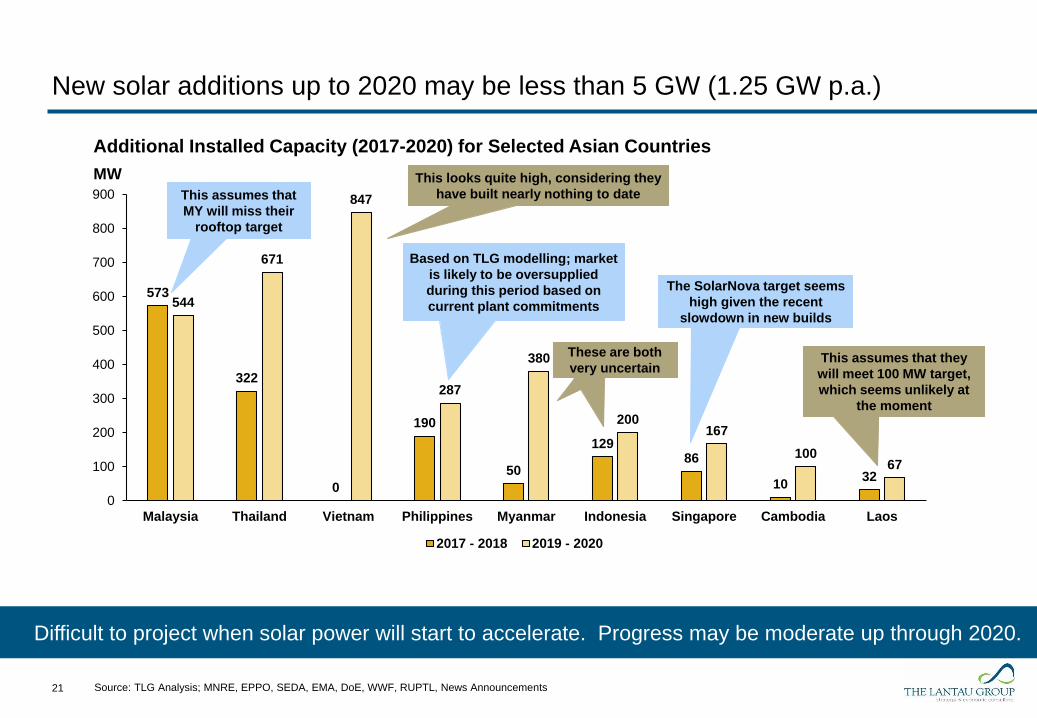
Additional Installed Capacity (2017-2020) for Selected Asian Countries
New solar additions up to 2020 may be less than 5 GW (1.25 GW p.a.)
This assumes that
MY will miss their
rooftop target
This looks quite high, considering they
have built nearly nothing to date
Based on TLG modelling; market
is likely to be oversupplied
during this period based on
current plant commitments
These are both
very uncertain
Source: TLG Analysis; MNRE, EPPO, SEDA, EMA, DoE, WWF, RUPTL, News Announcements
Difficult to project when solar power will start to accelerate. Progress may be moderate up through 2020.
The SolarNova target seems
high given the recent
slowdown in new builds
This assumes that they
will meet 100 MW target,
which seems unlikely at
the moment

167
5
0
20
40
60
80
100
120
140
160
180
China ASEAN
22
GW
MW
Additional Installed Capacity (2017-2020) for Selected Asian Countries
Compared to China capacity additions
China just adjusted (!) its 2020 solar target from >110GW to >240GW
Source: TLG Analysis; National Bureau of Statistics of China, MNRE, EPPO, SEDA, EMA, DoE, WWF, RUPTL, News Announcements
1,117
993
847
477430
329253
110 99
0
200
400
600
800
1,000
1,200

2016 global solar power snapshot
Solar power in SE Asia – The numbers
Impact of regulations
Fundamentals will drive growth
1
2
3
4
Overview
23

The lack of effective policies and regulations for solar is region-wide – both
across SE Asia region and across the regulatory framework
Thailand
- SE Asia leader in solar power – but
changing regulations have slowed
progress
- 2016 round of solar project awards was
not a success
- New round of solar bids in 2017 was
scaled down, and details unclear for a
new biomass program hybrid
Vietnam
- New Solar FiT in 2017 of $93.50/MWh
- Template PPA still not finalized
- Rooftop net metering scheme announced in 2017, but
detailed regulations still outstanding
- Financeability issues – draft PPA, EVN credit, FX
availability
Philippines
- FiT quotas for solar projects announced in
2014 were filled in 2015. No plans for new
FiT quotas
- Developers without quotas sitting on
“stranded” development projects
- But deregulated power market provides
options for non-FiT projects
Indonesia
- No utility-scale solar project in
operation
- 3 sets of regulations in 12 months
- Up to recently no template PPA, or even
structured solar program
Malaysia
- Current SE Asia exception.
- FiT program phases-out
- Solar replaced by bidding and net metering
- 450 MW auction in 2016
- 460 MW auction in 2017
- Net metering 1000 MW through 2020
Minor Mekong
- No FiT or developed RE schemes
- PPAs negotiated on ad hoc basis. Few
have been signed, and often
progress/schedule is uncertain
24
Source: TLG Analysis; Multiple sources
Template
PPA
Curtailment
/Deemed
Generation
FiTAuction /
Tender
Purchase/
Generation
Obligation
Rooftop
Exports
T&D
Access/
Pricing
Peak
Pricing
Philippines N/A
Vietnam
Indonesia
Malaysia
Thailand
Singapore
China
India
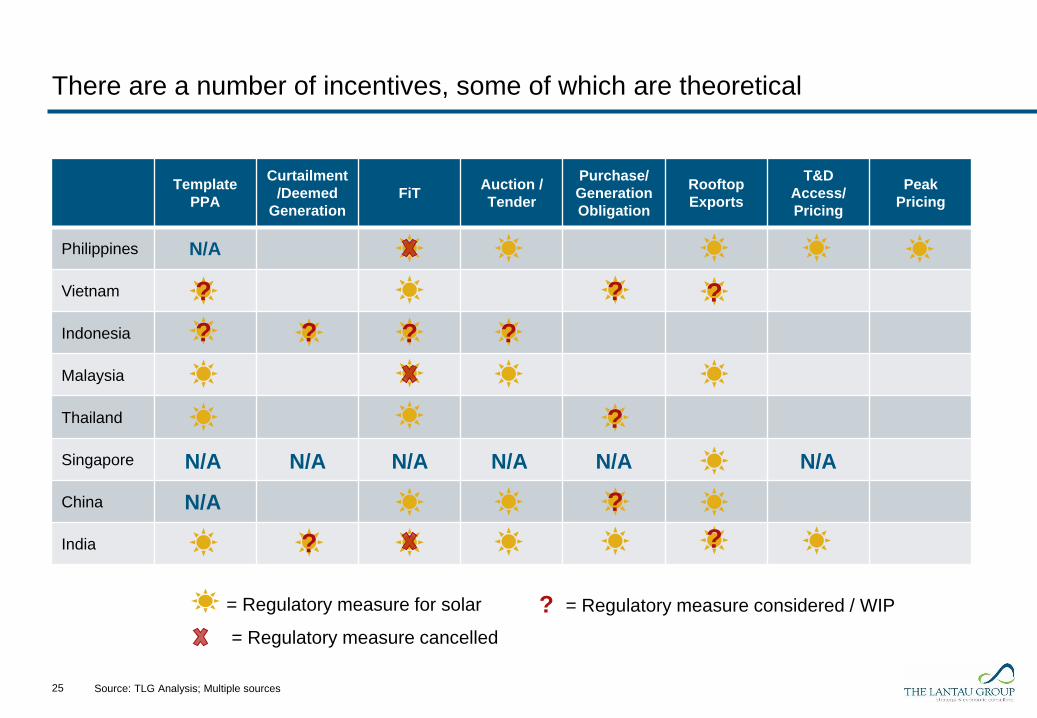
There are a number of incentives, some of which are theoretical
25
? ? ?
? ? ? ?
N/A N/A N/A N/A N/A N/A
N/A
?
?
?
?
= Regulatory measure for solar = Regulatory measure considered / WIP?
= Regulatory measure cancelled
Source: TLG Analysis; Multiple sources

Solar FiT (and other tariffs) vary considerably – but the level of the tariffs are
only part of the story
26
Competitively Bid Tariff / Negotiated PPA TariffUS₵/kWh
BPP sets solar tariff cap and varies by
location. (National average is shown
as the lower bound).
New FiT H2 2017
THB 4.12/kWh;
Down from THB
5.66/kWh
Top Runner Auction
(RMB 0.45/kWh)
2017 Solar
tender
(MYR .34/kWh)
Announced in H1 2017
(VND 2,086/kWh)
May 2017
Rajasthan 500 MW
(INR 2.44/kWh)
Why is the Indian solar power program a success while the solar FiT is essentially irrelevant?
Recent Meralco solar
CSP of 3.5 PhP/kWh
received successful
Swiss challenge at
lower rate
Source: TLG Analysis; CERC, PLN, Global Climate Scope, SEDA, News Announcements
2016 Solar PSAs with
Meralco proposed at
4.69 & 5.39 PhP/kWh
Focusing only “Renewables Regulations” may mean missing the
forest for the trees.
Weak renewables regulations is only part of the regulatory problem for solar and
wind power in SE Asia. Broader industry regulations are often road blocks in the
way of commercial drivers for solar and wind power.
27

Subsidized end-user tariffs are a major roadblock to generation investment –
for renewables or indeed for any type of generation
• Electricity prices are highly politicized in many SE Asia countries, with high prices deemed to risk
economic growth and contribute to political unrest
• Many countries lack transparent tariff regulations that mandate fair cost recovery
• Failure to set retail tariffs at compensatory levels has led to major subsidies across the region
(Philippines and Singapore being the notable exceptions)
• Large subsidies necessarily create a financially weak utility off-taker (e.g., PLN in Indonesia,
PVN in Vietnam), which creates issues with financing – particularly for small and numerous RE
projects
• Moreover, the fact that retail tariffs do not cover project costs creates a financial disincentive to
sign solar and wind PPAs where the FiT is (perceived) higher than the alternative (which is
usually coal) – as utilities lose money on all generation and lose more if the cost is higher
• Subsidized tariffs lessen any financial incentive for end users to adapt rooftop solar, since the
electricity cost savings are diminished by the subsidy
28

Ability of utility to pass through RE and other costs to end user tariffs varies –
and this matters!
29
Robust pass-through of RE costs
RE tariff adder to fund RE– but not sufficient
Limited cost pass-through support for RE
Thailand and Malaysia: Relatively successful
in implementing renewables. Off-taker has not
been a problem.
Indonesia: PLN lack incentives signing PPAs
where costs cannot be passed through. Look at
discrepancy in future solar capacity between
National energy plan (RUEN) and PLN’s
development plan (RUPTL) - 6.5GW vs <1GW in
2025Philippines: Lack of political will to
increase retail tariff or “RE adder”
Vietnam: EVN credit support is key issue

Rooftop solar could be an early driver for solar power in SE Asia – since utility
tariffs rather than wholesale costs set the implicit energy value
30
3.4
6.9 7.0 7.49.2 9.8 10.6 10.9 12.0 12.6
14.416.7
18.119.7 20.6 21.7 22.1 22.5
28.3
34.9
0
5
10
15
20
25
30
35
40
Lazard’s Rooftop
Solar LCOE
US₵/kWh
Residential Tariff Rooftop Solar LCOE (2016)
No FiT is required where tariffs are high enough, and it avoids financing and grid issues –
but only locations without subsidies would benefit
Residential Rates vs. Rooftop Solar LCOE
Source: Lazard LCOE 2016, TLG Analysis

Rooftop solar compensation mechanisms – Low hanging fruit that is
developing
31
Description
China
Rooftop power exports receive price above retail electricity tariff. Base
load wholesale tariff (varies by province), plus an additional 0.42 RMB/kWh
(US Cents 6-7/kWh)
India Depends on State
Thailand Self-use only at the moment; net metering regulations in progress
Philippines Self-use; exports to the grid receive displaced cost credit
Vietnam
New regulation provide for exports that receive credit to off-set consumption
(accounted for on an annual basis); Price for excess electricity to be
confirmed
Malaysia
Exports receive credit to off-set consumption (accounted for on a 24 month
basis); exported electricity compensated at displaced cost rate based on
customer voltage level
Indonesia N / A
Singapore
Differs for contestable and non-contestable customers:
- Contestable off-set own-use, and compensated at displaced cost
- Non-contestable off-set own-use, paid based on nodal prices for exports

Deregulation and electricity market reform can be the most
effective form of support for renewable energy
All of these can facilitate the entry of economic renewables, as seen in the Philippines
and Singapore
32

Deregulation and wholesale market reform supports investment in renewables
• In a pool market there are price signals for the value of power at different times of day.
In a deregulated electricity pool market, the price for electricity is higher when demand is
higher. In SE Asia, demand is high in the middle of the day when solar generation is high.
• Unbundling the traditional utility structure reduces conflict of interest. Reduced conflicts
of interest reduce investment risks associated with grid access, dispatch and curtailment.
• An open electricity market with many buyers takes away dependence on a single buyer
– particularly one controlled by the government. This reduces reliance on a government
guarantee of the off-taker and harnesses commercial incentives to pursue efficiencies.
• Corporate PPAs for renewables become easier. If third-party access to transmission is
available, generators and customers (or retailers) can efficiently contract for new capacity.
• Commercial developers are equal-opportunity investors. They can mobilize to develop
small-scale resources in ways that state-owned enterprises cannot (or, at least, do not).
33
Is the most effective regulatory mechanism for supporting growth
of renewable energy simply a workable wholesale market?

Average (2007-
2017) (PhP/kWh)Solar ‘Premium’
Generation-weighted Average Price (GWAP) 5.57 N/A
Load-weighted Average Price (LWAP) 4.24 31%
Time-weighted Average Price (TWAP) 3.92 42%
Note: * Approximate average prices; certain assumptions had to be made about ex-post WESM price
corrections; we used the solar profile of a ‘generic’ solar plant in Luzon to derive this GWAP
Source: TLG analysis; PEMC
Solar generation tends to be more valuable than the average unit of electricity
given its coincidence with high daytime demand; This value can be realised in
the WESM
34
PhP/kWh
Comparison of System Average and Solar Prices in the Luzon Grid (Jan 2007 – May 2017)*
0
2
4
6
8
10
12
14
16
Jan-07 Jan-08 Jan-09 Jan-10 Jan-11 Jan-12 Jan-13 Jan-14 Jan-15 Jan-16 Jan-17
Time-Average Load-weighted Generic Solar Time-Average Load-weighted Generic Solar

State-owned integrated utilities (e.g., EVN, PLN, EGAT, TNB) embody multiple
conflicts of interest that act to restrict investment in renewables
35
• Single Buyer –
– Big is beautiful – small RE projects are unlikely to receive Government
support
– Traditional thermal projects are favored because they are well understood
and cause fewer issues from a system standpoint
• Grid Operation –
– Renewables are often located far from load centers, and appropriate
network cost allocation principles are not well-developed – so utilities often
oppose RE projects because they must bear uncompensated network costs
– Renewables compete with utility generation, so utilities have an incentive to
block access
• System Operation –
– Combined role as generator and system operator creates natural incentive
to skew dispatch toward traditional thermal resources
– Natural conservatism of system operators – combined with the inherent
intermittency of renewables – gives them an excuse to keep thermal units
running for “stability” reasons
IU – SINGLE
WHOLESALE BUYER
& SELLER
IU - SYSTEM
OPERATION
IU - GENERATION
IU – GRID
OPERATION
IU – RETAILER
Integrated UtilityMultiple Roles / Same Entity
In some SE Asia markets curtailment risk is a major financing issue for solar projectsAnd that is before curtailment has occurred, and before there is any projects are in operation
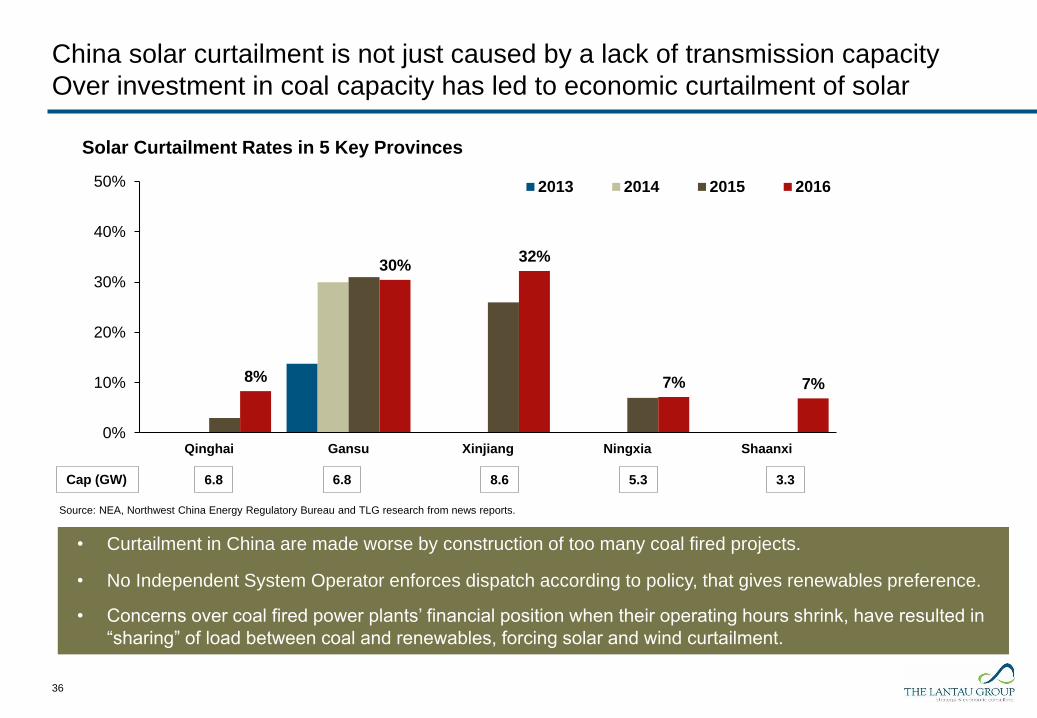
36
Solar Curtailment Rates in 5 Key Provinces
Source: NEA, Northwest China Energy Regulatory Bureau and TLG research from news reports.
8%
30%32%
7% 7%
0%
10%
20%
30%
40%
50%
Qinghai Gansu Xinjiang Ningxia Shaanxi
2013 2014 2015 2016
Cap (GW) 6.8 6.8 8.6 5.3 3.3
China solar curtailment is not just caused by a lack of transmission capacity
Over investment in coal capacity has led to economic curtailment of solar
• Curtailment in China are made worse by construction of too many coal fired projects.
• No Independent System Operator enforces dispatch according to policy, that gives renewables preference.
• Concerns over coal fired power plants’ financial position when their operating hours shrink, have resulted in
“sharing” of load between coal and renewables, forcing solar and wind curtailment.

Negros-Panay in the Philippines - Solar genration squeezing existing generation
when System Operator adhered to priority dispatch for solar power
37
150
160
170
180
190
200
210
220
1 2 3 4 5 6 7 8 9 10 11 12 13 14 15 16 17 18 19 20 21 22 23 24
Average Hourly Geothermal
Generation in NegrosMW
Average Solar Generation Profile: Negros
vs. Cebu (Q1 2017, rebased)MW
• Nearly 300 MW of solar power entered the Negros grid in March and April of 2016, adding to
existing 50 MW of installed solar power.
• Peak demand was only 314 MW in 2016
• The load profile for existing coal and geothermal generation changed dramatically, because of
solar genration preferred dispatch
• Even inexpensive and clean geothermal power had to ramp down during solar hours
Q2 2015
Q2 20170%
10%
20%
30%
40%
50%
60%
70%
80%
90%
100%
1 2 3 4 5 6 7 8 9 10 11 12 13 14 15 16 17 18 19 20 21 22 23 24
Pro
port
ion o
f m
ax.
dis
patc
h
Cebu Negros

2016 global solar power snapshot
Solar power in SE Asia – The numbers
Impact of regulations
Fundamentals will drive growth
1
2
3
4
Overview
38
Fundamentals and economics will drive solar and wind growth in
SE Asia
…eventually
39
Death and taxes are not the only things that are certain in the future.
More solar and wind power in SE Asia is inevitable. .

Southeast Asia is blessed with generally good solar resources
40
So
urc
e: W
orld
Ba
nk G
lob
al S
ola
r Atla
s
SE Asian solar resources are not on a par with those in the GCC states or Rajasthan in India
But they are better than South / East China

In much of SE Asia, peak solar output overlaps hours of peak demand
41
• Graph shows demand and solar resource profile for Luzon Philippines. Similar profiles exist
in most markets in Southeast Asia..
Hourly Solar Generation Profile and Alignment with Luzon Demand (2016)
0
2
4
6
8
10
0%
20%
40%
60%
80%
100%
1 3 5 7 9 11 13 15 17 19 21 23
Average Hourly Load
Average Hourly SolarCF
GW
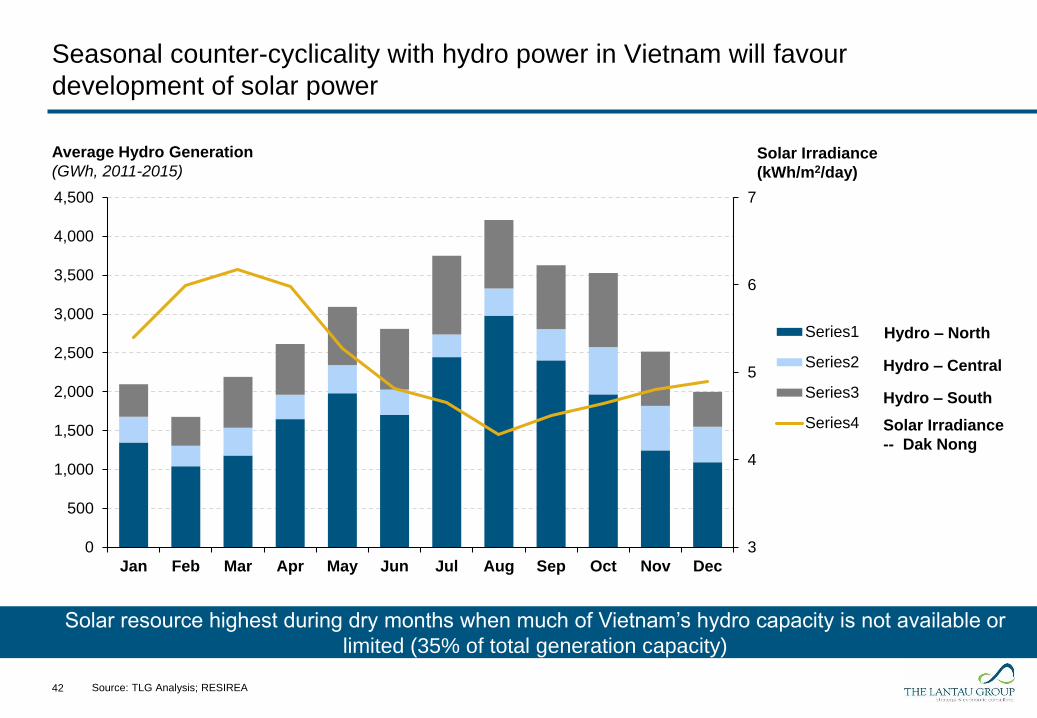
Seasonal counter-cyclicality with hydro power in Vietnam will favour
development of solar power
42 Source: TLG Analysis; RESIREA
3
4
5
6
7
0
500
1,000
1,500
2,000
2,500
3,000
3,500
4,000
4,500
Jan Feb Mar Apr May Jun Jul Aug Sep Oct Nov Dec
Series1
Series2
Series3
Series4
Solar Irradiance
(kWh/m2/day)
Average Hydro Generation
(GWh, 2011-2015)
Solar Irradiance
-- Dak Nong
Hydro – North
Hydro – Central
Hydro – South
Solar resource highest during dry months when much of Vietnam’s hydro capacity is not available or
limited (35% of total generation capacity)
0
2,000
4,000
6,000
8,000
10,000
12,000
14,000
Vietnam Indonesia Thailand Myanmar Laos
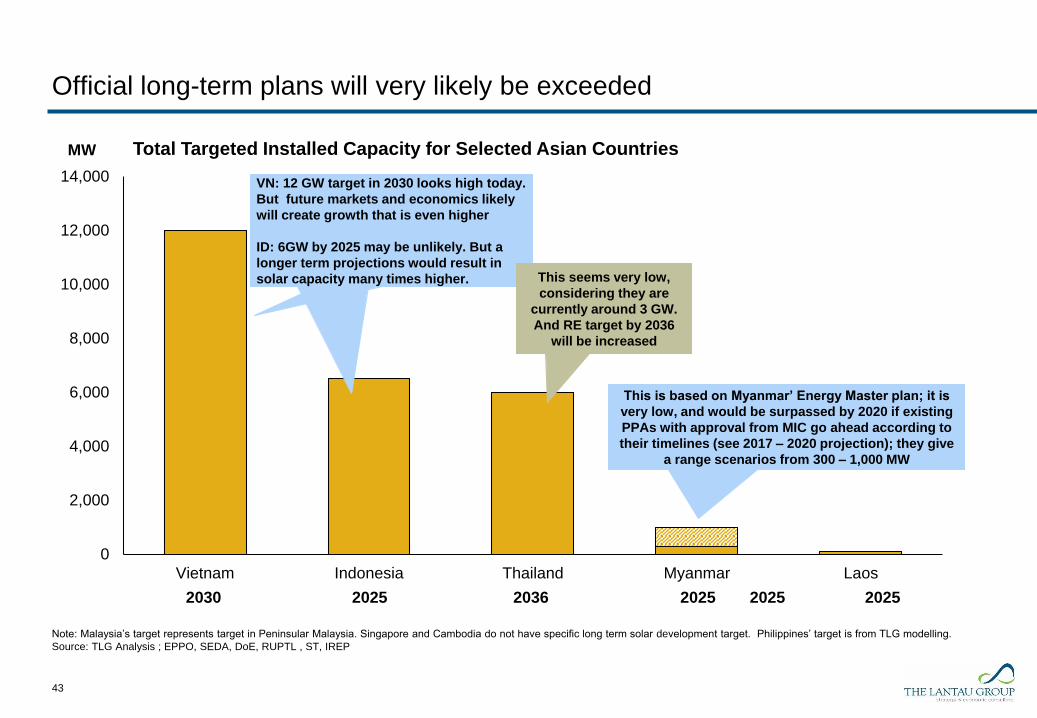
Official long-term plans will very likely be exceeded
43
MW
2030 2036 2025 202520252025
Note: Malaysia’s target represents target in Peninsular Malaysia. Singapore and Cambodia do not have specific long term solar development target. Philippines’ target is from TLG modelling.
Source: TLG Analysis ; EPPO, SEDA, DoE, RUPTL , ST, IREP
Total Targeted Installed Capacity for Selected Asian Countries
This is based on Myanmar’ Energy Master plan; it is
very low, and would be surpassed by 2020 if existing
PPAs with approval from MIC go ahead according to
their timelines (see 2017 – 2020 projection); they give
a range scenarios from 300 – 1,000 MW
VN: 12 GW target in 2030 looks high today.
But future markets and economics likely
will create growth that is even higher
ID: 6GW by 2025 may be unlikely. But a
longer term projections would result in
solar capacity many times higher. This seems very low,
considering they are
currently around 3 GW.
And RE target by 2036
will be increased

Average (2007-
2017) (PhP/kWh)Solar ‘Premium’
Generation-weighted Average Price (GWAP) 5.57 N/A
Load-weighted Average Price (LWAP) 4.24 31%
Time-weighted Average Price (TWAP) 3.92 42%
Note: * Approximate average prices; certain assumptions had to be made about ex-post WESM price
corrections; we used the solar profile of a ‘generic’ solar plant in Luzon to derive this GWAP
Source: TLG analysis; PEMC
Solar generation tends to be more valuable than the average unit of electricity
given its coincidence with high daytime demand; This value can be realised in the
WESM
44
PhP/kWh
Comparison of System Average and Solar Prices in the Luzon Grid (Jan 2007 – May 2017)*
0
2
4
6
8
10
12
14
16
Jan-07 Jan-08 Jan-09 Jan-10 Jan-11 Jan-12 Jan-13 Jan-14 Jan-15 Jan-16 Jan-17
Time-Average Load-weighted Generic Solar Time-Average Load-weighted Generic Solar

477
1,740
1,305
0
400
800
1,200
1,600
2,000
2017 - 2020 2021 - 2025 2026 - 2030
On pure economics (without specific regulatory support) solar power in the Philippines
will represent the second biggest source of new capacity through 2030
45
MW
Indicative Analysis of Projected Solar and Coal New Build in the WESM (2017 – 2030)*
Note: *This is according to what we judge to be a reasonable base case, which we ran on our in-house QUAFU model
Sources: TLG Analysis
Over 3.5 GW are built in the WESM between
2017 – 2030 in this case, only 185 MW of
which we have treated as ‘committed.’ The
rest is build on an economic basis
3,045
4,533
0
1,000
2,000
3,000
4,000
5,000
Solar Additions(2021 - 2030)
Coal Additions(2021 - 2030)
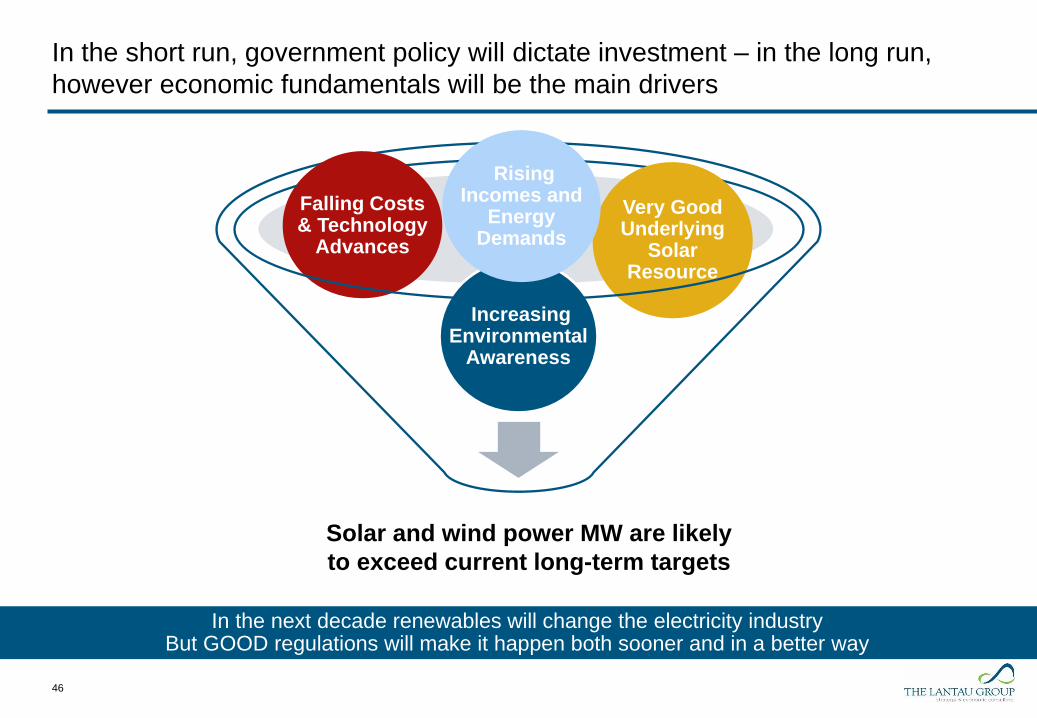
46
Solar and wind power MW are likely
to exceed current long-term targets
Increasing Environmental
Awareness
Falling Costs & Technology
Advances
Very Good Underlying
Solar Resource
Rising Incomes and
Energy Demands
In the short run, government policy will dictate investment – in the long run,
however economic fundamentals will be the main drivers
In the next decade renewables will change the electricity industryBut GOOD regulations will make it happen both sooner and in a better way

Missing in Southeast Asia - Long-term consistent government policies that
support continuous project opportunities over time can reduce costs and lessen
overall investment risks
47
Moreover, reliance on market mechanisms (i.e., auctions) unambiguously yields greater efficiency benefits
Attract more competition and support global best practices
Build local expertise
Contribute to developing economies
of scale
Yield less uncertainty and fewer
unanswered questions

Indian solar auctions: The world’s best worst best case study - rapidly falling
costs (but too fast?)
Apr 2016 4.32
Feb 2017 3.30
April 2017 3.15
May 2017 2.62
May 2017 2.44
48
• Indian solar tariffs declines of >40 %
• Irrational exuberance has played a role
• But a large part of the price decline is
due to falling solar prices in combination
with multiple auctions
• These results would have been
unthinkable two years ago

Final remarks
• Long term solar power will be grow
• But when is long term? By 2020? By 2024? It is hard to project when the “worm turns” and
additions of solar power accelerates.
• But when momentum changes the rate of new solar capacity likely will increase very quickly
(e.g. India, Australia, Mexico)
• Regulations will be important for short term potential for solar power, and help build
momentum.
• “Overbuild” of thermal generation may delay entry of renewals – despite economic rationale
• Vietnam planning for 10-15 GW in only 2-3 years
• Philippines over supply until 2020-2022
• Indonesia plans for coal generation have changed
49

50
Rigour
Value
Insight
EnergyPower UtilitiesFor more information please contact us:
Stefan Robertsson
+852 2521 5501 (office)
www.lantaugroup.com
www.lantaugroup.com
The Lantau Group (HK) Limited
4602-4606 Tower 1, Metroplaza
223 Hing Fong Road
Kwai Fong, Hong Kong
Tel: +852 2521 5501
Thank you!
Related Documents