World Energy Outlook Special Report ENERGY OUTLOOK ASIA SOUTHEAST

Welcome message from author
This document is posted to help you gain knowledge. Please leave a comment to let me know what you think about it! Share it to your friends and learn new things together.
Transcript
World Energy Outlook Special Report
ENERGY OUTLOOK ASIA
SOUTHEAST

For more information, and the free download of this report, please visit: www.worldenergyoutlook.org
The ten members of the Association of Southeast Asian Nations (ASEAN) – along with China and India – are shifting the centre of gravity of the global energy system towards Asia.
Energy demand in Southeast Asia has expanded by two-and- a-half times since 1990, its rate of growth among the fastest in the world. Economic and demographic trends point to further growth, lifting the region’s energy use per capita from just half of the global average today. But how will Southeast Asia’s fuel mix evolve? And what will the region’s supply and demand balance mean for oil, gas and coal trade?
The International Energy Agency, in co-operation with the Economic Research Institute for ASEAN and East Asia, has studied these issues in consultation with ASEAN member governments and leading commentators, industry representatives and international experts. This special report, in the World Energy Outlook series, presents the findings.
The report highlights:
� Trends in domestic energy needs and supply prospects, including the status of fossil-fuel subsidies and energy access.
� The central role that coal is set to play in fuelling the region’s power sector.
� Implications for energy trade and energy-import bills.
� The level of investment needed to expand energy-supply infrastructure.
� The substantial energy security, economic and environmental gains possible if the region were to realise a “high efficiency scenario”.
World Energy Outlook Special Report
SOUTHEAST ASIA ENERGY OUTLOOK

ENERGY OUTLOOK ASIA
SOUTHEAST
World Energy Outlook Special ReportSeptember 2013

INTERNATIONAL ENERGY AGENCY
The International Energy Agency (IEA), an autonomous agency, was established in November 1974. Its primary mandate was – and is – two-fold: to promote energy security amongst its member
countries through collective response to physical disruptions in oil supply, and provide authoritative research and analysis on ways to ensure reliable, affordable and clean energy for its 28 member countries and beyond. The IEA carries out a comprehensive programme of energy co-operation among its member countries, each of which is obliged to hold oil stocks equivalent to 90 days of its net imports. The Agency’s aims include the following objectives:
n Secure member countries’ access to reliable and ample supplies of all forms of energy; in particular, through maintaining effective emergency response capabilities in case of oil supply disruptions.
n Promote sustainable energy policies that spur economic growth and environmental protection in a global context – particularly in terms of reducing greenhouse-gas emissions that contribute to climate change.
n Improve transparency of international markets through collection and analysis of energy data.
n Support global collaboration on energy technology to secure future energy supplies and mitigate their environmental impact, including through improved energy
efficiency and development and deployment of low-carbon technologies.
n Find solutions to global energy challenges through engagement and dialogue with non-member countries, industry, international
organisations and other stakeholders.IEA member countries:
Australia Austria
Belgium Canada
Czech RepublicDenmark
FinlandFrance
GermanyGreece
HungaryIreland
ItalyJapan
Korea (Republic of)LuxembourgNetherlandsNew Zealand NorwayPolandPortugalSlovak RepublicSpainSwedenSwitzerlandTurkeyUnited Kingdom
United States
The European Commission also participates in
the work of the IEA.
© OECD/IEA, 2013International Energy Agency
9 rue de la Fédération 75739 Paris Cedex 15, France
www.iea.org
Please note that this publication is subject to specific restrictions
that limit its use and distribution. The terms and conditions are available online at
http://www.iea.org/termsandconditionsuseandcopyright/

Foreword 3
Foreword
As countries in Southeast Asia become larger energy consumers and growing participants in global energy markets, their governments will be increasingly confronted by challenges similar to those faced by IEA member countries. Energy security promises to become an elevated priority as reliance on oil imports rises across the region. So too does the need to ensure that energy supplies are affordable, in order to support continued economic growth and development. And removing barriers to energy efficiency and cleaner sources of energy also looks set to become a major imperative, especially in the context of the region’s fast-rising energy demand, the expanding role of coal in its energy mix and its growing urban population.
Engagement between countries in Southeast Asia and the IEA can help to address these common challenges. The IEA is striving to build fruitful working relationships with countries beyond its membership, co-operating on a wide range of activities, from technical workshops on topics such as emergency response policies to statistical training and capacity building exercises. Engagement is an integral part of our efforts to provide all stakeholders with a truly global view of the world’s energy system.
This report comes in response to the discussions during the Sixth East Asia Summit Energy Ministers’ Meeting in Cambodia in September 2012. Dr. Fatih Birol and his team in the IEA’s Directorate of Global Energy Economics have again met our high expectations. Throughout the process of preparing this analysis, they received valuable input from experts across the region, building on the productive relationship that the IEA already has with countries in Southeast Asia, as well as from our partners in the Economic Research Institute for ASEAN and East Asia (ERIA).
It is my hope that the report provides policy makers, industry and the general public throughout the entire region with the data, analysis and insights they need to make sound judgements about their energy future.
Maria van der Hoeven Executive Director
International Energy Agency
© O
ECD
/IEA
, 201
3

© O
ECD
/IEA
, 201
3

Acknowledgements 5
Acknowledgements
This report was prepared by the Directorate of Global Energy Economics (GEE) of the International Energy Agency (IEA). It was designed and directed by Fatih Birol, Chief Economist of the IEA. The analysis was co-ordinated by Amos Bromhead, Shigetoshi Ikeyama, Alessandro Blasi and Matthew Frank. Principal contributors to the report were Soo-Il Kim, Catur Kurniadi, Jung Woo Lee and Shigeru Suehiro. Other key contributors were Marco Baroni, Christian Besson, Laura Cozzi, Ian Cronshaw, Timur Gül, Fabian Kęsicki, Florian Kitt, Chiara Marricchi, Uğur Öcal, Paweł Olejarnik, Yerim Park, Katrin Schaber, Nora Selmet, Johannes Trüby, Ming Wan, David Wilkinson and Shuwei Zhang. Sandra Mooney and Magdalena Sanocka provided essential support.
Debra Justus carried editorial responsibility.
The report benefited from valuable inputs, comments and feedback from other experts within the IEA, including Keisuke Sadamori, Cecilia Tam and Laszlo Varro. Thanks also go to the Agency’s Communication and Information Office for their help in producing the report and to Bertrand Sadin and Anne Mayne for graphics.
We appreciate the support and co-operation provided by organisations and individuals including the Economic Research Institute for ASEAN and East Asia (ERIA), Shigeru Kimura and members of the Working Group for Analysis of Energy Saving Potential in East Asia under ERIA. Special thanks also go to the Ministry of Energy, Thailand and the Ministry of Economy, Trade and Industry (METI), Japan, and the Asia Development Bank (ADB) for their input throughout the study.
This report was prepared in response to discussions by Ministers gathered at the Sixth East Asia Summit Energy Ministers Meeting on 12 September 2012, in Phnom Penh, Cambodia.
A high-level workshop organised by the IEA and the Ministry of Energy, Thailand was held on 7 May 2013 in Bangkok to gather essential input to this study. The workshop participants have contributed valuable new insights, feedback and data for this analysis. More details can be found at www.worldenergyoutlook.org/aboutweo/workshops.
Many experts from outside of the IEA provided input, commented on the underlying analytical work and reviewed the report. Their comments and suggestions were of great value. They include:
Aznan Ariffin Tenaga Nasional Berhad, Malaysia
Victorino Bala ASCOPE, Philippines
Nguyen Minh Bao Institute of Energy, Vietnam
Milou Beerepoot King Monkut's University of Technology Thonburi, Thailand
Haji Jamain Bin Haji Julaihi Prime Minister’s Office, Brunei
Luigi Ciarrocchi Eni
Atena Falahti Ministry of Energy and Mineral Resources, Indonesia
Kazunari Fukui GE Power & Water, Singapore
Jonathan Goh Kok Chye Energy Market Authority, Singapore
© O
ECD
/IEA
, 201
3

6 World Energy Outlook | Special Report
Phoumin Han ERIA, Indonesia
Hitoshi Hayashi Toyota Motor Corporation, Japan
Masazumi Hirono The Japan Gas Association
Cao Quoc Hung Ministry of Industry and Trade, Vietnam
Fatimah Ismail PETRONAS, Malaysia
Brett Jacobs ERIA, Indonesia
Anthony Jude Asian Development Bank, Philippines
Sarawut Kaewtathip Ministry of Energy, Thailand
Shigeru Kimura The Institute of Energy Economics, Japan
Khamso Kouphokham Ministry of Energy and Mines, Lao PDR
Ken Koyama The Institute of Energy Economics, Japan
Allan Loi Energy Studies Institute, Singapore
Markus Lorenzini Siemens, Indonesia
Cecilya Laksmiwati Malik Energy Policy Planning Expert, Indonesia
Mitsuo Matsumoto ERIA, Indonesia
Larry Metzroth ArchCoal, Singapore
Asrul Sany Mohammad Ali Prime Minister's Office, Brunei
Lilibeth Morales Department of Energy, Philippines
Tin Zaw Myint Ministry of Energy, Myanmar
Intan Nahariah Yacoob PETRONAS, Malaysia
Hironori Nakanishi Ministry of Economy, Trade and Industry, Japan
Supit Padprem Ministry of Energy, Thailand
Daovong Phonekeo Ministry of Energy and Mines, Lao PDR
Djoko Prasetyo PLN, Indonesia
Carlo Russo Eni, Indonesia
Jesus Tamang Department of Energy, Philippines
Nobuo Tanaka The Institute of Energy Economics, Japan and former IEA Executive Director
Loo Took Gee Ministry of Energy, Green Technology and Water, Malaysia
Pe Zin Tun Ministry of Energy, Myanmar
Maria Vagliasindi World Bank, United States
Duncan Van Bergen Shell, Singapore
Lieng Vuthy Ministry Of Industry, Mines And Energy, Cambodia
Jacob Williams Peabody Energy, United States
Hisashi Yoshikawa University of Tokyo, Japan
Zaharin Zulkifli Energy Commission, Malaysia
The individuals and organisations that contributed to this study are not responsible for any opinions or judgements it contains. All errors and omissions are solely the responsibility of the IEA.
This publication has been produced under the authority of the Executive Director of the International Energy Agency. The views expressed do not necessarily reflect the views or policies of individual IEA member countries.
© O
ECD
/IEA
, 201
3
Acknowledgements 7
Comments and questions are welcome and should be addressed to:
Dr. Fatih Birol Chief Economist Director, Directorate of Global Energy Economics International Energy Agency 9, rue de la Fédération 75739 Paris Cedex 15 France
Telephone: (33-1) 4057 6670 Email: [email protected]
More information about the World Energy Outlook is available at www.worldenergyoutlook.org.
© O
ECD
/IEA
, 201
3

© O
ECD
/IEA
, 201
3
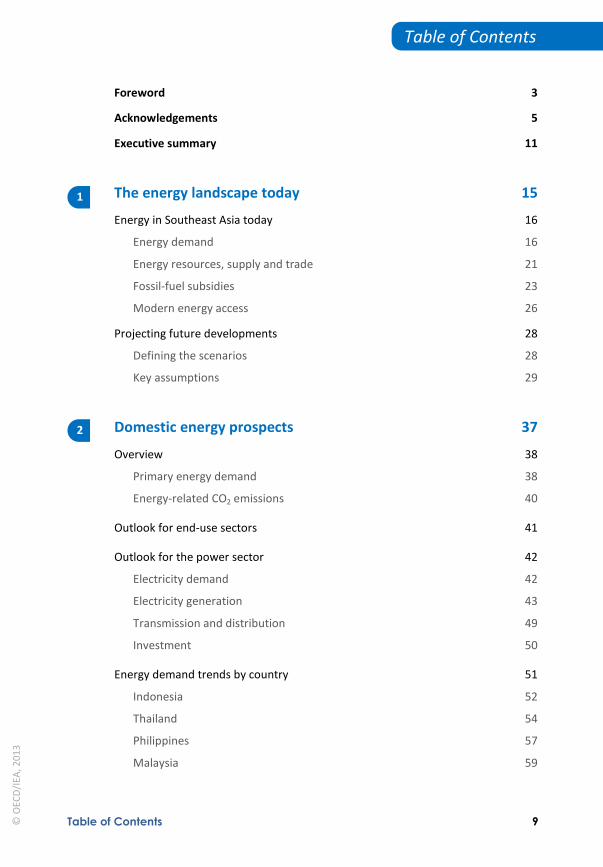
Table of Contents 9
Table of Contents
Foreword 3
Acknowledgements 5
Executive summary 11
The energy landscape today 15
Energy in Southeast Asia today 16
Energy demand 16
Energy resources, supply and trade 21
Fossil-fuel subsidies 23
Modern energy access 26
Projecting future developments 28
Defining the scenarios 28
Key assumptions 29
Domestic energy prospects 37
Overview 38
Primary energy demand 38
Energy-related CO2 emissions 40
Outlook for end-use sectors 41
Outlook for the power sector 42
Electricity demand 42
Electricity generation 43
Transmission and distribution 49
Investment 50
Energy demand trends by country 51
Indonesia 52
Thailand 54
Philippines 57
Malaysia 59
1
2
© O
ECD
/IEA
, 201
3
10 World Energy Outlook | Special Report
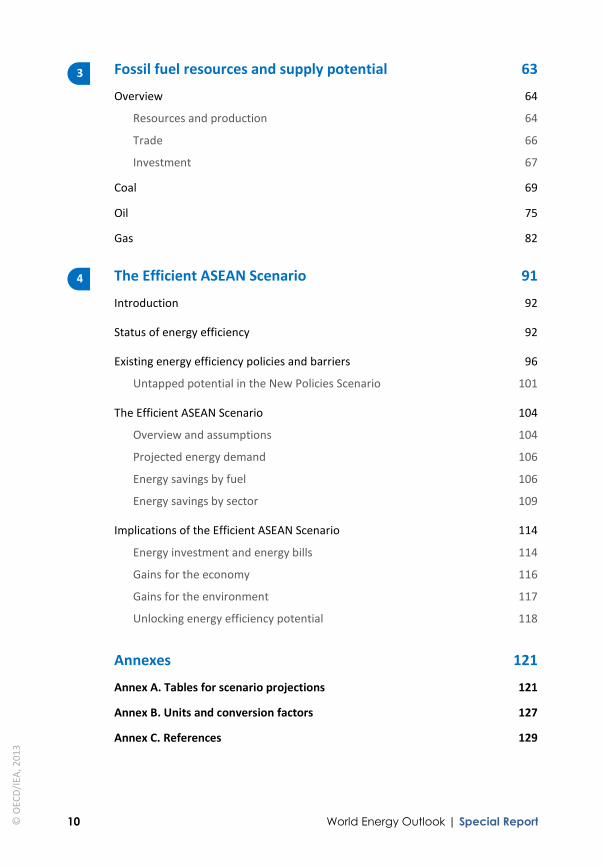
Fossil fuel resources and supply potential 63
Overview 64
Resources and production 64
Trade 66
Investment 67
Coal 69
Oil 75
Gas 82
The Efficient ASEAN Scenario 91
Introduction 92
Status of energy efficiency 92
Existing energy efficiency policies and barriers 96
Untapped potential in the New Policies Scenario 101
The Efficient ASEAN Scenario 104
Overview and assumptions 104
Projected energy demand 106
Energy savings by fuel 106
Energy savings by sector 109
Implications of the Efficient ASEAN Scenario 114
Energy investment and energy bills 114
Gains for the economy 116
Gains for the environment 117
Unlocking energy efficiency potential 118
Annexes 121
Annex A. Tables for scenario projections 121
Annex B. Units and conversion factors 127
Annex C. References 129
3
4
© O
ECD
/IEA
, 201
3

Executive Summary 11
Executive Summary
The ten members of the Association of Southeast Asian Nations (ASEAN) are – along with China and India – shifting the centre of gravity of the global energy system to Asia.1 Southeast Asia is an extremely diverse set of countries with vast differences in the scale and patterns of energy use and energy resource endowments. Since 1990, the region’s energy demand has expanded two-and-a-half times. The fundamentals suggest that considerable further growth in demand can be expected, especially considering that per-capita energy use of its 600 million inhabitants is still very low, at just half of the global average. This special report, in the World Energy Outlook series, assesses the prospects for Southeast Asia’s energy future as well as the implications for regional and global energy markets and policy making.
Southeast Asia’s energy demand increases by over 80% between today and 2035, a rise equivalent to current demand in Japan. This supports a near tripling of the region’s economy and a population that expands by almost one-quarter. In the New Policies Scenario, the central scenario, oil demand rises from 4.4 mb/d today to 6.8 mb/d in 2035, almost one-fifth of projected world growth. After having grown at double-digit rates each year since 1990, coal demand triples over 2011-2035, accounting for nearly 30% of global growth. Natural gas demand increases by 80% to 250 bcm. The share of renewables in the primary energy mix falls as rapidly increasing use of modern renewables – such as geothermal, hydro and wind – is offset by reduced use of traditional biomass for cooking. Southeast Asia’s energy-related CO2 emissions almost double, reaching 2.3 Gt in 2035.
The power sector is fundamental to the energy outlook for Southeast Asia, and within it coal emerges as the fuel of choice. Electricity generation between 2011 and 2035 increases by more than the current power output of India. Coal’s relative abundance and affordability in the region boosts its share of electricity generation from less than one-third today to almost one-half in 2035, mainly at the expense of natural gas and oil. This shift is already underway: some three-quarters of the thermal capacity now under construction is coal-fired. Deploying more efficient coal-fired power plants should be a major priority in the region – the average efficiency is currently just 34%, owing to the almost exclusive use of subcritical technologies. If the region’s coal-fired power plants were as efficient as those in Japan today, their fuel use would be one-fifth lower, alongside substantially reduced CO2 emissions and local air pollution.
Phasing out fossil-fuel subsidies and providing access to modern energy services remain unfinished business. Fossil-fuel subsidies amounted to $51 billion in Southeast Asia in 2012. Despite recent reform efforts, notably in Indonesia, Malaysia and Thailand, subsidies remain a significant factor distorting energy markets. They encourage wasteful energy use, burden government budgets, and deter investment in energy infrastructure and efficient technologies. More than 130 million people in Southeast Asia, or over one-fifth of the
1 In this report, ASEAN and Southeast Asia are used interchangeably to refer to Brunei Darussalam, Cambodia, Indonesia, Lao PDR, Malaysia, Myanmar, Philippines, Singapore, Thailand and Vietnam.
© O
ECD
/IEA
, 201
3
12 World Energy Outlook | Special Report
population, still lack access to electricity. While there is universal or very high levels of access to electricity in Brunei Darussalam, Malaysia, Thailand and Singapore, levels are below 75% in Cambodia, Myanmar, the Philippines and Indonesia. And almost half of the region’s population still relies on traditional use of biomass for cooking, which poses a serious risk of premature deaths from indoor air pollution.
Southeast Asia faces sharply increasing reliance on oil imports, which will impose high costs and leave it more vulnerable to potential disruptions. Decline in mature fields and limited large new prospects lead oil production across the region to fall by almost one-third in the period to 2035. As a result, Southeast Asia becomes the world’s fourth-largest oil importer, behind China, India and the European Union. Its oil import dependency almost doubles to 75%, as net imports rise from 1.9 mb/d to just over 5 mb/d. The region’s spending on net oil imports triples to almost $240 billion in 2035, equivalent to almost 4% of GDP. Thailand and Indonesia’s spending on net oil imports triples to nearly $70 billion each in 2035.
There will be a reduced surplus of natural gas and coal for export as production is increasingly diverted to domestic markets. Despite increasing gas production, Southeast Asia’s net gas exports, which come mainly from Indonesia, Malaysia, Myanmar and Brunei Darussalam, are cut from 62 bcm to 14 bcm in the period to 2035. The region’s net coal exports also decline after 2020 as regional demand outpaces indigenous production. Indonesia’s coal production rises by almost 90%, to 550 million tonnes of coal equivalent in 2035. It remains one of the world’s biggest coal producers and, by a very large margin, the top exporter of steam coal.
Developing policies to attract investment will be vital for enhancing energy security, affordability and sustainability. Around $1.7 trillion of cumulative investment in energy-supply infrastructure to 2035 is required in Southeast Asia, with almost 60% of the total in the power sector. Mobilising this will be challenging unless existing barriers are overcome: subsidised energy prices; under-developed energy transport networks; and the need for greater stability and consistency in the application of energy-related policies. Implementation of long-standing projects to interconnect markets, namely the ASEAN Power Grid and the Trans-ASEAN Gas Pipeline, can underpin more efficient exploitation of the region’s energy resources, while enhancing its collective energy security.
While Southeast Asia has made some gains in energy efficiency, almost three-quarters of its full economic potential is set to remain untapped in 2035. Removing barriers to energy efficiency deployment would deliver major energy savings. This is demonstrated in the Efficient ASEAN Scenario, which assumes the uptake of energy efficiency measures that are economically viable and have acceptable payback periods. Compared with the New Policies Scenario, energy demand is cut by almost 15% in 2035, an amount that exceeds Thailand’s current energy demand. Lower electricity demand and the use of more efficient power plants reduce coal demand by 25%. More efficient industrial equipment, stringent vehicle fuel-economy standards and the quicker phase-out of fossil-fuel subsidies drive demand reductions in oil (10%) and gas (11%).
© O
ECD
/IEA
, 201
3

Executive Summary 13
Improving energy efficiency would deliver major energy security, economic and environmental benefits. In the Efficient ASEAN Scenario, net oil imports are cut by around 700 kb/d in 2035, comparable with Malaysia’s current production, slashing oil-import bills by $30 billion. By the end of the period, net exports of natural gas are three-times higher (at 42 bcm) and of coal 50% higher (at 320 Mtce). An additional $330 billion in investment to improve end-use efficiency is required to realise these gains. In turn, this amount is more than offset by the resulting fuel cost savings, which total nearly $500 billion. Regional GDP is boosted by about 2% in 2035, as reduced spending on energy increases disposable income and stimulates activity elsewhere in the economy.
Unlocking Southeast Asia's energy efficiency potential requires government action to address a wide spectrum of barriers. The exact policy paths and measures will vary by country and by sector, but key priority areas include fuel-economy standards, more stringent building codes and energy performance standards for a wider range of products. Improving capacity and energy data collection are pre-requisites to effective energy efficiency policies and implementation. Realistic and measurable efficiency targets are needed, along with effective approaches to achieve them including mechanisms to monitor progress and make adjustments as needed. The affordability of energy efficiency also needs to be improved by eliminating market distortions, such as energy subsidies, and by increasing the availability of financing and incentives. Together these steps would help bring energy efficiency into the mainstream.
© O
ECD
/IEA
, 201
3

© O
ECD
/IEA
, 201
3

Chapter 1 | The energy landscape today 15
Chapter 1
The energy landscape today Where does Southeast Asia fit in the global energy picture?
Highl ights • The ten members of the Association of Southeast Asian Nations (ASEAN) – along
with China and India – are shifting the centre of gravity of the global energy system towards Asia. The region’s energy demand has risen two-and-a-half times since 1990 and is now equivalent to around three-quarters of the energy demand of India.
• Vast differences exist in the scale and patterns of energy use among and within the ASEAN member states. Oil is the dominant fuel, with demand currently around 4.4 mb/d, followed by natural gas, at 141 bcm. Coal use has grown at double-digit rates since 1990 and now makes up 16% of primary demand. The share of renewables in the primary mix is almost twice the global average at 24%, reflecting heavy reliance on traditional biomass used for cooking in rural areas where low incomes and/or a lack of access restrict the use of modern fuels.
• Compared with some of its neighbours, Southeast Asia is relatively well-endowed with energy resources, although they are unevenly distributed and often far from centres of demand. Currently, it is an exporter in net energy-equivalent terms, as exports of coal (220 Mtce), natural gas (62 bcm) and biofuels more than offset net imports of oil (1.9 mb/d). Indonesia is by far the dominant producer, having greatly increased its coal output and exports in the last decade.
• Fossil-fuel subsidy reform remains a challenge in Southeast Asia, although progress is being made. Subsidies amounted to $51 billion in 2012 and are deterring investment in needed energy infrastructure, while hampering improvements in energy efficiency and renewables deployment. Energy access is another key challenge: 134 million people in the region – more than one-fifth of the total population – lack access to electricity.
• Energy policy across Southeast Asia varies considerably, reflecting differences in political direction, economic development and natural resource endowments. Common themes include enhancing energy security, ensuring energy affordability and improving energy efficiency.
• Southeast Asia’s energy future depends on the interplay of multiple factors, including demographics, economics, pricing, technology and policy. This Outlook presents two scenarios: the New Policies Scenario incorporates existing policies and the cautious implementation of recent announcements; the Efficient ASEAN Scenario assumes the adoption of best available technologies and practices to improve energy efficiency driven by economic and environmental gains.
© O
ECD
/IEA
, 201
3
16 World Energy Outlook | Special Report
Energy in Southeast Asia today
Energy demand
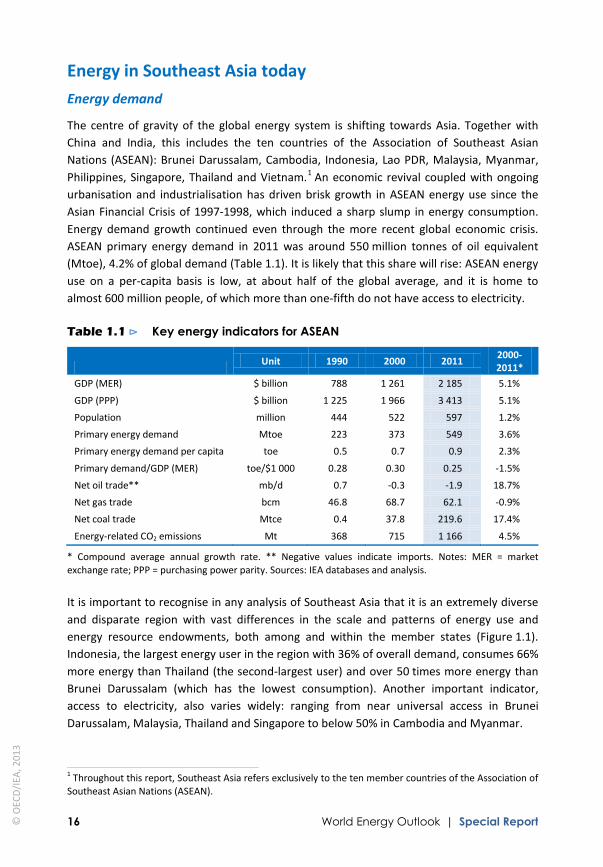
The centre of gravity of the global energy system is shifting towards Asia. Together with China and India, this includes the ten countries of the Association of Southeast Asian Nations (ASEAN): Brunei Darussalam, Cambodia, Indonesia, Lao PDR, Malaysia, Myanmar, Philippines, Singapore, Thailand and Vietnam.1 An economic revival coupled with ongoing urbanisation and industrialisation has driven brisk growth in ASEAN energy use since the Asian Financial Crisis of 1997-1998, which induced a sharp slump in energy consumption. Energy demand growth continued even through the more recent global economic crisis. ASEAN primary energy demand in 2011 was around 550 million tonnes of oil equivalent (Mtoe), 4.2% of global demand (Table 1.1). It is likely that this share will rise: ASEAN energy use on a per-capita basis is low, at about half of the global average, and it is home to almost 600 million people, of which more than one-fifth do not have access to electricity.
Table 1.1 ⊳ Key energy indicators for ASEAN
Unit 1990 2000 2011
2000- 2011*
GDP (MER) $ billion 788 1 261 2 185 5.1%
GDP (PPP) $ billion 1 225 1 966 3 413 5.1%
Population million 444 522 597 1.2%
Primary energy demand Mtoe 223 373 549 3.6%
Primary energy demand per capita toe 0.5 0.7 0.9 2.3%
Primary demand/GDP (MER) toe/$1 000 0.28 0.30 0.25 -1.5%
Net oil trade** mb/d 0.7 -0.3 -1.9 18.7%
Net gas trade bcm 46.8 68.7 62.1 -0.9%
Net coal trade Mtce 0.4 37.8 219.6 17.4%
Energy-related CO2 emissions Mt 368 715 1 166 4.5%
* Compound average annual growth rate. ** Negative values indicate imports. Notes: MER = market exchange rate; PPP = purchasing power parity. Sources: IEA databases and analysis.
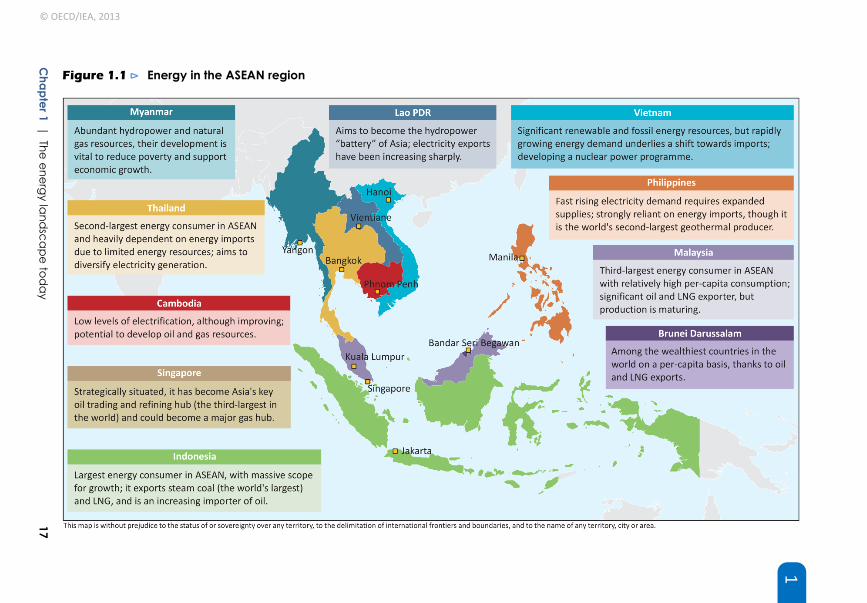
It is important to recognise in any analysis of Southeast Asia that it is an extremely diverse and disparate region with vast differences in the scale and patterns of energy use and energy resource endowments, both among and within the member states (Figure 1.1). Indonesia, the largest energy user in the region with 36% of overall demand, consumes 66% more energy than Thailand (the second-largest user) and over 50 times more energy than Brunei Darussalam (which has the lowest consumption). Another important indicator, access to electricity, also varies widely: ranging from near universal access in Brunei Darussalam, Malaysia, Thailand and Singapore to below 50% in Cambodia and Myanmar.
1 Throughout this report, Southeast Asia refers exclusively to the ten member countries of the Association of Southeast Asian Nations (ASEAN).
© O
ECD
/IEA
, 201
3
Chapter 1 | The energy la
ndscape toda
y 17
1 Figure 1.1 ⊳ Energy in the ASEAN region
© OECD/IEA, 2013

18 World Energy Outlook | Special Report
Primary energy demand
As in most parts of the world, Southeast Asia’s primary energy mix is dominated by fossil fuels, with oil, natural gas and coal making up more than three-quarters of demand. Over recent decades, there has been an ongoing shift towards coal and natural gas, primarily at the expense of oil in power generation and industry, and traditional biomass in the residential sector. But oil remains the dominant fuel, with demand currently at 4.4 million barrels per day (mb/d), and a 37% share in the primary energy mix. Natural gas is second at 21% of the primary energy mix with demand around 141 billion cubic metres (bcm) (which is comparable to current gas demand in China). ASEAN coal use has been rising at double-digit rates since 1990, tripling its share of the energy mix to 16%. Efforts are underway to boost the deployment of modern forms of renewable energy, which currently account for 12% of the primary energy mix, made up mainly of hydro, geothermal and biomass power, co-generation technologies and solar photovoltaic (PV). Traditional biomass plays a major role, representing some 12% of total demand (bringing the share of renewables in total to 24%), with the vast majority being used for cooking by people living in rural areas with low incomes and/or a lack of infrastructure restricting their use of modern fuels.
Electricity demand
Electricity demand in Southeast Asia increased by about a factor of five between 1990 and 2011 to 712 terawatt-hours (TWh). Nonetheless, on a per-capita basis ASEAN electricity demand remains low compared with developed countries (Figure 1.2). This is best illustrated by Indonesia: until 2005, its electricity demand was less than Norway’s, yet its population was approximately 50 times greater.
Figure 1.2 ⊳ Per-capita electricity demand and income in ASEAN, 2011
Notes: MER = market exchange rate. Lao PDR is not included as the data are not available.
The power generation mix of Southeast Asia is heavily reliant on fossil fuels, with natural gas (44%) and coal (31%) dominating output. Although its share is declining, oil – primarily diesel and heavy fuel oil – remains a key fuel for power generation in some parts of the
10 000
20 000
30 000
40 000
50 000
60 000
2 000 4 000 6 000 8 000 10 000 12 000 kWh per capita
GD
P pe
r cap
ita ($
2012
, MER
)
Cambodia Japan
OECD
Korea
China
Myanmar
Indonesia ASEAN average
Vietnam Thailand
Malaysia
Singapore
Philippines
Brunei Darussalam
© O
ECD
/IEA
, 201
3
Chapter 1 | The energy landscape today 19
1 region, particularly in areas that lack access to a grid or to infrastructure to supply coal or natural gas. Hydro (10%) and geothermal (3%) are important sources of generation, although overall the use of renewables is limited relative to their potential. Today, there are no commercial nuclear power plants in Southeast Asia, but many of its countries have studied the possibility of their introduction. Most of these plans were either shelved or have not moved forward since the 2011 accident at the Fukushima Daiichi plant in Japan. Vietnam has made the most progress, having signed an agreement with Russia to build its first nuclear power plant.
Sectoral demand
Energy demand in the industry and buildings sector each accounted for 30% of total final consumption in 2011, followed by transport (25%) (Figure 1.3). Industry has seen rapid growth in energy consumption in line with a move towards more energy-intensive manufacturing activities at the expense of agriculture. Within the buildings sector, the use of traditional biomass remains the leading energy source, although its share is declining as rising living standards and urbanisation support a switch to modern energy sources.
Energy use in the transport sector has also been growing rapidly and as in all other regions is dominated by oil, prompting moves to slow demand by reducing oil product subsidies and/or incentivising the use of biofuels and natural gas. The passenger vehicle stock has risen from just 5 million in 1990 to 22 million today, contributing to serious road congestion and local pollution problems in many of the large cities. This rapid expansion in vehicles has been in part linked to a lack of investment to improve and increase public transport. Moreover, many cities in the region have been growing in a pattern of sprawl rather than densification, with implications for the amount and type of energy demanded, for example, where transport demand cannot be readily served by public transport (World Bank, 2010).
Energy intensity and CO2 emissions
Energy intensity, the amount of energy used to produce a unit of gross domestic product (GDP), is on a general downward trend in Southeast Asia. This is primarily due to efficiency improvements in end-use sectors and in power generation. Between 1990 and 2011, primary energy demand (including traditional biomass) grew by almost 150% while the economy (measured in market exchange rate [MER] terms) expanded by nearly 180%. This represents an improvement of 11% in energy intensity over two decades, or 0.6% per year on average. Despite these advances, considerable scope remains to improve energy efficiency: in 2011, the region’s energy intensity was more than one-third higher than the global average and more than double that of the OECD (see Chapter 4).
ASEAN energy-related carbon-dioxide (CO2) emissions have more than tripled since 1990 in line with population growth, rising living standards and a growing share of fossil fuels in the energy mix. CO2 emissions amounted to 1.2 gigatonnes (Gt) in 2011, 3.7% of the global total. Emissions are very low compared with the region’s share of world population, of 8.6%.
© O
ECD
/IEA
, 201
3

20 W
orld Energy O
utlook | Special Report
Figure 1.3 ⊳ The ASEAN energy system, 2011 (Mtoe)
* Transformation of fossil fuels from primary energy into a form that can be used in the final consuming sectors. ** Includes losses and fuel consumed in oil and gas production, transformation losses and own use, generation lost or consumed in the process of electricity production, and transmission and distribution losses.
© OECD/IEA, 2013

Chapter 1 | The energy landscape today 21
1 The ASEAN countries are all classified as non-Annex I countries in the United Nations Framework Convention on Climate Change. Some, such as Indonesia and Malaysia, have adopted emissions reduction targets under the Copenhagen Accord, while most have national policies and strategies for climate change adaptation and mitigation. Southeast Asia is particularly vulnerable to the impacts of climate change as its population and economic activity are concentrated close to its long coastlines and as natural resources, agriculture and forestry are important sources of employment and economic growth (ADB, 2009).
Energy resources, supply and trade
The ASEAN region is relatively well-endowed with fossil fuel and renewable energy resources, although they are unevenly distributed. Moreover, the resources are often located far from demand centres or separated by inconvenient bodies of water. The region remains an energy exporter in net energy-equivalent terms, as exports of coal, natural gas and bioenergy (mainly biofuels) more than offset (in energy-equivalent terms) net imports of oil (Figure 1.4).2 However, many of the individual countries are importing increasing amounts of oil, natural gas, coal and electricity – from within and/or outside the region.
Figure 1.4 ⊳ Total energy production in ASEAN by source
Southeast Asia’s proven reserves of oil, essentially an inventory of what is currently economic to produce, amount to 13 billion barrels, which at current levels of production would sustain output for fourteen years. Oil production stood at 2.5 mb/d in 2012, down from a peak of 2.9 mb/d in 1996. The region has been a net importer of oil since the mid-1990s. Indonesia remains the largest oil producer, at 890 thousand barrels per day (kb/d) in 2012, although it became a net importer in 2004, prompting it to suspend its membership in the Organization of the Petroleum Exporting Countries (OPEC) in 2009. Brunei
2 Bioenergy refers to the energy content in solid, liquid and gaseous products derived from biomass feedstocks and biogas. This includes biofuels for transport and products (e.g. wood chips, pellets, black liquor) to produce electricity and heat. Municipal solid waste and industrial waste are also included.
1990 1994 1998 2002 2006 2011
100
200
300
400
500
600
700
Mto
e
Geothermal Coal Gas Bioenergy Oil Total primary energy demand
Hydro Other renewables
© O
ECD
/IEA
, 201
3
22 World Energy Outlook | Special Report
Darussalam and Malaysia remain the only two net oil exporters in the region. While Southeast Asia is considered to be a mature oil-producing region, there is still potential to boost output, as there remain relatively unexplored areas that are thought to hold significant resources particularly in deepwater. However, in some parts of the region, efforts to increase production are constrained by factors such as challenging legal and ownership issues, difficulties in raising finance and technological issues (see Chapter 3).
The region’s proven reserves of natural gas stand at 7.5 trillion cubic metres (tcm), 3.5% of the world’s total endowment (Oil & Gas Journal, 2012). At current levels of production, of 202 bcm in 2012, these reserves would sustain production for 37 years. Several of the large gas fields in the region have a high CO2 concentration, which poses considerable challenges for their exploitation. The region remains a net exporter of natural gas, but volumes are declining due to growing domestic needs and as many of the key producing fields are mature and declining in output. Brunei Darussalam was the first country in Southeast Asia to export liquefied natural gas (LNG) starting in 1972, and remains an important LNG exporter today. Malaysia and Indonesia were also pioneers in LNG trade and remain in the top-five exporters globally. However, Malaysia and Indonesia recently started importing LNG, as in both cases extra supply is needed to satisfy rising domestic needs (and overcome localised shortfalls) while respecting long-term export contracts. Thailand and Singapore are reliant on LNG imports and look set to be joined by Vietnam, the Philippines and Myanmar in the coming years. The increasing development of LNG regasification terminals in the region is linked to the limited intra-ASEAN gas pipeline infrastructure and countries’ desire for flexibility in gas procurement. Limitations in pipeline connections mean that piped gas trade in the region consists of Indonesia and Malaysia exporting gas to Singapore, and Myanmar exporting gas to Thailand and China.
Coal is the most abundant fossil fuel in Southeast Asia, with proven reserves sufficient to supply around 80 years of production at current levels (BGR, 2012). These are concentrated in Indonesia and Vietnam, as is coal production. In general, Indonesia’s coal is better suited for power generation, while Vietnam’s anthracite coal is more useful in steel production (hence Vietnam tends to generate electricity from low calorific-value waste coal (4 000-4 500 kilocalories per kilogram [kcal/kg]) and plans to import higher quality coal for its proposed large, high-efficiency plants). Total coal production in the ASEAN region amounted to 419 million tonnes of coal equivalent (Mtce) in 2012, up by over 20 times since 1990. Indonesia’s coal production has been rising spectacularly, and since around 2005 it has been the world’s largest exporter of steam coal (which is typically used to produce electricity). This growth has been driven by its abundant low-cost resources, low-cost domestic transport (close to coast, easy river shifting) and proximity to key demand centres in Asia, particularly China and India. Future export levels will be influenced by policies aimed at giving preference to the domestic market. Vietnam is the second-largest coal producer in Southeast Asia and the only other net exporter. Over recent years, Vietnam’s export levels have fallen as it also places priority on the domestic market where new power plants are driving demand higher. A number of ASEAN member states are importers of steam coal, including Thailand, the Philippines and Malaysia.
© O
ECD
/IEA
, 201
3
Chapter 1 | The energy landscape today 23
1 Renewable energy sources are abundant in Southeast Asia and remain an important and, in some regions, dominant source of energy supply. The technical potential is large for bioenergy (from feedstocks such as agricultural and forestry crops and residues, animal residues and municipal solid waste). Hydro already plays an important role in power supply, generating 10% of electricity in 2011. Considerable untapped potential remains to expand hydro facilities (particularly in the Greater Mekong Subregion, namely Cambodia, Lao PDR, Myanmar, Thailand and Vietnam), although in many cases resources are far from demand centres, and increasing environmental and social challenges are making them more difficult to develop. China is actively investing in the development of hydropower projects in Southeast Asia, particularly in Cambodia, Lao PDR and Myanmar, primarily for export to China. Geothermal is under-utilised relative to its potential but still generated 3% of total electricity in 2011, with Indonesia and the Philippines in the top-three in the world in terms of installed capacity. Wind and solar PV remain small in terms of overall generation, although their deployment is growing. Thailand, in particular, is rapidly installing solar PV capacity, driven by supportive government policies.
Fossil-fuel subsidies
Southeast Asia has a long history of providing subsidies that lower the price paid by energy consumers to below international market levels, or in the case of electricity generated from fossil fuels, to below levels that cover the full cost of supply. Indonesia, Malaysia, Thailand, Vietnam, Brunei Darussalam and Myanmar subsidise fossil fuel and/or electricity prices. In most cases, these subsidies are directed at gasoline and diesel as well as more socially sensitive products, namely liquefied petroleum gas (LPG), kerosene and electricity. These subsidies were typically introduced to help improve the living conditions of the poor by making fuels affordable and accessible. However, they have resulted in serious market distortions while failing to meet their intended objectives. Their presence has long-term implications for energy trends in the region. For example, energy system assets with lifetimes spanning decades have been built and are being expanded on the basis of skewed price signals. Artificially low energy prices are also dampening the incentive for consumers and industry to invest in more energy-efficient appliances and equipment (see Chapter 4), and are undermining government plans to increase electricity access and accelerate the deployment of renewable energy and other technologies.
Based on our estimates, fossil-fuel subsidies in Southeast Asia amounted to $51 billion in 2012 (Figure 1.5).3 Subsidies to oil constituted the largest share at 68% of the total, or $34 billion, followed by subsidies to electricity at 24%, or $12 billion. Spending on subsidies has been significant in Indonesia and Malaysia, both of which remain net energy exporters
3 These estimates cover subsidies to fossil fuels consumed by end-users and to fossil-fuel inputs to power generation. They are derived using the price-gap approach, which compares final consumer prices with reference prices that correspond to the full cost of supply or, where appropriate, the international market price adjusted for transportation and distribution costs. The methodology is available at www.worldenergyoutlook.org.
© O
ECD
/IEA
, 201
3

24 World Energy Outlook | Special Report
but are starting to become increasingly dependent on imports. When measured on a per-capita basis, subsidies were highest in Brunei Darussalam, although as it does not import energy, these represent opportunity costs and have no direct budgetary impact. Our series of estimates from 2007 to 2012 demonstrates that changes in the cost of subsidies in the region have been chiefly driven by changes in international oil prices, thus highlighting the risks involved in regulating domestic prices of products imported from international energy markets, which are subject to unpredictable price fluctuations. Other factors that lead to changes in the cost of subsidies from year to year include policy efforts to reform energy pricing, changes in exchange rates and variations in demand patterns.
Figure 1.5 ⊳ Economic value of fossil-fuel subsidies by fuel in ASEAN
There is now widespread recognition that subsidies are not sustainable and are having many unintended consequences. There is also a growing list of commitments to reform energy pricing made by those ASEAN governments that provide subsidies (Table 1.2). However, as in other parts of the world, there are real barriers to reform efforts. In particular, as subsidy policy is so politically sensitive in the region, the pace and ambition of reform efforts is often dictated by political realities and electoral cycles. Recently, economic factors have become a dominant driver of reform as rising consumption and persistently high energy prices have made subsidies an unsustainable financial burden in many instances. Indonesia increased prices of gasoline by 44% and diesel by 22% in June 2013 to reduce the strain on the state budget. The last time it raised fuel prices was in 2009 and since then the cost of subsidies has risen in line with the country’s mounting dependence on imported oil and a boom in vehicle ownership linked to its fast-growing economy. The reforms, which were accompanied by cash hand-outs to poor households, have proved successful. Although providing blanket subsidies to an entire population is an extremely inefficient way to make energy affordable for the poor, if the subsidies are to be removed, it is often important to provide targeted welfare assistance to avoid restricting access to modern energy services.
10
20
30
40
50
60
2007 2008 2009 2010 2011 2012
Billi
on d
olla
rs (2
012)
20
40
60
80
100
120
Dol
lars
per
bar
rel (
2012
) Coal
Natural gas
Electricity Oil IEA crude oil import price (right axis)
© O
ECD
/IEA
, 201
3

Chapter 1 | The energy landscape today 25
1 Table 1.2 ⊳ Fossil-fuel subsidies and reform efforts in ASEAN
Country Products subsidised Reform efforts
Brunei Darussalam
Diesel, gasoline, LPG and electricity.
Increased diesel and gasoline prices in 2008 for foreign-registered vehicles to limit “fuel tourism” from Malaysia, and applied a second increase for foreign vehicles in 2012.
Indonesia 88-octane gasoline, diesel, kerosene for households and small businesses, LPG and electricity.
Increased price of gasoline by 44% and diesel by 22% in June 2013. Promoting natural gas use in transport to reduce oil subsidies. Continuing successful kerosene to LPG conversion programme, which started in 2007. Electricity tariffs are set to rise by 15% in 2013 (based on quarterly increases) for all but consumers with the lowest level of consumption.
Malaysia 95-octane gasoline, diesel, LPG and electricity.
In September 2013, subsidies to gasoline and diesel were reduced in a bid to cut the budget deficit.
Plans to implement in 2014 a subsidy removal programme set out in 2011 to gradually increase natural gas and electricity prices.
Myanmar Electricity, natural gas and kerosene.
As part of power sector reforms, electricity prices were increased in January 2012. Diesel and gasoline prices were indexed to Singapore spot market prices in 2011.
Thailand
LPG prices controlled. Diesel and natural gas (for vehicles) controlled to minimise effect of volatility in international prices. Electricity for poor households.
From September 2013, increasing LPG prices every month for all but street vendors and consumers with the lowest level of electricity consumption. Increased electricity tariffs in September 2013, which will be revised every four months.
Vietnam
Diesel, gasoline, natural gas and electricity.
Gradually moving towards market prices for oil and natural gas. Plans to introduce a roadmap for the phase-out of fossil-fuel subsidies.
Spending on subsidies often becomes a serious burden on government resources. Malaysia, which spent an estimated $8.5 billion on fuel subsidies in 2012, cut subsidies to gasoline and diesel in September 2013 in a bid to reduce its budget deficit. Had Indonesia not made its recent reforms, government spending on energy subsidies would have reached levels comparable to its combined spending on health and education. The impact on government budgets is being compounded in a number of cases – including in Indonesia, Malaysia and Vietnam – by growing pressure to divert fossil fuel production away from lucrative export markets to domestic markets to satisfy fast-growing demand.
Subsidised energy prices in Southeast Asia are restricting investment in energy infrastructure by depriving energy companies of the revenues needed for new investment. This has been particularly prevalent in the electricity sector, but regulated energy prices are also complicating the investment climate in the oil, natural gas and coal sectors. In Indonesia, price controls are slowing the expansion of generating capacity, and grid extensions and upgrades that are needed to raise the electrification rate. The state-owned power corporation, PLN, is provided with a government subsidy as its regulated electricity
© O
ECD
/IEA
, 201
3
26 World Energy Outlook | Special Report
tariffs are insufficient to cover the full cost of supply. But as the subsidy level is determined on an annual basis, it undermines independent power producers’ confidence that, over the lifetime of their projects, PLN will secure sufficient revenues to pay for the electricity it would purchase from them. The Malaysian national oil company, Petronas, has identified regulated prices for natural gas (at well below international levels) as a major deterrent to investment to expand upstream production. It has also complicated moves to increase LNG imports into Peninsular Malaysia to overcome supply bottlenecks; the cost of imported gas was around three-times higher than domestic prices as of May 2013.
Could smuggling be a key driver of fossil-fuel subsidy reform?
The prevalence of fossil-fuel subsidies in Southeast Asia has made fuel smuggling a serious problem by providing an incentive to sell subsidised products in neighbouring countries where prices are higher. In addition to substantial financial gains for smugglers, this can lead to big losses by way of foregone taxes and excise duties in the recipient countries due to lower legitimate sales and a transfer of income from the subsidising country. Fuel smuggling also has many other negative consequences, such as complicating the collection of reliable energy statistics. Fuel smuggling in Southeast Asia often involves the use of small oil tankers or fishing boats that either bypass normal customs routes altogether or falsely declare their load as products that are exempt from excise taxes. Gasoline in Indonesia, for example, was up until recently around 60% cheaper than in a number of its neighbouring countries. Subsidies in Malaysia have also meant that refined product prices have been well below the regional average. In the Philippines, which has been the recipient of a lot of smuggled fuel, the government estimates that its tax revenues are being reduced by around $1 billion per year as a result of illegitimate sales.
Many ASEAN member states are taking steps to stamp out fuel smuggling, typically by stepping up border surveillance. But history has shown that efforts to curtail smuggling can absorb scarce administrative resources and are rarely completely successful. While better border control may be a necessary option for countries that are the recipients of smuggled fuels, a much more effective strategy would be for the originating countries to remove the subsidies, as that would eliminate the incentive to smuggle fuels.
Modern energy access4
We estimate that 134 million people in Southeast Asia, or 22% of the region’s population, currently do not have access to electricity and around 280 million people rely on the traditional use of biomass for cooking, almost half of the region’s population (Table 1.3).
4 For this analysis, modern energy access is defined as a household having reliable and affordable access to clean cooking facilities, a first connection to electricity and then an increasing level of electricity consumption over time.
S P O T L I G H T
© O
ECD
/IEA
, 201
3

Chapter 1 | The energy landscape today 27
1 Access to affordable and reliable energy services is crucial to reducing poverty and improving health, increasing productivity, enhancing competitiveness and promoting economic growth. The lack of access to modern forms of energy often tends to go hand-in-hand with a lack of provision of clean water, sanitation and health care. Inefficient and unsustainable cooking practices also have serious implications for the environment, such as land degradation and contributing to local and regional air pollution.
Table 1.3 ⊳ Access to modern energy services in ASEAN, 2011
Population without access to electricity
Population relying on traditional use of biomass for cooking*
Million Share (%) Million Share (%)
Brunei Darussalam 0 0% 0 0%
Cambodia 9 66% 13 88%
Indonesia 66 27% 103 42%
Lao PDR 1 22% 4 65%
Malaysia 0 1% 1 3%
Myanmar 25 51% 44 92%
Philippines 28 30% 47 50%
Singapore 0 0% 0 0%
Thailand 1 1% 18 26%
Vietnam 3 4% 49 56%
Total ASEAN 134 22% 279 47%
* Preliminary estimates based on IEA and World Health Organization (WHO) databases. Final estimates for 2011 will be published online at www.worldenergyoutlook.org.
Access to modern energy services is low in Southeast Asia relative to most other parts of the world, with the exceptions of Brunei Darussalam, Malaysia, Thailand and Singapore (which have reached high levels of access). Indonesia accounts for almost half of the population of those living in the region that lack access to electricity, partly reflecting the difficulties involved in providing access to modern energy services in the largest and most populous archipelago in the world. Electrification rates are also low in Cambodia (34%) and Myanmar (49%). Rural areas are home to 80% of the people in Southeast Asia without access to electricity, primarily reflecting the added difficulties of providing electricity in communities with low population densities.
Nonetheless, significant progress has and is being made in improving access to modern energy services. Since 2002, the number of people in the region without access to electricity has decreased by around 60 million. This has been realised despite the growth in population. In absolute terms, Indonesia has made the most progress, lifting its electrification rate from 53% in 2002 to 73% in 2011. Vietnam increased its electricity access rate from an estimated 80% in 2002 to 96% in 2011. Over the same period, the electrification rate almost doubled in Lao PDR, and the number of people with electricity access in Cambodia increased two-fold. Furthermore, a number of ASEAN member states have set electrification targets: 90% by 2017 in the Philippines; 90% by 2020 in Lao PDR;
© O
ECD
/IEA
, 201
3

28 World Energy Outlook | Special Report
99% by 2020 in Indonesia; and 70% by 2030 in Cambodia. Indonesia also recently set a target for clean cooking facilities, with a plan to increase the share of households using natural gas or LPG for cooking to 85% by 2015 from only 45% today.
Economic growth and urbanisation have been important factors in increasing access to modern energy services, but dedicated government interventions to increase access to electricity or lighting are also playing a major role. For example, since 2004, the Cambodian Rural Electrification Fund has been providing grant assistance for the development of solar home systems, and micro and mini hydropower. Indonesia and the Philippines also have programmes in place to encourage decentralised solutions, prioritising renewable energy sources such as geothermal, hydropower and biomass to provide access. A number of initiatives promoting clean cooking are also proving successful. In Cambodia, more than one million New Lao Stoves (an improved biomass stove that reduces indoor air pollution and improves combustion efficiency) have been distributed since 2003.
Projecting future developments
The evolution of energy demand and supply in Southeast Asia will be determined by the interplay of a number of factors, such as government policies, demographic change, urbanisation, economic trends including shifts in the structure of economic activity, energy pricing and technological developments. This report provides projections of energy demand and supply for Southeast Asia through to 2035. It includes two scenarios: the New Policies Scenario (see Chapters 2 and 3) and the Efficient ASEAN Scenario (see Chapter 4).5 The scenarios are differentiated primarily by their underlying assumptions about government policies. Both are based on the same assumptions for economic growth, demographic change and international energy pricing.
Defining the scenarios
The New Policies Scenario is the central scenario of this Outlook. In addition to incorporating policies and measures that had been adopted as of mid-2013 that affect energy markets, it also takes account of other relevant commitments that have been announced, even when the precise implementation measures have yet to be fully defined. These commitments include programmes to support renewable energy and improve energy efficiency, initiatives to promote alternative fuels and vehicles, policies related to the introduction of nuclear energy and initiatives to reform fossil-fuel subsidies. However, we take a relatively cautious view as to the extent to which these commitments will be implemented, as there are institutional, political and economic circumstances that could stand in the way.
The Efficient ASEAN Scenario examines what could be achieved if known best available technologies and practices to improve energy efficiency are systematically adopted throughout Southeast Asia. It is based on the core assumptions that all investments capable
5 Information on scenarios and modelling framework available at www.worldenergyoutlook.org/weomodel/.
© O
ECD
/IEA
, 201
3

Chapter 1 | The energy landscape today 29
1 of improving energy efficiency are made so long as they are economically viable and any market barriers obstructing their realisation are removed. Technologies implemented are subject to a stringent test of their economic viability, expressed as the acceptable payback period for each class of investment (see Chapter 4 for details).
The projections for both scenarios are derived from the IEA’s World Energy Model (WEM). The WEM is a large-scale simulation model designed to replicate how energy markets function, that consists of three main modules: (i) final energy consumption; (ii) energy transformation; and (iii) oil, natural gas, coal and renewable supply. Assumptions based on analysis of the latest developments in energy markets, the broader economy and energy and climate policy, are used as inputs to the WEM, together with huge quantities of historical data on economic and energy variables. These data were obtained from a wide variety of sources. The IEA in collaboration with the Economic Research Institute for ASEAN and East Asia (ERIA) carried out a survey of energy supply and demand data by working with energy ministries in each of the ASEAN member states. The results of the survey were supplemented by data sourced from the IEA’s historical statistics on energy supply, trade, stocks, transformation and demand, together with additional data from governments, international organisations, energy companies, consulting firms and investment banks worldwide.
To prepare this analysis, the regional disaggregation of the WEM has been enhanced to enable demand in the New Policies Scenario to be modelled separately in Indonesia, Thailand, Malaysia and the Philippines, while energy demand in the remaining ASEAN economies – Brunei Darussalam, Cambodia, Lao PDR, Myanmar, Singapore and Vietnam – has been modelled on an aggregated basis, in part due to data limitations. On the supply side, projections for oil, natural gas, coal and bioenergy are derived for all major producers within the region. For the Efficient ASEAN Scenario, the region is modelled as a single entity.
Key assumptions
Economic growth
Southeast Asia has become a new major pillar of economic growth in Asia, joining China and India. The combined GDP of the ten ASEAN member countries has increased by around three-quarters since 2000 (and now exceeds more than three-quarters of that of India when measured in purchasing power parity [PPP] terms). The region as a whole was surprisingly resilient during the recent global economic crisis, as strong domestic financial and macroeconomic fundamentals helped insulate it from the problems facing many of the world’s developed economies, even as it saw reduced demand for exports from key markets in Europe, the United States and Japan. Huge wealth disparities exist both among and within countries in the region: Singapore and Brunei Darussalam rank among the wealthiest countries in the world in terms of GDP per capita, while Cambodia, Lao PDR, Myanmar and Vietnam are at the other extreme. There are also significant social, cultural and institutional differences across the region.
© O
ECD
/IEA
, 201
3
30 World Energy Outlook | Special Report
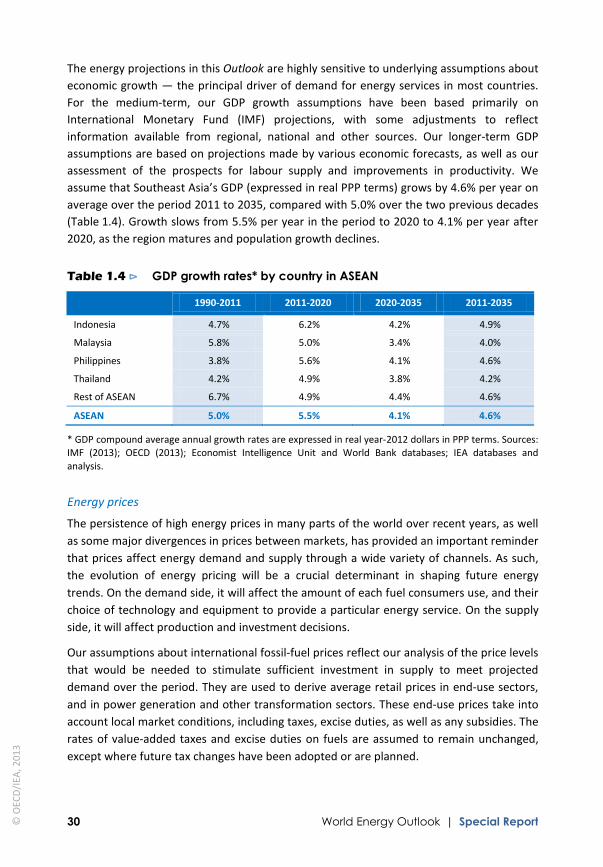
The energy projections in this Outlook are highly sensitive to underlying assumptions about economic growth — the principal driver of demand for energy services in most countries. For the medium-term, our GDP growth assumptions have been based primarily on International Monetary Fund (IMF) projections, with some adjustments to reflect information available from regional, national and other sources. Our longer-term GDP assumptions are based on projections made by various economic forecasts, as well as our assessment of the prospects for labour supply and improvements in productivity. We assume that Southeast Asia’s GDP (expressed in real PPP terms) grows by 4.6% per year on average over the period 2011 to 2035, compared with 5.0% over the two previous decades (Table 1.4). Growth slows from 5.5% per year in the period to 2020 to 4.1% per year after 2020, as the region matures and population growth declines.
Table 1.4 ⊳ GDP growth rates* by country in ASEAN
1990-2011 2011-2020 2020-2035 2011-2035
Indonesia 4.7% 6.2% 4.2% 4.9%
Malaysia 5.8% 5.0% 3.4% 4.0%
Philippines 3.8% 5.6% 4.1% 4.6%
Thailand 4.2% 4.9% 3.8% 4.2%
Rest of ASEAN 6.7% 4.9% 4.4% 4.6%
ASEAN 5.0% 5.5% 4.1% 4.6%
* GDP compound average annual growth rates are expressed in real year-2012 dollars in PPP terms. Sources: IMF (2013); OECD (2013); Economist Intelligence Unit and World Bank databases; IEA databases and analysis.
Energy prices
The persistence of high energy prices in many parts of the world over recent years, as well as some major divergences in prices between markets, has provided an important reminder that prices affect energy demand and supply through a wide variety of channels. As such, the evolution of energy pricing will be a crucial determinant in shaping future energy trends. On the demand side, it will affect the amount of each fuel consumers use, and their choice of technology and equipment to provide a particular energy service. On the supply side, it will affect production and investment decisions.
Our assumptions about international fossil-fuel prices reflect our analysis of the price levels that would be needed to stimulate sufficient investment in supply to meet projected demand over the period. They are used to derive average retail prices in end-use sectors, and in power generation and other transformation sectors. These end-use prices take into account local market conditions, including taxes, excise duties, as well as any subsidies. The rates of value-added taxes and excise duties on fuels are assumed to remain unchanged, except where future tax changes have been adopted or are planned.
© O
ECD
/IEA
, 201
3

Chapter 1 | The energy landscape today 31
1 We assume the average IEA crude oil import price – a proxy for international oil prices – rises from around $109/barrel in 2012 to $128/barrel (in real-2012 dollars) in 2035. Natural gas prices in Asia are assumed to fall from the peaks in recent years, but remain high by historical standards, with LNG import prices in Asia Pacific averaging $15 per million British thermal units (MBtu) in 2035. As the basis for deriving our steam coal price assumptions for different countries in the region, we assume the average steam coal import price rises from just under $100/tonne in 2012 to $110/tonne in 2035. This is a marker for high calorific-value coal which is generally sold in the international long distance market. As they do at present, many ASEAN countries are expected to continue to use lower cost and lower calorific-value coal for their electricity needs.
Energy policies
Energy policies across the ten ASEAN member states vary considerably, reflecting differences in political direction, economic development and natural resource endowments. Common themes include improving energy security (driven by increasing reliance on imported energy), reducing economic costs (linked to rising imports during this period of persistently high energy prices) and improving the sustainability of energy use (driven by concerns over local pollution and as the region is among the most vulnerable to the adverse impacts of climate change). To achieve these objectives, many ASEAN countries have adopted or announced policies to diversify energy supply, primarily through the increased use of coal, greater use of modern renewables and/or the eventual introduction of nuclear power. Most are also pursuing energy efficiency programmes, with a focus on energy management in industry and buildings, vehicle efficiency and appliance standards and labelling. In keeping with the approach adopted in the New Policies Scenario, our projections reflect a cautious view on the prospects for full realisation of the various energy policies, targets and objectives that have been announced unless the precise implementation measures have been fully defined (Table 1.5).
In terms of intra-regional co-operation, ASEAN countries have an active agenda on many energy policy fronts. They continue to strive towards implementation of long-standing projects aimed at establishing interconnected grids for electricity and natural gas, namely the ASEAN Power Grid and the Trans-ASEAN Gas Pipeline. Realising the full potential of these initiatives requires further efforts to harmonise technical and regulatory standards, phasing out end-user price subsidies, ensuring third-party grid and pipeline access, and the establishment of a regional regulator. The ASEAN Petroleum Security Agreement (APSA), which is a petroleum sharing scheme for times of supply shortages, came into force in March 2013 after having been ratified by all ten member states. In 2012, the ASEAN Council on Petroleum (ASCOPE) finalised and published decommissioning guidelines for offshore oil and gas structures in Southeast Asia, the first such guidelines for the region. ASEAN countries are also working together on a number of initiatives on clean coal technologies, energy efficiency and renewables. They have embarked on preliminary studies to investigate the use of carbon capture and storage (CCS) in the region and Indonesia has initiated a pilot CCS project in the gas processing sector with the support of the Asian Development Bank (ADB) and the Government of Japan (ADB, 2013).
© O
ECD
/IEA
, 201
3
32 W
orld Energy O
utlook | Special Report
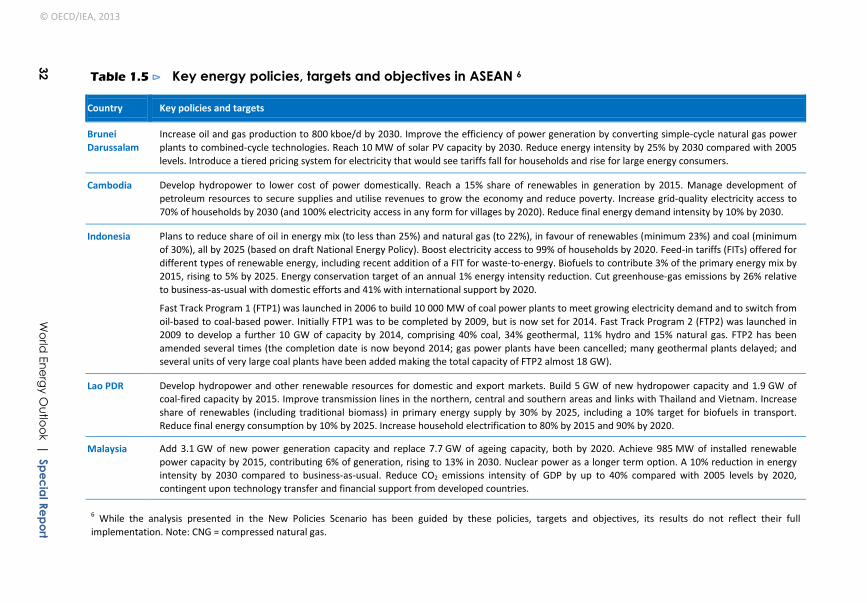
Table 1.5 ⊳ Key energy policies, targets and objectives in ASEAN 6
Key policies and targets
Increase oil and gas production to 800 kboe/d by 2030. Improve the efficiency of power generation by converting simple-cycle natural gas power plants to combined-cycle technologies. Reach 10 MW of solar PV capacity by 2030. Reduce energy intensity by 25% by 2030 compared with 2005 levels. Introduce a tiered pricing system for electricity that would see tariffs fall for households and rise for large energy consumers.
Develop hydropower to lower cost of power domestically. Reach a 15% share of renewables in generation by 2015. Manage development of petroleum resources to secure supplies and utilise revenues to grow the economy and reduce poverty. Increase grid-quality electricity access to 70% of households by 2030 (and 100% electricity access in any form for villages by 2020). Reduce final energy demand intensity by 10% by 2030.
Plans to reduce share of oil in energy mix (to less than 25%) and natural gas (to 22%), in favour of renewables (minimum 23%) and coal (minimum of 30%), all by 2025 (based on draft National Energy Policy). Boost electricity access to 99% of households by 2020. Feed-in tariffs (FITs) offered for different types of renewable energy, including recent addition of a FIT for waste-to-energy. Biofuels to contribute 3% of the primary energy mix by 2015, rising to 5% by 2025. Energy conservation target of an annual 1% energy intensity reduction. Cut greenhouse-gas emissions by 26% relative to business-as-usual with domestic efforts and 41% with international support by 2020.
Fast Track Program 1 (FTP1) was launched in 2006 to build 10 000 MW of coal power plants to meet growing electricity demand and to switch from oil-based to coal-based power. Initially FTP1 was to be completed by 2009, but is now set for 2014. Fast Track Program 2 (FTP2) was launched in 2009 to develop a further 10 GW of capacity by 2014, comprising 40% coal, 34% geothermal, 11% hydro and 15% natural gas. FTP2 has been amended several times (the completion date is now beyond 2014; gas power plants have been cancelled; many geothermal plants delayed; and several units of very large coal plants have been added making the total capacity of FTP2 almost 18 GW).
Develop hydropower and other renewable resources for domestic and export markets. Build 5 GW of new hydropower capacity and 1.9 GW of coal-fired capacity by 2015. Improve transmission lines in the northern, central and southern areas and links with Thailand and Vietnam. Increase share of renewables (including traditional biomass) in primary energy supply by 30% by 2025, including a 10% target for biofuels in transport. Reduce final energy consumption by 10% by 2025. Increase household electrification to 80% by 2015 and 90% by 2020.
Add 3.1 GW of new power generation capacity and replace 7.7 GW of ageing capacity, both by 2020. Achieve 985 MW of installed renewable power capacity by 2015, contributing 6% of generation, rising to 13% in 2030. Nuclear power as a longer term option. A 10% reduction in energy intensity by 2030 compared to business-as-usual. Reduce CO2 emissions intensity of GDP by up to 40% compared with 2005 levels by 2020, contingent upon technology transfer and financial support from developed countries.
6 While the analysis presented in the New Policies Scenario has been guided by these policies, targets and objectives, its results do not reflect their full implementation. Note: CNG = compressed natural gas.
Country
Brunei Darussalam
Cambodia
Indonesia
Lao PDR
Malaysia
© OECD/IEA, 2013

Chapter 1 | The energy la
ndscape toda
y 33
1 Table 1.5 ⊳ Key energy policies, targets and objectives in ASEAN (continued)
Key policies and targets
Targets a reduction in primary energy consumption of 5% in 2020 and 8% by 2030 (compared with business-as-usual) and an increase in the share of renewables in power generating capacity to 15-18% by 2020. As part of power sector reforms, electricity prices were increased in January 2012. Diesel and gasoline prices were indexed to Singapore spot market prices in 2011.
Increase generation capacity from 16 GW in 2011 to 29 GW in 2030 and expand grid to interconnect all major islands. Triple installed renewable capacity to 15 GW in 2030, with most of the growth from geothermal and hydropower. Achieve energy savings of 10% by 2030 relative to business-as-usual. Increase household electrification rate from 70% to 90% by 2017 and 100% sitio (“small township”) electrification by 2015. Implement an LPG conversion programme, an electric vehicle demonstration initiative and increase the number of public utility vehicles running on CNG and LPG to 30% by 2030 (from 10% today). Ethanol blend in gasoline to reach 20% by 2020. Biodiesel blend in diesel to reach 5% in 2015, 10% in 2020 and 20% by 2025.
Five key strategies: (i) diversify energy supplies; (ii) enhance infrastructure and systems; (iii) improve energy efficiency; (iv) strengthen the green economy; and (v) ensure competitive energy pricing. Take steps to become a major gas hub. Aims to have 5% of peak electricity demand supplied from renewable energy sources by 2020. Reduce energy intensity by 20% by 2020 and 35% by 2030 compared with 2005 levels. Have started to implement mitigation and energy efficiency measures with a view to reducing CO2 emissions by 7-11% below the 2020 business-as-usual level.
Power generation capacity to be increased to 71 GW in 2030, with a gradual reduction in the share of natural gas and introduction of nuclear power from 2026. Increase the share of renewable energy in final consumption to 25% by 2021, with consumption targets for ethanol of 9 million litres/day and biodiesel of 5.97 million litres/day, both in 2021. Reduce energy intensity by 25% by 2030, compared with 2005 levels. Increase oil stock to 45 days of net import and consider to expand to 90 days in the longer term.
Reach 75 GW of generation capacity by 2020 and 150 GW by 2030. Achieve 5% of power generation from renewable energy resources by 2020 and 12 GW of nuclear power by 2030. Encourage private investment in the power sector. Efficiency measures to save 5-8% of energy consumption over 2010-2015. Further develop local natural gas resources, increase imports and more investment in infrastructure. Build oil stocks equivalent to 90 days of net imports by 2025. Reach 100% electrification of rural households by 2020. Cut CO2 emissions intensity by 8-10% by 2020 compared with 2010 levels.
Country
Myanmar
Philippines
Singapore
Thailand
Vietnam
© OECD/IEA, 2013

34 World Energy Outlook | Special Report
Demographics
Demographic change affects both the level and pattern of energy use, directly and through its impact on economic growth and development. Our assumed rates of population growth are based on the medium-variant of the latest UN projections (UNPD, 2013). Southeast Asia’s population was estimated at almost 600 million in 2011 (Table 1.6). Brunei Darussalam has the smallest population, at just over 400 thousand people, while Indonesia, at 242 million people, has the largest in the region and the fourth-largest in the world. We assume Southeast Asia’s population increases to almost 740 million in 2035, or at 0.9% per year on average, which means it retains a share of the world population of around 8%. By contrast with some of its neighbours in Asia, Southeast Asia has a relatively young population, which gives it an advantage in terms of economic growth prospects as it has a large and growing labour pool. This is particularly the case for the Philippines, Cambodia, Lao PDR and Indonesia. Across the region as a whole, the median age is 27 compared with 45 in Japan and 35 in China.
Table 1.6 ⊳ Demographic assumptions
Population (million) Urbanisation rate
2011 2035 2011-2035* 2011 2035
Indonesia 242.3 301.5 0.9% 51% 66%
Malaysia 28.9 38.6 1.2% 73% 82%
Philippines 94.9 135.6 1.5% 49% 59%
Thailand 69.5 69.7 0.0% 34% 45%
Rest of ASEAN 161.9 191.0 0.7% 33% 49%
ASEAN 597.5 736.5 0.9% 45% 59%
* Compound average annual growth rates.
Sources: UNPD and World Bank databases; IEA analysis.
Southeast Asia is experiencing rapid urbanisation: the population living in urban areas grew at an annual rate of 3.1% between 1990 and 2011, or more than double the population growth rate. While the concentration of activities in urban areas can enable improved energy efficiency through economies of scale, the urban population in developing countries typically use more energy, particularly in the residential and transport sectors, than their rural counterparts, as their higher incomes and better access to energy services typically outweigh energy efficiency gains that come from higher density settlements. Based on UN projections, Southeast Asia’s urban population increases by 2.1% per year to 2035 (or more than double the population growth rate), as the urbanisation rate swells from 45% in 2011 to 59% in 2035. Overall, the number of people living in urban areas increases by over 165 million and the total urban population is more than 60% higher in 2035 than in 2011.
Growth in energy demand is closely correlated with growth in per-capita income, although the relationship has decoupled in a number of advanced countries and may be weaker in future than expected in economies that are emerging today if they evolve with smart urban
© O
ECD
/IEA
, 201
3

Chapter 1 | The energy landscape today 35
1 planning, efficient transport systems and energy-efficient buildings. Nonetheless, rising incomes will continue to lead to increased demand for goods that require energy to use and to produce, such as cars, refrigerators and air conditioners. Based on our assumptions for population and GDP growth, ASEAN GDP per capita is set to increase at 3.7% per year, from around $3 700 in 2011 to almost $8 700 in 2035 (calculated using market exchange rate). Despite this rapid growth, ASEAN GDP per capita in 2035 will be around one-sixth of the level in the OECD (Figure 1.6).
Figure 1.6 ⊳ GDP per capita in selected countries
* CAAGR = compound average annual growth rate. Note: GDP is expressed in 2012 dollars at market exchange rates.
10 000 20 000 30 000 40 000 50 000 60 000
India
Philippines
Indonesia
ASEAN
Thailand
China
Malaysia
OECD
Dollars (2012)
2011
2035
5.3%
3.1%
4.0%
3.7%
4.2%
5.5%
2.8%
1.6%
% CCAGR*
© O
ECD
/IEA
, 201
3

© O
ECD
/IEA
, 201
3

Chapter 2 | Domestic energy prospects 37
Chapter 2
Domestic energy prospects How will demand in Southeast Asia evolve?
Highl ights • Southeast Asia’s primary energy demand grows at more than twice the global
average in the Outlook to 2035, underpinning strong economic growth and rapid urbanisation. In the New Policies Scenario, our central scenario, the region’s energy demand rises by 83% between 2011 and 2035, representing over 10% of the growth in energy use worldwide. Per-capita energy demand increases from around one-fifth to one-third of the OECD average over the period. The amount of energy used to generate a unit of GDP declines by almost two-fifths.
• Coal demand jumps sharply, from a 16% share of the primary energy mix in 2011 to 28% in 2035, consistent with the trend in recent decades in its larger neighbours, China and India. Demand for oil rises from 4.3 mb/d to 6.8 mb/d, representing almost one-fifth of the growth in global demand. Gas demand increases about 80% to 250 bcm. The share of renewables in the primary energy mix falls as rapidly increasing use of modern renewables – such as geothermal, hydro and wind – is offset by reduced use of traditional biomass for cooking.
• The power sector is fundamental to the energy outlook for Southeast Asia. Electricity demand increases by half by 2020 and to almost 1 900 TWh by 2035, a level equivalent to the combined current demand of Japan and Korea. Gross capacity additions of almost 300 GW are required. Coal emerges as the fuel of choice in the power sector as it is relatively cheap and abundant in the region. A shift towards coal is already underway: some three-quarters of the thermal capacity now under construction is coal-fired. Gas for power generation will increasingly come from LNG, which in most cases is set to be more expensive than the gas historically used in the region. Power sector investment of almost $1 trillion is required over 2012-2035.
• Final energy consumption rises by 76% in 2011-2035. Industry remains the largest end-user, with its demand growing just over 90%. Strong growth in the vehicle stock pushes energy demand up by 88% in the transport sector. Buildings sector energy use rises at a more moderate rate, dampened by an ongoing switch to modern, more efficient sources of energy away from traditional biomass.
• The region’s energy-related CO2 emissions almost double, reaching 2.3 Gt in 2035. Growth is faster than in primary energy demand, reflecting the pronounced increase in the share of fossil fuels in the energy mix. Carbon intensity — the amount of CO2 emitted per unit of GDP — improves significantly, falling by 33% over 2011-2035.
© O
ECD
/IEA
, 201
3

38 World Energy Outlook 2013 | Special Report
Overview
Primary energy demand
In the New Policies Scenario, Southeast Asia’s total primary energy demand increases by 83% during the projection period, from 549 million tonnes of oil equivalent (Mtoe) in 2011 to 1 004 Mtoe in 2035 (Table 2.1). The growth rate slows progressively from an average of 3% per year to 2020 to 2.3% per year from 2020 to 2035, largely reflecting a gradual decline in economic and population growth rates, plus results from policy efforts to move towards more efficient patterns of energy use. The region remains heavily dependent on fossil fuels, which collectively represent 80% of primary energy demand in 2035, up from 76% in 2011.
Table 2.1 ⊳ Primary energy demand by country (Mtoe)
1990 2011 2020 2025 2035 2011-2035*
Indonesia 89 196 252 282 358 2.5%
Malaysia 21 74 96 106 128 2.3%
Philippines 29 40 58 69 92 3.5%
Thailand 42 118 151 168 206 2.3%
Rest of ASEAN 42 119 161 178 221 2.6%
Total ASEAN 223 549 718 804 1 004 2.5%
* Compound average annual growth rate.
Oil demand rises progressively from 4.3 million barrels per day (mb/d) in 2011 to 5.4 mb/d in 2020 and 6.8 mb/d in 2035. It remains the region’s largest contributor to primary energy demand, but its share of the mix drops from 38% to 31% with continued switching away from oil in power generation and industry, improvements in end-use efficiency and more use of biofuels to offset some of the strong growth in transport sector demand (Figure 2.1).
Figure 2.1 ⊳ ASEAN primary energy demand by source
1980 1990 2000 2010 2020 2030 2035
Oil Coal
Gas
Bioenergy
Hydro Nuclear
Other renewables 50
100
150
200
250
300
350
Mto
e
© O
ECD
/IEA
, 201
3
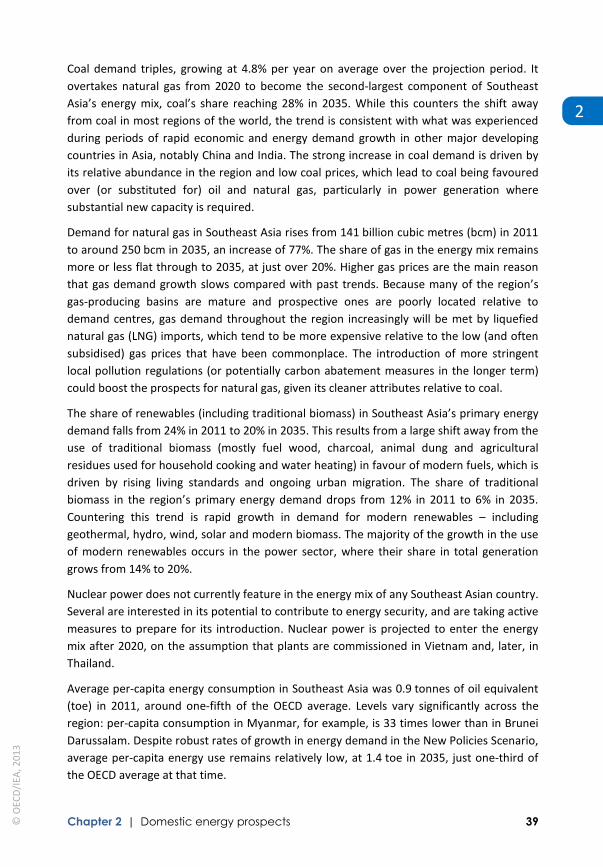
Chapter 2 | Domestic energy prospects 39
2
Coal demand triples, growing at 4.8% per year on average over the projection period. It overtakes natural gas from 2020 to become the second-largest component of Southeast Asia’s energy mix, coal’s share reaching 28% in 2035. While this counters the shift away from coal in most regions of the world, the trend is consistent with what was experienced during periods of rapid economic and energy demand growth in other major developing countries in Asia, notably China and India. The strong increase in coal demand is driven by its relative abundance in the region and low coal prices, which lead to coal being favoured over (or substituted for) oil and natural gas, particularly in power generation where substantial new capacity is required.
Demand for natural gas in Southeast Asia rises from 141 billion cubic metres (bcm) in 2011 to around 250 bcm in 2035, an increase of 77%. The share of gas in the energy mix remains more or less flat through to 2035, at just over 20%. Higher gas prices are the main reason that gas demand growth slows compared with past trends. Because many of the region’s gas-producing basins are mature and prospective ones are poorly located relative to demand centres, gas demand throughout the region increasingly will be met by liquefied natural gas (LNG) imports, which tend to be more expensive relative to the low (and often subsidised) gas prices that have been commonplace. The introduction of more stringent local pollution regulations (or potentially carbon abatement measures in the longer term) could boost the prospects for natural gas, given its cleaner attributes relative to coal.
The share of renewables (including traditional biomass) in Southeast Asia’s primary energy demand falls from 24% in 2011 to 20% in 2035. This results from a large shift away from the use of traditional biomass (mostly fuel wood, charcoal, animal dung and agricultural residues used for household cooking and water heating) in favour of modern fuels, which is driven by rising living standards and ongoing urban migration. The share of traditional biomass in the region’s primary energy demand drops from 12% in 2011 to 6% in 2035. Countering this trend is rapid growth in demand for modern renewables – including geothermal, hydro, wind, solar and modern biomass. The majority of the growth in the use of modern renewables occurs in the power sector, where their share in total generation grows from 14% to 20%.
Nuclear power does not currently feature in the energy mix of any Southeast Asian country. Several are interested in its potential to contribute to energy security, and are taking active measures to prepare for its introduction. Nuclear power is projected to enter the energy mix after 2020, on the assumption that plants are commissioned in Vietnam and, later, in Thailand.
Average per-capita energy consumption in Southeast Asia was 0.9 tonnes of oil equivalent (toe) in 2011, around one-fifth of the OECD average. Levels vary significantly across the region: per-capita consumption in Myanmar, for example, is 33 times lower than in Brunei Darussalam. Despite robust rates of growth in energy demand in the New Policies Scenario, average per-capita energy use remains relatively low, at 1.4 toe in 2035, just one-third of the OECD average at that time.
© O
ECD
/IEA
, 201
3
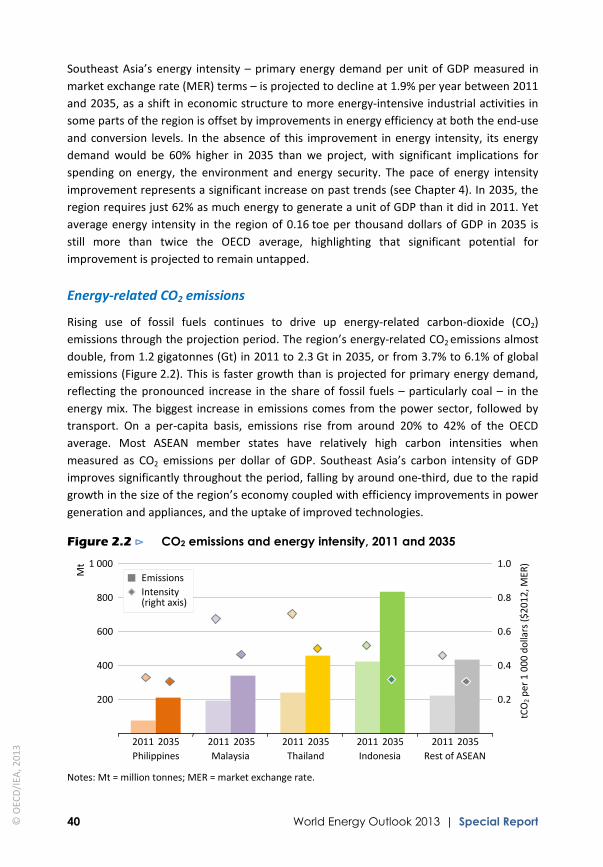
40 World Energy Outlook 2013 | Special Report
Southeast Asia’s energy intensity – primary energy demand per unit of GDP measured in market exchange rate (MER) terms – is projected to decline at 1.9% per year between 2011 and 2035, as a shift in economic structure to more energy-intensive industrial activities in some parts of the region is offset by improvements in energy efficiency at both the end-use and conversion levels. In the absence of this improvement in energy intensity, its energy demand would be 60% higher in 2035 than we project, with significant implications for spending on energy, the environment and energy security. The pace of energy intensity improvement represents a significant increase on past trends (see Chapter 4). In 2035, the region requires just 62% as much energy to generate a unit of GDP than it did in 2011. Yet average energy intensity in the region of 0.16 toe per thousand dollars of GDP in 2035 is still more than twice the OECD average, highlighting that significant potential for improvement is projected to remain untapped.
Energy-related CO2 emissions
Rising use of fossil fuels continues to drive up energy-related carbon-dioxide (CO2) emissions through the projection period. The region’s energy-related CO2 emissions almost double, from 1.2 gigatonnes (Gt) in 2011 to 2.3 Gt in 2035, or from 3.7% to 6.1% of global emissions (Figure 2.2). This is faster growth than is projected for primary energy demand, reflecting the pronounced increase in the share of fossil fuels – particularly coal – in the energy mix. The biggest increase in emissions comes from the power sector, followed by transport. On a per-capita basis, emissions rise from around 20% to 42% of the OECD average. Most ASEAN member states have relatively high carbon intensities when measured as CO2 emissions per dollar of GDP. Southeast Asia’s carbon intensity of GDP improves significantly throughout the period, falling by around one-third, due to the rapid growth in the size of the region’s economy coupled with efficiency improvements in power generation and appliances, and the uptake of improved technologies.
Figure 2.2 ⊳ CO2 emissions and energy intensity, 2011 and 2035
Notes: Mt = million tonnes; MER = market exchange rate.
200
400
600
800
1 000
2011 2035 2011 2035 2011 2035 2011 2035 2011 2035
0.2
0.4
0.6
0.8
1.0
tCO
2 per
1 0
00 d
olla
rs ($
2012
, MER
)
Rest of ASEAN Philippines Malaysia Thailand Indonesia
Emissions Intensity (right axis)
Mt
© O
ECD
/IEA
, 201
3

Chapter 2 | Domestic energy prospects 41
2
Outlook for end-use sectors
Total final energy consumption1 grows at an average annual rate of 2.4% through 2035, rising from 398 Mtoe in 2011 to just over 700 Mtoe in 2035. Industry is presently the largest end-use sector. Its energy demand grows at 2.7% per year on average over 2011-2035, driven by a continued structural shift from labour-intensive activities to more energy-intensive ones (Figure 2.3). Growth in industrial energy demand slows with time, due in part to energy efficiency measures for large energy users.
Figure 2.3 ⊳ ASEAN incremental energy demand by sector
* Other includes agriculture and non-energy use (and, in the case of ASEAN, is primarily oil and gas feedstocks for the petrochemicals industry).
Energy demand in the buildings sector increases 1.8% per year, rising by 52% overall during the period.2 This modest growth results from an ongoing switch from traditional biomass combusted in inefficient devices to modern (more efficient) forms of energy. This partly offsets a large rise in energy needs in the residential and commercial sub-sectors, where demand is pushed higher by population and economic growth, and increasing urbanisation.
Transport sector energy demand nearly doubles over 2011-2035, growing by 2.7% per year. This rapid increase is underpinned by rising incomes, often low or subsidised oil product prices and, in some cases, a lack of public transport. Nonetheless, measures to improve fuel economy and phase out subsidies contribute to a gradual slowdown in demand growth. Oil-based fuels continue to dominate in transport, meeting 90% of demand in 2035, though efforts to promote alternative fuels, in part to reduce the burden of rising oil imports, contribute to increasing use of natural gas. Despite strong growth, passenger light-duty
1 Total final consumption is the sum of energy consumption in industry, transport, buildings (including residential and services), agriculture and non-energy use. It excludes international bunkers. 2 The buildings sector includes energy used in residential, commercial and institutional buildings, and non-specified other. Building energy use includes space heating and cooling, water heating, lighting, appliances and cooking equipment.
2011 2035 2011 2035 2011 2035 2011 2035 2011 2035
Other renewables Bioenergy
Electricity
Gas
Oil
Coal
Industry Transport Residential Services Other*
Mto
e 250
200
150
100
50
© O
ECD
/IEA
, 201
3

42 World Energy Outlook 2013 | Special Report
vehicle (PLDV) ownership rates remain low relative to the world average, rising to 71 per 1 000 people in 2035 (Figure 2.4). The PLDV stock rises from 22 million in 2011 to 53 million in 2035, with most of the growth in Indonesia, Malaysia, Thailand and the Philippines.
Figure 2.4 ⊳ Passenger light-duty vehicle stock and ownership rates
Outlook for the power sector Electricity demand
The power sector accounts for 52% of the increase in primary energy demand in Southeast Asia in the New Policies Scenario, highlighting its importance in the overall energy outlook. Final electricity consumption, which excludes transmission losses and other non-final uses, grows by 4.2% per year on average (Figure 2.5). Of the major end-use sectors, residential consumption increases the fastest, its share of the total overtaking that of industry to become the largest at the end of the projection period. The drivers of rising residential electricity consumption include higher standards of living – underpinned by a more than doubling of GDP per capita – increasing urbanisation and expanding electricity access.
Figure 2.5 ⊳ ASEAN final electricity consumption by sector
2011 2015 2020 2025 2030 2035
27%
32%
39%
25%
39%
35%
Total final consumption
Industry
Residential
Services
Tera
wat
t-ho
urs
300
600
900
1 200
1 500
1 800
10
20
30
40
50
60
2011 2015 2020 2025 2030 2035
50
100
150
200
250
300
Vehi
cles
per
thou
sand
peo
ple Rest of ASEAN
Thailand
Philippines
Malaysia
Indonesia
Vehicle ownership (right axis):
Mill
ion
vehi
cles
World average ASEAN average
© O
ECD
/IEA
, 201
3

Chapter 2 | Domestic energy prospects 43
2
Electricity generation
Generation capacity
Electricity generation capacity in Southeast Asia grows steadily, from 176 gigawatts (GW) in 2011 to almost 460 GW in 2035 (Figure 2.6). Gross capacity additions over the projection period (of almost 300 GW) are close to today’s installed capacity in Japan. Southeast Asia’s fleet of power plants shifts notably towards coal, which accounts for 40% of new capacity additions. Gas (26%) and hydro (15%) also add significant capacity. Oil-fired capacity falls, largely because of deteriorating economics as a result of high fuel costs, though some is maintained to serve the region’s isolated areas.
Figure 2.6 ⊳ ASEAN electricity generation capacity
Southeast Asia’s coal-fired capacity doubles between 2011 and 2020, reaching 80 GW, and doubles again between 2020 and 2035, rising to 160 GW. The move towards coal has already begun: coal-fired capacity represented 75% of the thermal capacity under construction at end-2012, with most of the projects located in Vietnam (12 GW) and Indonesia (8 GW). Expansion of coal-fired capacity is sustained throughout the projection period. The trend is driven by coal’s availability and affordability in the region, which makes it attractive compared with gas (see Spotlight).
Renewables-based electricity has excellent potential in Southeast Asia. Interest is strong in expanding renewables-based electricity because of the multiple energy security and environmental benefits on offer, such as greater diversity in the power mix, slower growth in energy imports and reduced local air pollution. The greatest potential lies in its hydro resources and, in particular, with countries in the Greater Mekong Subregion – Cambodia, Lao PDR, Myanmar, Thailand and Vietnam. To date, hydro has been the most exploited of the region’s renewable energy resources, with more than a quarter of the potential realised (IEA, 2010). While economic and energy security benefits make hydro an attractive source of generation, concerns have intensified over the sustainability of continued development, particularly related to environmental, fishery and social impacts. Southeast
100
200
300
400
500
2011 2020 2025 2030 2035
GW
Other renewables
Bioenergy
Geothermal
Hydro
Nuclear
Oil
Gas
Coal
© O
ECD
/IEA
, 201
3

44 World Energy Outlook 2013 | Special Report
Asia also has diverse and abundant biomass feedstocks, ranging from agriculture and forestry residues to forestry products. Most ASEAN countries have adopted targets for renewables-based capacity and/or generation. Indonesia, Malaysia, the Philippines and Thailand have financial support measures such as feed-in tariffs and tax exemptions to accelerate renewables deployment. Renewables capacity grows quickly in the New Policies Scenario, rising from 43 GW in 2012 to around 130 GW in 2035. Hydro is the biggest source of growth in renewables-based capacity, at 44 GW, with many new projects expected to come online in the Greater Mekong Subregion. Aside from a reduction in costs and more ambitious support measures, realising a large expansion of renewables in Southeast Asia hinges critically on the development of adequate grid infrastructure and access to it.
Nuclear power has a limited role in Southeast Asia over the Outlook period. This reflects the complexities of developing a nuclear power programme and the slow progress to date of most countries that have included nuclear in their long-term plans. Vietnam is the most active and is currently undertaking site preparation, work force training and the creation of a legal framework. Moreover, Vietnam has signed a co-operative agreement (that includes financing) with Russia to build its first nuclear power plant, with construction expected to begin in late 2014 and nuclear to enter the power mix before 2025. Thailand includes nuclear power in its Power Development Plan from 2026. While these plans could face public opposition, the country has very limited indigenous energy resources, which is expected to be a key driver behind its development. We project Thailand to start producing electricity from nuclear power plants before 2030.
Indonesia has the largest total gross electricity generation capacity additions (100 GW) in the region during the projection period. Almost half of these are coal-fired, driven by abundant coal reserves, particularly coal types that have low energy content and little to no value as exports. Thailand adds 55 GW over the period to 2035, mainly gas (44%) and coal (35%). The need to secure affordable fuel or electricity supply (as a result of domestic resource scarcity) and strong environmental considerations will compete to determine what type of capacity is built in Thailand, though hydro-generated electricity imports from Lao PDR and potentially coal-fired electricity imports from neighbouring countries should help to alleviate capacity needs. In Malaysia, a further 42 GW are installed over 2012-2035, also mainly gas (38%) and coal (33%). A key driver of Malaysia’s capacity additions will be the choice it faces, like Indonesia, to either use domestically produced gas or to export it as high-value LNG. Around 41 GW of capacity are added in the Philippines, mostly coal- and gas-fired plants. Vietnam is also expected to add significant power generation capacity.
Generation by source
In the New Policies Scenario, electricity generation in Southeast Asia grows by 4.2% per year on average, from 696 terawatt-hours (TWh) in 2011 to almost 1 900 TWh in 2035 (Table 2.2). At the end of the projection period, total generation in the region approaches that of Japan and Korea combined. With the exception of oil, all sources of electricity generation grow in absolute terms; however, there are important shifts in the mix. The
© O
ECD
/IEA
, 201
3
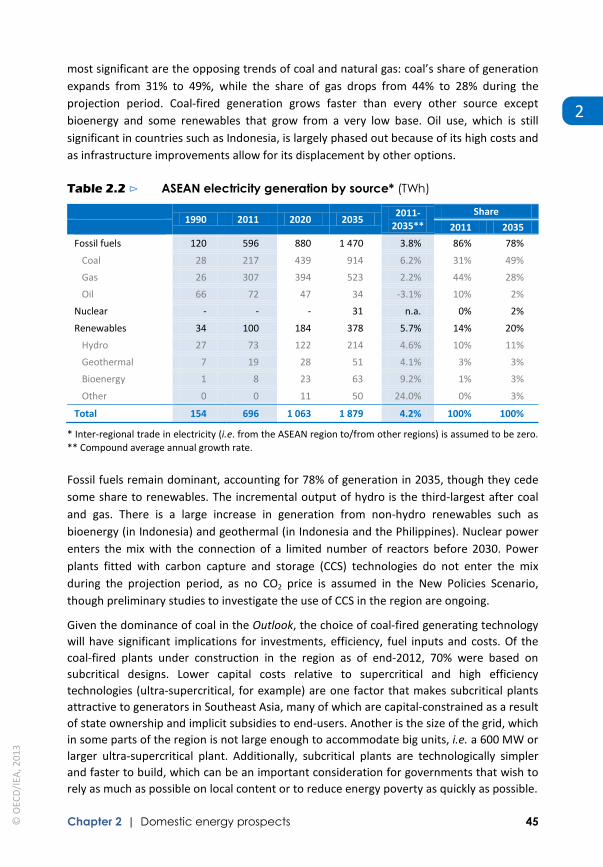
Chapter 2 | Domestic energy prospects 45
2
most significant are the opposing trends of coal and natural gas: coal’s share of generation expands from 31% to 49%, while the share of gas drops from 44% to 28% during the projection period. Coal-fired generation grows faster than every other source except bioenergy and some renewables that grow from a very low base. Oil use, which is still significant in countries such as Indonesia, is largely phased out because of its high costs and as infrastructure improvements allow for its displacement by other options.
Table 2.2 ⊳ ASEAN electricity generation by source* (TWh)
1990 2011 2020 2035 2011-
2035** Share
2011 2035
Fossil fuels 120 596 880 1 470 3.8% 86% 78%
Coal 28 217 439 914 6.2% 31% 49%
Gas 26 307 394 523 2.2% 44% 28%
Oil 66 72 47 34 -3.1% 10% 2%
Nuclear - - - 31 n.a. 0% 2%
Renewables 34 100 184 378 5.7% 14% 20%
Hydro 27 73 122 214 4.6% 10% 11%
Geothermal 7 19 28 51 4.1% 3% 3%
Bioenergy 1 8 23 63 9.2% 1% 3%
Other 0 0 11 50 24.0% 0% 3%
Total 154 696 1 063 1 879 4.2% 100% 100%
* Inter-regional trade in electricity (i.e. from the ASEAN region to/from other regions) is assumed to be zero. ** Compound average annual growth rate.
Fossil fuels remain dominant, accounting for 78% of generation in 2035, though they cede some share to renewables. The incremental output of hydro is the third-largest after coal and gas. There is a large increase in generation from non-hydro renewables such as bioenergy (in Indonesia) and geothermal (in Indonesia and the Philippines). Nuclear power enters the mix with the connection of a limited number of reactors before 2030. Power plants fitted with carbon capture and storage (CCS) technologies do not enter the mix during the projection period, as no CO2 price is assumed in the New Policies Scenario, though preliminary studies to investigate the use of CCS in the region are ongoing.
Given the dominance of coal in the Outlook, the choice of coal-fired generating technology will have significant implications for investments, efficiency, fuel inputs and costs. Of the coal-fired plants under construction in the region as of end-2012, 70% were based on subcritical designs. Lower capital costs relative to supercritical and high efficiency technologies (ultra-supercritical, for example) are one factor that makes subcritical plants attractive to generators in Southeast Asia, many of which are capital-constrained as a result of state ownership and implicit subsidies to end-users. Another is the size of the grid, which in some parts of the region is not large enough to accommodate big units, i.e. a 600 MW or larger ultra-supercritical plant. Additionally, subcritical plants are technologically simpler and faster to build, which can be an important consideration for governments that wish to rely as much as possible on local content or to reduce energy poverty as quickly as possible.
© O
ECD
/IEA
, 201
3

46 World Energy Outlook 2013 | Special Report
Who will win the competition in power generation – coal or gas?
Coal and gas are set to be the leading options for power generation in Southeast Asia over 2011-2035. Both fuels are available, can be transported by existing infrastructure to power plants near demand centres and can be transformed into electricity using proven technologies. Other sources will have a role in the mix, but may be limited during the projection period by their scalability (for example, nuclear and non-hydro renewables), affordability (oil) or isolated geography (hydro and geothermal).
A comparison of electricity generating costs demonstrates a strong competitive advantage for coal-fired power plants under a wide range of coal and gas prices (Figure 2.9). This is particularly true in Indonesia and nearby countries where cheap coal with low energy content can be consumed in new boilers and where transport costs will be lower. A further consideration is the impact on trade. Under the assumption that the price of gas remains higher than the price of coal during the projection period (in energy equivalent terms), countries will have a strong incentive to capture the profits or savings (depending on whether they export or import gas) associated with the price differential between the two fuels. Factors could support the choice of gas in certain circumstances, including: better environmental performance (reduced local pollution, with accompanying public health benefits, and lower CO2 emissions), limited grid size, system flexibility needs, lower capital costs and shorter construction times.
As long as fuel price differentials continue to favour coal over gas by a significant margin, Southeast Asia’s incremental power generation is set to be dominated by coal. But could LNG supplies from North America’s shale gas boom alter this outlook? In our view, they could play an important role by precipitating a change in the way that imported gas is priced, away from the prevailing link to oil prices (which is currently resulting in high costs for imported LNG) towards a system that reflects the costs of supply and the regional supply-demand balance for gas.
LNG from the United States, in particular, could have an impact on pricing mechanisms in the region because of the way that gas from the initial LNG export projects is being marketed: instead of being supported by long-term contracts, with pricing linked to the oil price and exports dedicated to a single destination, these projects are based on the Henry Hub price, plus a liquefaction fee, and there are no destination restrictions. As this LNG is effectively free to seek the most advantageous international market (expected to be in Asia), this could narrow the differences between regional gas prices towards levels that reflect the costs of liquefaction, shipping and regasification. The price effect would not be sufficient to bring gas into direct competition with coal for baseload power generation in Southeast Asia, but would enhance its attractiveness as a fuel to meet peak demands, provide flexibility or meet local air quality concerns.
S P O T L I G H T
© O
ECD
/IEA
, 201
3
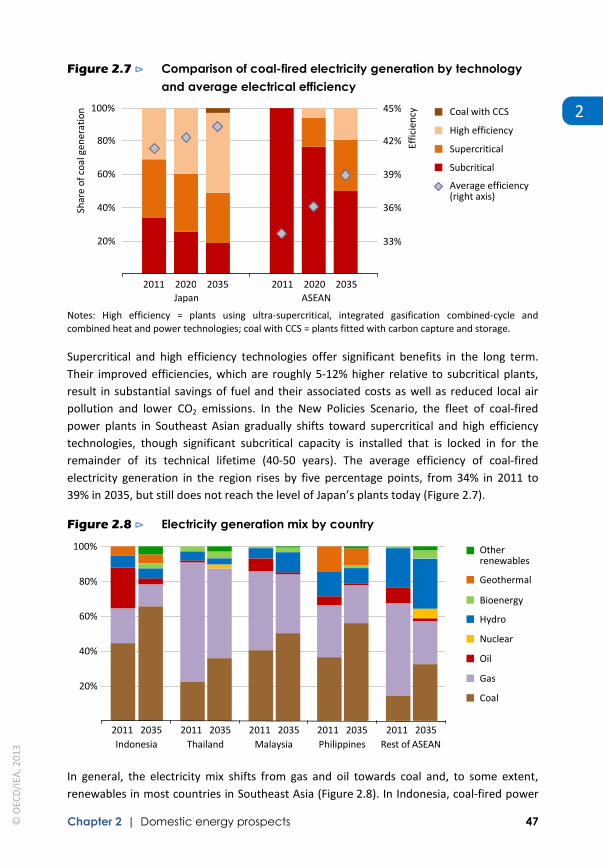
Chapter 2 | Domestic energy prospects 47
2
Figure 2.7 ⊳ Comparison of coal-fired electricity generation by technology and average electrical efficiency
Notes: High efficiency = plants using ultra-supercritical, integrated gasification combined-cycle and combined heat and power technologies; coal with CCS = plants fitted with carbon capture and storage.
Supercritical and high efficiency technologies offer significant benefits in the long term. Their improved efficiencies, which are roughly 5-12% higher relative to subcritical plants, result in substantial savings of fuel and their associated costs as well as reduced local air pollution and lower CO2 emissions. In the New Policies Scenario, the fleet of coal-fired power plants in Southeast Asian gradually shifts toward supercritical and high efficiency technologies, though significant subcritical capacity is installed that is locked in for the remainder of its technical lifetime (40-50 years). The average efficiency of coal-fired electricity generation in the region rises by five percentage points, from 34% in 2011 to 39% in 2035, but still does not reach the level of Japan’s plants today (Figure 2.7).
Figure 2.8 ⊳ Electricity generation mix by country
In general, the electricity mix shifts from gas and oil towards coal and, to some extent, renewables in most countries in Southeast Asia (Figure 2.8). In Indonesia, coal-fired power
20%
40%
60%
80%
100%
2011 2035
Other renewables
Geothermal
Bioenergy
Hydro
Nuclear
Oil
Gas
Coal
Indonesia Thailand Malaysia Philippines Rest of ASEAN 2011 2035 2011 2035 2011 2035 2011 2035
20%
40%
60%
80%
100%
2011 2020 2035 2011 2020 2035
Shar
e of
coa
l gen
erat
ion
33%
36%
39%
42%
45%
Effic
ienc
y Coal with CCS
High efficiency
Supercritical
Subcritical Average efficiency (right axis)
Japan ASEAN
© O
ECD
/IEA
, 201
3

48 World Energy Outlook 2013 | Special Report
generation increases by almost a factor of five over the period to 2035, essentially substituting for the decline in oil-fired generation, with some additional hydro, geothermal and other renewables entering the mix. Thailand sees some diversification of its electricity mix, which is heavily weighted towards gas at present, though gas still accounts for about 50% of electricity generation in 2035. In Malaysia, additional coal, bioenergy and hydro displace oil and decrease the role of gas by the end of the projection period. A large increase in coal-fired generation in the Philippines, which accounts for 56% of the mix in 2035, decreases the overall shares coming from geothermal and oil.
Generation costs
The competitiveness of coal versus gas is one of the key reasons for Southeast Asia’s shift towards coal in power generation (see Spotlight). This stems from the lower price of coal relative to gas in the region, as well as the higher export value of gas for countries that produce it. Future fuel price assumptions have a strong influence on investment decisions in new capacity, while operational decisions are impacted more by short-term price competition between fuels. The levelised cost of electricity generation – which includes fixed costs, variable costs (operations and maintenance, and fuel) and financing costs for new power plants – is used here to compare the generating costs of different technologies in Southeast Asia for plants built in the period 2020-2035 (Table 2.3).3 The analysis shows generating costs for competing technologies under different coal and gas price assumptions; all other parameters are held constant.
Table 2.3 ⊳ Assumed costs and operational features of key power generation technologies in ASEAN, 2020-2035
Capital cost ($/kW)
Non-fuel O&M cost
($/kW)
Thermal efficiency
Capacity factor
Construction time
(years)
Coal supercritical 1 500 60 41% 80% 5
Gas CCGT 700 25 58% 60% 3
Nuclear 4 500 123 33% 85% 7
Wind 1 600 21 n.a. 22% 1.5
Geothermal 4 000 40 15% 75% 4
Notes: The figures reflect assumptions in the New Policies Scenario and are used for the analysis of levelised electricity generating costs in Figure 2.9. All costs are in year-2012 dollars. The assumptions are considered representative averages for the region. Capital costs include interest during construction and costs such as legal expenses and engineering, procurement and construction. The thermal efficiencies listed are the maximum currently attainable by each technology under standard conditions. Environmental factors, such as ambient temperature, and operating conditions may mean that actual efficiencies achieved are lower. For coal and nuclear, capacity factors are estimated averages for baseload operation, with mid-load operation for gas. O&M = operating and maintenance; CCGT = combined-cycle gas turbine. Source: IEA databases.
3 The levelised cost of electricity is a useful for comparing the unit costs of technologies over their economic lifetime, but power companies also use portfolio investment-valuation methodologies to evaluate risks over their entire plant portfolio, rather than focusing on the technology with the lowest stand-alone generating costs. Depending on the project, different risk profiles may be acceptable for different technologies.
© O
ECD
/IEA
, 201
3

Chapter 2 | Domestic energy prospects 49
2
Coal has the cheapest generating costs in Southeast Asia over the range of assumptions analysed. With a coal price of $40/tonne, the generating cost of a new coal supercritical plant in Southeast Asia is about $45/megawatt-hour (MWh) over 2020-2035 (Figure 2.9). Doubling the coal price to $80/tonne, the generating cost rises to $60/MWh, which remains about 30% cheaper than the generating cost for a new CCGT with gas prices of $10/million British thermal units (MBtu). The economics of nuclear power and onshore wind compare favourably with new CCGTs if gas prices increase to $15/MBtu, though supercritical coal is still much cheaper than those options. Generating costs for geothermal can be competitive in Southeast Asia, particularly in Indonesia and the Philippines, however its feasibility depends on site specific factors.
Figure 2.9 ⊳ Electricity generation costs in ASEAN under different coal and gas price assumptions, 2020-2035
* Includes fuel costs, which are a small share of the total. Notes: Assumed capital costs, non-fuel operating and maintenance (O&M) costs, thermal efficiency and construction lead times by technology are in Table 2.3. The assumed economic lifetimes of plants – the period over which the initial investment is recovered – are assumed to be 30 years for coal; 25 years for CCGTs; 35 years for nuclear; 20 years for wind; and 25 years for geothermal. The weighted average cost of capital is assumed to be 8%. No CO2 price is assumed.
Transmission and distribution
Electricity transmission and distribution (T&D) networks in Southeast Asian countries vary in terms of their coverage of end-users, reliability and interconnectivity at the regional and national levels. In 2011, the region’s networks comprised 3.1 million kilometres (km) of T&D lines, managed mostly by state-owned enterprises. Average T&D losses were around 8% in 2011, close to the world average, being highest in Myanmar (16%). The recent occurrence of several large blackouts across the region shows that there remains room to improve grid reliability.4 In most countries, grid density is low. Future investment will need
4 Within a matter of weeks in May 2013, large blackouts were experienced in the Philippines, where the outage of five power plants caused 40% of the island of Luzon to lose power (including Manila); Thailand, where lightning disrupted power transmission to fourteen southern provinces for two hours; and Vietnam, where transmission line work knocked out power to 22 provinces in the south and Cambodia for ten hours.
20
40
60
80
100
120
Supercritical coal CCGT Nuclear* Wind Geothermal
Dol
lars
per
MW
h (2
012)
$120/tonne $80/tonne $40/tonne
Fuel costs - coal:
Fuel costs - gas:
Capital and non-fuel O&M
$15/MBtu $10/MBtu $5/MBtu
© O
ECD
/IEA
, 201
3

50 World Energy Outlook 2013 | Special Report
to concentrate on building adequate T&D capacity to accommodate new demand and generation, as well as to ensure a reasonable degree of redundancy. The region is projected to need an additional 250 000 km of transmission lines, mostly between its main demand centres, and a further 4.0 million km of distribution lines to connect end-users between 2011 and 2035.
Existing interconnections between countries already facilitate some electricity trade. In the Greater Mekong Subregion (which includes Cambodia, Lao PDR, Myanmar, Thailand, Vietnam and parts of China), interconnected power capacity is presently near 4 GW,5 while Peninsular Malaysia is linked with Thailand and Singapore. Additionally, interconnections with China are important for Southeast Asia to facilitate trade. Vietnam imports electricity from China, while Lao PDR exports electricity generated from hydro facilities to China (as Myanmar also plans to do in the future). A rich and diverse portfolio of resources, combined with quickly growing electricity needs in markets that are sometimes far from potential suppliers, point to further integration of grids (both cross-border and national) where it is viable technically and financially. The benefits for Southeast Asia could include lower costs – by taking advantage of the cheapest resources and sharing reserve margins, which would obviate the need for some additional generating capacity – and enhanced reliability.6
Grid integration is a central objective of the ASEAN Power Grid (APG) and its development under the ASEAN Plan of Action on Energy Cooperation for the period 2010-2015. Plans are in place to develop thirteen new interconnections with a transmission capacity of 19 GW over the next decade, many in conjunction with the installation of large hydro capacity (Ford, 2012). Projects in the Greater Mekong Subregion are likely to be developed more quickly given its contiguous geography and the clear opportunities for electricity trade. Lao PDR, already a key net exporter, is set to become an even more important regional supplier in the next few years. Thailand and Cambodia are both net importers and are expected to be joined soon by Vietnam. Myanmar has great potential for growth in generating capacity (especially hydro), but also significant unserved domestic demand.
Investment
Cumulative investment of about $990 billion is required in Southeast Asia’s power sector through to 2035, representing more than half of the total amount needed in the region’s energy-supply infrastructure. We project that almost $440 billion goes towards power plants, with 40% of that in coal-fired capacity, reflecting investors’ strong preference for coal given its competitiveness versus alternatives; hydro (23%) and other renewables (17%) also account for significant shares. T&D networks must expand considerably to meet higher
5 About 70% is accounted for by the high-capacity Roe Et2–Nam Theun link that enables exports of electricity generated by Lao PDR’s large hydro resources to Thailand. 6 The Heads of ASEAN Power Utilities and Authorities estimate that planned interconnection projects will save member countries $788 million per year. The Government of Thailand estimates that regional savings on power generation and lower energy imports would be $1.9 billion per year.
© O
ECD
/IEA
, 201
3
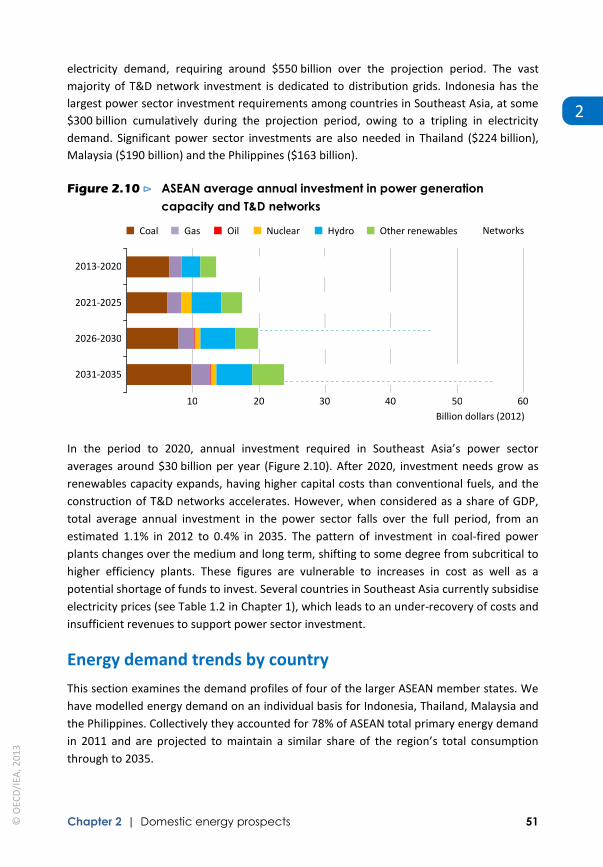
Chapter 2 | Domestic energy prospects 51
2
electricity demand, requiring around $550 billion over the projection period. The vast majority of T&D network investment is dedicated to distribution grids. Indonesia has the largest power sector investment requirements among countries in Southeast Asia, at some $300 billion cumulatively during the projection period, owing to a tripling in electricity demand. Significant power sector investments are also needed in Thailand ($224 billion), Malaysia ($190 billion) and the Philippines ($163 billion).
Figure 2.10 ⊳ ASEAN average annual investment in power generation capacity and T&D networks
In the period to 2020, annual investment required in Southeast Asia’s power sector averages around $30 billion per year (Figure 2.10). After 2020, investment needs grow as renewables capacity expands, having higher capital costs than conventional fuels, and the construction of T&D networks accelerates. However, when considered as a share of GDP, total average annual investment in the power sector falls over the full period, from an estimated 1.1% in 2012 to 0.4% in 2035. The pattern of investment in coal-fired power plants changes over the medium and long term, shifting to some degree from subcritical to higher efficiency plants. These figures are vulnerable to increases in cost as well as a potential shortage of funds to invest. Several countries in Southeast Asia currently subsidise electricity prices (see Table 1.2 in Chapter 1), which leads to an under-recovery of costs and insufficient revenues to support power sector investment.
Energy demand trends by country
This section examines the demand profiles of four of the larger ASEAN member states. We have modelled energy demand on an individual basis for Indonesia, Thailand, Malaysia and the Philippines. Collectively they accounted for 78% of ASEAN total primary energy demand in 2011 and are projected to maintain a similar share of the region’s total consumption through to 2035.
10 20 30 40 50 60
2031-2035
2026-2030
2021-2025
2013-2020
Billion dollars (2012)
Coal Oil Nuclear Hydro Other renewables Networks Gas
© O
ECD
/IEA
, 201
3

52 World Energy Outlook 2013 | Special Report
Indonesia
Indonesia is the largest energy consumer in Southeast Asia, accounting for 36% of the region’s total primary consumption in 2011. It is a net importer of oil, but the world’s top exporter of steam coal and also a major supplier of LNG. As the largest and most populous archipelago in the world, providing modern energy access is an important challenge: currently 27% of the population lacks access to electricity, which partly explains its low level of per-capita energy consumption, at around one-fifth of the OECD average.
In the New Policies Scenario, Indonesia’s total primary energy demand growth averages 2.5% per year over 2011-2035, rising from 196 Mtoe to nearly 360 Mtoe (Table 2.4). Over the period, its population expands from 242 million to 302 million and its economy grows by around 220%. Its per-capita consumption rises by 46%, from 0.8 toe in 2011 to 1.2 toe in 2035, but is still just 30% of the OECD average in 2035.
Table 2.4 ⊳ Primary energy demand in Indonesia by fuel (Mtoe)
1990 2011 2020 2025 2035 2011-2035*
Coal 4 31 60 78 115 5.5%
Oil 33 73 84 87 95 1.1%
Gas 16 35 46 53 71 3.0%
Hydro 0.5 1.1 1.6 2.1 2.7 4.0%
Bioenergy** 34 40 39 37 38 -0.3%
Other renewables 2 16 21 25 37 3.5%
Total 89 196 252 282 358 2.5%
* Compound average annual growth rate. ** Includes traditional and modern biomass uses.
Fossil fuels continue to dominate Indonesia’s energy mix throughout the Outlook period, accounting for 79% of primary energy use in 2035, up from 71% in 2011. In the New Policies Scenario, its oil demand rises from 1.5 mb/d in 2012 to 2.1 mb/d in 2035. Oil’s share of the fuel mix declines from 37% to 27%, mainly on reduced use in the power sector and a gradual shift to alternative fuels in transport. Coal demand more than triples, to 115 Mtoe, as it overtakes oil as the dominant fuel in the mix with its share rising by sixteen percentage points to 32% in 2035. Growth in coal use is particularly rapid in the medium term, linked to the completion of the two “Fast Track” programmes (see Table 1.5 in Chapter 1); which are largely based on coal-fired power generation. The need to increasingly rely on relatively expensive LNG dampens growth in demand for natural gas, although its use still more than doubles from around 40 bcm in 2012 to 81 bcm in 2035, driven by expanded use in fertiliser production, power generation and industry. Prospects for gas use in the near term are closely tied to the completion of projects to construct floating storage and regasification units; the first unit (West Java) started operating in the Jakarta Gulf in 2012, two other are under construction (Arun and Lampung) and a further two are planned.
With the exception of traditional biomass, today’s use of renewable energy in Indonesia is limited relative to its plentiful resources. In 2035, renewables represent 21% of the primary energy mix, down from 29% in 2011. This reduced share of renewables reflects falling
© O
ECD
/IEA
, 201
3
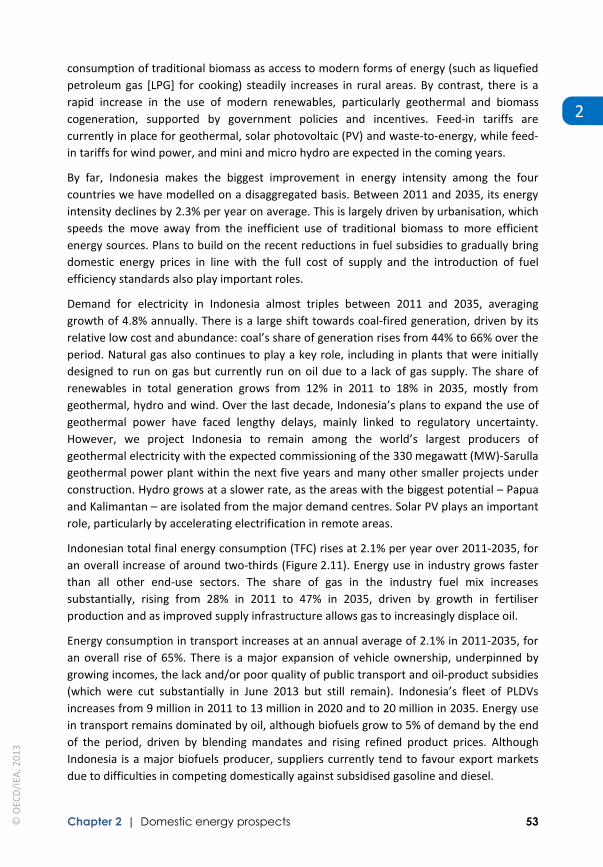
Chapter 2 | Domestic energy prospects 53
2
consumption of traditional biomass as access to modern forms of energy (such as liquefied petroleum gas [LPG] for cooking) steadily increases in rural areas. By contrast, there is a rapid increase in the use of modern renewables, particularly geothermal and biomass cogeneration, supported by government policies and incentives. Feed-in tariffs are currently in place for geothermal, solar photovoltaic (PV) and waste-to-energy, while feed-in tariffs for wind power, and mini and micro hydro are expected in the coming years.
By far, Indonesia makes the biggest improvement in energy intensity among the four countries we have modelled on a disaggregated basis. Between 2011 and 2035, its energy intensity declines by 2.3% per year on average. This is largely driven by urbanisation, which speeds the move away from the inefficient use of traditional biomass to more efficient energy sources. Plans to build on the recent reductions in fuel subsidies to gradually bring domestic energy prices in line with the full cost of supply and the introduction of fuel efficiency standards also play important roles.
Demand for electricity in Indonesia almost triples between 2011 and 2035, averaging growth of 4.8% annually. There is a large shift towards coal-fired generation, driven by its relative low cost and abundance: coal’s share of generation rises from 44% to 66% over the period. Natural gas also continues to play a key role, including in plants that were initially designed to run on gas but currently run on oil due to a lack of gas supply. The share of renewables in total generation grows from 12% in 2011 to 18% in 2035, mostly from geothermal, hydro and wind. Over the last decade, Indonesia’s plans to expand the use of geothermal power have faced lengthy delays, mainly linked to regulatory uncertainty. However, we project Indonesia to remain among the world’s largest producers of geothermal electricity with the expected commissioning of the 330 megawatt (MW)-Sarulla geothermal power plant within the next five years and many other smaller projects under construction. Hydro grows at a slower rate, as the areas with the biggest potential – Papua and Kalimantan – are isolated from the major demand centres. Solar PV plays an important role, particularly by accelerating electrification in remote areas.
Indonesian total final energy consumption (TFC) rises at 2.1% per year over 2011-2035, for an overall increase of around two-thirds (Figure 2.11). Energy use in industry grows faster than all other end-use sectors. The share of gas in the industry fuel mix increases substantially, rising from 28% in 2011 to 47% in 2035, driven by growth in fertiliser production and as improved supply infrastructure allows gas to increasingly displace oil.
Energy consumption in transport increases at an annual average of 2.1% in 2011-2035, for an overall rise of 65%. There is a major expansion of vehicle ownership, underpinned by growing incomes, the lack and/or poor quality of public transport and oil-product subsidies (which were cut substantially in June 2013 but still remain). Indonesia’s fleet of PLDVs increases from 9 million in 2011 to 13 million in 2020 and to 20 million in 2035. Energy use in transport remains dominated by oil, although biofuels grow to 5% of demand by the end of the period, driven by blending mandates and rising refined product prices. Although Indonesia is a major biofuels producer, suppliers currently tend to favour export markets due to difficulties in competing domestically against subsidised gasoline and diesel.
© O
ECD
/IEA
, 201
3

54 World Energy Outlook 2013 | Special Report
Figure 2.11 ⊳ Incremental energy demand in Indonesia by sector and fuel, 2011-2035
* Other sectors includes agriculture and non-energy use. Notes: TPED = total primary energy demand; TFC = total final consumption.
Energy demand in the buildings sector grows at 1% per year on average in 2011-2035, the slowest rate of growth of all sectors. This is primarily due to the residential sub-sector (which dominates overall energy use in the sector) where demand increases at a moderate rate as more efficient energy sources replace the inefficient use of traditional biomass, and as policies to improve efficiency take effect, including appliance labelling and performance standards. By contrast, energy demand in the services sub-sector continues to experience rapid growth. Electricity displaces biomass as the dominant fuel in the buildings sector, with its share rising from just 18% in 2011 to 50% in 2035, based on improved access to electricity and strong demand for electrical appliances.
Indonesia’s energy-related CO2 emissions rise from an estimated 426 million tonnes (Mt) in 2011 to more than 800 Mt in 2035. This represents a significantly faster rate of growth than in energy demand, reflecting the increasing share of fossil fuels in the primary energy mix. Per-capita emissions rise from 18% to 38% of the OECD average over the period.
Thailand
Thailand has the second-highest primary energy demand in ASEAN, at 118 Mtoe in 2011, a little over 20% of the region’s consumption. It is heavily dependent on energy imports due to its limited indigenous resources. In the New Policies Scenario, Thai primary energy demand grows at 2.3% on average per year between 2011 and 2035, for an overall rise of 75% (Table 2.5). Key drivers include ongoing urbanisation (although the population is stable throughout the period, at around 70 million) and a near tripling in the size of its economy. Per-capita energy use continues to increase, reaching 3 toe in 2035, or almost three-quarters of the OECD average.
3.9%
-20 0 20 40 60 80 100 120
Other sectors*
Buildings
Transport
Industry
Power generation
Mtoe
Coal
Oil
Gas
Hydro
Bioenergy
Other renewables
Electricity
%
TFC
TPED
Other energy sector
Compound average annual growth rate
4.1%
2.9%
2.1%
1.0%
2.4%
© O
ECD
/IEA
, 201
3
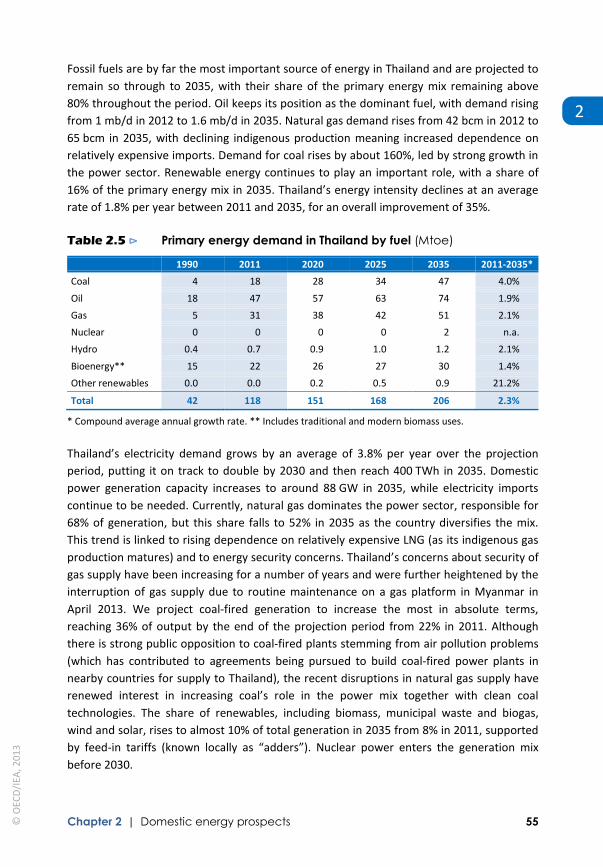
Chapter 2 | Domestic energy prospects 55
2
Fossil fuels are by far the most important source of energy in Thailand and are projected to remain so through to 2035, with their share of the primary energy mix remaining above 80% throughout the period. Oil keeps its position as the dominant fuel, with demand rising from 1 mb/d in 2012 to 1.6 mb/d in 2035. Natural gas demand rises from 42 bcm in 2012 to 65 bcm in 2035, with declining indigenous production meaning increased dependence on relatively expensive imports. Demand for coal rises by about 160%, led by strong growth in the power sector. Renewable energy continues to play an important role, with a share of 16% of the primary energy mix in 2035. Thailand’s energy intensity declines at an average rate of 1.8% per year between 2011 and 2035, for an overall improvement of 35%.
Table 2.5 ⊳ Primary energy demand in Thailand by fuel (Mtoe)
1990 2011 2020 2025 2035 2011-2035*
Coal 4 18 28 34 47 4.0%
Oil 18 47 57 63 74 1.9%
Gas 5 31 38 42 51 2.1%
Nuclear 0 0 0 0 2 n.a.
Hydro 0.4 0.7 0.9 1.0 1.2 2.1%
Bioenergy** 15 22 26 27 30 1.4%
Other renewables 0.0 0.0 0.2 0.5 0.9 21.2%
Total 42 118 151 168 206 2.3%
* Compound average annual growth rate. ** Includes traditional and modern biomass uses.
Thailand’s electricity demand grows by an average of 3.8% per year over the projection period, putting it on track to double by 2030 and then reach 400 TWh in 2035. Domestic power generation capacity increases to around 88 GW in 2035, while electricity imports continue to be needed. Currently, natural gas dominates the power sector, responsible for 68% of generation, but this share falls to 52% in 2035 as the country diversifies the mix. This trend is linked to rising dependence on relatively expensive LNG (as its indigenous gas production matures) and to energy security concerns. Thailand’s concerns about security of gas supply have been increasing for a number of years and were further heightened by the interruption of gas supply due to routine maintenance on a gas platform in Myanmar in April 2013. We project coal-fired generation to increase the most in absolute terms, reaching 36% of output by the end of the projection period from 22% in 2011. Although there is strong public opposition to coal-fired plants stemming from air pollution problems (which has contributed to agreements being pursued to build coal-fired power plants in nearby countries for supply to Thailand), the recent disruptions in natural gas supply have renewed interest in increasing coal’s role in the power mix together with clean coal technologies. The share of renewables, including biomass, municipal waste and biogas, wind and solar, rises to almost 10% of total generation in 2035 from 8% in 2011, supported by feed-in tariffs (known locally as “adders”). Nuclear power enters the generation mix before 2030.
© O
ECD
/IEA
, 201
3

56 World Energy Outlook 2013 | Special Report
Thailand’s total final energy consumption increases at 2.3% per year over the period, for an overall increase of 73% (Figure 2.12). Industry is currently the largest end-use sector, representing a little less than one-third of total final demand in 2011. In the New Policies Scenario, industrial energy demand increases by almost three-quarters, to 47 Mtoe in 2035, driven by growth in a wide range of sub-sectors. Policies to promote energy efficiency contribute to a slowdown in growth compared with the much faster rates seen over the last two decades. Coal, mainly for cement manufacturing, remains the dominant fuel with a share of industrial energy demand that drops slightly to 33% in 2035. Demand for electricity increases at a faster rate, pushing its share of the industrial fuel mix from 20% in 2011 to 25% in 2035. Non-energy use, which mainly constitutes naphtha and natural gas used as feedstocks for petrochemical manufacturing, maintains a share of around 20% of final energy demand throughout the period.7
Figure 2.12 ⊳ Incremental energy demand in Thailand by sector and fuel, 2011-2035
* Other sectors includes agriculture and non-energy use. Notes: TPED = total primary energy demand; TFC = total final consumption.
In the New Policies Scenario, transport almost overtakes industry as the largest end-use sector: its demand increases to 41 Mtoe, with annual growth averaging 3% over 2011-2035. The main driver is growth in private vehicles (with the number of PLDVs rising to 10 million in 2035, from 3 million in 2011) as well as buses, trucks and light commercial vehicles. The impact of rising demand for mobility on energy use (and local air pollution) is partly offset by efficiency improvements and a shift to greater use of public transport, notably in the Bangkok region. Oil remains the dominant transport fuel, although its share of transport energy demand declines to 84% in 2035. By contrast, the share of gas increases to 10% and biofuels to 6%, underpinned by a range of support mechanisms to make them more attractive vis-à-vis oil-based fuels and an expansion of natural gas vehicle filling stations.
7 Following statistical convention, fuel that is not combusted but is used by industry for other purposes (such as petrochemical feedstocks) is defined as non-energy use and is excluded from industrial energy demand.
-10 0 10 20 30 40 50
3.7%
-0.3%
2.3%
3.0%
2.4%
1.6%
Mtoe
Other sectors*
Buildings
Transport
Industry
Power generation
TFC
TPED
Other energy sector
Coal Oil
Gas
Hydro
Bioenergy Other renewables
Electricity % Compound
average annual growth rate
Nuclear
© O
ECD
/IEA
, 201
3
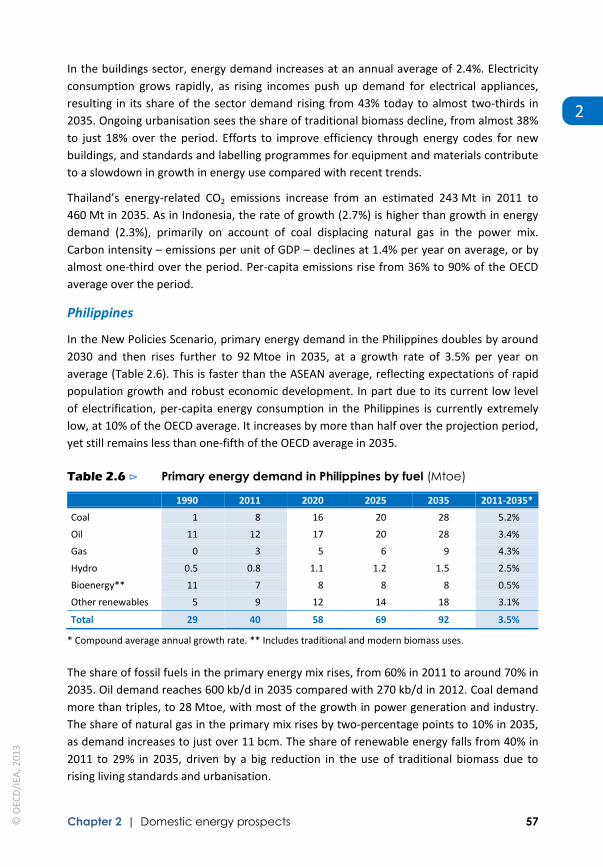
Chapter 2 | Domestic energy prospects 57
2
In the buildings sector, energy demand increases at an annual average of 2.4%. Electricity consumption grows rapidly, as rising incomes push up demand for electrical appliances, resulting in its share of the sector demand rising from 43% today to almost two-thirds in 2035. Ongoing urbanisation sees the share of traditional biomass decline, from almost 38% to just 18% over the period. Efforts to improve efficiency through energy codes for new buildings, and standards and labelling programmes for equipment and materials contribute to a slowdown in growth in energy use compared with recent trends.
Thailand’s energy-related CO2 emissions increase from an estimated 243 Mt in 2011 to 460 Mt in 2035. As in Indonesia, the rate of growth (2.7%) is higher than growth in energy demand (2.3%), primarily on account of coal displacing natural gas in the power mix. Carbon intensity – emissions per unit of GDP – declines at 1.4% per year on average, or by almost one-third over the period. Per-capita emissions rise from 36% to 90% of the OECD average over the period.
Philippines
In the New Policies Scenario, primary energy demand in the Philippines doubles by around 2030 and then rises further to 92 Mtoe in 2035, at a growth rate of 3.5% per year on average (Table 2.6). This is faster than the ASEAN average, reflecting expectations of rapid population growth and robust economic development. In part due to its current low level of electrification, per-capita energy consumption in the Philippines is currently extremely low, at 10% of the OECD average. It increases by more than half over the projection period, yet still remains less than one-fifth of the OECD average in 2035.
Table 2.6 ⊳ Primary energy demand in Philippines by fuel (Mtoe)
1990 2011 2020 2025 2035 2011-2035*
Coal 1 8 16 20 28 5.2%
Oil 11 12 17 20 28 3.4%
Gas 0 3 5 6 9 4.3%
Hydro 0.5 0.8 1.1 1.2 1.5 2.5%
Bioenergy** 11 7 8 8 8 0.5%
Other renewables 5 9 12 14 18 3.1%
Total 29 40 58 69 92 3.5%
* Compound average annual growth rate. ** Includes traditional and modern biomass uses.
The share of fossil fuels in the primary energy mix rises, from 60% in 2011 to around 70% in 2035. Oil demand reaches 600 kb/d in 2035 compared with 270 kb/d in 2012. Coal demand more than triples, to 28 Mtoe, with most of the growth in power generation and industry. The share of natural gas in the primary mix rises by two-percentage points to 10% in 2035, as demand increases to just over 11 bcm. The share of renewable energy falls from 40% in 2011 to 29% in 2035, driven by a big reduction in the use of traditional biomass due to rising living standards and urbanisation.
© O
ECD
/IEA
, 201
3
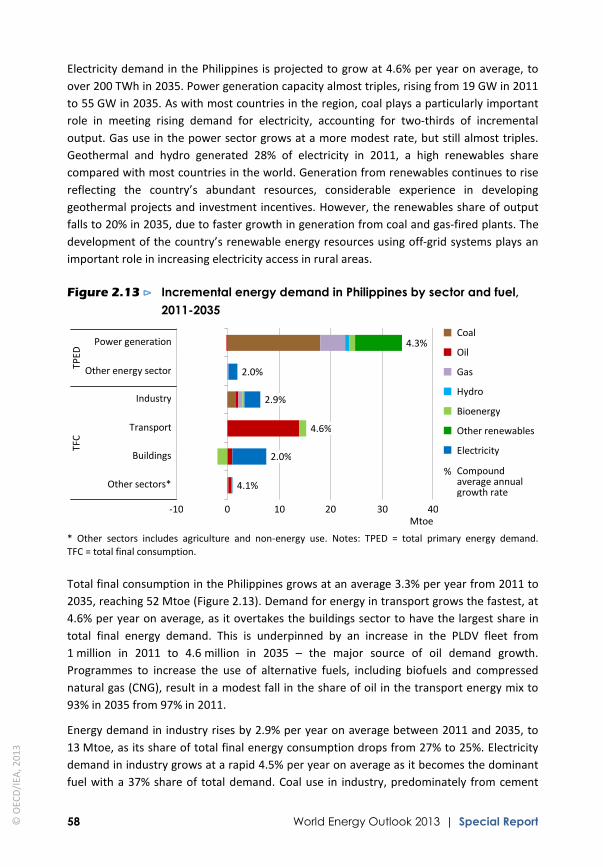
58 World Energy Outlook 2013 | Special Report
Electricity demand in the Philippines is projected to grow at 4.6% per year on average, to over 200 TWh in 2035. Power generation capacity almost triples, rising from 19 GW in 2011 to 55 GW in 2035. As with most countries in the region, coal plays a particularly important role in meeting rising demand for electricity, accounting for two-thirds of incremental output. Gas use in the power sector grows at a more modest rate, but still almost triples. Geothermal and hydro generated 28% of electricity in 2011, a high renewables share compared with most countries in the world. Generation from renewables continues to rise reflecting the country’s abundant resources, considerable experience in developing geothermal projects and investment incentives. However, the renewables share of output falls to 20% in 2035, due to faster growth in generation from coal and gas-fired plants. The development of the country’s renewable energy resources using off-grid systems plays an important role in increasing electricity access in rural areas.
Figure 2.13 ⊳ Incremental energy demand in Philippines by sector and fuel, 2011-2035
* Other sectors includes agriculture and non-energy use. Notes: TPED = total primary energy demand. TFC = total final consumption.
Total final consumption in the Philippines grows at an average 3.3% per year from 2011 to 2035, reaching 52 Mtoe (Figure 2.13). Demand for energy in transport grows the fastest, at 4.6% per year on average, as it overtakes the buildings sector to have the largest share in total final energy demand. This is underpinned by an increase in the PLDV fleet from 1 million in 2011 to 4.6 million in 2035 – the major source of oil demand growth. Programmes to increase the use of alternative fuels, including biofuels and compressed natural gas (CNG), result in a modest fall in the share of oil in the transport energy mix to 93% in 2035 from 97% in 2011.
Energy demand in industry rises by 2.9% per year on average between 2011 and 2035, to 13 Mtoe, as its share of total final energy consumption drops from 27% to 25%. Electricity demand in industry grows at a rapid 4.5% per year on average as it becomes the dominant fuel with a 37% share of total demand. Coal use in industry, predominately from cement
-10 0 10 20 30 40 Mtoe
4.3%
2.0%
2.9%
4.6%
2.0%
4.1%
Coal
Oil
Gas
Hydro
Bioenergy
Other renewables
Electricity
% Compound average annual growth rate
TFC
TPED
Power generation
Other energy sector
Industry
Transport
Buildings
Other sectors*
© O
ECD
/IEA
, 201
3

Chapter 2 | Domestic energy prospects 59
2
manufacturing, rises at an average 2.5% per year as its share of total industrial energy demand drops by three percentage points to 27%.
Energy demand in the buildings sector as a share of total final consumption drops from a 37% to 27% over the period, reflecting average annual growth of 2%. Traditional biomass is currently the dominant fuel in the sector, meeting almost two-fifths of demand, but this falls to just 7% in 2035 as rising incomes and urbanisation foster the uptake of more efficient modern fuels. The Philippines is working to improve energy access as a means of poverty alleviation and is aiming at 90% household electrification by 2017 and 100% sitio (neighbourhood) electrification by 2015. Electricity use in buildings expands rapidly, at 4.9% per year on average, pushing its share of the sector’s energy demand from 35% to 68%.
The Philippines energy-related CO2 emissions rise by 176%, from 77 Mt in 2011 to 213 Mt in 2035, with the rising share of coal in the energy mix being the main driver. When measured on a per-capita basis, emissions rise from 8% to 21% of the OECD average over the period.
Malaysia
Malaysia is the third-largest energy consumer in the ASEAN region and a large net exporter of oil and natural gas. In the New Policies Scenario, Malaysia’s population increases at an average annual rate of 1.2% between 2011 and 2035, reaching 39 million. During the same period, its GDP increases at 4% per year on average. These factors help drive an increase in Malaysian primary energy demand of 71% in 2011-2035, annual average growth of 2.3% (Table 2.7). Growth in demand slows over time as growth in population and GDP moderate. Malaysia’s per-capita energy consumption is currently relatively high for the region, at 61% of the OECD average. It continues to rise, reaching 83% of the OECD average in 2035. Efficiency improvements and a gradual shift to a less energy-intensive economic structure contribute to a decline in energy intensity of 1.7% per year on average, for an overall improvement of almost one-third.
Table 2.7 ⊳ Primary energy demand in Malaysia by fuel (Mtoe)
1990 2011 2020 2025 2035 2011-2035*
Coal 1 15 24 29 39 3.9%
Oil 11 28 33 35 40 1.6%
Gas 6 28 34 37 41 1.5%
Hydro 0.3 0.7 1.6 1.9 2.9 6.4%
Bioenergy** 1.8 2.2 2.8 3.2 4.4 3.0%
Other renewables 0.0 0.0 0.1 0.1 0.4 48.1%
Total 21 74 96 106 128 2.3%
* Compound average annual growth rate. ** Includes traditional and modern biomass uses.
The share of fossil fuels in Malaysia’s primary energy mix stays well above 90% through the projection period. Natural gas loses market share but remains the dominant fuel in the mix, with demand rising from 36 bcm in 2012 to 48 bcm in 2035. Demand for coal, however,
© O
ECD
/IEA
, 201
3

60 World Energy Outlook 2013 | Special Report
grows at a faster rate as it is increasingly favoured in power generation and gas subsidies are progressively reduced. Oil demand grows at 1.6% per year on average, increasing from 0.6 mb/d in 2012 to 0.85 mb/d in 2035. The use of renewable energy grows rapidly from a low base, pushing its share of primary demand from 4% to 6% over the period.
Malaysian electricity demand doubles by 2030 and then increases further to just over 300 TWh in 2035. This requires an expansion of installed power generation capacity from 29 GW in 2011 to 67 GW in 2035. Coal becomes the fuel of choice on economic grounds as natural gas will increasingly have to be sourced from higher cost imports and indigenous supplies mature. Coal’s share of generation rises from 41% to 50% over the period. Generation from natural gas continues to rise, but its share of total output declines by eleven percentage points to 34%. Renewables account for 15% of generation in 2035 from 7% in 2011, with the bulk of the growth from hydropower. The region of Sarawak, a Malaysian state on the island of Borneo, has large hydropower resources that are being developed as part of the Sarawak Corridor of Renewable Energy (SCORE) to attract industries by offering competitively priced power, and to produce power for other parts of the country and for export to Brunei. SCORE includes the Bakun Hydropower Project (2 400 MW) that is expected to be fully operational in 2014 as well as a number of other large hydropower plants, such as the Baleh (950 MW), Murum (900 MW) and Baram (1 000 MW) plants, all of which are under construction.
Figure 2.14 ⊳ Incremental energy demand in Malaysia by sector and fuel, 2011-2035
* Other sectors includes agriculture and non-energy use. Notes: TPED = total primary energy demand. TFC = total final consumption.
Total final consumption almost doubles between 2011 and 2035, reaching 85 Mtoe. Industry overtakes transport as the largest end-user, but its demand slows over time due to energy pricing reforms and a gradual transition away from energy-intensive industries (Figure 2.14). Electricity and natural gas continue to dominate the energy mix in industry, both registering annual average growth of 4.2% over the period. Growth in natural gas is
-10 0 10 20 30 40 Mtoe
3.0%
-1.9%
3.9%
2.1%
3.1%
2.3%
Coal
Oil
Gas
Hydro
Bioenergy
Other renewables
Electricity
% Compound average annual growth rate
Other sectors*
Buildings
Transport
Industry
Power generation
TFC
TPED
Other energy sector
© O
ECD
/IEA
, 201
3
Chapter 2 | Domestic energy prospects 61
2
boosted in the near term by LNG imports to Peninsular Malaysia, which help overcome shortages of supply that have been restricting gas use in industry and enable shifts to natural gas from diesel and LPG.
Energy demand in the transport sector increases by over three-fifths, yet its share of total final energy use decreases from 33% in 2011 to 28% in 2035. Growth slows over the period in line with reforms to fuel subsidies, efficiency improvements, more use of public transport and vehicle saturation. The PLDV stock climbs from around 8 million in 2011 to 15 million in 2035. Oil-based fuels continue to dominate transport, although natural gas, and to a lesser extent biofuels, start to gain market share.
In the buildings sector, energy demand is projected to increase by 3.1% per year on average between 2011 and 2035. Electricity dominates energy use in buildings as Malaysia has achieved almost universal electrification, and as an upper middle-income economy it has a relatively high penetration of electric appliances, such as air conditioners and refrigerators. The share of electricity in total buildings sector energy use rises from 70% in 2011 to 78% over the period. Oil, predominately in the form of LPG used for cooking, remains the second-largest share, but it drops from 25% to 15% over the period.
Malaysia’s energy-related CO2 emissions increase by 75%, rising from 195 Mt in 2011 to 340 Mt in 2035. Carbon intensity – emissions per unit of GDP – declines at 1.6% per year on average. When measured on a per-capita basis, its emissions exceed the OECD average before 2030, from around 70% of the OECD average in 2011.
© O
ECD
/IEA
, 201
3

© O
ECD
/IEA
, 201
3
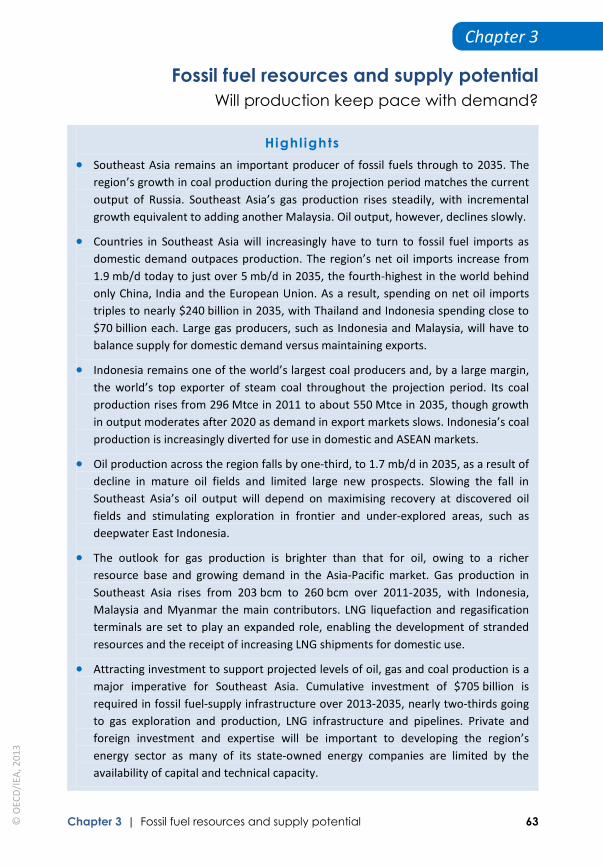
Chapter 3 | Fossil fuel resources and supply potential 63
Chapter 3
Fossil fuel resources and supply potential Will production keep pace with demand?
Highl ights • Southeast Asia remains an important producer of fossil fuels through to 2035. The
region’s growth in coal production during the projection period matches the current output of Russia. Southeast Asia’s gas production rises steadily, with incremental growth equivalent to adding another Malaysia. Oil output, however, declines slowly.
• Countries in Southeast Asia will increasingly have to turn to fossil fuel imports as domestic demand outpaces production. The region’s net oil imports increase from 1.9 mb/d today to just over 5 mb/d in 2035, the fourth-highest in the world behind only China, India and the European Union. As a result, spending on net oil imports triples to nearly $240 billion in 2035, with Thailand and Indonesia spending close to $70 billion each. Large gas producers, such as Indonesia and Malaysia, will have to balance supply for domestic demand versus maintaining exports.
• Indonesia remains one of the world’s largest coal producers and, by a large margin, the world’s top exporter of steam coal throughout the projection period. Its coal production rises from 296 Mtce in 2011 to about 550 Mtce in 2035, though growth in output moderates after 2020 as demand in export markets slows. Indonesia’s coal production is increasingly diverted for use in domestic and ASEAN markets.
• Oil production across the region falls by one-third, to 1.7 mb/d in 2035, as a result of decline in mature oil fields and limited large new prospects. Slowing the fall in Southeast Asia’s oil output will depend on maximising recovery at discovered oil fields and stimulating exploration in frontier and under-explored areas, such as deepwater East Indonesia.
• The outlook for gas production is brighter than that for oil, owing to a richer resource base and growing demand in the Asia-Pacific market. Gas production in Southeast Asia rises from 203 bcm to 260 bcm over 2011-2035, with Indonesia, Malaysia and Myanmar the main contributors. LNG liquefaction and regasification terminals are set to play an expanded role, enabling the development of stranded resources and the receipt of increasing LNG shipments for domestic use.
• Attracting investment to support projected levels of oil, gas and coal production is a major imperative for Southeast Asia. Cumulative investment of $705 billion is required in fossil fuel-supply infrastructure over 2013-2035, nearly two-thirds going to gas exploration and production, LNG infrastructure and pipelines. Private and foreign investment and expertise will be important to developing the region’s energy sector as many of its state-owned energy companies are limited by the availability of capital and technical capacity.
© O
ECD
/IEA
, 201
3

64 World Energy Outlook | Special Report
Overview
Southeast Asia’s fossil fuel resources – oil, gas and coal – will be essential to meeting rapidly growing domestic energy demand to support economic growth and development. Fossil fuel exports play an important role in several of the region’s economies, and sustaining these will be a key priority for them over the coming decades. Challenges to fossil fuel production between 2011 and 2035 will include the availability of oil and natural gas resources, and some above-ground barriers to resource development. Chief among these barriers is expanding fossil fuel-supply infrastructure to produce and deliver resources as well as developing attractive frameworks to bring forward the substantial level of investment required. This chapter covers the outlook in the New Policies Scenario for the production of fossil fuels in Southeast Asia, including for the related issues of trade and investment.
Resources and production
Fossil fuel production in Southeast Asia is dominated by the countries that hold the resources: mainly Indonesia, Malaysia, Thailand and Vietnam (Figure 3.1). Together they accounted for more than 90% of the 537 million tonnes of oil equivalent (Mtoe) of fossil fuel production in the region in 2011. Myanmar, which is relatively under-explored, has potential for gas production growth if its energy sector attracts needed investment. Brunei Darussalam has steadily developed its oil and gas resources for export. The Philippines, Lao PDR and Cambodia lack sizeable fossil fuel deposits, but have substantial renewable energy potential (in the form of bioenergy, geothermal and/or hydro [see the Outlook for the power sector in Chapter 2]).
Figure 3.1 ⊳ Fossil fuel* production by country
* Includes oil, gas and coal, which accounted for nearly 80% of energy production in Southeast Asia in 2011. Note: Data for Lao PDR were not available.
100
200
300
400
500
600
1990 1993 1996 1999 2002 2005 2008 2011
Mto
e Singapore Cambodia Philippines Myanmar Brunei Thailand Vietnam Malaysia Indonesia
© O
ECD
/IEA
, 201
3
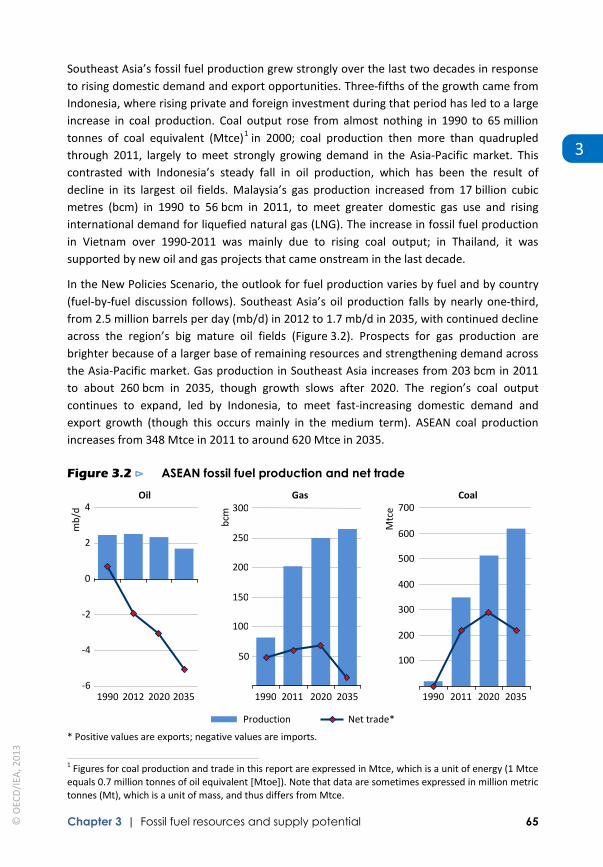
Chapter 3 | Fossil fuel resources and supply potential 65
3
Southeast Asia’s fossil fuel production grew strongly over the last two decades in response to rising domestic demand and export opportunities. Three-fifths of the growth came from Indonesia, where rising private and foreign investment during that period has led to a large increase in coal production. Coal output rose from almost nothing in 1990 to 65 million tonnes of coal equivalent (Mtce)1 in 2000; coal production then more than quadrupled through 2011, largely to meet strongly growing demand in the Asia-Pacific market. This contrasted with Indonesia’s steady fall in oil production, which has been the result of decline in its largest oil fields. Malaysia’s gas production increased from 17 billion cubic metres (bcm) in 1990 to 56 bcm in 2011, to meet greater domestic gas use and rising international demand for liquefied natural gas (LNG). The increase in fossil fuel production in Vietnam over 1990-2011 was mainly due to rising coal output; in Thailand, it was supported by new oil and gas projects that came onstream in the last decade.
In the New Policies Scenario, the outlook for fuel production varies by fuel and by country (fuel-by-fuel discussion follows). Southeast Asia’s oil production falls by nearly one-third, from 2.5 million barrels per day (mb/d) in 2012 to 1.7 mb/d in 2035, with continued decline across the region’s big mature oil fields (Figure 3.2). Prospects for gas production are brighter because of a larger base of remaining resources and strengthening demand across the Asia-Pacific market. Gas production in Southeast Asia increases from 203 bcm in 2011 to about 260 bcm in 2035, though growth slows after 2020. The region’s coal output continues to expand, led by Indonesia, to meet fast-increasing domestic demand and export growth (though this occurs mainly in the medium term). ASEAN coal production increases from 348 Mtce in 2011 to around 620 Mtce in 2035.
Figure 3.2 ⊳ ASEAN fossil fuel production and net trade
* Positive values are exports; negative values are imports.
1 Figures for coal production and trade in this report are expressed in Mtce, which is a unit of energy (1 Mtce equals 0.7 million tonnes of oil equivalent [Mtoe]). Note that data are sometimes expressed in million metric tonnes (Mt), which is a unit of mass, and thus differs from Mtce.
-6
-4
-2
0
2
4
1990 2012 2020 2035
mb/
d
Oil
bcm
50
100
150
200
250
300
1990 2011 2020 2035
Gas
100
200
300
400
500
600
700
1990 2011 2020 2035
Mtc
e Coal
Production Net trade*
© O
ECD
/IEA
, 201
3
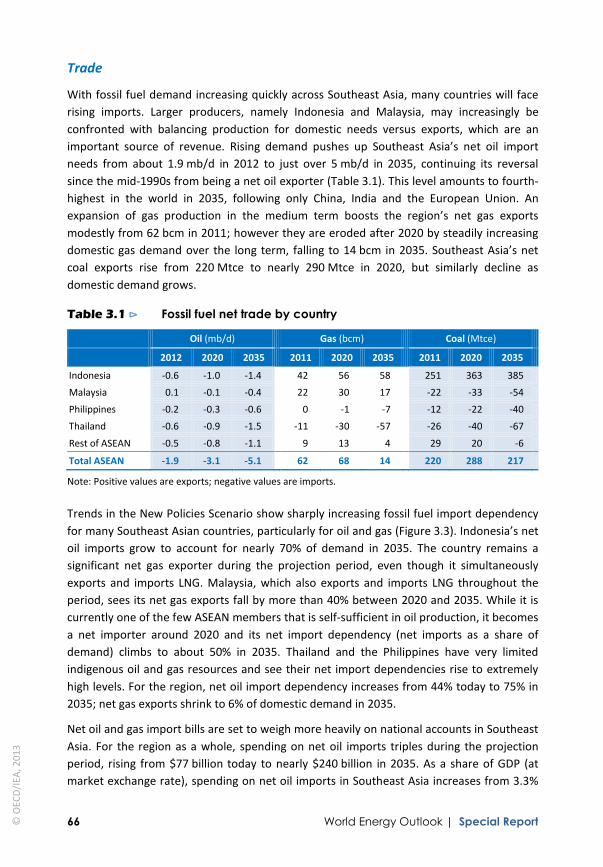
66 World Energy Outlook | Special Report
Trade
With fossil fuel demand increasing quickly across Southeast Asia, many countries will face rising imports. Larger producers, namely Indonesia and Malaysia, may increasingly be confronted with balancing production for domestic needs versus exports, which are an important source of revenue. Rising demand pushes up Southeast Asia’s net oil import needs from about 1.9 mb/d in 2012 to just over 5 mb/d in 2035, continuing its reversal since the mid-1990s from being a net oil exporter (Table 3.1). This level amounts to fourth-highest in the world in 2035, following only China, India and the European Union. An expansion of gas production in the medium term boosts the region’s net gas exports modestly from 62 bcm in 2011; however they are eroded after 2020 by steadily increasing domestic gas demand over the long term, falling to 14 bcm in 2035. Southeast Asia’s net coal exports rise from 220 Mtce to nearly 290 Mtce in 2020, but similarly decline as domestic demand grows.
Table 3.1 ⊳ Fossil fuel net trade by country
Oil (mb/d) Gas (bcm) Coal (Mtce)
2012 2020 2035 2011 2020 2035 2011 2020 2035
Indonesia -0.6 -1.0 -1.4 42 56 58 251 363 385 Malaysia 0.1 -0.1 -0.4 22 30 17 -22 -33 -54 Philippines -0.2 -0.3 -0.6 0 -1 -7 -12 -22 -40 Thailand -0.6 -0.9 -1.5 -11 -30 -57 -26 -40 -67 Rest of ASEAN -0.5 -0.8 -1.1 9 13 4 29 20 -6
Total ASEAN -1.9 -3.1 -5.1 62 68 14 220 288 217
Note: Positive values are exports; negative values are imports.
Trends in the New Policies Scenario show sharply increasing fossil fuel import dependency for many Southeast Asian countries, particularly for oil and gas (Figure 3.3). Indonesia’s net oil imports grow to account for nearly 70% of demand in 2035. The country remains a significant net gas exporter during the projection period, even though it simultaneously exports and imports LNG. Malaysia, which also exports and imports LNG throughout the period, sees its net gas exports fall by more than 40% between 2020 and 2035. While it is currently one of the few ASEAN members that is self-sufficient in oil production, it becomes a net importer around 2020 and its net import dependency (net imports as a share of demand) climbs to about 50% in 2035. Thailand and the Philippines have very limited indigenous oil and gas resources and see their net import dependencies rise to extremely high levels. For the region, net oil import dependency increases from 44% today to 75% in 2035; net gas exports shrink to 6% of domestic demand in 2035.
Net oil and gas import bills are set to weigh more heavily on national accounts in Southeast Asia. For the region as a whole, spending on net oil imports triples during the projection period, rising from $77 billion today to nearly $240 billion in 2035. As a share of GDP (at market exchange rate), spending on net oil imports in Southeast Asia increases from 3.3%
© O
ECD
/IEA
, 201
3

Chapter 3 | Fossil fuel resources and supply potential 67
3
to 3.7% during the period. Thailand and Indonesia are projected to spend the most on net oil imports, at close to $70 billion each in 2035. Indonesia’s net oil import bill is partially offset by revenues from net gas exports, which rise to above $30 billion at the end of the projection period. However, for Thailand, rising net gas imports add to its sharply rising spending on imports. Thailand’s net oil and gas import bill totals about $100 billion in 2035, up from near $30 billion in 2011.
Figure 3.3 ⊳ Net oil and gas import dependency* in selected countries
* Import dependency is calculated as net imports divided by primary demand for each fuel. ** Indonesia’s net gas exports were slightly greater than its primary gas demand in 2011.
Investment
Significant investment will be needed in Southeast Asia to bring forward the projected amounts of oil, gas and coal production. The region requires $705 billion of cumulative investment in fossil fuel-supply infrastructure over 2013-2035 (Figure 3.4). Investment in oil-supply infrastructure in Southeast Asia totals about $205 billion, four-fifths for upstream development and the remainder for refineries. At $460 billion, gas requires a significantly higher level of investment than oil, reflecting a larger resource base that is increasingly costly to develop and the need for expanded gas transmission and distribution infrastructure. Relatively minor investment occurs in the region’s LNG chain. There are plans to build many LNG regasification terminals, which are much less expensive than liquefaction plants, though several expansions of existing liquefaction plants and floating LNG (FLNG) liquefaction facilities are planned (Table 3.8 and Figure 3.13). The coal sector is projected to need some $40 billion, in mining and to build infrastructure for inland transport. Indonesia accounts for the largest share (nearly 45%) of investment in fossil fuel-supply infrastructure in Southeast Asia during the projection period.
-20%
0%
20%
40%
60%
80%
100%
-100% -80% -60% -40% -20% 0% 20% 40% 60% 80% 100% Gas
Oil
Indonesia**
Thailand
Malaysia
Philippines ASEAN
2011 Net gas exporter, net oil importer
2035
Net gas & oil importer
Net gas & oil exporter
© O
ECD
/IEA
, 201
3
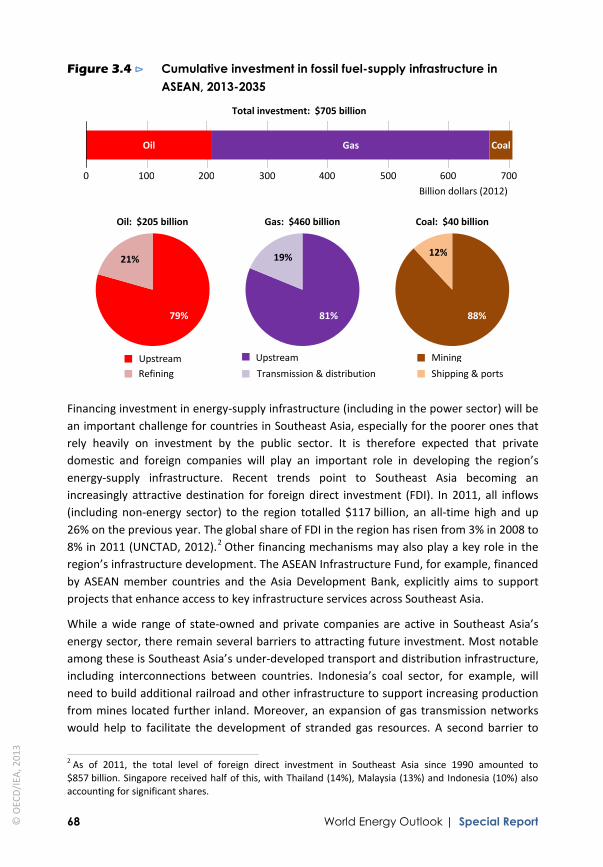
68 World Energy Outlook | Special Report
Figure 3.4 ⊳ Cumulative investment in fossil fuel-supply infrastructure in ASEAN, 2013-2035
Financing investment in energy-supply infrastructure (including in the power sector) will be an important challenge for countries in Southeast Asia, especially for the poorer ones that rely heavily on investment by the public sector. It is therefore expected that private domestic and foreign companies will play an important role in developing the region’s energy-supply infrastructure. Recent trends point to Southeast Asia becoming an increasingly attractive destination for foreign direct investment (FDI). In 2011, all inflows (including non-energy sector) to the region totalled $117 billion, an all-time high and up 26% on the previous year. The global share of FDI in the region has risen from 3% in 2008 to 8% in 2011 (UNCTAD, 2012).2 Other financing mechanisms may also play a key role in the region’s infrastructure development. The ASEAN Infrastructure Fund, for example, financed by ASEAN member countries and the Asia Development Bank, explicitly aims to support projects that enhance access to key infrastructure services across Southeast Asia.
While a wide range of state-owned and private companies are active in Southeast Asia’s energy sector, there remain several barriers to attracting future investment. Most notable among these is Southeast Asia’s under-developed transport and distribution infrastructure, including interconnections between countries. Indonesia’s coal sector, for example, will need to build additional railroad and other infrastructure to support increasing production from mines located further inland. Moreover, an expansion of gas transmission networks would help to facilitate the development of stranded gas resources. A second barrier to
2 As of 2011, the total level of foreign direct investment in Southeast Asia since 1990 amounted to $857 billion. Singapore received half of this, with Thailand (14%), Malaysia (13%) and Indonesia (10%) also accounting for significant shares.
0 100 200 300 400 500 600 700 Billion dollars (2012)
Oil: $205 billion Gas: $460 billion Coal: $40 billion
Total investment: $705 billion
Coal Gas Oil
79%
21%
Upstream
81%
19%
Upstream
88%
12%
Mining Refining Transmission & distribution Shipping & ports
© O
ECD
/IEA
, 201
3

Chapter 3 | Fossil fuel resources and supply potential 69
3
investment is subsidised end-use energy prices. Gas prices, for example, are controlled or set at levels insufficient to justify the development of capital-intensive projects that could supply the domestic market. As a consequence, stranded resources remain untapped unless they can be commercialised through LNG export projects that receive international prices.
Greater stability and consistency in the application of policy frameworks throughout the region is also called for. This would help to reduce perceived long-term risks and encourage private investment in the large-scale projects needed to sustain or expand production. Countries will also have to periodically review the attractiveness of investment frameworks. Given the decline of oil and gas production and the smaller size of new development prospects, for example, policies may need to be tailored further to incentivise exploration in frontier areas and/or to develop marginal fields.
Coal Overview
Southeast Asia will continue to be an important player in global coal markets in the coming decades. Indonesia remains one of the world’s major producers and exporters, while the broader region becomes a key centre for coal demand (see Chapter 2). At end-2011, Southeast Asia had 28 billion tonnes in total coal reserves, or 2.7% of the world total (Table 3.2). The vast majority of these are located in Indonesia, which contains significant hard and brown coal, and there are some hard coal reserves in Vietnam. Existing coal reserves in the region would be sufficient to sustain current rates of production for 80 years, though there is large potential for resources to be converted to reserves as exploration and production expands, particularly in Indonesia. Southeast Asia’s reserves are predominantly sub-bituminous coal, bituminous coal and lignite of low and medium energy content, making them well-suited for use in power generation.
Table 3.2 ⊳ Coal resources by country and type, end-2011 (billion tonnes)
Hard coal Brown coal Total
Reserves Resources Reserves Resources Reserves Resources
Indonesia 13.5 73.3 9.0 19.0 22.5 92.3
Vietnam 3.1 3.5 0.2 199.9 3.4 203.4
Rest of ASEAN 0.4 2.4 1.7 2.2 2.1 4.6
Total ASEAN 17.0 79.2 11.0 221.1 27.9 300.3
Share of world 2.3% 0.5% 3.9% 5.3% 2.7% 1.4%
Notes: Hard coal includes anthracite and bituminous coal; brown coal includes sub-bituminous coal and lignite. Steam coal, also known as thermal coal, refers to anthracite, bituminous coal not used as coking coal and sub-bituminous coal. Source: BGR (2012).
Coal production in Southeast Asia was 348 Mtce in 2011, with Indonesia accounting for 85% of the region’s total output (Table 3.3). Southeast Asia features a mix of net importers (Thailand, Malaysia and the Philippines) and net exporters (notably Indonesia, but also
© O
ECD
/IEA
, 201
3

70 World Energy Outlook | Special Report
Vietnam). As a whole, the region’s net coal exports were 220 Mtce in 2011, up 12% from the previous year. Southeast Asia lies at the geographical nexus of global coal trade. It is home to key transport routes for shipments between major importers in Asia (such as China, India, Japan and Korea) and major exporters (such as Australia and South Africa).
Table 3.3 ⊳ Coal production by country (Mtce)
1990 2011 2020 2025 2030 2035
2011-2035*
Indonesia 8 296 449 489 519 549 2.6%
Vietnam 4 36 38 39 40 41 0.6%
Rest of ASEAN 6 17 25 26 27 26 1.8%
Total ASEAN 18 348 512 554 586 616 2.4%
Share of world 0.6% 6.3% 8.5% 9.0% 9.4% 9.7% n.a.
* Compound average annual growth rate.
In the New Policies Scenario, coal production in Southeast Asia continues to grow strongly throughout the projection period, rising to around 510 Mtce in 2020 and then close to 620 Mtce in 2035 (Figure 3.5). Nearly all (95%) of the incremental output in the region comes from Indonesia. Production growth is increasingly driven by fast-rising domestic demand (mainly in power generation) and less by exports, which begin to decline in net terms as demand for coal in the Asia-Pacific market slows. Net exports from the region are projected to peak at nearly 290 Mtce just before 2020 and then fall to around 220 Mtce in 2035.
Figure 3.5 ⊳ ASEAN coal balance
Coal production in the region faces several common challenges. The first is keeping pace with domestic demand: the average annual rate of growth for coal production in Southeast Asia is projected to be 2.4% over 2011-2035, versus 4.8% for coal demand. This trend will necessitate increasing imports in many countries – Malaysia, Thailand, Philippines and Vietnam – while Indonesia over the long term will see its export growth level off. Rising coal
100
200
300
400
500
600
700
1990 2000 2010 2020 2030 2035
Mtc
e
Net exports
Production
Consumption
© O
ECD
/IEA
, 201
3
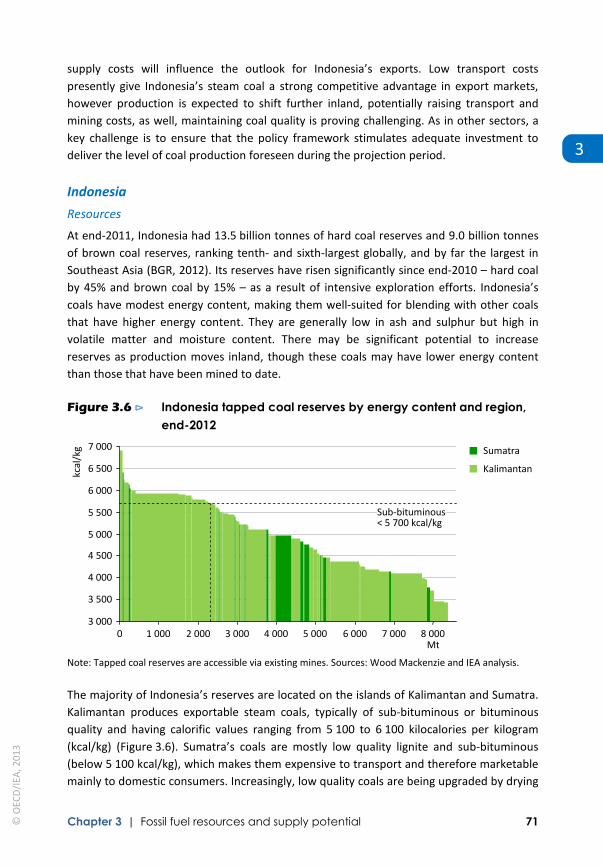
Chapter 3 | Fossil fuel resources and supply potential 71
3
supply costs will influence the outlook for Indonesia’s exports. Low transport costs presently give Indonesia’s steam coal a strong competitive advantage in export markets, however production is expected to shift further inland, potentially raising transport and mining costs, as well, maintaining coal quality is proving challenging. As in other sectors, a key challenge is to ensure that the policy framework stimulates adequate investment to deliver the level of coal production foreseen during the projection period.
Indonesia
Resources
At end-2011, Indonesia had 13.5 billion tonnes of hard coal reserves and 9.0 billion tonnes of brown coal reserves, ranking tenth- and sixth-largest globally, and by far the largest in Southeast Asia (BGR, 2012). Its reserves have risen significantly since end-2010 – hard coal by 45% and brown coal by 15% – as a result of intensive exploration efforts. Indonesia’s coals have modest energy content, making them well-suited for blending with other coals that have higher energy content. They are generally low in ash and sulphur but high in volatile matter and moisture content. There may be significant potential to increase reserves as production moves inland, though these coals may have lower energy content than those that have been mined to date.
Figure 3.6 ⊳ Indonesia tapped coal reserves by energy content and region, end-2012
Note: Tapped coal reserves are accessible via existing mines. Sources: Wood Mackenzie and IEA analysis.
The majority of Indonesia’s reserves are located on the islands of Kalimantan and Sumatra. Kalimantan produces exportable steam coals, typically of sub-bituminous or bituminous quality and having calorific values ranging from 5 100 to 6 100 kilocalories per kilogram (kcal/kg) (Figure 3.6). Sumatra’s coals are mostly low quality lignite and sub-bituminous (below 5 100 kcal/kg), which makes them expensive to transport and therefore marketable mainly to domestic consumers. Increasingly, low quality coals are being upgraded by drying
3 000
3 500
4 000
4 500
5 000
5 500
6 000
6 500
7 000
1 000 2 000 3 000 4 000 5 000 6 000 7 000 8 000 Mt
kcal
/kg
Sumatra
Kalimantan
Sub-bituminous < 5 700 kcal/kg
0
© O
ECD
/IEA
, 201
3
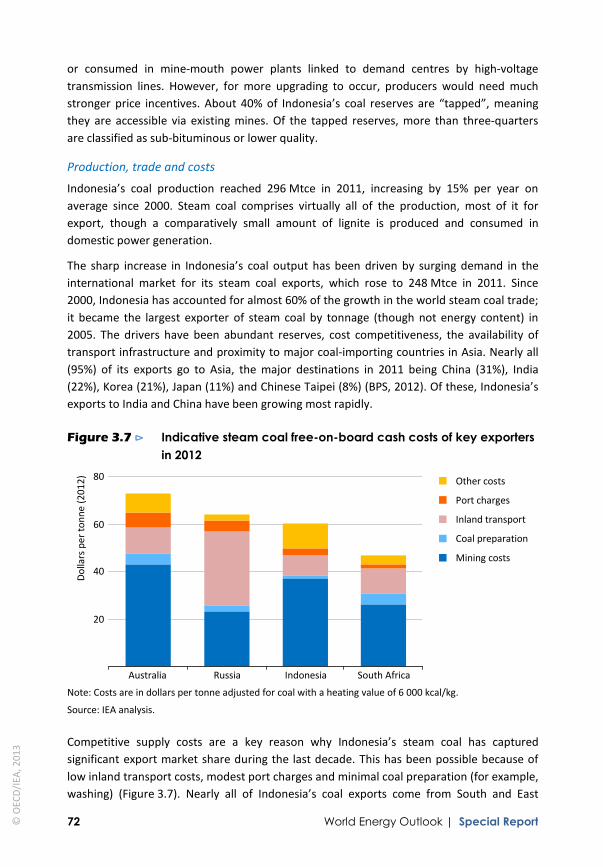
72 World Energy Outlook | Special Report
or consumed in mine-mouth power plants linked to demand centres by high-voltage transmission lines. However, for more upgrading to occur, producers would need much stronger price incentives. About 40% of Indonesia’s coal reserves are “tapped”, meaning they are accessible via existing mines. Of the tapped reserves, more than three-quarters are classified as sub-bituminous or lower quality.
Production, trade and costs
Indonesia’s coal production reached 296 Mtce in 2011, increasing by 15% per year on average since 2000. Steam coal comprises virtually all of the production, most of it for export, though a comparatively small amount of lignite is produced and consumed in domestic power generation.
The sharp increase in Indonesia’s coal output has been driven by surging demand in the international market for its steam coal exports, which rose to 248 Mtce in 2011. Since 2000, Indonesia has accounted for almost 60% of the growth in the world steam coal trade; it became the largest exporter of steam coal by tonnage (though not energy content) in 2005. The drivers have been abundant reserves, cost competitiveness, the availability of transport infrastructure and proximity to major coal-importing countries in Asia. Nearly all (95%) of its exports go to Asia, the major destinations in 2011 being China (31%), India (22%), Korea (21%), Japan (11%) and Chinese Taipei (8%) (BPS, 2012). Of these, Indonesia’s exports to India and China have been growing most rapidly.
Figure 3.7 ⊳ Indicative steam coal free-on-board cash costs of key exporters in 2012
Note: Costs are in dollars per tonne adjusted for coal with a heating value of 6 000 kcal/kg.
Source: IEA analysis.
Competitive supply costs are a key reason why Indonesia’s steam coal has captured significant export market share during the last decade. This has been possible because of low inland transport costs, modest port charges and minimal coal preparation (for example, washing) (Figure 3.7). Nearly all of Indonesia’s coal exports come from South and East
20
40
60
80
Australia Russia Indonesia South Africa
Dol
lars
per
tonn
e (2
012)
Other costs
Port charges
Inland transport
Coal preparation
Mining costs
© O
ECD
/IEA
, 201
3

Chapter 3 | Fossil fuel resources and supply potential 73
3
Kalimantan, where a network of navigable rivers allows mining operations to truck and barge export-quality steam coals to offshore terminals, where they are loaded onto larger bulk carriers. This system avoids railway or port bottlenecks, which have frequently encumbered exports from Australia and South Africa, thus helping Indonesian producers keep costs down and increase exports quickly.
During the projection period, several factors could raise supply costs for Indonesia’s export-quality steam coal. First, most mines are truck-and-shovel operations that rely on a significant amount of trucking, exposing supply costs to movements in the price of diesel fuel. Since 2008, higher oil prices, in combination with the phase-out of government subsidies for diesel, have caused a significant increase in supply costs. Second, as Indonesia depletes its export-quality reserves closest to the coast, mines are expected to move further inland. This will require long-term investments in capital-intensive railroads, roads, fixed ports and channelised waterways. Additionally, inland coal deposits could be of lower quality and have less favourable geologic conditions and higher stripping ratios. Thus the move inland could have a significant impact on inland transport costs, mine productivity and revenues. Productivity at Indonesian mines is low relative to its main competitors – 3.4 kilotonnes (kt) per employee compared with 8.5 kt/employee in Australia in 2012 – and improvement, through greater mechanisation for example, represents a key opportunity to stem increases in supply costs.
Sector policies
Indonesia’s policy framework has encouraged strong competition in the coal sector through the wide participation of domestic and international players. This has led to a very rapid expansion of low cost supply with low capacity costs at a time when Indonesian and global demand for coal has accelerated rapidly. Going forward, however, a more stable framework may be needed to attract investment in long-term, capital-intensive projects needed to sustain and expand production and exports.
Indonesia enacted a new mining law in 2009 with the general objective of promoting mining development by simplifying licensing, improving the planning of mining areas and clarifying responsibilities between central, provincial and district authorities. The policy gives foreign as well as Indonesian investors eight years to carry out exploration and another 23 years to build and operate mines. The policy, however, has not yet been fully implemented and new regulations introduced in 2012 require foreign companies to reduce their ownership in mines to a maximum of 49% by the tenth year of production. Furthermore, the government plans to meet rapidly rising domestic power demand through a large expansion of coal-fired power generation and has given priority to increasing coal supply to the domestic market over exports. Consequently, it has set a minimum share of coal production that must be sold to domestic customers (a domestic market obligation). The government has also discussed banning low quality coal exports (less than 5 600 kcal/kg) to ensure fuel supply for new coal-fired power plants coming online in the next several years, though formal regulations have not been adopted.
© O
ECD
/IEA
, 201
3
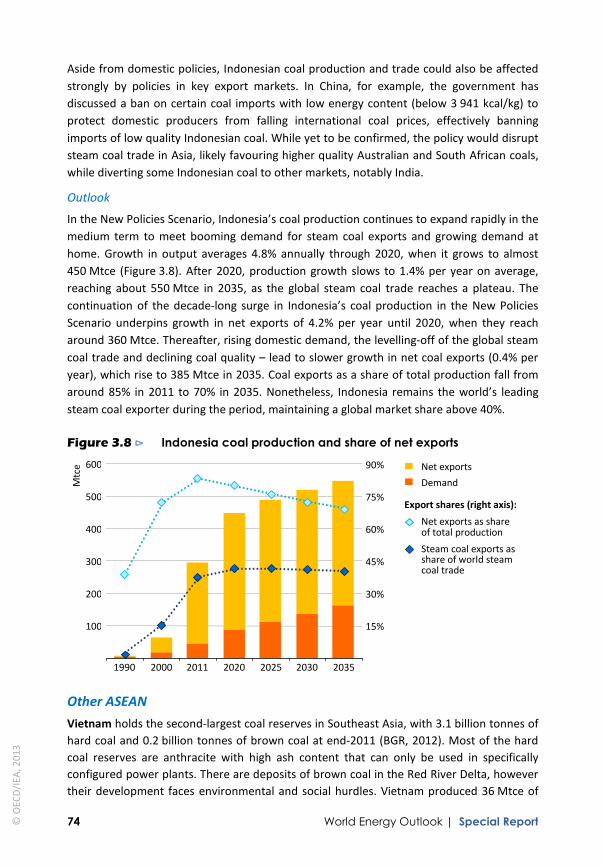
74 World Energy Outlook | Special Report
Aside from domestic policies, Indonesian coal production and trade could also be affected strongly by policies in key export markets. In China, for example, the government has discussed a ban on certain coal imports with low energy content (below 3 941 kcal/kg) to protect domestic producers from falling international coal prices, effectively banning imports of low quality Indonesian coal. While yet to be confirmed, the policy would disrupt steam coal trade in Asia, likely favouring higher quality Australian and South African coals, while diverting some Indonesian coal to other markets, notably India.
Outlook
In the New Policies Scenario, Indonesia’s coal production continues to expand rapidly in the medium term to meet booming demand for steam coal exports and growing demand at home. Growth in output averages 4.8% annually through 2020, when it grows to almost 450 Mtce (Figure 3.8). After 2020, production growth slows to 1.4% per year on average, reaching about 550 Mtce in 2035, as the global steam coal trade reaches a plateau. The continuation of the decade-long surge in Indonesia’s coal production in the New Policies Scenario underpins growth in net exports of 4.2% per year until 2020, when they reach around 360 Mtce. Thereafter, rising domestic demand, the levelling-off of the global steam coal trade and declining coal quality – lead to slower growth in net coal exports (0.4% per year), which rise to 385 Mtce in 2035. Coal exports as a share of total production fall from around 85% in 2011 to 70% in 2035. Nonetheless, Indonesia remains the world’s leading steam coal exporter during the period, maintaining a global market share above 40%.
Figure 3.8 ⊳ Indonesia coal production and share of net exports
Other ASEAN
Vietnam holds the second-largest coal reserves in Southeast Asia, with 3.1 billion tonnes of hard coal and 0.2 billion tonnes of brown coal at end-2011 (BGR, 2012). Most of the hard coal reserves are anthracite with high ash content that can only be used in specifically configured power plants. There are deposits of brown coal in the Red River Delta, however their development faces environmental and social hurdles. Vietnam produced 36 Mtce of
100
200
300
400
600
1990 2000 2011 2020 2025 2030 2035
Mtc
e
15%
30%
45%
60%
75%
Net exports Demand
Export shares (right axis): Net exports as share of total production Steam coal exports as share of world steam coal trade
90%
500
© O
ECD
/IEA
, 201
3
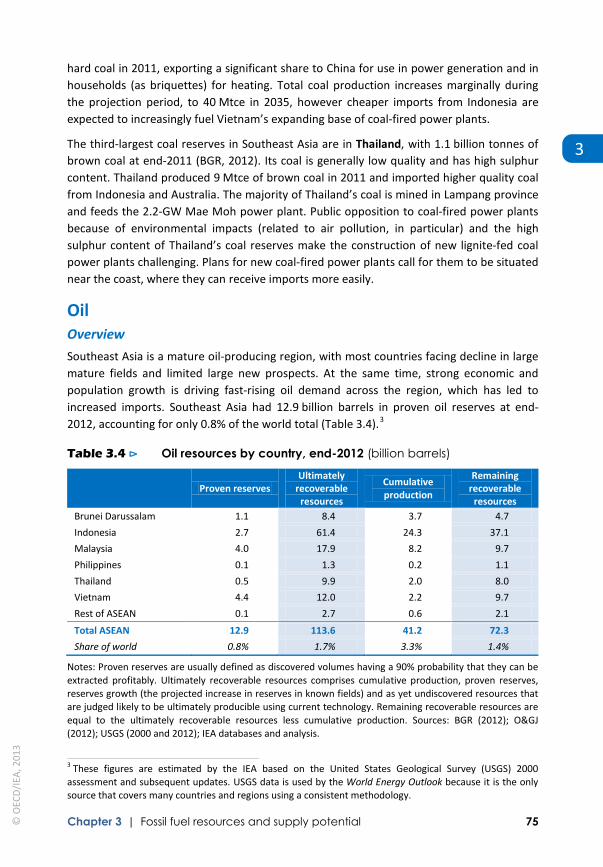
Chapter 3 | Fossil fuel resources and supply potential 75
3
hard coal in 2011, exporting a significant share to China for use in power generation and in households (as briquettes) for heating. Total coal production increases marginally during the projection period, to 40 Mtce in 2035, however cheaper imports from Indonesia are expected to increasingly fuel Vietnam’s expanding base of coal-fired power plants.
The third-largest coal reserves in Southeast Asia are in Thailand, with 1.1 billion tonnes of brown coal at end-2011 (BGR, 2012). Its coal is generally low quality and has high sulphur content. Thailand produced 9 Mtce of brown coal in 2011 and imported higher quality coal from Indonesia and Australia. The majority of Thailand’s coal is mined in Lampang province and feeds the 2.2-GW Mae Moh power plant. Public opposition to coal-fired power plants because of environmental impacts (related to air pollution, in particular) and the high sulphur content of Thailand’s coal reserves make the construction of new lignite-fed coal power plants challenging. Plans for new coal-fired power plants call for them to be situated near the coast, where they can receive imports more easily.
Oil Overview
Southeast Asia is a mature oil-producing region, with most countries facing decline in large mature fields and limited large new prospects. At the same time, strong economic and population growth is driving fast-rising oil demand across the region, which has led to increased imports. Southeast Asia had 12.9 billion barrels in proven oil reserves at end-2012, accounting for only 0.8% of the world total (Table 3.4).3
Table 3.4 ⊳ Oil resources by country, end-2012 (billion barrels)
Proven reserves Ultimately
recoverable resources
Cumulative production
Remaining recoverable
resources Brunei Darussalam 1.1 8.4 3.7 4.7
Indonesia 2.7 61.4 24.3 37.1
Malaysia 4.0 17.9 8.2 9.7
Philippines 0.1 1.3 0.2 1.1
Thailand 0.5 9.9 2.0 8.0
Vietnam 4.4 12.0 2.2 9.7
Rest of ASEAN 0.1 2.7 0.6 2.1
Total ASEAN 12.9 113.6 41.2 72.3
Share of world 0.8% 1.7% 3.3% 1.4%
Notes: Proven reserves are usually defined as discovered volumes having a 90% probability that they can be extracted profitably. Ultimately recoverable resources comprises cumulative production, proven reserves, reserves growth (the projected increase in reserves in known fields) and as yet undiscovered resources that are judged likely to be ultimately producible using current technology. Remaining recoverable resources are equal to the ultimately recoverable resources less cumulative production. Sources: BGR (2012); O&GJ (2012); USGS (2000 and 2012); IEA databases and analysis.
3 These figures are estimated by the IEA based on the United States Geological Survey (USGS) 2000 assessment and subsequent updates. USGS data is used by the World Energy Outlook because it is the only source that covers many countries and regions using a consistent methodology.
© O
ECD
/IEA
, 201
3
76 World Energy Outlook | Special Report
The region’s dwindling oil resources and the trend of increasing imports underscores the importance of maximising recovery in discovered oil fields and increasing incentives for exploration in frontier or under-explored areas, such as in deepwater East Indonesia. Doing so requires that Southeast Asian countries work to reduce regulatory uncertainties and offer investment frameworks that are commensurate to the risks and rewards of exploring and developing more technically-challenging resources and projects. Several territorial disputes stand in the way of development, notably in the South China Sea (Box 3.1) and in the Overlapping Claims Area (Cambodia and Thailand).
Box 3.1 ⊳ Territorial claims in the South China Sea
Overlapping territorial claims in the South China Sea complicate prospects for oil and gas exploration and production in contested areas. Brunei Darussalam, Cambodia, China, Indonesia, Malaysia, the Philippines and Vietnam have laid various claims of ownership to small islands, rocks, reefs and offshore areas in the South China Sea. An important facet of the disputes is the nature and extent of “exclusive economic zones”, prescribed by the 1982 United Nations Convention on the Law of the Sea (to which almost all ASEAN members are a party, with the exception of Cambodia), which stretch 200 nautical miles from the edge of a nation’s territorial sea and provide special rights to marine and energy resources.
Access to oil and gas deposits beneath the seafloor is a key aspect of the countries’ competing claims. All view the resources as critical to boosting supply security amid rising demand at home. While most discoveries in the South China Sea to date reside within uncontested coastal areas, deepwater prospects, which represent one of the few opportunities to stem falling reserves and output, are likely to be in disputed territory. A lack of exploration makes it difficult to gauge the full extent of the resource base. Nonetheless the additional resources would not reverse the outlook for relative oil and gas scarcity in the region, but might offset or delay some imports, if produced.
A resolution to territorial disputes in the South China Sea remains elusive despite efforts at multilateral and bilateral negotiations between involved parties. International mechanisms for arbitration, such as the United Nations’ International Tribunal for the Law of the Sea, are available, but have not been utilised. The “ASEAN plus Three” (China, Japan and South Korea) group has not produced a durable solution yet. Moreover, unilateral exploration projects in disputed areas have stirred tensions. Joint management of the sea’s oil and gas resources could provide a stable framework for development and benefit the various claimants, but without progress on solving the underlying sovereignty issues the outlook for oil and gas development in the South China Sea remains uncertain.
© O
ECD
/IEA
, 201
3
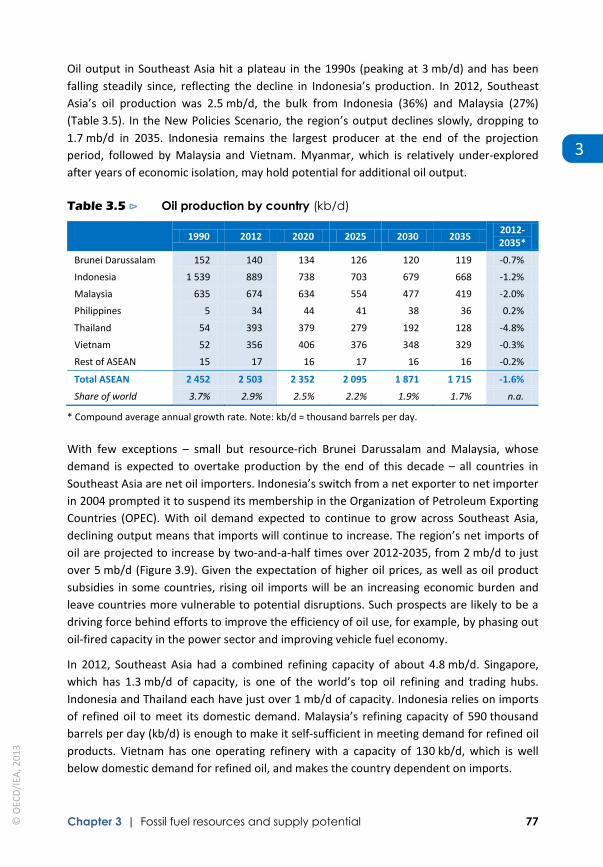
Chapter 3 | Fossil fuel resources and supply potential 77
3
Oil output in Southeast Asia hit a plateau in the 1990s (peaking at 3 mb/d) and has been falling steadily since, reflecting the decline in Indonesia’s production. In 2012, Southeast Asia’s oil production was 2.5 mb/d, the bulk from Indonesia (36%) and Malaysia (27%) (Table 3.5). In the New Policies Scenario, the region’s output declines slowly, dropping to 1.7 mb/d in 2035. Indonesia remains the largest producer at the end of the projection period, followed by Malaysia and Vietnam. Myanmar, which is relatively under-explored after years of economic isolation, may hold potential for additional oil output.
Table 3.5 ⊳ Oil production by country (kb/d)
1990 2012 2020 2025 2030 2035
2012-2035*
Brunei Darussalam 152 140 134 126 120 119 -0.7%
Indonesia 1 539 889 738 703 679 668 -1.2%
Malaysia 635 674 634 554 477 419 -2.0%
Philippines 5 34 44 41 38 36 0.2%
Thailand 54 393 379 279 192 128 -4.8%
Vietnam 52 356 406 376 348 329 -0.3%
Rest of ASEAN 15 17 16 17 16 16 -0.2%
Total ASEAN 2 452 2 503 2 352 2 095 1 871 1 715 -1.6%
Share of world 3.7% 2.9% 2.5% 2.2% 1.9% 1.7% n.a.
* Compound average annual growth rate. Note: kb/d = thousand barrels per day.
With few exceptions – small but resource-rich Brunei Darussalam and Malaysia, whose demand is expected to overtake production by the end of this decade – all countries in Southeast Asia are net oil importers. Indonesia’s switch from a net exporter to net importer in 2004 prompted it to suspend its membership in the Organization of Petroleum Exporting Countries (OPEC). With oil demand expected to continue to grow across Southeast Asia, declining output means that imports will continue to increase. The region’s net imports of oil are projected to increase by two-and-a-half times over 2012-2035, from 2 mb/d to just over 5 mb/d (Figure 3.9). Given the expectation of higher oil prices, as well as oil product subsidies in some countries, rising oil imports will be an increasing economic burden and leave countries more vulnerable to potential disruptions. Such prospects are likely to be a driving force behind efforts to improve the efficiency of oil use, for example, by phasing out oil-fired capacity in the power sector and improving vehicle fuel economy.
In 2012, Southeast Asia had a combined refining capacity of about 4.8 mb/d. Singapore, which has 1.3 mb/d of capacity, is one of the world’s top oil refining and trading hubs. Indonesia and Thailand each have just over 1 mb/d of capacity. Indonesia relies on imports of refined oil to meet its domestic demand. Malaysia’s refining capacity of 590 thousand barrels per day (kb/d) is enough to make it self-sufficient in meeting demand for refined oil products. Vietnam has one operating refinery with a capacity of 130 kb/d, which is well below domestic demand for refined oil, and makes the country dependent on imports.
© O
ECD
/IEA
, 201
3

78 World Energy Outlook | Special Report
Figure 3.9 ⊳ ASEAN oil balance
* Positive values are exports; negative values are imports.
Indonesia
Indonesia’s proven reserves were 2.7 billion barrels at end-2012. It is a mature producer, with the bulk of its 889 kb/d in output in 2012 coming from the well-explored Sumatra, Java and East Kalimantan basins. Declines in the onshore giant Duri and Minas fields and a lack of sizeable new prospects have seen oil production fall by almost half since its peak in 1991.
New developments are expected to be limited in the short and medium term. The Cepu Block in East and Central Java, containing 600 million barrels of recoverable liquids, is Indonesia’s only major new development on the horizon. Operated by Pertamina, the national oil company, and ExxonMobil, peak production of 165 kb/d is expected to be reached in late 2014, offsetting to some extent the decline in other fields through the end of the present decade. East Natuna, a gas project in the South China Sea, could be a significant source of natural gas liquids (NGLs) when it comes onstream post-2020. East Indonesia includes large frontier areas that are relatively unexplored and may contain significant potential. It has had some exploration activity to date, though its vast size, scarce infrastructure and rugged terrain have proven challenging.
Slowing Indonesia’s decline in oil output will require the execution of more complex, expensive projects, such as deepwater and enhanced oil recovery (EOR), and exploration in more technically-challenging areas. This implies a strong continued role for foreign companies that can offer expertise and capital. Chevron employs EOR to slow decline in both the Minas and Duri fields, for example, with the steam injection project in the Duri field being one of the largest in the world. The lack of major developments scheduled to come onstream suggests that stronger incentives may be needed to encourage exploration in frontier areas, i.e. such as through production sharing contracts and fiscal measures.
-6
-4
-2
0
2
4
6
8
1990 2000 2010 2020 2030 2035
mb/
d
Net trade*
Production
Consumption
© O
ECD
/IEA
, 201
3
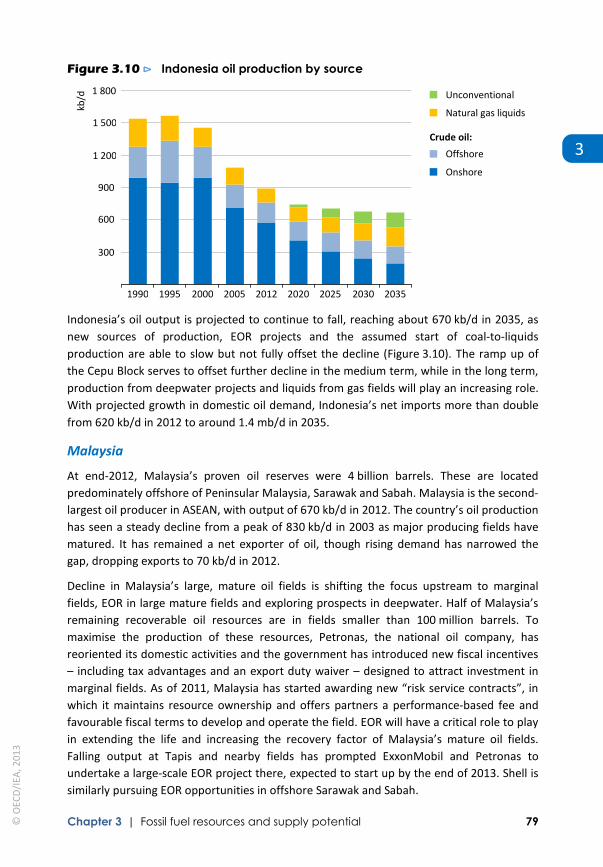
Chapter 3 | Fossil fuel resources and supply potential 79
3
Figure 3.10 ⊳ Indonesia oil production by source
Indonesia’s oil output is projected to continue to fall, reaching about 670 kb/d in 2035, as new sources of production, EOR projects and the assumed start of coal-to-liquids production are able to slow but not fully offset the decline (Figure 3.10). The ramp up of the Cepu Block serves to offset further decline in the medium term, while in the long term, production from deepwater projects and liquids from gas fields will play an increasing role. With projected growth in domestic oil demand, Indonesia’s net imports more than double from 620 kb/d in 2012 to around 1.4 mb/d in 2035.
Malaysia
At end-2012, Malaysia’s proven oil reserves were 4 billion barrels. These are located predominately offshore of Peninsular Malaysia, Sarawak and Sabah. Malaysia is the second-largest oil producer in ASEAN, with output of 670 kb/d in 2012. The country’s oil production has seen a steady decline from a peak of 830 kb/d in 2003 as major producing fields have matured. It has remained a net exporter of oil, though rising demand has narrowed the gap, dropping exports to 70 kb/d in 2012.
Decline in Malaysia’s large, mature oil fields is shifting the focus upstream to marginal fields, EOR in large mature fields and exploring prospects in deepwater. Half of Malaysia’s remaining recoverable oil resources are in fields smaller than 100 million barrels. To maximise the production of these resources, Petronas, the national oil company, has reoriented its domestic activities and the government has introduced new fiscal incentives – including tax advantages and an export duty waiver – designed to attract investment in marginal fields. As of 2011, Malaysia has started awarding new “risk service contracts”, in which it maintains resource ownership and offers partners a performance-based fee and favourable fiscal terms to develop and operate the field. EOR will have a critical role to play in extending the life and increasing the recovery factor of Malaysia’s mature oil fields. Falling output at Tapis and nearby fields has prompted ExxonMobil and Petronas to undertake a large-scale EOR project there, expected to start up by the end of 2013. Shell is similarly pursuing EOR opportunities in offshore Sarawak and Sabah.
300
600
900
1 200
1 500
1 800
1990 1995 2000 2005 2012 2020 2025 2030 2035
kb/d
Unconventional Natural gas liquids
Offshore
Onshore
Crude oil:
© O
ECD
/IEA
, 201
3

80 World Energy Outlook | Special Report
Box 3.2 ⊳ A critical choke point: the Malacca and Singapore Straits
The Malacca and Singapore Straits constitute one of the most important waterways in the world. Stretching 800 kilometres (km) between Malaysia, Indonesia and Singapore, and only three-km wide at its narrowest point, they connect the Indian Ocean to the South China Sea and Pacific Ocean, a route transited by more than 60 000 vessels annually and estimated to carry 25-40% of global trade (Simon, 2011). It is the shortest sea route between major oil and gas producers in the Persian Gulf and the fast-growing Asia-Pacific market. In 2012, a little over one-third of globally traded crude oil (about 12 mb/d) passed through the straits. Looking ahead, the share and absolute volume of global energy trade moving through the waterway is expected to increase to about 45% of the crude oil trade (16.5 mb/d) in 2035.
That such a large volume of energy (and world) trade transits this “choke point” emphasises the importance of safe and secure passage. Disrupted shipping traffic in the straits would have negative consequences for regional and global energy markets, potentially affecting the timing of deliveries and shipping costs. Piracy and sea robbery have been the most common hazards faced by ships navigating the straits. However, the threat has been significantly reduced in recent years due to a combination of co-ordinated security measures between the littoral states and improved political and economic conditions onshore that offer alternatives to piracy. Reported attacks in the Malacca Strait fell from 75 in 2000 to just two in 2012; in the Singapore Strait they numbered six in 2012 (IMB, 2013; Raymond, 2009). Nonetheless, the International Maritime Bureau advises ships to remain vigilant and maintain anti-piracy watches.
Given the trend of increasing traffic in the straits, more likely hazards are collisions between large vessels and serious groundings, which could create bottlenecks, i.e. a slowing of transit. Blockage of the straits for any period, of course, would have a much more substantial impact, causing vessels to reroute around the Indonesia archipelago, but events that could precipitate such a situation are extremely low in frequency. Prospects for minimising the risk of disruption to energy trade through the Malacca and Singapore Straits hinge on continued co-ordination of navigational safety measures and security efforts by the littoral states.
There are also alternatives to relieve shipping traffic in the straits, such as pipelines and new seaborne shipping routes. The gas portion of the 770-km Myanmar-China oil and gas pipeline stretching from Ramree Island in the Bay of Bengal to China’s landlocked Yunnan province opened in July 2013. The capacity of the gas line is 12 bcm per year, taking supplies from Myanmar’s offshore gas fields. The crude oil line, with capacity expected to reach 440 kb/d, is scheduled to begin operating in 2014 and will take oil shipments. Various other proposals have been made to bypass the straits via canal or pipeline, but little progress has been made.
© O
ECD
/IEA
, 201
3
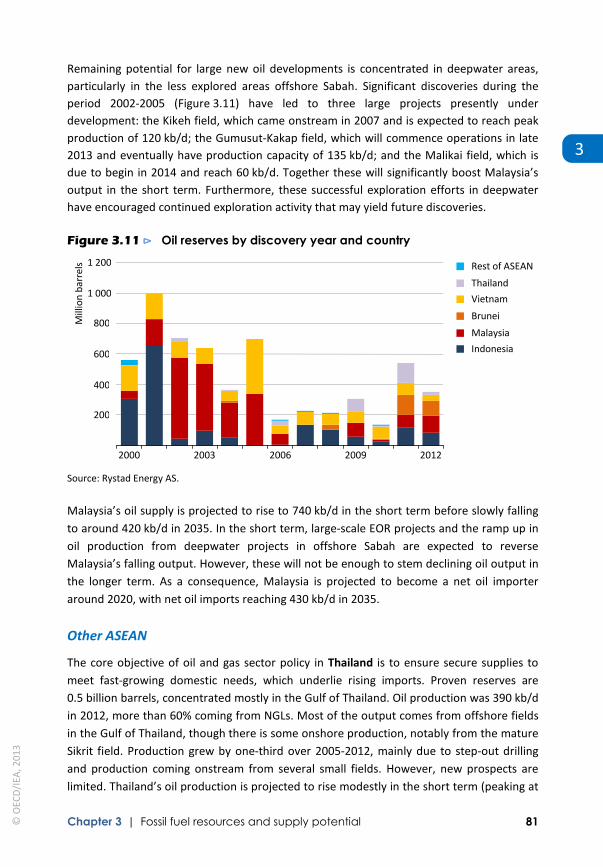
Chapter 3 | Fossil fuel resources and supply potential 81
3
Remaining potential for large new oil developments is concentrated in deepwater areas, particularly in the less explored areas offshore Sabah. Significant discoveries during the period 2002-2005 (Figure 3.11) have led to three large projects presently under development: the Kikeh field, which came onstream in 2007 and is expected to reach peak production of 120 kb/d; the Gumusut-Kakap field, which will commence operations in late 2013 and eventually have production capacity of 135 kb/d; and the Malikai field, which is due to begin in 2014 and reach 60 kb/d. Together these will significantly boost Malaysia’s output in the short term. Furthermore, these successful exploration efforts in deepwater have encouraged continued exploration activity that may yield future discoveries.
Figure 3.11 ⊳ Oil reserves by discovery year and country
Source: Rystad Energy AS.
Malaysia’s oil supply is projected to rise to 740 kb/d in the short term before slowly falling to around 420 kb/d in 2035. In the short term, large-scale EOR projects and the ramp up in oil production from deepwater projects in offshore Sabah are expected to reverse Malaysia’s falling output. However, these will not be enough to stem declining oil output in the longer term. As a consequence, Malaysia is projected to become a net oil importer around 2020, with net oil imports reaching 430 kb/d in 2035.
Other ASEAN
The core objective of oil and gas sector policy in Thailand is to ensure secure supplies to meet fast-growing domestic needs, which underlie rising imports. Proven reserves are 0.5 billion barrels, concentrated mostly in the Gulf of Thailand. Oil production was 390 kb/d in 2012, more than 60% coming from NGLs. Most of the output comes from offshore fields in the Gulf of Thailand, though there is some onshore production, notably from the mature Sikrit field. Production grew by one-third over 2005-2012, mainly due to step-out drilling and production coming onstream from several small fields. However, new prospects are limited. Thailand’s oil production is projected to rise modestly in the short term (peaking at
200
400
600
800
1 000
1 200
2000 2003 2006 2009 2012
Mill
ion
barr
els
Rest of ASEAN Thailand Vietnam Brunei Malaysia Indonesia
© O
ECD
/IEA
, 201
3

82 World Energy Outlook | Special Report
about 420 kb/d) as several new blocks come onstream, but it falls gradually thereafter as mature fields decline and smaller discoveries fail to replace depleted reserves, coming to around 130 kb/d in 2035. Consequently the gap between domestic demand and production continues to grow throughout the projection period, making Thailand increasingly dependent on net oil imports, which rise from 630 kb/d in 2012 to about 1.5 mb/d in 2035.
Vietnam’s focus is to secure oil supplies for a growing domestic market and to limit growth in imports. Proven reserves are 4.4 billion barrels. Vietnam’s oil production was 360 kb/d in 2012, however, though its largest-producing fields are in decline (namely Bach Ho, Rong and Rong SE). The most promising areas for exploration are the Cuu Long, Nam Con Son and Malay basins, located offshore southern Vietnam. The country’s unconventional prospects are also being studied. For example, Eni recently agreed to carry out an assessment with PetroVietnam, the state-owned oil company. Several new projects have come onstream recently whose collective production has caused oil output to rise modestly year-on-year, but these will likely be unable to stave off falling oil production over the long term. Vietnam’s oil output is projected to increase marginally to around 410 kb/d in 2020, but falls gradually to 330 kb/d in 2035, causing Vietnam to become more dependent on imports.
Singapore is very active downstream – engaged in oil refining, petrochemicals and oil trading activities – in part because of its strategic location at the nexus of oil trade between the Middle East and key consumers in Asia. The combined capacity of its refineries was 1.3 mb/d in 2012, well above its domestic consumption. Its refining sector supports significant oil product exports (particularly of gasoline and fuel oil) to Asia, notably to Malaysia, Australia and China in 2012 (US DOE/EIA, 2013). The oil industry plays an important role in Singapore’s economy, accounting for about 5% of GDP. While it has established itself as the preeminent hub for oil trading and a leader in the regional refining market, Singapore faces the prospect of competition from other regional players such as India, Malaysia, Thailand and Vietnam.
Myanmar produces only a small amount of oil today. The country is relatively under-explored in part due to economic sanctions imposed by the United States and European Union that precluded investment. With these now mostly lifted, interest in the country’s oil sector is increasing and it is attracting foreign investment.
Gas Overview
Southeast Asia is richer in natural gas than it is in oil. Gas promises to have a central role in the domestic energy mix of countries in the region and as a key export from Indonesia, Malaysia, Myanmar and Brunei Darussalam. At end-2012, Southeast Asia had 7.5 trillion cubic metres (tcm) of proven gas reserves, representing 3.5% of the world total (Table 3.6). The majority are in Indonesia and Malaysia. Increasingly, new prospects in Southeast Asia
© O
ECD
/IEA
, 201
3
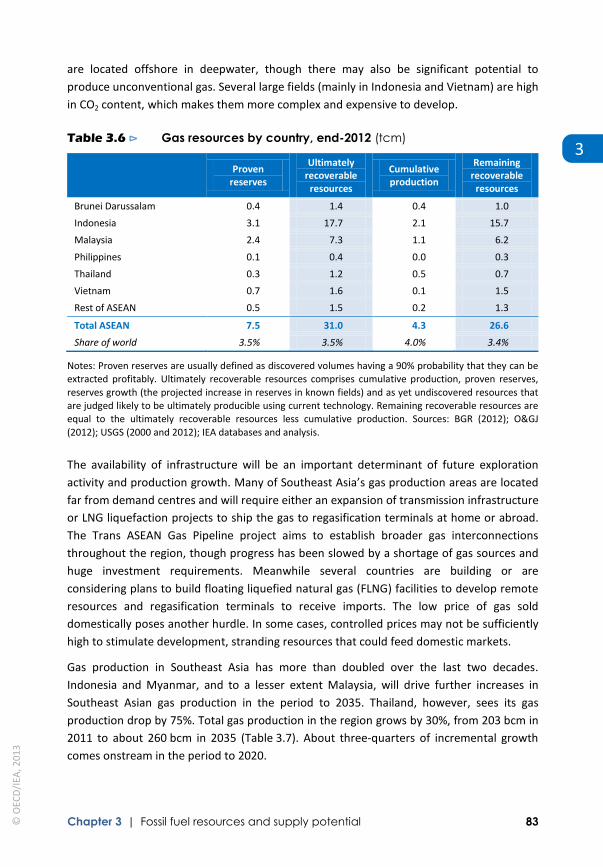
Chapter 3 | Fossil fuel resources and supply potential 83
3
are located offshore in deepwater, though there may also be significant potential to produce unconventional gas. Several large fields (mainly in Indonesia and Vietnam) are high in CO2 content, which makes them more complex and expensive to develop.
Table 3.6 ⊳ Gas resources by country, end-2012 (tcm)
Proven reserves
Ultimately recoverable
resources
Cumulative production
Remaining recoverable
resources
Brunei Darussalam 0.4 1.4 0.4 1.0
Indonesia 3.1 17.7 2.1 15.7
Malaysia 2.4 7.3 1.1 6.2
Philippines 0.1 0.4 0.0 0.3
Thailand 0.3 1.2 0.5 0.7
Vietnam 0.7 1.6 0.1 1.5
Rest of ASEAN 0.5 1.5 0.2 1.3
Total ASEAN 7.5 31.0 4.3 26.6
Share of world 3.5% 3.5% 4.0% 3.4%
Notes: Proven reserves are usually defined as discovered volumes having a 90% probability that they can be extracted profitably. Ultimately recoverable resources comprises cumulative production, proven reserves, reserves growth (the projected increase in reserves in known fields) and as yet undiscovered resources that are judged likely to be ultimately producible using current technology. Remaining recoverable resources are equal to the ultimately recoverable resources less cumulative production. Sources: BGR (2012); O&GJ (2012); USGS (2000 and 2012); IEA databases and analysis.
The availability of infrastructure will be an important determinant of future exploration activity and production growth. Many of Southeast Asia’s gas production areas are located far from demand centres and will require either an expansion of transmission infrastructure or LNG liquefaction projects to ship the gas to regasification terminals at home or abroad. The Trans ASEAN Gas Pipeline project aims to establish broader gas interconnections throughout the region, though progress has been slowed by a shortage of gas sources and huge investment requirements. Meanwhile several countries are building or are considering plans to build floating liquefied natural gas (FLNG) facilities to develop remote resources and regasification terminals to receive imports. The low price of gas sold domestically poses another hurdle. In some cases, controlled prices may not be sufficiently high to stimulate development, stranding resources that could feed domestic markets.
Gas production in Southeast Asia has more than doubled over the last two decades. Indonesia and Myanmar, and to a lesser extent Malaysia, will drive further increases in Southeast Asian gas production in the period to 2035. Thailand, however, sees its gas production drop by 75%. Total gas production in the region grows by 30%, from 203 bcm in 2011 to about 260 bcm in 2035 (Table 3.7). About three-quarters of incremental growth comes onstream in the period to 2020.
© O
ECD
/IEA
, 201
3

84 World Energy Outlook | Special Report
Table 3.7 ⊳ Gas production by country (bcm)
1990 2011 2020 2025 2030 2035
2011-2035*
Brunei Darussalam 9 13 16 15 15 14 0.5%
Indonesia 48 81 108 118 129 139 2.3%
Malaysia 17 56 71 68 67 65 0.6%
Philippines 0 4 5 5 4 4 0.2%
Thailand 6 28 19 15 11 7 -5.5%
Vietnam 0 9 13 12 12 12 1.3%
Rest of ASEAN 1 12 18 19 21 22 2.6%
Total ASEAN 82 203 249 252 258 264 1.1%
Share of world 4.0% 6.0% 6.3% 5.8% 5.6% 5.3% n.a.
* Compound average annual growth rate.
Southeast Asia is a key exporter of LNG to global markets, and increasingly a LNG importer as well. In mid-2013, it had almost 90 bcm per year of LNG liquefaction capacity, accounting for almost one-quarter of the world total. This is located in Indonesia, Malaysia and Brunei Darussalam (Table 3.8). Fast-rising demand and limited interconnections between countries in Southeast Asia have prompted the installation of several LNG regasification terminals in recent years: as of mid-2013, Indonesia, Malaysia, Singapore and Thailand were receiving LNG shipments. In the case of Indonesia and Malaysia, a geographical mismatch between the location of gas resources and demand has created the situation in which they are simultaneously importers and exporters of LNG. Net exports from the region are expected to increase in the medium term, approaching 70 bcm in 2020, but then decline to 14 bcm in 2035 as domestic gas demand ramps up (Figure 3.12). Indonesia and Malaysia remain net gas exporters throughout the projection period, though Malaysia’s net exports are significantly eroded by domestic demand growth by 2035.
Figure 3.12 ⊳ ASEAN gas balance
50
100
150
200
250
300
1990 2000 2010 2020 2030 2035
bcm
Net exports
Production
Consumption
© O
ECD
/IEA
, 201
3

Chapter 3 | Fossil fuel resources and supply potential 85
3
Indonesia
While oil production in Indonesia has been in steady decline since the mid-1990s, its gas production has been increasing in recent years, reaching 81 bcm in 2011. Infrastructure is the most significant challenge to producing gas in Indonesia, as the bulk of the country’s gas resources are located on the outer islands, far from demand centres on the island of Java. Indonesia’s government has prioritised the development of gas for domestic use in power generation and industry, which could reduce the future availability of gas for export.
Indonesia’s proven gas reserves are just over 3 tcm. Its largest production areas are in Sumatra and East Kalimantan. The largest undeveloped prospect is located in the offshore East Natuna Block, which holds about 1.3 tcm of gas reserves. High CO2 content (around 70%) makes the project expensive and complex to develop, though exploration is expected to advance once agreement has been reached between Pertamina and partners (ExxonMobil, Total and PTT EP) on the terms of a production-sharing contract. Other promising areas that have yielded notable discoveries in recent years include West Papua and Sulawesi. FLNG facilities are opening up new development possibilities in remote areas, for example, in the Arafura Sea in East Indonesia where the Abadi FLNG project is planned.
Indonesia has also been pushing ahead with plans to develop its unconventional resources. Five companies finished a joint study regarding shale gas potential in North Sumatra and around 70 proposals to drill exploration wells have been submitted for approval, following a first licensing round. Licensing rounds for other prospective areas are planned in the coming months. The government expects commercial shale-gas production to begin in 2018. Exploration activity is also underway for coalbed methane and dozens of production-sharing agreements have been signed. The regulatory regime for unconventional gas developments, including the sharing of competences between local and central government, is under development, with tax incentives planned to bring investment forward.
Indonesia has historically been a significant exporter of gas, which it exports mainly as LNG to Japan, Korea and China. Indonesia’s three operating LNG liquefaction plants (Bontang, Arun and Tangguh) have a combined capacity of 45-bcm per year, and in 2012, it was the world’s fifth-largest LNG exporter. Exports have been in decline because of falling production at the Arun liquefaction plant in northern Sumatra, which is being wound down in preparation for its conversion to a regasification terminal in 2014. Two new liquefaction plants, Sengkang and Donggi-Senoro, are being built on the island of Sulawesi (Table 3.8). Additionally, there are plans to expand the Tangguh plant and, in the remote Arafura Sea, to build the Abadi FLNG project. Indonesia’s first regasification terminal, a floating storage and regasification unit (FSRU) in West Java, started receiving deliveries in 2012. Two others were under construction as of mid-2013 and there are plans to build several more in order to meet domestic gas demand needs.
© O
ECD
/IEA
, 201
3

86 World Energy Outlook | Special Report
Table 3.8 ⊳ ASEAN LNG export and import facilities
Project (location) Capacity Status Start
mmtpa bcm/y
Liqu
efac
tion
Brunei Brunei LNG 7.2 9.8 Operating 1972
Indonesia Bontang (East Kalimantan) 21.6 29.4 Operating 1978
Arun* (Aceh) 4.8 6.4 Operating 1978
Tangguh LNG (Papua) 7.6 10.3 Operating 2009
– expansion 3.8 5.2 Planned 2018
Donggi-Senoro (Central Sulawesi) 2.0 2.7 Construction 2014
Sengkang (South Sulawesi) 2.0 2.7 Construction 2014
Abadi FLNG (Arafura Sea) 2.5 3.4 Planned n.a.
Malaysia MLNG I, II & III (Bintulu) 24.2 32.9 Operating 1983
– expansion 3.6 4.9 Construction 2015
Kanowit FLNG (Sarawak) 1.2 1.6 Construction 2015
Rotan FLNG (Sabah) 1.5 2.0 Planned 2016
Rega
sific
atio
n
Indonesia West Java FSRU 3.7 5.2 Operating 2012
Lampung FSRU 2.0 2.8 Construction 2014
Arun* (Aceh) 1.5 2.1 Construction 2014
Banten FSRU 3.0 4.1 Planned 2014
Central Java FSRU 3.0 4.1 Planned 2016
Malaysia Lekas (Malacca) 3.8 5.2 Operating 2013
Lahad Datu (Sabah) 0.8 1.1 Planned 2016
Pengerang (Johor) 3.8 5.2 Planned 2017
Philippines Quezon 1.0 1.4 Planned 2014
Batangas FSRU 3.8 5.3 Planned 2017
Singapore Jurong Island 3.5 4.7 Operating 2013
– expansion 5.3 7.1 Construction 2013
Thailand Ma Ta Phut 5.0 6.9 Operating 2011
– expansion 5.0 6.9 Planned 2014
Vietnam Thi Vai 1.0 1.4 Planned 2016
Bin Thuan 3.0 4.1 Planned 2018
* The Arun LNG terminal is being converted from a liquefaction unit to a regasification unit. Notes: Information as of mid-2013. mmtpa = million metric tonnes per annum; FLNG = floating liquefied natural gas; FSRU = floating storage and regasification unit.
Sources: IEA (2013); IEA databases and analysis.
© O
ECD
/IEA
, 201
3
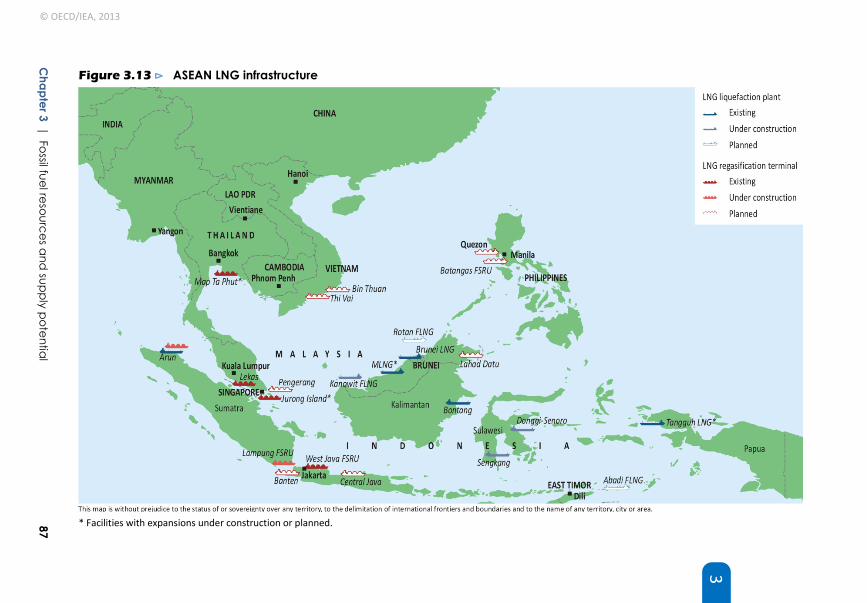
Chapter 3 | Fossil fuel resources a
nd supply potential
87
3
Figure 3.13 ⊳ ASEAN LNG infrastructure
* Facilities with expansions under construction or planned.
© OECD/IEA, 2013

88 World Energy Outlook | Special Report
Indonesia’s gas production is projected to grow by around 70% during the projection period, reaching nearly 140 bcm in 2035 (Figure 3.14). In the period to 2020, the ramp up of new LNG liquefaction projects is expected to contribute to increasing Indonesian gas production. After 2020, the growing output is expected to be driven by development of large offshore projects, such as East Natuna and Gendalo-Gehem. Additionally both shale gas and coalbed methane contribute to production from the 2020s, with their combined output reaching 20 bcm in 2035. The expansion of LNG liquefaction capacity boosts Indonesia’s net gas exports to around 55 bcm by 2020s, but they then level off as domestic gas demand increases.
Figure 3.14 ⊳ Gas production in Indonesia and Malaysia
Malaysia
Malaysia’s gas production in 2011 was 56 bcm, the second-largest in ASEAN. Production from offshore Peninsular Malaysia, including the Thailand-Malaysia Joint Development Area, has supplied rapidly increasing demand from domestic users, while production from offshore Sarawak feeds the 33-bcm MLNG (Bintulu) liquefaction terminal. Malaysia is the world’s second-largest LNG exporter, its main customers being Japan, Korea and China. However, there is considerable potential for greater gas use in Peninsular Malaysia given its population, economic activity and relatively well-developed gas distribution network, which may lead to falling net gas exports over time.
Proven gas reserves in Malaysia are 2.4 tcm. Gas from offshore Sarawak and Sabah is expected to be used to sustain exports from the MLNG terminal. Prospects for continued exports remain strong in the medium term, with recent discoveries and new developments expected to keep the MLNG terminal operating at full capacity through at least 2018. A ninth liquefaction train, expected to be added by 2015, will expand its capacity by 15%. Construction has begun on the Kanowit FLNG terminal, which would be used to develop fields offshore Sarawak. With its commissioning expected around 2015, it would be the world’s first operating FLNG facility. Malaysia became a simultaneous exporter and importer of LNG in 2013 with the commissioning of the 5.2-bcm Lekas regasification
30
60
90
120
150
1990 2011 2020 2035
Indonesia
1990 2011 2020 2035
Malaysia Net exports Consumption bc
m
© O
ECD
/IEA
, 201
3

Chapter 3 | Fossil fuel resources and supply potential 89
3
terminal in Malacca. The facility is set to be supplied under long-term contracts signed with Qatargas and Gladstone LNG (Australia), while at least two other small regasification terminals are planned (Pengerang and Lahad Datu).
Malaysia’s gas production is projected to rise in the medium term, reaching about 70 bcm in 2020, before declining slightly to 65 bcm in 2035 (Figure 3.14). Net gas exports increase to about 30 bcm by 2020, but thereafter are narrowed by increasing domestic gas demand, falling to 17 bcm in 2035.
Other ASEAN
Brunei Darussalam’s gas output has been sustained at around 12-13 bcm per year despite declining oil production. Southwest Ampa is its largest producing gas field, making up the majority of its production, though future prospects hinge on exploration in the deepwater of the Baram Delta. Most of Brunei Darussalam’s gas production feeds the 9.8-bcm Brunei LNG liquefaction plant, from which it exports to Japan and Korea under long-term contracts. Production is projected to increase modestly to 14 bcm at the end of the Outlook period, the country remaining a net gas exporter.
Gas production in Vietnam has grown steadily in the past decade, reaching 9 bcm in 2011. The Lan Tay field in the Nam Con Son basin, located offshore southern Vietnam, provides almost two-thirds of the county’s total output, supplying gas to the onshore Phu My power plant. The expectation that domestic gas demand growth will outpace production has prompted plans to build the Thi Vai LNG regasification terminal, which is scheduled to be completed by 2016. A second regasification terminal is also planned. Vietnam’s gas production is projected to remain relatively steady throughout the projection period. New developments in the Nam Con Son basin and the Chevron-operated “Block B” project in the Malay basin (though a disagreement over the price of gas may delay the project) are projected to boost Vietnam’s total gas output in the short term. Gas prospects are promising in the underexplored Song Hon basin and other frontier areas in the South China Sea. Development of the latter may be hindered by an ongoing territorial dispute with China (Box 3.1).
As with oil, most of Thailand’s gas-producing fields lie offshore in the Gulf of Thailand, including the PTT EP-operated Bongkot field, the country’s largest. Production, at 28 bcm in 2011, has risen in recent years as new output has come onstream from the Joint Development Area shared with Malaysia. Thailand’s net imports of gas were 11 bcm in 2011, the majority received by pipeline from Myanmar. With domestic demand outpacing production, the country began taking LNG shipments in 2011 following the opening of the Map Ta Phut regasification terminal. The Overlapping Claims Area with Cambodia is promising in the long term, however its development hinges on the two countries resolving their long-standing dispute. Thailand’s gas production is projected to fall by 75% during the Outlook period, as new projects and efforts to maintain output in existing production areas will not be enough to offset decline. Coupled with rising domestic gas demand, net gas imports rise to almost 60 bcm in 2035, with additional volumes likely to come via Myanmar and increasing LNG imports.
© O
ECD
/IEA
, 201
3

90 World Energy Outlook | Special Report
Myanmar holds notable potential for increasing its gas production. The bulk of its output currently comes from the offshore Yadana and Yetagun fields, which mainly supply exports to Thailand. Production is ramping up at the offshore Shwe field, which is the primary source of gas that will feed the newly commissioned Myanmar-China gas pipeline (July 2013). With a transmission capacity of 12 bcm/year, the pipeline will support rising exports to China’s Yunnan province based on a 30-year agreement. The government has sought to increase foreign investment in the energy sector following the lifting of economic sanctions, and has attracted strong interest in several acreage offerings since 2011. However, it will take time to develop additional prospects and it is unclear whether future gas supplies will be for domestic use or for export. The government issued a tender in July 2013 to import increasing volumes of LNG.
© O
ECD
/IEA
, 201
3

Chapter 4 | The Efficient ASEAN Scenario 91
Chapter 4
The Efficient ASEAN Scenario Is enough energy being put into improving efficiency?
Highl ights • More efficient use of energy is getting increased attention in Southeast Asia in
recognition of the need to curb demand growth, reduce energy imports and mitigate pollution. In the New Policies Scenario, ASEAN energy intensity declines on average by 1.9% per year to 2035, compared with 0.6% per year between 1990 and 2011.
• These gains mark progress. Nevertheless, considerable scope for further energy efficiency improvement remains. In the New Policies Scenario, three-quarters of the region’s economically viable energy efficiency potential still remains untapped. Moreover, the energy intensity of Southeast Asia improves at a pace only marginally faster than the global average, preserving the significant gap between it and the advanced economies.
• The Efficient ASEAN Scenario, the focus of this chapter, shows how tackling barriers to energy efficiency investment can unleash this potential. ASEAN energy intensity improves by 2.5% per year on average, cutting growth in primary energy demand by almost 15% in 2035, an amount exceeding the current demand in Thailand. Demand for all forms of energy increases to support economic and population growth, but at a more moderate pace. In 2035, coal demand is 25% lower than in the New Policies Scenario, oil is down 10% and natural gas is 11% lower.
• Industry accounts for 42% of the savings in the Efficient ASEAN Scenario in 2035, followed by transport (38%) and buildings (20%). These savings result mainly from the deployment of more efficient equipment, introduction of more stringent efficiency standards and faster phase out of energy subsidies. Fuel consumption in the power sector is reduced by almost one-fifth, driven by lower electricity demand from end-use sectors and more efficient fossil-fuelled power plants. Additional investment of $330 billion in more efficient end-uses is needed, but is more than offset by fuel cost savings of almost $500 billion in end-use sectors. Net economic savings in the power sector total almost $200 billion.
• The Efficient ASEAN Scenario delivers major economic, environmental and energy security gains in the period 2013-2035. Cumulative GDP rises by $1.7 trillion compared with the New Policies Scenario. By 2035, the region’s GDP is almost 2% higher. Oil import needs fall by 700 kb/d, cutting oil import bills in 2035 by $31 billion, while revenues from increased coal and natural gas exports reach $29 billion. Southeast Asia’s energy-related CO2 emissions are 19% lower in 2035 than in the New Policies Scenario; air quality is also improved with reduced emissions of local pollutants and particulate matter.
© O
ECD
/IEA
, 201
3
92 World Energy Outlook | Special Report
Introduction Only a relatively small share of the energy efficiency potential has been achieved in the ASEAN countries. As primary energy demand is poised to increase at more than twice the average global rate in the coming decades, taking action to improve energy efficiency is important. The extent to which energy efficiency performance is improved will be a key factor in determining the energy balance for the region, including energy import and export levels for individual countries. This will, in turn, impact economic and social development.
In this chapter, we analyse past trends, recent policy changes and the extent to which energy efficiency potential is exploited in the New Policies Scenario. Building from this, we present the Efficient ASEAN Scenario. The scenario makes no bold assumptions about technical breakthroughs, but instead shows the benefits that could be achieved if best available technologies and practices to improve energy efficiency are systematically adopted. These technologies are subject to a stringent economic viability test, expressed as acceptable payback periods for each class of investment. Government actions needed to eliminate barriers that hinder the uptake of energy efficiency are discussed.
We use decomposition analysis to analyse the future role of energy efficiency. This approach singles out the efficiency effect from activity-related energy changes and those due to technology and fuel switching.1 We use energy intensity - measured as primary energy demand per unit of real GDP using market exchange rate (MER) terms - as the best available proxy to consider how energy efficiency has tempered growth in energy demand. However, energy intensity is not a perfect indicator as it does not distinguish the effects of unrelated factors, such as changes in a country’s economic structure or its climatic conditions. For example, service-oriented and temperate climate countries typically have lower energy intensities than those with a large manufacturing base and a cold climate, regardless of their energy efficiency.
Status of energy efficiency Southeast Asia’s economy was one of the fastest growing in the world over 1980-2011, with GDP rising by over 5% per year on average. Rapid economic expansion, however, was not accompanied by a significant reduction in its energy intensity, which improved by only 12% overall. This compares with an improvement of 26% worldwide, 38% in OECD countries, 74% in China and 44% in India (Figure 4.1). Improvement in energy intensity in Southeast Asia has been slow because, as it transformed to more energy-intensive economies, it failed to fully tap available technical potential for energy efficiency. Its industrial energy intensity – measured as energy consumed per unit of industrial value added – worsened by 0.2% per year between 1980 and 2011.2 While other emerging economies improved energy intensity over the same period, such as China (5.9% per year) and India (2.3% per year), the annual average for OECD countries was 2.1%.
1 For more detail on the methodology used, see www.worldenergyoutlook.org. 2 The 1997-1998 Asian Financial crisis further contributed to deteriorating energy intensity levels. This was mainly due to a steep decline in industrial output that was not accompanied by a proportional reduction in energy consumption, since running industrial facilities below full capacity reduces less than proportionally the amount of energy used.
© O
ECD
/IEA
, 201
3

Chapter 4 | The Efficient ASEAN Scenario 93
4
Fig
ure
4.1
⊳
Tren
ds in
ene
rgy
inte
nsity
and
GDP
per
cap
ita in
sel
ecte
d co
untri
es, 1
980
- 201
1
Indo
nesi
a
Mal
aysi
a
Phili
ppin
es
Thai
land
Vie
tnam
Ch
ina
Indi
a
toe
per
1
000
dolla
rs
(201
2, M
ER)
Dol
lars
per
cap
ita (2
012,
MER
)
10 0
00
8 00
0
6 00
0
4 00
0
2 00
0
1.6
1.4
1.2
1.0
0.8
0.6
0.4
0.2
OEC
D
Sing
apor
e
Japa
n
Mal
aysi
a
10 0
00
20 0
00
30 0
00
40 0
00
50 0
00
60 0
00
0.1
0.2
0.3
1980
1990
2000
2011
Not
e: G
DP
is m
easu
red
at m
arke
t exc
hang
e ra
tes
(MER
) in
year
-201
2 do
llars
.
0 0
0 0
© O
ECD
/IEA
, 201
3

94 World Energy Outlook | Special Report
This is not to say that Southeast Asia has not made progress. Between 2000 and 2011, energy intensity in industry in Southeast Asia declined by an annual average of 0.8%, outpacing the global average but still half the average rate of OECD countries (Figure 4.2).
Figure 4.2 ⊳ Energy intensity improvements in industry by selected country and region, 1980-2000 and 2000-2011
Overall in the last decade, Southeast Asia has matched energy intensity improvements made by OECD countries (though it started from a much higher level of energy intensity and therefore did not close the gap). This reflects shifts from inefficient traditional fuels to modern fuels, underpinned by urbanisation; increased share of high value-added services in the economy; and considerable improvements in industrial energy use. Significant scope for improving energy efficiency remains: Southeast Asia currently consumes more than twice the amount of energy per unit of GDP than the OECD average.
Untapped efficiency potential exists across the region in each of the energy end-use sectors as well as in power generation. For example, inefficient appliances and incandescent light bulbs in the buildings sector and industrial motors with low efficiency remain commonplace.3 Air conditioners in the region are highly inefficient compared with best available technologies and their use is expanding rapidly as urbanisation and rising incomes lead to more demand for cooling. Efficiency of fossil-fuelled power plants averages 38% across the region, with a low of just 28% in Myanmar to a high of 44% in Singapore (higher than the OECD average). Low power plant efficiencies are linked to the use of dated technologies and poor maintenance practices. Losses from the transmission and distribution of electricity are also higher than in more advanced economies, averaging 8% in 2011 compared with 6% in OECD countries and less than 5% in Japan.
3 A recent analysis from Asian Development Bank highlights that the best performing liquid-crystal display (LCD) or light-emitting diode (LED) televisions sold in the Philippines market consume twice the power of those available in developed countries.
-20% 0% 20% 40% 60% 80%
ASEAN
China
India
OECD
World 1980-2000 2000-2011
© O
ECD
/IEA
, 201
3

Chapter 4 | The Efficient ASEAN Scenario 95
4
Figure 4.3 illustrates the significant differences among the Southeast Asian countries in terms of their current energy intensity levels and changes since 1980. Vietnam has the highest energy intensity at more than 85% above the average for the region. Vietnam’s economy has transitioned from heavy reliance on agriculture to one that is much more diversified. Its primary energy mix has evolved accordingly: in 1980, about 70% of consumption was bioenergy with the share of fossil fuels limited to around one-quarter; by 2011, the shares were reversed, with fossil fuels accounting for more than 70% of the total.4
Figure 4.3 ⊳ Energy intensity and annual average improvements in selected countries, 1980 and 2011
* Compound average annual growth rate. Notes: Positive values indicate energy intensity improvements. MER = market exchange rate.
The steep decline in Vietnam’s energy intensity between 1980 and 2000 was largely because of the dramatic fall in the use of traditional biomass. However, over the last decade, there has been strong expansion of the industrial sector including energy-intensive sub-sectors, with efficiency levels remaining poor, particularly in state-owned enterprises. Energy consumption in buildings and transport has also expanded rapidly, outpacing the increase in the sector’s value added and contributing to growing energy intensity (World Bank, 2010). Since 2000, rapid growth in the share of fossil-fuelled plants in the power generation mix, at the expense of hydro, has further worsened Vietnam’s energy intensity.
Thailand‘s energy intensity is 37% above the regional average. It has increased slightly over the last two decades, mainly due to a restructuring of its economy. The industrial base, dominated largely by manufacturing activities such as machinery, electronic components and vehicle assembly, has expanded significantly, with its contribution to GDP climbing from 34% in 1990 to 45% today. Moreover, the energy intensity of Thailand’s transport sector (measured as energy used in transport per unit GDP) is high relative to its regional neighbours due to its high level of motorisation and heavy dependence on road transport.
4 Bioenergy includes biomass and waste.
0.2
0.4
0.6
0.8
1.0
Philippines Malaysia Thailand Indonesia Singapore Vietnam ASEAN
toe
per 1
000
dol
lars
($20
12, M
ER)
-0.5%
0%
0.5%
1.0%
1.5%
2.0%
2.5% 1980
2011
1980-2011* (right axis)
© O
ECD
/IEA
, 201
3
96 World Energy Outlook | Special Report
In Indonesia, the poor level of energy intensity is linked to the relatively high share of biomass (typically combusted in inefficient devices) in the energy mix, the prevalence of subsidies that reduce consumers’ incentive to conserve energy and the rapid growth in energy-intensive industrial activities, particularly petrochemicals, fertilisers and cement production. However, Indonesia has made strides over the last decade in improving its energy intensity, which declined by 23%. This was the result of urbanisation, which brought about a switch towards more efficient commercial fuels such as oil and electricity, and improved practices and technology being introduced in the industry and buildings sectors.
Malaysia’s high energy intensity reflects the weight of the upstream energy sector and the manufacturing of energy-intensive goods (such as pharmaceuticals and chemicals) in its economy. Furthermore, Malaysia’s power generation mix has experienced a shift to much more use of coal, with its share of generation rising from 11% in 2000 to 41% in 2011, mainly at the expense of higher efficiency gas and hydro power plants.
Singapore and the Philippines have the lowest energy intensities in Southeast Asia, at 50% 30% lower, respectively, than the regional average. Given their limited indigenous energy resources, both countries have historically tried to minimise wasteful energy consumption. Other factors have also been at play. Singapore is a relatively mature economy dominated by the services sector. Moreover, its economy has a reasonably low share of energy-intensive industries (mainly petroleum refining and petrochemicals). And being densely populated and with limited available land, Singapore has developed good public transport networks.
In the Philippines, high dependence on oil imports, relatively low per-capita income, cost-reflective energy pricing and poorly developed energy infrastructure have led to modest growth in energy demand compared with other ASEAN countries. The country’s economy is relatively labour intensive. Its energy prices are among the highest in the region, partly as a consequence of its reliance on high cost gas from its offshore Malampaya field. In addition to being low compared with the ASEAN average, the Philippines realised a 39% improvement in energy intensity between 2000 and 2011, driven by a significant reduction in the share of bioenergy and oil in the energy mix as well as improvements in industry’s energy intensity.
Existing energy efficiency policies and barriers
All countries in Southeast Asia have taken steps to improve energy efficiency. The range of adopted policies and measures, such as regulations, market-based and financial instruments, and information and awareness measures are taken into consideration in our New Policies Scenario. Existing and proposed efficiency policies by country are summarised in Table 4.1.
Southeast Asian countries have been actively involved in international co-operative efforts on energy efficiency. In 2007, the Cebu Declaration on East Asian Energy Security set the basis for sector-specific energy efficiency goals and action plans, for which each country’s
© O
ECD
/IEA
, 201
3
Chapter 4 | The Efficient ASEAN Scenario 97
4
progress is monitored annually during the East Asia Summit Energy Ministers’ Meetings. Based on the ASEAN Plan of Action for Energy Cooperation (APAEC) for the period 2010-2015, member states also have a target to reduce regional energy intensity by at least 8% from 2005 levels by 2015. Recently, ASEAN members have been discussing the introduction of more ambitious efficiency targets beyond 2015.
There remain major barriers to improving energy efficiency in the region. Policies have generally focused on voluntary measures, support for model projects and enhancing awareness. There has been a lesser role for mandatory measures and incentives for widespread deployment and practical implementation. Despite recent reforms and announcements, such as in Indonesia and Malaysia, fossil-fuel subsidies remain prevalent across the region. These mask the real cost of energy, discouraging efficient consumption and reducing incentives to invest in more energy-efficient equipment (Box 4.1). Moreover, institutional frameworks need to be further developed. Other than Indonesia, Singapore, Thailand and Vietnam, ASEAN countries do not have specific legal frameworks for energy efficiency, and, in many cases, responsibility for enforcement of related policies is split among several authorities, leading to a modest level of implementation.
Energy efficiency policies in the transport sector have shown signs of improvement, though no country in the region has introduced fuel-economy standards like those in most major car markets around the world. Thailand is developing mandatory standards that will discourage the uptake of vehicles with low fuel economy and has introduced a 17% tax reduction for the purchase of cars with average fuel consumption of no lower than 20 km/litre and meeting at least Euro 4 emissions standards. Indonesia plans to introduce mandatory carbon-dioxide (CO2) emissions standards for passenger vehicles. Fiscal incentives, though they are not common, could represent an opportunity to promote more fuel-efficient vehicles, especially with high tax rates applied to vehicle purchases across the region. Singapore recently introduced a carbon-based scheme which rewards high efficiency “eco-cars” with rebates of up to 20 000 Singapore dollars ($16 000) and imposes penalties for high-emissions cars.
In the industry sector, mandatory energy management programmes for large energy users are in place in Indonesia, Malaysia, Singapore, Thailand and Vietnam. Factories in Thailand with energy capacity over 1 000 kilowatts (kW), or with annual consumption exceeding 20 terajoules (TJ), are required to implement energy management programmes and to make progress reports available for external auditing.5 In Singapore, energy-intensive companies are required to submit efficiency improvement plans. Large energy users in Indonesia and Vietnam must perform mandatory energy audits, appoint an energy manager, implement an energy efficiency programme and report progress each year. However, the diffusion of energy efficient practices and technologies in industry remains limited across the region, mainly because of financing challenges or a lack of awareness and expertise.
5 Thailand is currently considering energy management obligations for small-to-medium size enterprises and buildings.
© O
ECD
/IEA
, 201
3
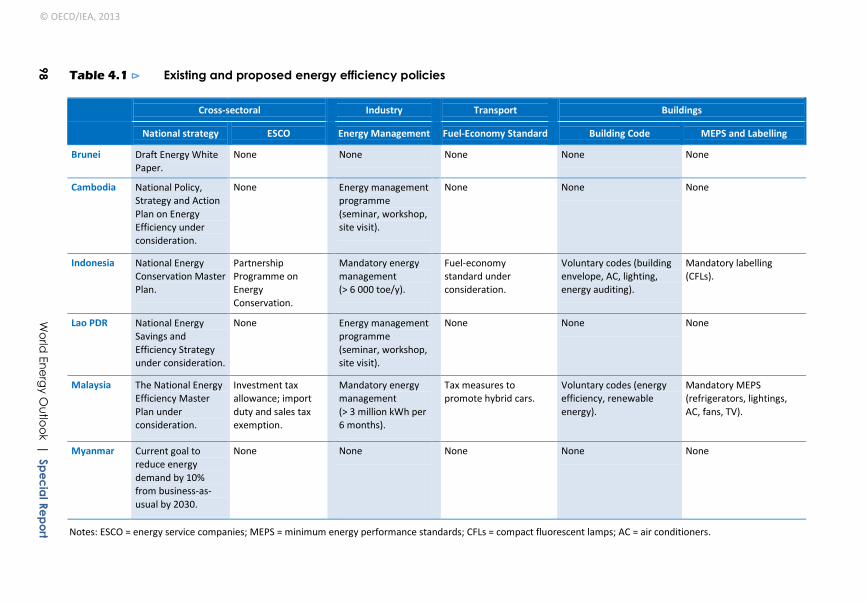
98 W
orld Energy O
utlook | Special Report
Table 4.1 ⊳ Existing and proposed energy efficiency policies
Buildings
MEPS and Labelling
None
None
Mandatory labelling (CFLs).
None
Mandatory MEPS (refrigerators, lightings, AC, fans, TV).
None
Notes: ESCO = energy service companies; MEPS = minimum energy performance standards; CFLs = compact fluorescent lamps; AC = air conditioners.
Building Code
None
None
Voluntary codes (building envelope, AC, lighting, energy auditing).
None
Voluntary codes (energy efficiency, renewable energy).
None
Transport
Fuel-Economy Standard
None
None
Fuel-economy standard under consideration.
None
Tax measures to promote hybrid cars.
None
Industry
Energy Management
None
Energy management programme (seminar, workshop, site visit).
Mandatory energy management (> 6 000 toe/y).
Energy management programme (seminar, workshop, site visit).
Mandatory energy management (> 3 million kWh per 6 months).
None
Cross-sectoral
ESCO
None
None
Partnership Programme on Energy Conservation.
None
Investment tax allowance; import duty and sales tax exemption.
None
National strategy
Draft Energy White Paper.
National Policy, Strategy and Action Plan on Energy Efficiency under consideration.
National Energy Conservation Master Plan.
National Energy Savings and Efficiency Strategy under consideration.
The National Energy Efficiency Master Plan under consideration.
Current goal to reduce energy demand by 10% from business-as-usual by 2030.
Brunei
Cambodia
Indonesia
Lao PDR
Malaysia
Myanmar
© OECD/IEA, 2013
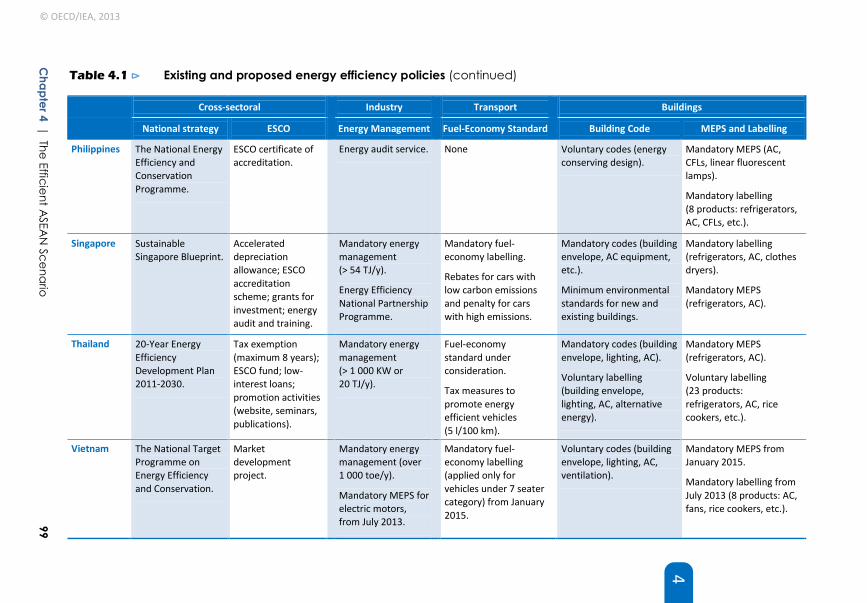
Chapter 4 | The Efficient A
SEAN
Scenario
99
4
Table 4.1 ⊳ Existing and proposed energy efficiency policies (continued)
Buildings
MEPS and Labelling
Mandatory MEPS (AC, CFLs, linear fluorescent lamps).
Mandatory labelling (8 products: refrigerators, AC, CFLs, etc.).
Mandatory labelling (refrigerators, AC, clothes dryers).
Mandatory MEPS (refrigerators, AC).
Mandatory MEPS (refrigerators, AC).
Voluntary labelling (23 products: refrigerators, AC, rice cookers, etc.).
Mandatory MEPS from January 2015.
Mandatory labelling from July 2013 (8 products: AC, fans, rice cookers, etc.).
Building Code
Voluntary codes (energy conserving design).
Mandatory codes (building envelope, AC equipment, etc.).
Minimum environmental standards for new and existing buildings.
Mandatory codes (building envelope, lighting, AC).
Voluntary labelling (building envelope, lighting, AC, alternative energy).
Voluntary codes (building envelope, lighting, AC, ventilation).
Transport
Fuel-Economy Standard
None
Mandatory fuel-economy labelling.
Rebates for cars with low carbon emissions and penalty for cars with high emissions.
Fuel-economy standard under consideration.
Tax measures to promote energy efficient vehicles (5 l/100 km).
Mandatory fuel-economy labelling (applied only for vehicles under 7 seater category) from January 2015.
Industry
Energy Management
Energy audit service.
Mandatory energy management (> 54 TJ/y).
Energy Efficiency National Partnership Programme.
Mandatory energy management (> 1 000 KW or 20 TJ/y).
Mandatory energy management (over 1 000 toe/y).
Mandatory MEPS for electric motors, from July 2013.
Cross-sectoral
ESCO
ESCO certificate of accreditation.
Accelerated depreciation allowance; ESCO accreditation scheme; grants for investment; energy audit and training.
Tax exemption (maximum 8 years); ESCO fund; low-interest loans; promotion activities (website, seminars, publications).
Market development project.
National strategy
The National Energy Efficiency and Conservation Programme.
Sustainable Singapore Blueprint.
20-Year Energy Efficiency Development Plan 2011-2030.
The National Target Programme on Energy Efficiency and Conservation.
Philippines
Singapore
Thailand
Vietnam
© OECD/IEA, 2013
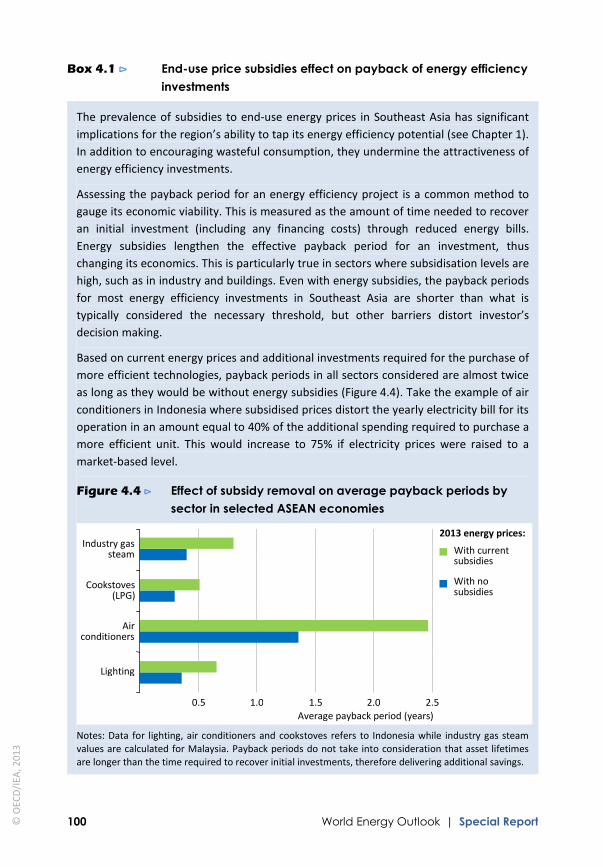
100 World Energy Outlook | Special Report
Box 4.1 ⊳ End-use price subsidies effect on payback of energy efficiency investments
The prevalence of subsidies to end-use energy prices in Southeast Asia has significant implications for the region’s ability to tap its energy efficiency potential (see Chapter 1). In addition to encouraging wasteful consumption, they undermine the attractiveness of energy efficiency investments.
Assessing the payback period for an energy efficiency project is a common method to gauge its economic viability. This is measured as the amount of time needed to recover an initial investment (including any financing costs) through reduced energy bills. Energy subsidies lengthen the effective payback period for an investment, thus changing its economics. This is particularly true in sectors where subsidisation levels are high, such as in industry and buildings. Even with energy subsidies, the payback periods for most energy efficiency investments in Southeast Asia are shorter than what is typically considered the necessary threshold, but other barriers distort investor’s decision making.
Based on current energy prices and additional investments required for the purchase of more efficient technologies, payback periods in all sectors considered are almost twice as long as they would be without energy subsidies (Figure 4.4). Take the example of air conditioners in Indonesia where subsidised prices distort the yearly electricity bill for its operation in an amount equal to 40% of the additional spending required to purchase a more efficient unit. This would increase to 75% if electricity prices were raised to a market-based level.
Figure 4.4 ⊳ Effect of subsidy removal on average payback periods by sector in selected ASEAN economies
Notes: Data for lighting, air conditioners and cookstoves refers to Indonesia while industry gas steam values are calculated for Malaysia. Payback periods do not take into consideration that asset lifetimes are longer than the time required to recover initial investments, therefore delivering additional savings.
0.5 1.0 1.5 2.0 2.5
Lighting
Air conditioners
Cookstoves (LPG)
Industry gas steam
Average payback period (years)
With current subsidies
2013 energy prices:
With no subsidies
© O
ECD
/IEA
, 201
3
Chapter 4 | The Efficient ASEAN Scenario 101
4
Most Southeast Asian countries have introduced energy codes for new and existing buildings (which includes the commercial and residential sectors).6 However, their stringency and enforcement vary greatly and, in most cases, they are not mandatory. Singapore and Thailand have been first movers, adopting strict standards on building envelopes and systems for air conditioning and lighting. Efficiency labelling for equipment and appliances is relatively common, but only recently have minimum energy performance standards (MEPS) been adopted in half of the ASEAN countries. The Philippines was the first to adopt mandatory MEPS (in 1993); Thailand has mandatory MEPS as well as voluntary high energy performance standards (HEPS) (as of 2007); Malaysia introduced MEPS in 2013 on selected electrical appliances and lighting, while Singapore adopted mandatory MEPS in 2011; and, Vietnam plans to prohibit the production or import of household electrical products that do not meet MEPS (from January 2015). Even in these countries, there remains significant scope to extend the coverage of equipment and appliance standards as well as to ensure a stricter compliance with those measures already in place.
The market for energy service companies (ESCOs), which provide financing for private investment in energy efficiency, remains limited in Southeast Asia with only a few countries providing incentives for their activity. Thailand established an ESCO fund in 2008 using revenues from a tax on petroleum products, which contributes to financing businesses involved in equity investment, equipment leasing, carbon credit and credit guarantees. Although the Philippines has very high electricity prices, its ESCO market remains highly fragmented, with many small operators that lack the capacity to fully exploit energy efficiency potential.
Untapped potential in the New Policies Scenario
The pace at which energy intensity in the region is projected to improve in the New Policies Scenario, almost 40% between 2011 and 2035, represents a significant increase on past trends, though it remains twice as high as in OECD countries in 2035 (Figure 4.5). Indonesia’s energy intensity, at 2.3% per year, improves at the quickest pace (among the four countries that have been modelled on a disaggregated basis), followed by Thailand (1.8%) and Malaysia (1.7%). The rate of improvement in the Philippines is slower (1.1% per year), but its energy intensity in 2011 was already 30% below the regional average, as the country had been able to achieve significant improvements over the last two decades.
Improvements in energy intensity in Southeast Asia stem from several factors. First, the demographic shift towards urban areas leads to increasing use of more efficient fuels. This contributes to a declining share of the buildings sector in final energy consumption, despite rising incomes and increasing access to modern energy services. Second, the region’s economic structure is transitioning from rural activities to higher value-added ones, such as
6 The buildings sector includes energy used in residential, commercial and institutional buildings, and non-specified other. Building energy use includes space heating and cooling, water heating, lighting, appliances and cooking equipment.
© O
ECD
/IEA
, 201
3

102 World Energy Outlook | Special Report
manufacturing and services. Third, it is assumed that ongoing reforms to energy subsidies and announced plans to reform energy subsidies incentivise energy efficiency and conservation. In addition, the average efficiency of power generation improves, despite a large expansion of coal-fired power plants (which are on average less efficient than alternatives), which slows the rate at which it approaches the global average.
Figure 4.5 ⊳ Energy intensity and average annual change in ASEAN in the New Policies Scenario
* Compound average annual growth rate. Note: Positive values indicate energy intensity improvements. MER = market exchange rate.
Nevertheless, our analysis shows that around three-quarters of Southeast Asia’s economic potential for energy efficiency in 2035 would be unexploited in the New Policies Scenario (Figure 4.6). Among end-use sectors, industry registers the best performance, tapping about 30% of its potential. These savings result from higher energy prices, which make it attractive to replace dated equipment and employ higher standards in new industrial capacity. They also stem from industrial energy audits and energy management standards that become common practice across the region.
The transport sector taps only 25% of its economically viable energy efficiency potential in the New Policies Scenario. The introduction of fuel-economy standards in some countries contributes to reduced average fuel consumption of passenger light-duty vehicles (PLDV), which drops from 9.1 litres per 100 kilometres (l/100 km) in 2011 to 7.6 l/100 km in 2035. The bulk of the savings are realised in the second-half of the projection period, reflecting the time necessary for more rigorous standards to affect the vehicle stock in use. Nonetheless, at the end of the projection period, the average efficiency of PLDVs in the region is significantly lower than the average in OECD countries. Some countries have announced plans to promote hybrid and electric vehicles – including the Philippines, which plans to introduce 100 000 three-wheel electric vehicles by 2020 – but in the New Policies Scenario their share of the fleet remains negligible even in 2035.
-1.0%
-0.5%
0%
0.5%
1.0%
1.5%
2.0%
2.5%
Indonesia Malaysia Philippines Thailand ASEAN
0.1
0.2
0.3
0.4
0.5
toe
per 1
000
dol
lars
($
2012
, MER
)
1990-2011 2011-2035
2011
2035
Energy intensity (right axis):
Average annual change in energy intensity*:
© O
ECD
/IEA
, 201
3
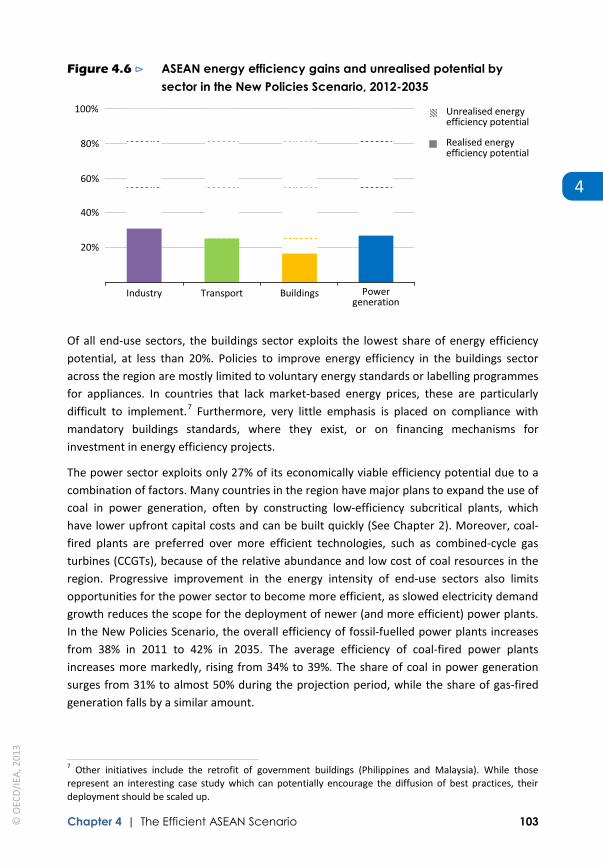
Chapter 4 | The Efficient ASEAN Scenario 103
4
Figure 4.6 ⊳ ASEAN energy efficiency gains and unrealised potential by sector in the New Policies Scenario, 2012-2035
Of all end-use sectors, the buildings sector exploits the lowest share of energy efficiency potential, at less than 20%. Policies to improve energy efficiency in the buildings sector across the region are mostly limited to voluntary energy standards or labelling programmes for appliances. In countries that lack market-based energy prices, these are particularly difficult to implement.7 Furthermore, very little emphasis is placed on compliance with mandatory buildings standards, where they exist, or on financing mechanisms for investment in energy efficiency projects.
The power sector exploits only 27% of its economically viable efficiency potential due to a combination of factors. Many countries in the region have major plans to expand the use of coal in power generation, often by constructing low-efficiency subcritical plants, which have lower upfront capital costs and can be built quickly (See Chapter 2). Moreover, coal-fired plants are preferred over more efficient technologies, such as combined-cycle gas turbines (CCGTs), because of the relative abundance and low cost of coal resources in the region. Progressive improvement in the energy intensity of end-use sectors also limits opportunities for the power sector to become more efficient, as slowed electricity demand growth reduces the scope for the deployment of newer (and more efficient) power plants. In the New Policies Scenario, the overall efficiency of fossil-fuelled power plants increases from 38% in 2011 to 42% in 2035. The average efficiency of coal-fired power plants increases more markedly, rising from 34% to 39%. The share of coal in power generation surges from 31% to almost 50% during the projection period, while the share of gas-fired generation falls by a similar amount.
7 Other initiatives include the retrofit of government buildings (Philippines and Malaysia). While those represent an interesting case study which can potentially encourage the diffusion of best practices, their deployment should be scaled up.
20%
40%
60%
80%
100%
Industry Transport Buildings Power generation
Unrealised energy efficiency potential
Realised energy efficiency potential
© O
ECD
/IEA
, 201
3

104 World Energy Outlook | Special Report
The Efficient ASEAN Scenario
Overview and assumptions
The Efficient ASEAN Scenario rests on the core assumption that the market realises the potential of all known energy efficiency measures that are economically viable.8 To calculate the economic potential, which varies by sector, two key steps were taken. First, technical potentials were determined, identifying key technologies and measures to improve energy efficiency over 2011-2035. Second, energy efficiency measures that are economically viable were identified. The criterion adopted was the amount of time – or payback period – that an investor might be reasonably willing to wait to recover the cost of an energy efficiency investment through the value of undiscounted fuel savings. Key policies implemented in the Efficient ASEAN Scenario by sector are shown in Table 4.2.
Table 4.2 ⊳ Key policy assumptions in the Efficient ASEAN Scenario by sector
Sector Policy assumption
Buildings Stringent energy codes for new buildings and those undergoing renovation implemented by 2015 and enhanced by 2020.
Increased building energy management systems for all buildings in the service sector.
Stepwise implementation of Cooperative Energy Efficiency Design for Sustainability (CEEDS): building codes, energy standards and/or labelling for major appliances including cooling and lighting.
Energy standards for cooking and water heating starting in 2015, implemented/enhanced by 2020.
Industry Efficiency of all new equipment, including highly efficient electric motor systems, equals level of best available technology by 2015.
Transformation of production systems, for instance through increased use of recycled or substitute materials.
System optimisation by implementation of process control and energy management programmes.
Transport Progressive improvements in energy efficiency in road transport, for example via mandatory fuel-economy standards, fuel-economy labelling, tax breaks and incentives.
Power generation and grids
Introduction of efficiency standards for existing fossil-fuel plants, which reduce their refurbishment and shorten the lifetime of inefficient plants.
Increased construction of supercritical and ultra-supercritical coal plants and gas-fired CCGT plants.
Higher efficiency standards for transmission and distribution networks.
8 The methodology is based on the Efficient World Scenario of the World Energy Outlook-2012. For more details see www.worldenergyoutlook.org. The approach differs from much of the analysis of energy savings potential in the ASEAN region that has been undertaken by a number of other organisations, which have typically been based on the realisation of energy efficiency goals (see for example, ERIA, 2013; IEEJ, 2011).
© O
ECD
/IEA
, 201
3

Chapter 4 | The Efficient ASEAN Scenario 105
4
The choice of average payback periods is by definition a controversial topic, as in practice they are likely to vary widely with specific local circumstances. We have based the payback periods on an extensive data search as well as consultations with authorities, organisations and companies operating in the region. They were calculated as averages over the Outlook period and take account of sector-specific considerations. The payback periods selected are considerably shorter than the operating lifetime of the assets, meaning that there would be additional energy savings beyond the end of the projection period. The payback periods adopted do not take into account the transaction costs associated with overcoming the present barriers to investment as the scenario assumes that these barriers will be dissipated by a bundle of targeted policy measures, so eliminating, or at least, minimising, transaction costs.
With the exception of assumptions related to energy efficiency, all other assumptions adopted in the Efficient ASEAN Scenario including those for economic growth and international energy pricing are as per the New Policies Scenario (see Chapter 1). However, fossil-fuel subsidies in the Efficient ASEAN Scenario are assumed to be phased out more rapidly than in the New Policies Scenario (Box 4.2).
Box 4.2 ⊳ Measuring the benefits of fossil-fuel subsidy reform
Subsidies to fossil fuels remain widespread across Southeast Asia. We estimate that they amounted to over $51 billion in 2012, after rising in recent years in line with higher international energy prices (see Chapter 1).
In the New Policies Scenario, we take into account policy commitments and plans that have already been implemented to align domestic energy prices towards market values as well as those that have been announced. We assume that all subsidies to oil and coal consumption are phased out within ten years at the latest, while those to natural gas and electricity decline steadily through to 2035 (at which time they are at very low levels). Subsidies are phased out at a much faster rate in the Efficient ASEAN Scenario. We assume all subsidies to oil and coal consumption are removed within five years at the latest and those to natural gas and electricity are completely removed by 2030.
The partial phase-out means that, in the New Policies Scenario, the projected cost of subsidies in 2035 is around $15 billion. This compares with overall spending of more than $100 billion in the case that the subsidisation rate does not change during the projection period. In the Efficient ASEAN Scenario, the overall value of subsidies plunges to $5 billion by 2018, more than $20 billion lower than in the New Policies Scenario; subsidies are completely removed by 2030. Compared with the New Policies Scenario, the Efficient ASEAN Scenario results in a cumulative reduction in spending on subsidies of over $260 billion, or 12% of the region’s current GDP.
© O
ECD
/IEA
, 201
3

106 World Energy Outlook | Special Report
Projected energy demand
Primary energy demand in the Efficient ASEAN Scenario is almost 15% lower in 2035 than in the New Policies Scenario, at around 870 million tonnes of oil equivalent (Mtoe) (Table 4.3). The amount of energy saved by 2035 exceeds the current energy demand of Thailand. Southeast Asia’s primary energy demand still increases over the projection period, but at 1.9% per year on average compared with 2.5% in the New Policies Scenario. The region’s energy intensity declines at an annual average rate of 2.5% (compared with 1.9% in the New Policies Scenario) and in 2035 its energy intensity is about 15% higher than today’s OECD value. Savings increase over the period, as a result of the different pace between the two scenarios in the implementation of energy efficiency measures and the deployment of more advanced equipment and appliances. A more rapid reduction of fossil-fuel subsidies provides an incentive to replace inefficient equipment and encourages industry and consumers to adopt more efficient energy practices.
Table 4.3 ⊳ Primary energy demand in the Efficient ASEAN Scenario
Primary Energy Demand
(Mtoe) Energy savings
versus NPS CAAGR
(%)
2011 2020 2035 2020 2035 2011-35
Coal 90 141 210 -9.7% -24.9% 3.6%
Oil 208 249 281 -2.1% -10.3% 1.3%
Gas 117 146 185 -3.3% -11.2% 1.9%
Nuclear 0 0 8 n.a. n.a. n.a.
Hydro 6 10 17 n.a. -5.3% 4.4%
Bioenergy 103 110 116 -0.7% -3.6% 0.5%
Other renewables 25 34 53 0.1% -7.3% 3.2%
Total 549 692 870 -3.7% -13.4% 1.9%
Notes: NPS= New Policies Scenario; CAAGR = compound average annual growth rate.
By 2035, demand for each of the primary energy fuels is lower than in the New Policies Scenario. The biggest savings are for coal, with demand cut by 25%, followed by natural gas (11% reduction) and oil at 10%. However, fossil fuels still make up over 75% of the energy mix in 2035 (80% in the New Policies Scenario). By 2020, the primary energy demand in the Efficient ASEAN Scenario is 4% lower than in the New Policies Scenario with most of savings coming from power generation and industry. This results from the earlier adoption of more efficient technologies and processes in the industrial sector, and lower electricity demand from the buildings sector which leads to a reduction in fuel inputs for power generation.
Energy savings by fuel
In the Efficient ASEAN Scenario, oil demand rises at an average rate of 1.3% per year compared with 1.7% in the New Policies Scenario. By 2035, it reaches 6.1 million barrels per day (mb/d), around 700 thousand barrels per day (kb/d) lower than in the New Policies Scenario (Figure 4.7). The difference in 2035 exceeds the current oil consumption of Malaysia.
© O
ECD
/IEA
, 201
3
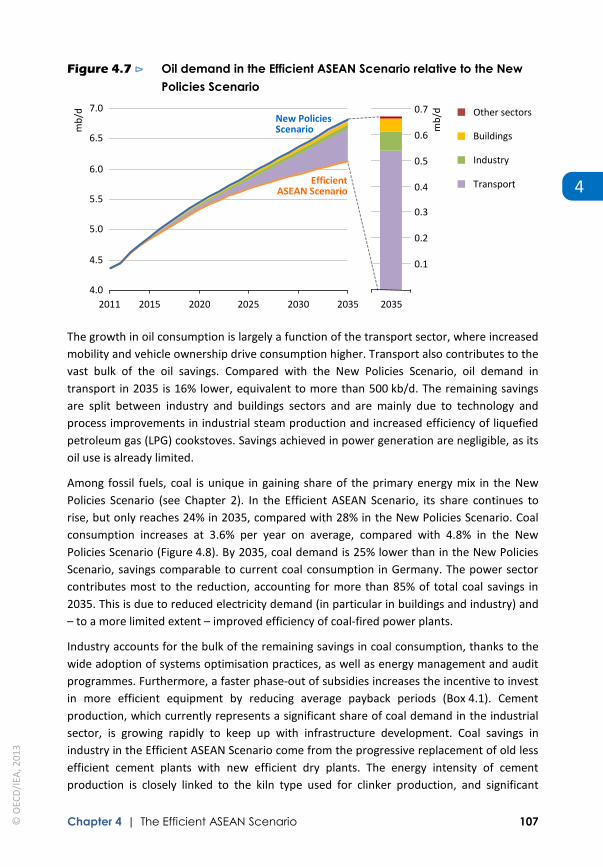
Chapter 4 | The Efficient ASEAN Scenario 107
4
Figure 4.7 ⊳ Oil demand in the Efficient ASEAN Scenario relative to the New Policies Scenario
The growth in oil consumption is largely a function of the transport sector, where increased mobility and vehicle ownership drive consumption higher. Transport also contributes to the vast bulk of the oil savings. Compared with the New Policies Scenario, oil demand in transport in 2035 is 16% lower, equivalent to more than 500 kb/d. The remaining savings are split between industry and buildings sectors and are mainly due to technology and process improvements in industrial steam production and increased efficiency of liquefied petroleum gas (LPG) cookstoves. Savings achieved in power generation are negligible, as its oil use is already limited.
Among fossil fuels, coal is unique in gaining share of the primary energy mix in the New Policies Scenario (see Chapter 2). In the Efficient ASEAN Scenario, its share continues to rise, but only reaches 24% in 2035, compared with 28% in the New Policies Scenario. Coal consumption increases at 3.6% per year on average, compared with 4.8% in the New Policies Scenario (Figure 4.8). By 2035, coal demand is 25% lower than in the New Policies Scenario, savings comparable to current coal consumption in Germany. The power sector contributes most to the reduction, accounting for more than 85% of total coal savings in 2035. This is due to reduced electricity demand (in particular in buildings and industry) and – to a more limited extent – improved efficiency of coal-fired power plants.
Industry accounts for the bulk of the remaining savings in coal consumption, thanks to the wide adoption of systems optimisation practices, as well as energy management and audit programmes. Furthermore, a faster phase-out of subsidies increases the incentive to invest in more efficient equipment by reducing average payback periods (Box 4.1). Cement production, which currently represents a significant share of coal demand in the industrial sector, is growing rapidly to keep up with infrastructure development. Coal savings in industry in the Efficient ASEAN Scenario come from the progressive replacement of old less efficient cement plants with new efficient dry plants. The energy intensity of cement production is closely linked to the kiln type used for clinker production, and significant
4.0
4.5
5.0
5.5
6.0
6.5
7.0
2011 2015 2020 2025 2030 2035
mb/
d Other sectors
Buildings
Industry
Transport
New Policies Scenario
Efficient ASEAN Scenario
0.1
0.2
0.3
0.4
0.5
0.6
0.7
2035
mb/
d
© O
ECD
/IEA
, 201
3

108 World Energy Outlook | Special Report
savings can be obtained by implementing heat recovery systems. Today’s most efficient cement kilns are five- to six-stage pre-heaters and pre-calciners plants, which are not commonly used in Southeast Asia.
Figure 4.8 ⊳ Coal demand in the Efficient ASEAN Scenario relative to the New Policies Scenario
In the Efficient ASEAN Scenario, natural gas demand increases at 1.9% per year, compared with 2.4% in the New Policies Scenario. This is because gas use in the power sector expands at a much slower rate due to lower electricity demand and as a consequence of a greater deployment of more efficient CCGTs. Consequently, gas consumption in the power sector declines by 9% by 2035. However, natural gas is the fastest growing fossil fuel in final energy consumption, rising on average at 3.9% per year (versus 4.6% in the New Policies Scenario). The share of natural gas in the primary energy mix remains flat at 21%.
Figure 4.9 ⊳ Savings in natural gas demand by sector in the Efficient ASEAN Scenario relative to the New Policies Scenario
5
10
15
20
25
30
2020 2025 2030 2035
bcm
Other sectors
Buildings
Transport
Power generation
Industry
100
150
200
250
300
350
400
2011 2015 2020 2025 2030 2035
Mtc
e
Industry
Power generation New Policies Scenario
Efficient ASEAN Scenario
© O
ECD
/IEA
, 201
3

Chapter 4 | The Efficient ASEAN Scenario 109
4
Southeast Asia’s gas demand is slightly more than 220 billion cubic metres (bcm) in 2035, or 6% less than in the New Policies Scenario (Figure 4.9). Industry accounts for almost half of the cumulative savings over the projection period, due to greater deployment of more efficient equipment and the renovation of dated technologies triggered by higher domestic gas prices.
Final electricity consumption in the Efficient ASEAN Scenario in 2035 is 15% lower than in the New Policies Scenario (Figure 4.10). Electricity demand increases on average 3.5% per year compared with 4.2% in the New Policies Scenario. By 2035, electricity consumption is almost 250 terawatt-hours (TWh) lower than in the New Policies Scenario, equivalent to the current combined consumption of Indonesia and the Philippines. The residential and services sub-sectors account for about 60% of the cumulative savings driven by the uptake of more energy-efficient equipment, a phase-out of incandescent light bulbs, implementation of more stringent codes for insulation in buildings and appliances, and an expansion of energy labelling, including for lighting and air conditioners. By 2035, about 40% of the reduction in demand for electricity comes from industry as a result of the adoption of high-efficiency electric motor systems and pumps.
Figure 4.10 ⊳ Savings in final electricity consumption by sector in the Efficient ASEAN Scenario relative to the New Policies Scenario
Energy savings by sector
End-use sectors
In the Efficient ASEAN Scenario, total final energy consumption increases from 399 Mtoe in 2011 to almost 620 Mtoe in 2035, or 11% lower than in the New Policies Scenario. Industry accounts for around 40% of the total savings, followed by transport and buildings (Figure 4.11). However, the reduction in primary energy demand of the power sector, of more than 75 Mtoe, is primarily due to reduced electricity demand in end-use sectors, especially buildings and industry. If the savings in the power sector were accounted for in
50
100
150
200
250
2020 2025 2030 2035
TWh
5%
10%
15%
20%
25% Services Residential
Industry
Savings (right axis):
As share of electricity consumption in New Policies Scenario
© O
ECD
/IEA
, 201
3
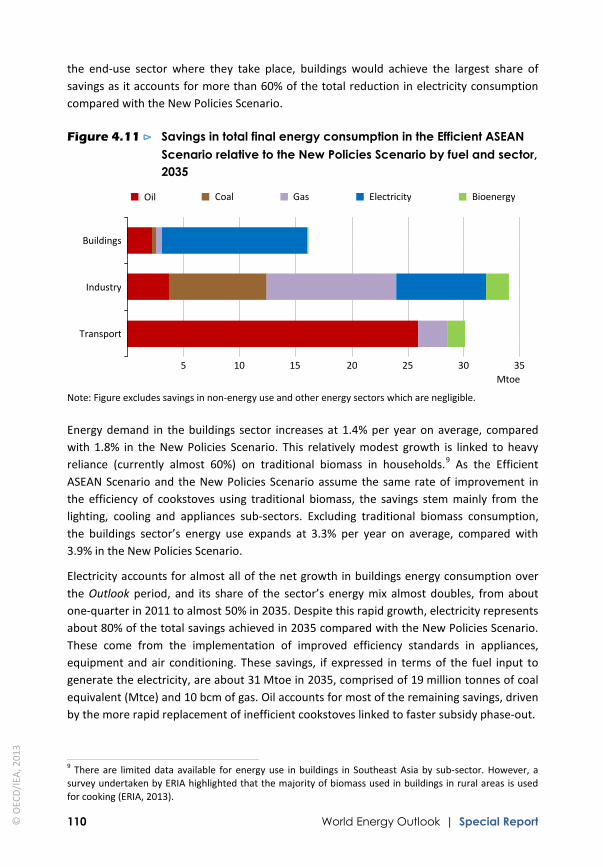
110 World Energy Outlook | Special Report
the end-use sector where they take place, buildings would achieve the largest share of savings as it accounts for more than 60% of the total reduction in electricity consumption compared with the New Policies Scenario.
Figure 4.11 ⊳ Savings in total final energy consumption in the Efficient ASEAN Scenario relative to the New Policies Scenario by fuel and sector, 2035
Note: Figure excludes savings in non-energy use and other energy sectors which are negligible.
Energy demand in the buildings sector increases at 1.4% per year on average, compared with 1.8% in the New Policies Scenario. This relatively modest growth is linked to heavy reliance (currently almost 60%) on traditional biomass in households.9 As the Efficient ASEAN Scenario and the New Policies Scenario assume the same rate of improvement in the efficiency of cookstoves using traditional biomass, the savings stem mainly from the lighting, cooling and appliances sub-sectors. Excluding traditional biomass consumption, the buildings sector’s energy use expands at 3.3% per year on average, compared with 3.9% in the New Policies Scenario.
Electricity accounts for almost all of the net growth in buildings energy consumption over the Outlook period, and its share of the sector’s energy mix almost doubles, from about one-quarter in 2011 to almost 50% in 2035. Despite this rapid growth, electricity represents about 80% of the total savings achieved in 2035 compared with the New Policies Scenario. These come from the implementation of improved efficiency standards in appliances, equipment and air conditioning. These savings, if expressed in terms of the fuel input to generate the electricity, are about 31 Mtoe in 2035, comprised of 19 million tonnes of coal equivalent (Mtce) and 10 bcm of gas. Oil accounts for most of the remaining savings, driven by the more rapid replacement of inefficient cookstoves linked to faster subsidy phase-out.
9 There are limited data available for energy use in buildings in Southeast Asia by sub-sector. However, a survey undertaken by ERIA highlighted that the majority of biomass used in buildings in rural areas is used for cooking (ERIA, 2013).
5 10 15 20 25 30 35
Buildings
Industry
Transport
Mtoe
Oil Coal Gas Electricity Bioenergy
© O
ECD
/IEA
, 201
3

Chapter 4 | The Efficient ASEAN Scenario 111
4
Transport energy demand growth averages 1.9% per year, compared with 2.7% in the New Policies Scenario. In the first part of the projection period, transport demand grows at a similar pace to the New Policies Scenario, then growth moderates because of more rapid phase out of subsidies in the Efficient ASEAN Scenario and more stringent fuel-economy standards have time to impact the efficiency of the vehicle stock. Between 2020 and 2035, transport energy demand grows at 1.3% per year on average compared with 2.3% in the New Policies Scenario. The key assumption in the Efficient ASEAN Scenario is deployment of progressively more efficient vehicles as a consequence of mandatory fuel-economy standards, labelling and incentives. It does not assume the more widespread promotion of alternative fuels or more rapid modal shift to less energy-intensive transport modes, such as mass rapid systems or improvements in urban design and planning (see Spotlight).
Transport energy demand is 16% lower in the Efficient ASEAN Scenario in 2035 than in the New Policies Scenario. The road sector accounts for almost all of the savings in transport. In 2035, oil demand in transport reaches 2.9 mb/d, more than 500 kb/d lower than in the New Policies Scenario, with PLDVs and road freight accounting for more than 90% of the savings (Figure 4.12).10 The average on-road fuel economy of PLDVs reaches 6 l/100km in 2035 (close to the current average level in Japan) compared with 7.6 l/100km in the New Policies Scenario and 9 l/100 km in 2011. Oil savings in domestic aviation and navigation are negligible because of much more limited energy consumption and on the assumption that a significant share of their potential is already implemented in the New Policies Scenario. The use of other fuels (natural gas and biofuels) is reduced almost proportionately to the diminished energy consumption of the sector as no additional measures are implemented in the Efficient ASEAN Scenario.
Figure 4.12 ⊳ Oil savings in road transport in the Efficient ASEAN Scenario relative to the New Policies Scenario
10 Road freight includes light commercial vehicles, medium freight traffic and trucks. The remaining part of savings comes from increased efficiency from buses and – to a lower extent – from two- and three-wheelers.
-600
-500
-400
-300
-200
-100
2011 2015 2020 2025 2030 2035
kb/d
Road freight
Other
Passenger light- duty vehicles
© O
ECD
/IEA
, 201
3

112 World Energy Outlook | Special Report
The importance of well-developed urban planning during rapid urbanisation
Most ASEAN countries are experiencing rapid urbanisation. The growth of cities such as, Bangkok, Jakarta, Manila and Ho Chi Minh City is putting strains on infrastructure and services. Urban areas need electricity, roads, railways, ports and airports to support economic growth. People need water and sanitation, education and healthcare facilities to reduce poverty and increase productivity (DBS, 2011). Urbanisation and growth in incomes will have a large impact on energy demand, increasing the importance of early adoption of energy efficiency measures.
Smart urban planning can help capture the available efficiency gains. One priority is to develop efficient transport systems. Worsening traffic congestion, more vehicles and under-developed public transport are serious problems in some ASEAN cities, contributing to poor air quality, which is responsible for thousands of premature deaths each year (WHO, 2011). A study in 2009 estimated that the average vehicle speed in Jakarta fell from 38 km/hour in 1995 to 17 km/hour in 2007 due to congestion, with fuel waste amounting to about one-third of overall consumption (MTME, 2009).
Minimising distances between housing and work places, providing efficient transport options (such as mass transit networks) and smart traffic systems can minimise energy use in a cost-effective manner. For example, it is estimated that a shift from private vehicles to mass transit systems could reduce fuel consumption by over half a million litres of oil products per day in Jakarta, while significantly reducing air pollution (BUMN, 2013). In Bangkok, the number of motor vehicles registered soared from 0.6 million in 1980 to 7.5 million in 2012, choking its transport networks. According to the Ministry of Transport of Thailand, the expansion of rapid transit systems and better management of traffic congestion could cut 5.5 Mt of CO2 emissions per year (BMA, 2007).
Southeast Asia has opportunities to make significant gains by taking steps to develop compact, energy-efficient, safe and liveable cities, where people rely more on public transport than individual cars and have energy-efficient buildings. Moreover, city planning needs to take account of potential impacts of climate change and extreme weather events.11 Flooding risks in the region are exacerbated by subsidence from groundwater extraction: subsidence in Bangkok has been measured at 4 centimetres (cm) per year and in parts of Jakarta at 6 cm per year (ADB, 2011). Floods in Thailand in 2011 caused the deaths of more than 600 people; damages estimated at 13% of GDP (World Bank, 2010); and contributed to a major slowdown in economic growth. Addressing these risks represents a key challenge for policy makers in Southeast Asia.
11 The impact of climate change is expected to be stronger in urban areas with annual maximum temperatures in cities increasing much faster than the global average. This would have significant implications for average cooling demand and peak electricity load in Southeast Asia’s cities (IEA, 2013).
S P O T L I G H T
© O
ECD
/IEA
, 201
3
Chapter 4 | The Efficient ASEAN Scenario 113
4
In the Efficient ASEAN Scenario, energy demand in the industry sector increases by 62% between 2011 and 2035, compared with a rise of 91% in the New Policies Scenario. The difference, exceeding 30 Mtoe, is equal to the current industrial energy demand of the Philippines and Thailand combined. Energy consumption grows in all industry sub-sectors as intensity improvements achieved are more than offset by faster growth in production. Industry energy intensity declines on average at 2.4% per year, compared with 1.7% per year in the New Policies Scenario. This represents a significant improvement on the last three decades, during which it increased at an annual pace of 0.2%. Mandatory energy management programmes for large energy users, together with the optimisation of industrial processes and the phase-out of energy subsidies, significantly slows growth in industrial energy demand. Energy intensity in the region’s industrial sector approaches today’s value of the OECD by the end of projection period.
Cumulative savings achieved in industry come from reduced gas consumption (30% of the total), followed by lower use of coal and electricity (about 25% each). More than 70% of current industrial energy consumption is categorised as “other industries”, including non-energy intensive activities (such as food and tobacco, machinery, textiles, clothing and timber). This share is not expected to change significantly over the Outlook period in the Efficient ASEAN Scenario. The expected demand growth stems from rising production in energy-intensive industries, such as steel, cement and chemicals, is largely offset by efficiency improvements, equipment upgrading and implementation of high-efficiency systems in other industrial activities.
Savings in the power sector
In the Efficient ASEAN Scenario, gross electricity generation more than doubles over the Outlook period, but is about 300 TWh lower than in the New Policies Scenario in 2035 (equivalent to the current total electricity production of Italy). This significantly reduces the need for generation capacity, which is 13% (or almost 60 gigawatts [GW]) lower at the end of the projection period. Even though coal-fired capacity more than triples, it represents almost 70% (40 GW) of the total reduction in the region’s generation capacity compared with the New Policies Scenario. The Efficient ASEAN Scenario therefore avoids construction of coal-fired capacity equivalent to the current total installed capacity of Thailand. At the end of the projection period, installed gas-fired capacity expands by more than 80%, but is 8% (about 12 GW) lower than in the New Policies Scenario.
The average efficiency of fossil-fuelled generation improves significantly in the Efficient ASEAN Scenario, by two-and-a-half percentage points. This is mainly because the share of coal-fired generation reaches 42% in 2035, compared with 49% in the New Policies Scenario. The average efficiency of coal-fired generation is two percentage points higher in 2035 than in the New Policies Scenario and gas-fired generation is nearly two-and-a-half percentage points higher (Figure 4.13). For coal, this is the result of a more pronounced shift away from plants using subcritical technology. A higher share of CCGT plants is the basis for improvements in gas-fired efficiency.
© O
ECD
/IEA
, 201
3
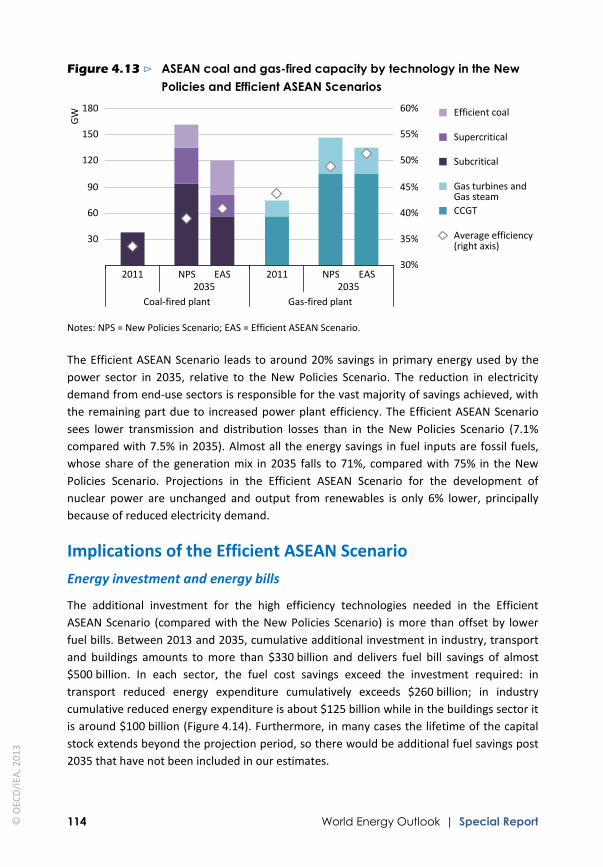
114 World Energy Outlook | Special Report
Figure 4.13 ⊳ ASEAN coal and gas-fired capacity by technology in the New Policies and Efficient ASEAN Scenarios
Notes: NPS = New Policies Scenario; EAS = Efficient ASEAN Scenario.
The Efficient ASEAN Scenario leads to around 20% savings in primary energy used by the power sector in 2035, relative to the New Policies Scenario. The reduction in electricity demand from end-use sectors is responsible for the vast majority of savings achieved, with the remaining part due to increased power plant efficiency. The Efficient ASEAN Scenario sees lower transmission and distribution losses than in the New Policies Scenario (7.1% compared with 7.5% in 2035). Almost all the energy savings in fuel inputs are fossil fuels, whose share of the generation mix in 2035 falls to 71%, compared with 75% in the New Policies Scenario. Projections in the Efficient ASEAN Scenario for the development of nuclear power are unchanged and output from renewables is only 6% lower, principally because of reduced electricity demand.
Implications of the Efficient ASEAN Scenario Energy investment and energy bills
The additional investment for the high efficiency technologies needed in the Efficient ASEAN Scenario (compared with the New Policies Scenario) is more than offset by lower fuel bills. Between 2013 and 2035, cumulative additional investment in industry, transport and buildings amounts to more than $330 billion and delivers fuel bill savings of almost $500 billion. In each sector, the fuel cost savings exceed the investment required: in transport reduced energy expenditure cumulatively exceeds $260 billion; in industry cumulative reduced energy expenditure is about $125 billion while in the buildings sector it is around $100 billion (Figure 4.14). Furthermore, in many cases the lifetime of the capital stock extends beyond the projection period, so there would be additional fuel savings post 2035 that have not been included in our estimates.
2011 NPS EAS 2011 NPS EAS 30%
35%
40%
45%
50%
55%
60% Efficient coal
Supercritical
Subcritical
Gas turbines and Gas steam CCGT
Average efficiency (right axis)
2035 2035 Coal-fired plant Gas-fired plant
30
60
90
120
150
180
GW
© O
ECD
/IEA
, 201
3

Chapter 4 | The Efficient ASEAN Scenario 115
4
Figure 4.14 ⊳ Additional investment in energy efficiency compared with fuel savings in the Efficient ASEAN Scenario, 2013-2035
In the power sector, the shift towards more efficient plants increases their average unit costs, but lower electricity demand contributes to a reduction in the amount of new capacity required of about 60 GW. Between 2013 and 2035, the net savings in the power generation segment reaches almost $70 billion. Spending on transmission and distribution networks is higher by over $120 billion because of measures taken to reduce losses and moderate electricity demand growth.
In the Efficient ASEAN Scenario, the slower growth in energy demand leads to an improvement in the region’s energy trade balance. By 2035, net oil imports reach 4.4 mb/d, or almost 0.7 mb/d lower than in the New Policies Scenario; gas and coal net exports, at 42 bcm and about 320 Mtce, are increased by almost 30 bcm and 100 Mtce. As a result, the region’s spending on net imports of fossil fuels in 2035 is reduced by $60 billion compared with the New Policies Scenario: oil-import bills are cut by $31 billion while it sees higher revenues from exports of coal (by $11 billion) and natural gas (by $18 billion) (Figure 4.15).
The Efficient ASEAN Scenario considers the region as a whole but this should not disguise the fact that there are large differences among the countries and, consequently, a different level in the way that each would benefit from the exploitation of its economically viable energy efficiency potential. However, in both scenarios presented, Southeast Asia increases its reliance on oil imports and remains a net-exporter of natural gas and coal. But the extent to which the region needs to expand its oil imports and is able to remain a net coal and gas exporter differs significantly.12 For example, in the New Policies Scenario, Southeast Asia’s net exports of natural gas decline by more than 70% over the Outlook period, to 14 bcm in 2035. In the Efficient ASEAN Scenario, volumes of gas available for export in 2035 triples (42 bcm), thanks to the more modest increase in domestic demand.
12 In the Efficient ASEAN Scenario, we assume that the domestic fossil fuel production is the same as in the New Policies Scenario. Increasing oil import needs will sustain the exploitation of domestic resources, while coal and natural gas production are expected to be affected marginally by the reduced growth of domestic energy demand, as exports are directed predominantly outside the ASEAN region.
50
100
150
200
250
300
Transport Buildings Industry
Billi
on d
olla
rs (2
012)
Investment
Fuel savings
© O
ECD
/IEA
, 201
3
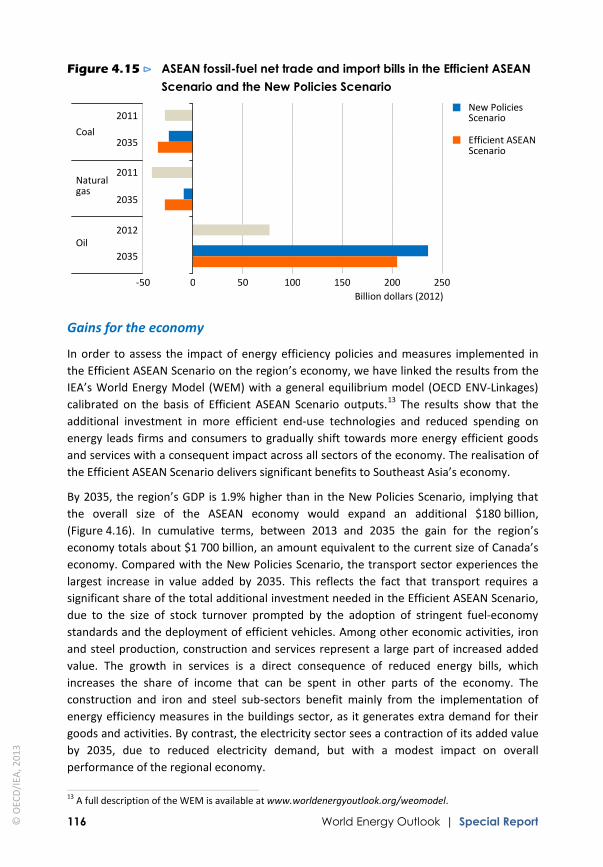
116 World Energy Outlook | Special Report
Figure 4.15 ⊳ ASEAN fossil-fuel net trade and import bills in the Efficient ASEAN Scenario and the New Policies Scenario
Gains for the economy
In order to assess the impact of energy efficiency policies and measures implemented in the Efficient ASEAN Scenario on the region’s economy, we have linked the results from the IEA’s World Energy Model (WEM) with a general equilibrium model (OECD ENV-Linkages) calibrated on the basis of Efficient ASEAN Scenario outputs.13 The results show that the additional investment in more efficient end-use technologies and reduced spending on energy leads firms and consumers to gradually shift towards more energy efficient goods and services with a consequent impact across all sectors of the economy. The realisation of the Efficient ASEAN Scenario delivers significant benefits to Southeast Asia’s economy.
By 2035, the region’s GDP is 1.9% higher than in the New Policies Scenario, implying that the overall size of the ASEAN economy would expand an additional $180 billion, (Figure 4.16). In cumulative terms, between 2013 and 2035 the gain for the region’s economy totals about $1 700 billion, an amount equivalent to the current size of Canada’s economy. Compared with the New Policies Scenario, the transport sector experiences the largest increase in value added by 2035. This reflects the fact that transport requires a significant share of the total additional investment needed in the Efficient ASEAN Scenario, due to the size of stock turnover prompted by the adoption of stringent fuel-economy standards and the deployment of efficient vehicles. Among other economic activities, iron and steel production, construction and services represent a large part of increased added value. The growth in services is a direct consequence of reduced energy bills, which increases the share of income that can be spent in other parts of the economy. The construction and iron and steel sub-sectors benefit mainly from the implementation of energy efficiency measures in the buildings sector, as it generates extra demand for their goods and activities. By contrast, the electricity sector sees a contraction of its added value by 2035, due to reduced electricity demand, but with a modest impact on overall performance of the regional economy.
13 A full description of the WEM is available at www.worldenergyoutlook.org/weomodel.
-50 0 50 100 150 200 250 Billion dollars (2012)
New Policies Scenario 2011
2035
2011
2035
2012
2035 Oil
Natural gas
Coal Efficient ASEAN Scenario
© O
ECD
/IEA
, 201
3

Chapter 4 | The Efficient ASEAN Scenario 117
4
Figure 4.16 ⊳ Change in real ASEAN GDP in the Efficient ASEAN Scenario relative to the New Policies Scenario
Note: GDP is in year-2012 dollars expressed in real purchasing power parity terms.
Gains for the environment
In the Efficient ASEAN Scenario, energy-related CO2 emissions in Southeast Asia increase at 2% on average per year compared with 2.8% per year in the New Policies Scenario. By 2035, the region’s energy-related CO2 emissions are 19%, or more than 400 million tonnes (Mt), lower than in the New Policies Scenario. Savings are fairly equally split between end-use sectors and power generation (Table 4.4).
Table 4.4 ⊳ Energy-related CO2 emissions in the Efficient ASEAN Scenario by sector versus the New Policies Scenario (Mt)
Efficient ASEAN Scenario
Change versus New Policies Scenario
2005 2012 2020 2035 2020 2035
Power generation 291 438 561 776 -9.3% -25.1%
Buildings 56 53 62 75 -3.7% -9.6%
Industry 206 268 341 407 -4.7% -15.1%
Transport 225 300 360 429 -2.7% -16.3%
Total 915 1 219 1 496 1 860 -5.5% -18.6%
Two-thirds of the total emissions savings come from reduced use of coal, with power generation accounting for about 90%. This reflects the predominance of coal in electricity generation and its limited use in the end-use sectors. This trend highlights the environmental benefits associated with the Efficient ASEAN Scenario, not only in terms of greenhouse-gas emissions but also for reducing air pollution. According to the World Health Organization, the largest contributors to urban outdoor air pollution include coal-fired power plants, burning of biomass and coal for cooking and heating, vehicle transport and other industries. There is no comprehensive picture of air quality in Southeast Asia.
40
80
120
160
200
2015 2020 2025 2030 2035
Billi
on d
olla
rs (2
012)
0.5%
1.0%
1.5%
2.0%
2.5% Change in GDP
Percentage change in GDP (right axis)
© O
ECD
/IEA
, 201
3
118 World Energy Outlook | Special Report
Nonetheless, some of the largest metropolitan areas appear to have experienced a serious decline in air quality in recent years, mostly because of increasing rates of vehicle ownership, higher manufacturing concentrations in inner city areas together with the use of low-quality coal and wood in cooking/heating stoves. The realisation of the Efficient ASEAN Scenario would bring a sustained reduction in sulphur dioxide emissions compared with the New Policies Scenario. Similarly, higher standards of fuel efficiency in transport would help reduce levels of particulate matters and nitrogen oxide emissions, which are the primary cause of air pollution in metropolitan areas.
Unlocking energy efficiency potential
The results presented in this chapter demonstrate the scale of valuable benefits associated with exploiting economically viable energy efficiency potential in Southeast Asia. Given the projected rise in energy demand and the growing burden on indigenous supply resources, energy savings can be a very important and cost-effective source of additional energy “supply” for the region and also deliver substantial economic gains. There is no single measure that would trigger wide-scale adoption of energy efficiency measures and policies throughout the region. Barriers to implementation differ widely. However, based on a review of its current status in Southeast Asia, unlocking energy efficiency’s potential rests on addressing challenges in several key areas:
Enhance national policy co-ordination and regulatory frameworks. Closer co-operation among competent authorities should be enhanced in order to maximise energy savings across all sectors. Governments need to adopt realistic and measureable targets, implement effective mandatory and voluntary policies and standards, and ensure stricter compliance with measures in place, including:
Industry: strengthen expertise and training for energy audits and energy management; encourage the use of best available energy practices and technologies.
Transport: establish mandatory fuel-economy standards and labelling initiatives; introduce financial (tax) incentives to encourage the purchase of energy-efficient vehicles.
Buildings sector: implement progressively more stringent building energy codes and mandatory energy performance standards for all energy-consuming products, and strengthen compliance and enforcement mechanisms.
Power sector: encourage the deployment of high efficiency coal-fired generation technologies (supercritical, ultra-supercritical and integrated gasification combined-cycle (IGCC) plants); support efficient electricity networks in order to optimise power flows and reduce transmission and distribution losses.
Eliminate market distortions. Artificially low energy prices remain common place in several Southeast Asian countries. These undervalue energy efficiency returns and discourage consumers and industry to invest in energy-efficient practices and equipment.
© O
ECD
/IEA
, 201
3

Chapter 4 | The Efficient ASEAN Scenario 119
4
Promote energy efficiency awareness and visibility. Governments should encourage better knowledge of energy efficiency dynamics and make the cost-saving benefits of new practices and efficient technologies more visible in the public and private sectors.
Encourage the financing of energy efficiency projects. Many financial institutions throughout the region are reluctant to support energy efficiency projects because of a lack of relevant experience and technical expertise as well as scepticism about potential returns. Governments will need to take a more active role in developing energy efficiency markets beyond their infancy. Adopting well-designed financial instruments (such as co-financing schemes, loans, national grants and special funds) as well as supporting the development of ESCO activities could provide a decisive boost in creating functional energy efficiency markets.
Improve capacity building and data collection. Energy efficiency is relatively new on the agenda in Southeast Asia. Institutions and industries are still developing expertise in implementing best practices and building capacity in energy management. Moreover, to assess its potential and make it visible to the market, energy efficiency needs to be measurable. To this end, most countries in the region should expand their energy data collecting and analysis capacity, and present energy data at a more disaggregated level, in line with evolving international practices.
Monitor and evaluate the effectiveness of energy efficiency policies. The introduction of energy efficiency policies does not alone ensure the achievement of objectives or targets. Governments need to develop procedures and tools, including the use of energy efficiency indicators, to monitor effects of policies introduced and implement adjustments when needed.
© O
ECD
/IEA
, 201
3

© O
ECD
/IEA
, 201
3
Annex A | Tables for scenario projections 121
Annex A
Tables for scenario projections
General note to the tables
The tables detail projections for energy demand, gross electricity generation and electrical capacity, and carbon-dioxide (CO2) emissions from fuel combustion in ASEAN member countries, which include Brunei Darussalam, Cambodia, Indonesia, Lao PDR, Malaysia, Myanmar, the Philippines, Singapore, Thailand and Vietnam. The tables present historical and projected data for the New Policies and Efficient ASEAN Scenarios.
Data for energy demand, gross electricity generation and CO2 emissions from fuel combustion up to 2011 are based on IEA statistics, published in Energy Balances of non-OECD Countries and CO2 Emissions from Fuel Combustion. Historical data for electrical capacity is supplemented from the Platts World Electric Power Plants Database (December 2012 version).
Both in the text of this book and in the tables, rounding may lead to minor differences between totals and the sum of their individual components. Growth rates are calculated on a compound average annual basis and are marked “n.a.” when the base year is zero or the value exceeds 200%. Nil values are marked “-”.
Definitional note to the tables
Total primary energy demand (TPED) is equivalent to power generation plus other energy sector excluding electricity and heat, plus total final consumption (TFC) excluding electricity and heat. TPED does not include ambient heat from heat pumps or electricity trade. Sectors comprising TFC include industry, transport, buildings (residential, services and non-specified other) and other (agriculture and non-energy use). Projected electrical capacity is the net result of existing capacity plus additions less retirements. Total CO2 includes emissions from other energy sector in addition to the power generation and TFC sectors shown in the tables. CO2 emissions and energy demand from international marine and aviation bunkers are included only at the world transport level. CO2 emissions do not include emissions from industrial waste and non-renewable municipal waste.
© O
ECD
/IEA
, 201
3
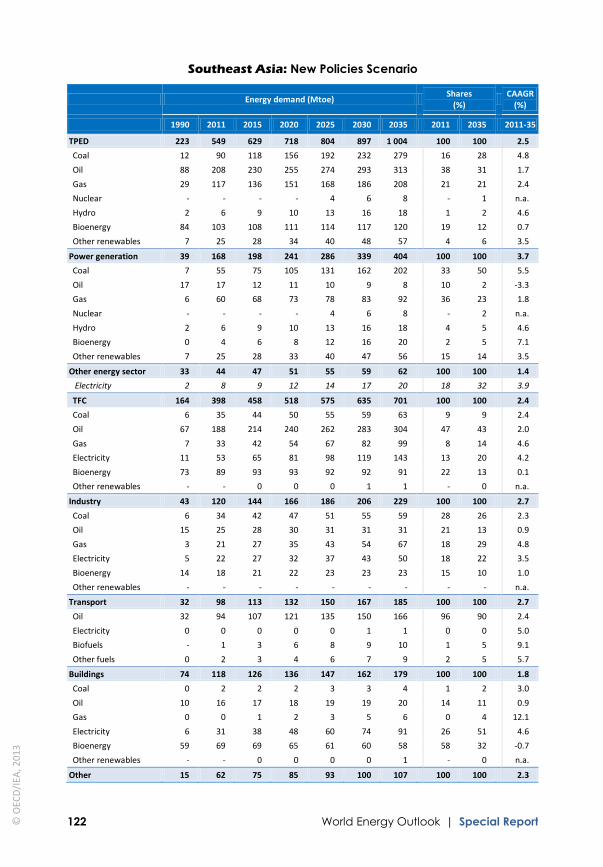
122 World Energy Outlook | Special Report
Southeast Asia: New Policies Scenario
Energy demand (Mtoe) Shares
(%)
CAAGR (%)
1990 2011 2015 2020 2025 2030 2035 2011 2035 2011-35
TPED 223 549 629 718 804 897 1 004 100 100 2.5
Coal 12 90 118 156 192 232 279 16 28 4.8
Oil 88 208 230 255 274 293 313 38 31 1.7
Gas 29 117 136 151 168 186 208 21 21 2.4
Nuclear - - - - 4 6 8 - 1 n.a.
Hydro 2 6 9 10 13 16 18 1 2 4.6
Bioenergy 84 103 108 111 114 117 120 19 12 0.7
Other renewables 7 25 28 34 40 48 57 4 6 3.5
Power generation 39 168 198 241 286 339 404 100 100 3.7
Coal 7 55 75 105 131 162 202 33 50 5.5
Oil 17 17 12 11 10 9 8 10 2 -3.3
Gas 6 60 68 73 78 83 92 36 23 1.8
Nuclear - - - - 4 6 8 - 2 n.a.
Hydro 2 6 9 10 13 16 18 4 5 4.6
Bioenergy 0 4 6 8 12 16 20 2 5 7.1
Other renewables 7 25 28 33 40 47 56 15 14 3.5
Other energy sector 33 44 47 51 55 59 62 100 100 1.4
Electricity 2 8 9 12 14 17 20 18 32 3.9
TFC 164 398 458 518 575 635 701 100 100 2.4
Coal 6 35 44 50 55 59 63 9 9 2.4
Oil 67 188 214 240 262 283 304 47 43 2.0
Gas 7 33 42 54 67 82 99 8 14 4.6
Electricity 11 53 65 81 98 119 143 13 20 4.2
Bioenergy 73 89 93 93 92 92 91 22 13 0.1
Other renewables - - 0 0 0 1 1 - 0 n.a.
Industry 43 120 144 166 186 206 229 100 100 2.7
Coal 6 34 42 47 51 55 59 28 26 2.3
Oil 15 25 28 30 31 31 31 21 13 0.9
Gas 3 21 27 35 43 54 67 18 29 4.8
Electricity 5 22 27 32 37 43 50 18 22 3.5
Bioenergy 14 18 21 22 23 23 23 15 10 1.0
Other renewables - - - - - - - - - n.a.
Transport 32 98 113 132 150 167 185 100 100 2.7
Oil 32 94 107 121 135 150 166 96 90 2.4
Electricity 0 0 0 0 0 1 1 0 0 5.0
Biofuels - 1 3 6 8 9 10 1 5 9.1
Other fuels 0 2 3 4 6 7 9 2 5 5.7
Buildings 74 118 126 136 147 162 179 100 100 1.8
Coal 0 2 2 2 3 3 4 1 2 3.0
Oil 10 16 17 18 19 19 20 14 11 0.9
Gas 0 0 1 2 3 5 6 0 4 12.1
Electricity 6 31 38 48 60 74 91 26 51 4.6
Bioenergy 59 69 69 65 61 60 58 58 32 -0.7
Other renewables - - 0 0 0 0 1 - 0 n.a.
Other 15 62 75 85 93 100 107 100 100 2.3
© O
ECD
/IEA
, 201
3

Annex A | Tables for scenario projections 123
A
Southeast Asia: Efficient ASEAN Scenario
Energy demand (Mtoe) Shares
(%)
CAAGR (%)
2020 2025 2030 2035 2035 2011-35
TPED 692 753 807 870 100 1.9
Coal 141 163 184 210 24 3.6
Oil 249 263 272 281 32 1.3
Gas 146 158 169 185 21 1.9
Nuclear - 4 6 8 1 n.a.
Hydro 10 13 15 17 2 4.4
Bioenergy 110 112 114 116 13 0.5
Other renewables 34 40 46 53 6 3.2
Power generation 225 256 288 329 100 2.8
Coal 92 106 121 141 43 4.0
Oil 11 9 8 7 2 -3.5
Gas 70 73 76 83 25 1.3
Nuclear - 4 6 8 2 n.a.
Hydro 10 13 15 17 5 4.4
Bioenergy 8 11 15 19 6 6.9
Other renewables 33 40 46 52 16 3.1
Other energy sector 50 53 57 58 100 1.2
Electricity 11 12 14 16 27 3.0
TFC 503 544 580 621 100 1.9
Coal 48 50 52 54 9 1.8
Oil 235 252 263 273 44 1.6
Gas 52 62 73 85 14 3.9
Electricity 76 89 103 122 20 3.5
Bioenergy 92 90 89 87 14 -0.1
Other renewables 0 0 1 1 0 n.a.
Industry 158 170 180 195 100 2.0
Coal 45 47 48 50 26 1.7
Oil 29 28 27 27 14 0.3
Gas 33 39 46 55 28 4.0
Electricity 30 34 37 42 21 2.7
Bioenergy 22 22 21 21 11 0.6
Other renewables - - - - - n.a.
Transport 128 142 149 155 100 1.9
Oil 118 129 135 140 90 1.6
Electricity 0 0 1 1 0 4.9
Biofuels 5 7 8 8 5 8.3
Other fuels 4 5 6 6 4 4.1
Buildings 132 139 150 163 100 1.4
Coal 2 3 3 3 2 2.7
Oil 18 18 18 18 11 0.4
Gas 2 3 4 6 4 11.7
Electricity 45 54 65 78 48 3.9
Bioenergy 65 61 60 57 35 -0.8
Other renewables 0 0 0 1 0 n.a.
Other 85 93 100 108 100 2.3
© O
ECD
/IEA
, 201
3

124 World Energy Outlook | Special Report
Southeast Asia: New Policies Scenario
Electricity generation (TWh) Shares
(%)
CAAGR (%)
1990 2011 2015 2020 2025 2030 2035 2011 2035 2011-35
Total generation 154 696 852 1 063 1 295 1 560 1 879 100 100 4.2
Coal 28 217 304 439 564 719 914 31 49 6.2
Oil 66 72 51 47 42 37 34 10 2 -3.1
Gas 26 307 356 394 434 473 523 44 28 2.2
Nuclear - - - - 14 23 31 - 2 n.a.
Hydro 27 73 100 122 151 184 214 10 11 4.6
Bioenergy 1 8 14 23 33 47 63 1 3 9.2
Other renewables 7 20 27 39 56 76 101 3 5 7.1
Electrical capacity (GW) Shares
(%)
CAAGR (%)
2011 2015 2020 2025 2030 2035 2011 2035 2011-35
Total capacity 176 218 264 320 384 459 100 100 4.1
Coal 38 59 80 102 129 161 22 35 6.2
Oil 24 24 23 21 19 18 14 4 -1.4
Gas 74 85 96 111 127 147 42 32 2.9
Nuclear - - - 2 3 4 - 1 n.a.
Hydro 31 37 45 55 67 77 18 17 3.9
Bioenergy 6 7 8 10 12 14 3 3 3.9
Other renewables 3 6 12 19 27 38 2 8 10.6
CO2 emissions (Mt) Shares
(%)
CAAGR (%)
1990 2011 2015 2020 2025 2030 2035 2011 2035 2011-35
Total CO2 368 1 166 1 354 1 583 1 785 2 012 2 284 100 100 2.8
Coal 53 360 470 611 731 871 1 044 31 46 4.5
Oil 261 541 577 632 678 724 772 46 34 1.5
Gas 54 265 307 341 377 417 468 23 20 2.4
Power generation 96 414 494 619 728 862 1 036 100 100 3.9
Coal 28 219 296 414 516 640 797 53 77 5.5
Oil 53 54 38 35 31 27 24 13 2 -3.3
Gas 14 141 160 170 182 195 215 34 21 1.8
TFC 229 676 779 886 983 1 080 1 185 100 100 2.4
Coal 25 141 173 197 215 231 247 21 21 2.4
Oil 191 464 516 574 624 673 724 69 61 1.9
Transport 97 280 317 360 402 446 492 41 42 2.4
Gas 14 71 89 115 143 176 214 11 18 4.7
© O
ECD
/IEA
, 201
3

Annex A | Tables for scenario projections 125
A
Southeast Asia: Efficient ASEAN Scenario
Electricity generation (TWh) Shares
(%)
CAAGR (%)
2020 2025 2030 2035 2035 2011-35
Total generation 994 1 164 1 350 1 589 100 3.5
Coal 383 459 551 671 42 4.8
Oil 47 40 35 32 2 -3.4
Gas 380 414 446 498 31 2.0
Nuclear - 14 23 31 2 n.a.
Hydro 122 148 176 203 13 4.4
Bioenergy 23 33 47 61 4 9.0
Other renewables 39 55 72 93 6 6.7
Electrical capacity (GW) Shares
(%)
CAAGR (%)
2020 2025 2030 2035 2035 2011-35
Total capacity 254 294 341 399 100 3.5
Coal 74 85 102 121 30 4.9
Oil 23 21 18 17 4 -1.5
Gas 93 103 115 135 34 2.5
Nuclear - 2 3 4 1 n.a.
Hydro 45 54 64 73 18 3.7
Bioenergy 8 10 12 13 3 3.7
Other renewables 12 18 26 36 9 10.4
CO2 emissions (Mt) Shares
(%)
CAAGR (%)
2020 2025 2030 2035 2035 2011-35
Total CO2 1 496 1 616 1 723 1 860 100 2.0
Coal 551 616 682 770 41 3.2
Oil 616 646 662 676 36 0.9
Gas 329 354 378 414 22 1.9
Power generation 561 619 683 776 100 2.7
Coal 363 418 479 559 72 4.0
Oil 35 30 26 23 3 -3.5
Gas 164 171 178 194 25 1.3
TFC 857 922 969 1 020 100 1.7
Coal 188 197 203 211 21 1.7
Oil 559 593 612 629 62 1.3
Transport 350 381 400 415 41 1.6
Gas 109 132 154 180 18 4.0
© O
ECD
/IEA
, 201
3

© O
ECD
/IEA
, 201
3

Annex B | Units and conversion factors 127
Annex B
Units and conversion factors
This annex provides general information on units, and conversion factors for energy and currency.
Units
Coal Mtce million tonnes of coal equivalent
Emissions ppm parts per million (by volume)
Gt CO2-eq gigatonnes of carbon-dioxide equivalent (using 100-year global warming potentials for different greenhouse gases)
kg CO2-eq kilogrammes of carbon-dioxide equivalent
g CO2/km grammes of carbon dioxide per kilometre
g CO2/kWh grammes of carbon dioxide per kilowatt-hour
Energy Mtoe million tonnes of oil equivalent
MBtu million British thermal units
Gcal gigacalorie (1 calorie x 109)
TJ terajoule (1 joule x 1012)
kWh kilowatt-hour
MWh megawatt-hour
GWh gigawatt-hour
TWh terawatt-hour
Gas mcm million cubic metres
bcm billion cubic metres
tcm trillion cubic metres
Mass kg kilogramme (1 000 kg = 1 tonne)
kt kilotonnes (1 tonne x 103)
Mt million tonnes (1 tonne x 106)
Gt gigatonnes (1 tonne x 109)
Monetary $ million 1 US dollar x 106
$ billion 1 US dollar x 109
$ trillion 1 US dollar x 1012
© O
ECD
/IEA
, 201
3
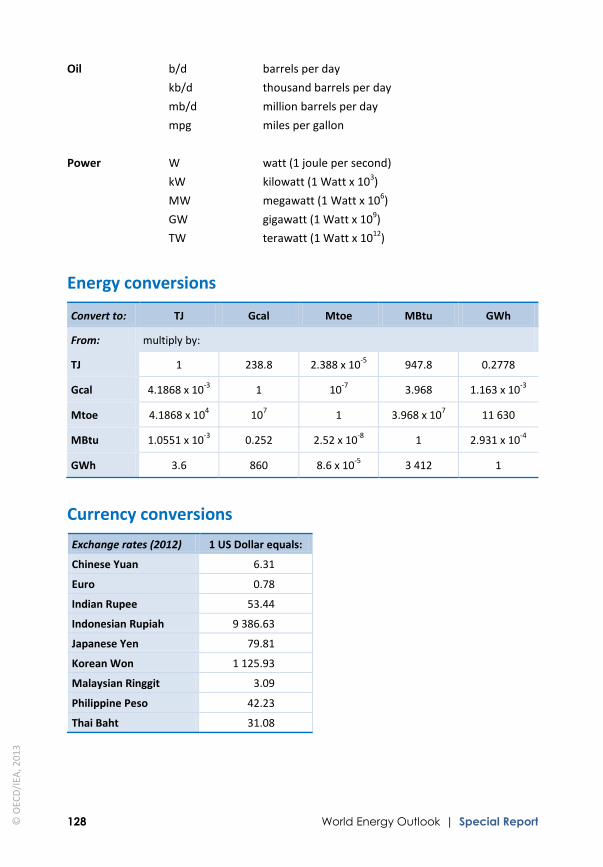
128 World Energy Outlook | Special Report
Oil b/d barrels per day
kb/d thousand barrels per day
mb/d million barrels per day
mpg miles per gallon
Power W watt (1 joule per second)
kW kilowatt (1 Watt x 103)
MW megawatt (1 Watt x 106)
GW gigawatt (1 Watt x 109)
TW terawatt (1 Watt x 1012)
Energy conversions
Convert to: TJ Gcal Mtoe MBtu GWh
From: multiply by:
TJ 1 238.8 2.388 x 10⁻⁵ 947.8 0.2778
Gcal 4.1868 x 10⁻³ 1 10-7 3.968 1.163 x 10⁻³
Mtoe 4.1868 x 10⁴ 107 1 3.968 x 10⁷ 11 630
MBtu 1.0551 x 10⁻³ 0.252 2.52 x 10⁻⁸ 1 2.931 x 10⁻⁴
GWh 3.6 860 8.6 x 10⁻⁵ 3 412 1
Currency conversions
Exchange rates (2012) 1 US Dollar equals:
Chinese Yuan 6.31
Euro 0.78
Indian Rupee 53.44
Indonesian Rupiah 9 386.63
Japanese Yen 79.81
Korean Won 1 125.93
Malaysian Ringgit 3.09
Philippine Peso 42.23
Thai Baht 31.08
© O
ECD
/IEA
, 201
3

Annex C | References 129
Annex C
References
Chapter 1: The energy landscape today
ADB (Asian Development Bank) (2009), The Economics of Climate Change in Southeast Asia: A Regional Review, ADB, Manila.
− (2013), Prospects for Carbon Capture and Storage in Southeast Asia, ADB, Manila, forthcoming.
BGR (Bundesanstalt für Geowissenschaften und Rohstoffe – German Federal Institute for Geosciences and Natural Resources) (2012), Energierohstoffe 2012, Reserven, Ressourcen, Verfügbarkeit, Tabellen (Energy Resources 20121, Reserves, Resources, Availability, Tables), BGR, Hannover, Germany.
IMF (International Monetary Fund) (2013), World Economic Outlook Update: Growing Pains, IMF, Washington, DC, July.
OECD (Organisation for Economic Co-operation and Development) (2013), OECD Economic Outlook, OECD, Paris, September.
O&GJ (Oil and Gas Journal) (2012), “Worldwide Look at Reserves and Production”, Oil and Gas Journal, Pennwell Corporation, Oklahoma City, OK, United States.
UNPD (United Nations Population Division) (2013), World Population Prospects: The 2012 Revision, United Nations, New York.
World Bank (2010), Winds of Change: East Asia’s Sustainable Energy Future, World Bank, Washington, DC.
Chapter 2: Domestic energy prospects
Ford, N. (2012), “ASEAN Focuses on Grid Reliability”, Platts Energy Economist, McGraw Hill Financial, London.
IEA (International Energy Agency) (2010), Deploying Renewables in Southeast Asia: Trends and Potentials, OECD/IEA, Paris.
Chapter 3: Fossil fuel resources and supply potential
BGR (Bundesanstalt für Geowissenschaften und Rohstoffe – German Federal Institute for Geosciences and Natural Resources) (2012), Energierohstoffe 2012, Reserven, Ressourcen, Verfügbarkeit, Tabellen (Energy Resources 2012, Reserves, Resources, Availability, Tables), BGR, Hannover, Germany.
BPS (Badan Pusat Statistik) (2012), Statistical Yearbook of Indonesia 2012, BPS, Jakarta.
© O
ECD
/IEA
, 201
3
130 World Energy Outlook | Special Report
IEA (International Energy Agency) (2013), Medium-Term Gas Market Report 2013, OECD/IEA, Paris.
IMB (International Maritime Bureau) (2013), Piracy and Armed Robbery Against Ships –Report for the Period 1 January-31 December 2012, International Chamber of Commerce, London.
O&GJ (Oil and Gas Journal) (2012), “Worldwide Look at Reserves and Production”, Oil and Gas Journal, Pennwell Corporation, Oklahoma City, United States.
Raymond, C. (2009), “Piracy and Armed Robbery in the Malacca Strait: A Problem Solved?”, Naval War College Review, Vol. 62, No. 3., Newport, RI, United States.
Simon, S. (2011), “Safety and Security in the Malacca Strait: The Limits of Collaboration”, Asian Security, Vol. 7, No. 1, Routledge, pp. 27-41.
UNCTAD (United Nations Conference on Trade and Development) (2012), World Investment Report 2012, UNCTAD, New York and Geneva.
US DOE/EIA (United States Department of Energy/Energy Information Administration) (2013), “South China Sea”, Country Analysis Brief, US DOE, Washington, DC.
USGS (United States Geological Survey) (2000), World Petroleum Assessment, USGS, Boulder, United States.
− (2012), "An Estimate of Undiscovered Oil and Gas Resources of the World", Fact Sheet FS2012-3042, USGS, Boulder, United States.
Chapter 4: The Efficient ASEAN Scenario
ADB (Asian Development Bank) (2011), ASIA 2050: Realizing the Asian Century, ADB, Manila.
BMA (Bangkok Metropolitan Administration) (2007), Action Plan on Global Warming Mitigation 2007-2012, Bangkok
BUMN Consortium (2013), Pemecahan Kemacetan di Jalan Protokol Jakarta (in Indonesian) www.dephub.go.id/files/media/, accessed May 2013.
DBS (DBS Bank) (2011), Imaging ASIA 2020.
ERIA (Economic Research Institute for ASEAN and East Asia) (2013), Analysis on Energy Saving Potential in East Asia, ERIA, Jakarta.
IEA (International Energy Agency) (2013), Redrawing the Energy-Climate Map, World Energy Outlook Special Report, OECD/IEA, Paris.
IEEJ (The Institute of Energy Economics, Japan) (2011), The 3rd ASEAN Energy Outlook, IEEJ, Tokyo.
© O
ECD
/IEA
, 201
3

Annex C | References 131
C
MTME (Ministry of Transportation and Ministry of Environment Indonesia) (2009), Indonesia Country Report on Environmentally Sustainable Transport Implementation, www.uncrd.or.jp/env/4th-regional-est-forum/Presentations/08_BS2_Indonesia.pdf, accessed May 2013.
WHO (World Health Organisation) (2011), Tackling the Global Clean Air Challenge, World Health Organisation, Geneva.
World Bank (2010), Vietnam: Expanding Opportunities for Energy Efficiency, World Bank, Washington, DC.
© O
ECD
/IEA
, 201
3
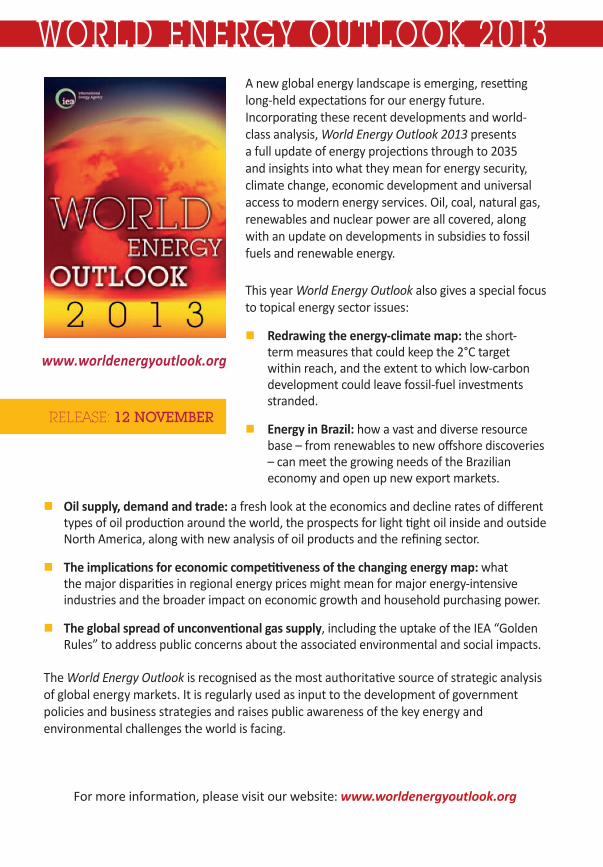
A new global energy landscape is emerging, resetting long-held expectations for our energy future. Incorporating these recent developments and world-class analysis, World Energy Outlook 2013 presents a full update of energy projections through to 2035 and insights into what they mean for energy security, climate change, economic development and universal access to modern energy services. Oil, coal, natural gas, renewables and nuclear power are all covered, along with an update on developments in subsidies to fossil fuels and renewable energy.
This year World Energy Outlook also gives a special focus to topical energy sector issues:
� Redrawing the energy-climate map: the short-term measures that could keep the 2°C target within reach, and the extent to which low-carbon development could leave fossil-fuel investments stranded.
� Energy in Brazil: how a vast and diverse resource base – from renewables to new offshore discoveries – can meet the growing needs of the Brazilian economy and open up new export markets.
� Oil supply, demand and trade: a fresh look at the economics and decline rates of different types of oil production around the world, the prospects for light tight oil inside and outside North America, along with new analysis of oil products and the refining sector.
� The implications for economic competitiveness of the changing energy map: what the major disparities in regional energy prices might mean for major energy-intensive industries and the broader impact on economic growth and household purchasing power.
� The global spread of unconventional gas supply, including the uptake of the IEA “Golden Rules” to address public concerns about the associated environmental and social impacts.
The World Energy Outlook is recognised as the most authoritative source of strategic analysis of global energy markets. It is regularly used as input to the development of government policies and business strategies and raises public awareness of the key energy and environmental challenges the world is facing.
For more information, please visit our website: www.worldenergyoutlook.org
www.worldenergyoutlook.org
RELEASE: 12 NOVEMBER
WORLD ENERGY OUTLOOK 2013
TA BLE OF CONTENTS
PART COUTLOOK FOR OIL MARKETS
PART AGLOBALENERGYTRENDS
PART BBRAZIL ENERGY OUTLOOK
ANNEXES
BRAZILIAN RESOURCES AND SUPPLY POTENTIAL11
IMPLICATIONS OF BRAZIL’S ENERGY DEVELOPMENT12
THE BRAZILIAN ENERGY SECTOR TODAY9
PROSPECTS FOR BRAZIL’S DOMESTIC ENERGY CONSUMPTION10
ENERGY AND GLOBAL COMPETITIVENESS8
SCOPE AND METHODOLOGY1
GLOBAL ENERGY TRENDS TO 20352
NATURAL GAS MARKET OUTLOOK3
POWER SECTOR OUTLOOK5
ENERGY EFFICIENCY OUTLOOK 7
COAL MARKET OUTLOOK4
RENEWABLE ENERGY OUTLOOK6
PROSPECTS FOR OIL SUPPLY14
IMPLICATIONS FOR OIL REFINING AND TRADE16
FROM OIL RESOURCES TO RESERVES13
PROSPECTS FOR OIL DEMAND15


International Energy Agency • 9 rue de la Fédération • 75739 Paris Cedex 15, France
Buy IEA publications online:
www.iea.org/books
PDF versions available at 20% discount
A number of books printed before January 2012
are now available free of charge in pdf format
on our website
Onlinebookshop
Tel: +33 (0)1 40 57 66 90
E-mail: [email protected]
This publication is the result of a collaborative effort between the International Energy Agency (IEA) and the Economic Research Institute for ASEAN and East Asia (ERIA).
This publication reflects the views of the IEA Secretariat and ERIA, but does not necessarily reflect those of their respective individual member countries. The IEA and
ERIA make no representation or warranty, express or implied, in respect to the publication’s contents (including its completeness or accuracy) and shall not be
responsible for any use of, or reliance on, the publication.
This document and any map included herein are without prejudice to the status of or sovereignty over any territory, to the delimitation of international frontiers and
boundaries and to the name of any territory, city or area.
IEA PUBLICATIONS, 9 rue de la Fédération, 75739 PARIS CEDEX 15 Printed in France by IEA, September 2013
Photo credits: GraphicObsession
Related Documents


