astat 2009 AUTONOME PROVINZ BOZEN - SÜDTIROL PROVINCIA AUTONOMA DI BOLZANO - ALTO ADIGE Rip. 8 - Istituto provinciale di statistica Abt. 8 - Landesinstitut für Statistik AUTONOMOUS PROVINCE OF SOUTH TYROL Rep. 8 - Provincial Statistics Institute South Tyrol in figures

Welcome message from author
This document is posted to help you gain knowledge. Please leave a comment to let me know what you think about it! Share it to your friends and learn new things together.
Transcript
astat
2009
AUTONOME PROVINZBOZEN - SÜDTIROL
PROVINCIA AUTONOMADI BOLZANO - ALTO ADIGE
Rip. 8 - Istituto provincialedi statistica
Abt. 8 - Landesinstitutfür Statistik
AUTONOMOUS PROVINCE OF SOUTH TYROL
Rep. 8 - Provincial Statistics Institute
SouthTyrol infigures
General preliminary notes
SIGNS
Signs used in the tables of this publication:
Hyphen (-): a) the attribute doesn’t existb) the attribute exists and has been collected, but it doesn’t occur.
Four dots (….): the attribute exists, but its frequency is unknown for various reasons.
Two dots (..): Value which differs from zero but doesn’t reach 50% of the lowest unitthat may be shown in the table.
ABBREVIATIONS
Abbreviations among the table sources:ASTAT: Provincial Statistics InstituteISTAT: National Statistics Institute
ROUNDINGS
Usually the values are rounded without considering the sum. Therefore may be minordifferences between the summation of the single values and their sum in the table. Thisapplies mainly to percentages and monetary values.
PRELIMINARY AND RECTIFIED DATA
Recent data is to be considered preliminary. They will be rectified in future editions. Valuesof older publications which differ from the data in the actual edition have been rectified.
© Copyright:
Autonomous Province of South TyrolProvincial Statistics Institute - ASTATBozen / Bolzano 2009
Orders are available from:
ASTATVia Kanonikus-Michael-Gamper-Str. 1I-39100 Bozen / BolzanoTel. 0471 41 84 00Fax 0471 41 84 19
For further information please contact:
Statistische Informationsstelle / Centro d’informazione statisticaTel. 0471 41 84 04, 41 84 05
The tables of this publication are www.provinz.bz.it/astatalso to be found in internet at www.provincia.bz.it/astat
E-mail: [email protected]
Reproduction and reprinting of tables and charts, even partial, is only allowed if the source iscited (title and publisher).
Editor: Oscar Benvenuto
Layout and graphics: Raimund LantschnerRenata Stauder
Translation: Logiudice Sonja
Source of data:
Data was mainly taken from official statistics sources which are partly directly collected by theProvincial Statistics Institute (ASTAT) and partly acquired from various ISTAT publications.
The following public bodies also provided data: Provincial Hydrographic Department, ProvincialHospital Department, Local Education Authority, Bilingual Examination Secretariat, Chamber ofCommerce, SIAE, Provincial Employment Office, Provincial Agricultural Division, ProvincialForestry Division, Provincial Department of Industry, ENEL, Provincial Cablecar Department,Telecom, RAI, Banca d'Italia, Autonomous Province of Trento.
ASTAT accepts full responsibilty for the data and ist evaluation.

C o n t e n t s
astat: South Tyrol in figures 2009 page 3
Page
T e r r i t o r y a n d e n v i r o n m e n t
1 Surface area by altitude 6
2 Municipalities grouped by surface area - 2008 6
3 Surface area by land use - 2000 7
4 Climate - 2008 7
P o p u l a t i o n a n d s o c i e t y
5 Demographic development in South Tyrol and in its main urban centres - 1754-2001 8
6 Surface area, resident population and population density in South Tyroleandistricts - 31.12.2008 9
7 Resident population of the municipalities and districts in 2008, 2001 and 1991 10
8 Municipalities and resident population by population size groups - 31.12.2008 14
9 Declarations of which language group belong to/affiliated to - PopulationCensus 2001 15
10 Percentage composition of the three official language groups (based on thedeclarations made during the Population Census 2001) by municipality 16
11 Resident population by language group according to the Population Censusesfrom 1880 to 2001 19
12 Natural population change - 2006-2008 20
13 Average life expectancy at birth - 2008 20
14 Marriages, separations and divorces - 2006-2008 21
15 Immigration and emigration by source and destination area - 2006 22
16 Households by number of members - 2001 and 2008 23
17 Deaths by causes of death - 2008 23
18 Hospitals, number and bed utilisation rate - 2008 24
19 Legally induced abortions - 2006-2008 24
20 Suicides - 2004-2008 24
21 Schools: number of classes and enrolled students by teaching language -School year 2008/09 25
22 Resident population aged 14 and over by sex and educational level - 1991 and2001 26
23 Tests of bilingual ability by sex and test level - 1977-2008 26
C o n t e n t s
4 page astat: South Tyrol in figures 2009
Page
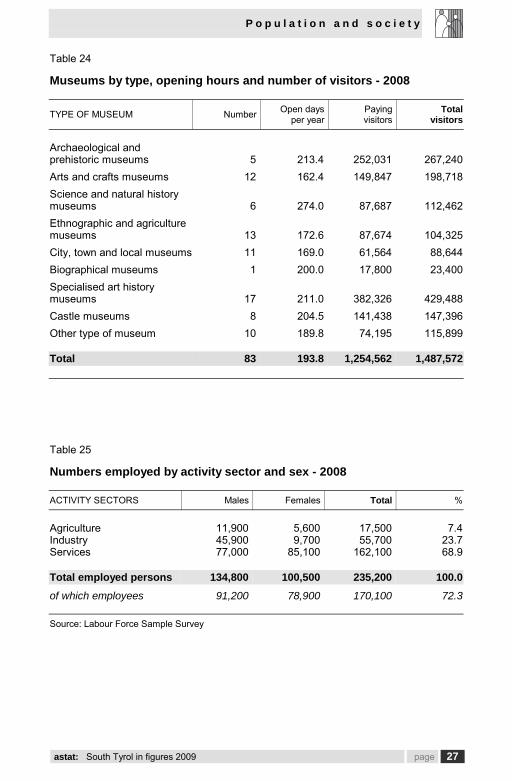
24 Museums by type, opening hours and number of visitors - 2008 27
25 Numbers employed by activity sector and sex - 2008 27
26 Unemployment - 2006-2008 28
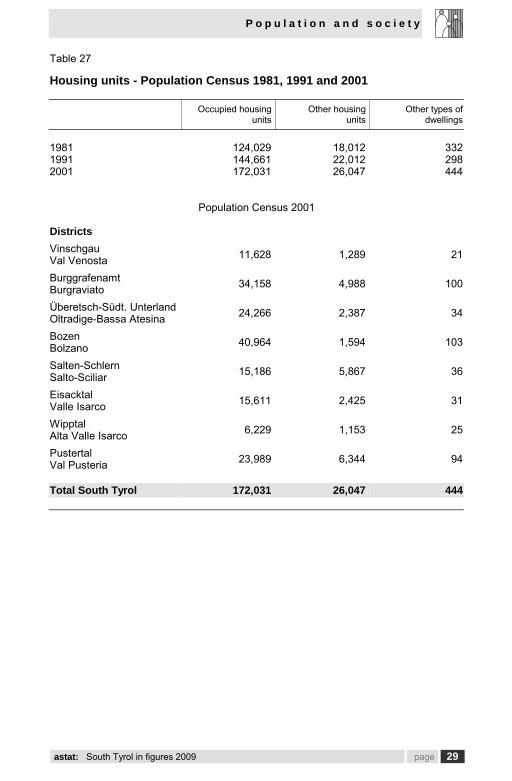
27 Housing units - Population Census 1981, 1991 and 2001 29
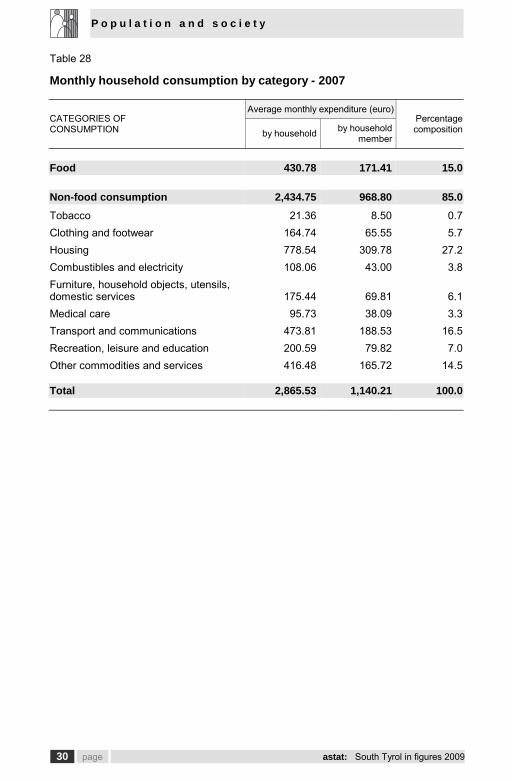
28 Monthly household consumption by category - 2007 30
E c o n o m y a n d b u s i n e s s
29 Local units and employees by activity sector - 1981, 1991 and 2001 31
30 Inflation rates in Bozen / Bolzano, Trento and Italy - 2006-2008 32
31 Use and resources of goods and services - 2006-2007 32
32 Gross and net value-added at basic prices and gross domestic product atmarket prices - 2006-2007 33
33 Per capita values of some economic aggregates in South Tyrol and Italy -2006-2007 34
34 Farm holdings and holding surface area by land use - 2000 35
35 Farm holdings and livestock population by livestock type - 2000 35
36 Agricultural production by crop type - 2006-2008 36
37 Wine grape harvest - 2007-2008 36
38 Apple harvest by variety - 2007-2008 37
39 Forestry production by type of wood and utilisation - 2006-2008 38
40 Mining production - 2005-2007 38
41 Electricity production and consumption - 2006-2007 39
42 Collected building permits - 2006-2008 39
43 Public works of local administration - 2006-2008 40
44 Trade with foreign countries - 1993-2008 40
45 Accommodation capacity, arrivals and overnight stays - 2006-2008 41
46 Traffic network - 2008 42
47 Vehicles liable to road tax - 2008 42
48 Road accidents and people injured - 2005-2008 43
49 Cableways by category - 2006-2008 43
50 TV subscriptions - 1965-2008 44
51 Deposits, loans, number of banks and customer service - 2006-2008 44
C o n t e n t s
astat: South Tyrol in figures 2009 page 5
Page
P u b l i c a d m i n i s t r a t i o n a n d j u s t i c e
52 Civil servants by administration - 2007-2008 45
53 Consolidated expenditure of local public administration by functional classifica-tion - 2006-2007 46
54 Declared bankruptcies by activity sector - 2006-2008 47
55 Protests - 2007-2008 47
56 Reported crimes leading to prosecution - 2005 47
C h a r t s
1 Demographic development in South Tyrol and in its main urban centres - 1869-2001 8
2 Birth rate, mortality rate and marriage rate - 1950-2008 21
3 Migration balance by source and destination area - 2006 22
4 Students of nursery, primary, lower and upper secondary schools - schoolyears 1970/71-2008/09 25
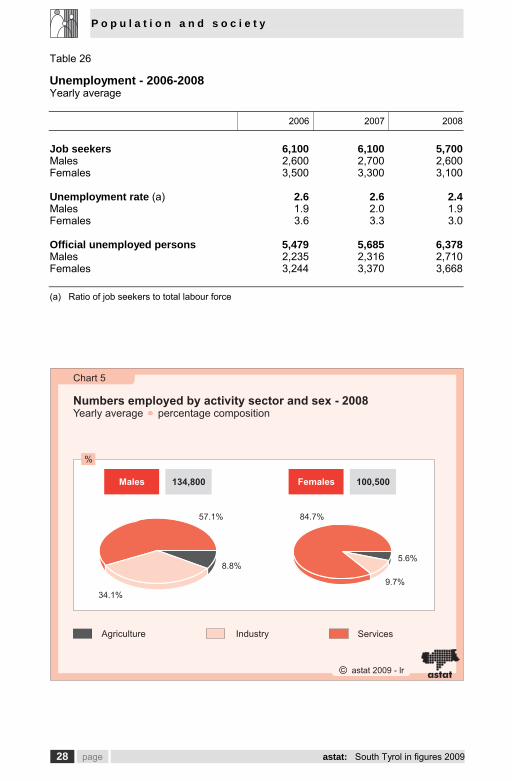
5 Numbers employed by activity sector and sex - 2008 28
6 Agricultural holdings by livestock type - 2000 34
7 Apple and pear harvest - 2008 37
8 Local administration civil servants - 2008 45
T e r r i t o r y a n d e n v i r o n m e n t
6 page astat: South Tyrol in figures 2009
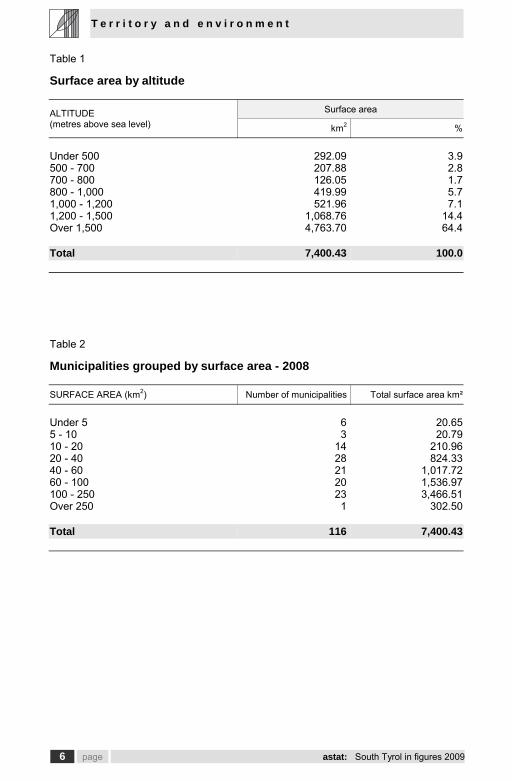
Table 1
Surface area by altitude
Surface areaALTITUDE(metres above sea level) km2 %
Under 500 292.09 3.9500 - 700 207.88 2.8700 - 800 126.05 1.7800 - 1,000 419.99 5.71,000 - 1,200 521.96 7.11,200 - 1,500 1,068.76 14.4Over 1,500 4,763.70 64.4
Total 7,400.43 100.0
Table 2
Municipalities grouped by surface area - 2008
SURFACE AREA (km2) Number of municipalities Total surface area km²
Under 5 6 20.655 - 10 3 20.7910 - 20 14 210.9620 - 40 28 824.3340 - 60 21 1,017.7260 - 100 20 1,536.97100 - 250 23 3,466.51Over 250 1 302.50
Total 116 7,400.43
T e r r i t o r y a n d e n v i r o n m e n t
astat: South Tyrol in figures 2009 page 7
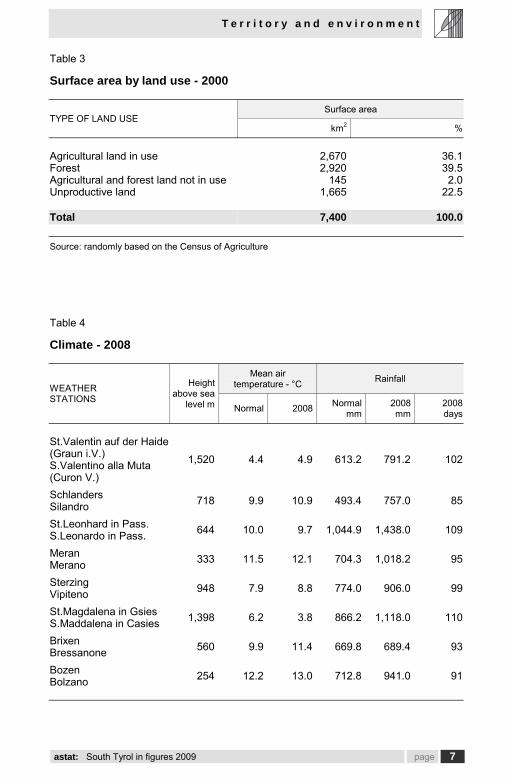
Table 3
Surface area by land use - 2000
Surface areaTYPE OF LAND USE
km2 %
Agricultural land in use 2,670 36.1Forest 2,920 39.5Agricultural and forest land not in use 145 2.0Unproductive land 1,665 22.5
Total 7,400 100.0
Source: randomly based on the Census of Agriculture
Table 4
Climate - 2008
Mean airtemperature - °C Rainfall
WEATHERSTATIONS
Heightabove sea
level m Normal 2008 Normalmm
2008mm
2008days
St.Valentin auf der Haide(Graun i.V.)S.Valentino alla Muta(Curon V.)
1,520 4.4 4.9 613.2 791.2 102
SchlandersSilandro 718 9.9 10.9 493.4 757.0 85
St.Leonhard in Pass.S.Leonardo in Pass. 644 10.0 9.7 1,044.9 1,438.0 109
MeranMerano 333 11.5 12.1 704.3 1,018.2 95
SterzingVipiteno 948 7.9 8.8 774.0 906.0 99
St.Magdalena in GsiesS.Maddalena in Casies 1,398 6.2 3.8 866.2 1,118.0 110
BrixenBressanone 560 9.9 11.4 669.8 689.4 93
BozenBolzano 254 12.2 13.0 712.8 941.0 91

P o p u l a t i o n a n d s o c i e t y
8 page astat: South Tyrol in figures 2009
Table 5
Demographic development in South Tyrol and in its main urban centres- 1754-2001
YEAR Total South Tyrol BozenBolzano
MeranMerano
BrixenBressanone
1754 163,000 .... .... ....1837 183,727 10,499 .... ....1869 196,686 14,941 7,142 7,3991880 205,306 17,441 9,812 7,8491890 210,285 19,242 13,552 8,534
1900 222,793 23,521 18,544 8,8821910 251,451 30,424 23,640 10,0491921 256,610 32,679 21,177 10,4241931 282,158 37,351 25,196 11,6591936 298,290 45,505 25,611 11,242
1951 333,900 70,898 27,908 11,7971961 373,863 88,799 30,614 13,4561971 414,041 105,757 33,235 16,0171981 430,568 105,180 33,711 16,1011991 440,508 98,158 33,504 16,992
2001 462,999 94,989 33,656 18,359
astat 2009 - lr astat
800
700
600
500
400
300
200
100
01869 1880 1900 1921 19611936 1981 2001
Chart 1
Demographic development in South Tyrol and in its main urbancentres - 1869-2001
The Brixen index of demographic development correspondsapproximately to that for the whole province of South Tyrol
Index 1869 = 100
Total South Tyrol
BozenBolzano
MeranMerano
P o p u l a t i o n a n d s o c i e t y
astat: South Tyrol in figures 2009 page 9
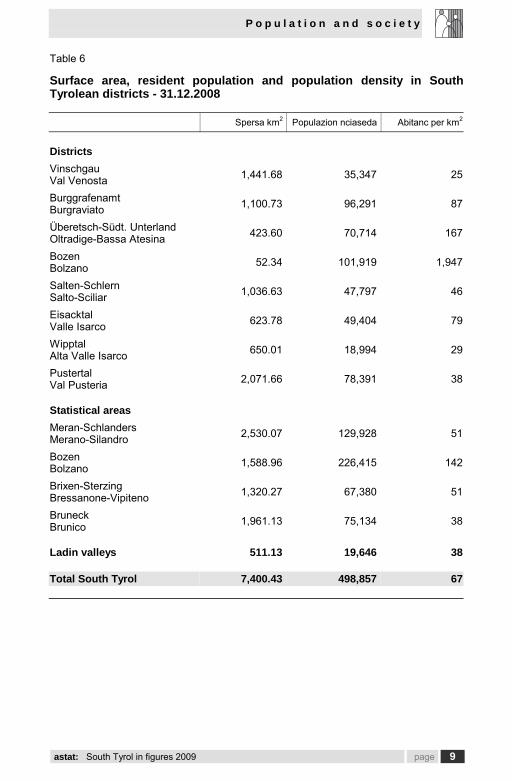
Table 6
Surface area, resident population and population density in SouthTyrolean districts - 31.12.2008
Spersa km2 Populazion nciaseda Abitanc per km2
DistrictsVinschgauVal Venosta 1,441.68 35,347 25
BurggrafenamtBurgraviato 1,100.73 96,291 87
Überetsch-Südt. UnterlandOltradige-Bassa Atesina 423.60 70,714 167
BozenBolzano 52.34 101,919 1,947
Salten-SchlernSalto-Sciliar 1,036.63 47,797 46
EisacktalValle Isarco 623.78 49,404 79
WipptalAlta Valle Isarco 650.01 18,994 29
PustertalVal Pusteria 2,071.66 78,391 38
Statistical areasMeran-SchlandersMerano-Silandro 2,530.07 129,928 51
BozenBolzano 1,588.96 226,415 142
Brixen-SterzingBressanone-Vipiteno 1,320.27 67,380 51
BruneckBrunico 1,961.13 75,134 38
Ladin valleys 511.13 19,646 38
Total South Tyrol 7,400.43 498,857 67

P o p u l a t i o n a n d s o c i e t y
10 page astat: South Tyrol in figures 2009
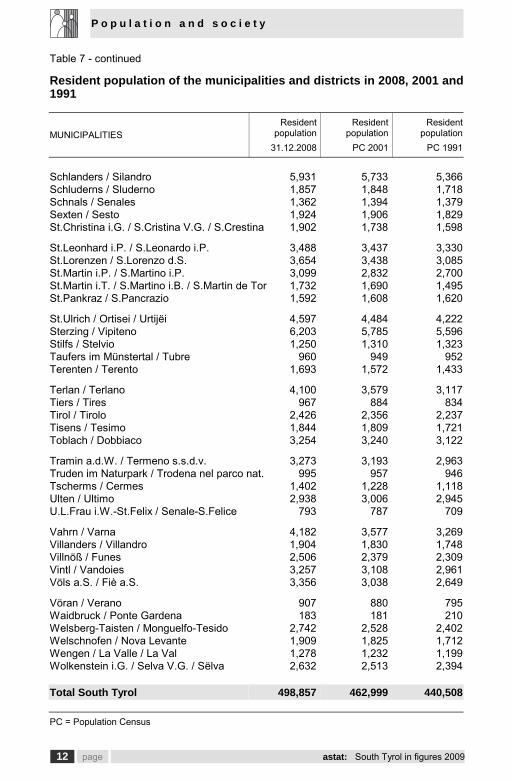
Table 7
Resident population of the municipalities and districts in 2008, 2001 and1991
MUNICIPALITIESResident
population31.12.2008
Residentpopulation
PC 2001
Residentpopulation
PC 1991
Abtei / Badia 3,323 3,015 2,722Ahrntal / Valle Aurina 5,831 5,517 5,261Aldein / Aldino 1,678 1,656 1,590Algund / Lagundo 4,650 4,169 3,841Altrei / Anterivo 393 387 395
Andrian / Andriano 1,018 794 758Auer / Ora 3,490 3,022 2,637Barbian / Barbiano 1,555 1,520 1,444Bozen / Bolzano 101,919 94,989 98,158Branzoll / Bronzolo 2,601 2,293 1,973
Brenner / Brennero 2,114 2,066 2,242Brixen / Bressanone 20,360 18,359 16,992Bruneck / Brunico 15,170 13,618 12,624Burgstall / Postal 1,692 1,435 1,268Corvara / Corvara i.B. / Curvea-Corvara 1,313 1,266 1,236
Deutschnofen / Nova Ponente 3,861 3,565 3,231Enneberg / Marebbe / Mareo 2,869 2,682 2,574Eppan a.d.W. / Appiano s.s.d.v. 13,892 12,657 10,914Feldthurns / Velturno 2,698 2,541 2,302Franzensfeste / Fortezza 965 892 915
Freienfeld / Campo di Trens 2,656 2,458 2,383Gais 3,136 2,865 2,537Gargazon / Gargazzone 1,561 1,366 1,140Glurns / Glorenza 886 883 795Graun i.V. / Curon V. 2,417 2,379 2,331
Gsies / Valle di Casies 2,192 2,098 2,008Hafling / Avelengo 726 709 623Innichen / S.Candido 3,171 3,107 3,073Jenesien / S.Genesio 2,940 2,703 2,353Kaltern a.d.W. / Caldaro s.s.d.v. 7,558 6,852 6,337
Karneid / Cornedo all’Isarco 3,312 3,113 2,764Kastelbell-Tschars / Castelbello-Ciardes 2,382 2,328 2,317Kastelruth / Castelrotto 6,442 5,994 5,600Kiens / Chienes 2,676 2,641 2,476Klausen / Chiusa 5,098 4,613 4,284
Kuens / Caines 380 318 304Kurtatsch a.d.W. / Cortaccia s.s.d.v. 2,238 2,085 1,812Kurtinig a.d.W. / Cortina s.s.d.v. 629 594 552Laas / Lasa 3,862 3,700 3,514Lajen / Laion 2,537 2,261 1,945
P o p u l a t i o n a n d s o c i e t y
astat: South Tyrol in figures 2009 page 11
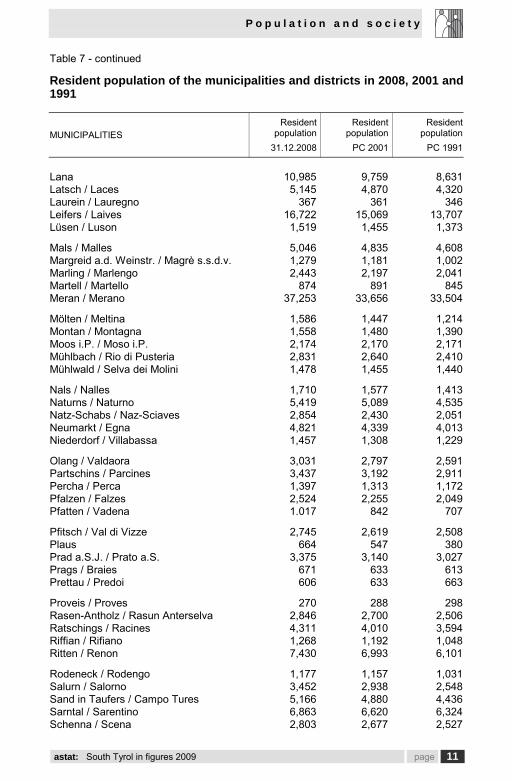
Table 7 - continued
Resident population of the municipalities and districts in 2008, 2001 and1991
MUNICIPALITIESResident
population31.12.2008
Residentpopulation
PC 2001
Residentpopulation
PC 1991
Lana 10,985 9,759 8,631Latsch / Laces 5,145 4,870 4,320Laurein / Lauregno 367 361 346Leifers / Laives 16,722 15,069 13,707Lüsen / Luson 1,519 1,455 1,373
Mals / Malles 5,046 4,835 4,608Margreid a.d. Weinstr. / Magrè s.s.d.v. 1,279 1,181 1,002Marling / Marlengo 2,443 2,197 2,041Martell / Martello 874 891 845Meran / Merano 37,253 33,656 33,504
Mölten / Meltina 1,586 1,447 1,214Montan / Montagna 1,558 1,480 1,390Moos i.P. / Moso i.P. 2,174 2,170 2,171Mühlbach / Rio di Pusteria 2,831 2,640 2,410Mühlwald / Selva dei Molini 1,478 1,455 1,440
Nals / Nalles 1,710 1,577 1,413Naturns / Naturno 5,419 5,089 4,535Natz-Schabs / Naz-Sciaves 2,854 2,430 2,051Neumarkt / Egna 4,821 4,339 4,013Niederdorf / Villabassa 1,457 1,308 1,229
Olang / Valdaora 3,031 2,797 2,591Partschins / Parcines 3,437 3,192 2,911Percha / Perca 1,397 1,313 1,172Pfalzen / Falzes 2,524 2,255 2,049Pfatten / Vadena 1.017 842 707
Pfitsch / Val di Vizze 2,745 2,619 2,508Plaus 664 547 380Prad a.S.J. / Prato a.S. 3,375 3,140 3,027Prags / Braies 671 633 613Prettau / Predoi 606 633 663
Proveis / Proves 270 288 298Rasen-Antholz / Rasun Anterselva 2,846 2,700 2,506Ratschings / Racines 4,311 4,010 3,594Riffian / Rifiano 1,268 1,192 1,048Ritten / Renon 7,430 6,993 6,101
Rodeneck / Rodengo 1,177 1,157 1,031Salurn / Salorno 3,452 2,938 2,548Sand in Taufers / Campo Tures 5,166 4,880 4,436Sarntal / Sarentino 6,863 6,620 6,324Schenna / Scena 2,803 2,677 2,527
P o p u l a t i o n a n d s o c i e t y
12 page astat: South Tyrol in figures 2009
Table 7 - continued
Resident population of the municipalities and districts in 2008, 2001 and1991
MUNICIPALITIESResident
population31.12.2008
Residentpopulation
PC 2001
Residentpopulation
PC 1991
Schlanders / Silandro 5,931 5,733 5,366Schluderns / Sluderno 1,857 1,848 1,718Schnals / Senales 1,362 1,394 1,379Sexten / Sesto 1,924 1,906 1,829St.Christina i.G. / S.Cristina V.G. / S.Crestina 1,902 1,738 1,598
St.Leonhard i.P. / S.Leonardo i.P. 3,488 3,437 3,330St.Lorenzen / S.Lorenzo d.S. 3,654 3,438 3,085St.Martin i.P. / S.Martino i.P. 3,099 2,832 2,700St.Martin i.T. / S.Martino i.B. / S.Martin de Tor 1,732 1,690 1,495St.Pankraz / S.Pancrazio 1,592 1,608 1,620
St.Ulrich / Ortisei / Urtijëi 4,597 4,484 4,222Sterzing / Vipiteno 6,203 5,785 5,596Stilfs / Stelvio 1,250 1,310 1,323Taufers im Münstertal / Tubre 960 949 952Terenten / Terento 1,693 1,572 1,433
Terlan / Terlano 4,100 3,579 3,117Tiers / Tires 967 884 834Tirol / Tirolo 2,426 2,356 2,237Tisens / Tesimo 1,844 1,809 1,721Toblach / Dobbiaco 3,254 3,240 3,122
Tramin a.d.W. / Termeno s.s.d.v. 3,273 3,193 2,963Truden im Naturpark / Trodena nel parco nat. 995 957 946Tscherms / Cermes 1,402 1,228 1,118Ulten / Ultimo 2,938 3,006 2,945U.L.Frau i.W.-St.Felix / Senale-S.Felice 793 787 709
Vahrn / Varna 4,182 3,577 3,269Villanders / Villandro 1,904 1,830 1,748Villnöß / Funes 2,506 2,379 2,309Vintl / Vandoies 3,257 3,108 2,961Völs a.S. / Fiè a.S. 3,356 3,038 2,649
Vöran / Verano 907 880 795Waidbruck / Ponte Gardena 183 181 210Welsberg-Taisten / Monguelfo-Tesido 2,742 2,528 2,402Welschnofen / Nova Levante 1,909 1,825 1,712Wengen / La Valle / La Val 1,278 1,232 1,199Wolkenstein i.G. / Selva V.G. / Sëlva 2,632 2,513 2,394
Total South Tyrol 498,857 462,999 440,508
PC = Population Census
P o p u l a t i o n a n d s o c i e t y
astat: South Tyrol in figures 2009 page 13
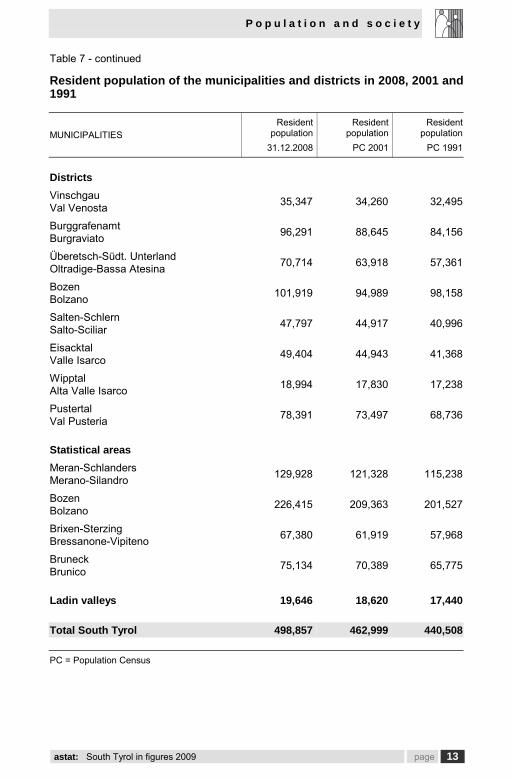
Table 7 - continued
Resident population of the municipalities and districts in 2008, 2001 and1991
MUNICIPALITIESResident
population31.12.2008
Residentpopulation
PC 2001
Residentpopulation
PC 1991
DistrictsVinschgauVal Venosta 35,347 34,260 32,495
BurggrafenamtBurgraviato 96,291 88,645 84,156
Überetsch-Südt. UnterlandOltradige-Bassa Atesina 70,714 63,918 57,361
BozenBolzano 101,919 94,989 98,158
Salten-SchlernSalto-Sciliar 47,797 44,917 40,996
EisacktalValle Isarco 49,404 44,943 41,368
WipptalAlta Valle Isarco 18,994 17,830 17,238
PustertalVal Pusteria 78,391 73,497 68,736
Statistical areasMeran-SchlandersMerano-Silandro 129,928 121,328 115,238
BozenBolzano 226,415 209,363 201,527
Brixen-SterzingBressanone-Vipiteno 67,380 61,919 57,968
BruneckBrunico 75,134 70,389 65,775
Ladin valleys 19,646 18,620 17,440
Total South Tyrol 498,857 462,999 440,508
PC = Population Census
P o p u l a t i o n a n d s o c i e t y
14 page astat: South Tyrol in figures 2009
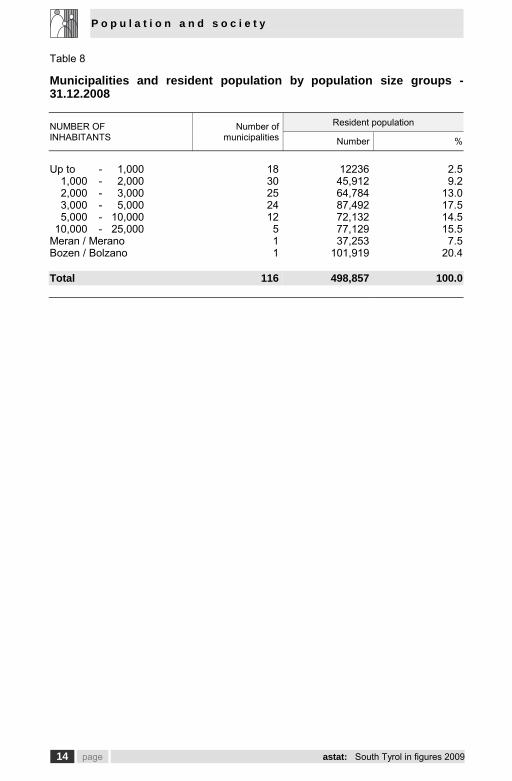
Table 8
Municipalities and resident population by population size groups -31.12.2008
Resident populationNUMBER OFINHABITANTS
Number ofmunicipalities Number %
Up to - 1,000 18 12236 2.51,000 - 2,000 30 45,912 9.22,000 - 3,000 25 64,784 13.03,000 - 5,000 24 87,492 17.55,000 - 10,000 12 72,132 14.5
10,000 - 25,000 5 77,129 15.5Meran / Merano 1 37,253 7.5Bozen / Bolzano 1 101,919 20.4
Total 116 498,857 100.0
P o p u l a t i o n a n d s o c i e t y
astat: South Tyrol in figures 2009 page 15
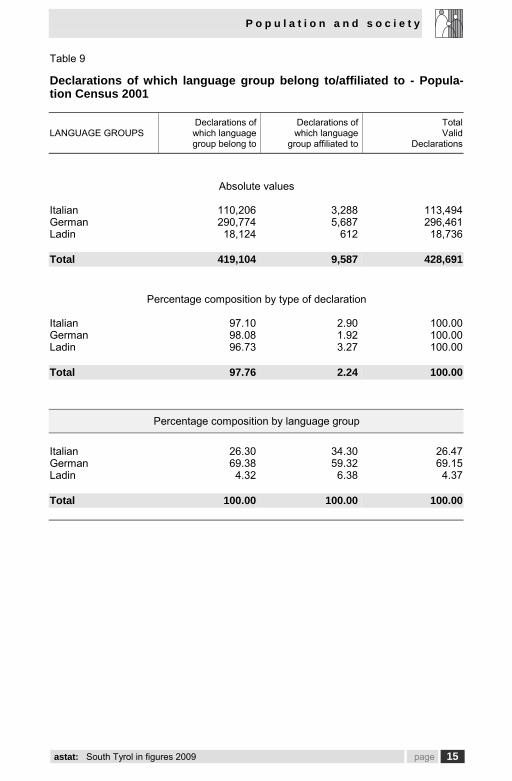
Table 9
Declarations of which language group belong to/affiliated to - Popula-tion Census 2001
LANGUAGE GROUPSDeclarations ofwhich languagegroup belong to
Declarations ofwhich language
group affiliated to
TotalValid
Declarations
Absolute values
Italian 110,206 3,288 113,494German 290,774 5,687 296,461Ladin 18,124 612 18,736
Total 419,104 9,587 428,691
Percentage composition by type of declaration
Italian 97.10 2.90 100.00German 98.08 1.92 100.00Ladin 96.73 3.27 100.00
Total 97.76 2.24 100.00
Percentage composition by language group
Italian 26.30 34.30 26.47German 69.38 59.32 69.15Ladin 4.32 6.38 4.37
Total 100.00 100.00 100.00
P o p u l a t i o n a n d s o c i e t y
16 page astat: South Tyrol in figures 2009
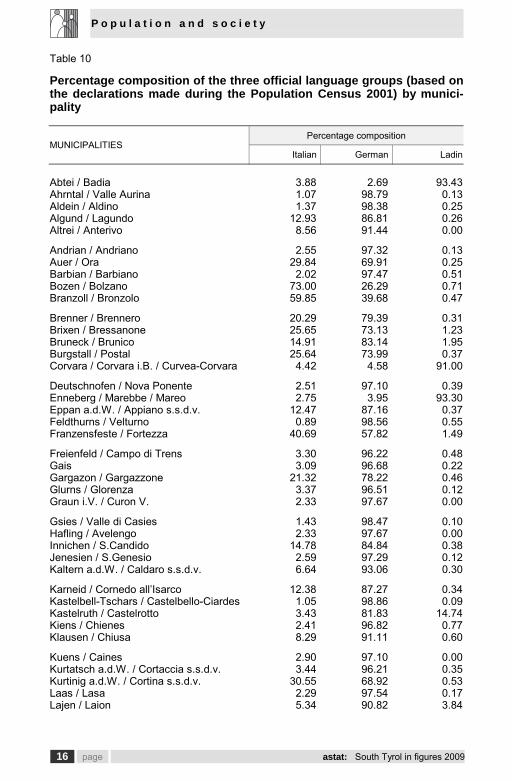
Table 10
Percentage composition of the three official language groups (based onthe declarations made during the Population Census 2001) by munici-pality
Percentage compositionMUNICIPALITIES
Italian German Ladin
Abtei / Badia 3.88 2.69 93.43Ahrntal / Valle Aurina 1.07 98.79 0.13Aldein / Aldino 1.37 98.38 0.25Algund / Lagundo 12.93 86.81 0.26Altrei / Anterivo 8.56 91.44 0.00
Andrian / Andriano 2.55 97.32 0.13Auer / Ora 29.84 69.91 0.25Barbian / Barbiano 2.02 97.47 0.51Bozen / Bolzano 73.00 26.29 0.71Branzoll / Bronzolo 59.85 39.68 0.47
Brenner / Brennero 20.29 79.39 0.31Brixen / Bressanone 25.65 73.13 1.23Bruneck / Brunico 14.91 83.14 1.95Burgstall / Postal 25.64 73.99 0.37Corvara / Corvara i.B. / Curvea-Corvara 4.42 4.58 91.00
Deutschnofen / Nova Ponente 2.51 97.10 0.39Enneberg / Marebbe / Mareo 2.75 3.95 93.30Eppan a.d.W. / Appiano s.s.d.v. 12.47 87.16 0.37Feldthurns / Velturno 0.89 98.56 0.55Franzensfeste / Fortezza 40.69 57.82 1.49
Freienfeld / Campo di Trens 3.30 96.22 0.48Gais 3.09 96.68 0.22Gargazon / Gargazzone 21.32 78.22 0.46Glurns / Glorenza 3.37 96.51 0.12Graun i.V. / Curon V. 2.33 97.67 0.00
Gsies / Valle di Casies 1.43 98.47 0.10Hafling / Avelengo 2.33 97.67 0.00Innichen / S.Candido 14.78 84.84 0.38Jenesien / S.Genesio 2.59 97.29 0.12Kaltern a.d.W. / Caldaro s.s.d.v. 6.64 93.06 0.30
Karneid / Cornedo all’Isarco 12.38 87.27 0.34Kastelbell-Tschars / Castelbello-Ciardes 1.05 98.86 0.09Kastelruth / Castelrotto 3.43 81.83 14.74Kiens / Chienes 2.41 96.82 0.77Klausen / Chiusa 8.29 91.11 0.60
Kuens / Caines 2.90 97.10 0.00Kurtatsch a.d.W. / Cortaccia s.s.d.v. 3.44 96.21 0.35Kurtinig a.d.W. / Cortina s.s.d.v. 30.55 68.92 0.53Laas / Lasa 2.29 97.54 0.17Lajen / Laion 5.34 90.82 3.84

P o p u l a t i o n a n d s o c i e t y
astat: South Tyrol in figures 2009 page 17
Table 10 - continued
Percentage composition of the three official language groups (based onthe declarations made during the Population Census 2001) by munici-pality
Percentage compositionMUNICIPALITIES
Italian German Ladin
Lana 7.91 91.80 0.29Latsch / Laces 2.61 97.32 0.07Laurein / Lauregno 0.28 99.72 0.00Leifers / Laives 70.42 29.07 0.51Lüsen / Luson 0.83 98.95 0.23
Mals / Malles V. 3.08 96.83 0.09Margreid a.d.W. / Magrè s.s.d.v. 15.96 83.49 0.56Marling / Marlengo 11.26 88.50 0.24Martell / Martello 0.70 99.30 0.00Meran / Merano 48.01 51.50 0.49
Mölten / Meltina 2.77 97.09 0.15Montan / Montagna 6.04 93.82 0.15Moos i.P. / Moso i.P. 0.91 99.09 0.00Mühlbach / Rio di Pusteria 4.03 95.31 0.66Mühlwald / Selva dei Molini 0.73 99.19 0.07
Nals / Nalles 5.05 94.62 0.33Naturns / Naturno 2.89 97.07 0.04Natz-Schabs / Naz-Sciaves 5.39 93.62 0.99Neumarkt / Egna 37.97 61.65 0.37Niederdorf / Villabassa 6.68 93.32 0.00
Olang / Valdaora 2.16 97.42 0.42Partschins / Parcines 2.96 96.97 0.07Percha / Perca 2.54 96.82 0.64Pfalzen / Falzes 1.78 97.31 0.91Pfatten / Vadena 57.09 42.40 0.51
Pfitsch / Val di Vizze 9.29 90.38 0.33Plaus 0.99 99.01 0.00Prad a.S.J. / Prato a.S. 2.90 96.93 0.17Prags / Braies 2.79 96.89 0.33Prettau / Predoi 1.30 98.70 0.00
Proveis / Proves 2.16 97.84 0.00Rasen-Antholz / Rasun Anterselva 2.31 97.50 0.20Ratschings / Racines 1.53 98.44 0.03Riffian / Rifiano 1.08 98.92 0.00Ritten / Renon 3.77 95.96 0.26
Rodeneck / Rodengo 0.18 99.64 0.18Salurn / Salorno 62.19 37.43 0.39Sand in Taufers / Campo Tures 2.94 96.72 0.33Sarntal / Sarentino 1.45 98.44 0.11Schenna / Scena 2.49 97.31 0.20
P o p u l a t i o n a n d s o c i e t y
18 page astat: South Tyrol in figures 2009
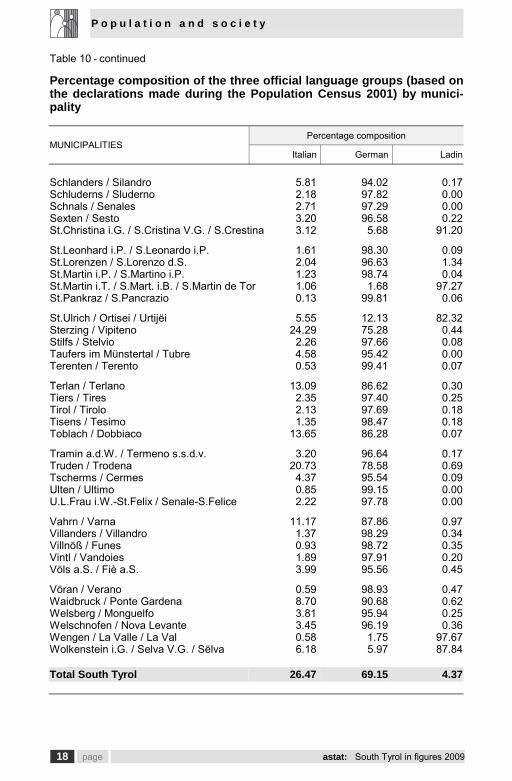
Table 10 - continued
Percentage composition of the three official language groups (based onthe declarations made during the Population Census 2001) by munici-pality
Percentage compositionMUNICIPALITIES
Italian German Ladin
Schlanders / Silandro 5.81 94.02 0.17Schluderns / Sluderno 2.18 97.82 0.00Schnals / Senales 2.71 97.29 0.00Sexten / Sesto 3.20 96.58 0.22St.Christina i.G. / S.Cristina V.G. / S.Crestina 3.12 5.68 91.20
St.Leonhard i.P. / S.Leonardo i.P. 1.61 98.30 0.09St.Lorenzen / S.Lorenzo d.S. 2.04 96.63 1.34St.Martin i.P. / S.Martino i.P. 1.23 98.74 0.04St.Martin i.T. / S.Mart. i.B. / S.Martin de Tor 1.06 1.68 97.27St.Pankraz / S.Pancrazio 0.13 99.81 0.06
St.Ulrich / Ortisei / Urtijëi 5.55 12.13 82.32Sterzing / Vipiteno 24.29 75.28 0.44Stilfs / Stelvio 2.26 97.66 0.08Taufers im Münstertal / Tubre 4.58 95.42 0.00Terenten / Terento 0.53 99.41 0.07
Terlan / Terlano 13.09 86.62 0.30Tiers / Tires 2.35 97.40 0.25Tirol / Tirolo 2.13 97.69 0.18Tisens / Tesimo 1.35 98.47 0.18Toblach / Dobbiaco 13.65 86.28 0.07
Tramin a.d.W. / Termeno s.s.d.v. 3.20 96.64 0.17Truden / Trodena 20.73 78.58 0.69Tscherms / Cermes 4.37 95.54 0.09Ulten / Ultimo 0.85 99.15 0.00U.L.Frau i.W.-St.Felix / Senale-S.Felice 2.22 97.78 0.00
Vahrn / Varna 11.17 87.86 0.97Villanders / Villandro 1.37 98.29 0.34Villnöß / Funes 0.93 98.72 0.35Vintl / Vandoies 1.89 97.91 0.20Völs a.S. / Fiè a.S. 3.99 95.56 0.45
Vöran / Verano 0.59 98.93 0.47Waidbruck / Ponte Gardena 8.70 90.68 0.62Welsberg / Monguelfo 3.81 95.94 0.25Welschnofen / Nova Levante 3.45 96.19 0.36Wengen / La Valle / La Val 0.58 1.75 97.67Wolkenstein i.G. / Selva V.G. / Sëlva 6.18 5.97 87.84
Total South Tyrol 26.47 69.15 4.37

P o p u l a t i o n a n d s o c i e t y
astat: South Tyrol in figures 2009 page 19
Table 11
Resident population by language group according to the PopulationCensuses from 1880 to 2001 (a)
YEAR Germans Italians Ladins Others (b) Total
Absolute values
1880 186,087 6,884 8,822 3,513 205,3061890 187,100 9,369 8,954 4,862 210,2851900 197,822 8,916 8,907 7,149 222,7941910 223,913 7,339 9,429 10,770 251,4511921 193,271 27,048 9,910 24,506 254,7351961 232,717 128,271 12,594 281 373,8631971 260,351 137,759 15,456 475 414,0411981 279,544 123,695 17,736 9,593 430,5681991 287,503 116,914 18,434 17,657 440,5082001 296,461 113,494 18,736 34,308 462,999
Percentage composition
1880 90.6 3.4 4.3 1.7 100.01890 89.0 4.5 4.3 2.3 100.01900 88.8 4.0 4.0 3.2 100.01910 89.0 2.9 3.8 4.3 100.01921 75.9 10.6 3.9 9.6 100.01961 62.2 34.3 3.4 0.1 100.01971 62.9 33.3 3.7 0.1 100.01981 64.9 28.7 4.1 2.2 100.01991 65.3 26.5 4.2 4.0 100.02001 64.0 24.5 4.0 7.4 100.0
(a) Figures up to 1921 refer to the present population, whereas those of 1961, 1971 and 1981 arebased on the resident population and those of 1991 as well as 2001 on the language groupdeclarations. The language analysed up to 1961 is the commonly spoken one, from 1971 to1981 it was the declaration of which language group they belonged to and in 1991 as well as2001 the declaration of which language group they belonged to or were affiliated to.
(b) The voice “others” contains different population groups according to the year:1880: the “locals” with a different commonly spoken language and the “non locals”; the same is
true for 1890 and 1900;1910: Italian citizens with a different commonly spoken language and non Italian citizens;1921: foreigners;1961: all residents with a different commonly spoken language;1971: all residents, who did not declare which language group they belonged to;1981: resident Italian citizens without any valid language group declaration, as well as resident
foreigners;1991: invalid declarations, people temporarily absent and resident foreigners; the same applies
to 2001
Source: ISTAT, Österreichisches Statistisches Zentralamt, elaborated by ASTAT

P o p u l a t i o n a n d s o c i e t y
20 page astat: South Tyrol in figures 2009
Table 12
Natural population change - 2006-2008
2006 2007 2008
Live births 5,409 5,502 5,462per 1,000 inhabitantsSouth Tyrol 11.1 11.2 11.0Province of Trento 10.3 10.1 10.5Italy 9.5 9.5 9.6
Stillbirths (a) 13 9 8per 1,000 birthsSouth Tyrol 2.6 1.8 1.6Province of Trento 2.1 2.9 ….Italy …. …. ….
Deaths 3,707 3,705 3,863per 1,000 inhabitantsSouth Tyrol 7.6 7.5 7.8Province of Trento 9.0 9.0 9.0Italy 9.5 9.6 9.8
Infant deaths within 1st yearof life (a) 16 21 16per 1,000 live birthsSouth Tyrol 3.2 4.2 3.2Province of Trento 2.7 1.4 ….Italy …. …. ….
…. ….Marriages (a)per 1,000 inhabitants 1,914 1,788 1,785South Tyrol 3.9 3.6 3.6Province of Trento 3.6 3.7 ….Italy 4.2 4.2 ….
(a) Present population
Table 13
Average life expectancy at birth - 2008Years
Males Females
South Tyrol 79.1 85.2Italy 78.8 84.1
P o p u l a t i o n a n d s o c i e t y
astat: South Tyrol in figures 2009 page 21
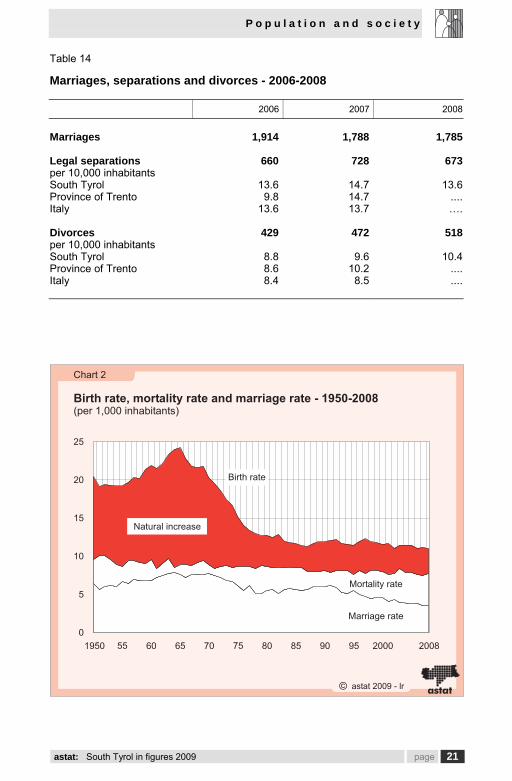
Table 14
Marriages, separations and divorces - 2006-2008
2006 2007 2008
Marriages 1,914 1,788 1,785
Legal separations 660 728 673per 10,000 inhabitantsSouth Tyrol 13.6 14.7 13.6Province of Trento 9.8 14.7 ....Italy 13.6 13.7 ….
Divorces 429 472 518per 10,000 inhabitantsSouth Tyrol 8.8 9.6 10.4Province of Trento 8.6 10.2 ....Italy 8.4 8.5 ....
astat 2009 - lr astat
25
20
15
10
5
0
Chart 2
Birth rate, mortality rate and marriage rate - 1950-2008(per 1,000 inhabitants)
1950 2008200075706560 908580 9555
Birth rate
Marriage rate
Natural increase
Mortality rate

P o p u l a t i o n a n d s o c i e t y
22 page astat: South Tyrol in figures 2009
Table 15
Immigration and emigration by source and destination area - 2006
SOURCE ANDDESTINATION AREA Immigration Emigration Balance
Another South Tyrolean municipality 8,724 8,724 -Northern Italy (exluding South Tyrol) 1,290 1,136 + 154Central Italy 298 241 + 57Southern Italy and island regions 892 354 + 538Austria 192 232 _ 40Switzerland 34 57 _ 23Germany 604 245 + 359Other foreign countries 3,016 652 + 2,364
Total 15,050 11,641 + 3,409of which from abroad 3,846 1,186 + 2,660
astat 2009 - lr astat
Austria
Chart 3
Migration balance by source and destination area - 2006
Northern Italy
Southern Italy and islandregions
Central Italy
Switzerland
Germany
Total
Other foreign countries
0-800 800 1,600 2,400 3,200 4,000
154
57
538
-40
-23
359
2,364
3,409

P o p u l a t i o n a n d s o c i e t y
astat: South Tyrol in figures 2009 page 23
Table 16
Households by number of members - 2001 and 2008
№ OF HOUSEHOLDSMEMBERS PC 2001 31.12.2008 2001-2008
change in %
1 50,806 68,984 + 35.82 40,761 47,551 + 16.73 31,771 33,793 + 6.44 31,944 32,875 + 2.95 12,624 12,321 _ 2.46 3,912 3,503 _ 10.57 and over- Households 2,096 1,640 _ 21.8- Members 15,977 12,428 _ 22.2
TotalHouseholds 173,914 200,667 + 15.4Members 457,986 492,016 + 7.4
PC = Population Census
Table 17
Deaths by causes of death - 2008
DISEASES Number % per 100,000inhabitants
Infectious and parasite diseases 51 1.3 10.3Tumourous (neoformation) 1,168 30.0 235.3Diseases of the blood and immunopathies 5 0.1 1.0Endocrine, nutritional and metabolic diseases 85 2.2 17.1Psychiatric illness and behavioural disordes 124 3.2 25.0Disorders of the nervous system, the eyesand the ears 149 3.8 30.0Circulatory system diseases 1,532 39.3 308.6Respiratory system diseases 270 9.9 54.4Digestive organ diseases 133 3.4 26.8Diseases of the urogenital apparatus 58 1.5 11.7Other diseases 46 1.2 9.3Symptoms and signs not elsewhere classified 26 0.7 5.2Traumas and poisoning 247 6.3 49.8
Total 3,894 100.0 784.5

P o p u l a t i o n a n d s o c i e t y
24 page astat: South Tyrol in figures 2009
Table 18
Hospitals, number and bed utilisation rate - 2008
Public Private Total
Hospitals 7 6 13Beds 1,995 390 2,385per 1,000 inhabitants 4.0 0.8 4.8Mean utilisation of beds (%) 79.6 57.5 77.6
Table 19
Legally induced abortions 2006-2008
2006 2007 2008
Number 564 582 586per 1,000 live birthsSouth Tyrol 104.3 105.8 107.3Province of Trento 260.9 250.5 219.0Italy 235.5 224.8 ….
Abortion rate (a)South Tyrol 4.8 5.0 5.0Province of Trento 11.6 11.0 9.6Italy 9.4 9.1 ….
(a) Abortions per 1,000 women in fertile age (range 15-49 years)
Table 20
Suicides - 2004-2008
2004 2005 2006 2007 2008
Males 43 38 32 32 40Females 17 13 14 6 12Total 60 51 46 38 52
per 100,000 inhabitantsSouth Tyrol 12.6 10.7 9.5 7.8 10.5Province of Trento 7.8 .... 7.9 .... ....Italy .... .... 6.3 .... ....

P o p u l a t i o n a n d s o c i e t y
astat: South Tyrol in figures 2009 page 25
Table 21
Schools: number of classes and enrolled students by teaching language- School year 2008/2009
German Italian Ladin Total
Nursery schoolEnrolments 11,310 3,607 689 15,606Classes 543 186 35 764
Primary schoolEnrolments 20,347 5,965 1,397 27,709Classes 1,724 361 100 2,185
Lower secondary schoolEnrolments 13,059 3,625 802 17,486Classes 656 198 41 895
Upper secondary schoolEnrolments 13,526 5,507 363 19,396Classes 717 356 34 1,107
astat 2009 - lr astat
Chart 4
Students of nursery, primary, lower and upper secondaryschools - school years 1970/71-2008/09
225
200
175
150
125
100
75
50
1980/81 1990/911985/861975/76 1995/9670/71 2000/01 2008/09
Index 1970/71 = 100
Lower secondary schools
Primary schools
Upper secondary schools
Nursery schools
P o p u l a t i o n a n d s o c i e t y
26 page astat: South Tyrol in figures 2009
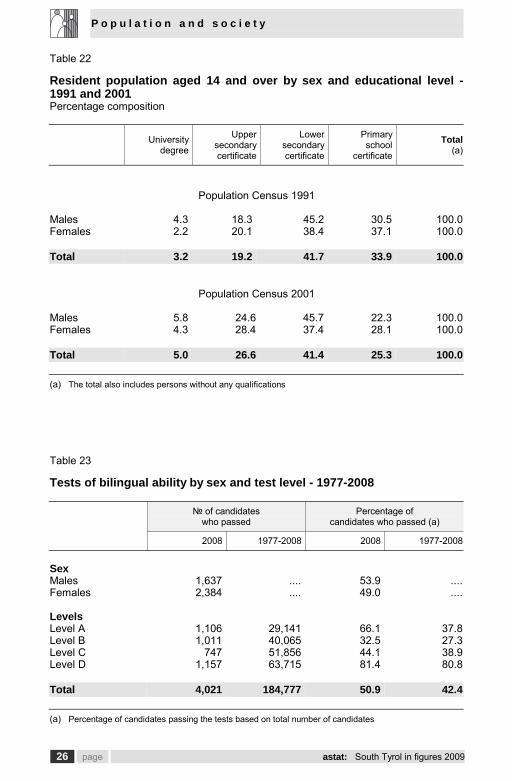
Table 22
Resident population aged 14 and over by sex and educational level -1991 and 2001Percentage composition
Universitydegree
Uppersecondarycertificate
Lowersecondarycertificate
Primaryschool
certificate
Total(a)
Population Census 1991
Males 4.3 18.3 45.2 30.5 100.0Females 2.2 20.1 38.4 37.1 100.0
Total 3.2 19.2 41.7 33.9 100.0
Population Census 2001
Males 5.8 24.6 45.7 22.3 100.0Females 4.3 28.4 37.4 28.1 100.0
Total 5.0 26.6 41.4 25.3 100.0
(a) The total also includes persons without any qualifications
Table 23
Tests of bilingual ability by sex and test level - 1977-2008
№ of candidateswho passed
Percentage ofcandidates who passed (a)
2008 1977-2008 2008 1977-2008
SexMales 1,637 .... 53.9 ....Females 2,384 .... 49.0 ....
LevelsLevel A 1,106 29,141 66.1 37.8Level B 1,011 40,065 32.5 27.3Level C 747 51,856 44.1 38.9Level D 1,157 63,715 81.4 80.8
Total 4,021 184,777 50.9 42.4
(a) Percentage of candidates passing the tests based on total number of candidates
P o p u l a t i o n a n d s o c i e t y
astat: South Tyrol in figures 2009 page 27
Table 24
Museums by type, opening hours and number of visitors - 2008
TYPE OF MUSEUM Number Open daysper year
Payingvisitors
Totalvisitors
Archaeological andprehistoric museums 5 213.4 252,031 267,240Arts and crafts museums 12 162.4 149,847 198,718Science and natural historymuseums 6 274.0 87,687 112,462Ethnographic and agriculturemuseums 13 172.6 87,674 104,325City, town and local museums 11 169.0 61,564 88,644Biographical museums 1 200.0 17,800 23,400Specialised art historymuseums 17 211.0 382,326 429,488Castle museums 8 204.5 141,438 147,396Other type of museum 10 189.8 74,195 115,899
Total 83 193.8 1,254,562 1,487,572
Table 25
Numbers employed by activity sector and sex - 2008
ACTIVITY SECTORS Males Females Total %
Agriculture 11,900 5,600 17,500 7.4Industry 45,900 9,700 55,700 23.7Services 77,000 85,100 162,100 68.9
Total employed persons 134,800 100,500 235,200 100.0of which employees 91,200 78,900 170,100 72.3
Source: Labour Force Sample Survey
P o p u l a t i o n a n d s o c i e t y
28 page astat: South Tyrol in figures 2009
Table 26
Unemployment - 2006-2008Yearly average
2006 2007 2008
Job seekers 6,100 6,100 5,700Males 2,600 2,700 2,600Females 3,500 3,300 3,100
Unemployment rate (a) 2.6 2.6 2.4Males 1.9 2.0 1.9Females 3.6 3.3 3.0
Official unemployed persons 5,479 5,685 6,378Males 2,235 2,316 2,710Females 3,244 3,370 3,668
(a) Ratio of job seekers to total labour force
astat 2009 - lr astat
Chart 5
Numbers employed by activity sector and sex - 2008Yearly average percentage composition
Agriculture Industry Services
57.1%
34.1%
8.8%
9.7%
84.7%
5.6%
134,800 100,500
%
Males Females
P o p u l a t i o n a n d s o c i e t y
astat: South Tyrol in figures 2009 page 29
Table 27
Housing units - Population Census 1981, 1991 and 2001
Occupied housingunits
Other housingunits
Other types ofdwellings
1981 124,029 18,012 3321991 144,661 22,012 2982001 172,031 26,047 444
Population Census 2001
DistrictsVinschgauVal Venosta 11,628 1,289 21
BurggrafenamtBurgraviato 34,158 4,988 100
Überetsch-Südt. UnterlandOltradige-Bassa Atesina 24,266 2,387 34
BozenBolzano 40,964 1,594 103
Salten-SchlernSalto-Sciliar 15,186 5,867 36
EisacktalValle Isarco 15,611 2,425 31
WipptalAlta Valle Isarco 6,229 1,153 25
PustertalVal Pusteria 23,989 6,344 94
Total South Tyrol 172,031 26,047 444
P o p u l a t i o n a n d s o c i e t y
30 page astat: South Tyrol in figures 2009
Table 28
Monthly household consumption by category - 2007
Average monthly expenditure (euro)CATEGORIES OFCONSUMPTION by household by household
member
Percentagecomposition
Food 430.78 171.41 15.0
Non-food consumption 2,434.75 968.80 85.0Tobacco 21.36 8.50 0.7Clothing and footwear 164.74 65.55 5.7Housing 778.54 309.78 27.2Combustibles and electricity 108.06 43.00 3.8Furniture, household objects, utensils,domestic services 175.44 69.81 6.1Medical care 95.73 38.09 3.3Transport and communications 473.81 188.53 16.5Recreation, leisure and education 200.59 79.82 7.0Other commodities and services 416.48 165.72 14.5
Total 2,865.53 1,140.21 100.0
E c o n o m y a n d b u s i n e s s
astat: South Tyrol in figures 2009 page 31
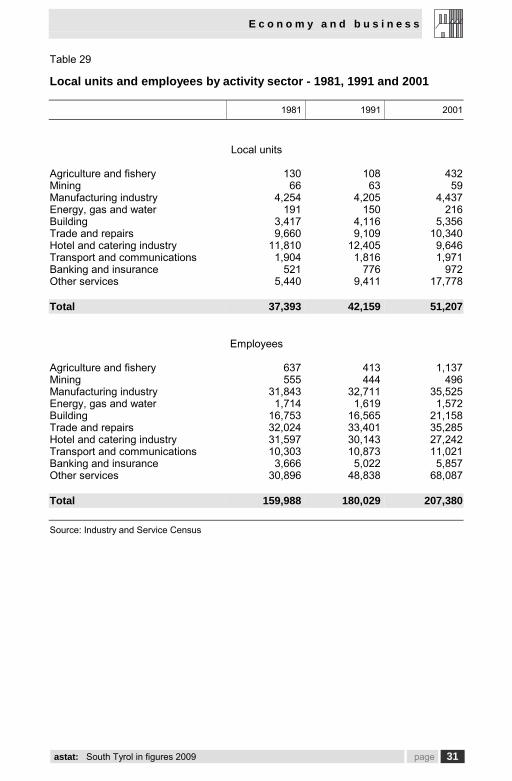
Table 29
Local units and employees by activity sector - 1981, 1991 and 2001
1981 1991 2001
Local units
Agriculture and fishery 130 108 432Mining 66 63 59Manufacturing industry 4,254 4,205 4,437Energy, gas and water 191 150 216Building 3,417 4,116 5,356Trade and repairs 9,660 9,109 10,340Hotel and catering industry 11,810 12,405 9,646Transport and communications 1,904 1,816 1,971Banking and insurance 521 776 972Other services 5,440 9,411 17,778
Total 37,393 42,159 51,207
Employees
Agriculture and fishery 637 413 1,137Mining 555 444 496Manufacturing industry 31,843 32,711 35,525Energy, gas and water 1,714 1,619 1,572Building 16,753 16,565 21,158Trade and repairs 32,024 33,401 35,285Hotel and catering industry 31,597 30,143 27,242Transport and communications 10,303 10,873 11,021Banking and insurance 3,666 5,022 5,857Other services 30,896 48,838 68,087
Total 159,988 180,029 207,380
Source: Industry and Service Census

E c o n o m y a n d b u s i n e s s
32 page astat: South Tyrol in figures 2009
Table 30
Inflation rates in Bozen / Bolzano, Trento and Italy - 2006-2008
2006 2007 2008
Bozen / Bolzano 2.2 2.3 3.8Trento 1.7 0.8 2.6Italy 2.0 1.7 3.2
Percentage variation of the mean consumer price index of households of workers and clerkscompared to the year before
Table 31
Use and resources of goods and services - 2006-2007Values at current prices in millions of euro
AGGREGATES 2006 2007
ResourcesGross domestic product at market prices 15,977.4 16,585.0Net imports 1,929.2 ….
Total 17,906.7 ….
UsesDomestic final use 13,311.7 ....Final use expenditure of:- Households 9,483.4 9,831.6- Non-profit institutions serving households 152.3 ….- General government 3,676.0 ….Gross fixed capital formation 4,539.1 ….Change in inventories 55.9 ….
Total 17,906.7 ….
E c o n o m y a n d b u s i n e s s
astat: South Tyrol in figures 2009 page 33
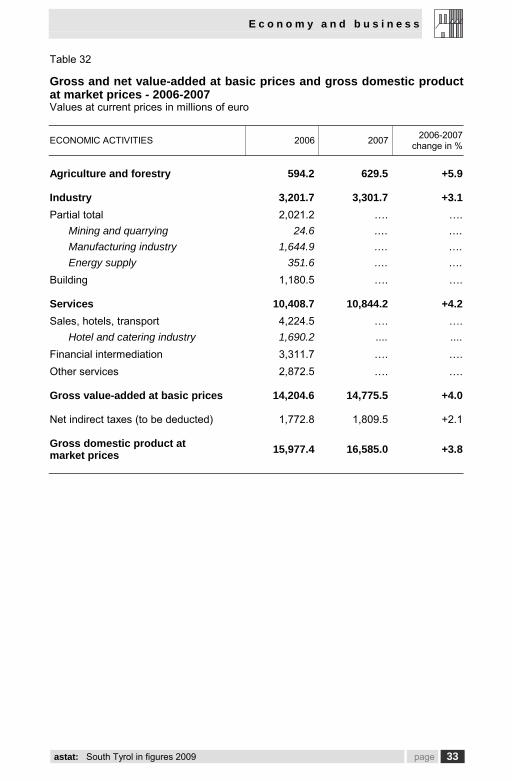
Table 32
Gross and net value-added at basic prices and gross domestic productat market prices - 2006-2007Values at current prices in millions of euro
ECONOMIC ACTIVITIES 2006 2007 2006-2007change in %
Agriculture and forestry 594.2 629.5 +5.9
Industry 3,201.7 3,301.7 +3.1Partial total 2,021.2 …. ….
Mining and quarrying 24.6 …. ….Manufacturing industry 1,644.9 …. ….Energy supply 351.6 …. ….
Building 1,180.5 …. ….
Services 10,408.7 10,844.2 +4.2Sales, hotels, transport 4,224.5 …. ….
Hotel and catering industry 1,690.2 .... ....Financial intermediation 3,311.7 …. ….Other services 2,872.5 …. ….
Gross value-added at basic prices 14,204.6 14,775.5 +4.0
Net indirect taxes (to be deducted) 1,772.8 1,809.5 +2.1
Gross domestic product atmarket prices 15,977.4 16,585.0 +3.8
E c o n o m y a n d b u s i n e s s
34 page astat: South Tyrol in figures 2009
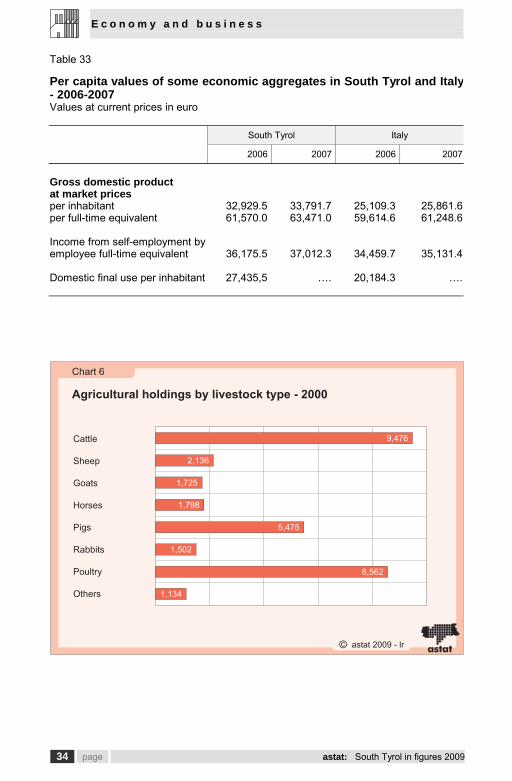
Table 33
Per capita values of some economic aggregates in South Tyrol and Italy- 2006-2007Values at current prices in euro
South Tyrol Italy
2006 2007 2006 2007
Gross domestic productat market pricesper inhabitant 32,929.5 33,791.7 25,109.3 25,861.6per full-time equivalent 61,570.0 63,471.0 59,614.6 61,248.6
Income from self-employment byemployee full-time equivalent 36,175.5 37,012.3 34,459.7 35,131.4
Domestic final use per inhabitant 27,435,5 …. 20,184.3 ….
astat 2009 - lr astat
9,476
2,136
1,725
1,798
5,475
1,502
8,562
1,134
Chart 6
Agricultural holdings by livestock type - 2000
Cattle
Sheep
Goats
Horses
Pigs
Rabbits
Poultry
Others
E c o n o m y a n d b u s i n e s s
astat: South Tyrol in figures 2009 page 35
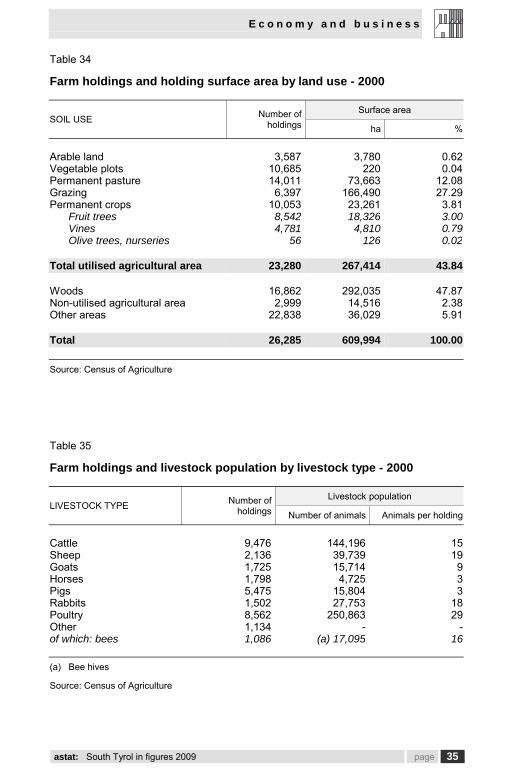
Table 34
Farm holdings and holding surface area by land use - 2000
Surface areaSOIL USE Number of
holdings ha %
Arable land 3,587 3,780 0.62Vegetable plots 10,685 220 0.04Permanent pasture 14,011 73,663 12.08Grazing 6,397 166,490 27.29Permanent crops 10,053 23,261 3.81
Fruit trees 8,542 18,326 3.00Vines 4,781 4,810 0.79Olive trees, nurseries 56 126 0.02
Total utilised agricultural area 23,280 267,414 43.84
Woods 16,862 292,035 47.87Non-utilised agricultural area 2,999 14,516 2.38Other areas 22,838 36,029 5.91
Total 26,285 609,994 100.00
Source: Census of Agriculture
Table 35
Farm holdings and livestock population by livestock type - 2000
Livestock populationLIVESTOCK TYPE Number of
holdings Number of animals Animals per holding
Cattle 9,476 144,196 15Sheep 2,136 39,739 19Goats 1,725 15,714 9Horses 1,798 4,725 3Pigs 5,475 15,804 3Rabbits 1,502 27,753 18Poultry 8,562 250,863 29Other 1,134 - -of which: bees 1,086 (a) 17,095 16
(a) Bee hives
Source: Census of Agriculture
E c o n o m y a n d b u s i n e s s
36 page astat: South Tyrol in figures 2009
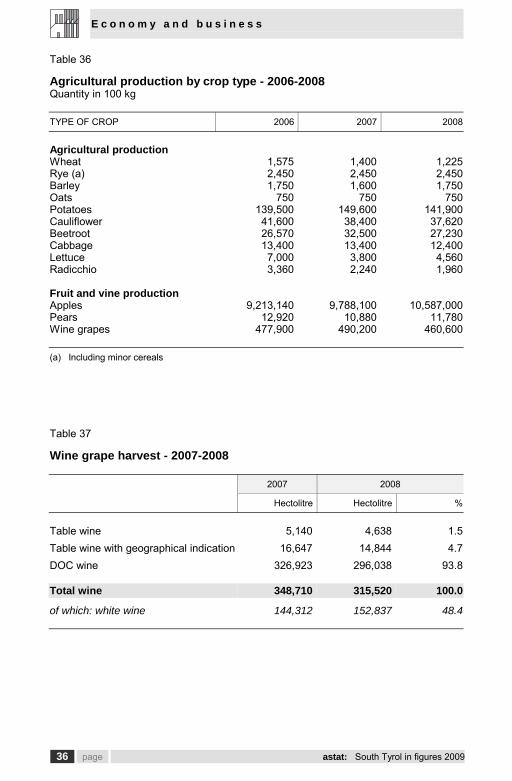
Table 36
Agricultural production by crop type - 2006-2008Quantity in 100 kg
TYPE OF CROP 2006 2007 2008
Agricultural productionWheat 1,575 1,400 1,225Rye (a) 2,450 2,450 2,450Barley 1,750 1,600 1,750Oats 750 750 750Potatoes 139,500 149,600 141,900Cauliflower 41,600 38,400 37,620Beetroot 26,570 32,500 27,230Cabbage 13,400 13,400 12,400Lettuce 7,000 3,800 4,560Radicchio 3,360 2,240 1,960
Fruit and vine productionApples 9,213,140 9,788,100 10,587,000Pears 12,920 10,880 11,780Wine grapes 477,900 490,200 460,600
(a) Including minor cereals
Table 37
Wine grape harvest - 2007-2008
2007 2008
Hectolitre Hectolitre %
Table wine 5,140 4,638 1.5Table wine with geographical indication 16,647 14,844 4.7DOC wine 326,923 296,038 93.8
Total wine 348,710 315,520 100.0
of which: white wine 144,312 152,837 48.4

E c o n o m y a n d b u s i n e s s
astat: South Tyrol in figures 2009 page 37
Table 38
Apple harvest by variety - 2007-2008
2007 2008VARIETIES
Production in 100 kg Production in 100 kg %
ApplesGolden Delicious 4,194,836 4,555,494 43.0Gala 1,524,783 1,691,391 16.0Red Delicious 1,064,457 1,189,119 11.2Braeburn 867,308 842,668 8.0Granny Smith 570,646 621,997 5.9Fuji 522,943 639,081 6.0Cripps Pink 283,892 289,441 2.7Morgenduft 236,705 235,279 2.2Jonagold 215,135 177,502 1.7Winesap 65,880 102,708 1.0Idared 50,302 45,075 0.4Jonagored 47,170 43,799 0.4Other 144,083 156,462 1.5
Total 9,788,140 10,587,016 100.0
astat 2009 - lr astat
Chart 7
Apple harvest - 2008Percentage composition
%
Red Delicious
Gala
Golden Delicious
Braeburn
11.2
16.0
43.0
21.88.0Apples
Others
1,058,702 t
E c o n o m y a n d b u s i n e s s
38 page astat: South Tyrol in figures 2009
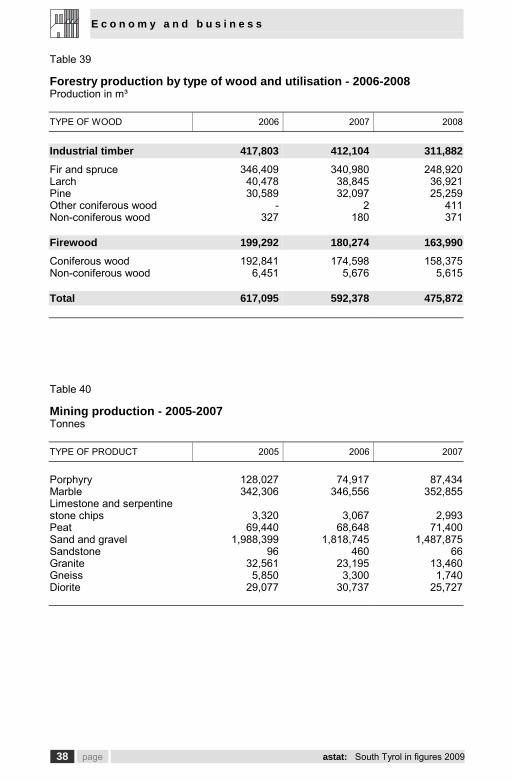
Table 39
Forestry production by type of wood and utilisation - 2006-2008Production in m³
TYPE OF WOOD 2006 2007 2008
Industrial timber 417,803 412,104 311,882Fir and spruce 346,409 340,980 248,920Larch 40,478 38,845 36,921Pine 30,589 32,097 25,259Other coniferous wood - 2 411Non-coniferous wood 327 180 371
Firewood 199,292 180,274 163,990Coniferous wood 192,841 174,598 158,375Non-coniferous wood 6,451 5,676 5,615
Total 617,095 592,378 475,872
Table 40
Mining production - 2005-2007Tonnes
TYPE OF PRODUCT 2005 2006 2007
Porphyry 128,027 74,917 87,434Marble 342,306 346,556 352,855Limestone and serpentinestone chips 3,320 3,067 2,993Peat 69,440 68,648 71,400Sand and gravel 1,988,399 1,818,745 1,487,875Sandstone 96 460 66Granite 32,561 23,195 13,460Gneiss 5,850 3,300 1,740Diorite 29,077 30,737 25,727
E c o n o m y a n d b u s i n e s s
astat: South Tyrol in figures 2009 page 39
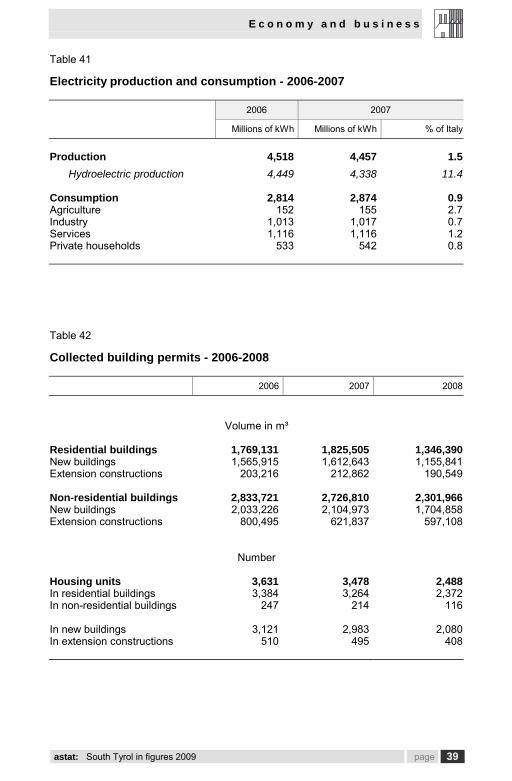
Table 41
Electricity production and consumption - 2006-2007
2006 2007
Millions of kWh Millions of kWh % of Italy
Production 4,518 4,457 1.5Hydroelectric production 4,449 4,338 11.4
Consumption 2,814 2,874 0.9Agriculture 152 155 2.7Industry 1,013 1,017 0.7Services 1,116 1,116 1.2Private households 533 542 0.8
Table 42
Collected building permits - 2006-2008
2006 2007 2008
Volume in m³
Residential buildings 1,769,131 1,825,505 1,346,390New buildings 1,565,915 1,612,643 1,155,841Extension constructions 203,216 212,862 190,549
Non-residential buildings 2,833,721 2,726,810 2,301,966New buildings 2,033,226 2,104,973 1,704,858Extension constructions 800,495 621,837 597,108
Number
Housing units 3,631 3,478 2,488In residential buildings 3,384 3,264 2,372In non-residential buildings 247 214 116
In new buildings 3,121 2,983 2,080In extension constructions 510 495 408
E c o n o m y a n d b u s i n e s s
40 page astat: South Tyrol in figures 2009
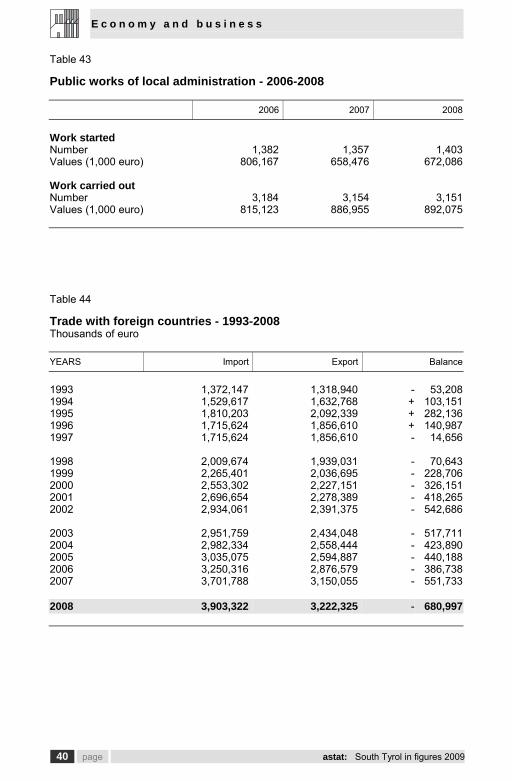
Table 43
Public works of local administration - 2006-2008
2006 2007 2008
Work startedNumber 1,382 1,357 1,403Values (1,000 euro) 806,167 658,476 672,086
Work carried outNumber 3,184 3,154 3,151Values (1,000 euro) 815,123 886,955 892,075
Table 44
Trade with foreign countries - 1993-2008Thousands of euro
YEARS Import Export Balance
1993 1,372,147 1,318,940 - 53,2081994 1,529,617 1,632,768 + 103,1511995 1,810,203 2,092,339 + 282,1361996 1,715,624 1,856,610 + 140,9871997 1,715,624 1,856,610 - 14,656
1998 2,009,674 1,939,031 - 70,6431999 2,265,401 2,036,695 - 228,7062000 2,553,302 2,227,151 - 326,1512001 2,696,654 2,278,389 - 418,2652002 2,934,061 2,391,375 - 542,686
2003 2,951,759 2,434,048 - 517,7112004 2,982,334 2,558,444 - 423,8902005 3,035,075 2,594,887 - 440,1882006 3,250,316 2,876,579 - 386,7382007 3,701,788 3,150,055 - 551,733
2008 3,903,322 3,222,325 - 680,997
E c o n o m y a n d b u s i n e s s
astat: South Tyrol in figures 2009 page 41
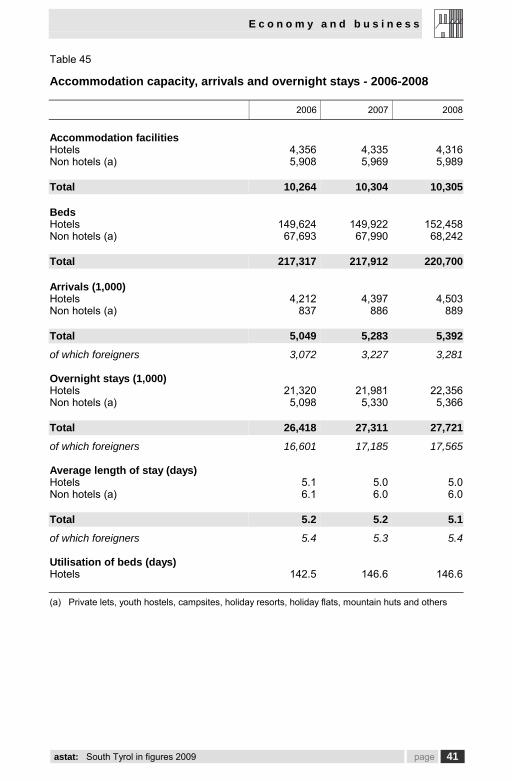
Table 45
Accommodation capacity, arrivals and overnight stays - 2006-2008
2006 2007 2008
Accommodation facilitiesHotels 4,356 4,335 4,316Non hotels (a) 5,908 5,969 5,989
Total 10,264 10,304 10,305
BedsHotels 149,624 149,922 152,458Non hotels (a) 67,693 67,990 68,242
Total 217,317 217,912 220,700
Arrivals (1,000)Hotels 4,212 4,397 4,503Non hotels (a) 837 886 889
Total 5,049 5,283 5,392
of which foreigners 3,072 3,227 3,281
Overnight stays (1,000)Hotels 21,320 21,981 22,356Non hotels (a) 5,098 5,330 5,366
Total 26,418 27,311 27,721
of which foreigners 16,601 17,185 17,565
Average length of stay (days)Hotels 5.1 5.0 5.0Non hotels (a) 6.1 6.0 6.0
Total 5.2 5.2 5.1
of which foreigners 5.4 5.3 5.4
Utilisation of beds (days)Hotels 142.5 146.6 146.6
(a) Private lets, youth hostels, campsites, holiday resorts, holiday flats, mountain huts and others

E c o n o m y a n d b u s i n e s s
42 page astat: South Tyrol in figures 2009
Table 46
Traffic network - 2008
RAILWAYS AND ROADS Length in km
Railways 287
Roads 8,407Motorways 133State roads 788Provincial roads 1,274Municipal roads 2,698Rural roads 3,514
Table 47
Vehicles liable to road tax - 2008
Per 100 inhabitantsTYPE OF VEHICLE Number
South Tyrol Province of Trento Italy
Cars 256,307 51,4 56.5 ….Lorries 35,498 7,1 8.5 ….Other trucks 4,133 0,8 1.8 ….Motorcycles 38,301 7,7 8.8 ….Trailers 9,761 2,0 2.2 ….
E c o n o m y a n d b u s i n e s s
astat: South Tyrol in figures 2009 page 43
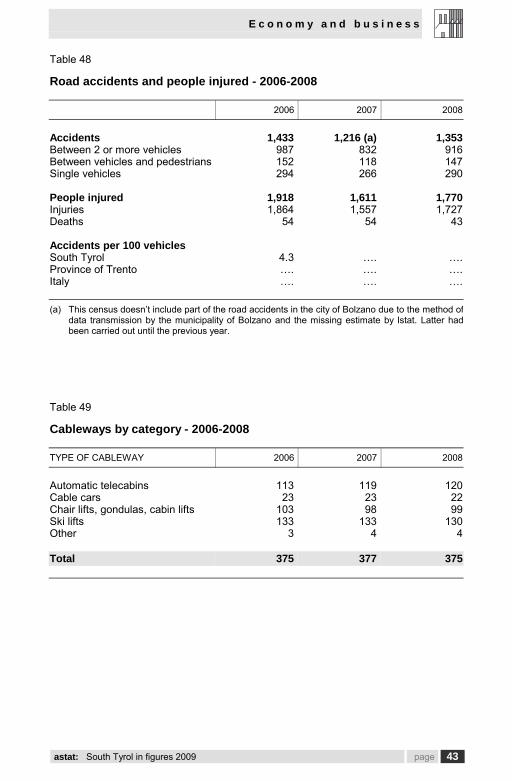
Table 48
Road accidents and people injured - 2006-2008
2006 2007 2008
Accidents 1,433 1,216 (a) 1,353Between 2 or more vehicles 987 832 916Between vehicles and pedestrians 152 118 147Single vehicles 294 266 290
People injured 1,918 1,611 1,770Injuries 1,864 1,557 1,727Deaths 54 54 43
Accidents per 100 vehiclesSouth Tyrol 4.3 …. ….Province of Trento …. …. ….Italy …. …. ….
(a) This census doesn’t include part of the road accidents in the city of Bolzano due to the method ofdata transmission by the municipality of Bolzano and the missing estimate by Istat. Latter hadbeen carried out until the previous year.
Table 49
Cableways by category - 2006-2008
TYPE OF CABLEWAY 2006 2007 2008
Automatic telecabins 113 119 120Cable cars 23 23 22Chair lifts, gondulas, cabin lifts 103 98 99Ski lifts 133 133 130Other 3 4 4
Total 375 377 375
E c o n o m y a n d b u s i n e s s
44 page astat: South Tyrol in figures 2009
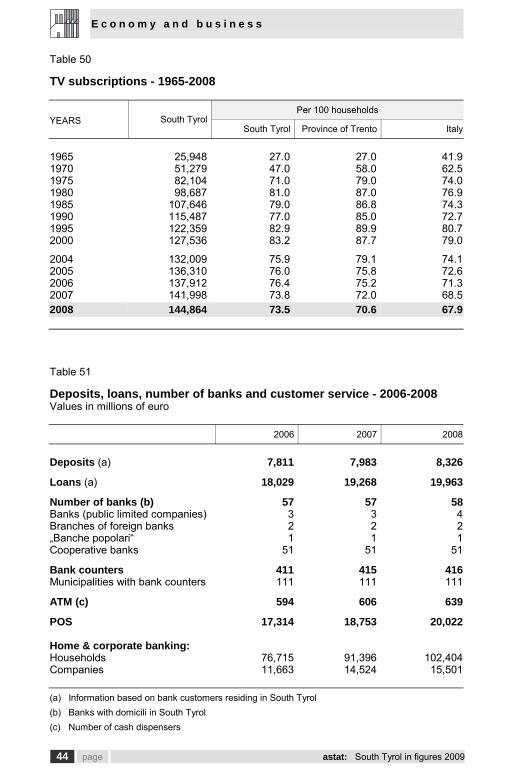
Table 50
TV subscriptions - 1965-2008
Per 100 householdsYEARS South Tyrol
South Tyrol Province of Trento Italy
1965 25,948 27.0 27.0 41.91970 51,279 47.0 58.0 62.51975 82,104 71.0 79.0 74.01980 98,687 81.0 87.0 76.91985 107,646 79.0 86.8 74.31990 115,487 77.0 85.0 72.71995 122,359 82.9 89.9 80.72000 127,536 83.2 87.7 79.0
2004 132,009 75.9 79.1 74.12005 136,310 76.0 75.8 72.62006 137,912 76.4 75.2 71.32007 141,998 73.8 72.0 68.52008 144,864 73.5 70.6 67.9
Table 51
Deposits, loans, number of banks and customer service - 2006-2008Values in millions of euro
2006 2007 2008
Deposits (a) 7,811 7,983 8,326
Loans (a) 18,029 19,268 19,963
Number of banks (b) 57 57 58Banks (public limited companies) 3 3 4Branches of foreign banks 2 2 2„Banche popolari“ 1 1 1Cooperative banks 51 51 51
Bank counters 411 415 416Municipalities with bank counters 111 111 111
ATM (c) 594 606 639
POS 17,314 18,753 20,022
Home & corporate banking:Households 76,715 91,396 102,404Companies 11,663 14,524 15,501
(a) Information based on bank customers residing in South Tyrol(b) Banks with domicili in South Tyrol(c) Number of cash dispensers
P u b l i c a d m i n i s t r a t i o n a n d j u s t i c e
astat: South Tyrol in figures 2009 page 45
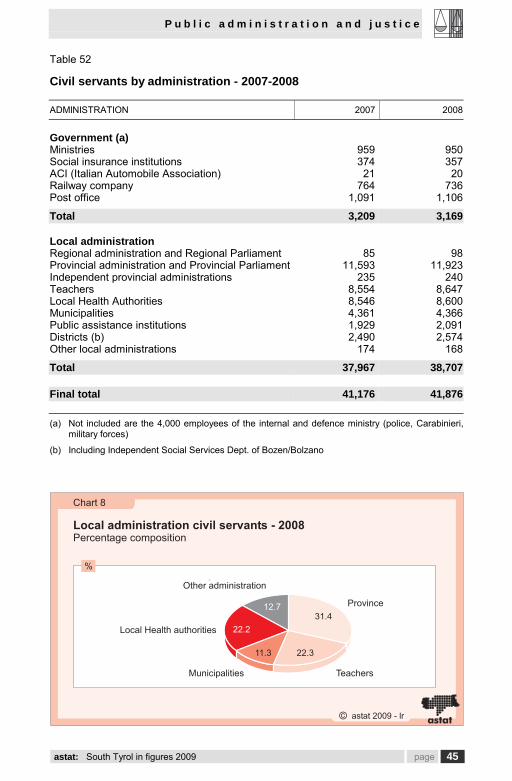
Table 52
Civil servants by administration - 2007-2008
ADMINISTRATION 2007 2008
Government (a)Ministries 959 950Social insurance institutions 374 357ACI (Italian Automobile Association) 21 20Railway company 764 736Post office 1,091 1,106
Total 3,209 3,169
Local administrationRegional administration and Regional Parliament 85 98Provincial administration and Provincial Parliament 11,593 11,923Independent provincial administrations 235 240Teachers 8,554 8,647Local Health Authorities 8,546 8,600Municipalities 4,361 4,366Public assistance institutions 1,929 2,091Districts (b) 2,490 2,574Other local administrations 174 168
Total 37,967 38,707
Final total 41,176 41,876
(a) Not included are the 4,000 employees of the internal and defence ministry (police, Carabinieri,military forces)
(b) Including Independent Social Services Dept. of Bozen/Bolzano
astat 2009 - lr astat
Chart 8
Local administration civil servants - 2008Percentage composition
Province
TeachersMunicipalities
Other administration
Local Health authorities
%
22.2
12.731.4
22.311.3
P u b l i c a d m i n i s t r a t i o n a n d j u s t i c e
46 page astat: South Tyrol in figures 2009
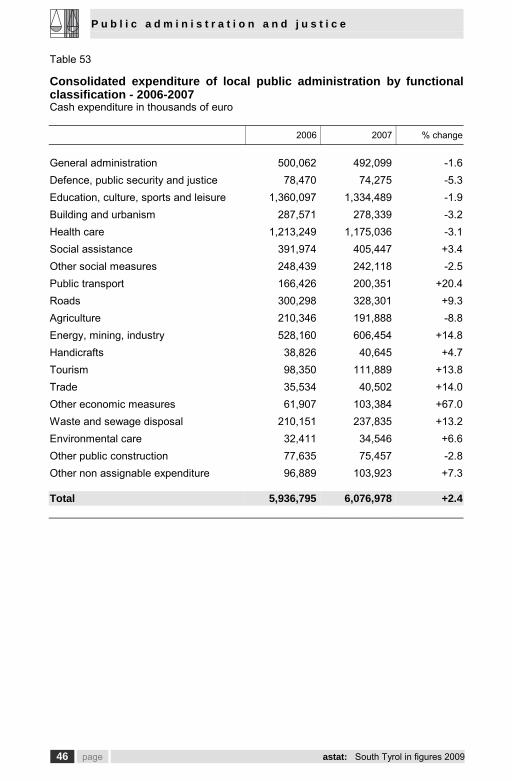
Table 53
Consolidated expenditure of local public administration by functionalclassification - 2006-2007Cash expenditure in thousands of euro
2006 2007 % change
General administration 500,062 492,099 -1.6Defence, public security and justice 78,470 74,275 -5.3Education, culture, sports and leisure 1,360,097 1,334,489 -1.9Building and urbanism 287,571 278,339 -3.2Health care 1,213,249 1,175,036 -3.1Social assistance 391,974 405,447 +3.4Other social measures 248,439 242,118 -2.5Public transport 166,426 200,351 +20.4Roads 300,298 328,301 +9.3Agriculture 210,346 191,888 -8.8Energy, mining, industry 528,160 606,454 +14.8Handicrafts 38,826 40,645 +4.7Tourism 98,350 111,889 +13.8Trade 35,534 40,502 +14.0Other economic measures 61,907 103,384 +67.0Waste and sewage disposal 210,151 237,835 +13.2Environmental care 32,411 34,546 +6.6Other public construction 77,635 75,457 -2.8Other non assignable expenditure 96,889 103,923 +7.3
Total 5,936,795 6,076,978 +2.4
P u b l i c a d m i n i s t r a t i o n a n d j u s t i c e
astat: South Tyrol in figures 2009 page 47
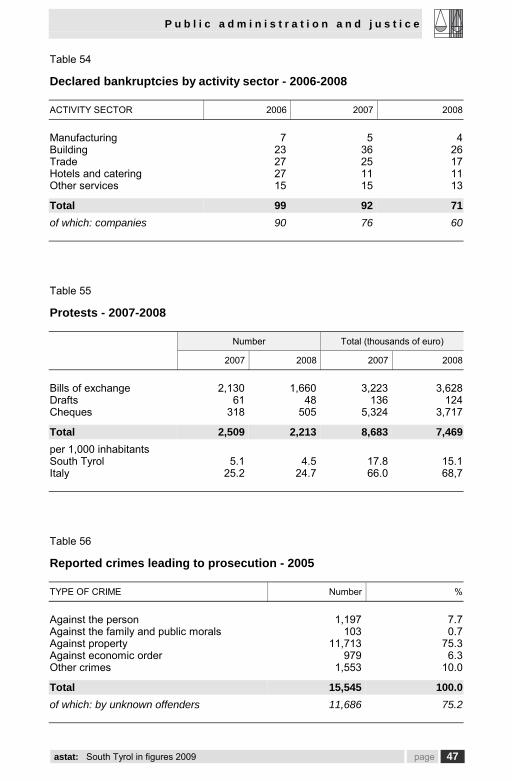
Table 54
Declared bankruptcies by activity sector - 2006-2008
ACTIVITY SECTOR 2006 2007 2008
Manufacturing 7 5 4Building 23 36 26Trade 27 25 17Hotels and catering 27 11 11Other services 15 15 13
Total 99 92 71of which: companies 90 76 60
Table 55
Protests - 2007-2008
Number Total (thousands of euro)
2007 2008 2007 2008
Bills of exchange 2,130 1,660 3,223 3,628Drafts 61 48 136 124Cheques 318 505 5,324 3,717
Total 2,509 2,213 8,683 7,469per 1,000 inhabitantsSouth Tyrol 5.1 4.5 17.8 15.1Italy 25.2 24.7 66.0 68,7
Table 56
Reported crimes leading to prosecution - 2005
TYPE OF CRIME Number %
Against the person 1,197 7.7Against the family and public morals 103 0.7Against property 11,713 75.3Against economic order 979 6.3Other crimes 1,553 10.0
Total 15,545 100.0of which: by unknown offenders 11,686 75.2
A S T A T p u b l i c a t i o n s l i s t
48 page astat: South Tyrol in figures 2009
S t a t i s t i s c h e s J a h r b u c h f ü r S ü d t i r o lA n n u a r i o s t a t i s t i c o d e l l a P r o v i n c i a d i B o l z a n o
2006 bilingual edition, 548 pages, 20062007 bilingual edition, 552 pages, 20072008 bilingual edition, 556 pages, 2008
S ü d t i r o l n z i f r e s2006 bilingual and ladin edition, 48 pages, 20062007 bilingual and ladin edition, 48 pages, 20072008 bilingual and ladin edition, 48 pages, 20082009 bilingual and ladin edition, 48 pages, 2009
I n Z a h l e nI n c i f r e
Nr. 1 Jugend in Zahlen 2006Giovani in cifre 2006bilingual edition, 48 pages, 2008
Nr. 2 Gender in Zahlen 2007Gender in cifre 2007bilingual edition, 52 pages, 2008
Nr. 3 Haushalte in Zahlen 2007-2008Famiglie in cifre 2007-2008bilingual edition, 44 pages, 2009
A S T A T - S c h r i f t e n r e i h eC o l l a n a A S T A T
Nr. 145 Die voraussichtliche Entwicklung der Schülerzahlen in Südtirol - 2000-2020Previsione sull’andamento scolastico in provincia di Bolzano - 2000-2020bilingual edition, 70 pages, 2009
Nr. 146 Mobilität und Verkehr in Südtirol - 2007Mobilità e traffico in provincia di Bolzano - 2007bilingual edition, 140 pages, 2009
Nr. 147 Tourismus in Südtirol - Tourismusjahr 2007/08Turismo in Alto Adige - Anno turistico 2007/08bilingual edition, 142 pages, 2009
Nr. 148 Das Tourismus-Satellitenkonto für Südtirol - 2005Il conto satellite del turismo per l’Alto Adige - 2005bilingual edition, 74 pages, 2009
Nr. 149 Renten in Südtirol - 2006Trattamenti pensionistici in Alto Adige - 2006bilingual edition, 74 pages, 2009
Nr. 150 Bedienstete der Landesverwaltung - 1997-2007Dipendenti dell’amministrazione provinciale - 1997-2007bilingual edition, 76 pages, 2009
Nr. 151 Zukunftsperspektiven der Jungakademiker in Südtirol - 2007Prospettive die giovani laureati in Alto Adige - 2007bilingual edition, 88 pages, 2009
Nr. 152 Erwerbstätigkeit in Südtirol - 2008Occupazione in provincia di Bolzano - 2008bilingual edition, 236 pages, 2009
S t a t i s t i k s a m m l u n g 2 0 0 9 ( D V D )R a c c o l t a s t a t i s t i c a 2 0 0 9 ( D V D )
Related Documents