Prepared for South Holland, South Kesteven and Rutland Outline Water Cycle Study Technical Report Final January 2011

Welcome message from author
This document is posted to help you gain knowledge. Please leave a comment to let me know what you think about it! Share it to your friends and learn new things together.
Transcript
Prepared for
South Holland, South Kesteven and Rutland Outline Water Cycle Study
Technical Report
Final
January 2011
South Holland, South Kestevern and Rutland Outline Water Cycle Study
Technical Report
Scott Wilson Scott House Alençon Link Basingstoke Hampshire
RG21 7PP
Tel 01256 310200 Fax 01256 310201 www.scottwilson.com
This document has been prepared in accordance with the scope of Scott Wilson's appointment with its client and is subject to the terms of that appointment. It is addressed to and for the sole and confidential use and reliance of Scott Wilson's client. Scott Wilson accepts no liability for any use of this document other than by its client and only for the purposes for which it was prepared and provided. No person other than the client may copy (in whole or in part) use or rely on the contents of this document, without the prior written permission of the Company Secretary of Scott Wilson Ltd. Any advice, opinions, or recommendations within this document should be read and relied upon only in the context of the document as a whole. The contents of this document do not provide legal or tax advice or opinion. © Scott Wilson Ltd 2010
Revision Schedule Technical Report January 2011
Rev Date Details Prepared by Reviewed by Approved by
01 September 2010
V1 Clare Postlethwaite Senior Consultant
Carl Pelling Principal Consultant
Carl Pelling Principal Consultant
Helen Judd Assistant Hydrologist
November 2010
v2 Clare Postlethwaite Senior Consultant
Carl Pelling Principal Consultant
Carl Pelling Principal Consultant
January 2011 Final Clare Postlethwaite Senior Consultant
Carl Pelling Principal Consultant
Carl Pelling Principal Consultant
South Holland, South Kestevern and Rutland Outline Water Cycle Study
Technical Report
Table of Contents
Executive Summary................................................................................... 5
1 Acronyms and abbreviations ......................................................... 7
2 Introduction ..................................................................................... 9
2.1 Growth in South Holland, South Kesteven and Rutland .................................................. 9
2.2 Study History .................................................................................................................. 9
2.3 Water Cycle Study Reporting........................................................................................ 10
2.4 Study Contributors........................................................................................................ 11
2.5 Outline Study – Aims and Objectives ............................................................................ 12
2.6 Study Area.................................................................................................................... 12
2.7 Key Constraints Assessment ........................................................................................ 14
3 Policy and Supporting Information.............................................. 17
3.1 Legislation and Policy ................................................................................................... 17
3.2 Guidance ...................................................................................................................... 23
3.3 Supporting Documents ................................................................................................. 23
3.4 Data Summary.............................................................................................................. 24
4 Proposed Growth .......................................................................... 25
4.1 Introduction................................................................................................................... 25
4.2 South Holland ............................................................................................................... 25
4.3 South Kesteven ............................................................................................................ 28
4.4 Rutland ......................................................................................................................... 29
5 Wastewater Strategy ..................................................................... 32
5.1 Introduction................................................................................................................... 32
5.2 Baseline........................................................................................................................ 32
5.3 Capacity Assessment Methodology Overview .............................................................. 36
5.4 Wastewater Treatment Capacity Assessment............................................................... 38
5.5 Environmental and Ecological Impact ........................................................................... 44
5.6 Wastewater Network Capacity Assessment.................................................................. 49
5.7 Conclusions .................................................................................................................. 62
6 Water Supply Strategy .................................................................. 65
6.1 Water Resources in the Study Area.............................................................................. 65
6.2 Water Demand Calculations ......................................................................................... 68
6.3 Water Efficiency............................................................................................................ 68
6.4 Water Supply Infrastructure .......................................................................................... 91
South Holland, South Kestevern and Rutland Outline Water Cycle Study
Technical Report
6.5 Environmental and Ecological Impact ........................................................................... 92
6.6 Conclusions .................................................................................................................. 94
7 Flood Risk Management ............................................................... 95
7.1 Flood Risk to Development........................................................................................... 95
7.2 Flood Risk from Development – Surface Water Management..................................... 107
7.3 Flood Risk from Development - Increased WwTW Discharges ................................... 110
7.4 Climate Change.......................................................................................................... 111
7.5 Conclusion.................................................................................................................. 111
8 Growth Locations Assessment .................................................. 112
8.1 Introduction................................................................................................................. 112
8.2 South Holland District ................................................................................................. 114
8.3 South Kesteven District .............................................................................................. 122
8.4 Rutland County........................................................................................................... 131
9 Outline Policy Guidance ............................................................. 137
9.1 Introduction................................................................................................................. 137
9.2 Water Cycle Policy...................................................................................................... 137
10 Developer checklist..................................................................... 140
11 Recommendations for Detailed Study....................................... 144
12 Appendices.................................................................................. 145
12.1 Appendix A - Stakeholder Communications Strategy.................................................. 146
12.2 Appendix B – Data Request........................................................................................ 147
Technical Report January 2011 5
Executive Summary
The administrative authorities of South Holland, South Kesteven and Rutland are expected to experience
an increase in housing and employment provision over the period up to 2026. The recently revoked
Regional Spatial Strategy (RSS) for the East Midlands1 (the East Midlands Regional Plan or EMRP) states
that the total housing provision from 2006 to 2026 for South Holland is 7,400, for South Kesteven is 13,600
and for Rutland is 3,000.
The overall aim of the project is to identify a clear programme of required water services infrastructure and
its implementation to support the delivery of sustainable growth up to 2026.The WCS tests the impact of
the proposed development on the water cycle, defines the existing baseline capacity for growth without the
need for new infrastructure and determine where new infrastructure or further investigation is required to
overcome constraints that may limit the required growth levels in the study area as a result of new water
services infrastructure.
The objectives of the WCS are to ensure:
• water services infrastructure is provided in a timely manner to support the housing,
employment and related services to support the growth planned for the region to 2026;
• there is a strategic programme for delivery of key infrastructure;
• there is a strategic approach to the management and usage of water;
• that development is only permitted where environmental capacity exists;
• that impacts on the study area from all relevant catchments (including groundwater) and
their growth are assessed in order to provide a holistic picture of water management in
South Holland, South Kesteven and Rutland; and
• that development is located away from areas at highest flood risk.
The assessment was carried out on the 5 key ‘water cycle’ topic areas:
• water resources;
• wastewater treatment and transmission;
• ecology;
• flood risk; and
• surface water management and SuDS potential.
The approach to the study was to collect baseline data from various stakeholders, to analyse the data and
relate it to the proposed growth areas. Constraints matrices were drawn up to identify the constraints to
growth and the relative significance of these as a barrier to growth. The key findings of the study, in
relation to the existing situation, were as follows:
For water resources, both Anglian Water and Severn Trent Waters’ Water Resource Management Plans
forecast supply to demand deficits by the end of the planning period, although both companies have
measures in place to deal with these deficits. However, water efficiency measures should still be
incorporated into all new development to reduce water use where possible.
1 http://www.gos.gov.uk/497296/docs/229865/East_Midlands_Regional_Plan2.pdf
Technical Report January 2011 6
For wastewater treatment and transmission, there are twelve wastewater treatment works that currently do
not have current capacity to accept and treat any further wastewater from growth without requiring an
increase in the volumes that they are consented to discharge. Any growth in these areas will require the
consent parameters of the discharge to be reviewed and altered. It was not possible to carry out a full
assessment of the capacity of the sewer network without knowledge of exact growth locations; this was a
recommendation for a Stage 2 study.
For ecology, no effects on designated conservation sites are anticipated from the proposed growth.
There are significant areas at flood risk throughout the study area and where possible development should
be steered away from these and into Flood Zone 1, in accordance with the flood zone mapping produced
for the SFRAs that each of the three Councils has commissioned.
The geology of some areas, particularly to the east, is not suitable for infiltration SuDS and discussions
must be held with the relevant Internal Drainage Board(s) to ensure that run-off rates from new
development are appropriate and will not exacerbate flooding elsewhere.
Recommendations for a Stage 2 Detailed study included:
a) It is essential that, if available, preferred development sites are agreed for all authorities and
provided to inform a more detailed assessment in Stage 2;
b) A preferred growth scenario should be selected to allow preferred solutions to be developed
and tested via the sustainability assessment;
c) Options for increased wastewater treatment capacity at twelve WwTW will be required to
allow growth to proceed;
d) Where discharge consent volumes will be increased, an assessment of impact on flood risk
of receiving watercourses should be undertaken;
e) Wastewater network modelling at several locations is required to determine when and where
new developer funded mains will be required;
f) More detailed SuDS requirements should be provided for preferred development sites when
known, including deriving values for permitted runoff rates and options for linkage with green
infrastructure; and
g) Infrastructure phasing timelines should be produced for each growth area to determine
impact of infrastructure and mitigation provision on housing delivery.
Technical Report January 2011 7
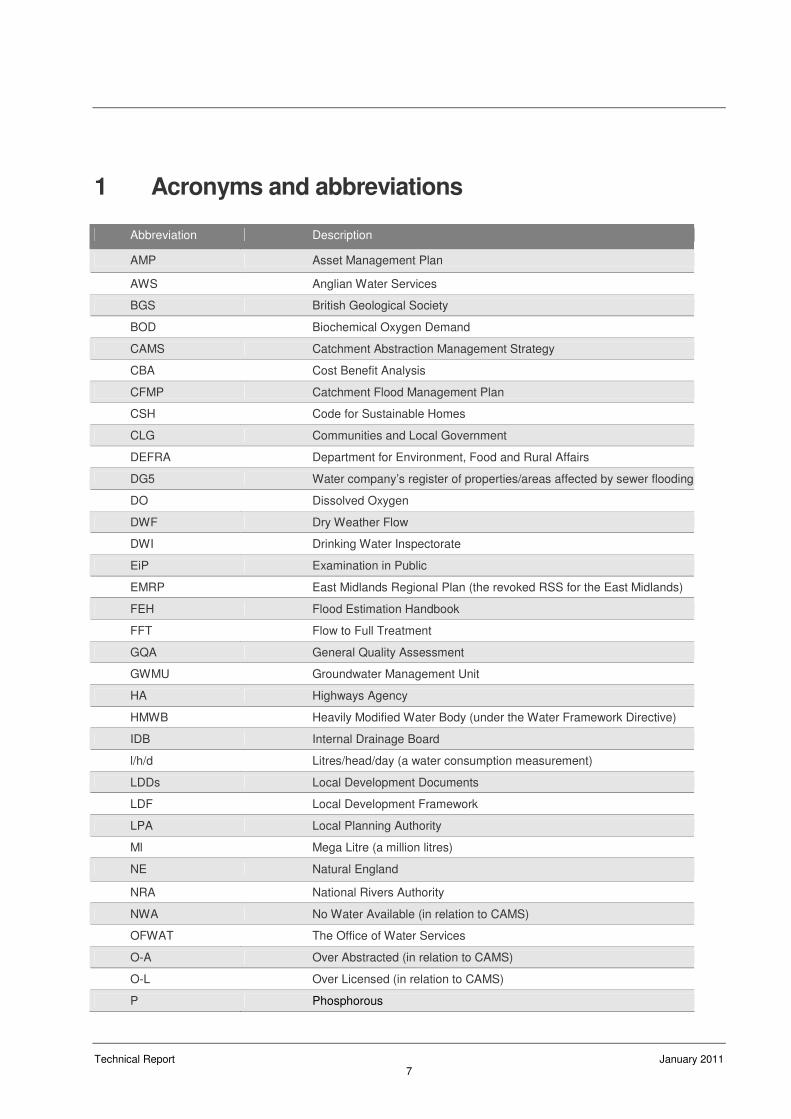
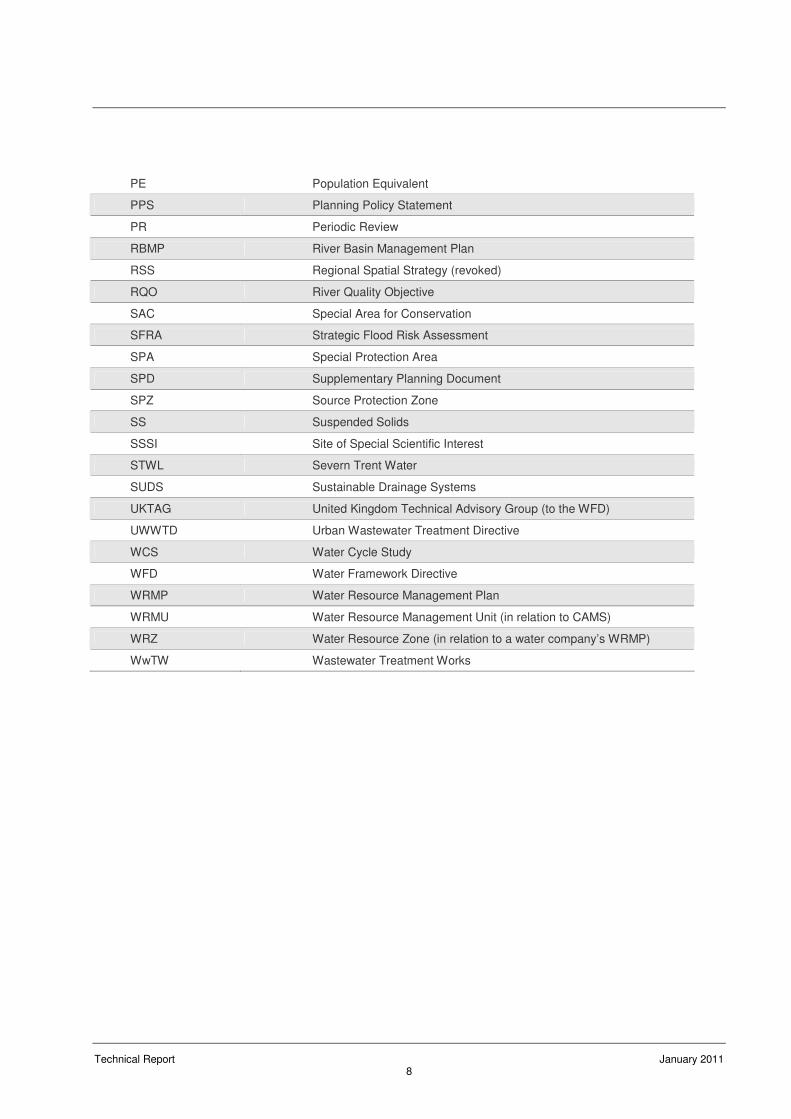
1 Acronyms and abbreviations
Abbreviation Description
AMP Asset Management Plan
AWS Anglian Water Services
BGS British Geological Society
BOD Biochemical Oxygen Demand
CAMS Catchment Abstraction Management Strategy
CBA Cost Benefit Analysis
CFMP Catchment Flood Management Plan
CSH Code for Sustainable Homes
CLG Communities and Local Government
DEFRA Department for Environment, Food and Rural Affairs
DG5 Water company’s register of properties/areas affected by sewer flooding
DO Dissolved Oxygen
DWF Dry Weather Flow
DWI Drinking Water Inspectorate
EiP Examination in Public
EMRP East Midlands Regional Plan (the revoked RSS for the East Midlands)
FEH Flood Estimation Handbook
FFT Flow to Full Treatment
GQA General Quality Assessment
GWMU Groundwater Management Unit
HA Highways Agency
HMWB Heavily Modified Water Body (under the Water Framework Directive)
IDB Internal Drainage Board
l/h/d Litres/head/day (a water consumption measurement)
LDDs Local Development Documents
LDF Local Development Framework
LPA Local Planning Authority
Ml Mega Litre (a million litres)
NE Natural England
NRA National Rivers Authority
NWA No Water Available (in relation to CAMS)
OFWAT The Office of Water Services
O-A Over Abstracted (in relation to CAMS)
O-L Over Licensed (in relation to CAMS)
P Phosphorous
Technical Report January 2011 8
PE Population Equivalent
PPS Planning Policy Statement
PR Periodic Review
RBMP River Basin Management Plan
RSS Regional Spatial Strategy (revoked)
RQO River Quality Objective
SAC Special Area for Conservation
SFRA Strategic Flood Risk Assessment
SPA Special Protection Area
SPD Supplementary Planning Document
SPZ Source Protection Zone
SS Suspended Solids
SSSI Site of Special Scientific Interest
STWL Severn Trent Water
SUDS Sustainable Drainage Systems
UKTAG United Kingdom Technical Advisory Group (to the WFD)
UWWTD Urban Wastewater Treatment Directive
WCS Water Cycle Study
WFD Water Framework Directive
WRMP Water Resource Management Plan
WRMU Water Resource Management Unit (in relation to CAMS)
WRZ Water Resource Zone (in relation to a water company’s WRMP)
WwTW Wastewater Treatment Works
Technical Report January 2011 9
2 Introduction
2.1 Growth in South Holland, South Kesteven and Rutland
The administrative authorities of South Holland, South Kesteven and Rutland are expected to
experience an increase in housing and employment provision over the period up to 2026. The
recently revoked Regional Spatial Strategy (RSS) for the East Midlands2 (the East Midlands
Regional Plan or EMRP) states that the total housing provision from 2006 to 2026 for South
Holland is 7,400, for South Kesteven is 13,600 and for Rutland is 3,000.
As of the 6th July 2010, the Secretary of State for Communities and Local Government
announced the revocation of Regional Strategies with immediate effect3. Regional Strategies
are being revoked under s79(6) of the Local Democracy Economic Development and
Construction Act 2009 and will thus no longer form part of the development plan for the
purposes of s38(6) of the Planning and Compulsory Purchase Act 2004. However, in the
absence of a replacement for the RSS, the previous housing figures will be used for the
purposes of this study for the South Holland District.
This growth represents a challenge to all three districts in ensuring that both the water
environment and water services infrastructure has the capacity to sustain this level of proposed
growth and development.
It is therefore key that the South Holland, South Kesteven and Rutland Water Cycle Study
(WCS) identifies any constraints on housing and employment growth planned for the study
area up to 2026 that may be imposed by the water cycle study and how these can be resolved
i.e. by ensuring that appropriate water infrastructure is provided to support the proposed
development. Furthermore, it should provide a strategic approach to the management and use
of water which ensures that the sustainability of the water environment in the region is not
compromised.
2.2 Study History
The South Holland, South Kesteven and Rutland Outline WCS is being undertaken in two
stages, as recommended by the Environment Agency guidance for Water Cycle Studies4. The
WCS stages are shown in Figure 2-1 below.
2 http://www.gos.gov.uk/497296/docs/229865/East_Midlands_Regional_Plan2.pdf
3 http://www.communities.gov.uk/documents/planningandbuilding/pdf/1631904.pdf
4 Environment Agency (2009), Water Cycle Study Guidance
Technical Report January 2011 10
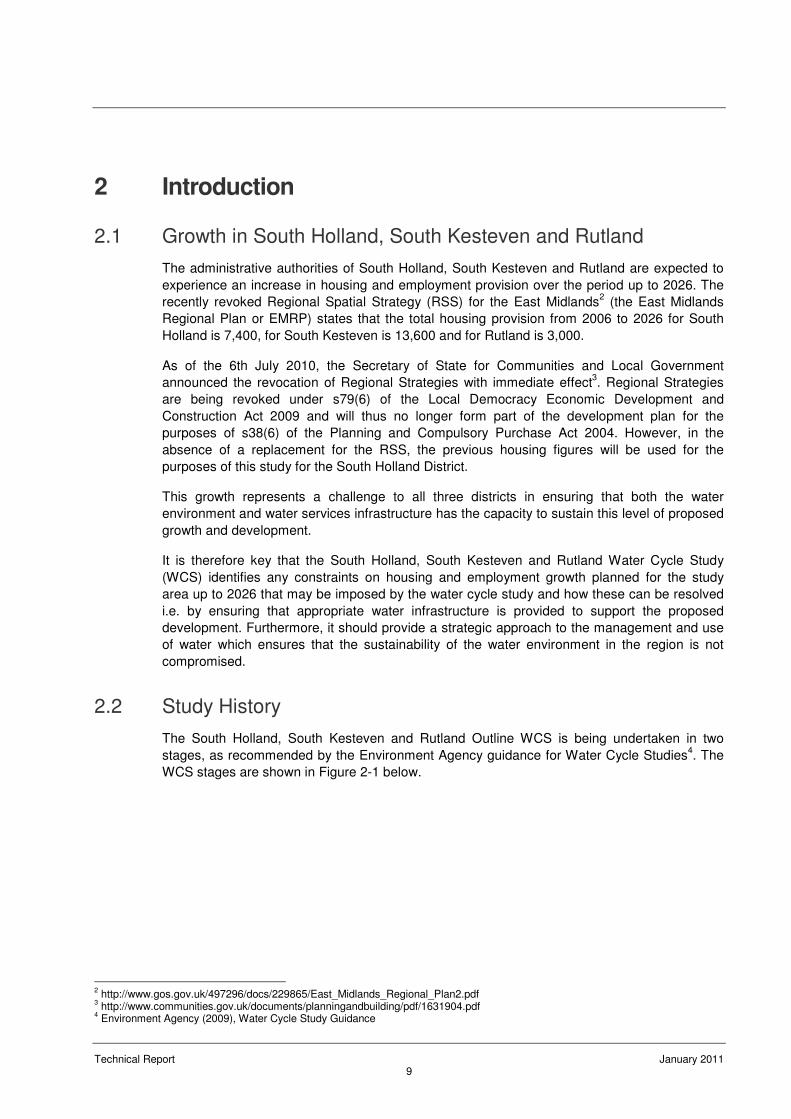
Figure 2-1: Water Cycle Study stages
A Scoping assessment, the Key Constraints Assessment, was completed in June 2010. Its aim
was to define the study area, establish the WCS steering group and to determine the key water
infrastructure and water environment constraints that have the potential to impact on growth
during the plan period for the administrative area of the three authorities.
The Key Constraints Assessment concluded that although no ‘showstoppers’ were identified,
there are significant potential constraints on housing growth in the study area requiring more
detailed assessment in the Outline phase of the WCS. In particular, management of flood risk,
wastewater treatment and transmission of demand for potable water.
2.3 Water Cycle Study Reporting
The undertaking of a WCS requires a significant amount of technical assessment work. This
technical work requires agreement by all technical stakeholders involved such that the findings
of the study can be agreed and signed up to by all parties to give an approved strategy.
It is important that the methodology, process and outputs of each of the WCS assessments is
documented and reported. However, as an evidence base to the Local Development
Frameworks (LDF) and associated Local Development Documents (LDD), the WCS reports
should primarily be planning based documents. Therefore, this Outline WCS has been
reported via two key documents:
• The Technical Report – this report presents the Outline Water Cycle Strategy, giving the
full technical detail of the study process, assessments and findings, with full conclusions of
the Outline strategy. Its aim is to be the technical reference point for the Water Cycle Study;
and
Technical Report January 2011 11
• The Planning Summary Report – this document provides the findings of the WCS and
relates them to the planning issues faced by the three partner authorities; this is aimed at a
wider audience that are unlikely to have in-depth knowledge of water infrastructure and the
water environment but rather have a planning background.
This report presents the Technical Report.
2.4 Study Contributors
2.4.1 Steering Group
This Outline Study has been carried out with the guidance of the Steering Group, comprising
the following organisations:
• South Holland District Council (SHDC);
• South Kesteven District Council (SKDC);
• Rutland County Council (RCC);
• Lincolnshire County Council (LCC);
• Anglian Water Services Ltd (AWS);
• Severn Trent Water Ltd (STWL);
• Environment Agency; and
• Natural England (NE).
2.4.2 Other consultees
The various stakeholders, including the Steering group, were arranged into four levels, to
reflect the level of input and consultation required into the WCS. The tiers were defined as
follows:
• Tier 1 – lead partner authority; ongoing consultation on the findings of the study; and
leaders of all steering group meetings and report direction.
• Tier 2 – Wider Steering Group (Environment Agency, Natural England, water companies) –
attendance at proposed stakeholder workshops (see below), monthly steering group
updates, attendance at 2 steering group meetings, invitation to comment on Scoping
outputs; agreement on final WCS Outline report.
• Tier 3 – Wider stakeholders and IDBs – Contact for additional useful information on local
infrastructure, potential circulation of agreed Scoping Study outputs for information and
comment to feed into Phase 2.
• Tier 4 - Provide findings of the joint Scoping and Outline Study – this tier includes parish
councils and neighbouring authorities.
The frequency and level of consultation and communication was agreed with the stakeholder
group through the production of a stakeholder communications strategy. This is included as
Appendix A.
Technical Report January 2011 12
2.5 Outline Study – Aims and Objectives
The overall aim of the project is to identify a clear programme of required water services
infrastructure and its implementation to support the delivery of sustainable growth up to
2026.The WCS tests the impact of the proposed development on the water cycle, defines the
existing baseline capacity for growth without the need for new infrastructure and determines
where new infrastructure or further investigation is required to overcome constraints that may
limit the required growth levels in the study area as a result of new water services
infrastructure.
The objectives of the WCS are to ensure:
• water services infrastructure is provided in a timely manner to support the housing,
employment and related services to support the growth planned for the region to 2026;
• there is a strategic programme for delivery of key infrastructure and estimates of costs;
• there is a strategic approach to the management and usage of water;
• that development is only permitted where environmental capacity exists;
• that impacts on the study area from all relevant catchments (including groundwater) and
their growth are assessed in order to provide a holistic picture of water management in
South Holland, South Kesteven and Rutland; and
• that development is located away from areas at highest flood risk.
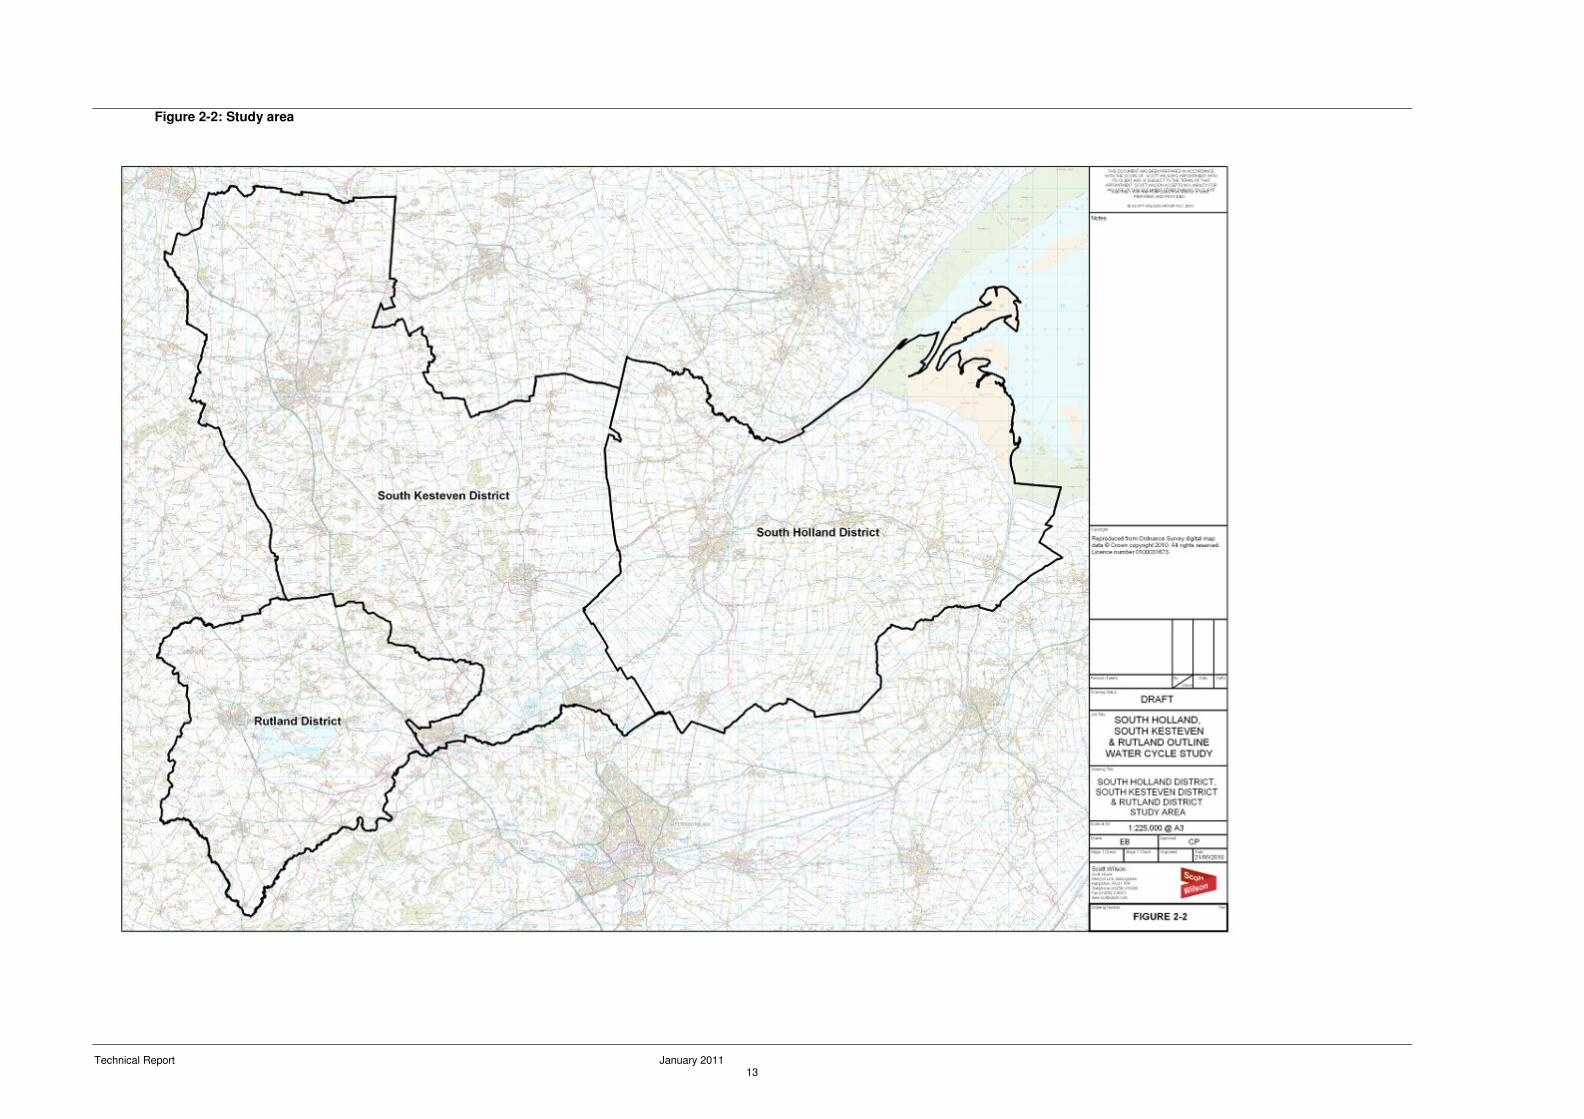
2.6 Study Area
The administrative areas of South Holland, South Kesteven and Rutland are shown in Figure 2-
2 below. Whilst the geographic scope of the Outline Study is limited to growth within South
Holland, South Kesteven and Rutland, the wider area will be considered where it has the
capacity to impact on growth within the study area. The town of Grantham was the subject of a
separate WCS, carried out by Atkins in 20105, and will therefore not be included in this study.
Stamford and Deeping WwTWs, which lie to the south of the South Kesteven District, were
included within the Peterborough WCS6, carried out by Hyder in 2010, which will therefore be
cross-referenced in this study.
Other large towns and settlements upstream of the study area will also be considered, as the
large upstream catchments of the major watercourses within the study area mean that
wastewater discharges and water supply demands from towns such as Peterborough and
Leicester can impact upon South Holland, South Kesteven and Rutland.
The study area is largely served by AWS, with the exception of an area to the west of Rutland,
which is supplied by STWL.
5 South Kesteven District Council, Grantham Water Cycle Study, Stage 2b Detailed Study, Atkins, January 2010.
6Opportunity Peterborough, Peterborough Water Cycle Study, Detailed Study, Hyder, March 2010.
Technical Report January 2011 13
Figure 2-2: Study area
Technical Report January 2011 14
2.7 Key Constraints Assessment
The Key Constraints Assessment7 represented the Scoping stage of the WCS, as shown above
in Figure 2-1. The assessment was carried out on the 5 key ‘water cycle’ topic areas:
• water resources;
• wastewater treatment and transmission;
• ecology;
• flood risk; and
• surface water management and SuDS potential.
2.7.1 Methodology
Water resources
The assessment of water resources reviewed the Environment Agency’s Catchment
Abstraction Management Strategies (CAMS) and Anglian and Severn Trent Water’s Water
Resource Management Plans (WRMP). The CAMS document looks at the environmental
capacity of the available water resources, by assessing the environmental impact of existing
surface and groundwater abstractions and making a judgement as to whether further
abstraction would be acceptable. The WRMPs extend the assessment to include the capacity
of water treatment and transmission infrastructure to supply water of drinking water quality to
the required locations. The WRMPs also give the water companies’ proposals to increase
available resources or provide sufficient efficiencies to meet future water resource demand.
Including available water to be abstracted (CAMS) and available water to be supplied (WRMP).
Wastewater treatment and transmission
The wastewater assessment addressed two key areas for wastewater: the baseline with
respect to treatment of wastewater and how much ‘spare’ capacity is available in existing
wastewater treatment facilities; and, the baseline with respect to wastewater or sewer network
and whether there is scope to use the existing and/or planned network system before upgrades
are required.
Baseline capacity at the wastewater treatment works was assessed by comparing the
consented Dry Weather Flow (DWF) with the measured DWF. Several of the wastewater
treatment works (WwTW) serving the outlying settlements have new proposed DWF consents;
these variations relate to the current flow at the works (and seasonal variations) and do not
consider growth. These works can therefore be considered to be operating at their consented
DWF limit and further variations will be required to treat additional flows from further
development.
Ecology
Information regarding Special Areas of Conservation (SACs), Special Protection Areas (SPAs),
Ramsar Sites and Sites of Special Scientific Interest (SSSIs) was supplied by Natural England.
7 South Holland, South Kesteven and Rutland Water Cycle Study Key Constraints Assessment, Scott Wilson 2010.
Technical Report January 2011 15
Information regarding locally designated sites, such as Local Nature Reserves (LNRs), was
supplied by RCC, SKDC and the Lincolnshire Biodiversity Partnership on behalf of SHDC.
Designated sites which had the potential to be impacted upon by the proposed development,
for example from increased abstraction or wastewater discharges, were then assessed and
possible constraints to development from designated sites were identified.
Due to the combined nature of the study and the differences in designation of local wildlife sites
between the three councils, it was decided in agreement with the three client authorities that
the assessment of ecological impact would be limited to internationally (SACs, SPAs, Ramsar)
and nationally (SSSIs) designated sites.
Flood risk
A review of the Environment Agency’s flood mapping8 and the SFRAs for each council
demonstrated that there are large areas at risk of flooding, this is of particular concern in South
Holland where there is a significant risk from tidal sources.
Surface water management and SuDS potential
The potential for the use of Sustainable Drainage Systems (SuDS) is largely dependent on the
underlying geology. Where there are permeable soils, infiltration SuDS can be recommended,
but where a sites lies over impermeable geology, such as clay, surface water run off will need
to be discharged to a surface watercourse. Attenuation should therefore be applied to the
discharge to prevent flood risk elsewhere being exacerbated by the new development,
consultation with the Environment Agency and Internal Drainage Boards (IDBs) will be required
to determine acceptable runoff rates.
For sites where infiltration SuDS may be appropriate, the following must be taken into account:
• there should be no direct discharge to groundwater from soakaways or infiltration systems
and all infiltration structures (e.g. permeable pavements, infiltration trenches, soakaways)
should be at a shallow a depth as possible to simulate natural attenuation;
• the base of the infiltration structures should be at least 1 m above the highest seasonal
water-table;
• roof water down-pipes should be connected to the drainage system directly, via re-use
devices such as water butts or by means of back inlet gullies provided with sealing plates
and there should be no open gratings;
• drainage systems should be constructed in accordance with CIRIA C6099 and C697
10; and
• soakaways should not be located in potentially contaminated ground. This may require a
site investigation on brownfield sites to determine suitable locations for soakaways to
ensure that soakaways do not increase the risk posed to groundwater.
2.7.2 Conclusions
The outcome of the key constraints assessment was the formulation of a constraints matrix for
each of the identified areas. The matrix has been designed so that the amount of subjective
8 www.environment-agency.gov.uk
9 The Interim Code of Practice for Sustainable Drainage Systems, National SuDS Working Group, July 2004.
10 The SuDS manual, CIRIA, February 2007
Technical Report January 2011 16
interpretation of the data is minimised, and hence the traffic lights allocated are based on
factual and quantitative data where possible. Constraints matrices were produced for the major
settlements within the study area, which identified a number of issues for development.
The constraints assessment was presented to the Steering Group on the 24th June 2010. The
conclusions of the constraints assessment and the comments of the Steering Group have been
incorporated into this Outline Study.
Technical Report January 2011 17
3 Policy and Supporting Information
National, regional, sub-regional and local planning policy and guidance documents provide
both requirements and guidance for delivering sustainable development. The following is a
summary of the legislative, policy and guidance drivers which have informed and shaped the
development of this WCS and its deliverables, and have been considered at all stages in the
WCS process.
3.1 Legislation and Policy
3.1.1 International and National
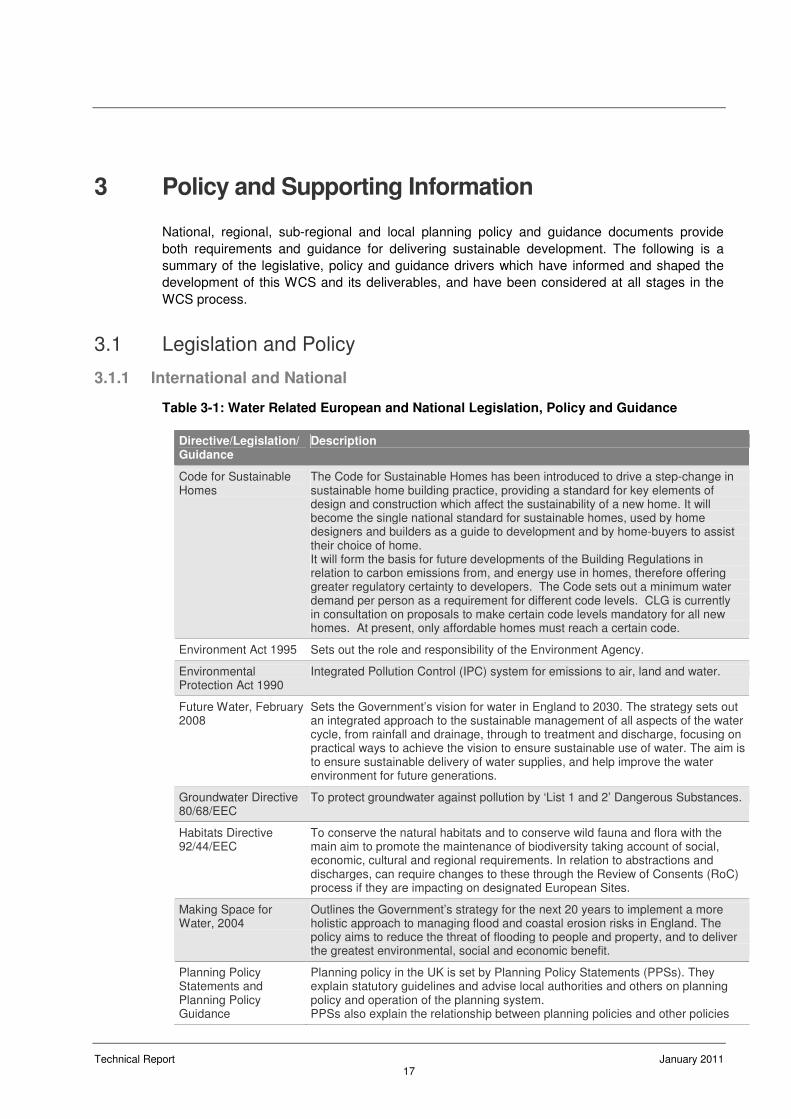
Table 3-1: Water Related European and National Legislation, Policy and Guidance
Directive/Legislation/Guidance
Description
Code for Sustainable Homes
The Code for Sustainable Homes has been introduced to drive a step-change in sustainable home building practice, providing a standard for key elements of design and construction which affect the sustainability of a new home. It will become the single national standard for sustainable homes, used by home designers and builders as a guide to development and by home-buyers to assist their choice of home. It will form the basis for future developments of the Building Regulations in relation to carbon emissions from, and energy use in homes, therefore offering greater regulatory certainty to developers. The Code sets out a minimum water demand per person as a requirement for different code levels. CLG is currently in consultation on proposals to make certain code levels mandatory for all new homes. At present, only affordable homes must reach a certain code.
Environment Act 1995 Sets out the role and responsibility of the Environment Agency.
Environmental Protection Act 1990
Integrated Pollution Control (IPC) system for emissions to air, land and water.
Future Water, February 2008
Sets the Government’s vision for water in England to 2030. The strategy sets out an integrated approach to the sustainable management of all aspects of the water cycle, from rainfall and drainage, through to treatment and discharge, focusing on practical ways to achieve the vision to ensure sustainable use of water. The aim is to ensure sustainable delivery of water supplies, and help improve the water environment for future generations.
Groundwater Directive 80/68/EEC
To protect groundwater against pollution by ‘List 1 and 2’ Dangerous Substances.
Habitats Directive 92/44/EEC
To conserve the natural habitats and to conserve wild fauna and flora with the main aim to promote the maintenance of biodiversity taking account of social, economic, cultural and regional requirements. In relation to abstractions and discharges, can require changes to these through the Review of Consents (RoC) process if they are impacting on designated European Sites.
Making Space for Water, 2004
Outlines the Government’s strategy for the next 20 years to implement a more holistic approach to managing flood and coastal erosion risks in England. The policy aims to reduce the threat of flooding to people and property, and to deliver the greatest environmental, social and economic benefit.
Planning Policy Statements and Planning Policy Guidance
Planning policy in the UK is set by Planning Policy Statements (PPSs). They explain statutory guidelines and advise local authorities and others on planning policy and operation of the planning system. PPSs also explain the relationship between planning policies and other policies
Technical Report January 2011 18
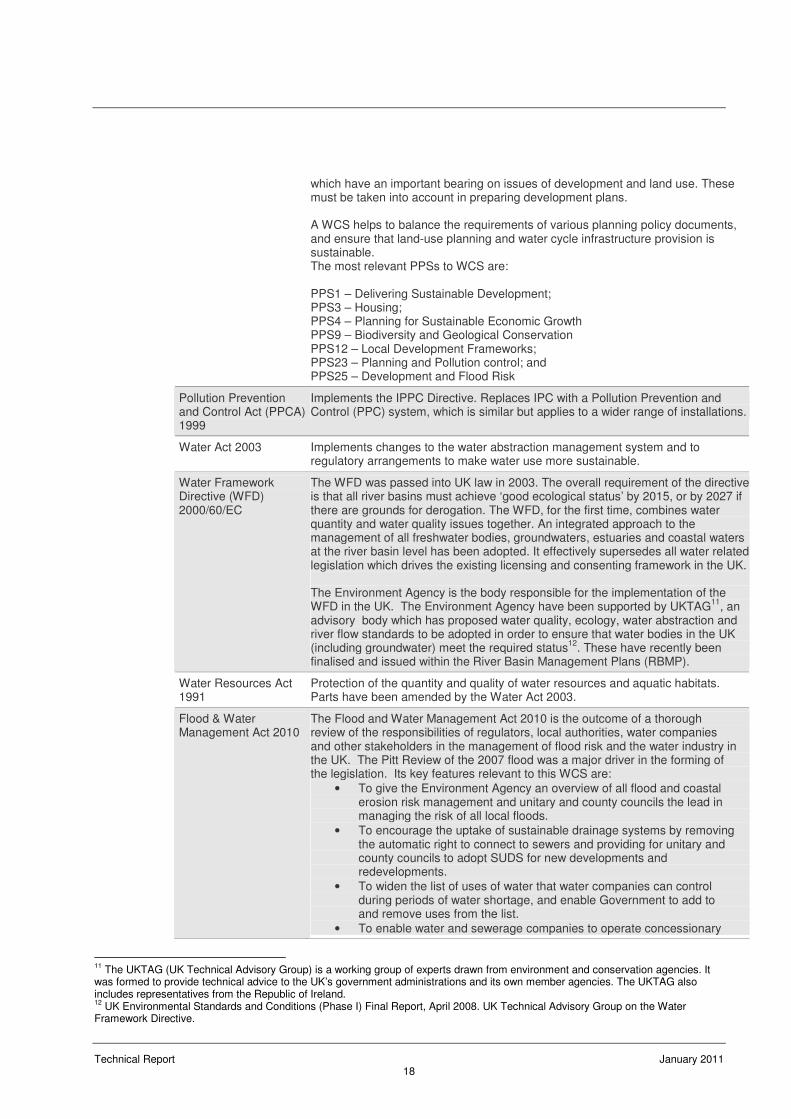
which have an important bearing on issues of development and land use. These must be taken into account in preparing development plans. A WCS helps to balance the requirements of various planning policy documents, and ensure that land-use planning and water cycle infrastructure provision is sustainable. The most relevant PPSs to WCS are: PPS1 – Delivering Sustainable Development; PPS3 – Housing; PPS4 – Planning for Sustainable Economic Growth PPS9 – Biodiversity and Geological Conservation PPS12 – Local Development Frameworks; PPS23 – Planning and Pollution control; and PPS25 – Development and Flood Risk
Pollution Prevention and Control Act (PPCA) 1999
Implements the IPPC Directive. Replaces IPC with a Pollution Prevention and Control (PPC) system, which is similar but applies to a wider range of installations.
Water Act 2003 Implements changes to the water abstraction management system and to regulatory arrangements to make water use more sustainable.
Water Framework Directive (WFD) 2000/60/EC
The WFD was passed into UK law in 2003. The overall requirement of the directive is that all river basins must achieve ‘good ecological status’ by 2015, or by 2027 if there are grounds for derogation. The WFD, for the first time, combines water quantity and water quality issues together. An integrated approach to the management of all freshwater bodies, groundwaters, estuaries and coastal waters at the river basin level has been adopted. It effectively supersedes all water related legislation which drives the existing licensing and consenting framework in the UK. The Environment Agency is the body responsible for the implementation of the WFD in the UK. The Environment Agency have been supported by UKTAG
11, an
advisory body which has proposed water quality, ecology, water abstraction and river flow standards to be adopted in order to ensure that water bodies in the UK (including groundwater) meet the required status
12. These have recently been
finalised and issued within the River Basin Management Plans (RBMP).
Water Resources Act 1991
Protection of the quantity and quality of water resources and aquatic habitats. Parts have been amended by the Water Act 2003.
Flood & Water Management Act 2010
The Flood and Water Management Act 2010 is the outcome of a thorough review of the responsibilities of regulators, local authorities, water companies and other stakeholders in the management of flood risk and the water industry in the UK. The Pitt Review of the 2007 flood was a major driver in the forming of the legislation. Its key features relevant to this WCS are:
• To give the Environment Agency an overview of all flood and coastal erosion risk management and unitary and county councils the lead in managing the risk of all local floods.
• To encourage the uptake of sustainable drainage systems by removing the automatic right to connect to sewers and providing for unitary and county councils to adopt SUDS for new developments and redevelopments.
• To widen the list of uses of water that water companies can control during periods of water shortage, and enable Government to add to and remove uses from the list.
• To enable water and sewerage companies to operate concessionary
11
The UKTAG (UK Technical Advisory Group) is a working group of experts drawn from environment and conservation agencies. It was formed to provide technical advice to the UK’s government administrations and its own member agencies. The UKTAG also includes representatives from the Republic of Ireland. 12
UK Environmental Standards and Conditions (Phase I) Final Report, April 2008. UK Technical Advisory Group on the Water Framework Directive.
Technical Report January 2011 19
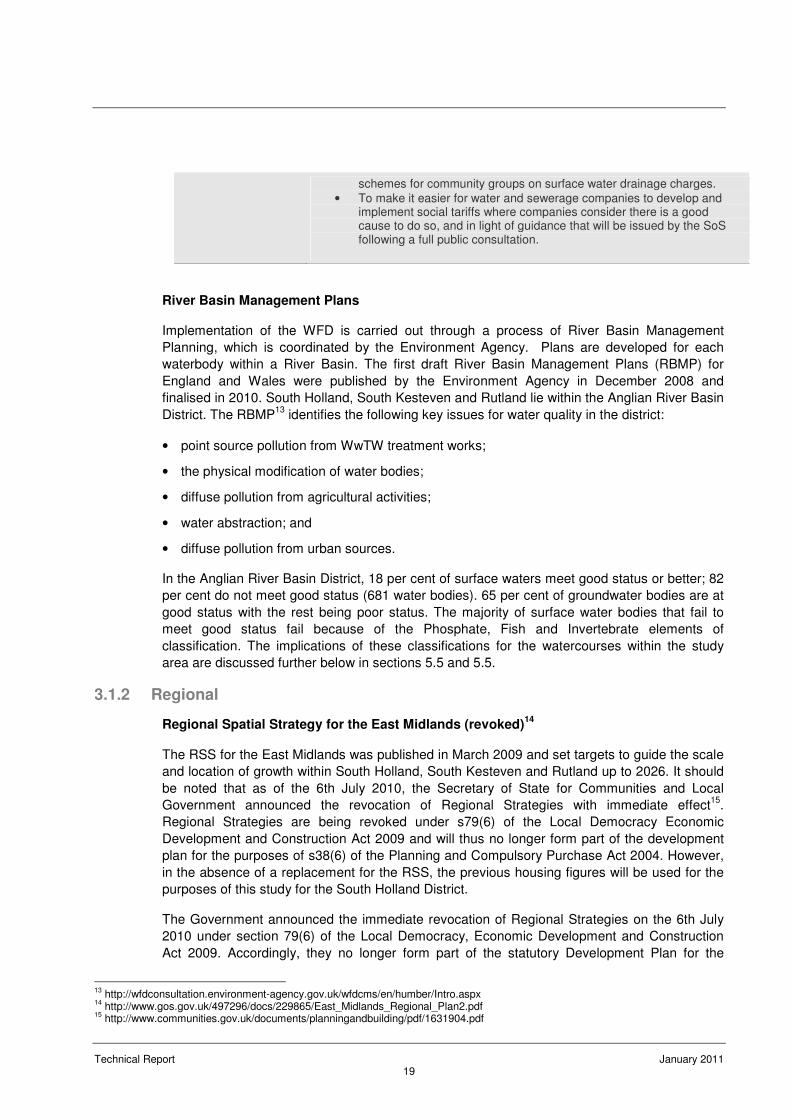
schemes for community groups on surface water drainage charges.
• To make it easier for water and sewerage companies to develop and implement social tariffs where companies consider there is a good cause to do so, and in light of guidance that will be issued by the SoS following a full public consultation.
River Basin Management Plans
Implementation of the WFD is carried out through a process of River Basin Management
Planning, which is coordinated by the Environment Agency. Plans are developed for each
waterbody within a River Basin. The first draft River Basin Management Plans (RBMP) for
England and Wales were published by the Environment Agency in December 2008 and
finalised in 2010. South Holland, South Kesteven and Rutland lie within the Anglian River Basin
District. The RBMP13
identifies the following key issues for water quality in the district:
• point source pollution from WwTW treatment works;
• the physical modification of water bodies;
• diffuse pollution from agricultural activities;
• water abstraction; and
• diffuse pollution from urban sources.
In the Anglian River Basin District, 18 per cent of surface waters meet good status or better; 82
per cent do not meet good status (681 water bodies). 65 per cent of groundwater bodies are at
good status with the rest being poor status. The majority of surface water bodies that fail to
meet good status fail because of the Phosphate, Fish and Invertebrate elements of
classification. The implications of these classifications for the watercourses within the study
area are discussed further below in sections 5.5 and 5.5.
3.1.2 Regional
Regional Spatial Strategy for the East Midlands (revoked)14
The RSS for the East Midlands was published in March 2009 and set targets to guide the scale
and location of growth within South Holland, South Kesteven and Rutland up to 2026. It should
be noted that as of the 6th July 2010, the Secretary of State for Communities and Local
Government announced the revocation of Regional Strategies with immediate effect15
.
Regional Strategies are being revoked under s79(6) of the Local Democracy Economic
Development and Construction Act 2009 and will thus no longer form part of the development
plan for the purposes of s38(6) of the Planning and Compulsory Purchase Act 2004. However,
in the absence of a replacement for the RSS, the previous housing figures will be used for the
purposes of this study for the South Holland District.
The Government announced the immediate revocation of Regional Strategies on the 6th July
2010 under section 79(6) of the Local Democracy, Economic Development and Construction
Act 2009. Accordingly, they no longer form part of the statutory Development Plan for the
13
http://wfdconsultation.environment-agency.gov.uk/wfdcms/en/humber/Intro.aspx 14
http://www.gos.gov.uk/497296/docs/229865/East_Midlands_Regional_Plan2.pdf 15
http://www.communities.gov.uk/documents/planningandbuilding/pdf/1631904.pdf
Technical Report January 2011 20
purposes of Section 38(6) of the Planning and Compulsory Purchase Act 2004. All
references to Regional Strategies in other Policy Statements are no longer valid. Planning
Policy Statements (PPS) and Planning Policy Guidance (PPG) will continue to apply until they
are replaced by the National Planning Framework.
3.1.3 Local
Local Development Frameworks
South Holland District Council
Due to the above revocation of the Regional Strategies, SHDC’s statutory Development Plan
for the District now consists of the saved policies in the South Holland Local Plan 2006. This
will be replaced by the Local Development Framework (LDF) in due course.
The LDF will be made up of a number of important documents, including:
• Local Development Scheme (LDS) - project plan setting out what new documents will be
produced and when;
• Statement of Community Involvement (SCI) - Document setting out how and when the
Council intends to consult with the community;
• Development Plan Documents (DPDs) - Documents that set out the planning policies to
guide and control development in the District;
• Supplementary Planning Documents (SPDs) - Documents that provide further and
additional information on a policy or policies held within a DPD; and
• Annual Monitoring Report (AMR) - Document that assesses the implementation of the LDS
and the extent to which policies are being achieved.
SHDC’s housing allocations are dependent on the outcome of the Coastal Strategy, which was
requested by the Inspector following an Examination in Public (EiP) of a previous iteration of
the RSS. The Coastal Strategy was requested due to the large areas of tidal flood zone that
exist within the District and aims to provide policy guidance on development within the
vulnerable coastal zone, taking into consideration the effects of climate change and sea level
rise.
South Holland and Boston Councils are in the latter stages of discussions related to the
production of a joint LDF. Boston has already completed a 'pre-outline' WCS and there is scope
in the future for any detailed study commissioned to cover both local authority areas building on
work already completed.
South Kesteven District Council
SKDC is currently preparing its LDF, the folder of documents which will set out the Councils
planning policy framework to 2026. The Core Strategy is the key document in the LDF which
sets out the overall vision and objectives and spatial strategy for the district. The Core Strategy
was adopted in July 2010.
In addition to the Core Strategy the LDF will comprise a Grantham Area Action plan (GAAP)
and a Site Allocation and Policies DPD which will identify sites for development and detailed
policies to support the Core Strategy policies. These documents are currently being prepared.
Technical Report January 2011 21
The Water Cycle study will inform the detailed policies and site allocations to be included within
them.
Rutland County Council
RCC is currently preparing its LDF, the folder of documents that will set out the Council’s
planning policies to 2026 and eventually replace the existing Rutland Local Plan. The Core
Strategy Development Plan Document is the key document in the LDF which sets out the
overall vision, objectives and spatial strategy for Rutland. Following consultation on preferred
options in May- June 2010, the Council is seeking comments on the final version of the Core
Strategy which is being submitted for public examination.
The consultation on the Core Strategy Proposed Submissions DPD ran until the 23rd
September 2010. A “Call for sites” consultation also ran until 30th September 2010. This is the
initial stage in the preparation of the Council’s Site Allocations and Development Control
Polices DPD.
Water Industry Funding
AWS and STWL are appointed as the water and sewerage undertakers for the study area
through an appointment made under the Water Industry Act 199116
. The principal duties of
water and sewerage undertakers are set out in that legislation. Section 37 of that Act places a
duty upon a water undertaker to develop and maintain an efficient and economical system of
water supply within its area. Similarly Section 94 places a duty upon a sewerage undertaker to
provide, improve and extend a system of public sewers to ensure that its area is effectually
drained and the contents of those sewers effectually dealt with.
Regulation
The Water Services Regulation Authority (Ofwat) is the economic regulator of water and
sewerage companies in England and Wales.
For every five year asset management planning (AMP) cycle, companies submit a business
plan to Ofwat. The plans set out each company's view of what it needs to do to maintain its
assets, improve services to customers, provide for growth in its region and deal with its impact
on the environment. Ofwat’s decision on how much companies need to recover from customers
through bills is expressed as price limits (‘K factors’).
Any major infrastructure requirements which arise after agreement of the five year AMP will
normally be considered for the following AMP period. AMP5 will cover the period 2010 to 2015.
The water companies’ Strategic Business Plans were submitted for the Price Review at the end
of 2009 (PR09). OFWAT has determined the price limits from this PR09 (November 2009) and
a review of the Final Business Plans has identified that there is over £2 billion to be spent
during the period to March 2015 (i.e. AMP5) across the AWS area17
and £2.4 billion across the
STWL area18
Where significant water cycle infrastructure requirements are not included within PR09, funding
cannot be sought until the next Price Review towards the end of AMP5 (PR14). Only in
16
http://www.legislation.gov.uk/ukpga/1991/56/contents 17
http://www.anglianwater.co.uk/news/general/9768FEF46C9541749367618E431BF588.aspx 18
http://www.stwater.co.uk/server.php?show=ConWebDoc.3865
Technical Report January 2011 22
exceptional circumstances will Water Companies seek to deviate from their Water Resource
Management Plan and submit an interim determination within the 5 year AMP cycle to provide
funding for unforeseen investment requirements. However, these have significant cost
implications and it is considered that infrastructure for planned development should be planned
for in sufficient time to be included in the relevant Business Plan and Price Review.
Developer Contributions
When a developer wishes to proceed with a particular site, they may requisition the appropriate
water company (or companies if separate for water and wastewater) to provide infrastructure in
accordance with the relevant provisions of the act (Section 98 for sewerage and Section 41 for
water). The cost of this is shared between the developer and undertaker in accordance with the
legislation.
For infrastructure serving more than one development site, the Water Industry Act assumes
that the first developer will pay the majority of the costs. In most cases, however, it will be
preferable to share costs equitably between developers. This will need to be facilitated through
the planning system.
Developers also pay an “infrastructure charge” to the water company to cover the cost of
general improvements which cannot be allocated to a specific site. If the developer provides
new infrastructure all the way to the treatment works, then this may be waived or taken into
account in calculating other contributions.
Separate provisions exist for industrial customers.
Water Resource Planning
Water companies produce Water Resource Management Plans (WRMP) on a statutory basis
covering 25 year planning horizons. WRMPs set out how a water company plans to provide
and invest in existing and new water resource schemes (e.g. reservoirs, desalination) to meet
increases in demand for potable supply, as a result of new development, population growth and
climate change over the next 25 year period. The statutory WRMPs will be updated in 5 yearly
cycles to coincide with the PR and AMP process. AWS’s current WRMP19
was finalised in
March 2010 and has been used in this WCS.
STWL’s WRMP20
was published in draft for public consultation on the 7th May 2008, with a
deadline for comments to be received by 29 July 2008. Due to the nature of comments
received in response to the consultation, significant changes were made to the draft WRMP,
with the final Plan published in June 2010.
Internal Drainage Board Policies
It was agreed at the start of the project that while it was not necessary to include Internal
Drainage Boards (IDBs) on the Steering Group, it was very important that they were consulted
to ensure that any issues and concerns were addressed by the WCS. The following IDBs were
therefore consulted and their policies taken into account when carrying out the assessment:
• South Holland IDB;
• Upper Witham IDB;
19
Anglian Water, Water Resource Management Plan, Main Report, February 2010. 20
Severn Trent Water , Water Resources Management Plan, Final version, June 2010
Technical Report January 2011 23
• Black Sluice IDB;
• Welland and Deepings IDB;
• Witham First IDB;
• Kings Lynn IDB; and
• North Level IDB.
3.2 Guidance
The Environment Agency has issued a National Guidance (The Water Cycle Study Manual21
)
document to ensure that WCS are carried out in a consistent way. This guidance outlines the
required approach for the Scoping, Outline and Detailed phases of water cycle studies and is
intended to assist local authorities, developers and others involved in commissioning or
carrying out a water cycle study. It provides non-prescriptive guidance on the purpose, scope
and best-practice process for undertaking such studies, as it recognises that Water cycle
studies need to be adapted to suit local conditions. The approach set out in the guidance forms
current best practice and the basis for the methodology followed in this WCS.
3.3 Supporting Documents
In addition to the legislation and guidance set out in Table 3-1, the following studies and reports
are relevant and, where available, have been used within the South Holland, South Kesteven
and Rutland WCS:
• Water Cycle Studies for Grantham (Detailed22
) and Peterborough; 23
;
• South Holland District SFRA (2010)24
, South Kesteven District SFRA (2009)25
and Rutland
SFRA (2009)26
;
• The Nene Catchment Abstraction Management Strategy;27
• The Welland Catchment Abstraction Management Strategy;28
• The Witham Catchment Abstraction Management Strategy;29
• The Environment Agency Groundwater Protection Policy;30
• The Environment Agency’s Review of Consent Process; and
• The SuDS Manual (Ciria C697).31
21
http://publications.environment-agency.gov.uk/pdf/GEHO0109BPFF-e-e.pdf 22
South Kesteven District Council, Grantham Water Cycle Study, Stage 2b Detailed Study, Atkins, January 2010 23 Opportunity Peterborough, Peterborough Water Cycle Study, Detailed Study, Hyder, March 2010. 24
South Holland District SFRA, Royal Haskoning, 2010 25
South Kesteven District, SFRA, Entec, 2009 26
Rutland County SFRA, Entec, 2009 27
http://www.environment-agency.gov.uk/research/planning/33550.aspx 28
http://www.environment-agency.gov.uk/research/planning/33550.aspx 29
http://www.environment-agency.gov.uk/research/planning/33550.aspx 30
http://publications.environment-agency.gov.uk/pdf/GEHO1006BLMW-e-e.pdf 31
http://www.ciria.org/service/AM/ContentManagerNet/Default.aspx?template=/TaggedPage/TaggedPageDisplay.cfm&TPLID=19&Content
ID=10559&TPPID=4334&AspNetFlag=1&Section=content_by_themes
Technical Report January 2011 24
3.4 Data Summary
The undertaking of a Water Cycle Study requires a large amount of data collection, much of
which is reliant on the willingness of third parties to supply in order to allow the study to be
progressed. This study has requested where required; a catalogue of the data collected,
identifying the data provider in each case, is included in Appendix B - Data Request.
Technical Report January 2011 25
4 Proposed Growth
4.1 Introduction
The districts of South Holland, South Kesteven and Rutland are expected to experience an
increase in housing and employment provision over the period to 2026. The recently revoked
Regional Spatial Strategy (RSS) for the East Midlands32
states that the total housing provision
from 2006 to 2026 for South Holland is 7,400, for South Kesteven is 13,600 and for Rutland is
3,000. In the absence of a replacement for the RSS, the previous housing figures will be used
for South Holland District for the purposes of this study and reference will be made to ‘RSS
requirement’. South Kesteven District Council has an adopted Core Strategy, which has been
used to determine growth scenarios
Three possible growth Scenarios have been calculated for the proposed growth in South
Holland, South Kesteven and Rutland. The scenarios have been developed such that three
levels of possible growth can be assessed in WCS ensuring that the full spectrum of possible
growth is assessed for impact on the water cycle.
It should be noted that the settlements listed in Tables 4-1 to 4-3 below do not represent all the
settlements in the study area where growth is proposed. Several of the smaller villages were
excluded from the assessment, because the level of growth was not considered to be high
enough to have a significant effect. In order to focus the assessment, only settlements that lie
within WwTW catchments where proposed growth is greater than 50 dwellings have been
assessed (if more than one settlement lies within a catchment the cumulative growth figure has
been assessed). For this level of assessment, it is felt that a cut off of 50 houses is appropriate.
For this reason the residual requirements listed in the three scenarios below are not wholly
reflected in the overall totals in Fig 4.1.
The exception to this is the settlement of Ancaster, in South Kesteven, which has been
included in the assessment despite only having a maximum growth level of 45 houses under
Scenario 3.
4.2 South Holland
4.2.1 Housing
Scenario 133
represents the RSS requirement for housing growth between 2006 and 2026
(7,400 dwellings) minus dwellings completed between 2006 and 2010 (1608 dwellings), which
gives a requirement over the study period of 5792 dwellings. This has been spread over
scenario period, namely 2256 dwellings between 2010 and 2015, 2147 between 2015 and
2020 and 1395 dwellings between 2020 and 2026. These are spatially distributed as shown in
Figure 4-1 below.
32
http://www.gos.gov.uk/497296/docs/229865/East_Midlands_Regional_Plan2.pdf 33
Please note, there are very small discrepancies between the above figures and those displayed below in Table 4-1 (6 houses in
Scenario 1 and 8 houses in Scenarios 2 and 3). This was caused by rounding of figures during the calculation process but does not
affect the overall assessment. In addition, the number given in table 4-1 the figures given in the table above represent the
settlements that were assessed in this WCs and do not represent all the proposed growth within the South Holland district. As
described above in paragraph 4.2.2, only WwTW catchments where proposed growth is greater than 50 dwellings have been
assessed (if more than one settlement lies within a catchment the cumulative growth figure has been assessed).
Technical Report January 2011 26
Scenario 2 represents the uncapped RSS requirement34
for housing growth between 2006 and
2026 (10,800 dwellings) minus dwellings completed between 2006 and 2010 (1608 dwellings),
which gives a requirement over the study period of 9,192 dwellings. This has been spread over
the scenario period, namely 3390 dwellings between 2010 and 2015, 3281 between 2015 and
2020 and 2529 dwellings between 2020 and 2026. These are spatially distributed as shown in
Figure 4-1 below.
Scenario 3 represents RSS requirement35
for housing growth between 2006 and 2026 (16,800
dwellings) minus dwellings completed between 2006 and 2010 (1608 dwellings) and minus the
Boston RSS Review requirement of 2,700 dwellings, which gives a requirement over the study
period of 12,492 dwellings. This has been spread over the scenario period, namely 4490
dwellings between 2010 and 2015, 4381 between 2015 and 2020 and 3629 dwellings between
2020 and 2026. These are spatially distributed as shown in Figure 4-1 below.
All of the above three scenarios include allocated sites and sites for which planning permission
has been granted. These are all sites on which AWS has been consulted and those with
planning permission have been included in AWS’s forward planning; AWS therefore has a legal
obligation to accept wastewater flows from these properties. However, this legal obligation
does not ensure that there is sufficient capacity in the sewer network or at the WwTW(s) and
the sites have therefore been included in this WCS assessment. This is a precautionary
approach, which can lead to an element of ‘double counting’ for proposed growth, but it is felt
that is an appropriate methodology to use.
4.2.2 Employment
One standard employment scenario has been used for each of the three housing scenarios.
This represents 100 hectares of land to be allocated for employment, plus outstanding
commitments. Employment land required will be evenly spread evenly over scenario period
(every 5 years) and spatially distributed as follows:
• Spalding 80%;
• Holbeach 5%;
• Crowland 5%;
• Donington 5%; and
• other areas (no restrictions in relation to Flood Zones) 5%.
No information was available regarding the type of employment and assumptions have
therefore not been made. In order to calculate the spread of jobs across the District across the
planning period, the proportional split of land area has been applied to the target job figures.
Figure 4-1 below shows the settlements and growth figures used for the WCS assessment
within South Holland District. It should be noted that some settlements were excluded from the
assessment because no significant growth is planned to drain to the catchment, for example
Sutton St James with 6 proposed houses or Tydd with 7 proposed houses and Deeping St
Nicholas, which drains to Deeping St Nicholas Wren Close WwTW which has a descriptive
consent, are not shown below. In order to focus the assessment, only WwTW catchments
34
Figures given in the draft RSS, pre Examination in Public to approve the Final RSS documents. 35
Figures given in the draft RSS, pre Examination in Public to approve the Final RSS documents.
Technical Report January 2011 27
where proposed growth is greater than 50 dwellings have been assessed (if more than one
settlement lies within a catchment the cumulative growth figure has been assessed).
In addition, the ‘Outside Coastal Zones’ growth area, which has a proposed growth allocation of
108 new houses over the planning period has not been included in the table below. It has not
been possible to assess this proposed growth, as the location of the growth is not specific
enough to allow the wastewater catchment, flood risk zone or SuDS potential to be identified.
Further assessment of the ‘Outside Coastal Zones’ growth area should therefore be carried out
at a later date once the specific locations are known, although it is not thought that the
relatively small housing figure would be likely to be a major issue if spread across a wide area.
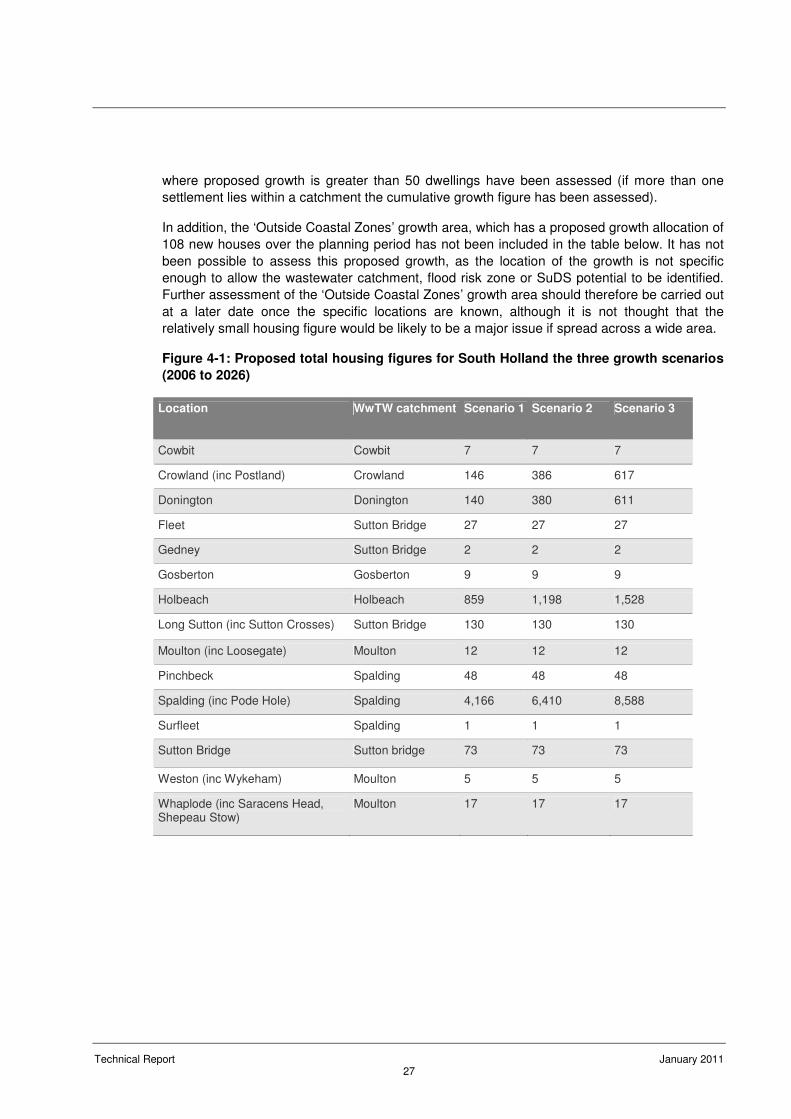
Figure 4-1: Proposed total housing figures for South Holland the three growth scenarios
(2006 to 2026)
Location WwTW catchment Scenario 1 Scenario 2 Scenario 3
Cowbit Cowbit 7 7 7
Crowland (inc Postland) Crowland 146 386 617
Donington Donington 140 380 611
Fleet Sutton Bridge 27 27 27
Gedney Sutton Bridge 2 2 2
Gosberton Gosberton 9 9 9
Holbeach Holbeach 859 1,198 1,528
Long Sutton (inc Sutton Crosses) Sutton Bridge 130 130 130
Moulton (inc Loosegate) Moulton 12 12 12
Pinchbeck Spalding 48 48 48
Spalding (inc Pode Hole) Spalding 4,166 6,410 8,588
Surfleet Spalding 1 1 1
Sutton Bridge Sutton bridge 73 73 73
Weston (inc Wykeham) Moulton 5 5 5
Whaplode (inc Saracens Head, Shepeau Stow)
Moulton 17 17 17
Technical Report January 2011 28
4.3 South Kesteven
4.3.1 Housing
Scenario 136
represents the Core Strategy requirement of 13,620 dwellings in total minus
completions between 2006 and 2010, which gives a requirement over the study period of 681
dwellings per annum.
Scenario 2 has been calculated as for Scenario 1, but with an additional 10% growth in addition
to the Core Strategy figures. This represents a total requirement of 14,982 dwellings over the
study period, which is an annual completion rate of 750 dwellings. Scenario 3 has been
calculated as for Scenario 1, but with an additional 20% growth in addition to the Core Strategy
figures. This represents a total requirement of 16,344 dwellings over the study period, which is
an annual completion rate of 818 dwellings.
4.3.2 Employment
As for the housing figures, employment Scenario 1 represents Core Strategy targets. This
equates to a total of 205 hectares of employment land over the plan period 2010 to 2026, or
12.8 hectares per annum.
Scenario 2 has been calculated as for Scenario 1, but with an additional 10% growth in addition
to the Core Strategy figures. This equates to a total of 224 hectares of employment land over
the plan period 2010 to 2026, or 14 hectares per annum.
Scenario 2 has been calculated as for Scenario 1, but with an additional 20% growth in addition
to the Core Strategy figures. This equates to a total of 242.4 hectares of employment land over
the plan period 2010 to 2026, or 15.2 hectares per annum. All of the above will be phased
evenly over the planning period.
No information was available regarding the type of employment and assumptions have
therefore not been made. In order to calculate the spread of jobs across the District across the
planning period, the proportional split of land area has been applied to the target job figures.
Figure 4-2 below shows the settlements and growth figures used for the WCS assessment
within South Kesteven District.
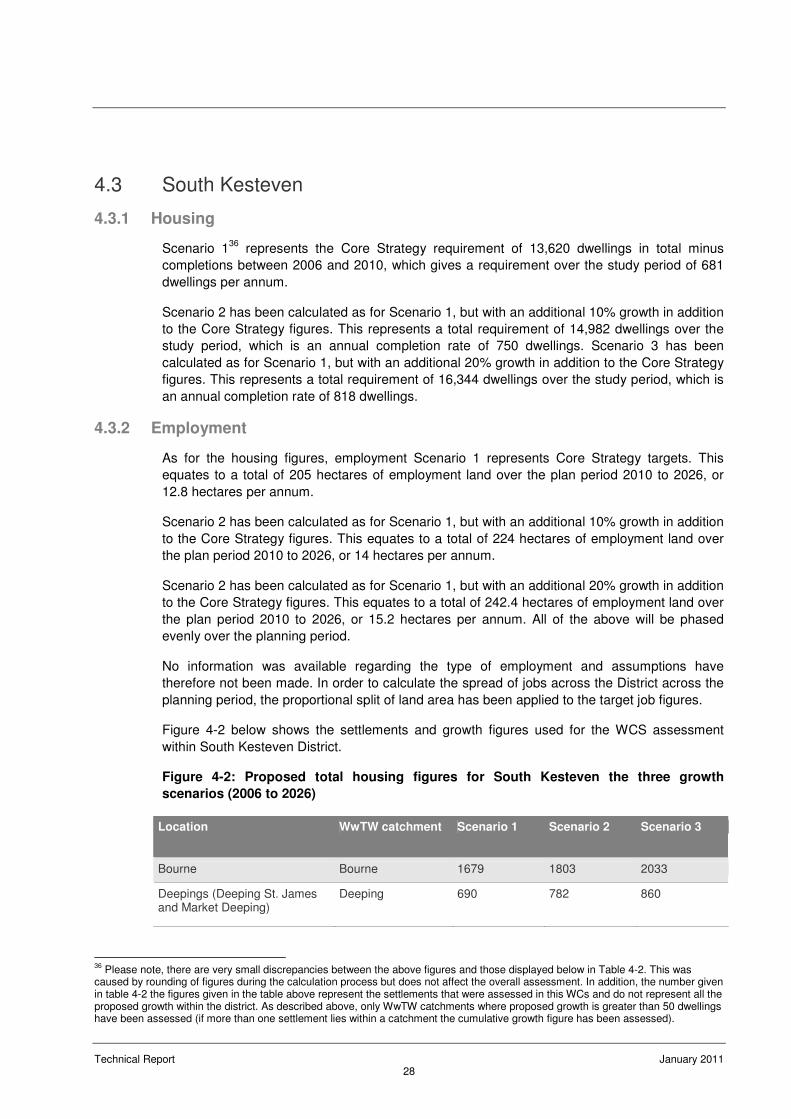
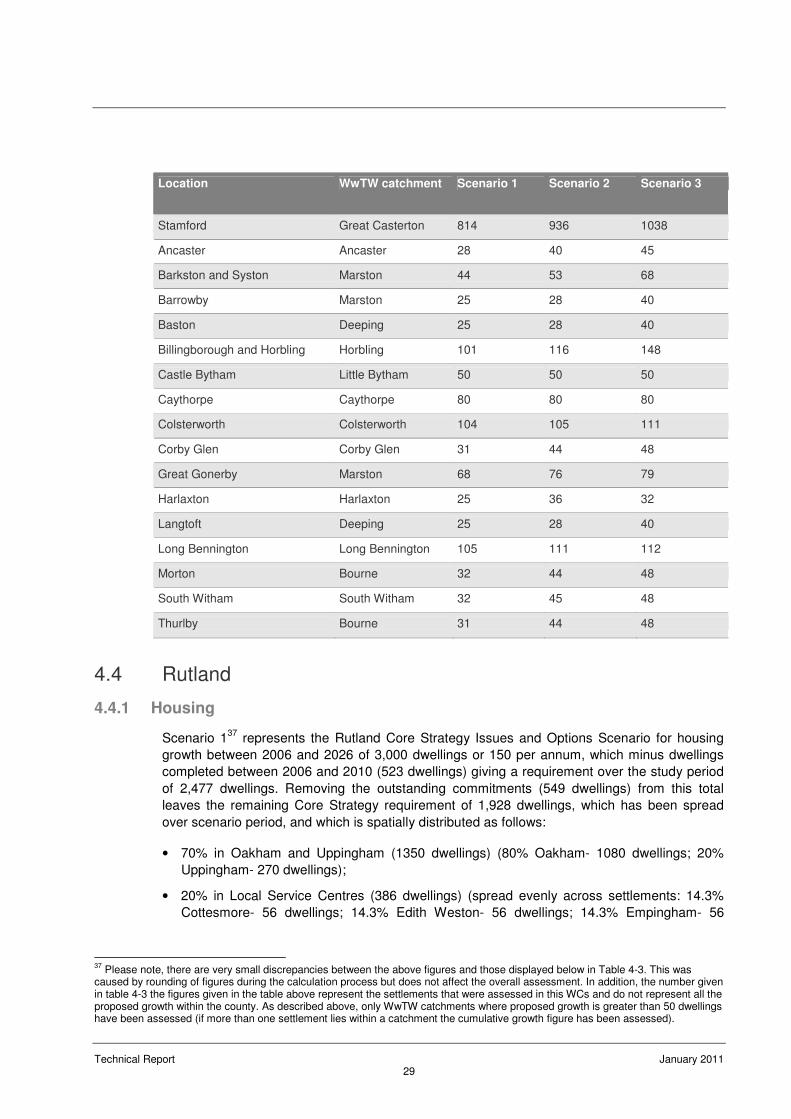
Figure 4-2: Proposed total housing figures for South Kesteven the three growth
scenarios (2006 to 2026)
Location WwTW catchment Scenario 1 Scenario 2 Scenario 3
Bourne Bourne 1679 1803 2033
Deepings (Deeping St. James and Market Deeping)
Deeping 690 782 860
36
Please note, there are very small discrepancies between the above figures and those displayed below in Table 4-2. This was caused by rounding of figures during the calculation process but does not affect the overall assessment. In addition, the number given in table 4-2 the figures given in the table above represent the settlements that were assessed in this WCs and do not represent all the proposed growth within the district. As described above, only WwTW catchments where proposed growth is greater than 50 dwellings have been assessed (if more than one settlement lies within a catchment the cumulative growth figure has been assessed).
Technical Report January 2011 29
Location WwTW catchment Scenario 1 Scenario 2 Scenario 3
Stamford Great Casterton 814 936 1038
Ancaster Ancaster 28 40 45
Barkston and Syston Marston 44 53 68
Barrowby Marston 25 28 40
Baston Deeping 25 28 40
Billingborough and Horbling Horbling 101 116 148
Castle Bytham Little Bytham 50 50 50
Caythorpe Caythorpe 80 80 80
Colsterworth Colsterworth 104 105 111
Corby Glen Corby Glen 31 44 48
Great Gonerby Marston 68 76 79
Harlaxton Harlaxton 25 36 32
Langtoft Deeping 25 28 40
Long Bennington Long Bennington 105 111 112
Morton Bourne 32 44 48
South Witham South Witham 32 45 48
Thurlby Bourne 31 44 48
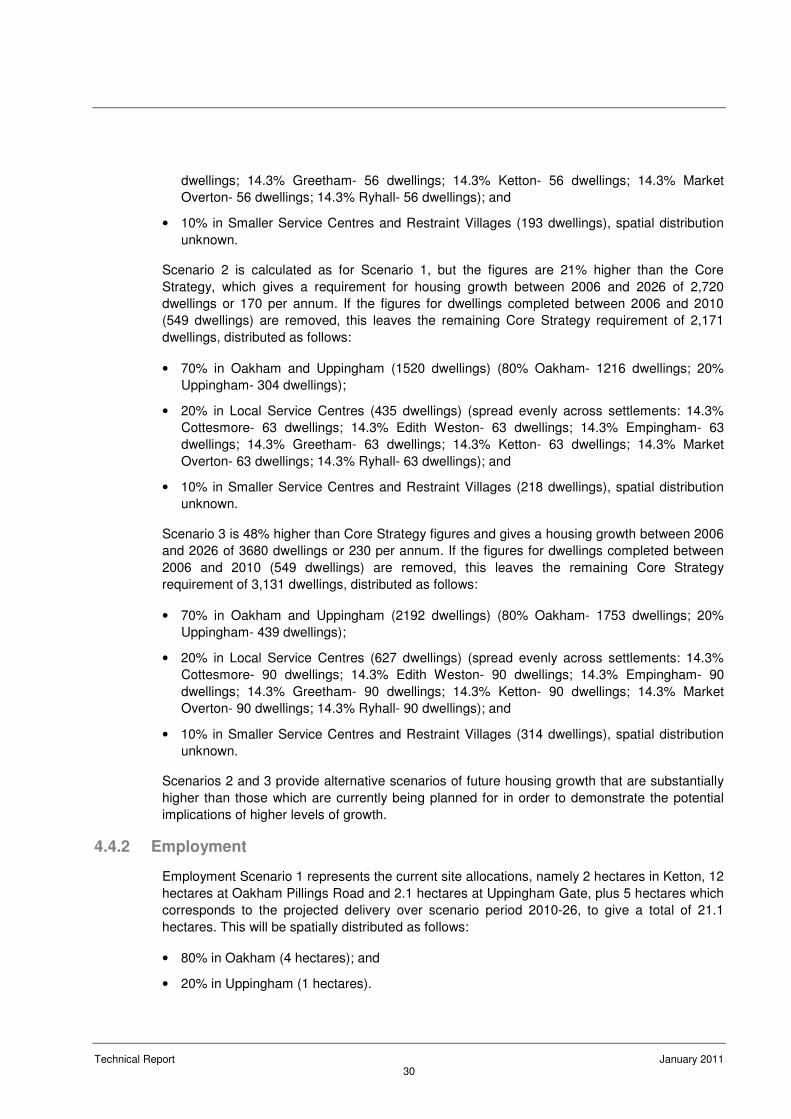
4.4 Rutland
4.4.1 Housing
Scenario 137
represents the Rutland Core Strategy Issues and Options Scenario for housing
growth between 2006 and 2026 of 3,000 dwellings or 150 per annum, which minus dwellings
completed between 2006 and 2010 (523 dwellings) giving a requirement over the study period
of 2,477 dwellings. Removing the outstanding commitments (549 dwellings) from this total
leaves the remaining Core Strategy requirement of 1,928 dwellings, which has been spread
over scenario period, and which is spatially distributed as follows:
• 70% in Oakham and Uppingham (1350 dwellings) (80% Oakham- 1080 dwellings; 20%
Uppingham- 270 dwellings);
• 20% in Local Service Centres (386 dwellings) (spread evenly across settlements: 14.3%
Cottesmore- 56 dwellings; 14.3% Edith Weston- 56 dwellings; 14.3% Empingham- 56
37
Please note, there are very small discrepancies between the above figures and those displayed below in Table 4-3. This was caused by rounding of figures during the calculation process but does not affect the overall assessment. In addition, the number given in table 4-3 the figures given in the table above represent the settlements that were assessed in this WCs and do not represent all the proposed growth within the county. As described above, only WwTW catchments where proposed growth is greater than 50 dwellings have been assessed (if more than one settlement lies within a catchment the cumulative growth figure has been assessed).
Technical Report January 2011 30
dwellings; 14.3% Greetham- 56 dwellings; 14.3% Ketton- 56 dwellings; 14.3% Market
Overton- 56 dwellings; 14.3% Ryhall- 56 dwellings); and
• 10% in Smaller Service Centres and Restraint Villages (193 dwellings), spatial distribution
unknown.
Scenario 2 is calculated as for Scenario 1, but the figures are 21% higher than the Core
Strategy, which gives a requirement for housing growth between 2006 and 2026 of 2,720
dwellings or 170 per annum. If the figures for dwellings completed between 2006 and 2010
(549 dwellings) are removed, this leaves the remaining Core Strategy requirement of 2,171
dwellings, distributed as follows:
• 70% in Oakham and Uppingham (1520 dwellings) (80% Oakham- 1216 dwellings; 20%
Uppingham- 304 dwellings);
• 20% in Local Service Centres (435 dwellings) (spread evenly across settlements: 14.3%
Cottesmore- 63 dwellings; 14.3% Edith Weston- 63 dwellings; 14.3% Empingham- 63
dwellings; 14.3% Greetham- 63 dwellings; 14.3% Ketton- 63 dwellings; 14.3% Market
Overton- 63 dwellings; 14.3% Ryhall- 63 dwellings); and
• 10% in Smaller Service Centres and Restraint Villages (218 dwellings), spatial distribution
unknown.
Scenario 3 is 48% higher than Core Strategy figures and gives a housing growth between 2006
and 2026 of 3680 dwellings or 230 per annum. If the figures for dwellings completed between
2006 and 2010 (549 dwellings) are removed, this leaves the remaining Core Strategy
requirement of 3,131 dwellings, distributed as follows:
• 70% in Oakham and Uppingham (2192 dwellings) (80% Oakham- 1753 dwellings; 20%
Uppingham- 439 dwellings);
• 20% in Local Service Centres (627 dwellings) (spread evenly across settlements: 14.3%
Cottesmore- 90 dwellings; 14.3% Edith Weston- 90 dwellings; 14.3% Empingham- 90
dwellings; 14.3% Greetham- 90 dwellings; 14.3% Ketton- 90 dwellings; 14.3% Market
Overton- 90 dwellings; 14.3% Ryhall- 90 dwellings); and
• 10% in Smaller Service Centres and Restraint Villages (314 dwellings), spatial distribution
unknown.
Scenarios 2 and 3 provide alternative scenarios of future housing growth that are substantially
higher than those which are currently being planned for in order to demonstrate the potential
implications of higher levels of growth.
4.4.2 Employment
Employment Scenario 1 represents the current site allocations, namely 2 hectares in Ketton, 12
hectares at Oakham Pillings Road and 2.1 hectares at Uppingham Gate, plus 5 hectares which
corresponds to the projected delivery over scenario period 2010-26, to give a total of 21.1
hectares. This will be spatially distributed as follows:
• 80% in Oakham (4 hectares); and
• 20% in Uppingham (1 hectares).
Technical Report January 2011 31
Employment Scenario 2 is calculated as per Scenario 1 above, but with an additional 10.5
hectares over and above the current site allocations, to give a total of 26.6 hectares. This will
be spatially distributed as follows:
• 80% in Oakham (8.4 hectares); and
• 20% in Uppingham (2.1 hectares).
Employment Scenario 3 is calculated as per Scenario 1 above, but with an additional 16
hectares over and above the current site allocations, to give a total of 32.1 hectares. This will
be spatially distributed as follows:
• 80% in Oakham (12.8 hectares)
• 20% in Uppingham (3.2 hectares)
No information was available regarding the type of employment and assumptions have
therefore not been made. In order to calculate the spread of jobs across the District across the
planning period, the proportional split of land area has been applied to the target job figures.
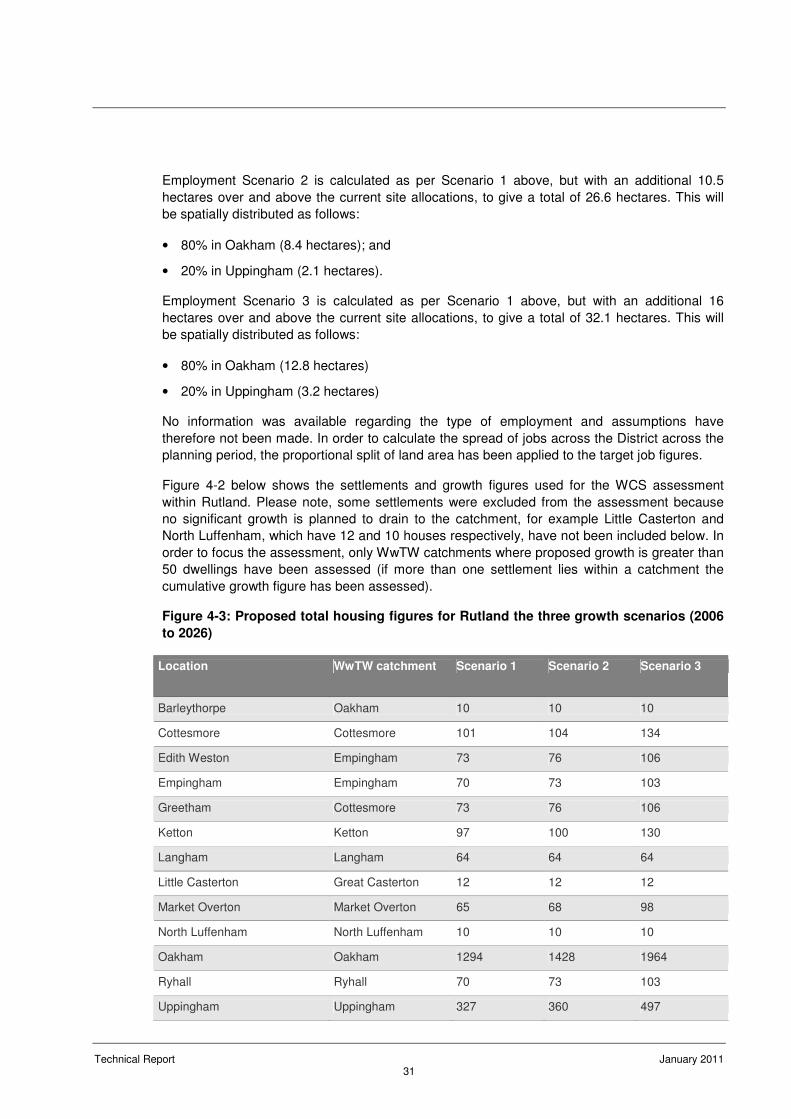
Figure 4-2 below shows the settlements and growth figures used for the WCS assessment
within Rutland. Please note, some settlements were excluded from the assessment because
no significant growth is planned to drain to the catchment, for example Little Casterton and
North Luffenham, which have 12 and 10 houses respectively, have not been included below. In
order to focus the assessment, only WwTW catchments where proposed growth is greater than
50 dwellings have been assessed (if more than one settlement lies within a catchment the
cumulative growth figure has been assessed).
Figure 4-3: Proposed total housing figures for Rutland the three growth scenarios (2006
to 2026)
Location WwTW catchment Scenario 1 Scenario 2 Scenario 3
Barleythorpe Oakham 10 10 10
Cottesmore Cottesmore 101 104 134
Edith Weston Empingham 73 76 106
Empingham Empingham 70 73 103
Greetham Cottesmore 73 76 106
Ketton Ketton 97 100 130
Langham Langham 64 64 64
Little Casterton Great Casterton 12 12 12
Market Overton Market Overton 65 68 98
North Luffenham North Luffenham 10 10 10
Oakham Oakham 1294 1428 1964
Ryhall Ryhall 70 73 103
Uppingham Uppingham 327 360 497
Technical Report January 2011 32
5 Wastewater Strategy
5.1 Introduction
The wastewater assessment addresses two key areas for wastewater: the baseline with
respect to treatment of wastewater and how much ‘spare’ capacity is available in existing
WwTW; and, the baseline with respect to wastewater or sewer network and whether there is
scope to use the existing and/or planned network system before upgrades are required.
An important aspect of the spare capacity of the existing wastewater treatment facilities is the
assessment of the environmental capacity of the receiving watercourses. Discharge of
additional treated wastewater from new development could have a detrimental impact on: the
water quality of receiving waters; the hydrological/hydraulic regime of receiving waters and
associated habitats; and, flood risk downstream of the discharge. In conjunction with the
findings of the Flood Risk, Water Quality and Ecology constraints assessments the constraints
of future wastewater treatment have been identified.
This section presents a summary of the methodology for, and the results of developing, the
outline wastewater strategy.
5.2 Baseline
5.2.1 WwTW Capacity Assessment
There are numerous WwTW within the study area in the main due to the flat topography of the
area, which results in it not being possible to drain catchments to a large, central treatment
works. It has therefore been the policy of AWS, and the preceding water boards, to build
numerous small works, which can drain small, discrete villages and catchments by gravity. To
drain to larger works in rural areas would require large volumes of wastewater to be pumped
over long distances, with the resulting energy demands making the process inefficient.
Several of the WwTW were excluded from the assessment, either because no significant
growth is planned to drain to the catchment, or the WwTW is too small and does not have
numeric values for its consented discharge (i.e. has a descriptive consent only). In order to
focus the assessment, only WwTW catchments where proposed growth is greater than 50
dwellings have been assessed (if more than one settlement lies within a catchment the
cumulative growth figure has been assessed). For this level of assessment, it is felt that a cut
off of 50 houses is an appropriate level of detail as this does not represent a significant flow
increase in a particular WwTW’s catchment.
The WwTW shown below in Table 5-1 were taken forward for assessment within the WCS.
The locations of these WwTW are shown in Figure 5-1.
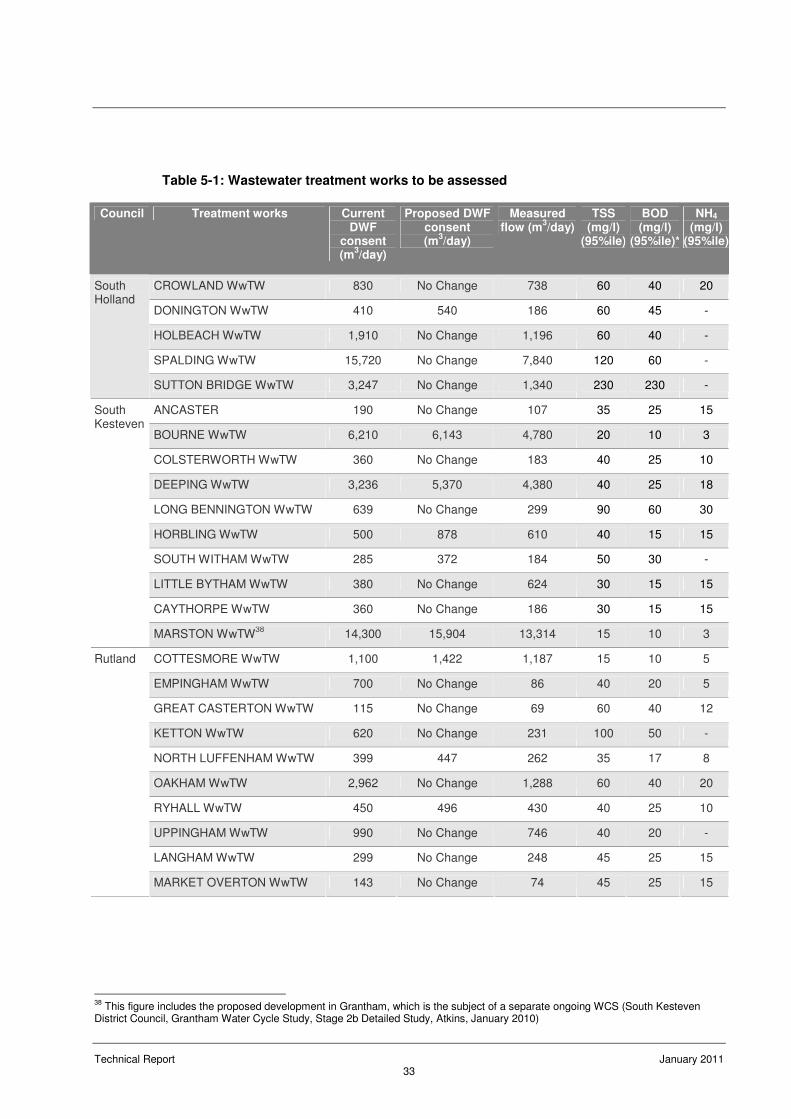
Technical Report January 2011 33
Table 5-1: Wastewater treatment works to be assessed
Council Treatment works Current DWF
consent (m
3/day)
Proposed DWF consent (m
3/day)
Measured flow (m
3/day)
TSS (mg/l)
(95%ile)
BOD (mg/l)
(95%ile)*
NH4 (mg/l)
(95%ile)
CROWLAND WwTW 830 No Change 738 60 40 20
DONINGTON WwTW 410 540 186 60 45 -
HOLBEACH WwTW 1,910 No Change 1,196 60 40 -
SPALDING WwTW 15,720 No Change 7,840 120 60 -
South Holland
SUTTON BRIDGE WwTW 3,247 No Change 1,340 230 230 -
ANCASTER 190 No Change 107 35 25 15
BOURNE WwTW 6,210 6,143 4,780 20 10 3
COLSTERWORTH WwTW 360 No Change 183 40 25 10
DEEPING WwTW 3,236 5,370 4,380 40 25 18
LONG BENNINGTON WwTW 639 No Change 299 90 60 30
HORBLING WwTW 500 878 610 40 15 15
SOUTH WITHAM WwTW 285 372 184 50 30 -
LITTLE BYTHAM WwTW 380 No Change 624 30 15 15
CAYTHORPE WwTW 360 No Change 186 30 15 15
South Kesteven
MARSTON WwTW38
14,300 15,904 13,314 15 10 3
COTTESMORE WwTW 1,100 1,422 1,187 15 10 5
EMPINGHAM WwTW 700 No Change 86 40 20 5
GREAT CASTERTON WwTW 115 No Change 69 60 40 12
KETTON WwTW 620 No Change 231 100 50 -
NORTH LUFFENHAM WwTW 399 447 262 35 17 8
OAKHAM WwTW 2,962 No Change 1,288 60 40 20
RYHALL WwTW 450 496 430 40 25 10
UPPINGHAM WwTW 990 No Change 746 40 20 -
LANGHAM WwTW 299 No Change 248 45 25 15
Rutland
MARKET OVERTON WwTW 143 No Change 74 45 25 15
38
This figure includes the proposed development in Grantham, which is the subject of a separate ongoing WCS (South Kesteven District Council, Grantham Water Cycle Study, Stage 2b Detailed Study, Atkins, January 2010)
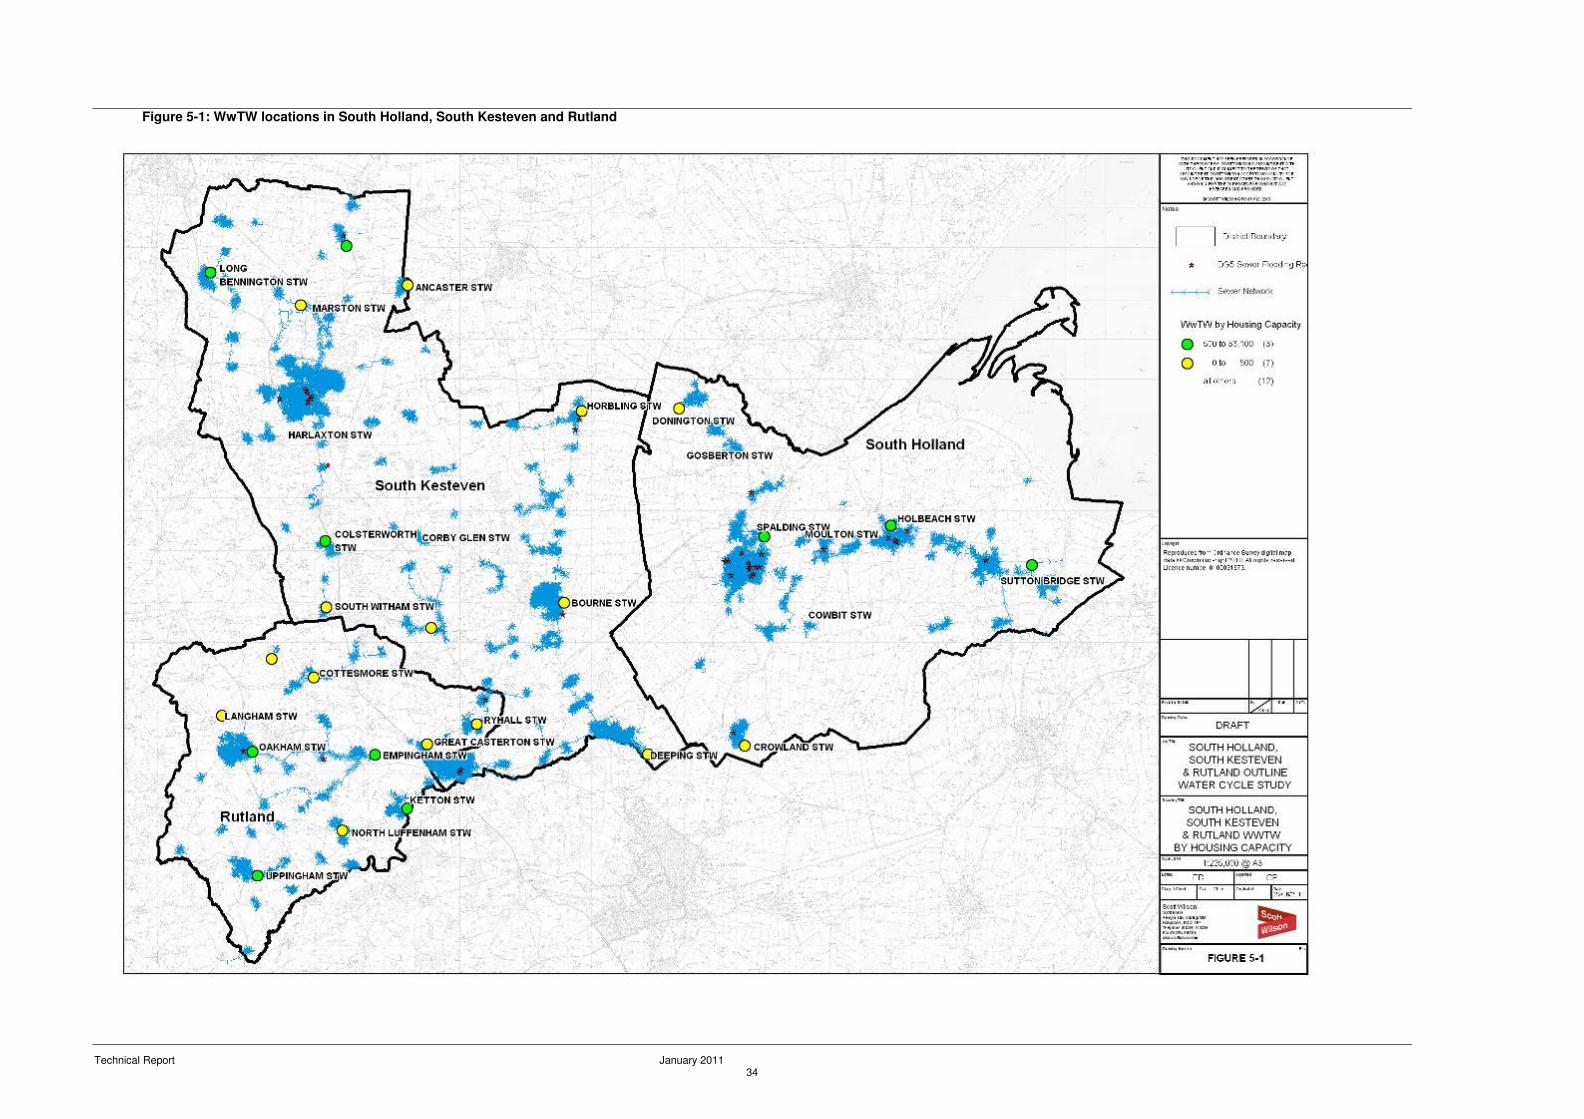
Technical Report January 2011 34
Figure 5-1: WwTW locations in South Holland, South Kesteven and Rutland
Technical Report January 2011 35
Proposed changes to Dry Weather Flow consent limits
DWF is a unit of measure, used by the Environment Agency in a discharge consent to describe
the maximum volume that can be discharged from wastewater treatment works. Until recent
changes were made to how DWF is measured and reported, DWF was defined as “the average
daily flow of sewage during seven consecutive days without rain following seven days during
which the rainfall did not exceed 0.25 mm on any one day, averaged over a summer and winter
period”. In industrial towns the seven days are replaced by five working days. Essentially it is
supposed to represent the proportion of flow treated by a WwTW that is made up of foul (or
waste) water and not surface water which is generated from rainfall events.
However, it is widely recognised that the previous definition of DWF had a number of
shortcomings, including the lack of qualifying periods without rainfall across an entire sewerage
catchment. A UKWIR project WW21/D to develop an alternative measure of DWF was carried
out in 2006, which concluded that the measure of DWF that would be the most appropriate
replacement for DWF was the 20th percentile (Q80)39
. Subsequent to this, Environment
Agency has accepted AWS using the 10th percentile rather than the 20
th percentile as the
measure of DWF at AWS WwTWs.
As a result of the redefinition of DWF and the installation of flow measurement at the majority of
AWS’s treatment works, discrepancies have been noted between consented and measured
DWF values. To rectify these discrepancies, AWS applied to vary all discharge consents where
there are measured flows higher than the consented DWF. These new DWF values are
referred to as the Proposed Consent. Where a WwTW has a proposed consent this figure has
been used in the assessment to represent the maximum flow that a WwTW is consented to
discharge during dry weather and, the actual flow that it is currently discharging. Effectively,
this means that there is no consented capacity at the WwTW to discharge any further flow
without applying for a further increase in consented flow.
Where no consent variation has been applied for, the existing consented DWF has been used
for the assessment. The Consented DWF values shown in Table 5-1 show proposed
consented values where appropriate, or existing DWF values where no application for a
variation has had to have been made. It should be noted that while the Environment Agency
has approved all proposed consents in principle, no varied consents have been issued.
However for Bourne WwTW, the revised consent limit is 6210 m3/d, which is not subject to the
“no headroom for growth condition”. The consent for Bourne revised for a different reason and
the revised limit has taken account of the committed growth in the catchment. AWS has stated
that it is therefore reasonably confident that there is sufficient headroom (current measured vs
consent limit) for the planned growth so Bourne.
Other proposed changes to discharge consents
Key actions have been identified in the RBMPs to begin the process of ensuring that all
waterbodies in the study area move towards achieving ‘Good’ status as required under the
WFD.
In addition, schemes were proposed under the Environment Agency’s National Environment
Programme (NEP) for investigation into risk of chemical pollution at Corby WwTW and to meet
39
An Improved Definition of Sewage Treatment Works Dry Weather Flow, Manuel Starr, 2006
Technical Report January 2011 36
the requirements of the UWWTD at Ketton WwTW. The NEP also proposed schemes to
reduce the levels of Ammonia in rivers by targeting discharges from Uppingham WwTW and
Holbeach WwTW. Uppingham STW will receive a 3 mg/l ammonia limit from 22nd Dec 2012.
It should also be noted that there is a proposed First Time Rural Sewerage Scheme for
Holbeach in AMP5, under s101 of the 1991 Water Industry Act40
. If this scheme goes ahead, it
could use up the majority of the spare capacity at Holbeach WwTW. It is not possible to fully
assess the scheme at this point due to uncertainties as to whether the scheme will progress,
but this should be taken into consideration during a Detailed WCS.
5.3 Capacity Assessment Methodology Overview
The assessment methodology for this WCS is based on that given in the Environment Agency’s
document ‘No deterioration and growth’, issued as draft in December 200941
. Although only
draft, it is felt that this document gives the best available methodology to assess the impacts of
growth on WFD targets and statuses and it has therefore been used as the basis of the
following assessment methodology. A summary process diagram is provided in Figure 5-2.
40
Water Industry Act 1991, HMSO, http://www.legislation.gov.uk/ukpga/1991/56/contents 41
No deterioration and growth, Environment Agency, 15th December 2009, DRAFT
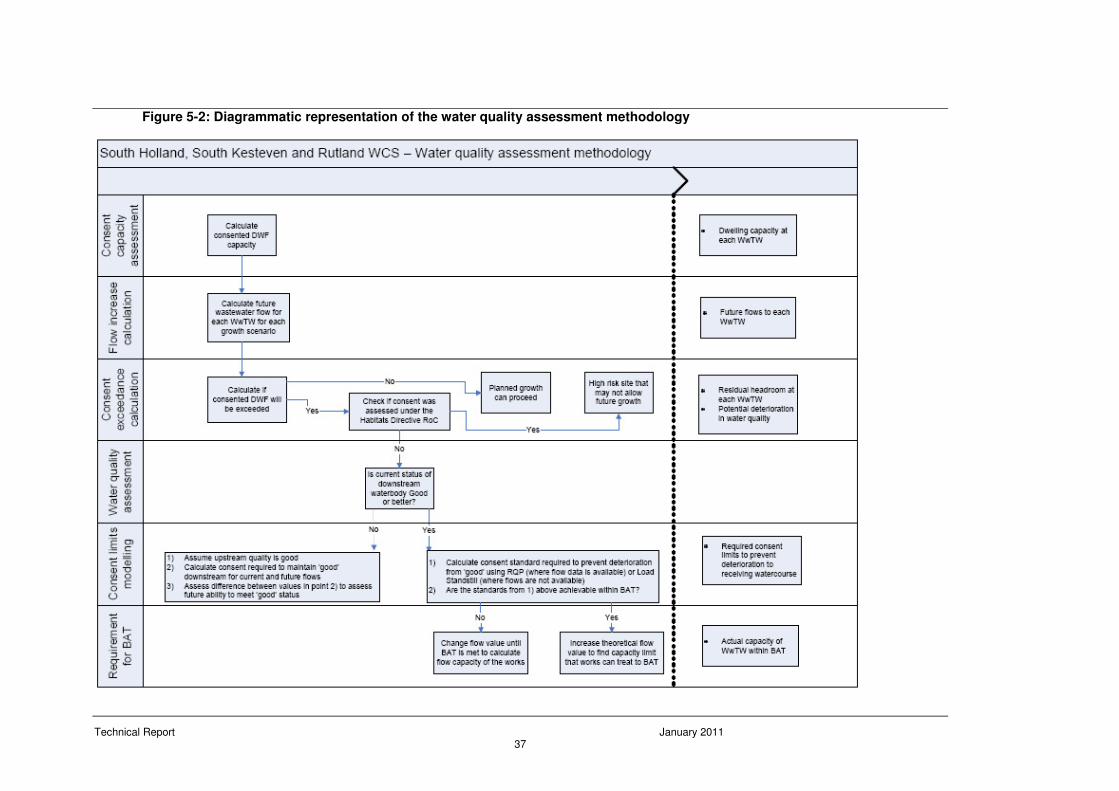
Technical Report January 2011 37
Figure 5-2: Diagrammatic representation of the water quality assessment methodology
Technical Report January 2011 38
5.4 Wastewater Treatment Capacity Assessment
5.4.1 Calculated consented volumetric capacity
Of the WwTW assessed, AWS have applied for an increase in consented DWF (new proposed
consent) for the following WwTWs which are therefore deemed to have no capacity in their
consented DWF for any further discharge:
• Cottesmore, North Luffenham, Ryhall, Deeping, Horbling, South Witham, Marston and Little
Bytham WwTWs42
.
The following WwTW had less than 20% variation between their measured and calculated
flows and the consent capacity to be able to treat further wastewater flow can therefore be
calculated as the difference between the measured and consented DWF:
• Great Casterton, Uppingham, Crowland, Spalding, Bourne, Deeping, Horbling, Marston,
Caythorpe, Langham and Market Overton WwTWs.
The remaining WwTW had greater than 20% variation between their measured and calculated
flows and the consent capacity was therefore calculated as the difference between the
calculated and consented DWF:
• Empingham, Ketton, Oakham, Donington, Holbeach, Sutton Bridge, Colsterworth and Long
Bennington WwTWs.
The calculations of volumetric flow capacity are presented in Table 5-2; the household figures
have been rounded to the nearest 50.
42
The recent consent variation for Bourne was carried out for a different reason and it should therefore not be considered to have no capacity as a result of this.
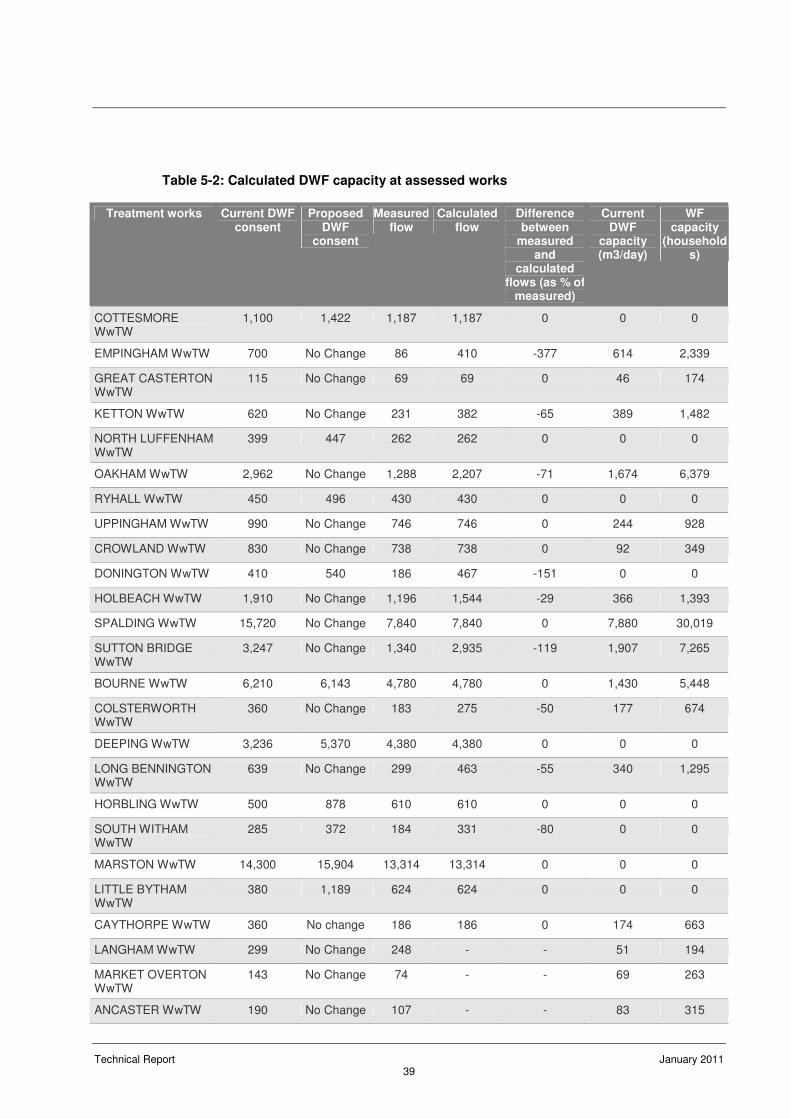
Technical Report January 2011 39
Table 5-2: Calculated DWF capacity at assessed works
Treatment works Current DWF consent
Proposed DWF
consent
Measured flow
Calculated flow
Difference between
measured and
calculated flows (as % of
measured)
Current DWF
capacity (m3/day)
WF capacity
(households)
COTTESMORE WwTW
1,100 1,422 1,187 1,187 0 0 0
EMPINGHAM WwTW 700 No Change 86 410 -377 614 2,339
GREAT CASTERTON WwTW
115 No Change 69 69 0 46 174
KETTON WwTW 620 No Change 231 382 -65 389 1,482
NORTH LUFFENHAM WwTW
399 447 262 262 0 0 0
OAKHAM WwTW 2,962 No Change 1,288 2,207 -71 1,674 6,379
RYHALL WwTW 450 496 430 430 0 0 0
UPPINGHAM WwTW 990 No Change 746 746 0 244 928
CROWLAND WwTW 830 No Change 738 738 0 92 349
DONINGTON WwTW 410 540 186 467 -151 0 0
HOLBEACH WwTW 1,910 No Change 1,196 1,544 -29 366 1,393
SPALDING WwTW 15,720 No Change 7,840 7,840 0 7,880 30,019
SUTTON BRIDGE WwTW
3,247 No Change 1,340 2,935 -119 1,907 7,265
BOURNE WwTW 6,210 6,143 4,780 4,780 0 1,430 5,448
COLSTERWORTH WwTW
360 No Change 183 275 -50 177 674
DEEPING WwTW 3,236 5,370 4,380 4,380 0 0 0
LONG BENNINGTON WwTW
639 No Change 299 463 -55 340 1,295
HORBLING WwTW 500 878 610 610 0 0 0
SOUTH WITHAM WwTW
285 372 184 331 -80 0 0
MARSTON WwTW 14,300 15,904 13,314 13,314 0 0 0
LITTLE BYTHAM WwTW
380 1,189 624 624 0 0 0
CAYTHORPE WwTW 360 No change 186 186 0 174 663
LANGHAM WwTW 299 No Change 248 - - 51 194
MARKET OVERTON WwTW
143 No Change 74 - - 69 263
ANCASTER WwTW 190 No Change 107 - - 83 315
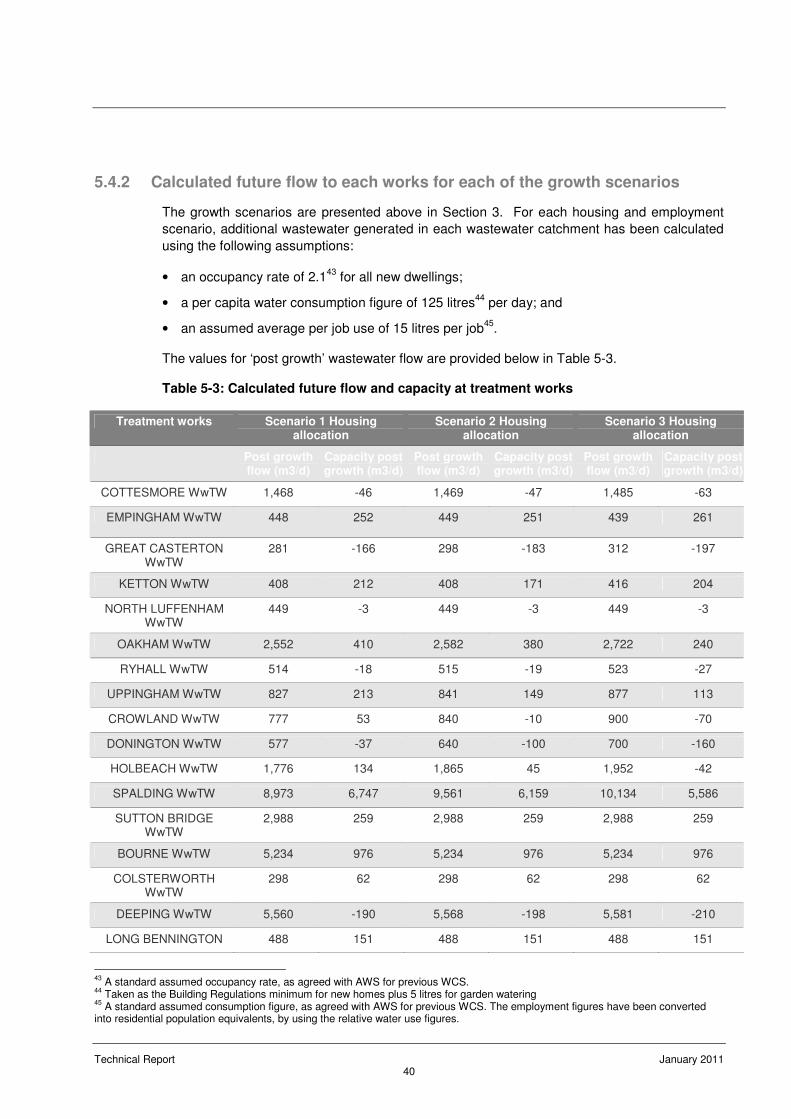
Technical Report January 2011 40
5.4.2 Calculated future flow to each works for each of the growth scenarios
The growth scenarios are presented above in Section 3. For each housing and employment
scenario, additional wastewater generated in each wastewater catchment has been calculated
using the following assumptions:
• an occupancy rate of 2.143
for all new dwellings;
• a per capita water consumption figure of 125 litres44
per day; and
• an assumed average per job use of 15 litres per job45
.
The values for ‘post growth’ wastewater flow are provided below in Table 5-3.
Table 5-3: Calculated future flow and capacity at treatment works
Treatment works Scenario 1 Housing allocation
Scenario 2 Housing allocation
Scenario 3 Housing allocation
Post growth flow (m3/d)
Capacity post growth (m3/d)
Post growth flow (m3/d)
Capacity post growth (m3/d)
Post growth flow (m3/d)
Capacity post growth (m3/d)
COTTESMORE WwTW 1,468 -46 1,469 -47 1,485 -63
EMPINGHAM WwTW 448 252 449 251 439 261
GREAT CASTERTON WwTW
281 -166 298 -183 312 -197
KETTON WwTW 408 212 408 171 416 204
NORTH LUFFENHAM WwTW
449 -3 449 -3 449 -3
OAKHAM WwTW 2,552 410 2,582 380 2,722 240
RYHALL WwTW 514 -18 515 -19 523 -27
UPPINGHAM WwTW 827 213 841 149 877 113
CROWLAND WwTW 777 53 840 -10 900 -70
DONINGTON WwTW 577 -37 640 -100 700 -160
HOLBEACH WwTW 1,776 134 1,865 45 1,952 -42
SPALDING WwTW 8,973 6,747 9,561 6,159 10,134 5,586
SUTTON BRIDGE WwTW
2,988 259 2,988 259 2,988 259
BOURNE WwTW 5,234 976 5,234 976 5,234 976
COLSTERWORTH WwTW
298 62 298 62 298 62
DEEPING WwTW 5,560 -190 5,568 -198 5,581 -210
LONG BENNINGTON 488 151 488 151 488 151
43
A standard assumed occupancy rate, as agreed with AWS for previous WCS. 44
Taken as the Building Regulations minimum for new homes plus 5 litres for garden watering 45
A standard assumed consumption figure, as agreed with AWS for previous WCS. The employment figures have been converted into residential population equivalents, by using the relative water use figures.
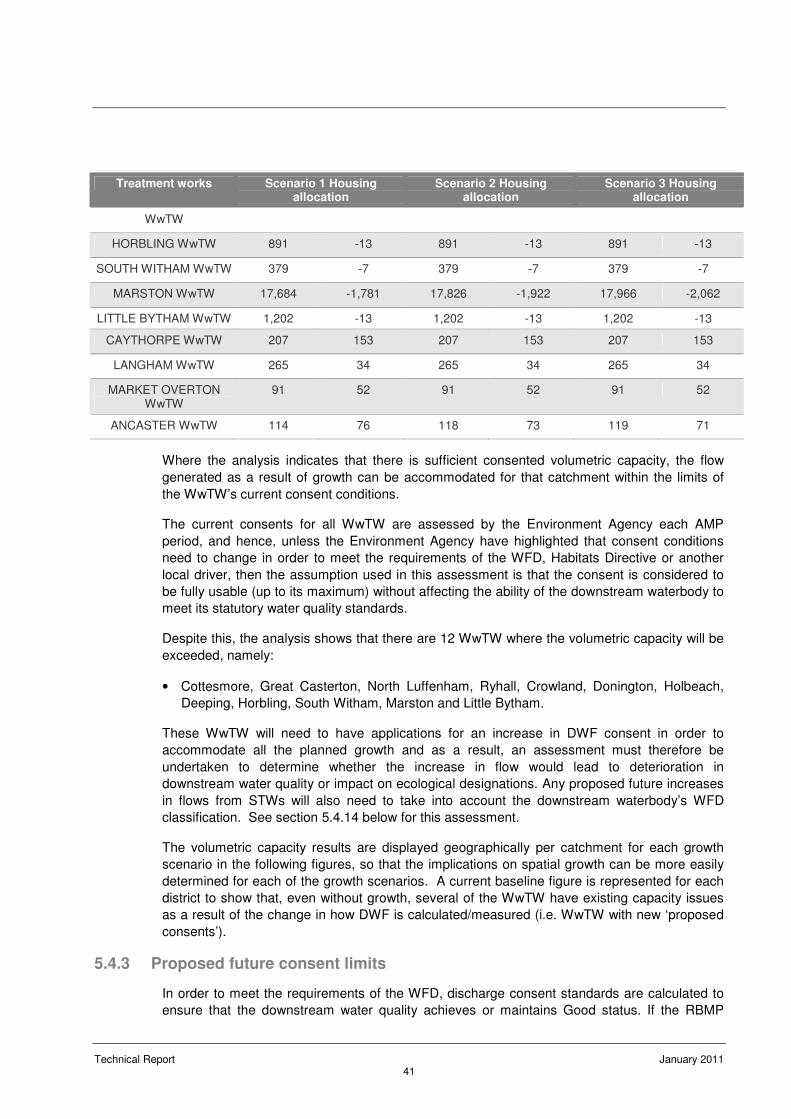
Technical Report January 2011 41
Treatment works Scenario 1 Housing allocation
Scenario 2 Housing allocation
Scenario 3 Housing allocation
WwTW
HORBLING WwTW 891 -13 891 -13 891 -13
SOUTH WITHAM WwTW 379 -7 379 -7 379 -7
MARSTON WwTW 17,684 -1,781 17,826 -1,922 17,966 -2,062
LITTLE BYTHAM WwTW 1,202 -13 1,202 -13 1,202 -13
CAYTHORPE WwTW 207 153 207 153 207 153
LANGHAM WwTW 265 34 265 34 265 34
MARKET OVERTON WwTW
91 52 91 52 91 52
ANCASTER WwTW 114 76 118 73 119 71
Where the analysis indicates that there is sufficient consented volumetric capacity, the flow
generated as a result of growth can be accommodated for that catchment within the limits of
the WwTW’s current consent conditions.
The current consents for all WwTW are assessed by the Environment Agency each AMP
period, and hence, unless the Environment Agency have highlighted that consent conditions
need to change in order to meet the requirements of the WFD, Habitats Directive or another
local driver, then the assumption used in this assessment is that the consent is considered to
be fully usable (up to its maximum) without affecting the ability of the downstream waterbody to
meet its statutory water quality standards.
Despite this, the analysis shows that there are 12 WwTW where the volumetric capacity will be
exceeded, namely:
• Cottesmore, Great Casterton, North Luffenham, Ryhall, Crowland, Donington, Holbeach,
Deeping, Horbling, South Witham, Marston and Little Bytham.
These WwTW will need to have applications for an increase in DWF consent in order to
accommodate all the planned growth and as a result, an assessment must therefore be
undertaken to determine whether the increase in flow would lead to deterioration in
downstream water quality or impact on ecological designations. Any proposed future increases
in flows from STWs will also need to take into account the downstream waterbody’s WFD
classification. See section 5.4.14 below for this assessment.
The volumetric capacity results are displayed geographically per catchment for each growth
scenario in the following figures, so that the implications on spatial growth can be more easily
determined for each of the growth scenarios. A current baseline figure is represented for each
district to show that, even without growth, several of the WwTW have existing capacity issues
as a result of the change in how DWF is calculated/measured (i.e. WwTW with new ‘proposed
consents’).
5.4.3 Proposed future consent limits
In order to meet the requirements of the WFD, discharge consent standards are calculated to
ensure that the downstream water quality achieves or maintains Good status. If the RBMP
Technical Report January 2011 42
indicates that the current status is Moderate or worse, then the assessment should be aiming
to show what the WwTW needs to achieve in order to enable the watercourse to meet ‘Good’
Status as defined in the WFD.
In order to determine appropriate consent limits to meet these conditions, a combination of
Mass Balance calculations (using the Environment Agency River Quality Planning [RQP] tool)
and Load Standstill calculation have been used to assess the required consent standards for
the affected WwTW.
The consent standards will be determined using RQP Mass Balance calculations where
upstream river flow data are available or Load Standstill Calculations where no upstream river
flow data are available. For those works where the flow or water quality sampling points are
either downstream or at some distance upstream, both RQP and Load Standstill Calculations
will be carried out, to provide a quality check on the suggested consent limits obtained.
The modelling was undertaken to determine what quality conditions (or consent standards)
would need to be applied to the discharges to ensure no deterioration in water quality
downstream and hence meet WFD standards and ecological requirements downstream. This
is to determine whether a feasible solution to increase the discharge at the existing WwTW is
available, and whether this is achievable within the limits of conventional wastewater treatment
technology46
. Modelling has been undertaken for the key discharge parameters of Ammonia
(NH4), Biochemical Oxygen Demand (BOD) and Phosphorus (P).
If the consent standards are not achievable within the limits of conventional wastewater
treatment technology, the increased flow that the WwTW can accommodate is calculated. If the
consent limits can be achieved within the limits of conventional wastewater treatment
technology, the maximum additional flow which the works can accommodate is calculated, to
assess the number of new dwellings that can be connected to a particular WwTW.
Using the guidance set out in the Environment Agency’s draft No Deterioration document47
,
Good status has been used as the target status for all WwTW. A summary is given in Table 5-
4. The consent limits in italics were obtained from the RQP method; all of the others were
obtained from the load standstill method.
46
i.e. The limit of conventional wastewater treatment technology is currently considered to be the at the following limits for the following determinands 5 mg/l BOD, 1 mg/l NH4 and 1 mg/l P 47
No deterioration and growth, Environment Agency, 15th December 2009, DRAFT
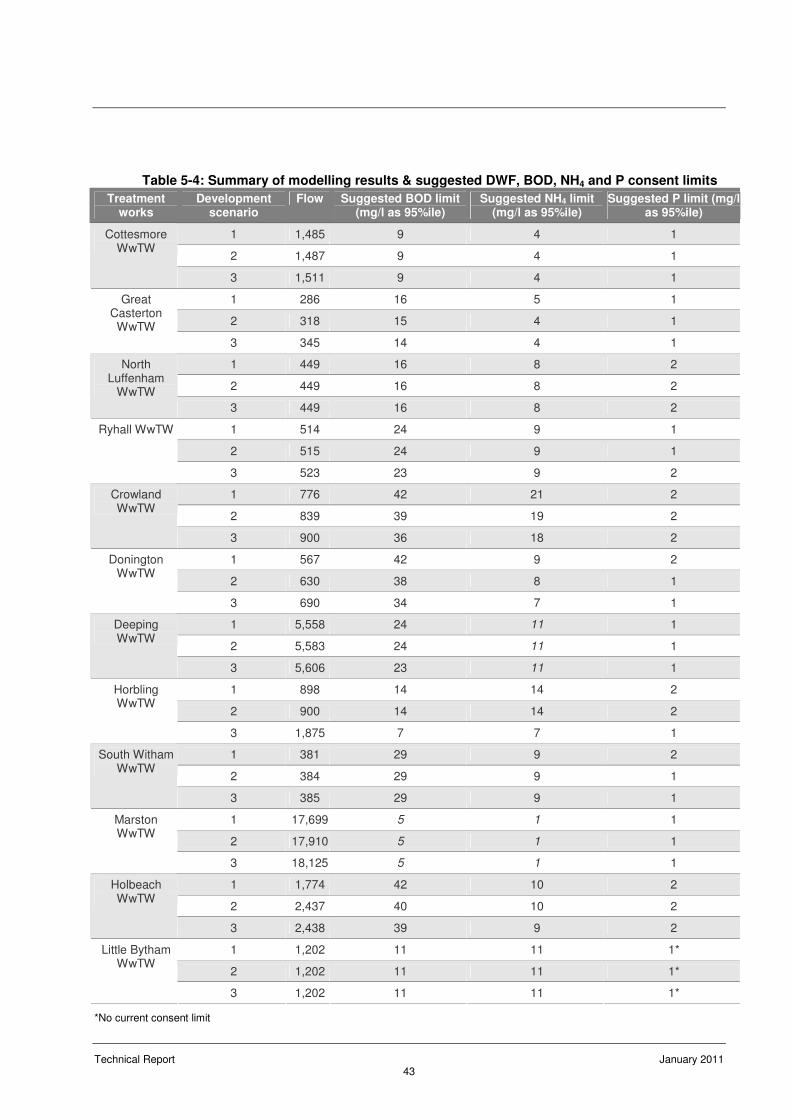
Technical Report January 2011 43
Table 5-4: Summary of modelling results & suggested DWF, BOD, NH4 and P consent limits
Treatment works
Development scenario
Flow Suggested BOD limit (mg/l as 95%ile)
Suggested NH4 limit (mg/l as 95%ile)
Suggested P limit (mg/l as 95%ile)
1 1,485 9 4 1
2 1,487 9 4 1
Cottesmore WwTW
3 1,511 9 4 1
1 286 16 5 1
2 318 15 4 1
Great Casterton WwTW
3 345 14 4 1
1 449 16 8 2
2 449 16 8 2
North Luffenham
WwTW
3 449 16 8 2
1 514 24 9 1
2 515 24 9 1
Ryhall WwTW
3 523 23 9 2
1 776 42 21 2
2 839 39 19 2
Crowland WwTW
3 900 36 18 2
1 567 42 9 2
2 630 38 8 1
Donington WwTW
3 690 34 7 1
1 5,558 24 11 1
2 5,583 24 11 1
Deeping WwTW
3 5,606 23 11 1
1 898 14 14 2
2 900 14 14 2
Horbling WwTW
3 1,875 7 7 1
1 381 29 9 2
2 384 29 9 1
South Witham WwTW
3 385 29 9 1
1 17,699 5 1 1
2 17,910 5 1 1
Marston WwTW
3 18,125 5 1 1
1 1,774 42 10 2
2 2,437 40 10 2
Holbeach WwTW
3 2,438 39 9 2
1 1,202 11 11 1*
2 1,202 11 11 1*
Little Bytham WwTW
3 1,202 11 11 1*
*No current consent limit
Technical Report January 2011 44
The table above indicates that, with the exception of Marston, all of the improvements are
technically feasible within the limits of conventional treatment, which is currently considered by
AWS to be 8 mg/l for BOD, 1 mg/l for NH4 and 1 mg/l for P, and that with upgrades at certain
WwTW, the additional flow could be treated to a higher quality and still ensure downstream
compliance with water quality and protection of ecological sites. Further water quality
modelling, in conjunction with discussions with the Environment Agency, should be carried out
for Marston WwTW. More detailed assessment may allow the proposed consent limits to be
relaxed.
5.5 Environmental and Ecological Impact
It was decided, in consultation with the three client authorities, that due to the differences in
assessment and designation of local wildlife sites (which are designated at the local authority
level), that it would be impractical and inconsistent to assess these in this WCS. Therefore only
sites which are designated at a national or international level have been considered.
5.5.1 Internationally designated sites
The Wash SPA/Ramsar site and The Wash & North Norfolk Coast SAC
An analysis of WwTW capacity within South Holland, South Kesteven and Rutland showed that
there are 12 WwTW where the volumetric capacity will be exceeded, namely: Cottesmore,
Great Casterton, North Luffenham, Ryhall, Crowland, Donington, Holbeach, Deeping, Horbling,
South Witham, Marston and Little Bytham. Five of these WwTW’s lie in Rutland, with a further
three in South Holland and two in South Kesteven. See Figure 5-1.
As such it will be necessary to apply for an increase in the consented discharge volume for
each of these works to meet the housing levels to be delivered within the study area. All of
these WwTWs discharge to watercourses that ultimately drain (via the Witham, Nene or
Welland) into The Wash SPA/Ramsar site and Wash & North Norfolk Coast SAC.
Studies indicate that The Wash is a P-limited system with a N:P ratio of >10 and that
freshwater species predominate in The Wash estuaries. Natural England in its Regulation 33
advice for the site indicated that most features are moderately sensitive to nutrient enrichment,
but only intertidal sand and mud are moderately vulnerable. There are no highly vulnerable
features.
However, the Environment Agency Review of Consents (RoC) process undertaken for The
Wash SPA and Wash & North Norfolk Coast SAC concluded that while the features of the
Wash are generally sensitive to eutrophication and The Wash can be classed as a
hypernutrified system, it is not currently eutrophic. According to the RoC report, marine
influences rather than fluvial inputs and discharges dominate nutrient dynamics in the system;
estimates indicate that the vast proportion of the nutrient flux (in excess of 99 %) occurs across
the seaward boundary, due to the extent of the bay closing line and the large tidal volumes
involved. Despite the high marine nutrient input, the high turbidity, tidal range and flushing rates
appear to prevent serious biological response to nutrient enrichment. In addition, the RoC
concluded that although fluvial nutrient inputs have been high, patterns/temporal trends have
been stable for over 25 years (and more recently are in decline due to the Urban Wastewater
Treatment Directive). Moreover, the marine environment is very turbid with limited light
availability, which limits the build up of algae. As such, there is no evidence that
hypernutrification and seasonally high production of algae in the tidal freshwaters or brackish
Technical Report January 2011 45
waters of the estuaries is adversely affecting the ecological functioning of The Wash system
and thereby having any undesirable disturbance to the balance of organisms and deterioration
of water quality.
The RoC report concludes that not only is the Wash not currently eutrophic, but 'An
assessment of trends in nutrient loading and modelling of future risks does not suggest that
these waters were at risk of becoming eutrophic'. On this basis the report seemed to be
indicating that while the interest features of the European site(s) have a sensitivity to
eutrophication, there are inherent factors within the Wash system that prevents eutrophication
(particularly due to fluvial inputs as these have a much less significant role than marine nutrient
inputs in the overall nutrient status of The Wash). Due to these inherent limiting factors, it can
be concluded that the small increase in fluvial nutrient inputs that would be associated with the
proposed growth in South Holland, South Kesteven and Rutland would be unlikely to have an
adverse effect, even when considered 'in combination'.
It can therefore be concluded that any increase in these consented discharge volumes would
be unlikely to lead to a significant adverse effect on The Wash SPA/Ramsar site or Wash &
North Norfolk Coast SAC and as such no further studies are required as part of the detailed
Water Cycle Study.
Rutland Water SPA & Ramsar site
Rutland Water a drinking water storage reservoir, which is heavily managed by AWS who
balances abstraction and replenishment to ensure a continued water supply to customers
across the region. The natural upstream catchment is small with minimal inputs from the River
Gwash and the Egleton Brook. However, the catchment is artificially enlarged by pumped
inputs from the River Welland and River Nene. Assessment of the water quality in Rutland
Water therefore has to include the quality and influences in the catchments of the Welland and
Nene upstream of the abstraction points combined with the immediate catchment of the
reservoir itself.
From 1993, a project to control levels of nutrients and prevent eutrophication of rivers and
standing waters was implemented on WwTW on the rivers Nene and Welland and on Oakham
WwTW that discharges into Rutland Water. The River Welland, River Nene and Rutland Water
are all designated Sensitive Areas UWWTD and as such, any large (over 10,000 population
equivalent) WwTW discharging to the watercourse/reservoir can be targeted reduce nutrient
outputs. Six WwTWs upstream of Rutland Water have progressively brought nutrient stripping
online since 1998, which has resulted in a reduction in P levels in Rutland Water48
.
The Appropriate Assessment carried out as part of the Habitats Directive Review of Consents
concluded that there are no Water Quality Consents which have been shown to have an
adverse affect on Rutland Water SPA, even under worst case scenarios in combination with
other potentially significant influences on the site.
The effects of increased surface water run-off on Rutland Water should also be considered,
once the individual development sites are known. However, it is thought at this point that there
should be sufficient scope for the use of SuDS in new development to ensure adverse effects
of increased surface water run-off can be mitigated.
Baston Fen SAC
48
Rutland Water Appropriate Assessment, Environment Agency, 2008
Technical Report January 2011 46
Baston Fen SAC is a 2 km long drainage channel, The Counterdrain, running alongside Baston
Fen. It contains high densities of Spined loach Cobitis taenia, and is an example of spined
loach populations in the Welland catchment. The patchy cover from submerge plants provides
excellent habitat for the species.
The SAC is described as being in Favourable condition49
and it can therefore be assumed that
it is not currently being adversely affected by wastewater discharges. There are no WwTW
upstream of Surfleet Lows on the River Glen and the proposed growth will therefore not impact
upon the SAC.
5.5.2 Nationally designated sites
SSSIs (other than those which are already covered by the international designations
above)
There are two SSSIs in South Holland District; Cowbit Wash SSSI is designated for its
archaeological interest features rather than ecological features, but the archaeological features
are water dependent and the site is therefore dependent on groundwater levels and could be
subject to impacts from the proposed development. However, no impacts on groundwater
levels in the vicinity of Cowbit Wash SSSI are anticipated as a result of changes to the
abstractions or wastewater discharges from the proposed development. Surfleet Lows SSSI is
one of the few remaining wet alluvial meadows in Lincolnshire which has not been subjected to
agricultural improvement. Meadows of this type are now rare throughout lowland Britain and
Surfleet Lows displays a typical range of meadow plants is present as well as a number of
species more characteristic of coastal locations. Surfleet Lows SSSI is current in Favourable
condition and it can therefore be assumed that it is not currently being adversely affected by
wastewater discharges. Surfleet lies within the catchment of Spalding WwTW, which
discharges to the River Welland, whereas Surfleet Lows lies upstream of the discharge point,
on the River Glen, a tributary of the Welland. There are no WwTW upstream of Surfleet Lows
on the River Glen and the proposed growth will therefore not impact upon the SSSI.
Rutland has numerous SSSIs but (other than Rutland Water itself) only Empingham Marshy
Meadows SSSI is particularly hydrologically sensitive and it is not connected with any WwTWs
or public water supply abstraction points. There are several SSSIs in South Kesteven District
but only three (Baston & Thurlby Fens, Langtoft Gravel Pits and Deeping Gravel Pits) are
particularly hydrologically sensitive. Of these, only Baston & Thurlby Fens SSSI is connected
with the fluvial regime, but this has already been considered above as part of Baston Fen SAC.
Horbling Fen SSSI, as with Cowbit Fen, is designated for its archaeological interest features
rather than water dependent ecological features and will therefore not be considered further as
part of this WCS. Shacklewell Hollows SSSI contains a range of semi-natural plant
communities which have developed along the valley of a small tributary of the River Gwash.
The tributary itself is a clean-water stream which drains strata of the Jurassic Lincolnshire
Limestones and Northampton sands50
.The SSSI lies immediately downstream of Empingham
WwTW, which could receive additional flows as a result of the proposed development.
However, there is sufficient headroom within the consented DWF at the works to ensure
increase will be required as a result of the proposed development.
Eyebrook Reservoir SSSI lies to the west of the study area, in Leicestershire. The site is a
major wetland area which combines an extensive sheet of open water with a complex of
49
http://www.jncc.gov.uk/protectedsites/sacselection/sac.asp?EUcode=UK0030085 50
http://www.sssi.naturalengland.org.uk/citation/citation_photo/1001268.pdf
Technical Report January 2011 47
wetland and lakeside habitats including mudflats, marsh, pasture, broad-leaved woodland, and
broad-leaved, mixed and coniferous plantations. In autumn and winter the site attracts large
numbers of ducks most notably Wigeon, Mallard, Teal and Pochard, while in spring and
autumn flocks of a wide variety of wading birds on passage use the area for feeding51
. The site
is heavily dependent on groundwater and could therefore be subject to impacts from the
proposed development. However, no impacts on groundwater levels are anticipated as a result
of the wastewater discharges from the proposed development.
Therefore, no further investigation of impacts on Sites of Special Scientific Interest should be
required as part of the WCS. Figure 5-3 shows the location of designated conservation sites
within the study area.
51
http://www.sssi.naturalengland.org.uk/citation/citation_photo/1004428.pdf
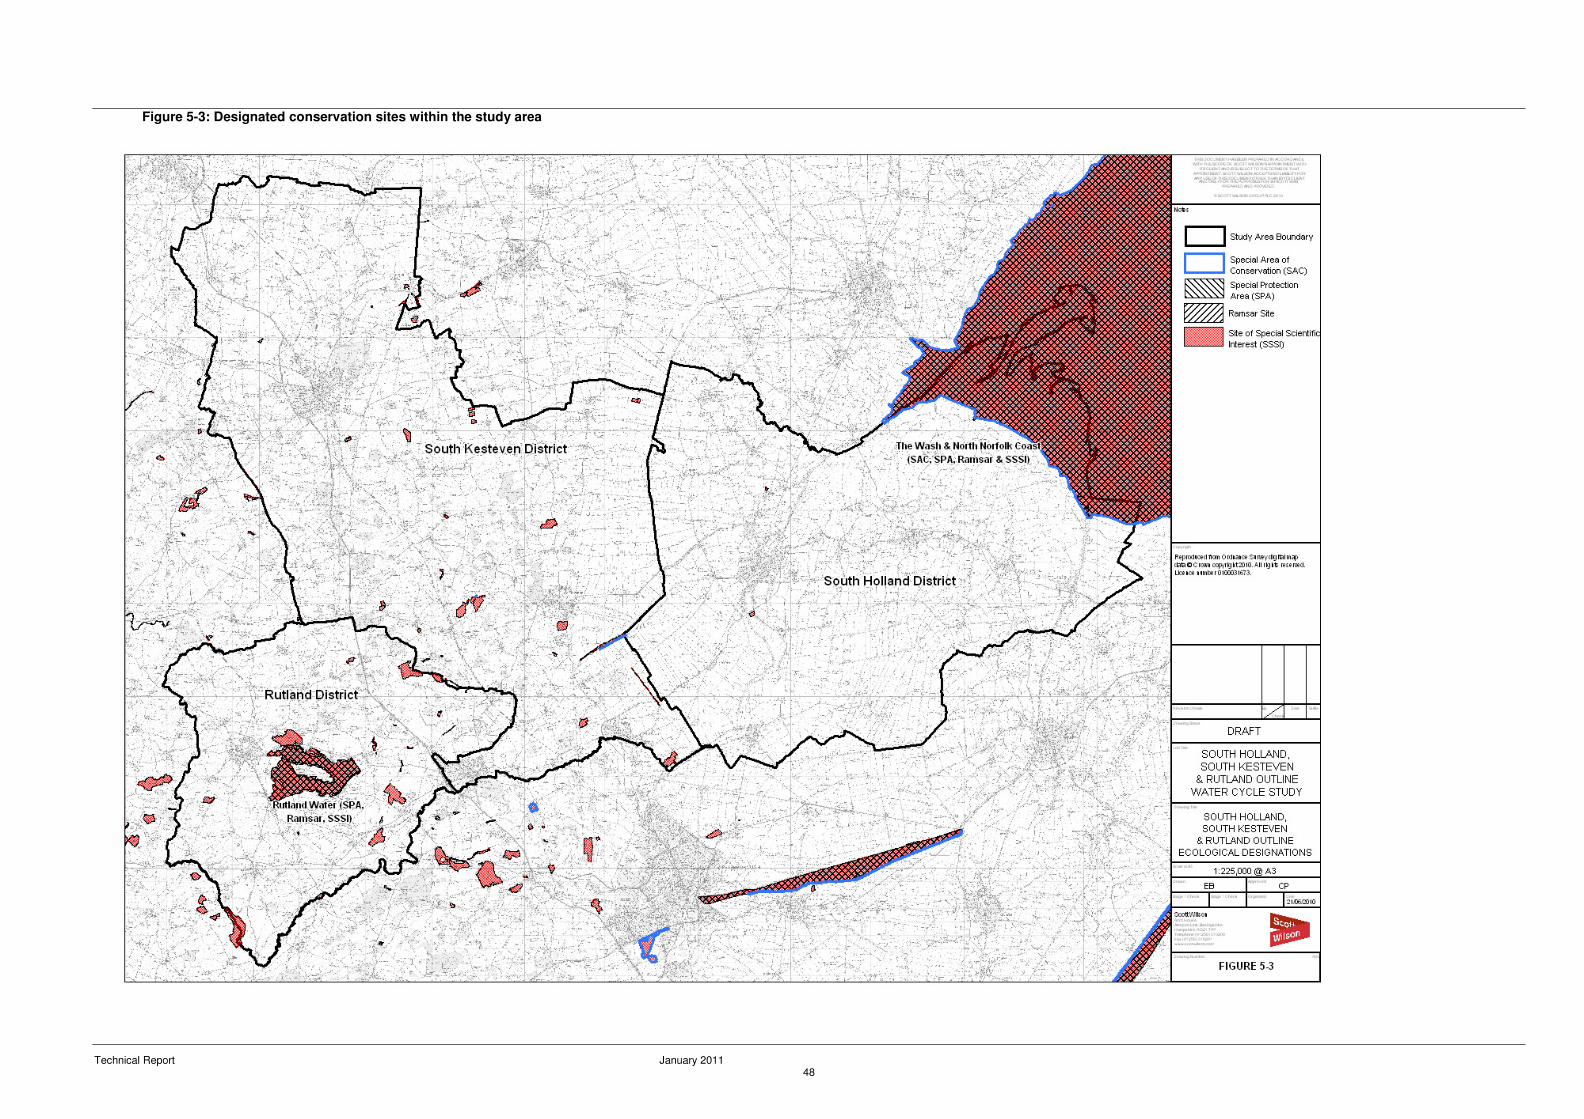
Technical Report January 2011 48
Figure 5-3: Designated conservation sites within the study area
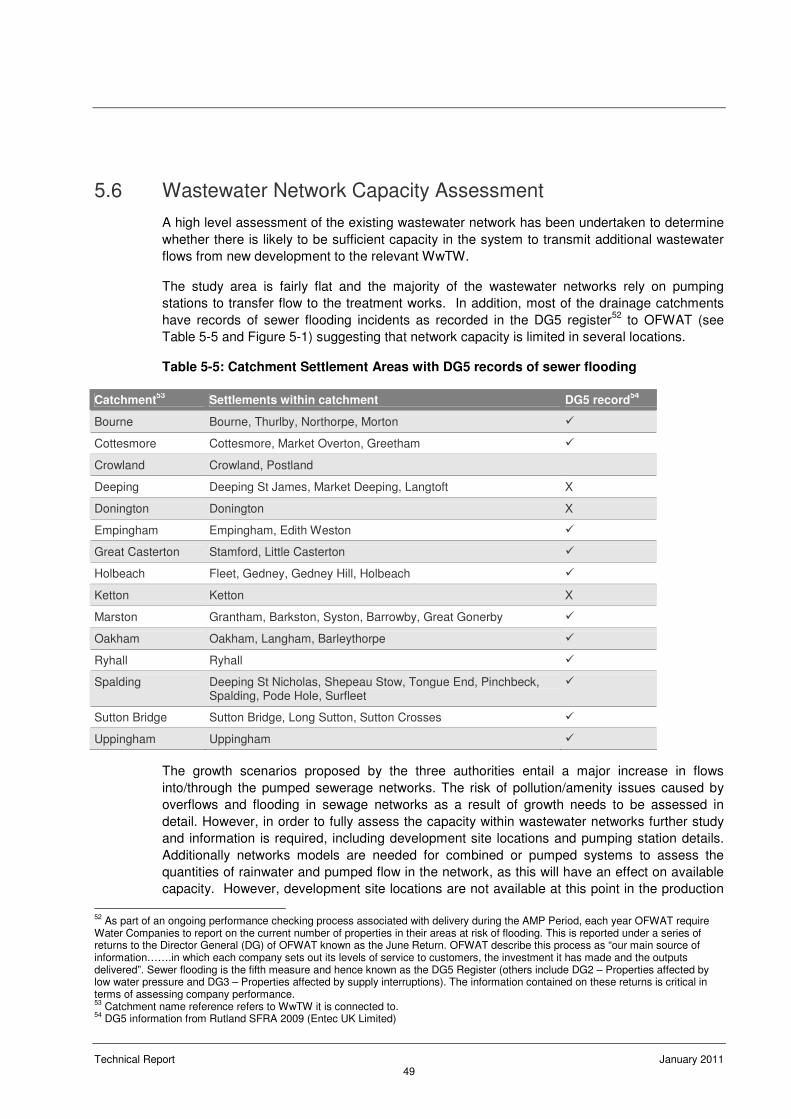
Technical Report January 2011 49
5.6 Wastewater Network Capacity Assessment
A high level assessment of the existing wastewater network has been undertaken to determine
whether there is likely to be sufficient capacity in the system to transmit additional wastewater
flows from new development to the relevant WwTW.
The study area is fairly flat and the majority of the wastewater networks rely on pumping
stations to transfer flow to the treatment works. In addition, most of the drainage catchments
have records of sewer flooding incidents as recorded in the DG5 register52
to OFWAT (see
Table 5-5 and Figure 5-1) suggesting that network capacity is limited in several locations.
Table 5-5: Catchment Settlement Areas with DG5 records of sewer flooding
Catchment53
Settlements within catchment DG5 record54
Bourne Bourne, Thurlby, Northorpe, Morton �
Cottesmore Cottesmore, Market Overton, Greetham �
Crowland Crowland, Postland
Deeping Deeping St James, Market Deeping, Langtoft X
Donington Donington X
Empingham Empingham, Edith Weston �
Great Casterton Stamford, Little Casterton �
Holbeach Fleet, Gedney, Gedney Hill, Holbeach �
Ketton Ketton X
Marston Grantham, Barkston, Syston, Barrowby, Great Gonerby �
Oakham Oakham, Langham, Barleythorpe �
Ryhall Ryhall �
Spalding Deeping St Nicholas, Shepeau Stow, Tongue End, Pinchbeck, Spalding, Pode Hole, Surfleet
�
Sutton Bridge Sutton Bridge, Long Sutton, Sutton Crosses �
Uppingham Uppingham �
The growth scenarios proposed by the three authorities entail a major increase in flows
into/through the pumped sewerage networks. The risk of pollution/amenity issues caused by
overflows and flooding in sewage networks as a result of growth needs to be assessed in
detail. However, in order to fully assess the capacity within wastewater networks further study
and information is required, including development site locations and pumping station details.
Additionally networks models are needed for combined or pumped systems to assess the
quantities of rainwater and pumped flow in the network, as this will have an effect on available
capacity. However, development site locations are not available at this point in the production
52
As part of an ongoing performance checking process associated with delivery during the AMP Period, each year OFWAT require Water Companies to report on the current number of properties in their areas at risk of flooding. This is reported under a series of returns to the Director General (DG) of OFWAT known as the June Return. OFWAT describe this process as “our main source of information…….in which each company sets out its levels of service to customers, the investment it has made and the outputs delivered”. Sewer flooding is the fifth measure and hence known as the DG5 Register (others include DG2 – Properties affected by low water pressure and DG3 – Properties affected by supply interruptions). The information contained on these returns is critical in terms of assessing company performance. 53
Catchment name reference refers to WwTW it is connected to. 54
DG5 information from Rutland SFRA 2009 (Entec UK Limited)
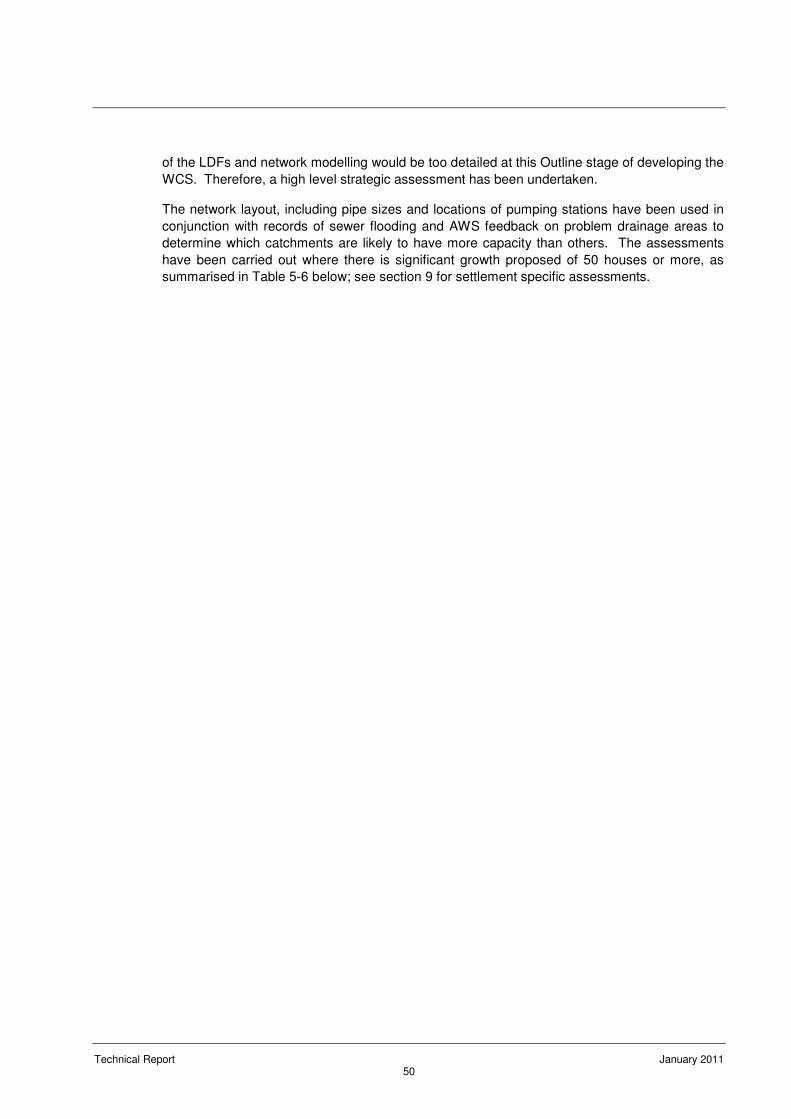
Technical Report January 2011 50
of the LDFs and network modelling would be too detailed at this Outline stage of developing the
WCS. Therefore, a high level strategic assessment has been undertaken.
The network layout, including pipe sizes and locations of pumping stations have been used in
conjunction with records of sewer flooding and AWS feedback on problem drainage areas to
determine which catchments are likely to have more capacity than others. The assessments
have been carried out where there is significant growth proposed of 50 houses or more, as
summarised in Table 5-6 below; see section 9 for settlement specific assessments.
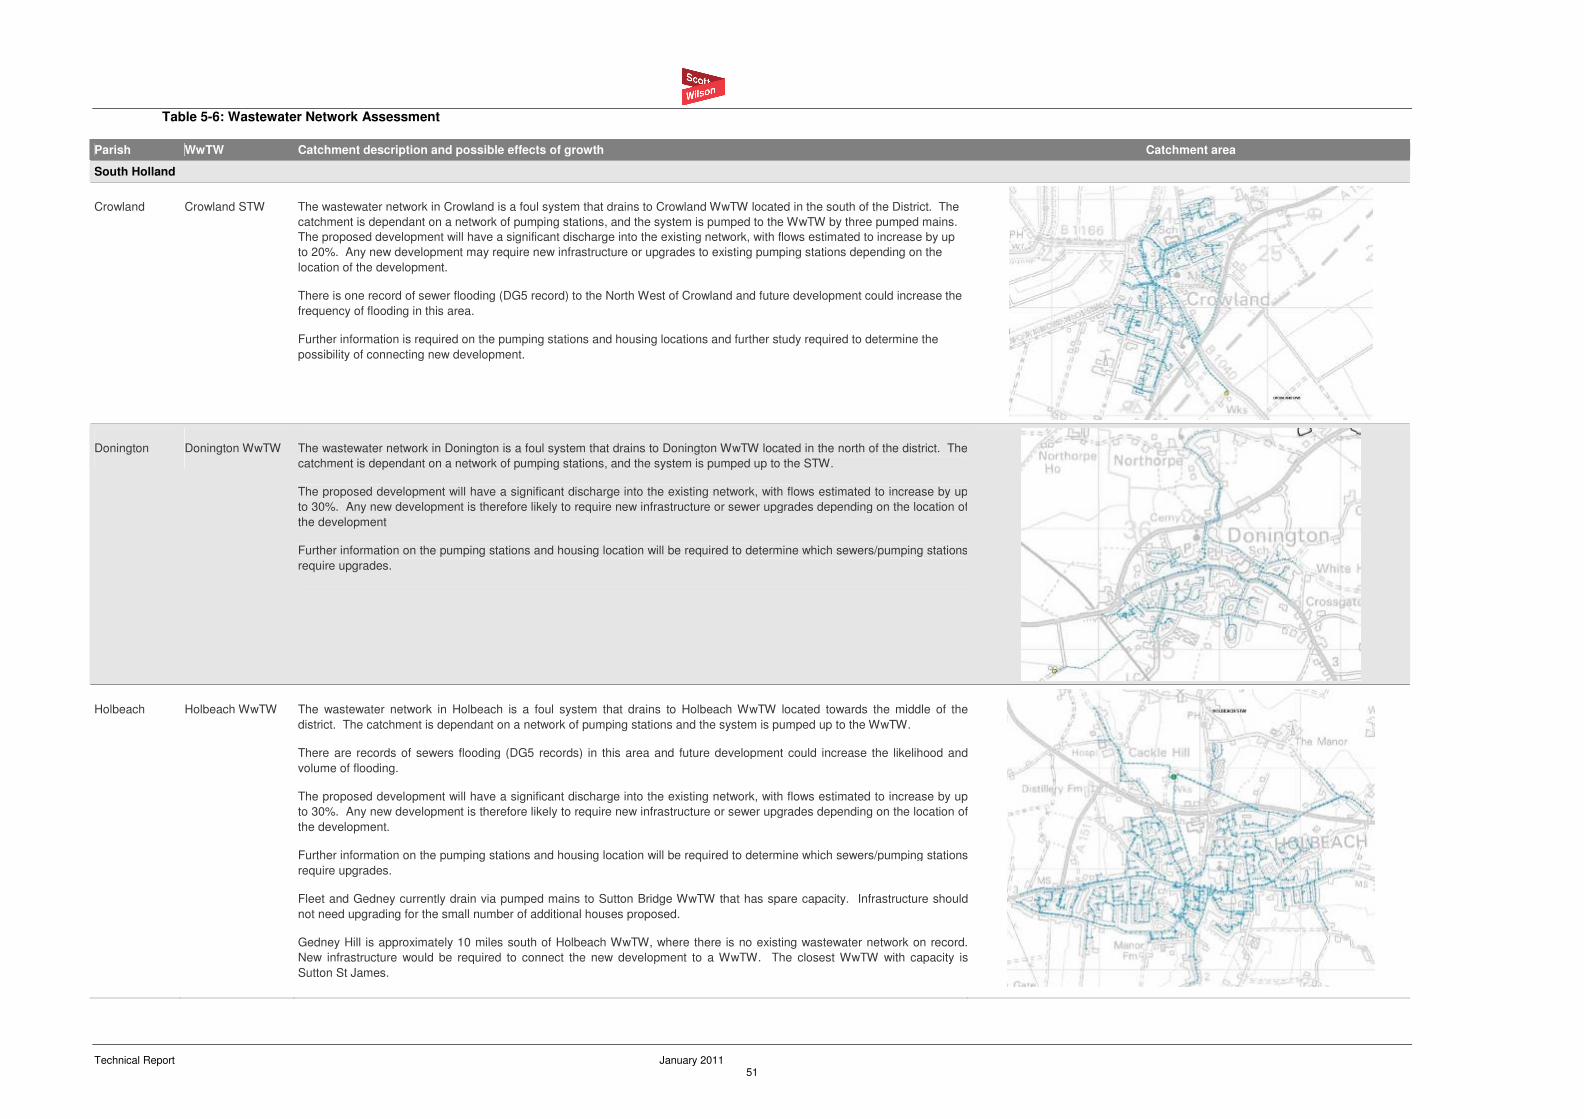
Technical Report January 2011 51
Table 5-6: Wastewater Network Assessment
Parish WwTW Catchment description and possible effects of growth Catchment area
South Holland
Crowland Crowland STW The wastewater network in Crowland is a foul system that drains to Crowland WwTW located in the south of the District. The
catchment is dependant on a network of pumping stations, and the system is pumped to the WwTW by three pumped mains.
The proposed development will have a significant discharge into the existing network, with flows estimated to increase by up
to 20%. Any new development may require new infrastructure or upgrades to existing pumping stations depending on the
location of the development.
There is one record of sewer flooding (DG5 record) to the North West of Crowland and future development could increase the
frequency of flooding in this area.
Further information is required on the pumping stations and housing locations and further study required to determine the
possibility of connecting new development.
Donington Donington WwTW The wastewater network in Donington is a foul system that drains to Donington WwTW located in the north of the district. The
catchment is dependant on a network of pumping stations, and the system is pumped up to the STW.
The proposed development will have a significant discharge into the existing network, with flows estimated to increase by up
to 30%. Any new development is therefore likely to require new infrastructure or sewer upgrades depending on the location of
the development
Further information on the pumping stations and housing location will be required to determine which sewers/pumping stations
require upgrades.
Holbeach Holbeach WwTW The wastewater network in Holbeach is a foul system that drains to Holbeach WwTW located towards the middle of the
district. The catchment is dependant on a network of pumping stations and the system is pumped up to the WwTW.
There are records of sewers flooding (DG5 records) in this area and future development could increase the likelihood and
volume of flooding.
The proposed development will have a significant discharge into the existing network, with flows estimated to increase by up
to 30%. Any new development is therefore likely to require new infrastructure or sewer upgrades depending on the location of
the development.
Further information on the pumping stations and housing location will be required to determine which sewers/pumping stations
require upgrades.
Fleet and Gedney currently drain via pumped mains to Sutton Bridge WwTW that has spare capacity. Infrastructure should
not need upgrading for the small number of additional houses proposed.
Gedney Hill is approximately 10 miles south of Holbeach WwTW, where there is no existing wastewater network on record.
New infrastructure would be required to connect the new development to a WwTW. The closest WwTW with capacity is
Sutton St James.
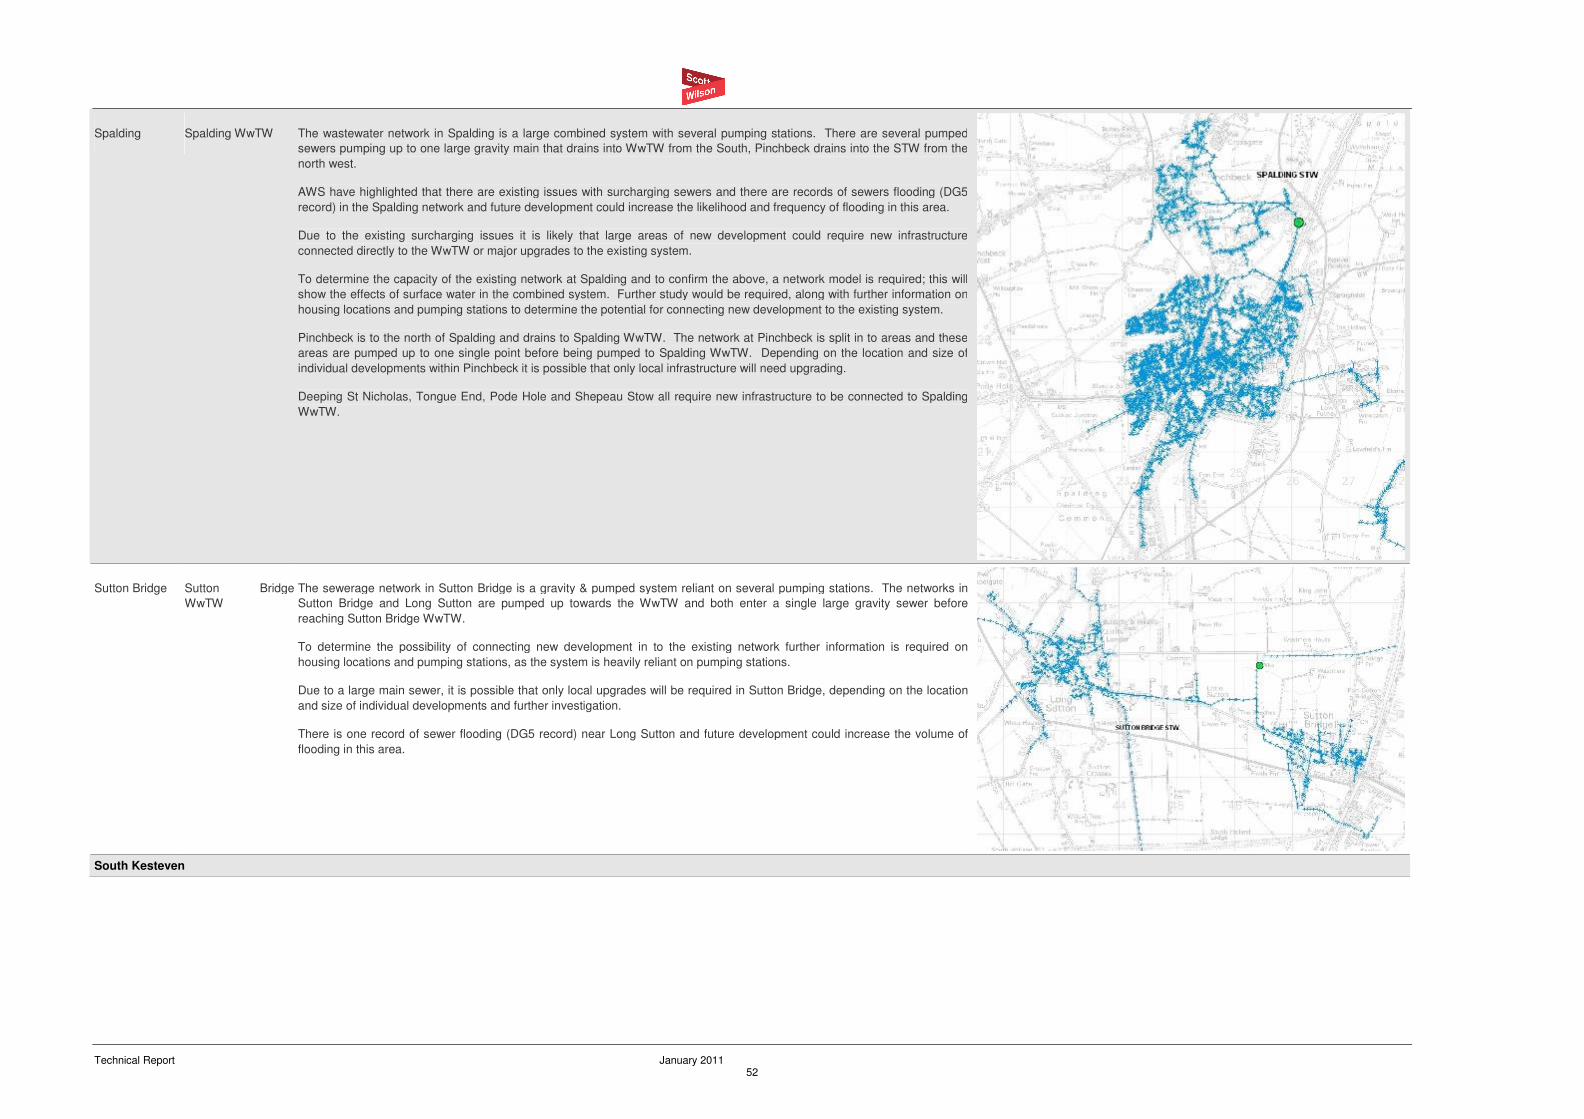
Technical Report January 2011 52
Spalding Spalding WwTW The wastewater network in Spalding is a large combined system with several pumping stations. There are several pumped
sewers pumping up to one large gravity main that drains into WwTW from the South, Pinchbeck drains into the STW from the
north west.
AWS have highlighted that there are existing issues with surcharging sewers and there are records of sewers flooding (DG5
record) in the Spalding network and future development could increase the likelihood and frequency of flooding in this area.
Due to the existing surcharging issues it is likely that large areas of new development could require new infrastructure
connected directly to the WwTW or major upgrades to the existing system.
To determine the capacity of the existing network at Spalding and to confirm the above, a network model is required; this will
show the effects of surface water in the combined system. Further study would be required, along with further information on
housing locations and pumping stations to determine the potential for connecting new development to the existing system.
Pinchbeck is to the north of Spalding and drains to Spalding WwTW. The network at Pinchbeck is split in to areas and these
areas are pumped up to one single point before being pumped to Spalding WwTW. Depending on the location and size of
individual developments within Pinchbeck it is possible that only local infrastructure will need upgrading.
Deeping St Nicholas, Tongue End, Pode Hole and Shepeau Stow all require new infrastructure to be connected to Spalding
WwTW.
Sutton Bridge Sutton Bridge
WwTW
The sewerage network in Sutton Bridge is a gravity & pumped system reliant on several pumping stations. The networks in
Sutton Bridge and Long Sutton are pumped up towards the WwTW and both enter a single large gravity sewer before
reaching Sutton Bridge WwTW.
To determine the possibility of connecting new development in to the existing network further information is required on
housing locations and pumping stations, as the system is heavily reliant on pumping stations.
Due to a large main sewer, it is possible that only local upgrades will be required in Sutton Bridge, depending on the location
and size of individual developments and further investigation.
There is one record of sewer flooding (DG5 record) near Long Sutton and future development could increase the volume of
flooding in this area.
South Kesteven
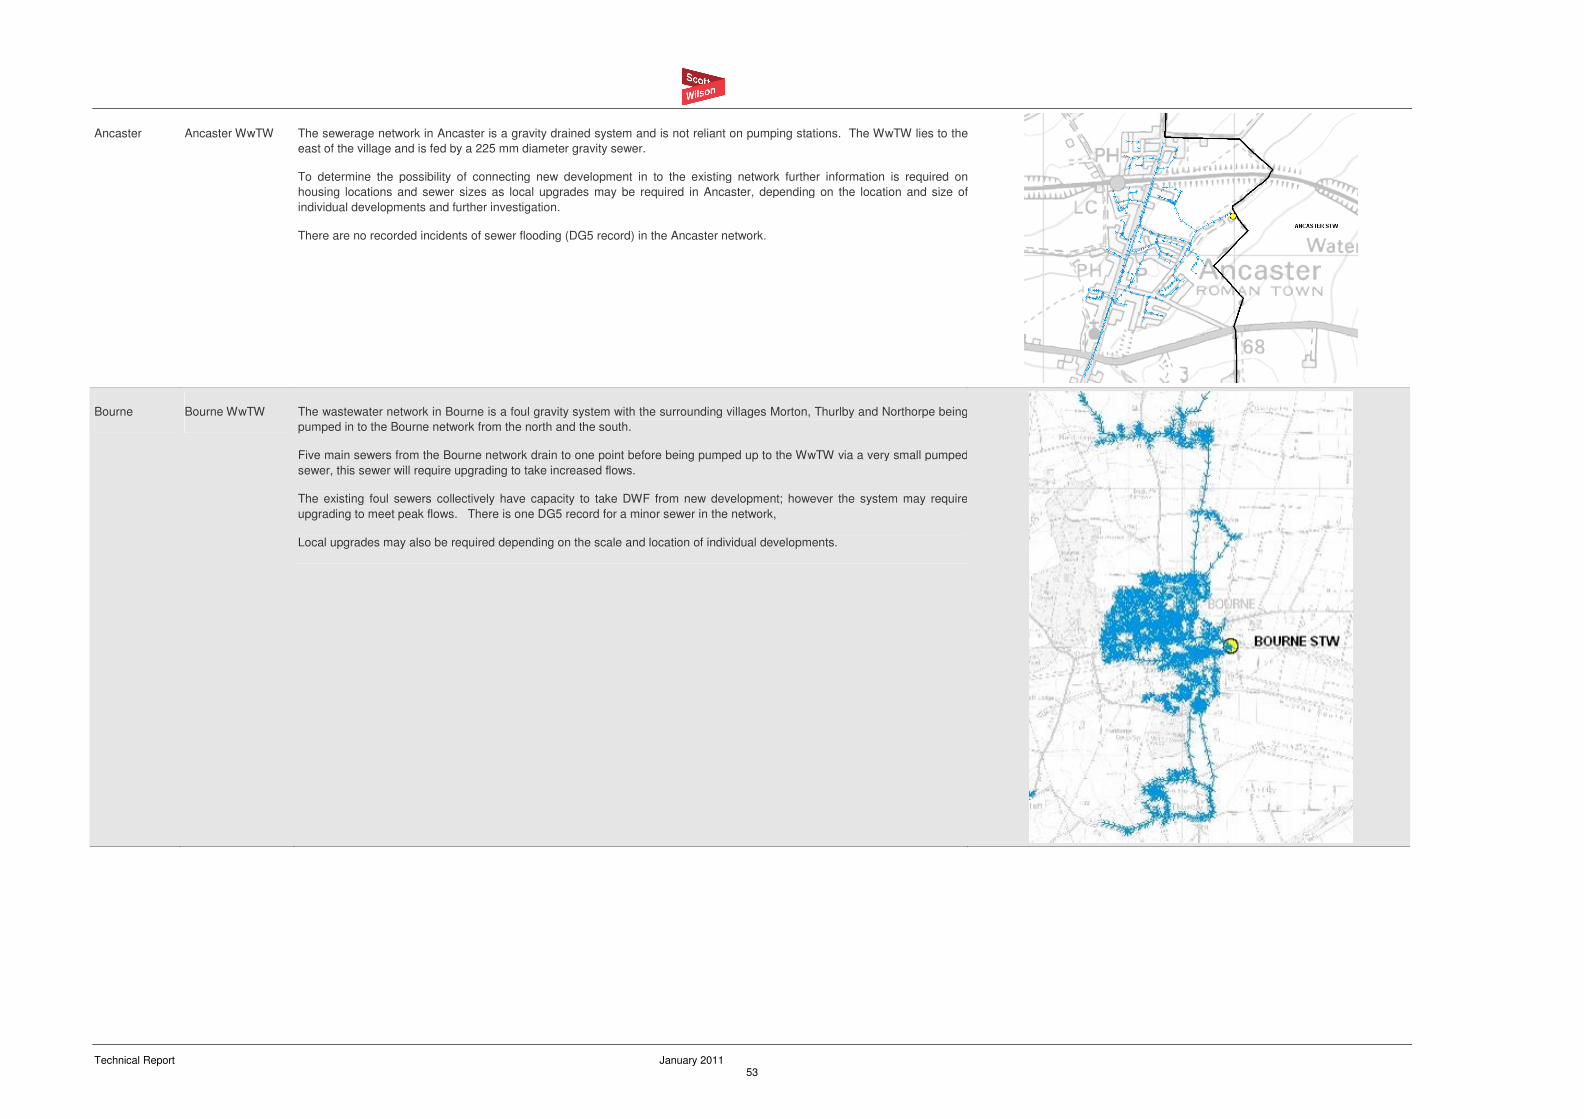
Technical Report January 2011 53
Ancaster Ancaster WwTW The sewerage network in Ancaster is a gravity drained system and is not reliant on pumping stations. The WwTW lies to the
east of the village and is fed by a 225 mm diameter gravity sewer.
To determine the possibility of connecting new development in to the existing network further information is required on
housing locations and sewer sizes as local upgrades may be required in Ancaster, depending on the location and size of
individual developments and further investigation.
There are no recorded incidents of sewer flooding (DG5 record) in the Ancaster network.
Bourne Bourne WwTW The wastewater network in Bourne is a foul gravity system with the surrounding villages Morton, Thurlby and Northorpe being
pumped in to the Bourne network from the north and the south.
Five main sewers from the Bourne network drain to one point before being pumped up to the WwTW via a very small pumped
sewer, this sewer will require upgrading to take increased flows.
The existing foul sewers collectively have capacity to take DWF from new development; however the system may require
upgrading to meet peak flows. There is one DG5 record for a minor sewer in the network,
Local upgrades may also be required depending on the scale and location of individual developments.
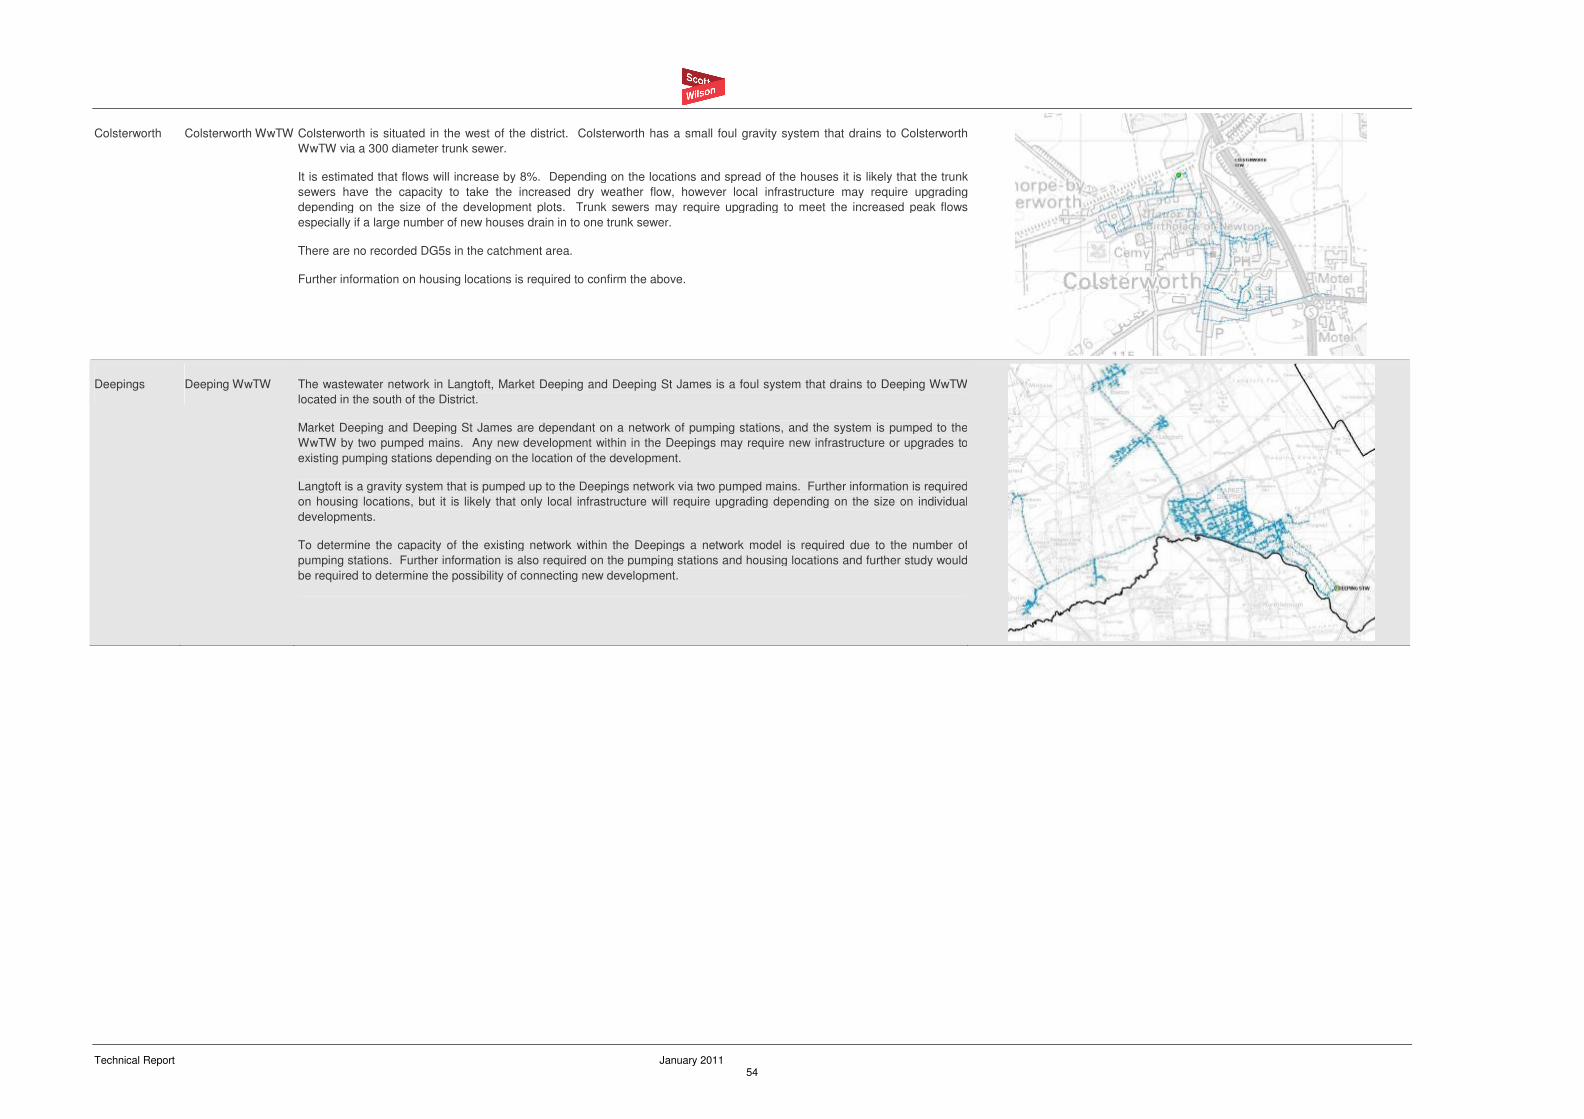
Technical Report January 2011 54
Colsterworth Colsterworth WwTW Colsterworth is situated in the west of the district. Colsterworth has a small foul gravity system that drains to Colsterworth
WwTW via a 300 diameter trunk sewer.
It is estimated that flows will increase by 8%. Depending on the locations and spread of the houses it is likely that the trunk
sewers have the capacity to take the increased dry weather flow, however local infrastructure may require upgrading
depending on the size of the development plots. Trunk sewers may require upgrading to meet the increased peak flows
especially if a large number of new houses drain in to one trunk sewer.
There are no recorded DG5s in the catchment area.
Further information on housing locations is required to confirm the above.
Deepings Deeping WwTW The wastewater network in Langtoft, Market Deeping and Deeping St James is a foul system that drains to Deeping WwTW
located in the south of the District.
Market Deeping and Deeping St James are dependant on a network of pumping stations, and the system is pumped to the
WwTW by two pumped mains. Any new development within in the Deepings may require new infrastructure or upgrades to
existing pumping stations depending on the location of the development.
Langtoft is a gravity system that is pumped up to the Deepings network via two pumped mains. Further information is required
on housing locations, but it is likely that only local infrastructure will require upgrading depending on the size on individual
developments.
To determine the capacity of the existing network within the Deepings a network model is required due to the number of
pumping stations. Further information is also required on the pumping stations and housing locations and further study would
be required to determine the possibility of connecting new development.
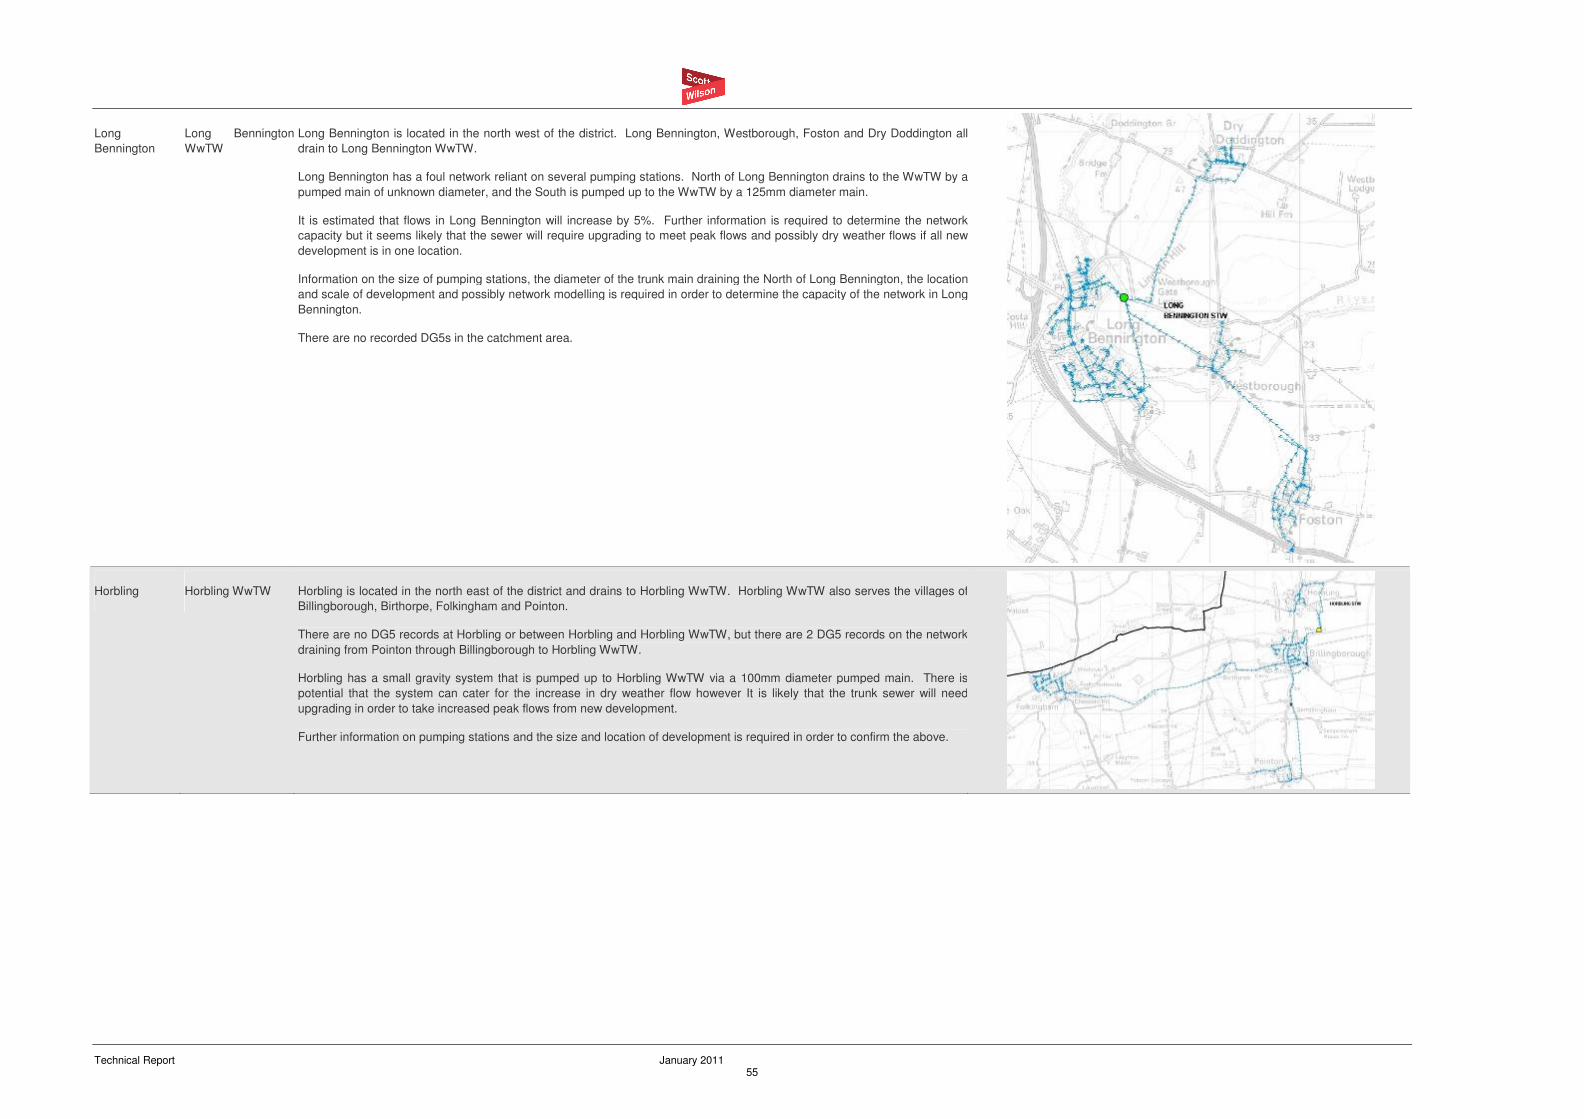
Technical Report January 2011 55
Long
Bennington
Long Bennington
WwTW
Long Bennington is located in the north west of the district. Long Bennington, Westborough, Foston and Dry Doddington all
drain to Long Bennington WwTW.
Long Bennington has a foul network reliant on several pumping stations. North of Long Bennington drains to the WwTW by a
pumped main of unknown diameter, and the South is pumped up to the WwTW by a 125mm diameter main.
It is estimated that flows in Long Bennington will increase by 5%. Further information is required to determine the network
capacity but it seems likely that the sewer will require upgrading to meet peak flows and possibly dry weather flows if all new
development is in one location.
Information on the size of pumping stations, the diameter of the trunk main draining the North of Long Bennington, the location
and scale of development and possibly network modelling is required in order to determine the capacity of the network in Long
Bennington.
There are no recorded DG5s in the catchment area.
Horbling Horbling WwTW Horbling is located in the north east of the district and drains to Horbling WwTW. Horbling WwTW also serves the villages of
Billingborough, Birthorpe, Folkingham and Pointon.
There are no DG5 records at Horbling or between Horbling and Horbling WwTW, but there are 2 DG5 records on the network
draining from Pointon through Billingborough to Horbling WwTW.
Horbling has a small gravity system that is pumped up to Horbling WwTW via a 100mm diameter pumped main. There is
potential that the system can cater for the increase in dry weather flow however It is likely that the trunk sewer will need
upgrading in order to take increased peak flows from new development.
Further information on pumping stations and the size and location of development is required in order to confirm the above.
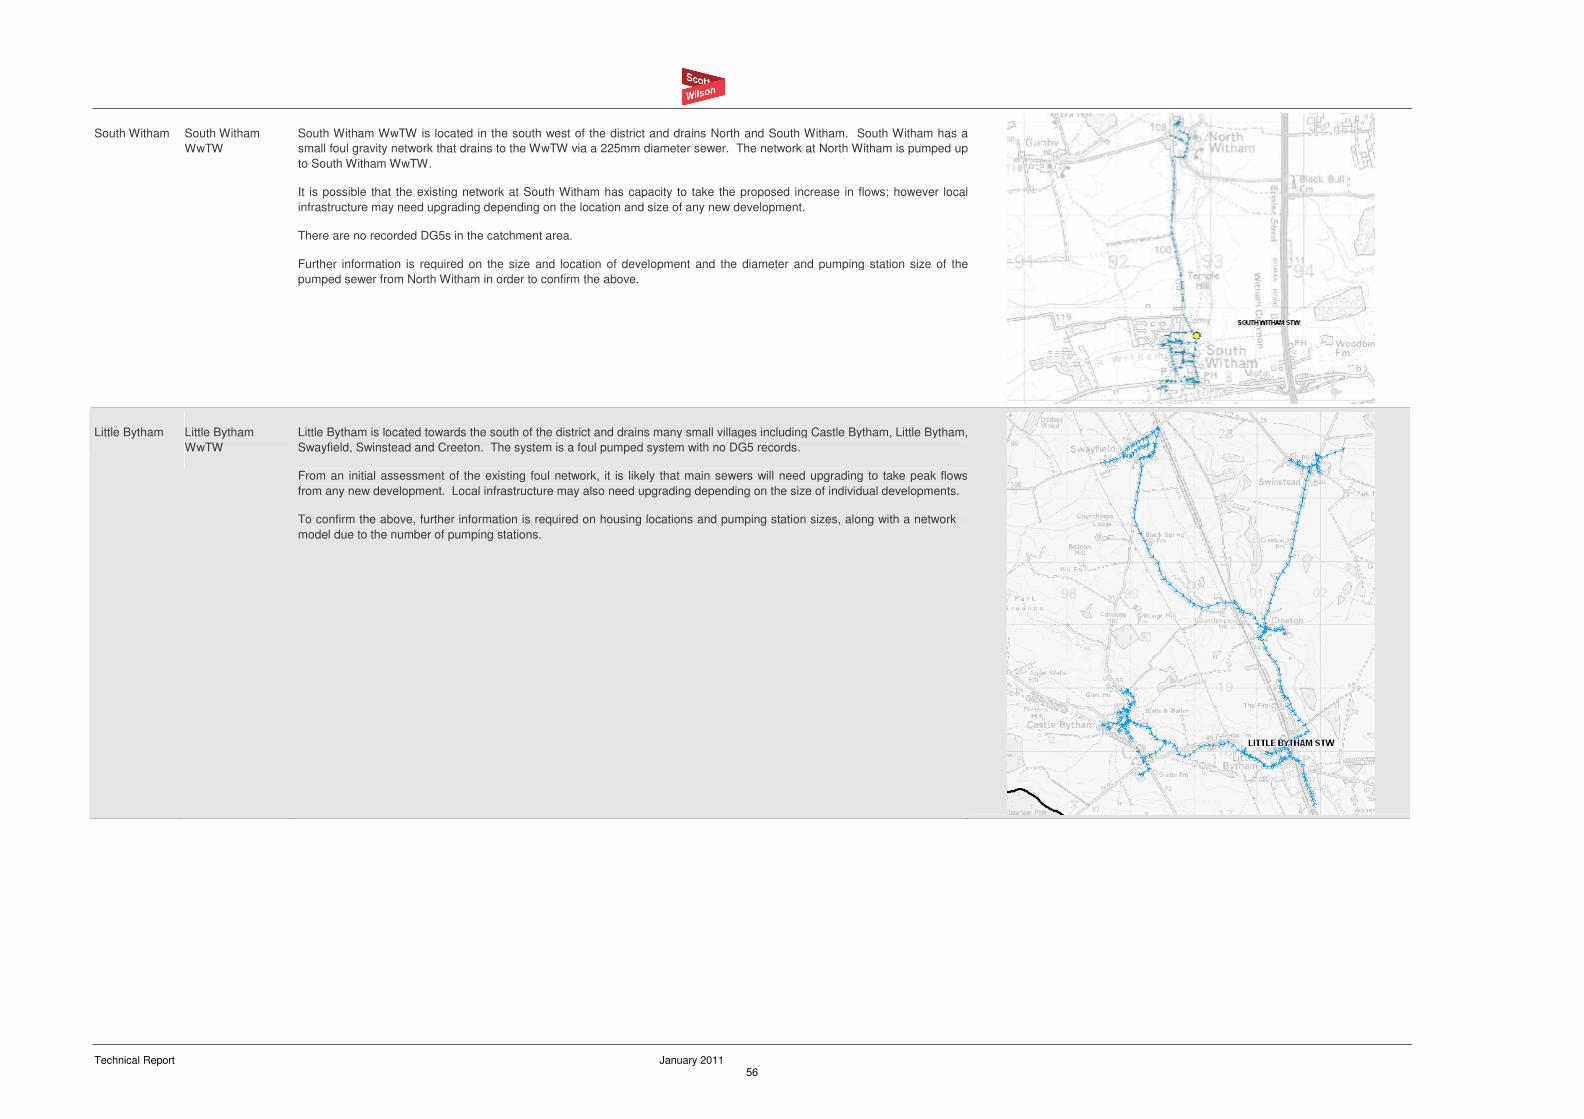
Technical Report January 2011 56
South Witham South Witham
WwTW
South Witham WwTW is located in the south west of the district and drains North and South Witham. South Witham has a
small foul gravity network that drains to the WwTW via a 225mm diameter sewer. The network at North Witham is pumped up
to South Witham WwTW.
It is possible that the existing network at South Witham has capacity to take the proposed increase in flows; however local
infrastructure may need upgrading depending on the location and size of any new development.
There are no recorded DG5s in the catchment area.
Further information is required on the size and location of development and the diameter and pumping station size of the
pumped sewer from North Witham in order to confirm the above.
Little Bytham Little Bytham
WwTW
Little Bytham is located towards the south of the district and drains many small villages including Castle Bytham, Little Bytham,
Swayfield, Swinstead and Creeton. The system is a foul pumped system with no DG5 records.
From an initial assessment of the existing foul network, it is likely that main sewers will need upgrading to take peak flows
from any new development. Local infrastructure may also need upgrading depending on the size of individual developments.
To confirm the above, further information is required on housing locations and pumping station sizes, along with a network
model due to the number of pumping stations.
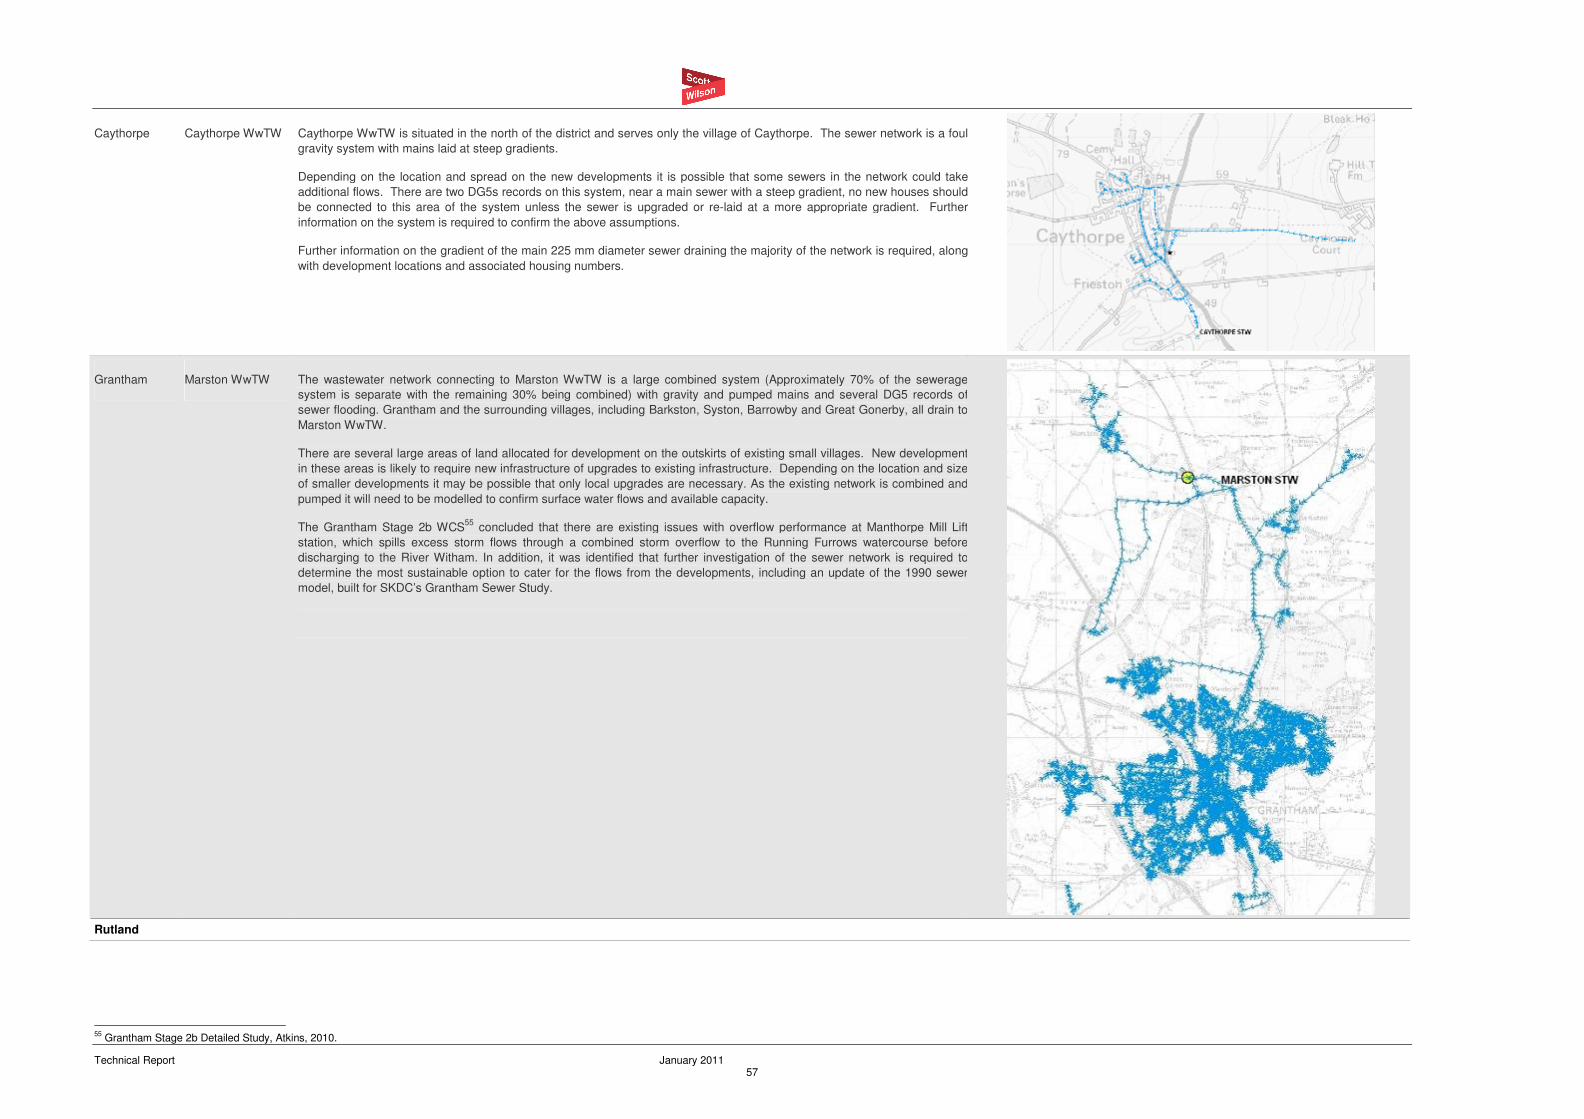
Technical Report January 2011 57
Caythorpe Caythorpe WwTW Caythorpe WwTW is situated in the north of the district and serves only the village of Caythorpe. The sewer network is a foul
gravity system with mains laid at steep gradients.
Depending on the location and spread on the new developments it is possible that some sewers in the network could take
additional flows. There are two DG5s records on this system, near a main sewer with a steep gradient, no new houses should
be connected to this area of the system unless the sewer is upgraded or re-laid at a more appropriate gradient. Further
information on the system is required to confirm the above assumptions.
Further information on the gradient of the main 225 mm diameter sewer draining the majority of the network is required, along
with development locations and associated housing numbers.
Grantham Marston WwTW The wastewater network connecting to Marston WwTW is a large combined system (Approximately 70% of the sewerage
system is separate with the remaining 30% being combined) with gravity and pumped mains and several DG5 records of
sewer flooding. Grantham and the surrounding villages, including Barkston, Syston, Barrowby and Great Gonerby, all drain to
Marston WwTW.
There are several large areas of land allocated for development on the outskirts of existing small villages. New development
in these areas is likely to require new infrastructure of upgrades to existing infrastructure. Depending on the location and size
of smaller developments it may be possible that only local upgrades are necessary. As the existing network is combined and
pumped it will need to be modelled to confirm surface water flows and available capacity.
The Grantham Stage 2b WCS55
concluded that there are existing issues with overflow performance at Manthorpe Mill Lift
station, which spills excess storm flows through a combined storm overflow to the Running Furrows watercourse before
discharging to the River Witham. In addition, it was identified that further investigation of the sewer network is required to
determine the most sustainable option to cater for the flows from the developments, including an update of the 1990 sewer
model, built for SKDC’s Grantham Sewer Study.
Rutland
55
Grantham Stage 2b Detailed Study, Atkins, 2010.
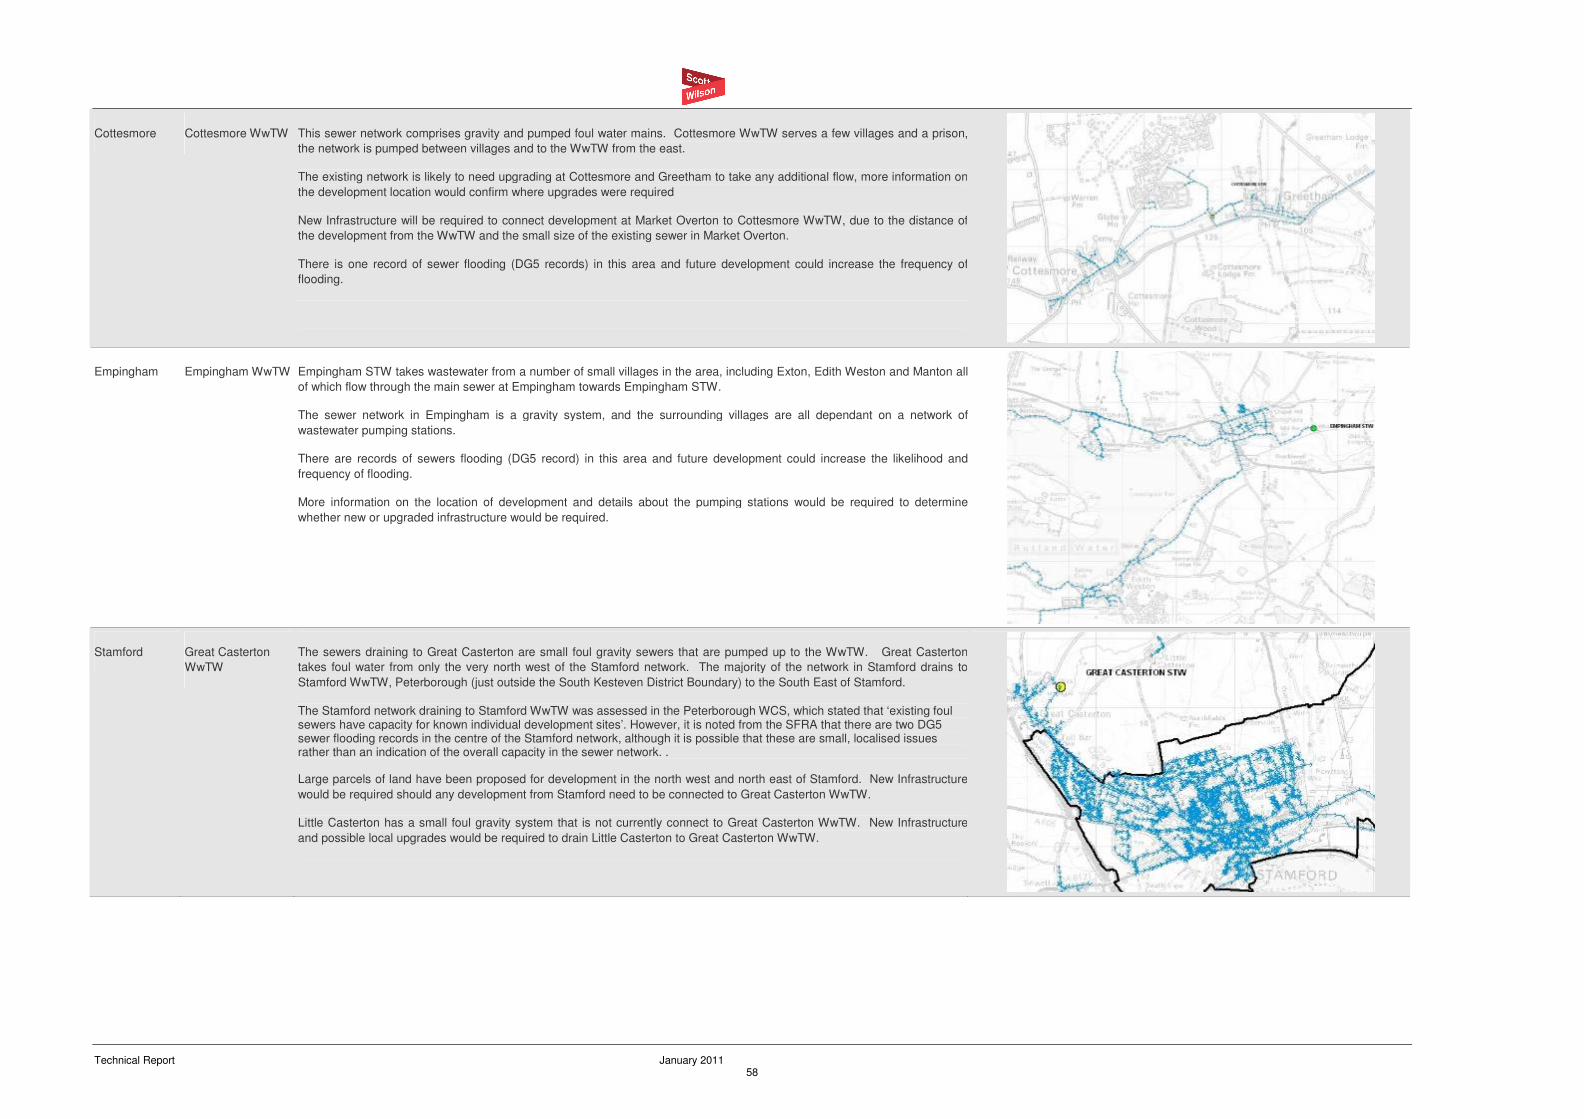
Technical Report January 2011 58
Cottesmore Cottesmore WwTW This sewer network comprises gravity and pumped foul water mains. Cottesmore WwTW serves a few villages and a prison,
the network is pumped between villages and to the WwTW from the east.
The existing network is likely to need upgrading at Cottesmore and Greetham to take any additional flow, more information on
the development location would confirm where upgrades were required
New Infrastructure will be required to connect development at Market Overton to Cottesmore WwTW, due to the distance of
the development from the WwTW and the small size of the existing sewer in Market Overton.
There is one record of sewer flooding (DG5 records) in this area and future development could increase the frequency of
flooding.
Empingham Empingham WwTW Empingham STW takes wastewater from a number of small villages in the area, including Exton, Edith Weston and Manton all
of which flow through the main sewer at Empingham towards Empingham STW.
The sewer network in Empingham is a gravity system, and the surrounding villages are all dependant on a network of
wastewater pumping stations.
There are records of sewers flooding (DG5 record) in this area and future development could increase the likelihood and
frequency of flooding.
More information on the location of development and details about the pumping stations would be required to determine
whether new or upgraded infrastructure would be required.
Stamford Great Casterton
WwTW
The sewers draining to Great Casterton are small foul gravity sewers that are pumped up to the WwTW. Great Casterton
takes foul water from only the very north west of the Stamford network. The majority of the network in Stamford drains to
Stamford WwTW, Peterborough (just outside the South Kesteven District Boundary) to the South East of Stamford.
The Stamford network draining to Stamford WwTW was assessed in the Peterborough WCS, which stated that ‘existing foul sewers have capacity for known individual development sites’. However, it is noted from the SFRA that there are two DG5 sewer flooding records in the centre of the Stamford network, although it is possible that these are small, localised issues rather than an indication of the overall capacity in the sewer network. .
Large parcels of land have been proposed for development in the north west and north east of Stamford. New Infrastructure
would be required should any development from Stamford need to be connected to Great Casterton WwTW.
Little Casterton has a small foul gravity system that is not currently connect to Great Casterton WwTW. New Infrastructure
and possible local upgrades would be required to drain Little Casterton to Great Casterton WwTW.
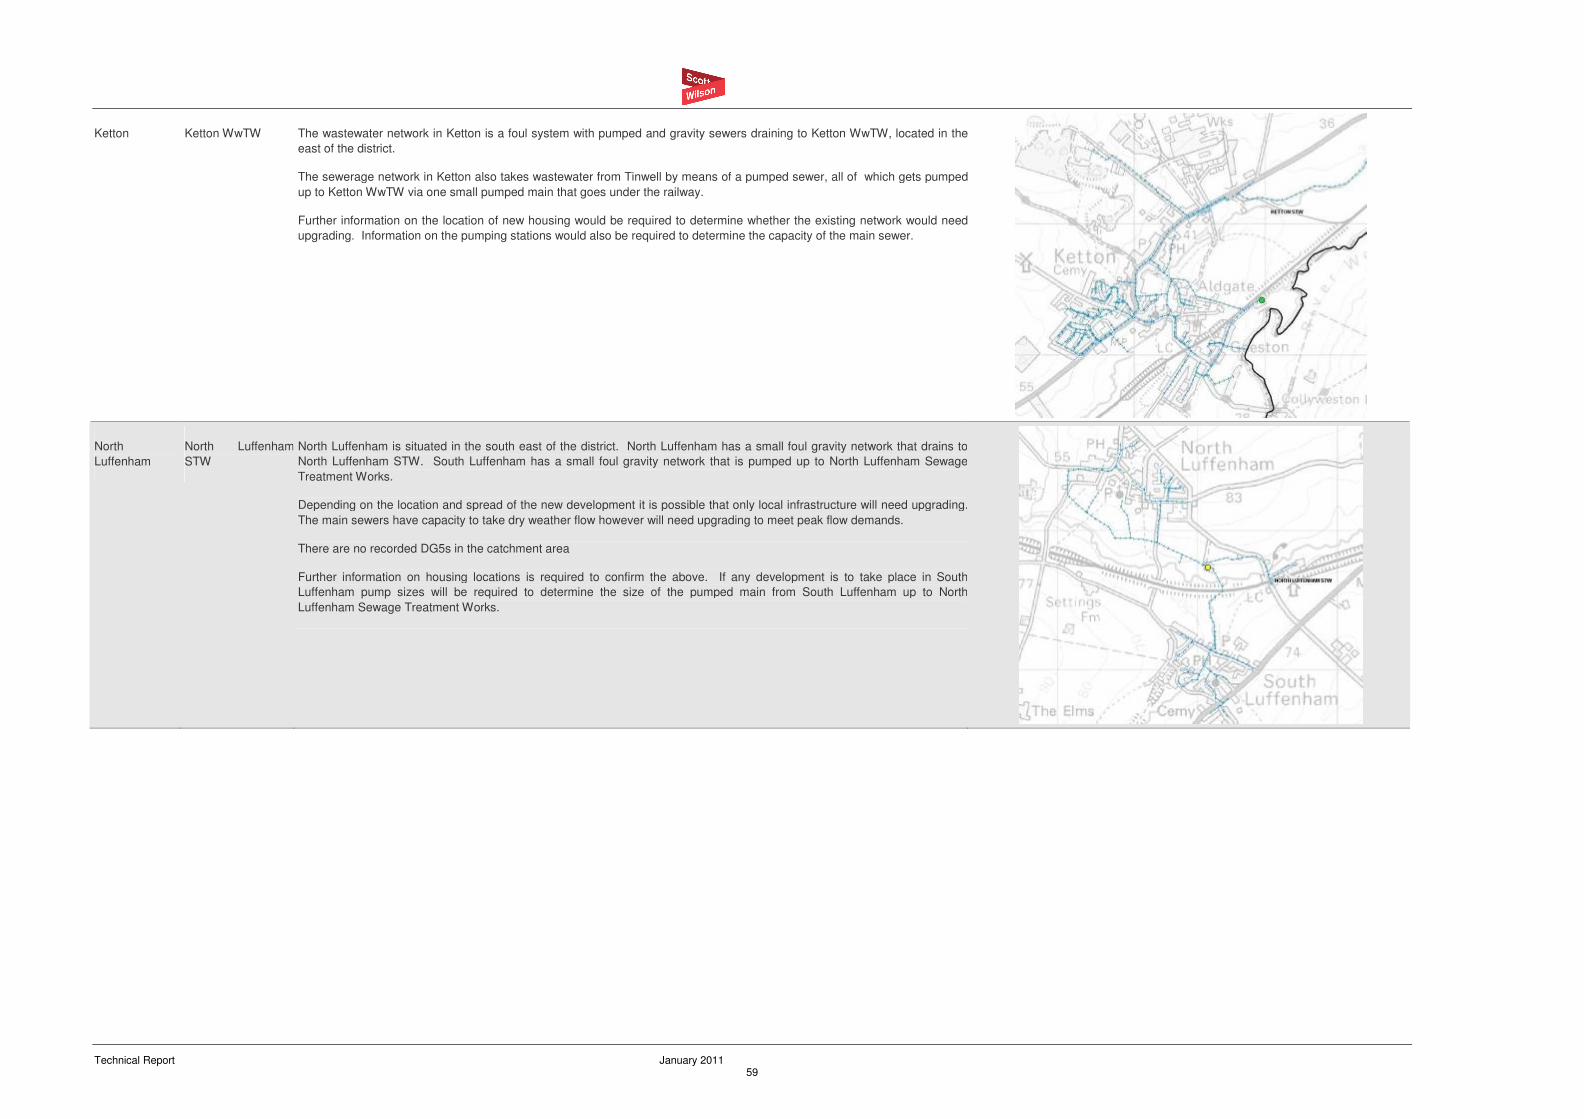
Technical Report January 2011 59
Ketton Ketton WwTW The wastewater network in Ketton is a foul system with pumped and gravity sewers draining to Ketton WwTW, located in the
east of the district.
The sewerage network in Ketton also takes wastewater from Tinwell by means of a pumped sewer, all of which gets pumped
up to Ketton WwTW via one small pumped main that goes under the railway.
Further information on the location of new housing would be required to determine whether the existing network would need
upgrading. Information on the pumping stations would also be required to determine the capacity of the main sewer.
North
Luffenham
North Luffenham
STW
North Luffenham is situated in the south east of the district. North Luffenham has a small foul gravity network that drains to
North Luffenham STW. South Luffenham has a small foul gravity network that is pumped up to North Luffenham Sewage
Treatment Works.
Depending on the location and spread of the new development it is possible that only local infrastructure will need upgrading.
The main sewers have capacity to take dry weather flow however will need upgrading to meet peak flow demands.
There are no recorded DG5s in the catchment area
Further information on housing locations is required to confirm the above. If any development is to take place in South
Luffenham pump sizes will be required to determine the size of the pumped main from South Luffenham up to North
Luffenham Sewage Treatment Works.
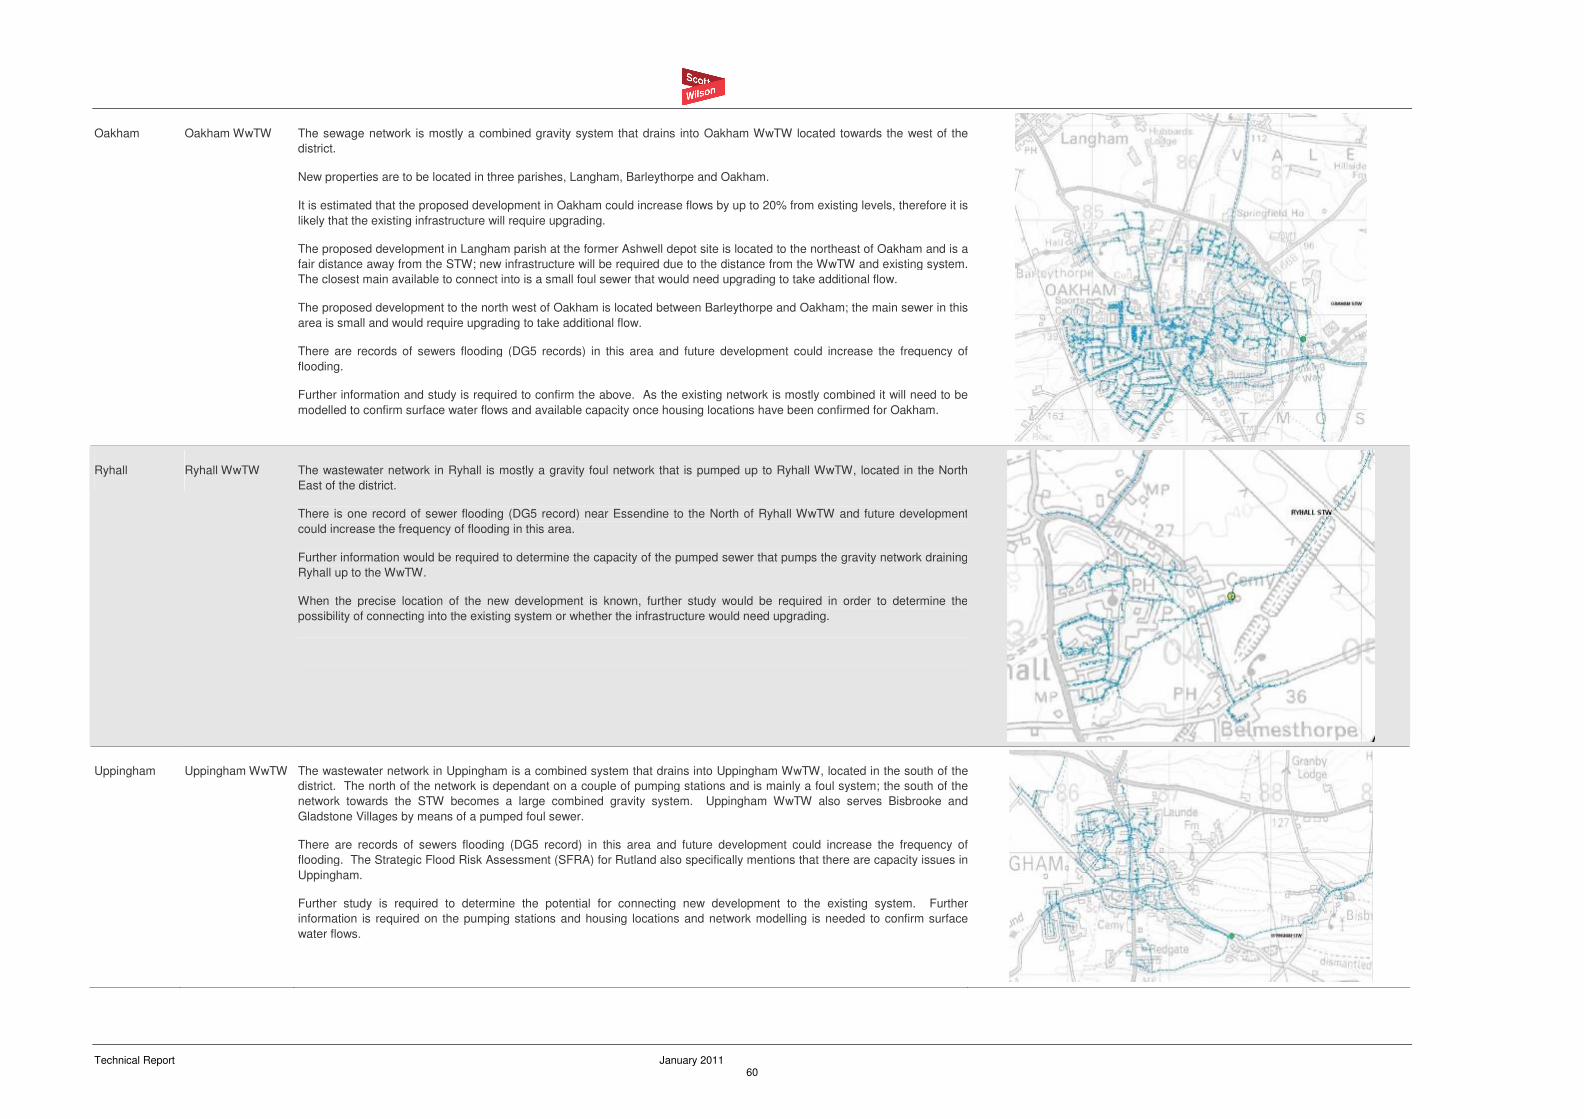
Technical Report January 2011 60
Oakham Oakham WwTW The sewage network is mostly a combined gravity system that drains into Oakham WwTW located towards the west of the
district.
New properties are to be located in three parishes, Langham, Barleythorpe and Oakham.
It is estimated that the proposed development in Oakham could increase flows by up to 20% from existing levels, therefore it is
likely that the existing infrastructure will require upgrading.
The proposed development in Langham parish at the former Ashwell depot site is located to the northeast of Oakham and is a
fair distance away from the STW; new infrastructure will be required due to the distance from the WwTW and existing system.
The closest main available to connect into is a small foul sewer that would need upgrading to take additional flow.
The proposed development to the north west of Oakham is located between Barleythorpe and Oakham; the main sewer in this
area is small and would require upgrading to take additional flow.
There are records of sewers flooding (DG5 records) in this area and future development could increase the frequency of
flooding.
Further information and study is required to confirm the above. As the existing network is mostly combined it will need to be
modelled to confirm surface water flows and available capacity once housing locations have been confirmed for Oakham.
Ryhall Ryhall WwTW The wastewater network in Ryhall is mostly a gravity foul network that is pumped up to Ryhall WwTW, located in the North
East of the district.
There is one record of sewer flooding (DG5 record) near Essendine to the North of Ryhall WwTW and future development
could increase the frequency of flooding in this area.
Further information would be required to determine the capacity of the pumped sewer that pumps the gravity network draining
Ryhall up to the WwTW.
When the precise location of the new development is known, further study would be required in order to determine the
possibility of connecting into the existing system or whether the infrastructure would need upgrading.
Uppingham Uppingham WwTW The wastewater network in Uppingham is a combined system that drains into Uppingham WwTW, located in the south of the
district. The north of the network is dependant on a couple of pumping stations and is mainly a foul system; the south of the
network towards the STW becomes a large combined gravity system. Uppingham WwTW also serves Bisbrooke and
Gladstone Villages by means of a pumped foul sewer.
There are records of sewers flooding (DG5 record) in this area and future development could increase the frequency of
flooding. The Strategic Flood Risk Assessment (SFRA) for Rutland also specifically mentions that there are capacity issues in
Uppingham.
Further study is required to determine the potential for connecting new development to the existing system. Further
information is required on the pumping stations and housing locations and network modelling is needed to confirm surface
water flows.
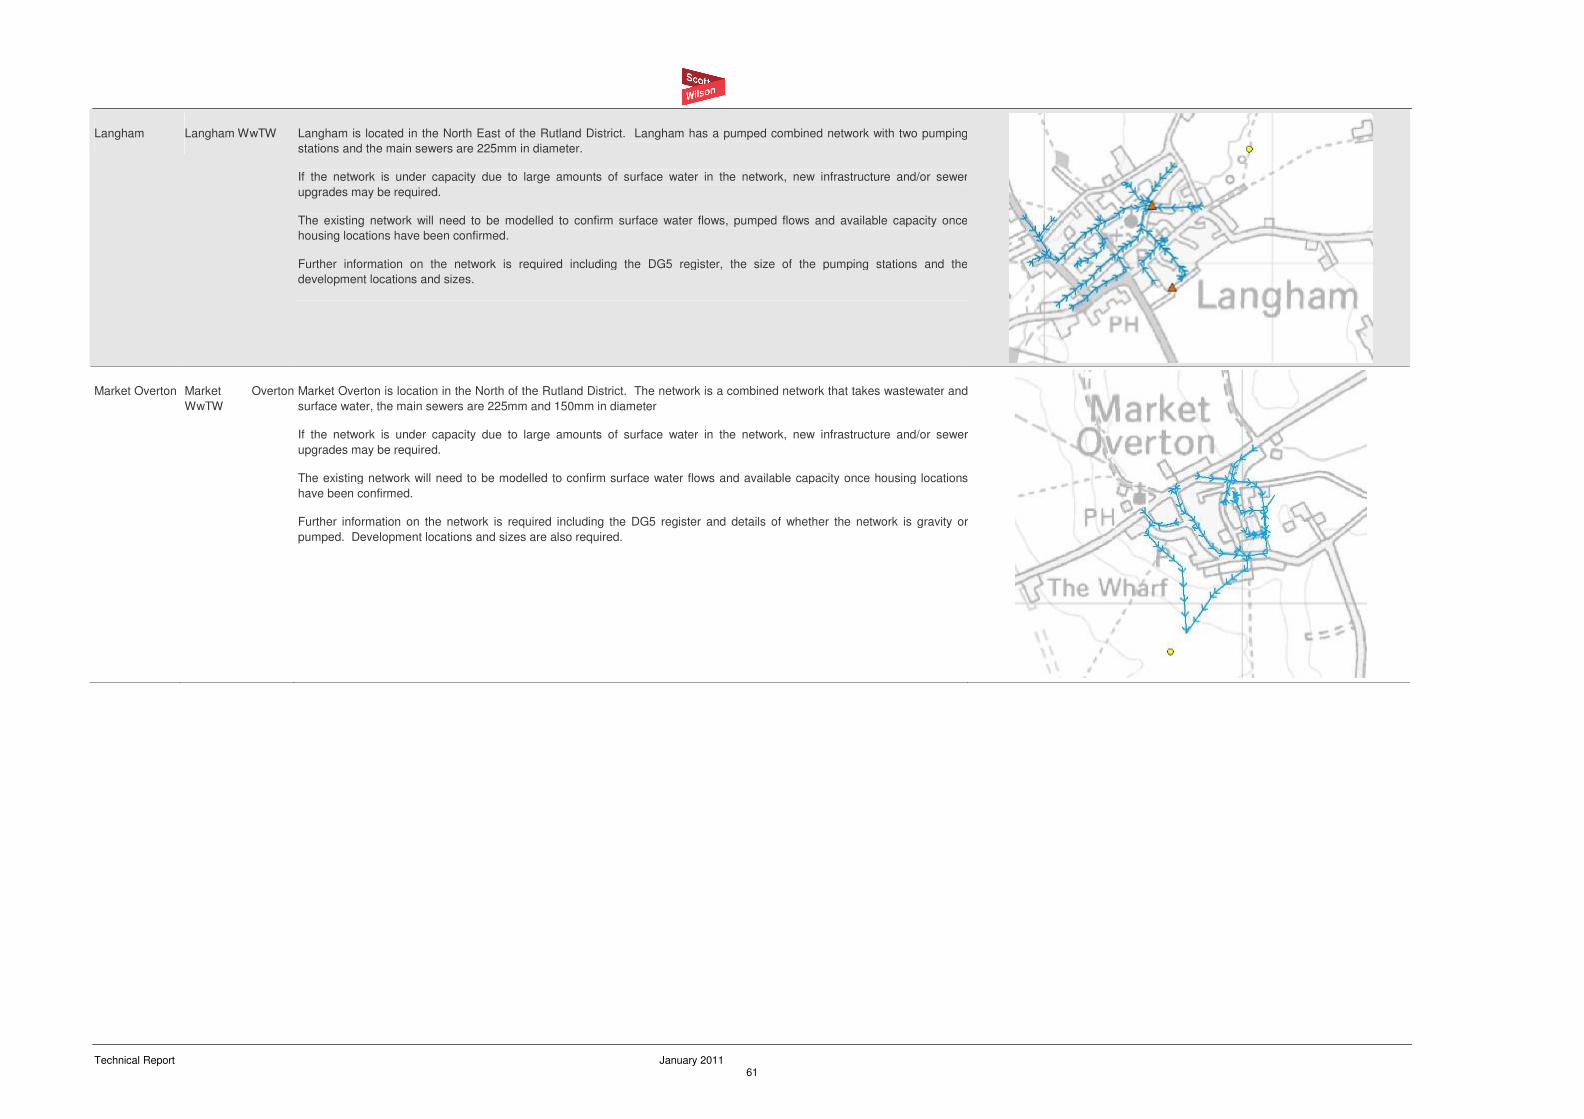
Technical Report January 2011 61
Langham Langham WwTW Langham is located in the North East of the Rutland District. Langham has a pumped combined network with two pumping
stations and the main sewers are 225mm in diameter.
If the network is under capacity due to large amounts of surface water in the network, new infrastructure and/or sewer
upgrades may be required.
The existing network will need to be modelled to confirm surface water flows, pumped flows and available capacity once
housing locations have been confirmed.
Further information on the network is required including the DG5 register, the size of the pumping stations and the
development locations and sizes.
Market Overton Market Overton
WwTW
Market Overton is location in the North of the Rutland District. The network is a combined network that takes wastewater and
surface water, the main sewers are 225mm and 150mm in diameter
If the network is under capacity due to large amounts of surface water in the network, new infrastructure and/or sewer
upgrades may be required.
The existing network will need to be modelled to confirm surface water flows and available capacity once housing locations
have been confirmed.
Further information on the network is required including the DG5 register and details of whether the network is gravity or
pumped. Development locations and sizes are also required.
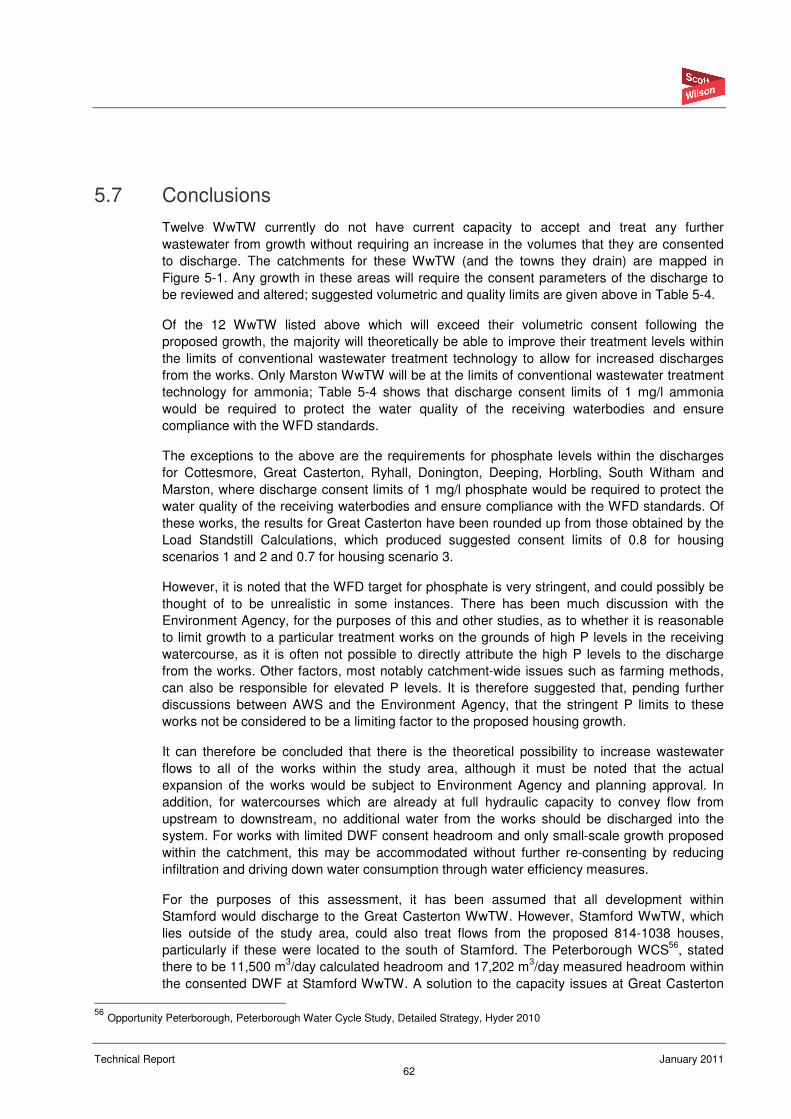
Technical Report January 2011 62
5.7 Conclusions
Twelve WwTW currently do not have current capacity to accept and treat any further
wastewater from growth without requiring an increase in the volumes that they are consented
to discharge. The catchments for these WwTW (and the towns they drain) are mapped in
Figure 5-1. Any growth in these areas will require the consent parameters of the discharge to
be reviewed and altered; suggested volumetric and quality limits are given above in Table 5-4.
Of the 12 WwTW listed above which will exceed their volumetric consent following the
proposed growth, the majority will theoretically be able to improve their treatment levels within
the limits of conventional wastewater treatment technology to allow for increased discharges
from the works. Only Marston WwTW will be at the limits of conventional wastewater treatment
technology for ammonia; Table 5-4 shows that discharge consent limits of 1 mg/l ammonia
would be required to protect the water quality of the receiving waterbodies and ensure
compliance with the WFD standards.
The exceptions to the above are the requirements for phosphate levels within the discharges
for Cottesmore, Great Casterton, Ryhall, Donington, Deeping, Horbling, South Witham and
Marston, where discharge consent limits of 1 mg/l phosphate would be required to protect the
water quality of the receiving waterbodies and ensure compliance with the WFD standards. Of
these works, the results for Great Casterton have been rounded up from those obtained by the
Load Standstill Calculations, which produced suggested consent limits of 0.8 for housing
scenarios 1 and 2 and 0.7 for housing scenario 3.
However, it is noted that the WFD target for phosphate is very stringent, and could possibly be
thought of to be unrealistic in some instances. There has been much discussion with the
Environment Agency, for the purposes of this and other studies, as to whether it is reasonable
to limit growth to a particular treatment works on the grounds of high P levels in the receiving
watercourse, as it is often not possible to directly attribute the high P levels to the discharge
from the works. Other factors, most notably catchment-wide issues such as farming methods,
can also be responsible for elevated P levels. It is therefore suggested that, pending further
discussions between AWS and the Environment Agency, that the stringent P limits to these
works not be considered to be a limiting factor to the proposed housing growth.
It can therefore be concluded that there is the theoretical possibility to increase wastewater
flows to all of the works within the study area, although it must be noted that the actual
expansion of the works would be subject to Environment Agency and planning approval. In
addition, for watercourses which are already at full hydraulic capacity to convey flow from
upstream to downstream, no additional water from the works should be discharged into the
system. For works with limited DWF consent headroom and only small-scale growth proposed
within the catchment, this may be accommodated without further re-consenting by reducing
infiltration and driving down water consumption through water efficiency measures.
For the purposes of this assessment, it has been assumed that all development within
Stamford would discharge to the Great Casterton WwTW. However, Stamford WwTW, which
lies outside of the study area, could also treat flows from the proposed 814-1038 houses,
particularly if these were located to the south of Stamford. The Peterborough WCS56
, stated
there to be 11,500 m3/day calculated headroom and 17,202 m
3/day measured headroom within
the consented DWF at Stamford WwTW. A solution to the capacity issues at Great Casterton
56
Opportunity Peterborough, Peterborough Water Cycle Study, Detailed Strategy, Hyder 2010
Technical Report January 2011 63
could therefore be to discharge some of the flows to Stamford WwTW, where the Peterborough
WCS has highlighted there is capacity.
In 2008 a major commercial trader (food processing firms) ceased operating, which has had
the effect of reducing the biological load and flow to the Marston works, as reported in the
Grantham WCS57
). This has released significant capacity; the Grantham WCS reports ‘This
substantial reduction of trade flows has freed up biological capacity equivalent to nearly 11,000
population equivalent. As a result of this load reduction AWS does not consider that major
capital works are now required in the next five yearly Asset Management Plan (AMP5 2010-
2015)’. This capacity is now theoretically available to treat increased domestic flows from
proposed development. However, it must be noted that while the trader has currently stopped
operating due to the recession, should the economic climate improve in the future, the trader
may resume operations. AWS has stated that it will not ‘reserve’ capacity in the WwTW or the
network, but it should be noted that there may be further capacity issues in the future should
the trader re-commence operations.
The Grantham WCS carried out an assessment to determine the most appropriate solution to
deal with all of the development flows discharging to Marston STW. This stated that ‘AWS has
carried out an assessment of the works as part of the Periodic Review (PR09) of the works as it
was reaching its flow consent limit and hence included in the AMP5 flow compliance project.
The review concluded that the works operates in a satisfactory manner; however, there is a
limited process capacity’. The report was carried out prior to the reduction in trade effluent
which has subsequently freed up substantial spare biological capacity at the works.’
The proposed development within Bourne (1,729 new dwellings) represents already committed
development, to be located at a new development at Elsea Park, to the south of Bourne. It is
understood from discussions with AWS that as planning permission has already been granted
for this development, it has been taken into account in AWS’s planning for future flow and
treatment capacity requirements at Bourne WwTW.
This principle applies to all development, not just that in Bourne; as a general rule development
which has been granted planning permission will have been included within AWS’s planning
growth forecasts.
A high level assessment of the existing wastewater network has been undertaken to determine
whether there is likely to be sufficient capacity in the system to transmit additional wastewater
flows from new development to the relevant wastewater treatment works. The assessment
concluded that some potential growth location may be limited by sewer network capacity; see
section 8 below for settlement specific assessments.
The Grantham WCS carried out an assessment to determine the most appropriate solution to
deal with all of the development flows draining through the Grantham catchment, based on the
sewer modelling carried out the conclusions of the study included the following major points:
• the discharge the Southern Quadrant development to a southern sewage treatment works
will eliminate the need to upgrade the upstream sewer system to cater for the development;
• additional storage will be required upstream or at Manthorpe Mill Lift Station;
• provision of 220m3 of on-line storage in the Brownlow Street area and upsizing of the
sewers; and
57
South Kesteven District Council, Grantham WCS, Stage 2b Detailed Study, Atkins, 2010.
Technical Report January 2011 64
• it is not considered at this stage that upsizing of the sewers/pumping stations will be
required at this stage as storm flows will be able to be accommodated in the storage tanks
without impacting on the various overflows in the system;
Due to the flat topography of the study area, the sewer system relies on pumping stations
(rather than free flowing gravity) to transmit wastewater flows. Many of the larger networks are
also a combined system, which means that sewer capacity is taken up by rainwater as
opposed to just waste water from properties. In order to accurately assess the available
capacity in pumped and combined systems network modelling is required. Once potential
development locations have been allocated the networks identified above as having potential
capacity constraints can be modelled. The modelling results will enable a more detailed
assessment of sewer capacity relative to development location.
It should be noted in general terms that the impact on the sewer network from the proposed
growth would be dependent on the exact location of the proposed development. In all cases,
development close to the WwTW would be more easily accommodated than development at
some distance. There is limited capacity to transfer flows through existing towns and
settlements in the existing networks and there are obvious difficulties with constructing a new
sewer main through an already developed area. However, if a large new development were
proposed close to a WwTW, it would be theoretically possible to construct a new sewer main to
serve the new development, with the associated costs passed on to the developer. The
phasing of new sewer mains and upgrades to existing infrastructure should be considered
when planning the development of large sites.
Technical Report January 2011 65
6 Water Supply Strategy
6.1 Water Resources in the Study Area
The climate within the East of England is typified by low rainfall with little variation in the
average amount throughout the year, averaging about 600 mm. The annual evapotranspiration
averages 380 mm. Most of the evapotranspiration occurs during the summer months and
exceeds rainfall totals over this period. However, winter rainfall and recharge provides the
water required to offset this seasonal imbalance.
6.1.1 Geology and Hydrogeology
The underlying geology of the study area is roughly split between the east and west of the
study area, with predominantly clay-based geology to the east in South Holland and the
eastern edge of South Kesteven, but limestone and sandstone to the west in the majority of
South Kesteven District and Rutland County.
The presence of groundwater within the study area corresponds to the underlying geology, with
the east of the study area classed as ‘Unproductive Strata’ but with aquifers located to the
west. A band of principal, secondary (A), secondary (B) and secondary (undifferentiated)
aquifer runs north-south through the centre of South Kesteven and the east of Rutland.
There are a number of Source Protection Zones (SPZs) within this aquifer area. The
Environment Agency designates SPZs around groundwater abstraction sources, to protect the
abstraction from potentially polluting activities, by limiting discharges to ground (i.e. via
soakaway) within the SPZ. Four Zones are designated:
• SPZ 1 – the area immediately around the source, which represents a 50-day travel time for
groundwater from a point on the surface to the abstraction or a 50 m radius;
• SPZ2 - this represents a 400-day travel time for groundwater from a point on the surface to
the abstraction;
• SPZ3 – this represents the entire catchment of the abstraction; and
• SPZ4 – this zone is sometimes designated as a Zone of Special Interest, where activities
could impact upon the groundwater, despite lying outside of the catchment (as defined by
SPZ3).
The location of SPZs within the study area can be viewed using the Environment Agency’s SPZ
mapping. Due to the regular updating of the SPZ mapping it is not felt appropriate to reproduce
these maps here and reference should be made to the Environment Agency website58
.
6.1.2 Hydrology
The three major river systems in the study area are the Welland, the Nene and the Witham.
The headwaters of the Welland are on the western boundary of the catchment upstream of
Market Harborough. From Market Harborough down to Stamford a series of tributaries flow to
the north bank of the Welland: River Glen, Langton Brook, Stonton Brook, Medbourne Brook,
Eye Brook and the River Chater.
58
www.environment-agency.gov.uk
Technical Report January 2011 66
The River Nene flows from its source in Northamptonshire to its outfall in the wash, with a
catchment area of approximately 1,630 km2. The River Witham rises in South Witham, south of
Grantham, passes through Lincoln and drains in to The Wash at Boston, with a catchment area
of approximately 3,100 km2.
In addition to the above, there are a number of drainage channels and catchwater drains, as
managed by a number of IDBs: South Holland IDB, Upper Witham IDB, Black Sluice IDB,
Welland and Deepings IDB, Witham First IDB, Kings Lynn IDB and North Level IDB.
6.1.3 Water Supply
Water supply in the study area is the responsibility of two water supply companies: AWS and
STWL. See Figure 6-1 below for the water supply areas and water resource zones (WRZ) for
the two companies.
The WRZs are based on the existing water supply system and represent the largest area in
which water resources can be shared, reflecting the Environment Agency's guideline for an
area where customers experience the same risk of supply failure from a resource shortfall. The
Planning Zones describe the geographical areas for which the companies’ Water Resource
Management Plans (WRMP) (see section 6.3.10 below) assesses the supply-demand forecast.
Groups of PZs are aggregated to form a WRZ.
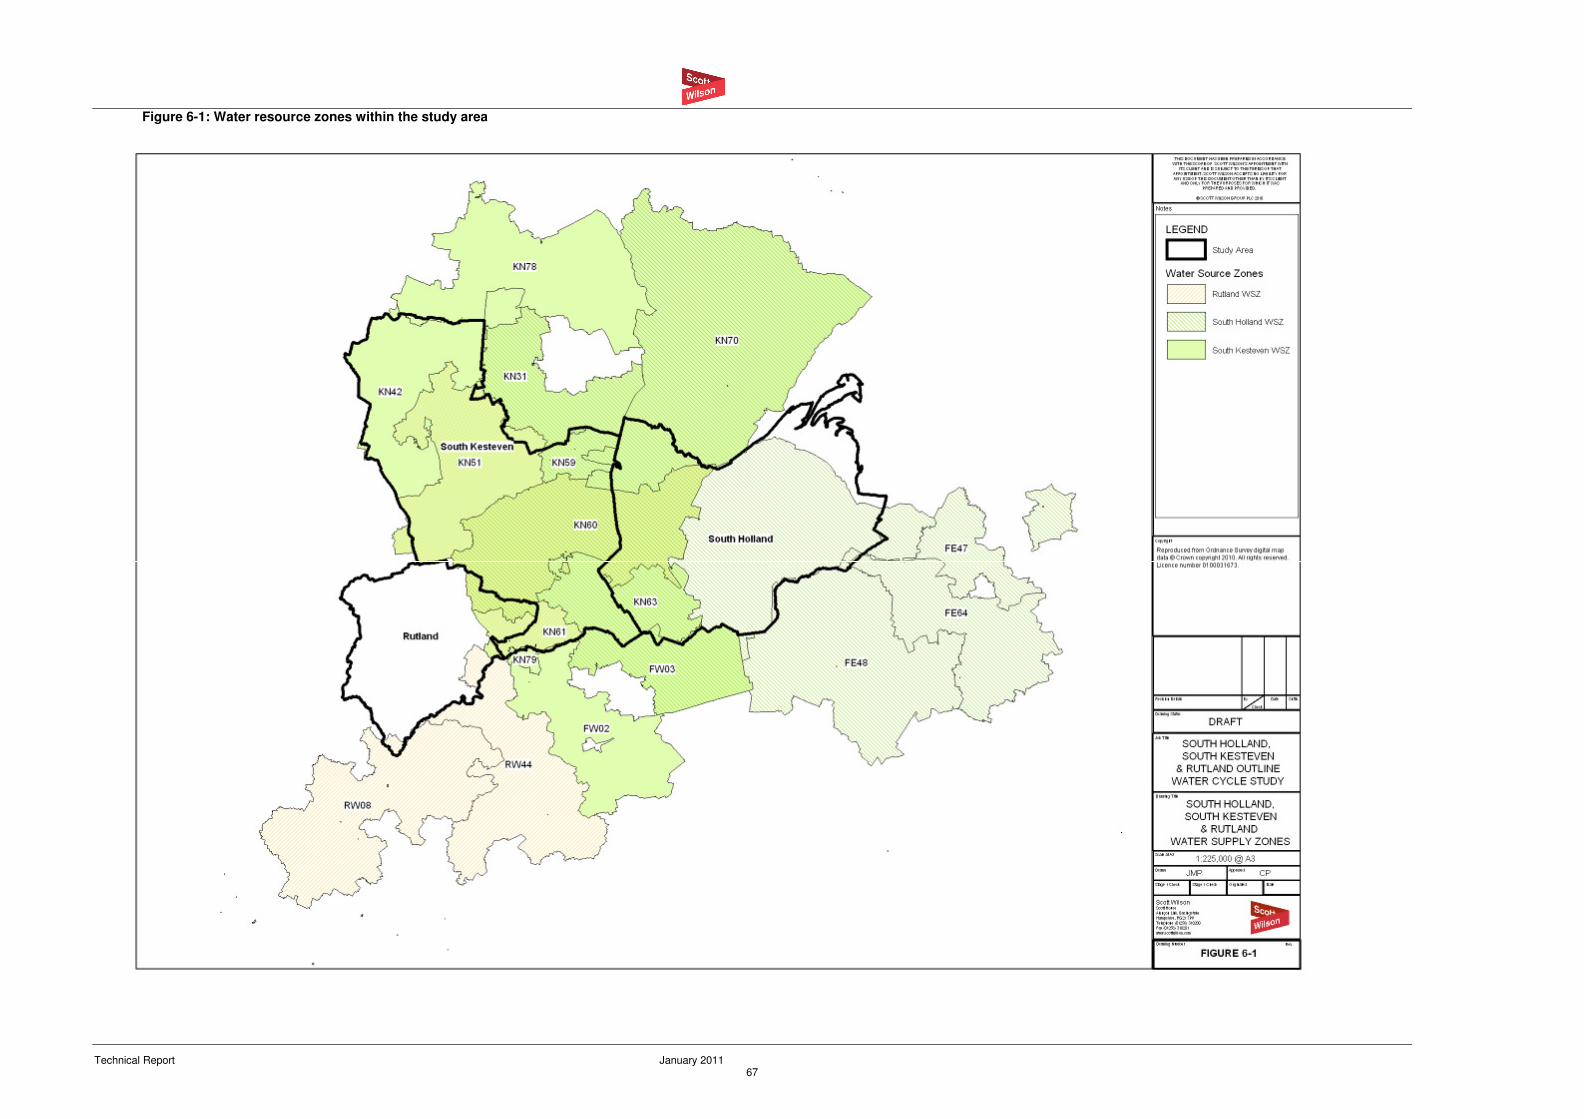
Technical Report January 2011 67
Figure 6-1: Water resource zones within the study area
Technical Report January 2011 68
6.2 Water Demand Calculations
In order to assess the water resources implications of the proposed growth in the study area,
five water supply projections for future growth have been prepared based on different options
for water use levels as follows:
• Projection 1 - Water Company average metered consumption (Reference 8) of 142 l/h/d,
this should be considered to be the ‘business as usual’ projection (assuming new homes will
have the same level of water consumption as for metered properties currently);
• Projection 2 – Part G of the Building Regulations requirement (due to come in force on the
6th April 2010) of 125 l/h/d (equivalent to the Code for Sustainable Homes (CfSH) Level 1/2
rating of 120 l/h/d plus 5 l/h/d for outdoor use);
• Projection 3 - the suggested policy projection of 105 l/h/d, equivalent to the CfSH Level 3/4
rating;
• Projection 4 - Thames Gateway Water neutrality study recommendation59
of 95 l/h/d; and
• Projection 5 – CfSH Level 5/6 rating of 80 l/h/d.
The above water consumption figures have been applied to the population figures for each of
the three proposed housing growth scenarios given in Section 4 and the anticipated water
demand has been calculated for each of the five water demand scenarios.
6.3 Water Efficiency
6.3.1 South Holland water demand strategies
The calculations, shown below in Figures 6-2 to 6-7, indicate that the ‘business as usual’
projection (Projection 1) of metered water consumption would require between 1.73 and 3.73
Ml/d of additional supply by 2026. This compares with the recommended policy projection
(Projection 3), which would require between 0.97 and 2.10 Ml/d by 2026. These figures, and
the water requirements and saving of the other water consumption strategies are displayed
graphically below.
Figures 6-2 to 6-7 below display the anticipated water saving from each water consumption
projection, as compared to the ‘business as usual’ projection (Projection 1) of metered water
consumption. Demand can be reduced by between 0.21 and 1.63 Ml/d in 2026 by adopting
more stringent water consumption approaches (Projections 2-5). The suggested policy
projection gives a saving of between 0.45 and 0.97 Ml/d in 2026.
59
While the Thames Gateway obviously lies outside of the study area, this is included as a benchmark study, which assessed the level of water saving that would be required to ensure sustainable growth in terms of water resources in a densely populated area and has therefore been included here as a point of comparison.
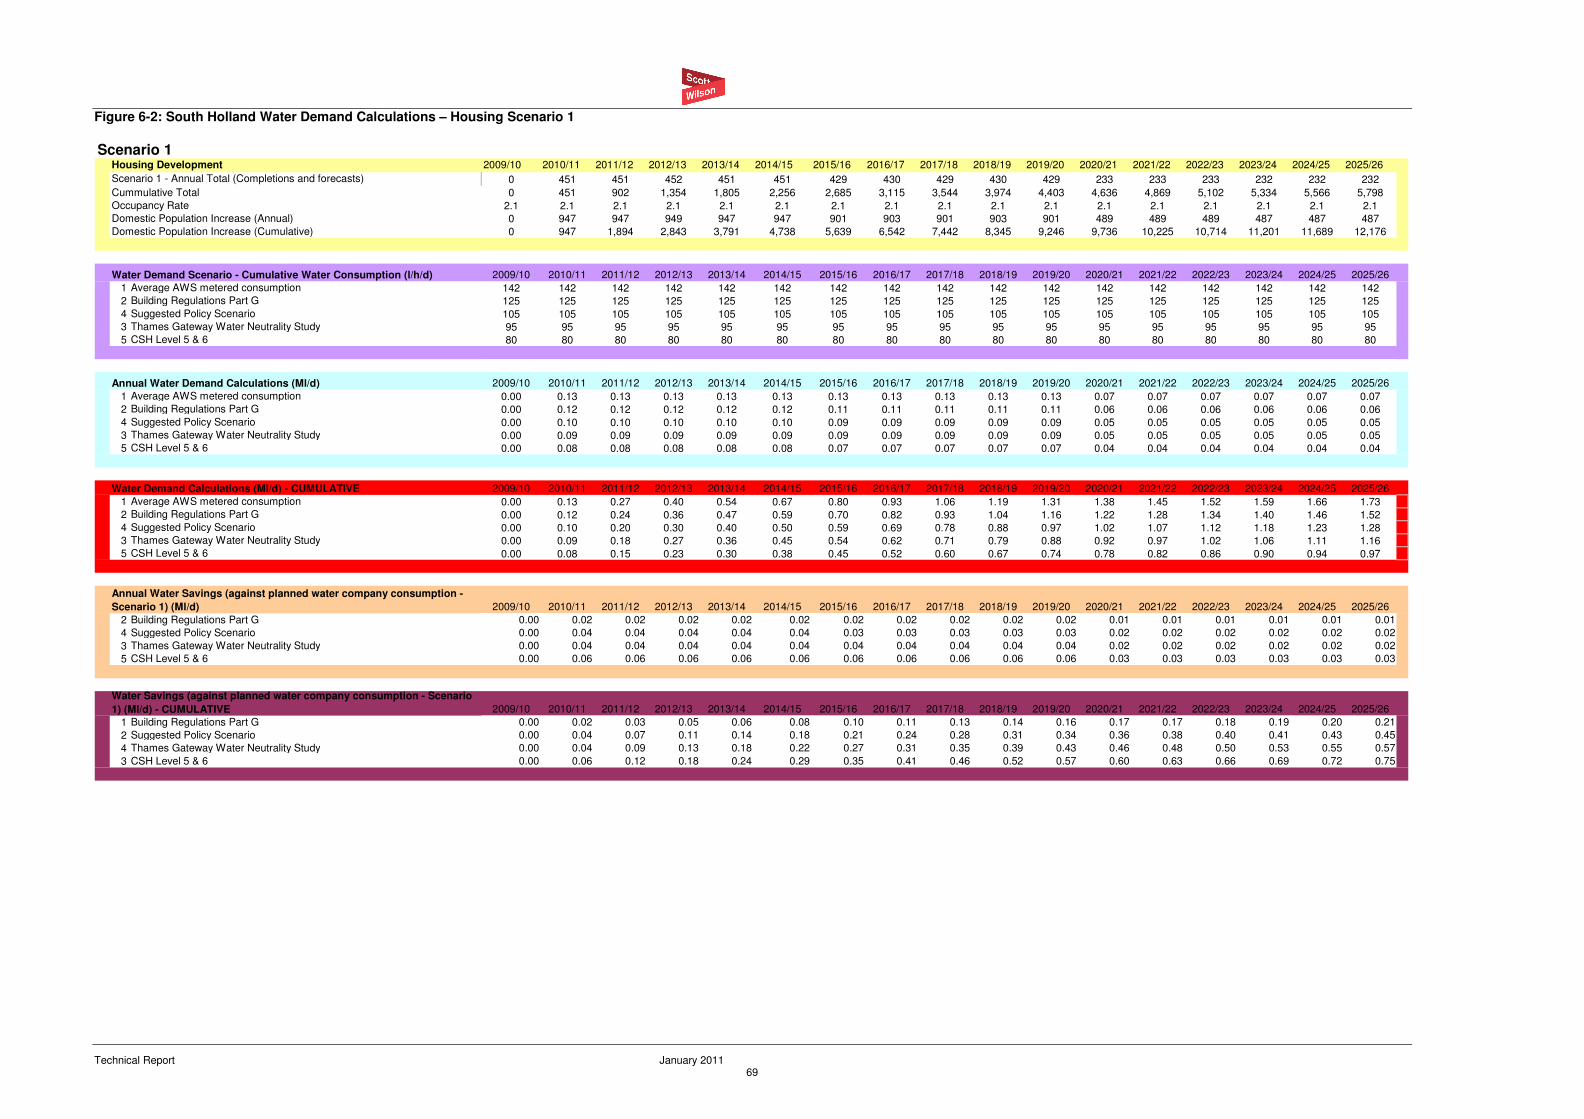
Technical Report January 2011 69
Figure 6-2: South Holland Water Demand Calculations – Housing Scenario 1
Scenario 12009/10 2010/11 2011/12 2012/13 2013/14 2014/15 2015/16 2016/17 2017/18 2018/19 2019/20 2020/21 2021/22 2022/23 2023/24 2024/25 2025/26
0 451 451 452 451 451 429 430 429 430 429 233 233 233 232 232 232
0 451 902 1,354 1,805 2,256 2,685 3,115 3,544 3,974 4,403 4,636 4,869 5,102 5,334 5,566 5,798
2.1 2.1 2.1 2.1 2.1 2.1 2.1 2.1 2.1 2.1 2.1 2.1 2.1 2.1 2.1 2.1 2.1
Domestic Population Increase (Annual) 0 947 947 949 947 947 901 903 901 903 901 489 489 489 487 487 487
Domestic Population Increase (Cumulative) 0 947 1,894 2,843 3,791 4,738 5,639 6,542 7,442 8,345 9,246 9,736 10,225 10,714 11,201 11,689 12,176
Water Demand Scenario - Cumulative Water Consumption (l/h/d) 2009/10 2010/11 2011/12 2012/13 2013/14 2014/15 2015/16 2016/17 2017/18 2018/19 2019/20 2020/21 2021/22 2022/23 2023/24 2024/25 2025/26
1 Average AWS metered consumption 142 142 142 142 142 142 142 142 142 142 142 142 142 142 142 142 142
2 Building Regulations Part G 125 125 125 125 125 125 125 125 125 125 125 125 125 125 125 125 125
4 Suggested Policy Scenario 105 105 105 105 105 105 105 105 105 105 105 105 105 105 105 105 105
3 Thames Gateway Water Neutrality Study 95 95 95 95 95 95 95 95 95 95 95 95 95 95 95 95 95
5 CSH Level 5 & 6 80 80 80 80 80 80 80 80 80 80 80 80 80 80 80 80 80
Annual Water Demand Calculations (Ml/d) 2009/10 2010/11 2011/12 2012/13 2013/14 2014/15 2015/16 2016/17 2017/18 2018/19 2019/20 2020/21 2021/22 2022/23 2023/24 2024/25 2025/26
1 Average AWS metered consumption 0.00 0.13 0.13 0.13 0.13 0.13 0.13 0.13 0.13 0.13 0.13 0.07 0.07 0.07 0.07 0.07 0.07
2 Building Regulations Part G 0.00 0.12 0.12 0.12 0.12 0.12 0.11 0.11 0.11 0.11 0.11 0.06 0.06 0.06 0.06 0.06 0.06
4 Suggested Policy Scenario 0.00 0.10 0.10 0.10 0.10 0.10 0.09 0.09 0.09 0.09 0.09 0.05 0.05 0.05 0.05 0.05 0.05
3 Thames Gateway Water Neutrality Study 0.00 0.09 0.09 0.09 0.09 0.09 0.09 0.09 0.09 0.09 0.09 0.05 0.05 0.05 0.05 0.05 0.05
5 CSH Level 5 & 6 0.00 0.08 0.08 0.08 0.08 0.08 0.07 0.07 0.07 0.07 0.07 0.04 0.04 0.04 0.04 0.04 0.04
Water Demand Calculations (Ml/d) - CUMULATIVE 2009/10 2010/11 2011/12 2012/13 2013/14 2014/15 2015/16 2016/17 2017/18 2018/19 2019/20 2020/21 2021/22 2022/23 2023/24 2024/25 2025/26
1 Average AWS metered consumption 0.00 0.13 0.27 0.40 0.54 0.67 0.80 0.93 1.06 1.19 1.31 1.38 1.45 1.52 1.59 1.66 1.73
2 Building Regulations Part G 0.00 0.12 0.24 0.36 0.47 0.59 0.70 0.82 0.93 1.04 1.16 1.22 1.28 1.34 1.40 1.46 1.52
4 Suggested Policy Scenario 0.00 0.10 0.20 0.30 0.40 0.50 0.59 0.69 0.78 0.88 0.97 1.02 1.07 1.12 1.18 1.23 1.28
3 Thames Gateway Water Neutrality Study 0.00 0.09 0.18 0.27 0.36 0.45 0.54 0.62 0.71 0.79 0.88 0.92 0.97 1.02 1.06 1.11 1.16
5 CSH Level 5 & 6 0.00 0.08 0.15 0.23 0.30 0.38 0.45 0.52 0.60 0.67 0.74 0.78 0.82 0.86 0.90 0.94 0.97
2009/10 2010/11 2011/12 2012/13 2013/14 2014/15 2015/16 2016/17 2017/18 2018/19 2019/20 2020/21 2021/22 2022/23 2023/24 2024/25 2025/26
2 Building Regulations Part G 0.00 0.02 0.02 0.02 0.02 0.02 0.02 0.02 0.02 0.02 0.02 0.01 0.01 0.01 0.01 0.01 0.01
4 Suggested Policy Scenario 0.00 0.04 0.04 0.04 0.04 0.04 0.03 0.03 0.03 0.03 0.03 0.02 0.02 0.02 0.02 0.02 0.02
3 Thames Gateway Water Neutrality Study 0.00 0.04 0.04 0.04 0.04 0.04 0.04 0.04 0.04 0.04 0.04 0.02 0.02 0.02 0.02 0.02 0.02
5 CSH Level 5 & 6 0.00 0.06 0.06 0.06 0.06 0.06 0.06 0.06 0.06 0.06 0.06 0.03 0.03 0.03 0.03 0.03 0.03
2009/10 2010/11 2011/12 2012/13 2013/14 2014/15 2015/16 2016/17 2017/18 2018/19 2019/20 2020/21 2021/22 2022/23 2023/24 2024/25 2025/26
1 Building Regulations Part G 0.00 0.02 0.03 0.05 0.06 0.08 0.10 0.11 0.13 0.14 0.16 0.17 0.17 0.18 0.19 0.20 0.21
2 Suggested Policy Scenario 0.00 0.04 0.07 0.11 0.14 0.18 0.21 0.24 0.28 0.31 0.34 0.36 0.38 0.40 0.41 0.43 0.45
4 Thames Gateway Water Neutrality Study 0.00 0.04 0.09 0.13 0.18 0.22 0.27 0.31 0.35 0.39 0.43 0.46 0.48 0.50 0.53 0.55 0.57
3 CSH Level 5 & 6 0.00 0.06 0.12 0.18 0.24 0.29 0.35 0.41 0.46 0.52 0.57 0.60 0.63 0.66 0.69 0.72 0.75
Annual Water Savings (against planned water company consumption -
Scenario 1) (Ml/d)
Water Savings (against planned water company consumption - Scenario
1) (Ml/d) - CUMULATIVE
Housing Development
Scenario 1 - Annual Total (Completions and forecasts)
Cummulative Total
Occupancy Rate
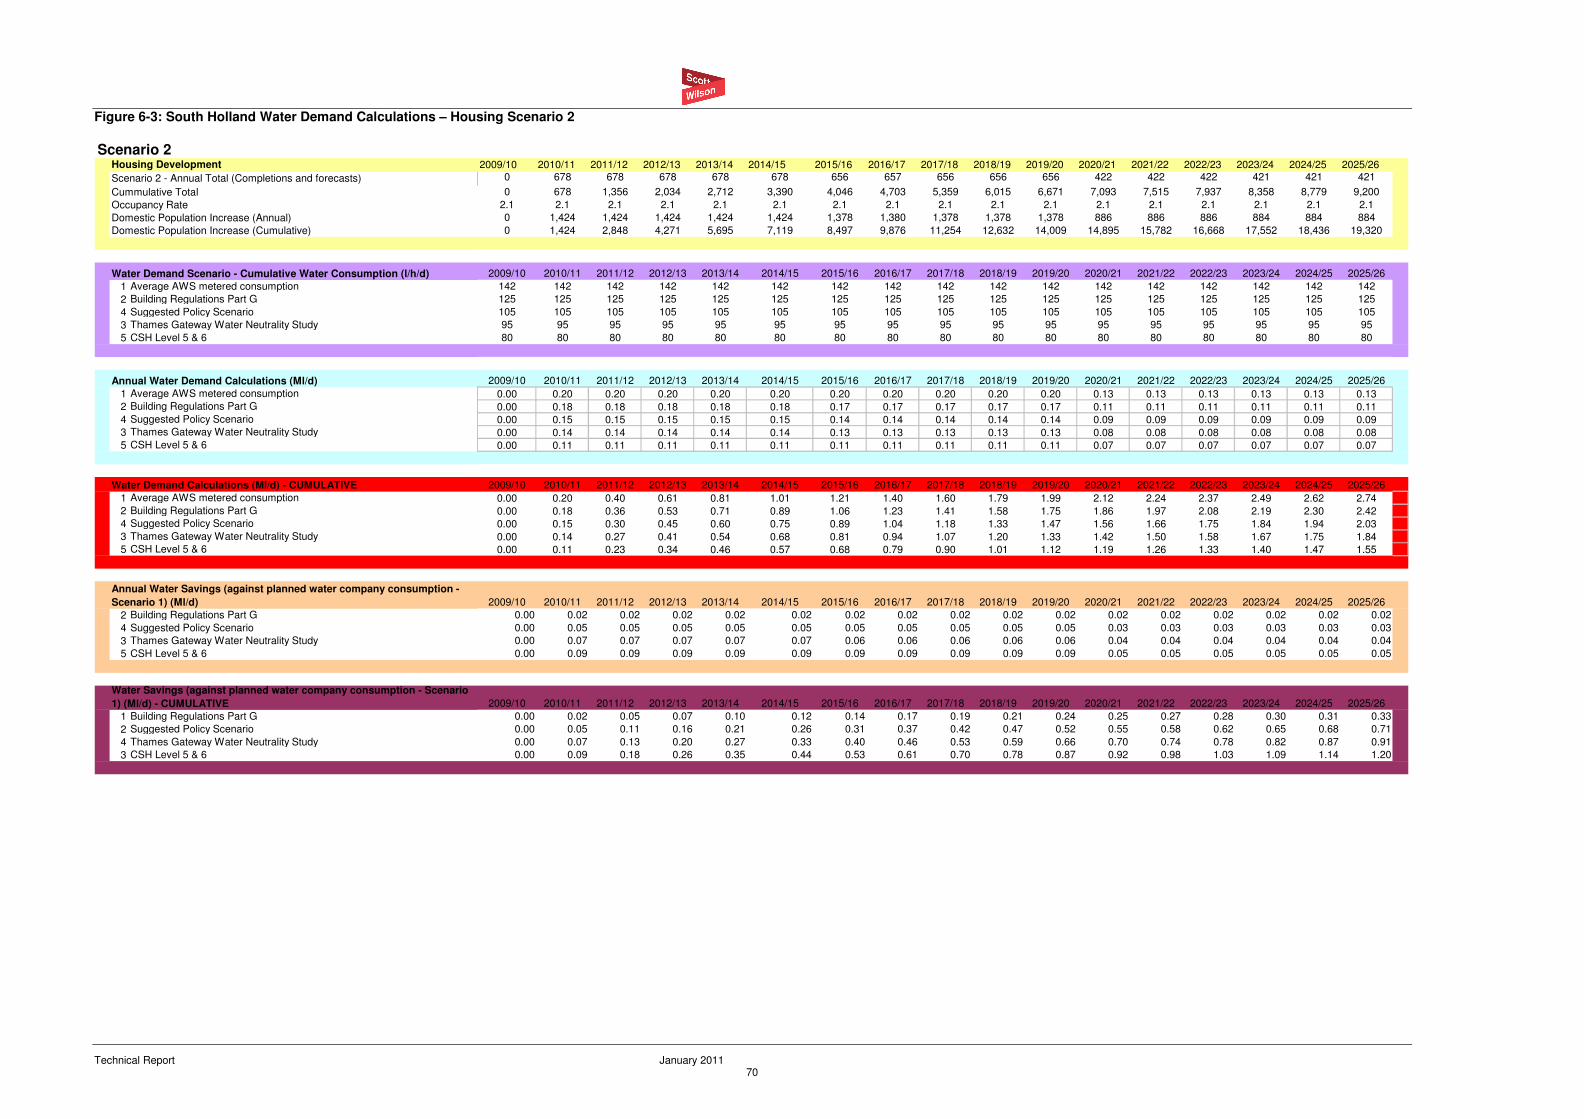
Technical Report January 2011 70
Figure 6-3: South Holland Water Demand Calculations – Housing Scenario 2
Scenario 22009/10 2010/11 2011/12 2012/13 2013/14 2014/15 2015/16 2016/17 2017/18 2018/19 2019/20 2020/21 2021/22 2022/23 2023/24 2024/25 2025/26
0 678 678 678 678 678 656 657 656 656 656 422 422 422 421 421 421
0 678 1,356 2,034 2,712 3,390 4,046 4,703 5,359 6,015 6,671 7,093 7,515 7,937 8,358 8,779 9,200
2.1 2.1 2.1 2.1 2.1 2.1 2.1 2.1 2.1 2.1 2.1 2.1 2.1 2.1 2.1 2.1 2.1
Domestic Population Increase (Annual) 0 1,424 1,424 1,424 1,424 1,424 1,378 1,380 1,378 1,378 1,378 886 886 886 884 884 884
Domestic Population Increase (Cumulative) 0 1,424 2,848 4,271 5,695 7,119 8,497 9,876 11,254 12,632 14,009 14,895 15,782 16,668 17,552 18,436 19,320
Water Demand Scenario - Cumulative Water Consumption (l/h/d) 2009/10 2010/11 2011/12 2012/13 2013/14 2014/15 2015/16 2016/17 2017/18 2018/19 2019/20 2020/21 2021/22 2022/23 2023/24 2024/25 2025/26
1 Average AWS metered consumption 142 142 142 142 142 142 142 142 142 142 142 142 142 142 142 142 142
2 Building Regulations Part G 125 125 125 125 125 125 125 125 125 125 125 125 125 125 125 125 125
4 Suggested Policy Scenario 105 105 105 105 105 105 105 105 105 105 105 105 105 105 105 105 105
3 Thames Gateway Water Neutrality Study 95 95 95 95 95 95 95 95 95 95 95 95 95 95 95 95 95
5 CSH Level 5 & 6 80 80 80 80 80 80 80 80 80 80 80 80 80 80 80 80 80
Annual Water Demand Calculations (Ml/d) 2009/10 2010/11 2011/12 2012/13 2013/14 2014/15 2015/16 2016/17 2017/18 2018/19 2019/20 2020/21 2021/22 2022/23 2023/24 2024/25 2025/26
1 Average AWS metered consumption 0.00 0.20 0.20 0.20 0.20 0.20 0.20 0.20 0.20 0.20 0.20 0.13 0.13 0.13 0.13 0.13 0.13
2 Building Regulations Part G 0.00 0.18 0.18 0.18 0.18 0.18 0.17 0.17 0.17 0.17 0.17 0.11 0.11 0.11 0.11 0.11 0.11
4 Suggested Policy Scenario 0.00 0.15 0.15 0.15 0.15 0.15 0.14 0.14 0.14 0.14 0.14 0.09 0.09 0.09 0.09 0.09 0.09
3 Thames Gateway Water Neutrality Study 0.00 0.14 0.14 0.14 0.14 0.14 0.13 0.13 0.13 0.13 0.13 0.08 0.08 0.08 0.08 0.08 0.08
5 CSH Level 5 & 6 0.00 0.11 0.11 0.11 0.11 0.11 0.11 0.11 0.11 0.11 0.11 0.07 0.07 0.07 0.07 0.07 0.07
Water Demand Calculations (Ml/d) - CUMULATIVE 2009/10 2010/11 2011/12 2012/13 2013/14 2014/15 2015/16 2016/17 2017/18 2018/19 2019/20 2020/21 2021/22 2022/23 2023/24 2024/25 2025/26
1 Average AWS metered consumption 0.00 0.20 0.40 0.61 0.81 1.01 1.21 1.40 1.60 1.79 1.99 2.12 2.24 2.37 2.49 2.62 2.74
2 Building Regulations Part G 0.00 0.18 0.36 0.53 0.71 0.89 1.06 1.23 1.41 1.58 1.75 1.86 1.97 2.08 2.19 2.30 2.42
4 Suggested Policy Scenario 0.00 0.15 0.30 0.45 0.60 0.75 0.89 1.04 1.18 1.33 1.47 1.56 1.66 1.75 1.84 1.94 2.03
3 Thames Gateway Water Neutrality Study 0.00 0.14 0.27 0.41 0.54 0.68 0.81 0.94 1.07 1.20 1.33 1.42 1.50 1.58 1.67 1.75 1.84
5 CSH Level 5 & 6 0.00 0.11 0.23 0.34 0.46 0.57 0.68 0.79 0.90 1.01 1.12 1.19 1.26 1.33 1.40 1.47 1.55
2009/10 2010/11 2011/12 2012/13 2013/14 2014/15 2015/16 2016/17 2017/18 2018/19 2019/20 2020/21 2021/22 2022/23 2023/24 2024/25 2025/26
2 Building Regulations Part G 0.00 0.02 0.02 0.02 0.02 0.02 0.02 0.02 0.02 0.02 0.02 0.02 0.02 0.02 0.02 0.02 0.02
4 Suggested Policy Scenario 0.00 0.05 0.05 0.05 0.05 0.05 0.05 0.05 0.05 0.05 0.05 0.03 0.03 0.03 0.03 0.03 0.03
3 Thames Gateway Water Neutrality Study 0.00 0.07 0.07 0.07 0.07 0.07 0.06 0.06 0.06 0.06 0.06 0.04 0.04 0.04 0.04 0.04 0.04
5 CSH Level 5 & 6 0.00 0.09 0.09 0.09 0.09 0.09 0.09 0.09 0.09 0.09 0.09 0.05 0.05 0.05 0.05 0.05 0.05
2009/10 2010/11 2011/12 2012/13 2013/14 2014/15 2015/16 2016/17 2017/18 2018/19 2019/20 2020/21 2021/22 2022/23 2023/24 2024/25 2025/26
1 Building Regulations Part G 0.00 0.02 0.05 0.07 0.10 0.12 0.14 0.17 0.19 0.21 0.24 0.25 0.27 0.28 0.30 0.31 0.33
2 Suggested Policy Scenario 0.00 0.05 0.11 0.16 0.21 0.26 0.31 0.37 0.42 0.47 0.52 0.55 0.58 0.62 0.65 0.68 0.71
4 Thames Gateway Water Neutrality Study 0.00 0.07 0.13 0.20 0.27 0.33 0.40 0.46 0.53 0.59 0.66 0.70 0.74 0.78 0.82 0.87 0.91
3 CSH Level 5 & 6 0.00 0.09 0.18 0.26 0.35 0.44 0.53 0.61 0.70 0.78 0.87 0.92 0.98 1.03 1.09 1.14 1.20
Annual Water Savings (against planned water company consumption -
Scenario 1) (Ml/d)
Water Savings (against planned water company consumption - Scenario
1) (Ml/d) - CUMULATIVE
Housing Development
Scenario 2 - Annual Total (Completions and forecasts)
Cummulative Total
Occupancy Rate
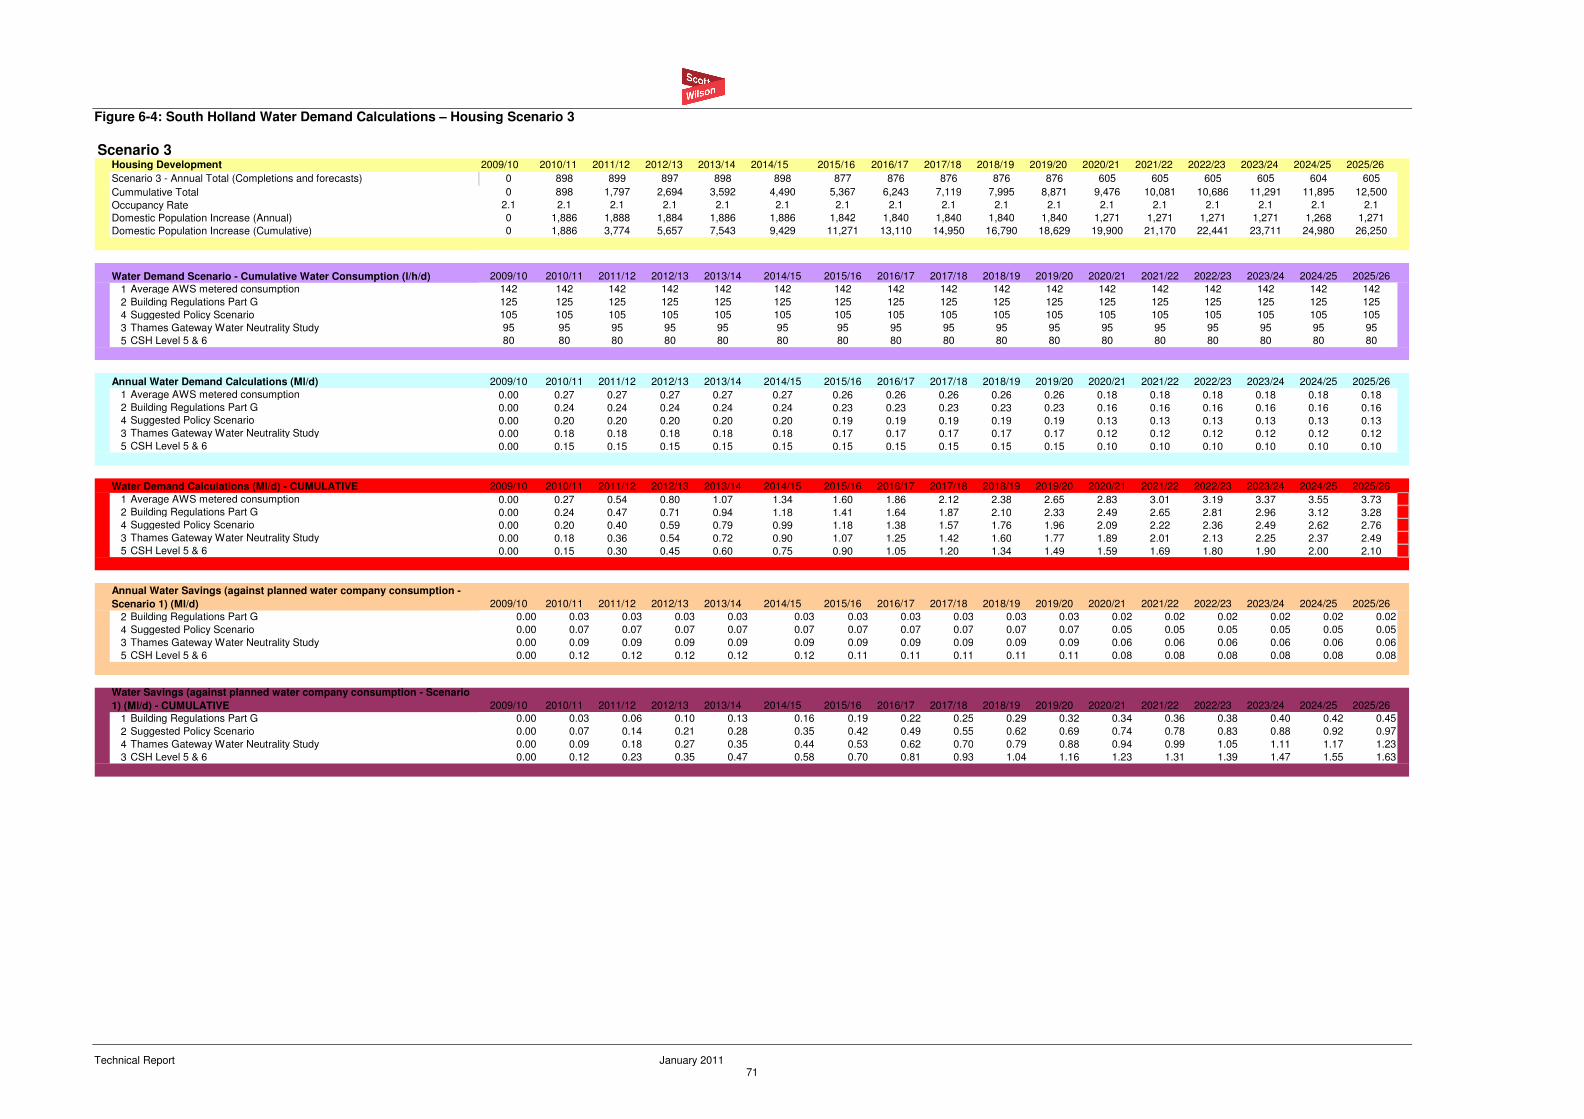
Technical Report January 2011 71
Figure 6-4: South Holland Water Demand Calculations – Housing Scenario 3
Scenario 32009/10 2010/11 2011/12 2012/13 2013/14 2014/15 2015/16 2016/17 2017/18 2018/19 2019/20 2020/21 2021/22 2022/23 2023/24 2024/25 2025/26
0 898 899 897 898 898 877 876 876 876 876 605 605 605 605 604 605
0 898 1,797 2,694 3,592 4,490 5,367 6,243 7,119 7,995 8,871 9,476 10,081 10,686 11,291 11,895 12,500
2.1 2.1 2.1 2.1 2.1 2.1 2.1 2.1 2.1 2.1 2.1 2.1 2.1 2.1 2.1 2.1 2.1
Domestic Population Increase (Annual) 0 1,886 1,888 1,884 1,886 1,886 1,842 1,840 1,840 1,840 1,840 1,271 1,271 1,271 1,271 1,268 1,271
Domestic Population Increase (Cumulative) 0 1,886 3,774 5,657 7,543 9,429 11,271 13,110 14,950 16,790 18,629 19,900 21,170 22,441 23,711 24,980 26,250
Water Demand Scenario - Cumulative Water Consumption (l/h/d) 2009/10 2010/11 2011/12 2012/13 2013/14 2014/15 2015/16 2016/17 2017/18 2018/19 2019/20 2020/21 2021/22 2022/23 2023/24 2024/25 2025/26
1 Average AWS metered consumption 142 142 142 142 142 142 142 142 142 142 142 142 142 142 142 142 142
2 Building Regulations Part G 125 125 125 125 125 125 125 125 125 125 125 125 125 125 125 125 125
4 Suggested Policy Scenario 105 105 105 105 105 105 105 105 105 105 105 105 105 105 105 105 105
3 Thames Gateway Water Neutrality Study 95 95 95 95 95 95 95 95 95 95 95 95 95 95 95 95 95
5 CSH Level 5 & 6 80 80 80 80 80 80 80 80 80 80 80 80 80 80 80 80 80
Annual Water Demand Calculations (Ml/d) 2009/10 2010/11 2011/12 2012/13 2013/14 2014/15 2015/16 2016/17 2017/18 2018/19 2019/20 2020/21 2021/22 2022/23 2023/24 2024/25 2025/26
1 Average AWS metered consumption 0.00 0.27 0.27 0.27 0.27 0.27 0.26 0.26 0.26 0.26 0.26 0.18 0.18 0.18 0.18 0.18 0.18
2 Building Regulations Part G 0.00 0.24 0.24 0.24 0.24 0.24 0.23 0.23 0.23 0.23 0.23 0.16 0.16 0.16 0.16 0.16 0.16
4 Suggested Policy Scenario 0.00 0.20 0.20 0.20 0.20 0.20 0.19 0.19 0.19 0.19 0.19 0.13 0.13 0.13 0.13 0.13 0.13
3 Thames Gateway Water Neutrality Study 0.00 0.18 0.18 0.18 0.18 0.18 0.17 0.17 0.17 0.17 0.17 0.12 0.12 0.12 0.12 0.12 0.12
5 CSH Level 5 & 6 0.00 0.15 0.15 0.15 0.15 0.15 0.15 0.15 0.15 0.15 0.15 0.10 0.10 0.10 0.10 0.10 0.10
Water Demand Calculations (Ml/d) - CUMULATIVE 2009/10 2010/11 2011/12 2012/13 2013/14 2014/15 2015/16 2016/17 2017/18 2018/19 2019/20 2020/21 2021/22 2022/23 2023/24 2024/25 2025/26
1 Average AWS metered consumption 0.00 0.27 0.54 0.80 1.07 1.34 1.60 1.86 2.12 2.38 2.65 2.83 3.01 3.19 3.37 3.55 3.73
2 Building Regulations Part G 0.00 0.24 0.47 0.71 0.94 1.18 1.41 1.64 1.87 2.10 2.33 2.49 2.65 2.81 2.96 3.12 3.28
4 Suggested Policy Scenario 0.00 0.20 0.40 0.59 0.79 0.99 1.18 1.38 1.57 1.76 1.96 2.09 2.22 2.36 2.49 2.62 2.76
3 Thames Gateway Water Neutrality Study 0.00 0.18 0.36 0.54 0.72 0.90 1.07 1.25 1.42 1.60 1.77 1.89 2.01 2.13 2.25 2.37 2.49
5 CSH Level 5 & 6 0.00 0.15 0.30 0.45 0.60 0.75 0.90 1.05 1.20 1.34 1.49 1.59 1.69 1.80 1.90 2.00 2.10
2009/10 2010/11 2011/12 2012/13 2013/14 2014/15 2015/16 2016/17 2017/18 2018/19 2019/20 2020/21 2021/22 2022/23 2023/24 2024/25 2025/26
2 Building Regulations Part G 0.00 0.03 0.03 0.03 0.03 0.03 0.03 0.03 0.03 0.03 0.03 0.02 0.02 0.02 0.02 0.02 0.02
4 Suggested Policy Scenario 0.00 0.07 0.07 0.07 0.07 0.07 0.07 0.07 0.07 0.07 0.07 0.05 0.05 0.05 0.05 0.05 0.05
3 Thames Gateway Water Neutrality Study 0.00 0.09 0.09 0.09 0.09 0.09 0.09 0.09 0.09 0.09 0.09 0.06 0.06 0.06 0.06 0.06 0.06
5 CSH Level 5 & 6 0.00 0.12 0.12 0.12 0.12 0.12 0.11 0.11 0.11 0.11 0.11 0.08 0.08 0.08 0.08 0.08 0.08
2009/10 2010/11 2011/12 2012/13 2013/14 2014/15 2015/16 2016/17 2017/18 2018/19 2019/20 2020/21 2021/22 2022/23 2023/24 2024/25 2025/26
1 Building Regulations Part G 0.00 0.03 0.06 0.10 0.13 0.16 0.19 0.22 0.25 0.29 0.32 0.34 0.36 0.38 0.40 0.42 0.45
2 Suggested Policy Scenario 0.00 0.07 0.14 0.21 0.28 0.35 0.42 0.49 0.55 0.62 0.69 0.74 0.78 0.83 0.88 0.92 0.97
4 Thames Gateway Water Neutrality Study 0.00 0.09 0.18 0.27 0.35 0.44 0.53 0.62 0.70 0.79 0.88 0.94 0.99 1.05 1.11 1.17 1.23
3 CSH Level 5 & 6 0.00 0.12 0.23 0.35 0.47 0.58 0.70 0.81 0.93 1.04 1.16 1.23 1.31 1.39 1.47 1.55 1.63
Water Savings (against planned water company consumption - Scenario
1) (Ml/d) - CUMULATIVE
Annual Water Savings (against planned water company consumption -
Scenario 1) (Ml/d)
Housing Development
Scenario 3 - Annual Total (Completions and forecasts)
Cummulative Total
Occupancy Rate
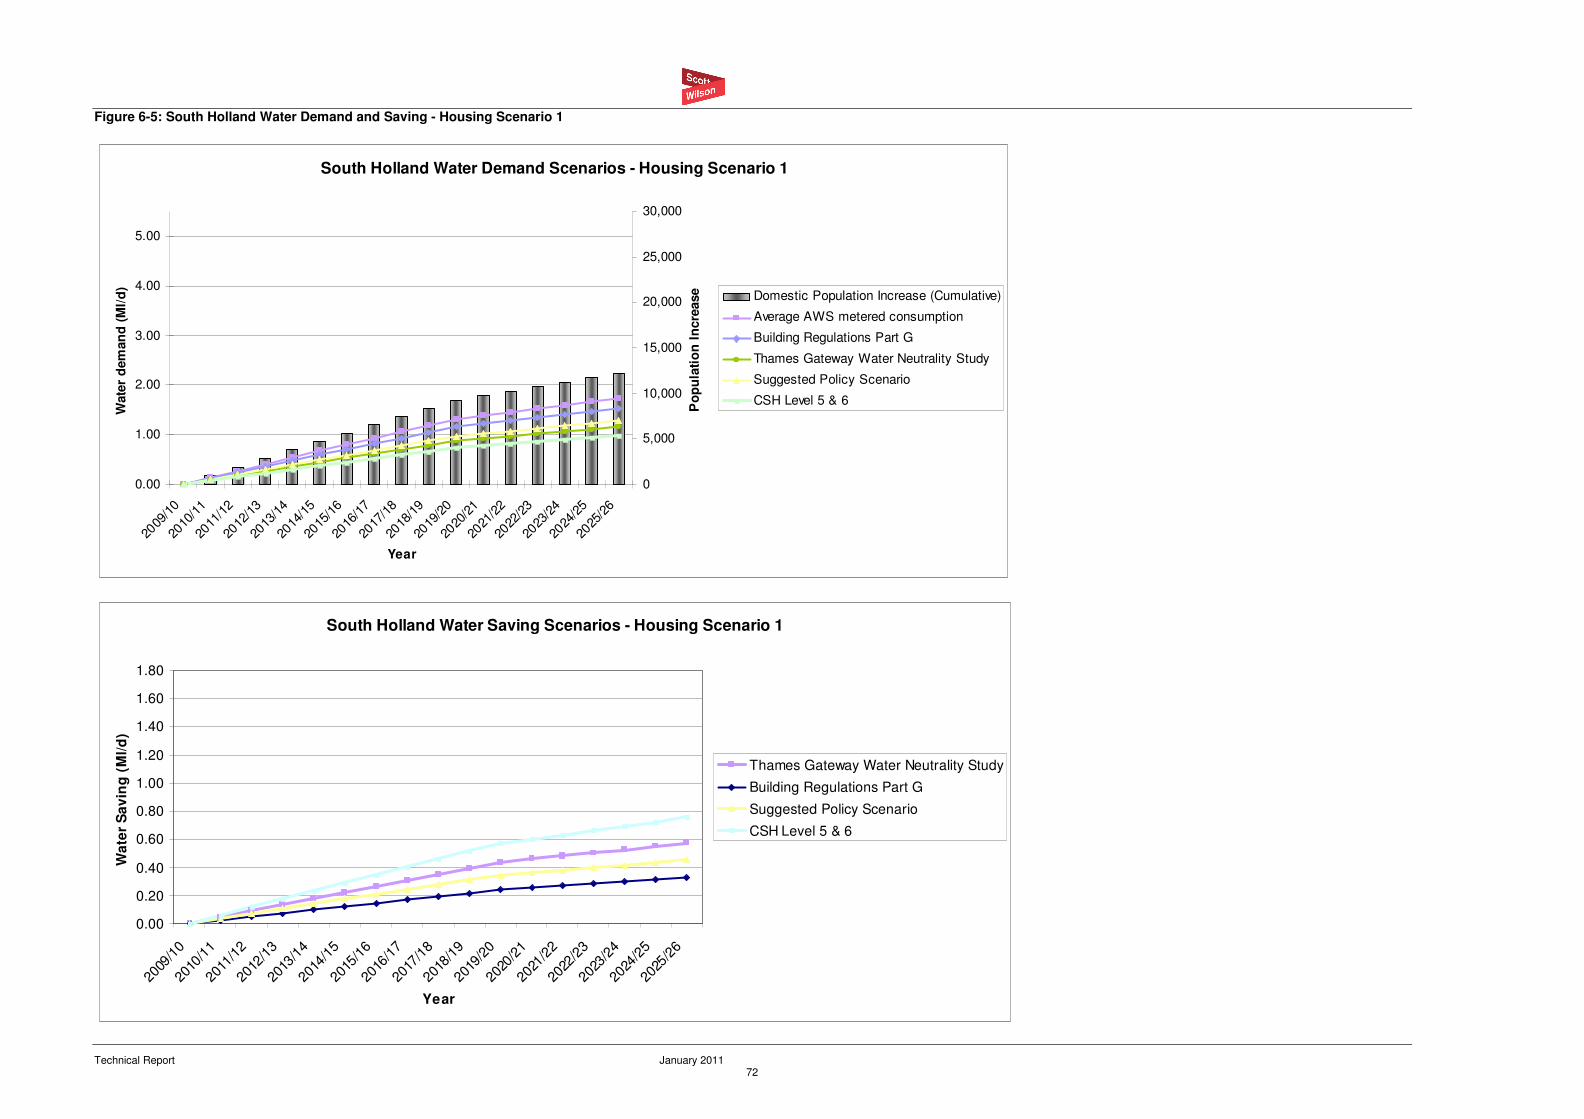
Technical Report January 2011 72
Figure 6-5: South Holland Water Demand and Saving - Housing Scenario 1
South Holland Water Demand Scenarios - Housing Scenario 1
0.00
1.00
2.00
3.00
4.00
5.00
2009
/10
2010
/11
2011
/12
2012
/13
2013
/14
2014
/15
2015
/16
2016
/17
2017
/18
2018
/19
2019
/20
2020
/21
2021
/22
2022
/23
2023
/24
2024
/25
2025
/26
Year
Wate
r d
em
an
d (
Ml/
d)
0
5,000
10,000
15,000
20,000
25,000
30,000
Po
pu
lati
on
In
cre
ase Domestic Population Increase (Cumulative)
Average AWS metered consumption
Building Regulations Part G
Thames Gateway Water Neutrality Study
Suggested Policy Scenario
CSH Level 5 & 6
South Holland Water Saving Scenarios - Housing Scenario 1
0.00
0.20
0.40
0.60
0.80
1.00
1.20
1.40
1.60
1.80
2009
/10
2010
/11
2011
/12
2012
/13
2013
/14
2014
/15
2015
/16
2016
/17
2017
/18
2018
/19
2019
/20
2020
/21
2021
/22
2022
/23
2023
/24
2024
/25
2025
/26
Year
Wa
ter
Sa
vin
g (
Ml/
d)
Thames Gateway Water Neutrality Study
Building Regulations Part G
Suggested Policy Scenario
CSH Level 5 & 6
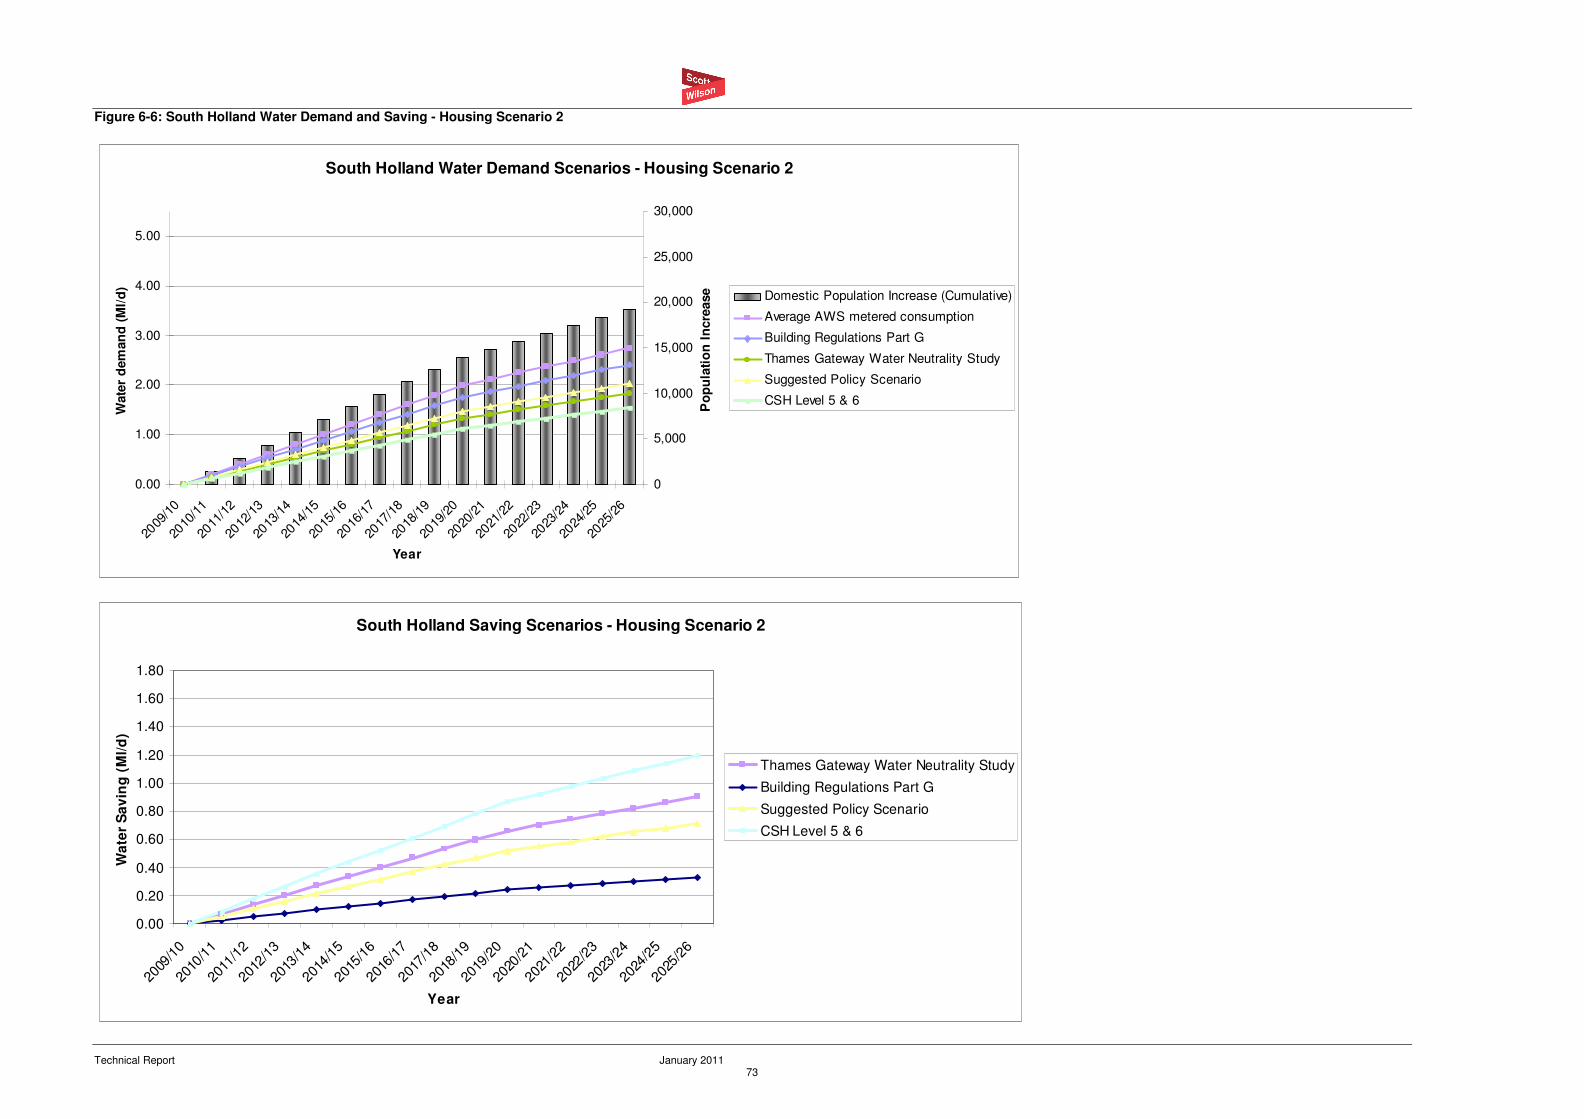
Technical Report January 2011 73
Figure 6-6: South Holland Water Demand and Saving - Housing Scenario 2
South Holland Water Demand Scenarios - Housing Scenario 2
0.00
1.00
2.00
3.00
4.00
5.00
2009
/10
2010
/11
2011
/12
2012
/13
2013
/14
2014
/15
2015
/16
2016
/17
2017
/18
2018
/19
2019
/20
2020
/21
2021
/22
2022
/23
2023
/24
2024
/25
2025
/26
Year
Wate
r d
em
an
d (
Ml/
d)
0
5,000
10,000
15,000
20,000
25,000
30,000
Po
pu
lati
on
In
cre
ase Domestic Population Increase (Cumulative)
Average AWS metered consumption
Building Regulations Part G
Thames Gateway Water Neutrality Study
Suggested Policy Scenario
CSH Level 5 & 6
South Holland Saving Scenarios - Housing Scenario 2
0.00
0.20
0.40
0.60
0.80
1.00
1.20
1.40
1.60
1.80
2009
/10
2010
/11
2011
/12
2012
/13
2013
/14
2014
/15
2015
/16
2016
/17
2017
/18
2018
/19
2019
/20
2020
/21
2021
/22
2022
/23
2023
/24
2024
/25
2025
/26
Year
Wa
ter
Sa
vin
g (
Ml/
d)
Thames Gateway Water Neutrality Study
Building Regulations Part G
Suggested Policy Scenario
CSH Level 5 & 6
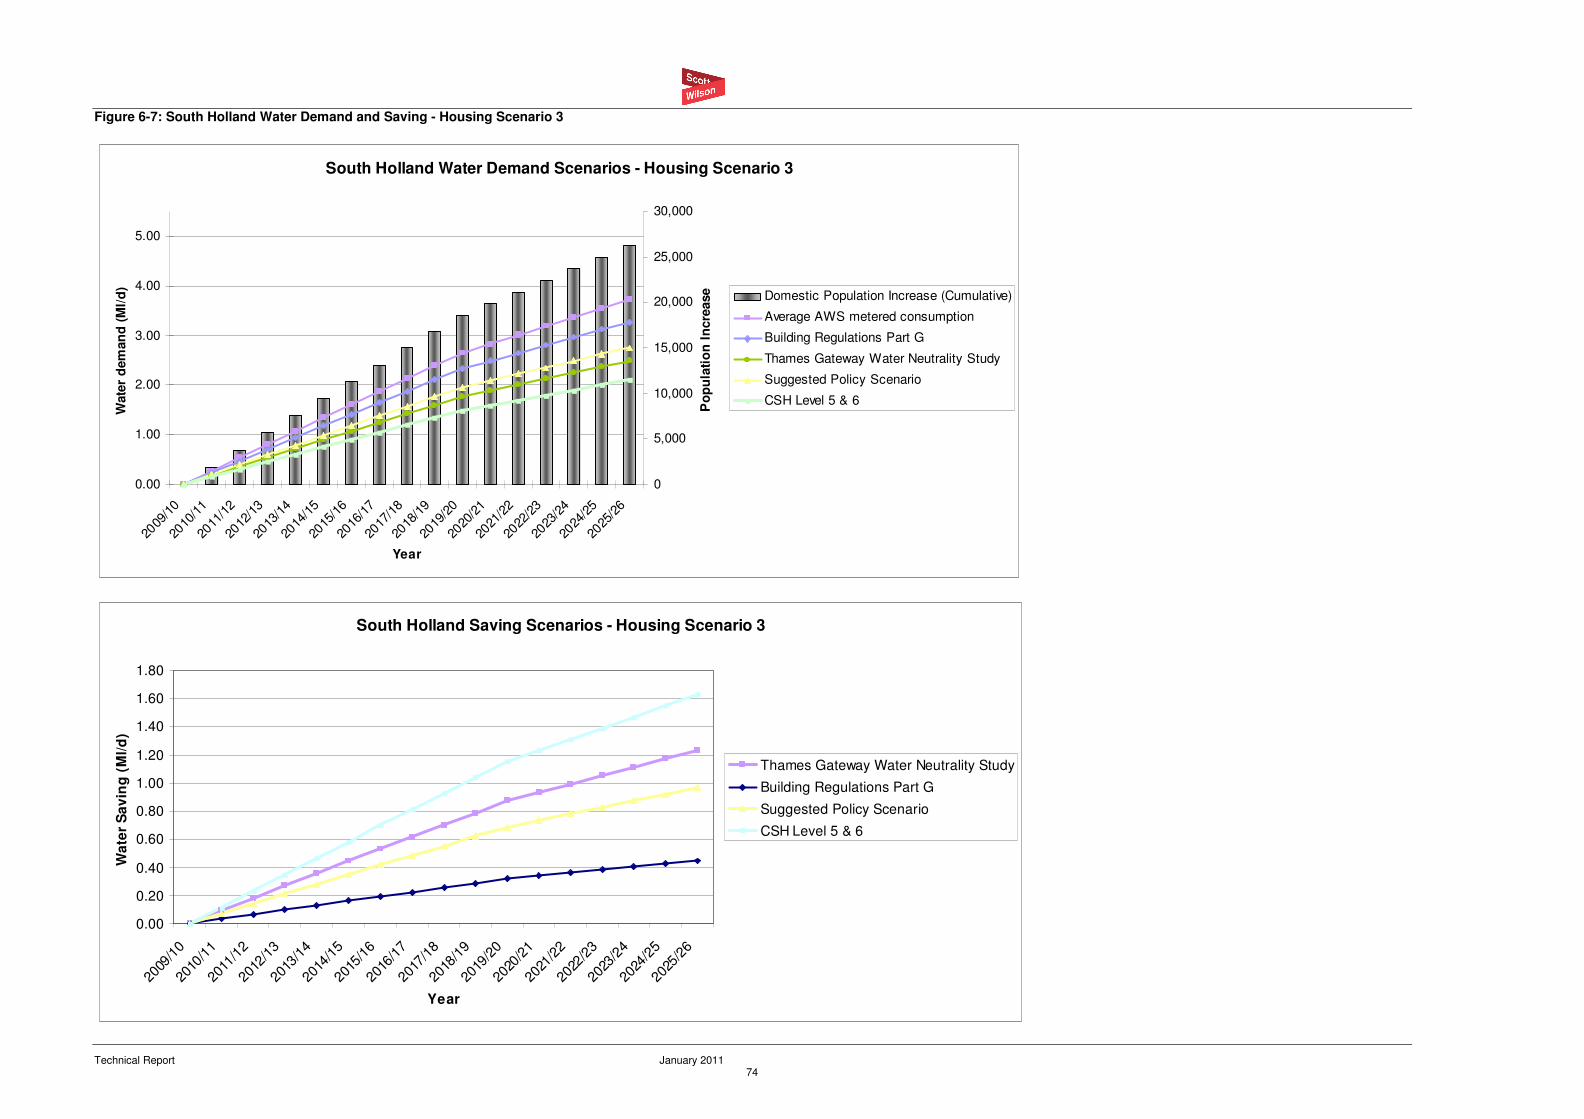
Technical Report January 2011 74
Figure 6-7: South Holland Water Demand and Saving - Housing Scenario 3
South Holland Water Demand Scenarios - Housing Scenario 3
0.00
1.00
2.00
3.00
4.00
5.00
2009
/10
2010
/11
2011
/12
2012
/13
2013
/14
2014
/15
2015
/16
2016
/17
2017
/18
2018
/19
2019
/20
2020
/21
2021
/22
2022
/23
2023
/24
2024
/25
2025
/26
Year
Wate
r d
em
an
d (
Ml/
d)
0
5,000
10,000
15,000
20,000
25,000
30,000
Po
pu
lati
on
In
cre
ase Domestic Population Increase (Cumulative)
Average AWS metered consumption
Building Regulations Part G
Thames Gateway Water Neutrality Study
Suggested Policy Scenario
CSH Level 5 & 6
South Holland Saving Scenarios - Housing Scenario 3
0.00
0.20
0.40
0.60
0.80
1.00
1.20
1.40
1.60
1.80
2009
/10
2010
/11
2011
/12
2012
/13
2013
/14
2014
/15
2015
/16
2016
/17
2017
/18
2018
/19
2019
/20
2020
/21
2021
/22
2022
/23
2023
/24
2024
/25
2025
/26
Year
Wa
ter
Sa
vin
g (
Ml/
d)
Thames Gateway Water Neutrality Study
Building Regulations Part G
Suggested Policy Scenario
CSH Level 5 & 6
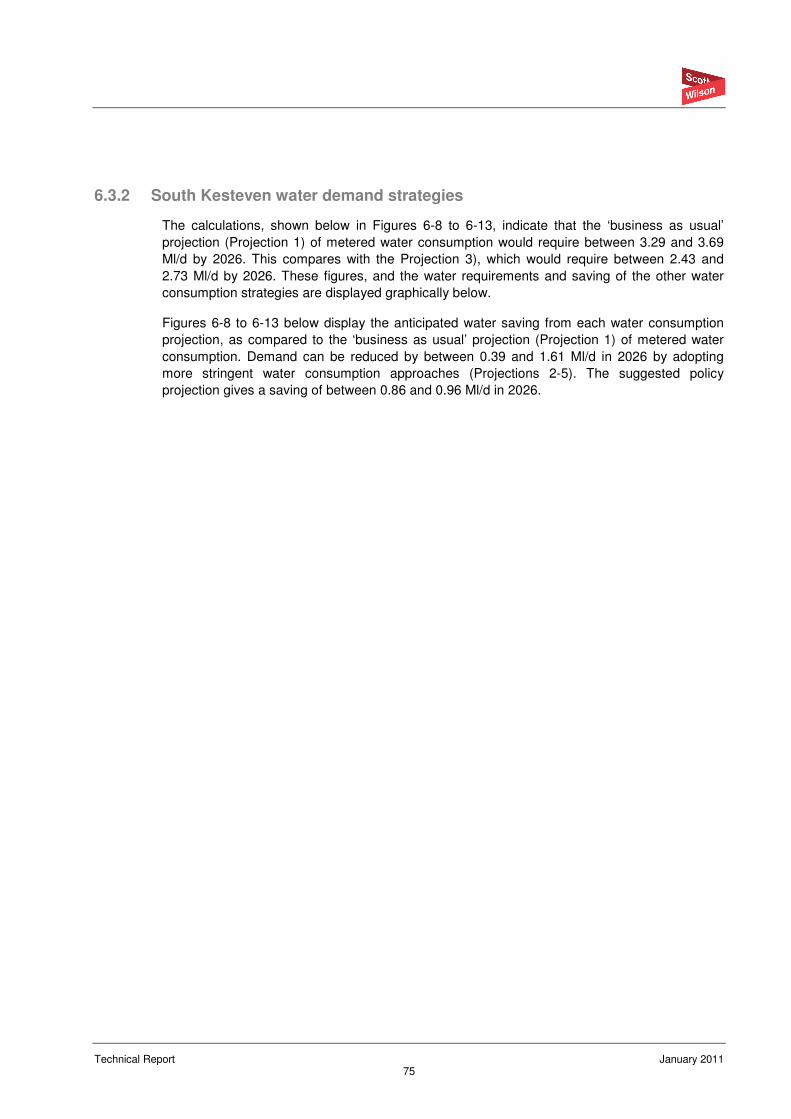
Technical Report January 2011 75
6.3.2 South Kesteven water demand strategies
The calculations, shown below in Figures 6-8 to 6-13, indicate that the ‘business as usual’
projection (Projection 1) of metered water consumption would require between 3.29 and 3.69
Ml/d by 2026. This compares with the Projection 3), which would require between 2.43 and
2.73 Ml/d by 2026. These figures, and the water requirements and saving of the other water
consumption strategies are displayed graphically below.
Figures 6-8 to 6-13 below display the anticipated water saving from each water consumption
projection, as compared to the ‘business as usual’ projection (Projection 1) of metered water
consumption. Demand can be reduced by between 0.39 and 1.61 Ml/d in 2026 by adopting
more stringent water consumption approaches (Projections 2-5). The suggested policy
projection gives a saving of between 0.86 and 0.96 Ml/d in 2026.

Technical Report January 2011 76
Figure 6-8: South Kesteven Water Demand Calculations – Housing Scenario 1
Scenario 12009/10 2010/11 2011/12 2012/13 2013/14 2014/15 2015/16 2016/17 2017/18 2018/19 2019/20 2020/21 2021/22 2022/23 2023/24 2024/25 2025/26
0 523 584 626 656 550 734 716 734 737 737 737 737 737 737 737 737
0 523 1,107 1,733 2,389 2,939 3,673 4,389 5,123 5,860 6,597 7,334 8,071 8,808 9,545 10,282 11,019
2.10 2.10 2.10 2.10 2.10 2.10 2.10 2.10 2.10 2.10 2.10 2.10 2.10 2.10 2.10 2.10 2.10
Domestic Population Increase (Annual) 0 1,098 1,226 1,315 1,378 1,155 1,541 1,504 1,541 1,548 1,548 1,548 1,548 1,548 1,548 1,548 1,548
Domestic Population Increase (Cumulative) 0 1,098 2,325 3,639 5,017 6,172 7,713 9,217 10,758 12,306 13,854 15,401 16,949 18,497 20,045 21,592 23,140
Water Demand Scenario - Cumulative Water Consumption (l/h/d) 2009/10 2010/11 2011/12 2012/13 2013/14 2014/15 2015/16 2016/17 2017/18 2018/19 2019/20 2020/21 2021/22 2022/23 2023/24 2024/25 2025/26
1 Average AWS metered consumption 142 142 142 142 142 142 142 142 142 142 142 142 142 142 142 142 142
2 Building Regulations Part G 125 125 125 125 125 125 125 125 125 125 125 125 125 125 125 125 125
4 Suggested Policy Scenario 105 105 105 105 105 105 105 105 105 105 105 105 105 105 105 105 105
3 Thames Gateway Water Neutrality Study 95 95 95 95 95 95 95 95 95 95 95 95 95 95 95 95 95
5 CSH Level 5 & 6 80 80 80 80 80 80 80 80 80 80 80 80 80 80 80 80 80
Annual Water Demand Calculations (Ml/d) 2009/10 2010/11 2011/12 2012/13 2013/14 2014/15 2015/16 2016/17 2017/18 2018/19 2019/20 2020/21 2021/22 2022/23 2023/24 2024/25 2025/26
1 Average AWS metered consumption 0.00 0.16 0.17 0.19 0.20 0.16 0.22 0.21 0.22 0.22 0.22 0.22 0.22 0.22 0.22 0.22 0.22
2 Building Regulations Part G 0.00 0.14 0.15 0.16 0.17 0.14 0.19 0.19 0.19 0.19 0.19 0.19 0.19 0.19 0.19 0.19 0.19
4 Suggested Policy Scenario 0.00 0.12 0.13 0.14 0.14 0.12 0.16 0.16 0.16 0.16 0.16 0.16 0.16 0.16 0.16 0.16 0.16
3 Thames Gateway Water Neutrality Study 0.00 0.10 0.12 0.12 0.13 0.11 0.15 0.14 0.15 0.15 0.15 0.15 0.15 0.15 0.15 0.15 0.15
5 CSH Level 5 & 6 0.00 0.09 0.10 0.11 0.11 0.09 0.12 0.12 0.12 0.12 0.12 0.12 0.12 0.12 0.12 0.12 0.12
Water Demand Calculations (Ml/d) - CUMULATIVE 2009/10 2010/11 2011/12 2012/13 2013/14 2014/15 2015/16 2016/17 2017/18 2018/19 2019/20 2020/21 2021/22 2022/23 2023/24 2024/25 2025/26
1 Average AWS metered consumption 0.00 0.16 0.33 0.52 0.71 0.88 1.10 1.31 1.53 1.75 1.97 2.19 2.41 2.63 2.85 3.07 3.29
2 Building Regulations Part G 0.00 0.14 0.29 0.45 0.63 0.77 0.96 1.15 1.34 1.54 1.73 1.93 2.12 2.31 2.51 2.70 2.89
4 Suggested Policy Scenario 0.00 0.12 0.24 0.38 0.53 0.65 0.81 0.97 1.13 1.29 1.45 1.62 1.78 1.94 2.10 2.27 2.43
3 Thames Gateway Water Neutrality Study 0.00 0.10 0.22 0.35 0.48 0.59 0.73 0.88 1.02 1.17 1.32 1.46 1.61 1.76 1.90 2.05 2.20
5 CSH Level 5 & 6 0.00 0.09 0.19 0.29 0.40 0.49 0.62 0.74 0.86 0.98 1.11 1.23 1.36 1.48 1.60 1.73 1.85
2009/10 2010/11 2011/12 2012/13 2013/14 2014/15 2015/16 2016/17 2017/18 2018/19 2019/20 2020/21 2021/22 2022/23 2023/24 2024/25 2025/26
2 Building Regulations Part G 0.00 0.02 0.02 0.02 0.02 0.02 0.03 0.03 0.03 0.03 0.03 0.03 0.03 0.03 0.03 0.03 0.03
4 Suggested Policy Scenario 0.00 0.04 0.05 0.05 0.05 0.04 0.06 0.06 0.06 0.06 0.06 0.06 0.06 0.06 0.06 0.06 0.06
3 Thames Gateway Water Neutrality Study 0.00 0.05 0.06 0.06 0.06 0.05 0.07 0.07 0.07 0.07 0.07 0.07 0.07 0.07 0.07 0.07 0.07
5 CSH Level 5 & 6 0.00 0.07 0.08 0.08 0.09 0.07 0.10 0.09 0.10 0.10 0.10 0.10 0.10 0.10 0.10 0.10 0.10
2009/10 2010/11 2011/12 2012/13 2013/14 2014/15 2015/16 2016/17 2017/18 2018/19 2019/20 2020/21 2021/22 2022/23 2023/24 2024/25 2025/26
1 Building Regulations Part G 0.00 0.02 0.04 0.06 0.09 0.10 0.13 0.16 0.18 0.21 0.24 0.26 0.29 0.31 0.34 0.37 0.39
2 Suggested Policy Scenario 0.00 0.04 0.09 0.13 0.19 0.23 0.29 0.34 0.40 0.46 0.51 0.57 0.63 0.68 0.74 0.80 0.86
4 Thames Gateway Water Neutrality Study 0.00 0.05 0.11 0.17 0.24 0.29 0.36 0.43 0.51 0.58 0.65 0.72 0.80 0.87 0.94 1.01 1.09
3 CSH Level 5 & 6 0.00 0.07 0.14 0.23 0.31 0.38 0.48 0.57 0.67 0.76 0.86 0.95 1.05 1.15 1.24 1.34 1.43
Annual Water Savings (against planned water company consumption -
Scenario 1) (Ml/d)
Water Savings (against planned water company consumption - Scenario
1) (Ml/d) - CUMULATIVE
Housing Development
Scenario 1 - Annual Total (Completions and forecasts)
Cummulative Total
Occupancy Rate
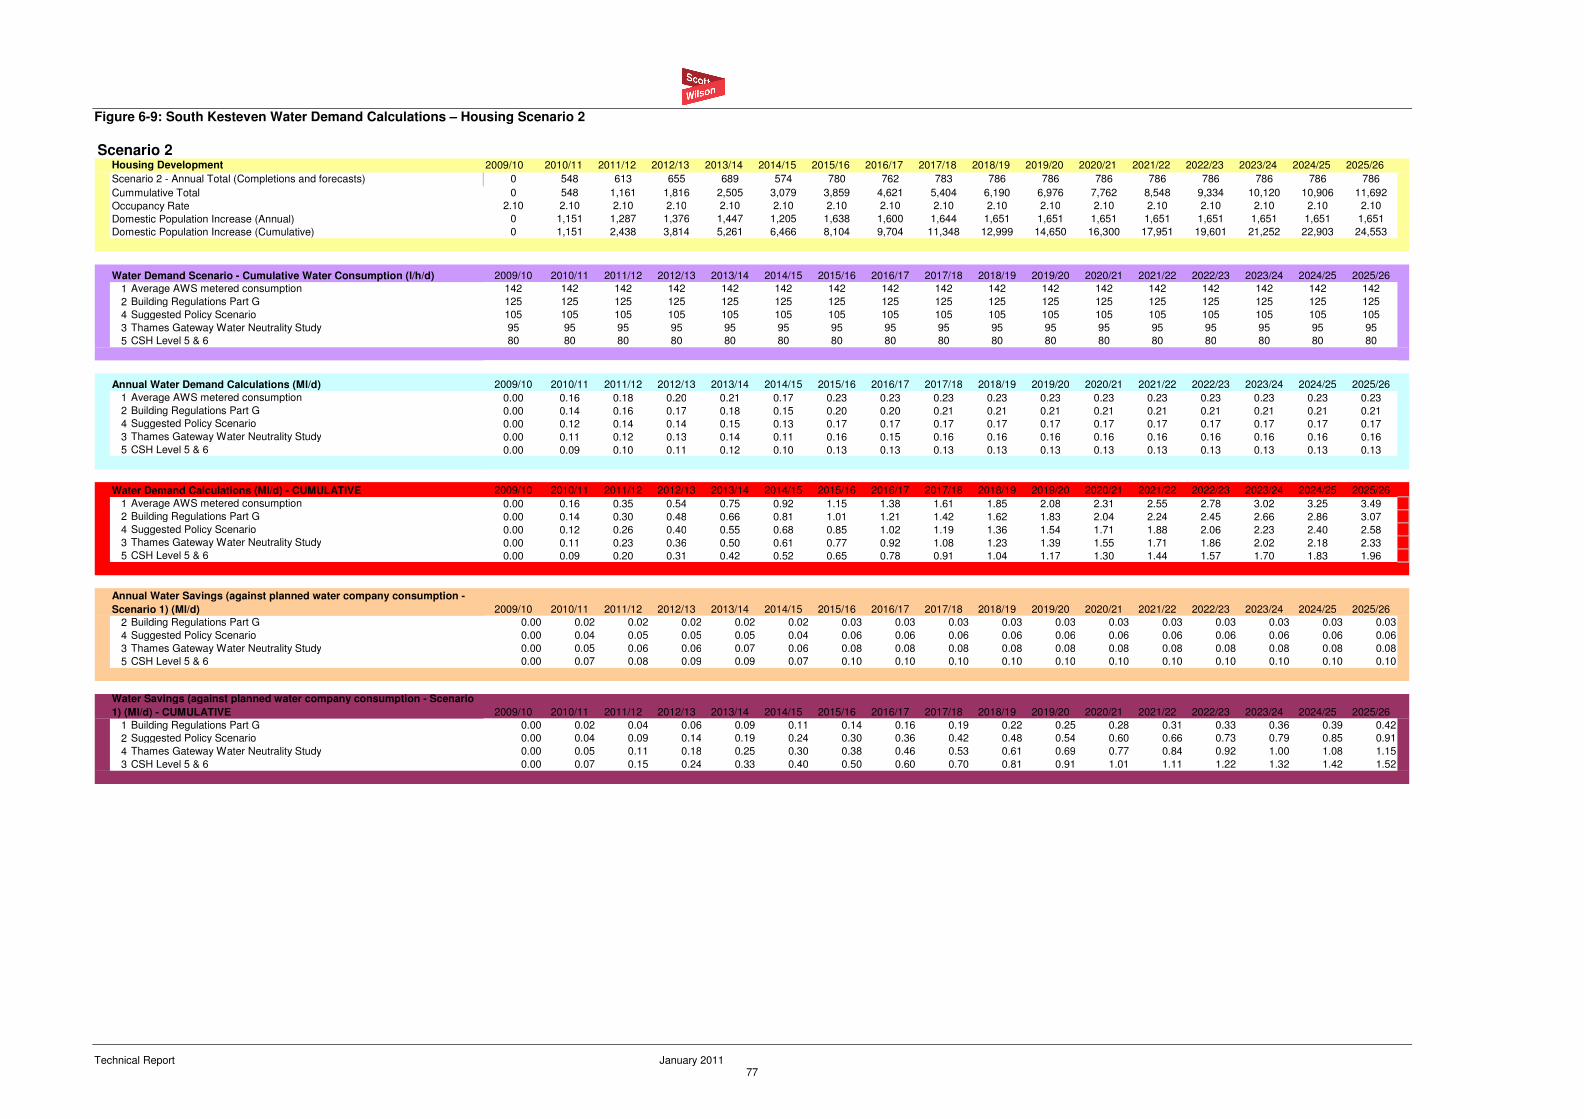
Technical Report January 2011 77
Figure 6-9: South Kesteven Water Demand Calculations – Housing Scenario 2
Scenario 22009/10 2010/11 2011/12 2012/13 2013/14 2014/15 2015/16 2016/17 2017/18 2018/19 2019/20 2020/21 2021/22 2022/23 2023/24 2024/25 2025/26
0 548 613 655 689 574 780 762 783 786 786 786 786 786 786 786 786
0 548 1,161 1,816 2,505 3,079 3,859 4,621 5,404 6,190 6,976 7,762 8,548 9,334 10,120 10,906 11,692
2.10 2.10 2.10 2.10 2.10 2.10 2.10 2.10 2.10 2.10 2.10 2.10 2.10 2.10 2.10 2.10 2.10
Domestic Population Increase (Annual) 0 1,151 1,287 1,376 1,447 1,205 1,638 1,600 1,644 1,651 1,651 1,651 1,651 1,651 1,651 1,651 1,651
Domestic Population Increase (Cumulative) 0 1,151 2,438 3,814 5,261 6,466 8,104 9,704 11,348 12,999 14,650 16,300 17,951 19,601 21,252 22,903 24,553
Water Demand Scenario - Cumulative Water Consumption (l/h/d) 2009/10 2010/11 2011/12 2012/13 2013/14 2014/15 2015/16 2016/17 2017/18 2018/19 2019/20 2020/21 2021/22 2022/23 2023/24 2024/25 2025/26
1 Average AWS metered consumption 142 142 142 142 142 142 142 142 142 142 142 142 142 142 142 142 142
2 Building Regulations Part G 125 125 125 125 125 125 125 125 125 125 125 125 125 125 125 125 125
4 Suggested Policy Scenario 105 105 105 105 105 105 105 105 105 105 105 105 105 105 105 105 105
3 Thames Gateway Water Neutrality Study 95 95 95 95 95 95 95 95 95 95 95 95 95 95 95 95 95
5 CSH Level 5 & 6 80 80 80 80 80 80 80 80 80 80 80 80 80 80 80 80 80
Annual Water Demand Calculations (Ml/d) 2009/10 2010/11 2011/12 2012/13 2013/14 2014/15 2015/16 2016/17 2017/18 2018/19 2019/20 2020/21 2021/22 2022/23 2023/24 2024/25 2025/26
1 Average AWS metered consumption 0.00 0.16 0.18 0.20 0.21 0.17 0.23 0.23 0.23 0.23 0.23 0.23 0.23 0.23 0.23 0.23 0.23
2 Building Regulations Part G 0.00 0.14 0.16 0.17 0.18 0.15 0.20 0.20 0.21 0.21 0.21 0.21 0.21 0.21 0.21 0.21 0.21
4 Suggested Policy Scenario 0.00 0.12 0.14 0.14 0.15 0.13 0.17 0.17 0.17 0.17 0.17 0.17 0.17 0.17 0.17 0.17 0.17
3 Thames Gateway Water Neutrality Study 0.00 0.11 0.12 0.13 0.14 0.11 0.16 0.15 0.16 0.16 0.16 0.16 0.16 0.16 0.16 0.16 0.16
5 CSH Level 5 & 6 0.00 0.09 0.10 0.11 0.12 0.10 0.13 0.13 0.13 0.13 0.13 0.13 0.13 0.13 0.13 0.13 0.13
Water Demand Calculations (Ml/d) - CUMULATIVE 2009/10 2010/11 2011/12 2012/13 2013/14 2014/15 2015/16 2016/17 2017/18 2018/19 2019/20 2020/21 2021/22 2022/23 2023/24 2024/25 2025/26
1 Average AWS metered consumption 0.00 0.16 0.35 0.54 0.75 0.92 1.15 1.38 1.61 1.85 2.08 2.31 2.55 2.78 3.02 3.25 3.49
2 Building Regulations Part G 0.00 0.14 0.30 0.48 0.66 0.81 1.01 1.21 1.42 1.62 1.83 2.04 2.24 2.45 2.66 2.86 3.07
4 Suggested Policy Scenario 0.00 0.12 0.26 0.40 0.55 0.68 0.85 1.02 1.19 1.36 1.54 1.71 1.88 2.06 2.23 2.40 2.58
3 Thames Gateway Water Neutrality Study 0.00 0.11 0.23 0.36 0.50 0.61 0.77 0.92 1.08 1.23 1.39 1.55 1.71 1.86 2.02 2.18 2.33
5 CSH Level 5 & 6 0.00 0.09 0.20 0.31 0.42 0.52 0.65 0.78 0.91 1.04 1.17 1.30 1.44 1.57 1.70 1.83 1.96
2009/10 2010/11 2011/12 2012/13 2013/14 2014/15 2015/16 2016/17 2017/18 2018/19 2019/20 2020/21 2021/22 2022/23 2023/24 2024/25 2025/26
2 Building Regulations Part G 0.00 0.02 0.02 0.02 0.02 0.02 0.03 0.03 0.03 0.03 0.03 0.03 0.03 0.03 0.03 0.03 0.03
4 Suggested Policy Scenario 0.00 0.04 0.05 0.05 0.05 0.04 0.06 0.06 0.06 0.06 0.06 0.06 0.06 0.06 0.06 0.06 0.06
3 Thames Gateway Water Neutrality Study 0.00 0.05 0.06 0.06 0.07 0.06 0.08 0.08 0.08 0.08 0.08 0.08 0.08 0.08 0.08 0.08 0.08
5 CSH Level 5 & 6 0.00 0.07 0.08 0.09 0.09 0.07 0.10 0.10 0.10 0.10 0.10 0.10 0.10 0.10 0.10 0.10 0.10
2009/10 2010/11 2011/12 2012/13 2013/14 2014/15 2015/16 2016/17 2017/18 2018/19 2019/20 2020/21 2021/22 2022/23 2023/24 2024/25 2025/26
1 Building Regulations Part G 0.00 0.02 0.04 0.06 0.09 0.11 0.14 0.16 0.19 0.22 0.25 0.28 0.31 0.33 0.36 0.39 0.42
2 Suggested Policy Scenario 0.00 0.04 0.09 0.14 0.19 0.24 0.30 0.36 0.42 0.48 0.54 0.60 0.66 0.73 0.79 0.85 0.91
4 Thames Gateway Water Neutrality Study 0.00 0.05 0.11 0.18 0.25 0.30 0.38 0.46 0.53 0.61 0.69 0.77 0.84 0.92 1.00 1.08 1.15
3 CSH Level 5 & 6 0.00 0.07 0.15 0.24 0.33 0.40 0.50 0.60 0.70 0.81 0.91 1.01 1.11 1.22 1.32 1.42 1.52
Annual Water Savings (against planned water company consumption -
Scenario 1) (Ml/d)
Water Savings (against planned water company consumption - Scenario
1) (Ml/d) - CUMULATIVE
Housing Development
Scenario 2 - Annual Total (Completions and forecasts)
Cummulative Total
Occupancy Rate

Technical Report January 2011 78
Figure 6-10: South Kesteven Water Demand Calculations – Housing Scenario 3
Scenario 32009/10 2010/11 2011/12 2012/13 2013/14 2014/15 2015/16 2016/17 2017/18 2018/19 2019/20 2020/21 2021/22 2022/23 2023/24 2024/25 2025/26
0 574 642 685 722 599 826 809 833 837 837 837 837 837 837 837 837
0 574 1,216 1,901 2,623 3,222 4,048 4,857 5,690 6,527 7,364 8,201 9,038 9,875 10,712 11,549 12,386
2.10 2.10 2.10 2.10 2.10 2.10 2.10 2.10 2.10 2.10 2.10 2.10 2.10 2.10 2.10 2.10 2.10
Domestic Population Increase (Annual) 0 1,205 1,348 1,439 1,516 1,258 1,735 1,699 1,749 1,758 1,758 1,758 1,758 1,758 1,758 1,758 1,758
Domestic Population Increase (Cumulative) 0 1,205 2,554 3,992 5,508 6,766 8,501 10,200 11,949 13,707 15,464 17,222 18,980 20,738 22,495 24,253 26,011
Water Demand Scenario - Cumulative Water Consumption (l/h/d) 2009/10 2010/11 2011/12 2012/13 2013/14 2014/15 2015/16 2016/17 2017/18 2018/19 2019/20 2020/21 2021/22 2022/23 2023/24 2024/25 2025/26
1 Average AWS metered consumption 142 142 142 142 142 142 142 142 142 142 142 142 142 142 142 142 142
2 Building Regulations Part G 125 125 125 125 125 125 125 125 125 125 125 125 125 125 125 125 125
4 Suggested Policy Scenario 105 105 105 105 105 105 105 105 105 105 105 105 105 105 105 105 105
3 Thames Gateway Water Neutrality Study 95 95 95 95 95 95 95 95 95 95 95 95 95 95 95 95 95
5 CSH Level 5 & 6 80 80 80 80 80 80 80 80 80 80 80 80 80 80 80 80 80
Annual Water Demand Calculations (Ml/d) 2009/10 2010/11 2011/12 2012/13 2013/14 2014/15 2015/16 2016/17 2017/18 2018/19 2019/20 2020/21 2021/22 2022/23 2023/24 2024/25 2025/26
1 Average AWS metered consumption 0.00 0.17 0.19 0.20 0.22 0.18 0.25 0.24 0.25 0.25 0.25 0.25 0.25 0.25 0.25 0.25 0.25
2 Building Regulations Part G 0.00 0.15 0.17 0.18 0.19 0.16 0.22 0.21 0.22 0.22 0.22 0.22 0.22 0.22 0.22 0.22 0.22
4 Suggested Policy Scenario 0.00 0.13 0.14 0.15 0.16 0.13 0.18 0.18 0.18 0.18 0.18 0.18 0.18 0.18 0.18 0.18 0.18
3 Thames Gateway Water Neutrality Study 0.00 0.11 0.13 0.14 0.14 0.12 0.16 0.16 0.17 0.17 0.17 0.17 0.17 0.17 0.17 0.17 0.17
5 CSH Level 5 & 6 0.00 0.10 0.11 0.12 0.12 0.10 0.14 0.14 0.14 0.14 0.14 0.14 0.14 0.14 0.14 0.14 0.14
Water Demand Calculations (Ml/d) - CUMULATIVE 2009/10 2010/11 2011/12 2012/13 2013/14 2014/15 2015/16 2016/17 2017/18 2018/19 2019/20 2020/21 2021/22 2022/23 2023/24 2024/25 2025/26
1 Average AWS metered consumption 0.00 0.17 0.36 0.57 0.78 0.96 1.21 1.45 1.70 1.95 2.20 2.45 2.70 2.94 3.19 3.44 3.69
2 Building Regulations Part G 0.00 0.15 0.32 0.50 0.69 0.85 1.06 1.27 1.49 1.71 1.93 2.15 2.37 2.59 2.81 3.03 3.25
4 Suggested Policy Scenario 0.00 0.13 0.27 0.42 0.58 0.71 0.89 1.07 1.25 1.44 1.62 1.81 1.99 2.18 2.36 2.55 2.73
3 Thames Gateway Water Neutrality Study 0.00 0.11 0.24 0.38 0.52 0.64 0.81 0.97 1.14 1.30 1.47 1.64 1.80 1.97 2.14 2.30 2.47
5 CSH Level 5 & 6 0.00 0.10 0.20 0.32 0.44 0.54 0.68 0.82 0.96 1.10 1.24 1.38 1.52 1.66 1.80 1.94 2.08
2009/10 2010/11 2011/12 2012/13 2013/14 2014/15 2015/16 2016/17 2017/18 2018/19 2019/20 2020/21 2021/22 2022/23 2023/24 2024/25 2025/26
2 Building Regulations Part G 0.00 0.02 0.02 0.02 0.03 0.02 0.03 0.03 0.03 0.03 0.03 0.03 0.03 0.03 0.03 0.03 0.03
4 Suggested Policy Scenario 0.00 0.04 0.05 0.05 0.06 0.05 0.06 0.06 0.06 0.07 0.07 0.07 0.07 0.07 0.07 0.07 0.07
3 Thames Gateway Water Neutrality Study 0.00 0.06 0.06 0.07 0.07 0.06 0.08 0.08 0.08 0.08 0.08 0.08 0.08 0.08 0.08 0.08 0.08
5 CSH Level 5 & 6 0.00 0.07 0.08 0.09 0.09 0.08 0.11 0.11 0.11 0.11 0.11 0.11 0.11 0.11 0.11 0.11 0.11
2009/10 2010/11 2011/12 2012/13 2013/14 2014/15 2015/16 2016/17 2017/18 2018/19 2019/20 2020/21 2021/22 2022/23 2023/24 2024/25 2025/26
1 Building Regulations Part G 0.00 0.02 0.04 0.07 0.09 0.12 0.14 0.17 0.20 0.23 0.26 0.29 0.32 0.35 0.38 0.41 0.44
2 Suggested Policy Scenario 0.00 0.04 0.09 0.15 0.20 0.25 0.31 0.38 0.44 0.51 0.57 0.64 0.70 0.77 0.83 0.90 0.96
4 Thames Gateway Water Neutrality Study 0.00 0.06 0.12 0.19 0.26 0.32 0.40 0.48 0.56 0.64 0.73 0.81 0.89 0.97 1.06 1.14 1.22
3 CSH Level 5 & 6 0.00 0.07 0.16 0.25 0.34 0.42 0.53 0.63 0.74 0.85 0.96 1.07 1.18 1.29 1.39 1.50 1.61
Water Savings (against planned water company consumption -
Scenario 1) (Ml/d) - CUMULATIVE
Annual Water Savings (against planned water company consumption -
Scenario 1) (Ml/d)
Housing Development
Scenario 3 - Annual Total (Completions and forecasts)
Cummulative Total
Occupancy Rate
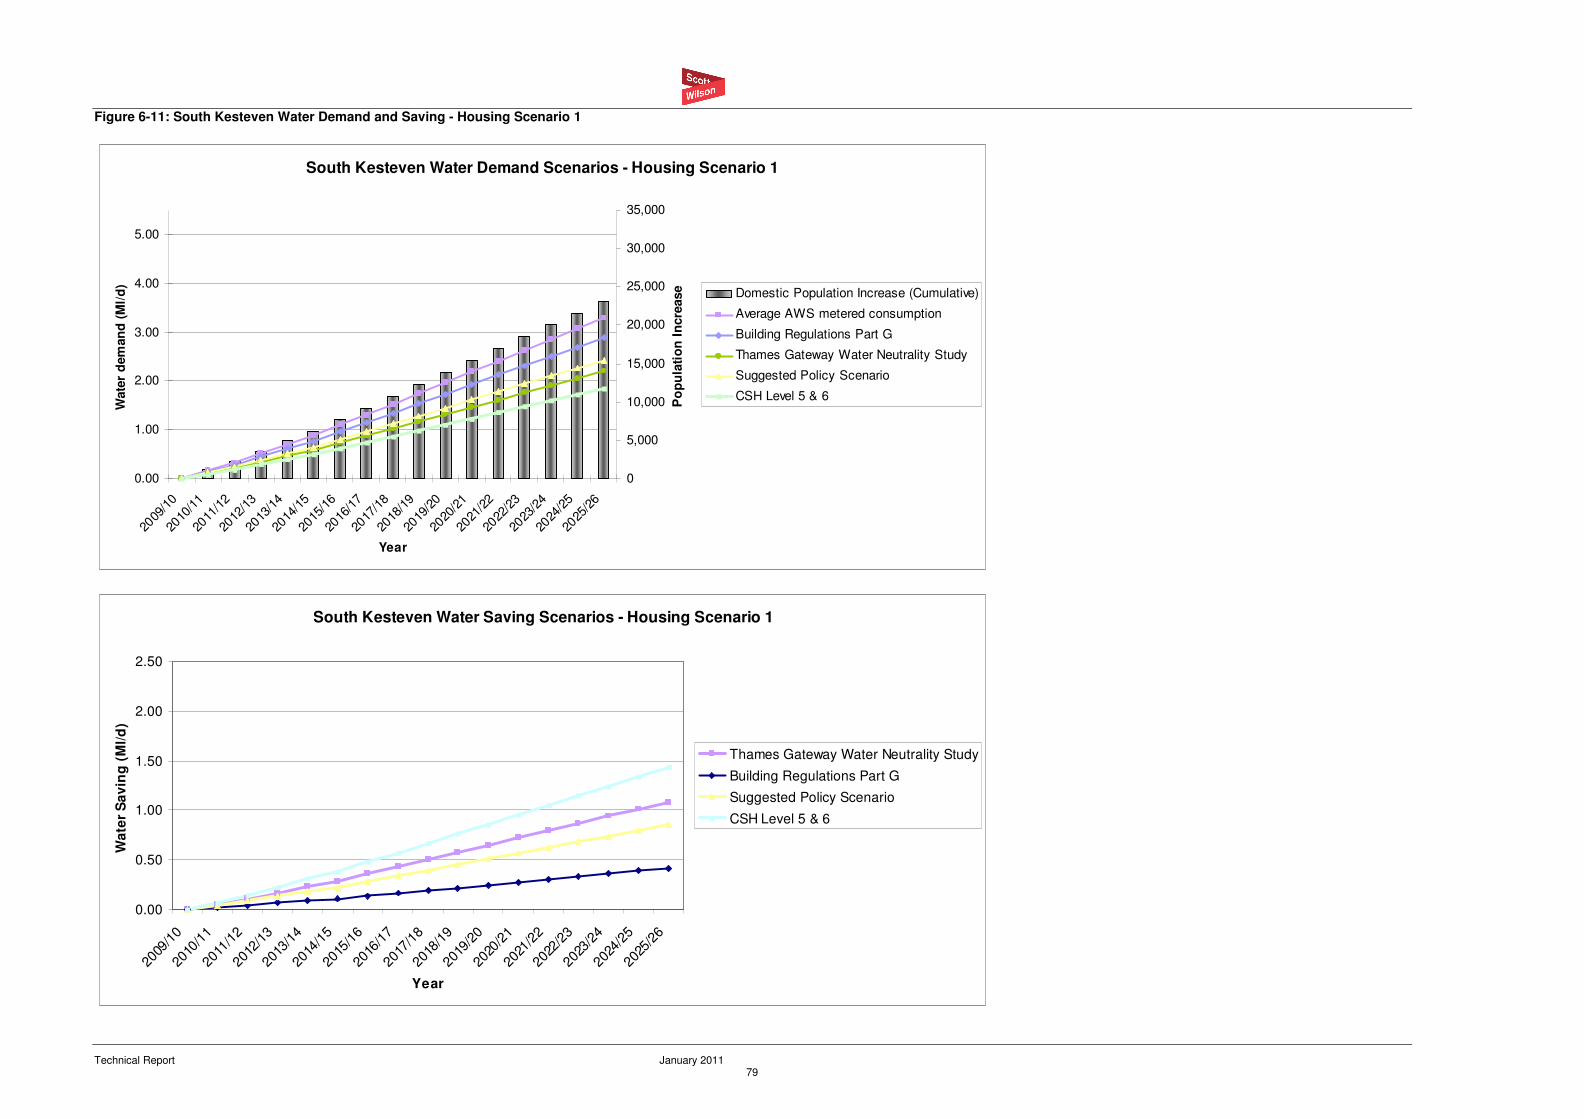
Technical Report January 2011 79
Figure 6-11: South Kesteven Water Demand and Saving - Housing Scenario 1
South Kesteven Water Demand Scenarios - Housing Scenario 1
0.00
1.00
2.00
3.00
4.00
5.00
2009
/10
2010
/11
2011
/12
2012
/13
2013
/14
2014
/15
2015
/16
2016
/17
2017
/18
2018
/19
2019
/20
2020
/21
2021
/22
2022
/23
2023
/24
2024
/25
2025
/26
Year
Wate
r d
em
an
d (
Ml/
d)
0
5,000
10,000
15,000
20,000
25,000
30,000
35,000
Po
pu
lati
on
In
cre
ase Domestic Population Increase (Cumulative)
Average AWS metered consumption
Building Regulations Part G
Thames Gateway Water Neutrality Study
Suggested Policy Scenario
CSH Level 5 & 6
South Kesteven Water Saving Scenarios - Housing Scenario 1
0.00
0.50
1.00
1.50
2.00
2.50
2009
/10
2010
/11
2011
/12
2012
/13
2013
/14
2014
/15
2015
/16
2016
/17
2017
/18
2018
/19
2019
/20
2020
/21
2021
/22
2022
/23
2023
/24
2024
/25
2025
/26
Year
Wa
ter
Sa
vin
g (
Ml/
d)
Thames Gateway Water Neutrality Study
Building Regulations Part G
Suggested Policy Scenario
CSH Level 5 & 6
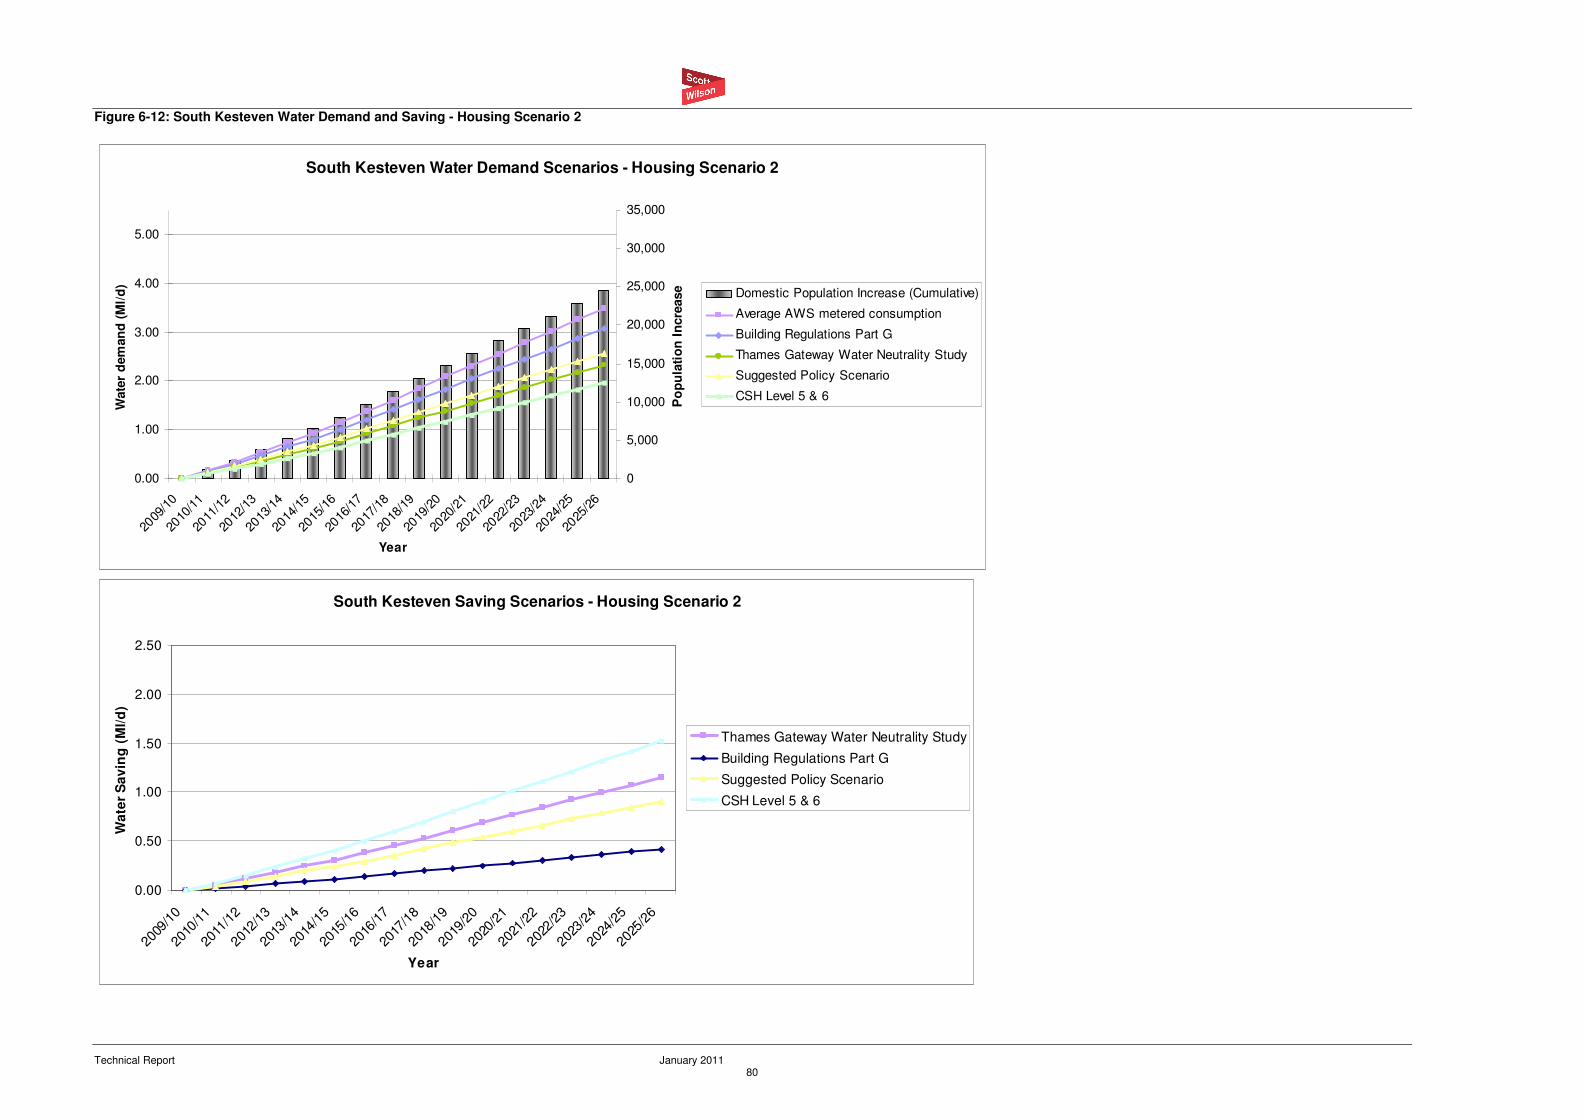
Technical Report January 2011 80
Figure 6-12: South Kesteven Water Demand and Saving - Housing Scenario 2
South Kesteven Water Demand Scenarios - Housing Scenario 2
0.00
1.00
2.00
3.00
4.00
5.00
2009
/10
2010
/11
2011
/12
2012
/13
2013
/14
2014
/15
2015
/16
2016
/17
2017
/18
2018
/19
2019
/20
2020
/21
2021
/22
2022
/23
2023
/24
2024
/25
2025
/26
Year
Wate
r d
em
an
d (
Ml/
d)
0
5,000
10,000
15,000
20,000
25,000
30,000
35,000
Po
pu
lati
on
In
cre
ase Domestic Population Increase (Cumulative)
Average AWS metered consumption
Building Regulations Part G
Thames Gateway Water Neutrality Study
Suggested Policy Scenario
CSH Level 5 & 6
South Kesteven Saving Scenarios - Housing Scenario 2
0.00
0.50
1.00
1.50
2.00
2.50
2009
/10
2010
/11
2011
/12
2012
/13
2013
/14
2014
/15
2015
/16
2016
/17
2017
/18
2018
/19
2019
/20
2020
/21
2021
/22
2022
/23
2023
/24
2024
/25
2025
/26
Year
Wa
ter
Sa
vin
g (
Ml/
d)
Thames Gateway Water Neutrality Study
Building Regulations Part G
Suggested Policy Scenario
CSH Level 5 & 6
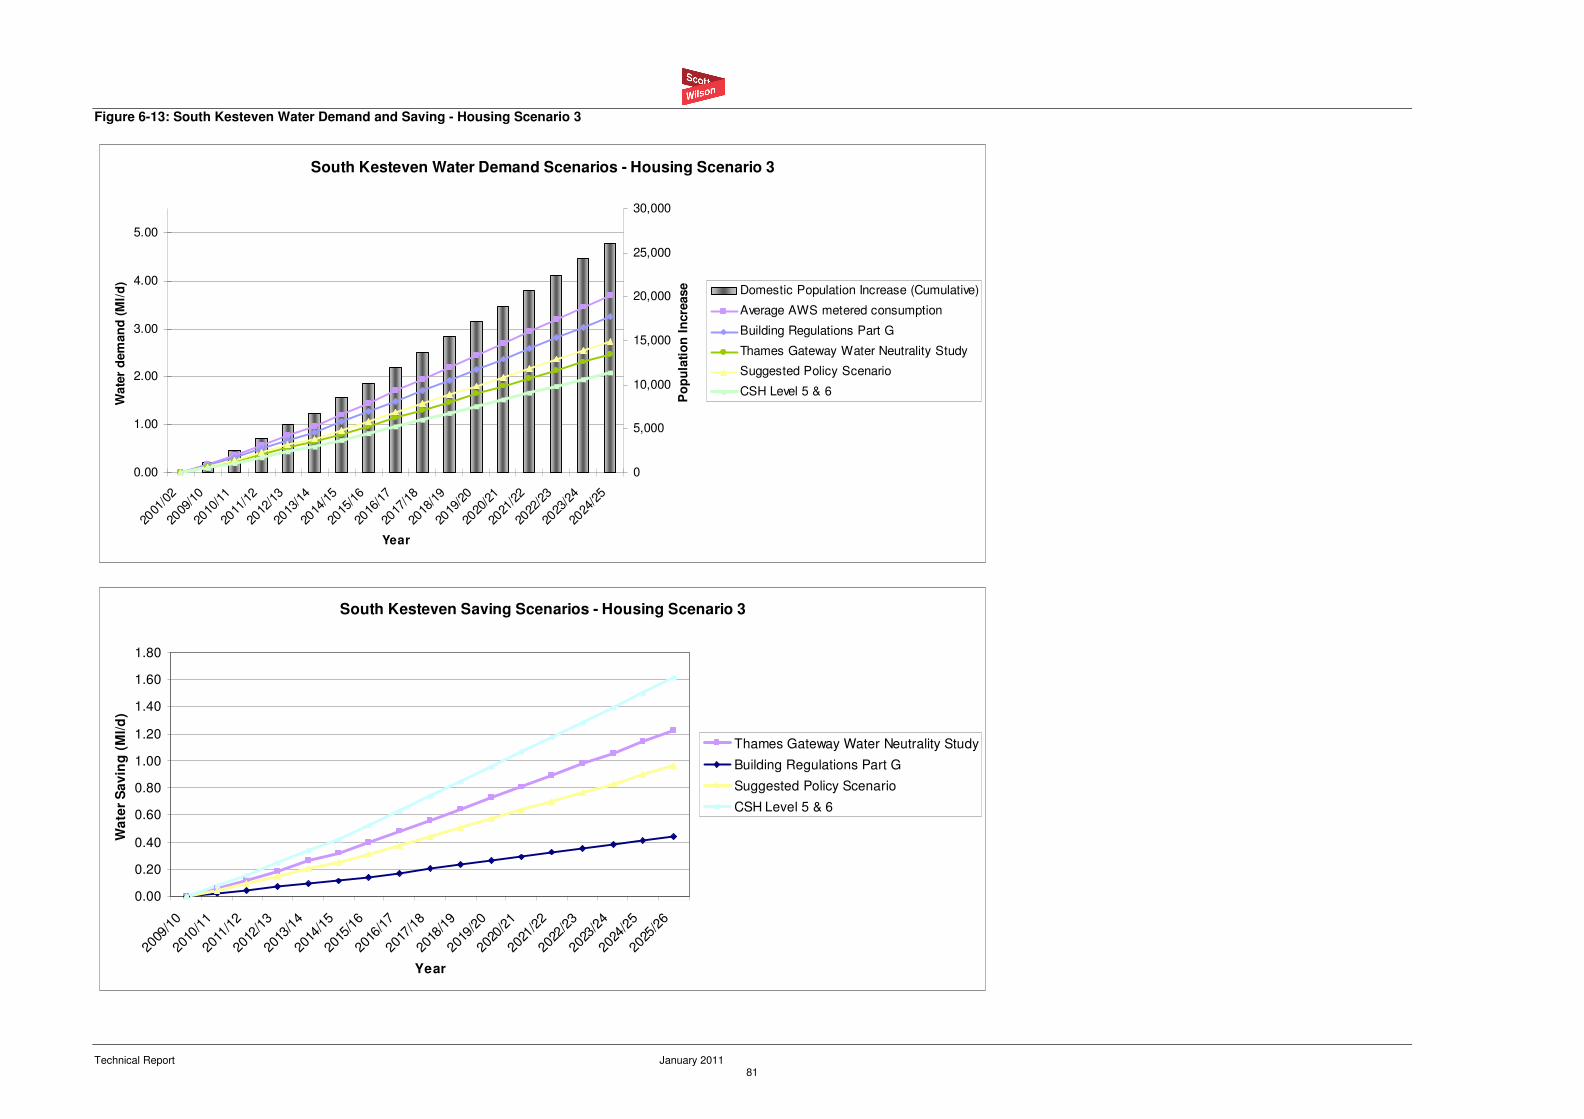
Technical Report January 2011 81
Figure 6-13: South Kesteven Water Demand and Saving - Housing Scenario 3
South Kesteven Water Demand Scenarios - Housing Scenario 3
0.00
1.00
2.00
3.00
4.00
5.00
2001
/02
2009
/10
2010
/11
2011
/12
2012
/13
2013
/14
2014
/15
2015
/16
2016
/17
2017
/18
2018
/19
2019
/20
2020
/21
2021
/22
2022
/23
2023
/24
2024
/25
Year
Wate
r d
em
an
d (
Ml/
d)
0
5,000
10,000
15,000
20,000
25,000
30,000
Po
pu
lati
on
In
cre
ase Domestic Population Increase (Cumulative)
Average AWS metered consumption
Building Regulations Part G
Thames Gateway Water Neutrality Study
Suggested Policy Scenario
CSH Level 5 & 6
South Kesteven Saving Scenarios - Housing Scenario 3
0.00
0.20
0.40
0.60
0.80
1.00
1.20
1.40
1.60
1.80
2009
/10
2010
/11
2011
/12
2012
/13
2013
/14
2014
/15
2015
/16
2016
/17
2017
/18
2018
/19
2019
/20
2020
/21
2021
/22
2022
/23
2023
/24
2024
/25
2025
/26
Year
Wa
ter
Sa
vin
g (
Ml/
d)
Thames Gateway Water Neutrality Study
Building Regulations Part G
Suggested Policy Scenario
CSH Level 5 & 6
Technical Report January 2011 82
6.3.3 Rutland water demand strategies
The calculations, shown below in Figures 6-14 to 6-19, indicate that the ‘business as usual’
projection (Projection 1) of metered water consumption would require between 0.77 and 1.13
Ml/d by 2026. This compares with Projection 3, which would require between 0.57 and 0.84
Ml/d by 2026. These figures, and the water requirements and saving of the other water
consumption strategies are displayed graphically below.
Figures 6-14 to 6-19 below display the anticipated water saving from each water consumption
projection, as compared to the ‘business as usual’ projection (Projection 1) of metered water
consumption. Demand can be reduced by between 0.09 and 0.49 Ml/d in 2026 by adopting
more stringent water consumption approaches (Projections 2-5). The suggested policy
projection gives a saving of between 0.20 and 0.29 Ml/d in 2026.

Technical Report January 2011 83
Figure 6-14: Rutland Water Demand Calculations – Housing Scenario 1
Scenario 12009/10 2010/11 2011/12 2012/13 2013/14 20014/15 20015/16 2016/17 2017/18 2018/19 2019/20 2020/21 2021/22 2022/23 2023/24 2024/25 2025/26
0 94 66 181 267 252 223 160 160 155 148 148 148 148 147 147 147
0 94 160 341 608 860 1,083 1,243 1,403 1,558 1,706 1,854 2,002 2,150 2,297 2,444 2,591
2.10 2.10 2.10 2.10 2.10 2.10 2.10 2.10 2.10 2.10 2.10 2.10 2.10 2.10 2.10 2.10 2.10
Domestic Population Increase (Annual) 0 197 139 380 561 529 468 336 336 326 311 311 311 311 309 309 309
Domestic Population Increase (Cumulative) 0 197 336 716 1,277 1,806 2,274 2,610 2,946 3,272 3,583 3,893 4,204 4,515 4,824 5,132 5,441
Water Demand Scenario - Cumulative Water Consumption (l/h/d) 2009/10 2010/11 2011/12 2012/13 2013/14 134.27 125.94 2016/17 2017/18 2018/19 2019/20 2020/21 2021/22 2022/23 2023/24 2024/25 2025/26
1 Average AWS metered consumption 142 142 142 142 142 142 142 142 142 142 142 142 142 142 142 142 142
2 Building Regulations Part G 125 125 125 125 125 125 125 125 125 125 125 125 125 125 125 125 125
4 Suggested Policy Scenario 105 105 105 105 105 105 105 105 105 105 105 105 105 105 105 105 105
3 Thames Gateway Water Neutrality Study 95 95 95 95 95 95 95 95 95 95 95 95 95 95 95 95 95
5 CSH Level 5 & 6 80 80 80 80 80 80 80 80 80 80 80 80 80 80 80 80 80
Annual Water Demand Calculations (Ml/d) 2009/10 2010/11 2011/12 2012/13 2013/14 2014/15 2015/16 2016/17 2017/18 2018/19 2019/20 2020/21 2021/22 2022/23 2023/24 2024/25 2025/26
1 Average AWS metered consumption 0.00 0.03 0.02 0.05 0.08 0.08 0.07 0.05 0.05 0.05 0.04 0.04 0.04 0.04 0.04 0.04 0.042 Building Regulations Part G 0.00 0.02 0.02 0.05 0.07 0.07 0.06 0.04 0.04 0.04 0.04 0.04 0.04 0.04 0.04 0.04 0.044 Suggested Policy Scenario 0.00 0.02 0.01 0.04 0.06 0.06 0.05 0.04 0.04 0.03 0.03 0.03 0.03 0.03 0.03 0.03 0.033 Thames Gateway Water Neutrality Study 0.00 0.02 0.01 0.04 0.05 0.05 0.04 0.03 0.03 0.03 0.03 0.03 0.03 0.03 0.03 0.03 0.03
5 CSH Level 5 & 6 0.00 0.02 0.01 0.03 0.04 0.04 0.04 0.03 0.03 0.03 0.02 0.02 0.02 0.02 0.02 0.02 0.02
Water Demand Calculations (Ml/d) - CUMULATIVE 2009/10 2010/11 2011/12 2012/13 2013/14 2014/15 2015/16 2016/17 2017/18 2018/19 2019/20 2020/21 2021/22 2022/23 2023/24 2024/25 2025/26
1 Average AWS metered consumption 0.00 0.03 0.05 0.10 0.18 0.26 0.32 0.37 0.42 0.46 0.51 0.55 0.60 0.64 0.68 0.73 0.772 Building Regulations Part G 0.00 0.02 0.04 0.09 0.16 0.23 0.28 0.33 0.37 0.41 0.45 0.49 0.53 0.56 0.60 0.64 0.684 Suggested Policy Scenario 0.00 0.02 0.04 0.08 0.13 0.19 0.24 0.27 0.31 0.34 0.38 0.41 0.44 0.47 0.51 0.54 0.57
3 Thames Gateway Water Neutrality Study 0.00 0.02 0.03 0.07 0.12 0.17 0.22 0.25 0.28 0.31 0.34 0.37 0.40 0.43 0.46 0.49 0.525 CSH Level 5 & 6 0.00 0.02 0.03 0.06 0.10 0.14 0.18 0.21 0.24 0.26 0.29 0.31 0.34 0.36 0.39 0.41 0.44
2009/10 2010/11 2011/12 2012/13 2013/14 2014/15 2015/16 2016/17 2017/18 2018/19 2019/20 2020/21 2021/22 2022/23 2023/24 2024/25 2025/26
2 Building Regulations Part G 0.00 0.00 0.00 0.01 0.01 0.01 0.01 0.01 0.01 0.01 0.01 0.01 0.01 0.01 0.01 0.01 0.01
4 Suggested Policy Scenario 0.00 0.01 0.01 0.01 0.02 0.02 0.02 0.01 0.01 0.01 0.01 0.01 0.01 0.01 0.01 0.01 0.01
3 Thames Gateway Water Neutrality Study 0.00 0.01 0.01 0.02 0.03 0.02 0.02 0.02 0.02 0.02 0.01 0.01 0.01 0.01 0.01 0.01 0.01
5 CSH Level 5 & 6 0.00 0.01 0.01 0.02 0.03 0.03 0.03 0.02 0.02 0.02 0.02 0.02 0.02 0.02 0.02 0.02 0.02
2009/10 2010/11 2011/12 2012/13 2013/14 2014/15 2015/16 2016/17 2017/18 2018/19 2019/20 2020/21 2021/22 2022/23 2023/24 2024/25 2025/26
1 Building Regulations Part G 0.00 0.00 0.01 0.01 0.02 0.03 0.04 0.04 0.05 0.06 0.06 0.07 0.07 0.08 0.08 0.09 0.09
2 Suggested Policy Scenario 0.00 0.01 0.01 0.03 0.05 0.07 0.08 0.10 0.11 0.12 0.13 0.14 0.16 0.17 0.18 0.19 0.20
4 Thames Gateway Water Neutrality Study 0.00 0.01 0.02 0.03 0.06 0.08 0.11 0.12 0.14 0.15 0.17 0.18 0.20 0.21 0.23 0.24 0.26
3 CSH Level 5 & 6 0.00 0.01 0.02 0.04 0.08 0.11 0.14 0.16 0.18 0.20 0.22 0.24 0.26 0.28 0.30 0.32 0.34
Annual Water Savings (against planned water company consumption -
Scenario 1) (Ml/d)
Water Savings (against planned water company consumption - Scenario
1) (Ml/d) - CUMULATIVE
Housing Development
Scenario 1 - Annual Total (Completions and forecasts)
Cummulative Total
Occupancy Rate

Technical Report January 2011 84
Figure 6-15: Rutland Water Demand Calculations – Housing Scenario 2
Scenario 22009/10 2010/11 2011/12 2012/13 2013/14 2014/15 2015/16 2016/17 2017/18 2018/19 2019/20 2020/21 2021/22 2022/23 2023/24 2024/25 2025/26
0 98 70 193 295 279 247 172 172 167 160 160 160 160 160 160 159
0 98 168 361 656 935 1,182 1,354 1,526 1,693 1,853 2,013 2,173 2,333 2,493 2,653 2,812
2.10 2.10 2.10 2.10 2.10 2.10 2.10 2.10 2.10 2.10 2.10 2.10 2.10 2.10 2.10 2.10 2.10
Domestic Population Increase (Annual) 0 206 147 405 620 586 519 361 361 351 336 336 336 336 336 336 334
Domestic Population Increase (Cumulative) 0 206 353 758 1,378 1,964 2,482 2,843 3,205 3,555 3,891 4,227 4,563 4,899 5,235 5,571 5,905
Water Demand Scenario - Cumulative Water Consumption (l/h/d) 2009/10 2010/11 2011/12 2012/13 2013/14 2014/15 2015/16 2016/17 2017/18 2018/19 2019/20 2020/21 2021/22 2022/23 2023/24 2024/25 2025/26
1 Average AWS metered consumption 142 142 142 142 142 142 142 142 142 142 142 142 142 142 142 142 142
2 Building Regulations Part G 125 125 125 125 125 125 125 125 125 125 125 125 125 125 125 125 125
4 Suggested Policy Scenario 105 105 105 105 105 105 105 105 105 105 105 105 105 105 105 105 105
3 Thames Gateway Water Neutrality Study 95 95 95 95 95 95 95 95 95 95 95 95 95 95 95 95 95
5 CSH Level 5 & 6 80 80 80 80 80 80 80 80 80 80 80 80 80 80 80 80 80
Annual Water Demand Calculations (Ml/d) 2009/10 2010/11 2011/12 2012/13 2013/14 2014/15 2015/16 2016/17 2017/18 2018/19 2019/20 2020/21 2021/22 2022/23 2023/24 2024/25 2025/26
1 Average AWS metered consumption 0.00 0.03 0.02 0.06 0.09 0.08 0.07 0.05 0.05 0.05 0.05 0.05 0.05 0.05 0.05 0.05 0.05
2 Building Regulations Part G 0.00 0.03 0.02 0.05 0.08 0.07 0.06 0.05 0.05 0.04 0.04 0.04 0.04 0.04 0.04 0.04 0.04
4 Suggested Policy Scenario 0.00 0.02 0.02 0.04 0.07 0.06 0.05 0.04 0.04 0.04 0.04 0.04 0.04 0.04 0.04 0.04 0.04
3 Thames Gateway Water Neutrality Study 0.00 0.02 0.01 0.04 0.06 0.06 0.05 0.03 0.03 0.03 0.03 0.03 0.03 0.03 0.03 0.03 0.03
5 CSH Level 5 & 6 0.00 0.02 0.01 0.03 0.05 0.05 0.04 0.03 0.03 0.03 0.03 0.03 0.03 0.03 0.03 0.03 0.03
Water Demand Calculations (Ml/d) - CUMULATIVE 2009/10 2010/11 2011/12 2012/13 2013/14 2014/15 2015/16 2016/17 2017/18 2018/19 2019/20 2020/21 2021/22 2022/23 2023/24 2024/25 2025/26
1 Average AWS metered consumption 0.00 0.03 0.05 0.11 0.20 0.28 0.35 0.40 0.46 0.50 0.55 0.60 0.65 0.70 0.74 0.79 0.84
2 Building Regulations Part G 0.00 0.03 0.04 0.09 0.17 0.25 0.31 0.36 0.40 0.44 0.49 0.53 0.57 0.61 0.65 0.70 0.74
4 Suggested Policy Scenario 0.00 0.02 0.04 0.08 0.14 0.21 0.26 0.30 0.34 0.37 0.41 0.44 0.48 0.51 0.55 0.58 0.62
3 Thames Gateway Water Neutrality Study 0.00 0.02 0.03 0.07 0.13 0.19 0.24 0.27 0.30 0.34 0.37 0.40 0.43 0.47 0.50 0.53 0.56
5 CSH Level 5 & 6 0.00 0.02 0.03 0.06 0.11 0.16 0.20 0.23 0.26 0.28 0.31 0.34 0.37 0.39 0.42 0.45 0.47
2009/10 2010/11 2011/12 2012/13 2013/14 2014/15 2015/16 2016/17 2017/18 2018/19 2019/20 2020/21 2021/22 2022/23 2023/24 2024/25 2025/26
2 Building Regulations Part G 0.00 0.00 0.00 0.01 0.01 0.01 0.01 0.01 0.01 0.01 0.01 0.01 0.01 0.01 0.01 0.01 0.01
4 Suggested Policy Scenario 0.00 0.01 0.01 0.01 0.02 0.02 0.02 0.01 0.01 0.01 0.01 0.01 0.01 0.01 0.01 0.01 0.01
3 Thames Gateway Water Neutrality Study 0.00 0.01 0.01 0.02 0.03 0.03 0.02 0.02 0.02 0.02 0.02 0.02 0.02 0.02 0.02 0.02 0.02
5 CSH Level 5 & 6 0.00 0.01 0.01 0.03 0.04 0.04 0.03 0.02 0.02 0.02 0.02 0.02 0.02 0.02 0.02 0.02 0.02
2009/10 2010/11 2011/12 2012/13 2013/14 2014/15 2015/16 2016/17 2017/18 2018/19 2019/20 2020/21 2021/22 2022/23 2023/24 2024/25 2025/26
1 Building Regulations Part G 0.00 0.00 0.01 0.01 0.02 0.03 0.04 0.05 0.05 0.06 0.07 0.07 0.08 0.08 0.09 0.09 0.10
2 Suggested Policy Scenario 0.00 0.01 0.01 0.03 0.05 0.07 0.09 0.11 0.12 0.13 0.14 0.16 0.17 0.18 0.19 0.21 0.22
4 Thames Gateway Water Neutrality Study 0.00 0.01 0.02 0.04 0.06 0.09 0.12 0.13 0.15 0.17 0.18 0.20 0.21 0.23 0.25 0.26 0.28
3 CSH Level 5 & 6 0.00 0.01 0.02 0.05 0.09 0.12 0.15 0.18 0.20 0.22 0.24 0.26 0.28 0.30 0.32 0.35 0.37
Annual Water Savings (against planned water company consumption -
Scenario 1) (Ml/d)
Water Savings (against planned water company consumption - Scenario
1) (Ml/d) - CUMULATIVE
Housing Development
Scenario 2 - Annual Total (Completions and forecasts)
Cummulative Total
Occupancy Rate
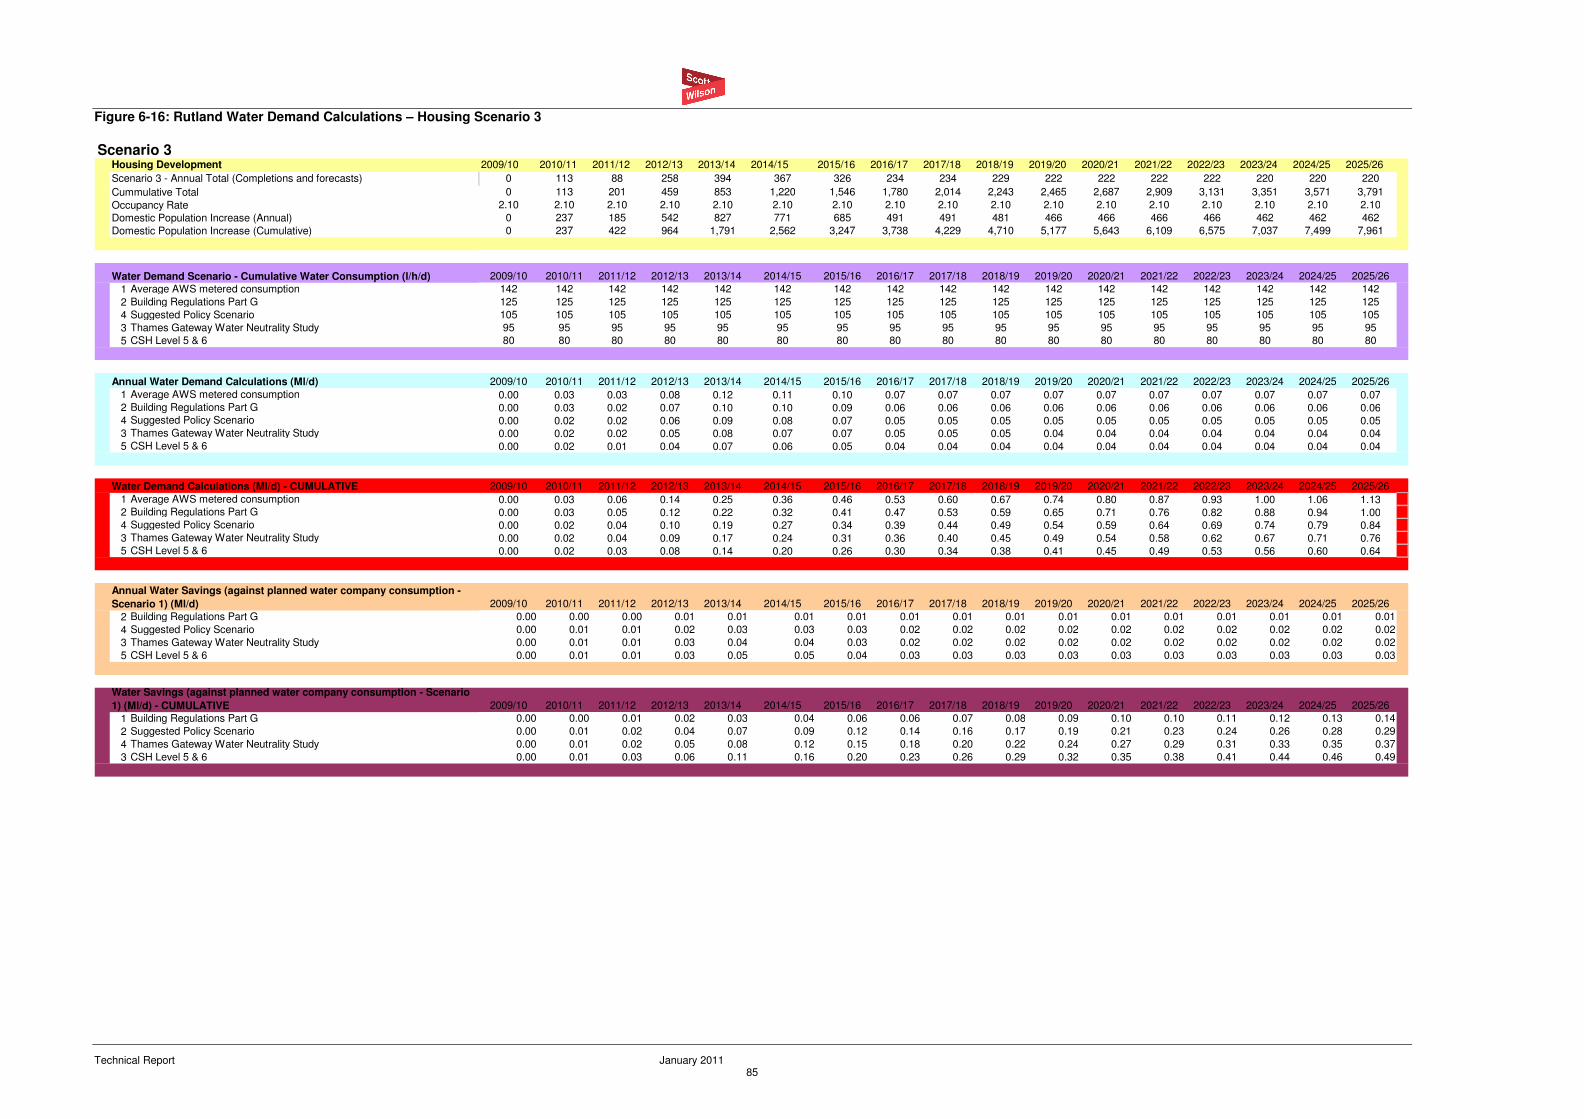
Technical Report January 2011 85
Figure 6-16: Rutland Water Demand Calculations – Housing Scenario 3
Scenario 32009/10 2010/11 2011/12 2012/13 2013/14 2014/15 2015/16 2016/17 2017/18 2018/19 2019/20 2020/21 2021/22 2022/23 2023/24 2024/25 2025/26
0 113 88 258 394 367 326 234 234 229 222 222 222 222 220 220 220
0 113 201 459 853 1,220 1,546 1,780 2,014 2,243 2,465 2,687 2,909 3,131 3,351 3,571 3,791
2.10 2.10 2.10 2.10 2.10 2.10 2.10 2.10 2.10 2.10 2.10 2.10 2.10 2.10 2.10 2.10 2.10
Domestic Population Increase (Annual) 0 237 185 542 827 771 685 491 491 481 466 466 466 466 462 462 462
Domestic Population Increase (Cumulative) 0 237 422 964 1,791 2,562 3,247 3,738 4,229 4,710 5,177 5,643 6,109 6,575 7,037 7,499 7,961
Water Demand Scenario - Cumulative Water Consumption (l/h/d) 2009/10 2010/11 2011/12 2012/13 2013/14 2014/15 2015/16 2016/17 2017/18 2018/19 2019/20 2020/21 2021/22 2022/23 2023/24 2024/25 2025/26
1 Average AWS metered consumption 142 142 142 142 142 142 142 142 142 142 142 142 142 142 142 142 142
2 Building Regulations Part G 125 125 125 125 125 125 125 125 125 125 125 125 125 125 125 125 125
4 Suggested Policy Scenario 105 105 105 105 105 105 105 105 105 105 105 105 105 105 105 105 105
3 Thames Gateway Water Neutrality Study 95 95 95 95 95 95 95 95 95 95 95 95 95 95 95 95 95
5 CSH Level 5 & 6 80 80 80 80 80 80 80 80 80 80 80 80 80 80 80 80 80
Annual Water Demand Calculations (Ml/d) 2009/10 2010/11 2011/12 2012/13 2013/14 2014/15 2015/16 2016/17 2017/18 2018/19 2019/20 2020/21 2021/22 2022/23 2023/24 2024/25 2025/26
1 Average AWS metered consumption 0.00 0.03 0.03 0.08 0.12 0.11 0.10 0.07 0.07 0.07 0.07 0.07 0.07 0.07 0.07 0.07 0.072 Building Regulations Part G 0.00 0.03 0.02 0.07 0.10 0.10 0.09 0.06 0.06 0.06 0.06 0.06 0.06 0.06 0.06 0.06 0.064 Suggested Policy Scenario 0.00 0.02 0.02 0.06 0.09 0.08 0.07 0.05 0.05 0.05 0.05 0.05 0.05 0.05 0.05 0.05 0.053 Thames Gateway Water Neutrality Study 0.00 0.02 0.02 0.05 0.08 0.07 0.07 0.05 0.05 0.05 0.04 0.04 0.04 0.04 0.04 0.04 0.04
5 CSH Level 5 & 6 0.00 0.02 0.01 0.04 0.07 0.06 0.05 0.04 0.04 0.04 0.04 0.04 0.04 0.04 0.04 0.04 0.04
Water Demand Calculations (Ml/d) - CUMULATIVE 2009/10 2010/11 2011/12 2012/13 2013/14 2014/15 2015/16 2016/17 2017/18 2018/19 2019/20 2020/21 2021/22 2022/23 2023/24 2024/25 2025/26
1 Average AWS metered consumption 0.00 0.03 0.06 0.14 0.25 0.36 0.46 0.53 0.60 0.67 0.74 0.80 0.87 0.93 1.00 1.06 1.132 Building Regulations Part G 0.00 0.03 0.05 0.12 0.22 0.32 0.41 0.47 0.53 0.59 0.65 0.71 0.76 0.82 0.88 0.94 1.004 Suggested Policy Scenario 0.00 0.02 0.04 0.10 0.19 0.27 0.34 0.39 0.44 0.49 0.54 0.59 0.64 0.69 0.74 0.79 0.84
3 Thames Gateway Water Neutrality Study 0.00 0.02 0.04 0.09 0.17 0.24 0.31 0.36 0.40 0.45 0.49 0.54 0.58 0.62 0.67 0.71 0.765 CSH Level 5 & 6 0.00 0.02 0.03 0.08 0.14 0.20 0.26 0.30 0.34 0.38 0.41 0.45 0.49 0.53 0.56 0.60 0.64
2009/10 2010/11 2011/12 2012/13 2013/14 2014/15 2015/16 2016/17 2017/18 2018/19 2019/20 2020/21 2021/22 2022/23 2023/24 2024/25 2025/26
2 Building Regulations Part G 0.00 0.00 0.00 0.01 0.01 0.01 0.01 0.01 0.01 0.01 0.01 0.01 0.01 0.01 0.01 0.01 0.01
4 Suggested Policy Scenario 0.00 0.01 0.01 0.02 0.03 0.03 0.03 0.02 0.02 0.02 0.02 0.02 0.02 0.02 0.02 0.02 0.02
3 Thames Gateway Water Neutrality Study 0.00 0.01 0.01 0.03 0.04 0.04 0.03 0.02 0.02 0.02 0.02 0.02 0.02 0.02 0.02 0.02 0.02
5 CSH Level 5 & 6 0.00 0.01 0.01 0.03 0.05 0.05 0.04 0.03 0.03 0.03 0.03 0.03 0.03 0.03 0.03 0.03 0.03
2009/10 2010/11 2011/12 2012/13 2013/14 2014/15 2015/16 2016/17 2017/18 2018/19 2019/20 2020/21 2021/22 2022/23 2023/24 2024/25 2025/26
1 Building Regulations Part G 0.00 0.00 0.01 0.02 0.03 0.04 0.06 0.06 0.07 0.08 0.09 0.10 0.10 0.11 0.12 0.13 0.14
2 Suggested Policy Scenario 0.00 0.01 0.02 0.04 0.07 0.09 0.12 0.14 0.16 0.17 0.19 0.21 0.23 0.24 0.26 0.28 0.29
4 Thames Gateway Water Neutrality Study 0.00 0.01 0.02 0.05 0.08 0.12 0.15 0.18 0.20 0.22 0.24 0.27 0.29 0.31 0.33 0.35 0.37
3 CSH Level 5 & 6 0.00 0.01 0.03 0.06 0.11 0.16 0.20 0.23 0.26 0.29 0.32 0.35 0.38 0.41 0.44 0.46 0.49
Water Savings (against planned water company consumption - Scenario
1) (Ml/d) - CUMULATIVE
Annual Water Savings (against planned water company consumption -
Scenario 1) (Ml/d)
Housing Development
Scenario 3 - Annual Total (Completions and forecasts)
Cummulative Total
Occupancy Rate
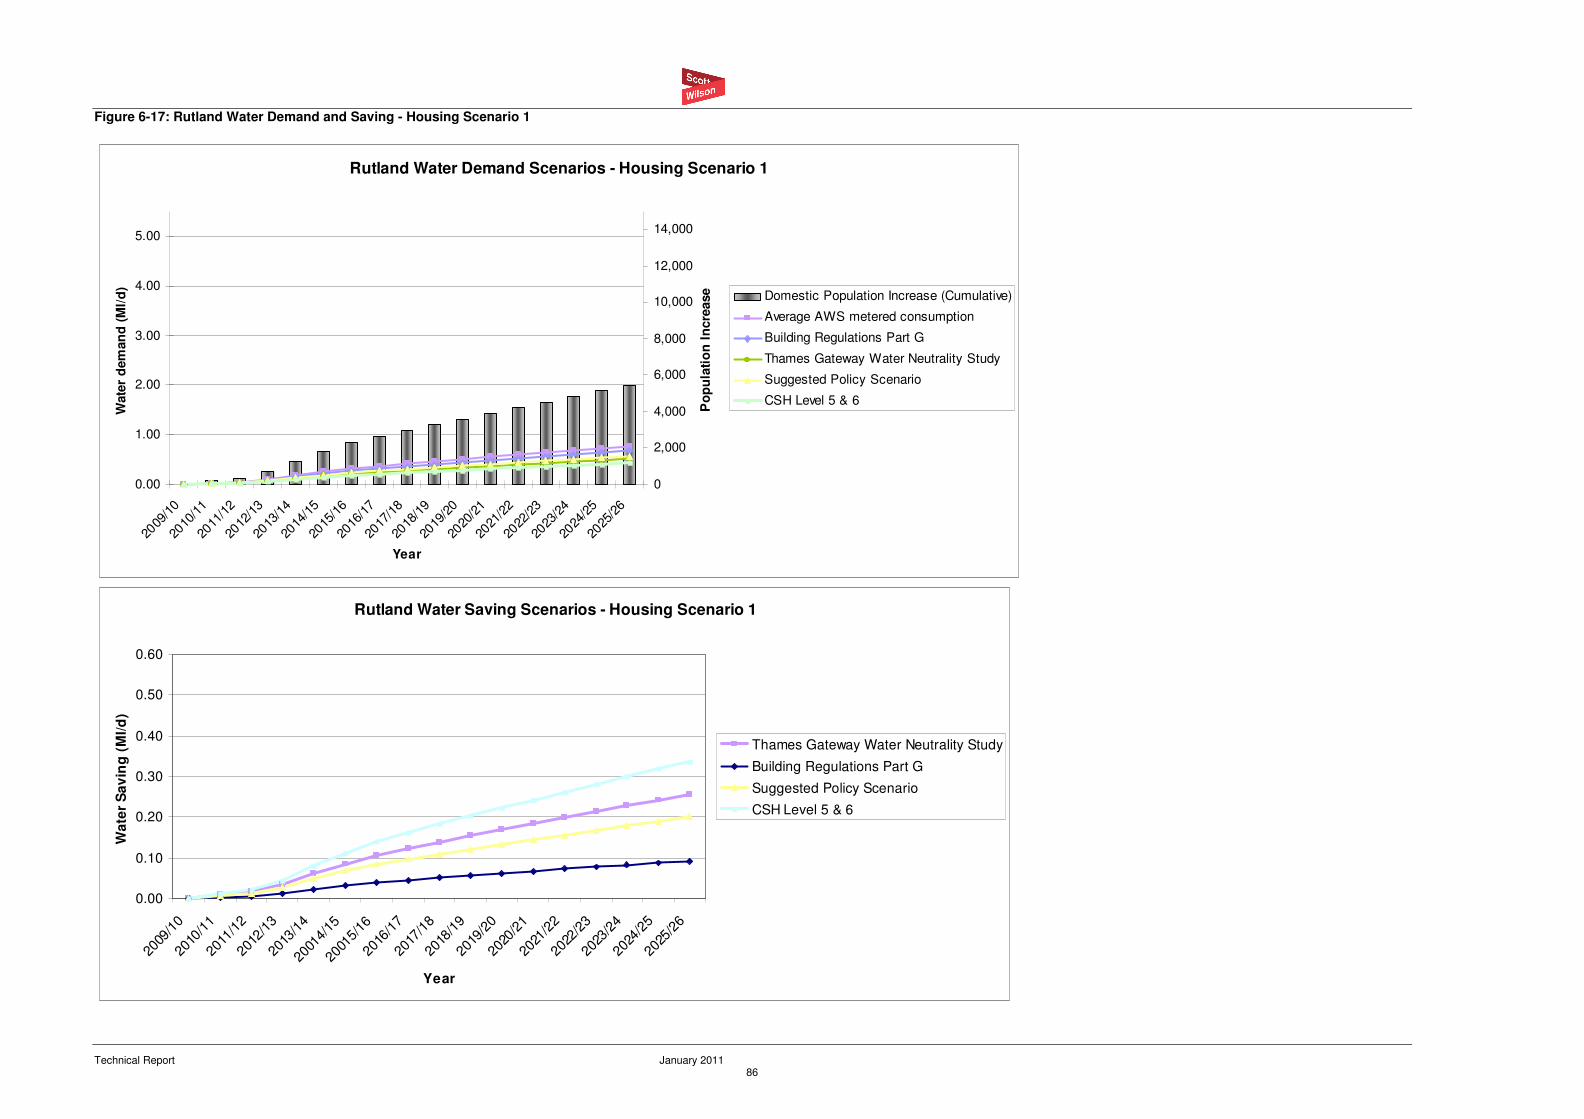
Technical Report January 2011 86
Figure 6-17: Rutland Water Demand and Saving - Housing Scenario 1
Rutland Water Demand Scenarios - Housing Scenario 1
0.00
1.00
2.00
3.00
4.00
5.00
2009
/10
2010
/11
2011
/12
2012
/13
2013
/14
2014
/15
2015
/16
2016
/17
2017
/18
2018
/19
2019
/20
2020
/21
2021
/22
2022
/23
2023
/24
2024
/25
2025
/26
Year
Wate
r d
em
an
d (
Ml/
d)
0
2,000
4,000
6,000
8,000
10,000
12,000
14,000
Po
pu
lati
on
In
cre
ase Domestic Population Increase (Cumulative)
Average AWS metered consumption
Building Regulations Part G
Thames Gateway Water Neutrality Study
Suggested Policy Scenario
CSH Level 5 & 6
Rutland Water Saving Scenarios - Housing Scenario 1
0.00
0.10
0.20
0.30
0.40
0.50
0.60
2009
/10
2010
/11
2011
/12
2012
/13
2013
/14
2001
4/15
2001
5/16
2016
/17
2017
/18
2018
/19
2019
/20
2020
/21
2021
/22
2022
/23
2023
/24
2024
/25
2025
/26
Year
Wa
ter
Sa
vin
g (
Ml/
d)
Thames Gateway Water Neutrality Study
Building Regulations Part G
Suggested Policy Scenario
CSH Level 5 & 6
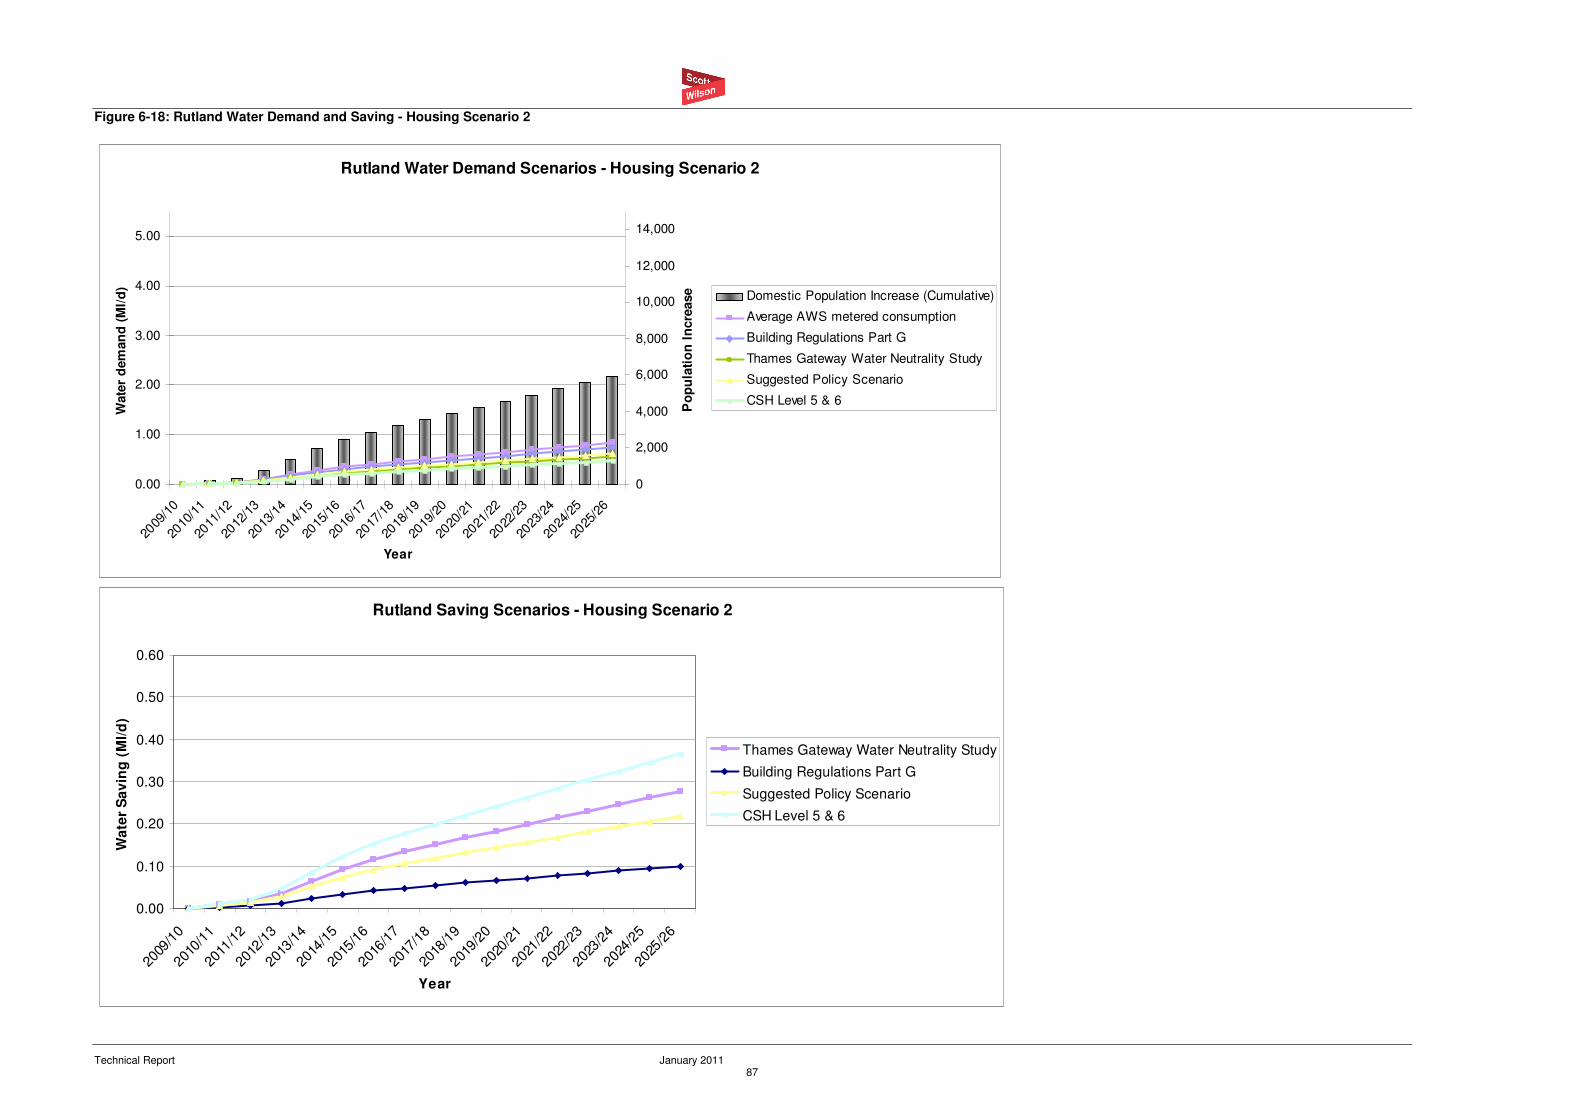
Technical Report January 2011 87
Figure 6-18: Rutland Water Demand and Saving - Housing Scenario 2
Rutland Water Demand Scenarios - Housing Scenario 2
0.00
1.00
2.00
3.00
4.00
5.00
2009
/10
2010
/11
2011
/12
2012
/13
2013
/14
2014
/15
2015
/16
2016
/17
2017
/18
2018
/19
2019
/20
2020
/21
2021
/22
2022
/23
2023
/24
2024
/25
2025
/26
Year
Wate
r d
em
an
d (
Ml/
d)
0
2,000
4,000
6,000
8,000
10,000
12,000
14,000
Po
pu
lati
on
In
cre
ase Domestic Population Increase (Cumulative)
Average AWS metered consumption
Building Regulations Part G
Thames Gateway Water Neutrality Study
Suggested Policy Scenario
CSH Level 5 & 6
Rutland Saving Scenarios - Housing Scenario 2
0.00
0.10
0.20
0.30
0.40
0.50
0.60
2009
/10
2010
/11
2011
/12
2012
/13
2013
/14
2014
/15
2015
/16
2016
/17
2017
/18
2018
/19
2019
/20
2020
/21
2021
/22
2022
/23
2023
/24
2024
/25
2025
/26
Year
Wa
ter
Sa
vin
g (
Ml/
d)
Thames Gateway Water Neutrality Study
Building Regulations Part G
Suggested Policy Scenario
CSH Level 5 & 6
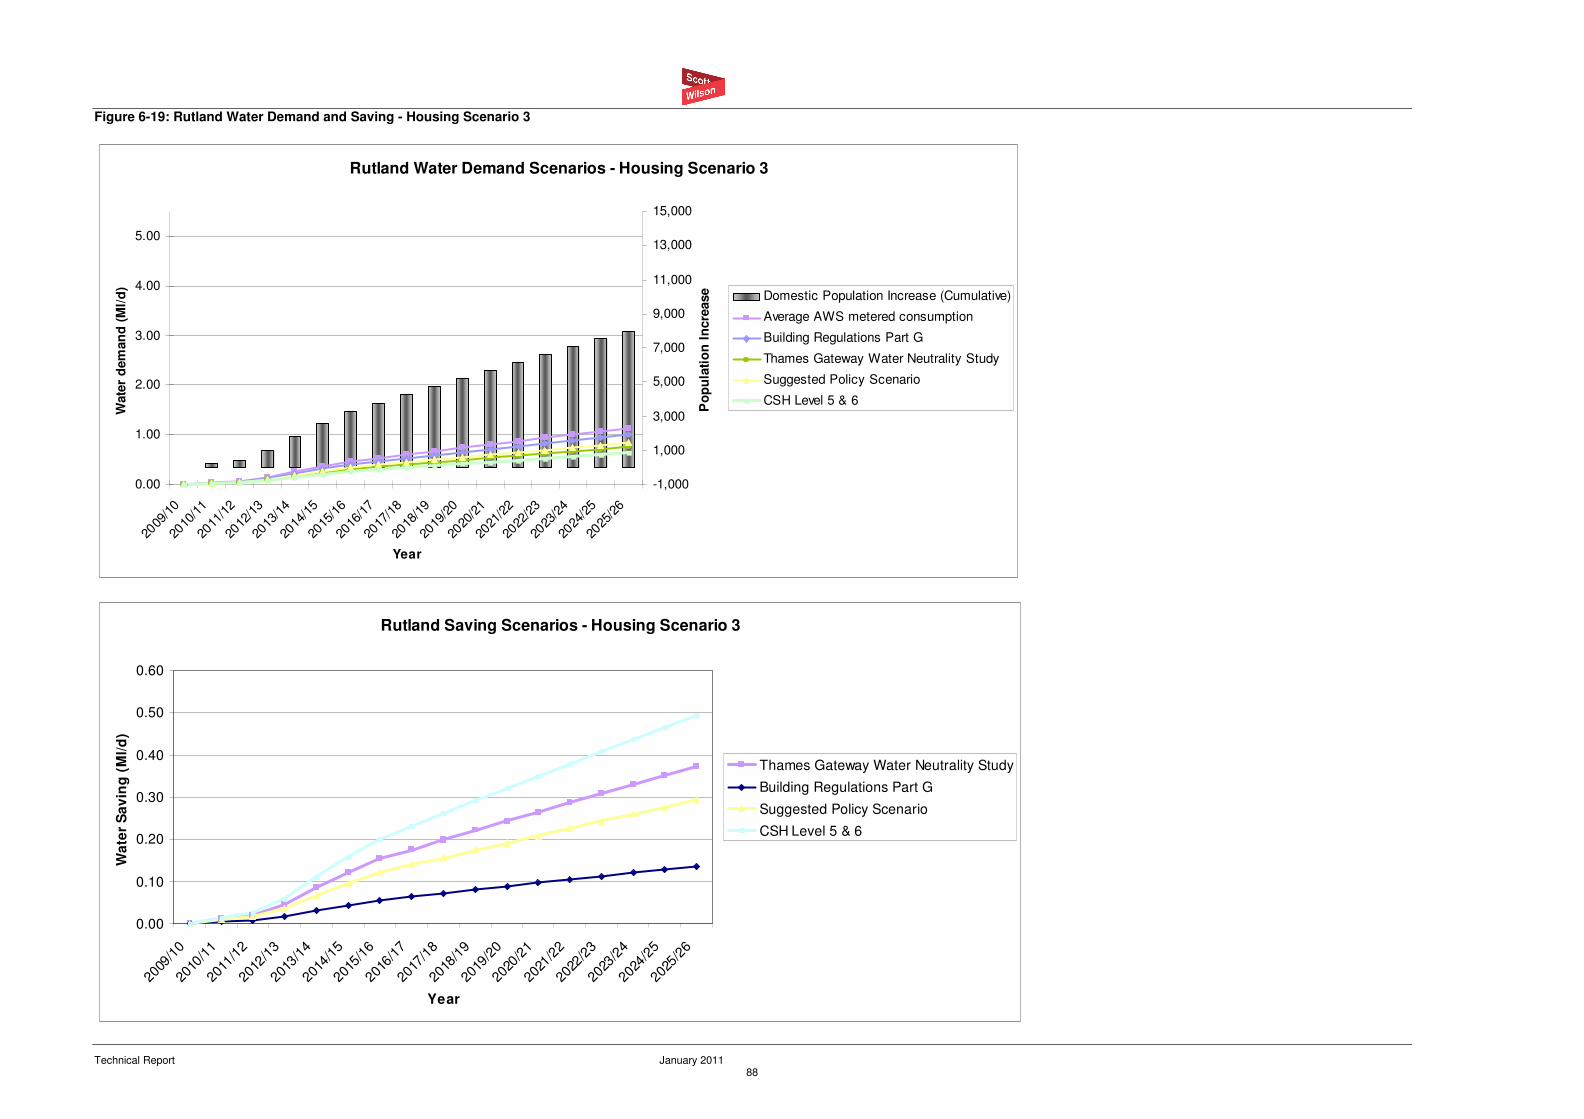
Technical Report January 2011 88
Figure 6-19: Rutland Water Demand and Saving - Housing Scenario 3
Rutland Water Demand Scenarios - Housing Scenario 3
0.00
1.00
2.00
3.00
4.00
5.00
2009
/10
2010
/11
2011
/12
2012
/13
2013
/14
2014
/15
2015
/16
2016
/17
2017
/18
2018
/19
2019
/20
2020
/21
2021
/22
2022
/23
2023
/24
2024
/25
2025
/26
Year
Wate
r d
em
an
d (
Ml/
d)
-1,000
1,000
3,000
5,000
7,000
9,000
11,000
13,000
15,000
Po
pu
lati
on
In
cre
ase Domestic Population Increase (Cumulative)
Average AWS metered consumption
Building Regulations Part G
Thames Gateway Water Neutrality Study
Suggested Policy Scenario
CSH Level 5 & 6
Rutland Saving Scenarios - Housing Scenario 3
0.00
0.10
0.20
0.30
0.40
0.50
0.60
2009
/10
2010
/11
2011
/12
2012
/13
2013
/14
2014
/15
2015
/16
2016
/17
2017
/18
2018
/19
2019
/20
2020
/21
2021
/22
2022
/23
2023
/24
2024
/25
2025
/26
Year
Wa
ter
Sa
vin
g (
Ml/
d)
Thames Gateway Water Neutrality Study
Building Regulations Part G
Suggested Policy Scenario
CSH Level 5 & 6
Technical Report January 2011 89
6.3.4 Water Resources Management Plans
Water companies produce WRMP on a statutory basis covering 25 year planning horizons.
WRMPs set out how a water company plans to provide and invest in existing and new water
resource schemes (e.g. reservoirs, desalination) to meet increases in demand for potable
supply, as a result of new development, population growth and climate change over the next 25
year period.
Anglian Water WRMP
AWS’s current WRMP60
was finalised in 2010 and has been used in this WCS. The WRMP
sets out how the Company intends to balance supply and demand over the next 25 years up to
2031, taking account of expected levels of per capita consumption and forecast population at a
zonal level.
The study area has two WRZs:
• the southeastern part of the study area is supplied by water resources in the Lincolnshire
Fens (WRZ4) water resource zone; and
• the northwestern part of the study area is supplied by water resources in the Lincoln
(WRZ2) water resources zone.
The Lincoln WRZ uses groundwater resources from the Sherwood Sandstone aquifer to the
west of Lincoln and local sources in the Lincolnshire Limestone aquifer to the north and south
of the city. Water is imported to the zone from Elsham WTW in the South Humberside WRZ to
north Lincoln. Historically the increasing nitrate level in the Lincolnshire Limestone aquifer has
been managed by developing groundwater sources in the confined limestone aquifer or by
blending with water from sourceworks with lower nitrate. Some sourceworks require treatment
to reduce the level of iron and manganese to meet the required standards and to remove
pesticides.
The Lincolnshire Fens WRZ is predominantly supplied by local abstraction from the Southern
Lincolnshire Limestone aquifer. The abstraction boreholes are all located in the confined
aquifer beneath the Fens, which receives recharge through the narrow outcrop that runs north–
south through Stamford. The yield of boreholes in the confined aquifer is prolific and licensed
abstractions are limited by the need to restrict drawdown in the aquifer to maintain confined
discharges from natural springs, such as those at Horbling and Billingborough, and man-made
‘wild bores’ across the Fens. It is also necessary to protect the aquifer against inducing the flow
of connate saline water from the east during periods of low groundwater recharge and hence
low groundwater levels. A number of licences have specific conditions to restrict abstraction
when water levels are low while retaining security and flexibility for public water supplies.
Severn Trent Water WRMP
STWL’s WRMP61
was published in June 2010. The plan shows that the western edge of
Rutland is supplied by drinking water from STWL’s East Midlands (WRZ6) Water Resource
Zone, which covers Derbyshire, Nottinghamshire, Leicestershire and Rutland. Water resource
issues affect both ground and surface water in this water resource zone. The WRZ uses
60
Anglian Water, Water Resource Management Plan, Main Report, February 2010. 61
Severn Trent Water , Water Resources Management Plan, Final version, June 2010
Technical Report January 2011 90
groundwater from the aquifer in Nottinghamshire as well as surface water abstractions from the
Rivers Derwent and Dove, Carsington Reservoir and the Charnwood reservoirs. Water is also
imported in to the WRZ from Anglian Water’s treatment works at Wing (Rutland Water).
6.3.5 Water Resource Zone Forecast Supply-Demand Balance
In order to assess the potential environmental constraints within which future growth needs to
be accommodated, it is necessary to identify the baseline situation (i.e. to identify any deficits in
the forecast supply-demand balance) in each water resource zone.
Lincolnshire Fens WRZ (AWS)
The Lincolnshire Fens WRZ has a forecast deficit of available water against target headroom
from early in the planning period. The Bourne Planning Zone has a forecast average deficit of
6.83 Ml/d and the Boston Planning Zone has a forecast average deficit of 4.96 Ml/d. AWS
propose to meet the supply demand through the use of intra-WRZ transfers, enhanced
metering and pressure reduction. The following specific schemes were proposed in the WRMP
to meet the supply demand deficit:
• Covenham WTW transfer (15.6 Ml/d); and
• New Boston WTW (15.6 Ml/d).
The transfer of up to 15.6 Ml/d from Covenham WTW to the Lincolnshire Fens WTW will use
existing spare capacity of potable water. It will require major reinforcement and extension of the
existing transfer from Covenham reservoir in the South Humberside WRZ to the Lincolnshire
Coastal WRZ. The link would complement the existing link from the South Humberside WRZ to
the south of the Lincoln WRZ, developing a strategic water resources and supply network
between the Lincolnshire WRZs to match that of Ruthamford WRZ with its benefits for security
of supplies and resilience.
The potential new WTW close to Boston would use surface water from the Lower River
Witham, supported during low flows by transfers and the increased discharges arising from
Canwick WwTW from growth in Lincoln. The transfers of water are already complex, with water
supplied in the Lincoln WRZ derived from water resources outside the catchment through the
import of water from Rutland Water to supply Grantham, and from the Sherwood Sandstone
aquifer and the River Ancholme, via Elsham WTW, to supply Lincoln. Raw water resources are
then transferred from the Lincoln WRZ to the Lincolnshire Fens WRZ by the River Witham.
However, AWS’s water resources strategy requires the redistribution of groundwater licences
by the Environment Agency. In addition, the Environment Agency has informed AWS of the
potential for sustainability changes to abstraction licences, which could result in significant
sustainability reductions. These and/or a failure to successfully redistribute groundwater
resources could trigger the requirement for major water resources schemes. In addition, the
WRMP may need to change to reflect new estimates of water resource availability when the
outputs from the latest climate change models, published in June 2009, are incorporated into
groundwater and surface water resource models62
.
62
Anglian Water, Water Resource Management Plan, Main Report, February 2010
Technical Report January 2011 91
East Midlands WRZ (STWL)
The projected supply / demand balance for STWL’s East Midlands WRZ is shown to be in
deficit from 2015 onwards. STWL’s WRMP63
uses a variety of planning certainty values (80%,
80%, 70%, 60%, 50% for each five year period from 2010 to 2035) to assess the baseline
supply-demand balance position, which will be positive until 2015/16, and negative thereafter.
At the end of AMP6 (2019/20) the supply shortfall is predicted to be 35 Ml/d and by the end of
the planning period (2034/35) the supply shortfall is predicted to be 65 Ml/d.
The WRMP then identifies and evaluates the range of options available for managing the
supply / demand balance over time. These options are:
• customer demand management options (the use of water by customers), including
promoting water saving and conservation for domestic and non-domestic users, increased
penetration levels for household metering penetration and tariff management;
• distribution options (activities between the input of water to the distribution system at the
water treatment works), which include leakage management, Supply integration via new
distribution links (intra company), bulk transfers of treated water (inter company), manage
leakage by mains replacement or renewal, or by pressure reduction and increased and
increased resilience (for example new distribution pipelines may have the added benefit of
increasing the flexibility of the transfer of water around the network);
• production management options (policies targeted at activities between the point of
resource abstraction and input into the distribution system), which include Treatment
improvements (capacity or new process), Reducing WTW process losses and WTW
maintenance; and
• resource management) options (policies affecting deployable output), which could include
Construction of a new reservoir to be filled in the wetter winter months, Direct abstraction
from a river or groundwater, Raw water transfers (from outside operating area),
desalination, Water reuse, canal transfers and Intra company transfers.
STWL’s strategy for the East Midlands is to strengthen the strategic distribution links to
maximise the sustainable use of existing water resources. The key component of this is the
scheme to duplicate a section of the Derwent Valley Aqueduct in order to increase its capacity
to deploy water from a number of existing treatment works to locations across the WRZ.
6.4 Water Supply Infrastructure
As with the sewer network, impacts on the potable water distribution network from the
proposed growth would be dependent on the exact location of the proposed development.
There is limited capacity to transfer increased flows through existing towns and settlements in
the existing networks (although potable water mains have more capacity than wastewater
network) and there are obvious difficulties with constructing a new main through an already
developed area. However, if a large new development were proposed close to an existing
supply main, it would be theoretically possible to construct a new pipeline to serve the new
development, with the associated costs passed on to the developer. The phasing of new
infrastructure and upgrades to existing infrastructure should be considered when planning the
development of large sites.
63
Severn Trent Water , Water Resources Management Plan, Final version, June 2010
Technical Report January 2011 92
6.5 Environmental and Ecological Impact
Figure 5-8 in Section 5 shows the location of designated conservation sites.
The Wash SPA/Ramsar site and The Wash & North Norfolk Coast SAC
Part of the study area receives its potable water supply from STWL’s East Midlands WRZ. The
East Midlands WRZ involves Rutland Water reservoir (which is also a Special Protection Area
and Ramsar site) which in turn stores water abstracted from the Rivers Nene and Welland
which drains into The Wash SPA/Ramsar site and Wash & North Norfolk Coast SAC.
According to the Environment Agency’s Review of Consents (RoC) for The Wash SPA/Ramsar
site, the risk of impact on SPA and SAC features sensitive to changes in water levels is
considered to be low, with the exception of Lagoons and common tern, which are considered to
be at high risk. Water level changes could result from reduced freshwater flow inputs due to
surface and groundwater abstractions. The RoC concluded that the risk of impact from both
surface and groundwater abstraction on the terrestrial component of the SPA features sensitive
to changes in the flow or velocity is low, whilst for SAC features (otters), it is considered
medium.
Table 6-3: Triggers used to identify abstractions (daily quantities Ml/d) which are
considered to potentially affect The Wash.
River Systems Non Consumptive Abstractions
64 Consumptive Abstractions (Summer)
65
With mcf66
Without mcf With mcf Without mcf
Principal Rivers (Great Ouse, Nene, Welland & Witham)
≥ 250 ≥ 100 ≥ 50 ≥ 20
Other Rivers (Wolferton/Ingol, Heacham & Steeping)
≥ 100 ≥ 20 ≥ 10 ≥ 5
Rutland Water SPA & Ramsar site
Rutland Water is heavily managed by AWS who try to balance abstraction and replenishment
in line with a normal operating curve. This management has effectively created the conditions
which has lead to Rutland Water being awarded its various environmental classifications. It is
expected that if Rutland Water was managed in a similar fashion in the future there would be
no degradation of the integrity of the site due to water resource issues alone. Although it is
understood that abstraction from the reservoir is likely to increase associated with the
extension at Wing Water Treatment Works (which could change in the reservoir level
management regime) it is also understood that an Appropriate Assessment of the effects of
increased abstraction has been will be undertaken by Anglian Water, however this was not
available for the purposes of this Outline study and should be assessed further at the Detailed
WCS stage.
64
Non consumptive abstractions exclude those described below providing the operation does not involve net export to another catchment either through abstraction or residual effluent discharge. As such, TWAS operations in the Witham and GOGS operations in the Ely Ouse are considered as non-consumptive 65
Consumptive abstractions undertaken during summer are summarised as follows with NALD codes given in parenthesis; Evaporative Cooling (080); General Cooling (120); Other high Loss (150); Spray Irrigation - Direct (400). In addition, any operation potentially involving large-scale export from the catchment should be considered as consumptive and therefore NALD codes 340, 430, 440 & 450 should be checked. As such, EOETS operations from the Cut Off Channel are considered as consumptive. Additionally, non-licensed slacker transfer operations should also be regarded as consumptive. 66
MCF = Minimum Control Flow (often referred to as Hands Off Flow)
Technical Report January 2011 93
To meet increased water supply demand AWS has recently invested more than £115 million
on:
• expanding the water treatment works at Wing;
• constructing more than 40 kilometres of new pipelines; and
• creating new wetland lagoons.
This will allow Anglian Water to abstract up to 90 million extra litres of water a day from the
reservoir to meet growing demand in the region. The scheme will provide an additional 41 km
of new pipeline, extension of the water treatment works at Wing, and 84 ha of lagoons and
wetland areas to safeguard the large numbers and diversity of wildfowl that depend on the
reservoir. The new wetland areas will be maintained by an independent water supply, ensuring
that wildlife is not disturbed if water levels in the main reservoir fluctuate.
SSSIs (other than those which are already covered by the international designations
above)
There are two SSSIs in South Holland District, however as Cowbit Wash SSSI is designated for
its archaeological interest features rather than water dependent ecological features, it will not
be considered further as part of this WCS. Surfleet Lows SSSI is one of the few remaining wet
alluvial meadows in Lincolnshire which has not been subjected to agricultural improvement.
Meadows of this type are now rare throughout lowland Britain and Surfleet Lows displays a
typical range of meadow plants is present as well as a number of species more characteristic of
coastal locations. Surfleet Lows SSSI is current in Favourable condition and it can therefore be
assumed that it is not currently being adversely affected by potable water abstractions. AWS
propose to meet the supply demand through the use of intra-WRZ transfers, enhanced
metering and pressure reduction, which will not impact upon the interest features of the SSSI.
Rutland has numerous SSSIs but (other than Rutland Water itself) only Empingham Marshy
Meadows SSSI is particularly hydrologically sensitive and it is not connected with any WwTWs
or public water supply abstraction points. There are several SSSIs in South Kesteven District
but only three (Baston & Thurlby Fens, Langtoft Gravel Pits and Deeping Gravel Pits) are
particularly hydrologically sensitive. Of these, only Baston & Thurlby Fens SSSI is connected
with the fluvial regime, but this site is not connected with any abstractions for the Public Water
Supply that are likely to be subject to any increase. Horbling Fen SSSI, as with Cowbit fen, is
designated for its archaeological interest features rather than water dependent ecological
features and will therefore not be considered further as part of this WCS.
Shacklewell Hollows SSSI contains a range of semi-natural plant communities which have
developed along the valley of a small tributary of the River Gwash. The tributary itself is a
clean-water stream which drains strata of the Jurassic Lincolnshire Limestones and
Northampton sands67
. No impacts on groundwater levels and therefore on the SSSI are
anticipated as a result of increased potable water demands, as the key component of STWL’s
water supply planning is to duplicate a section of the Derwent Valley Aqueduct in order to
increase its capacity to deploy water from a number of existing treatment works to locations
across the WRZ.
Therefore, no further investigation of impacts on Sites of Special Scientific Interest should be
required as part of the detailed WCS.
67
http://www.sssi.naturalengland.org.uk/citation/citation_photo/1001268.pdf
Technical Report January 2011 94
Eyebrook Reservoir SSSI lies to the west of the study area, in Leicestershire. The site is a
major wetland area which combines an extensive sheet of open water with a complex of
wetland and lakeside habitats including mudflats, marsh, pasture, broad-leaved woodland, and
broad-leaved, mixed and coniferous plantations. In autumn and winter the site attracts large
numbers of ducks most notably Wigeon, Mallard, Teal and Pochard, while in spring and
autumn flocks of a wide variety of wading birds on passage use the area for feeding68
. The site
is heavily dependent on groundwater and could therefore be subject to impacts from the
proposed development. However, no impacts on groundwater levels are anticipated as a result
of increased potable water demands, as the key component of STWL’s water supply planning
is to duplicate a section of the Derwent Valley Aqueduct in order to increase its capacity to
deploy water from a number of existing treatment works to locations across the WRZ.
The water resource assessment of the WCS has identified that there are water resource
deficits predicted to occur over the plan period. However, the mechanisms to resolve this are
identified in the Water Resource Management Plans for AWS and STWL, which have been
agreed with statutory consultees including the Environment Agency and do not involve adverse
effects on European sites.
6.6 Conclusions
Both AWS and STWL are predicting supply / demand balance deficits during the plan period,
although both companies have proposed measures to deal with these deficits. AWS propose to
meet the supply demand through the use of intra-WRZ transfers, enhanced metering and
pressure reduction. STWL’s strategy for the East Midlands is to strengthen the strategic
distribution links to maximise the sustainable use of existing water resources. The key
component of this is the scheme to duplicate a section of the Derwent Valley Aqueduct in order
to increase its capacity to deploy water from a number of existing treatment works to locations
across the WRZ. As the WRMPs run for a 25 year period, the proposed schemes will cover
several AMP periods.
No adverse effects on designated conservation sites are anticipated as a result of these
schemes and the availability of water resources should not be considered to be a constraint to
development for any of the proposed development locations. Despite this, it is important that
water efficiency measures be incorporated into all new development, to ensure the most
sustainable use of existing resources.
As with the sewer network, impacts on the potable water distribution network from the
proposed growth would be dependent on the exact location of the proposed development.
68
http://www.sssi.naturalengland.org.uk/citation/citation_photo/1004428.pdf
Technical Report January 2011 95
7 Flood Risk Management
It is important for the WCS to include an assessment of the constraints of, and the
infrastructure required to mitigate, the impacts of flood risk to proposed growth. Both flood risk
to, and flood risk from development needs to be considered in the overall assessment of
growth as proposed in each of the authorities’ LDFs.
7.1 Flood Risk to Development
7.1.1 Planning Policy Statement 25
Planning Policy Statement 25: Development and Flood Risk (PPS25) sets out guidance and
requirements for the assessment of flood risk. While this does not directly form part of the
guidance for carrying out a WCS, it has been used during the production of this report. The
guidance set out within PPS25 must be applied in order to address flood risk from all sources
(fluvial, pluvial, tidal, groundwater, artificial and sewer).
PPS25 states that the Sequential Test must be applied by local authorities when allocating new
development sites, in order to steer development away from the areas of greatest flood risk.
The Sequential Test is a planning principle that seeks to identify, allocate or develop land in low
flood risk zones before land in high flood risk zones. When a development type is not
compatible with flood risk in a particular location, the Exception Test may be applied if there are
valid reasons as to why the development should proceed, as set out in PPS25.
In addition, development in Flood Zones 3, 2 and sites greater than 1ha in area within Flood
Zone 1 should be subject to a PPS25 compliant FRA. The FRA should also ensure compliance
with the detailed WCS, Level 2 SFRA and SWMP. PPS25 also sets out the requirements for
local authorities to carry out Strategic Flood Risk Assessments (SFRAs).
7.1.2 Strategic Flood Risk Assessments
SFRAs have been carried out for the three Councils, which have formed the basis of the
assessment of flood risk presented in this WCS. The SFRA considers and maps the sources of
flood risk to potential development throughout the authority areas according to the
requirements of PPS25. The three SFRAs are as follows:
• South Holland District Level 2 SFRA69
, initially carried out by Royal Haskoning in 2002 and
updated by Royal Haskoning in 2010;
• South Kesteven District Level 1 SFRA completed 200970
and Level 2 to be completed
October 2010; and
• Rutland SFRA, carried out by Entec in 200971
.
The SKDC SFRA is currently being updated and is due to be published at the beginning of
2011.
69
South Holland District SFRA, Royal Haskoning, 2010 70
South Kesteven District, SFRA, Entec, 2009 71
Rutland County SFRA, Entec, 2009
Technical Report January 2011 96
7.1.3 Catchment Flood Management Plans
In addition to the SFRAs, Catchment Flood Management Plans (CFMPs) have been produced
by the Environment Agency for the Welland72
and Nene73
catchments. The CFMPs assess
inland flood risk from rivers, ground water, surface water and tidal flooding, but not coastal
flooding directly from the sea as this is covered by Shoreline Management Plans (SMPs). The
CFMP were published in December 2009 and the conclusions of the studies were therefore
available for use within the South Holland and South Kesteven SFRAs, although not the
Rutland SFRA.
The Fens policy area of the Nene CFMP is relevant to the SHDC area. The CFMP lists the
following policy that is applicable to the study area;
• Policy 4 - Areas of low, moderate or high flood risk where we are already managing the
flood risk effectively but where we may need to take further actions to keep pace with
climate change This policy will tend to be applied where the risks are currently deemed to
be appropriately-managed, but where the risk of flooding is expected to significantly rise in
the future. In this case we would need to do more in the future to contain what would
otherwise be increasing risk. Taking further action to reduce risk will require further
appraisal to assess whether there are socially and environmentally sustainable, technically
viable and economically justified options.
The Upper Tributaries (Policy 2), Welland and Glens (Policy 2), Fenland (Policy 4), Oakham
(Policy 3), Stamford (Policy 3), Spalding (Policy 4) and Surfleet (Policy 5) policy areas of the
Welland CFMP are relevant to the SKDC and RCC areas. The CFMP lists the following policies
that are applicable:
• Policy 2 - Areas of low to moderate flood risk where we can generally reduce existing flood
risk management actions. This policy will tend to be applied where the overall level of risk to
people and property is low to moderate. It may no longer be value for money to focus on
continuing current levels of maintenance of existing defences if we can use resources to
reduce risk where there are more people at higher risk. We would therefore review the flood
risk management actions being taken so that they are proportionate to the level of risk.
• Policy 3 - Areas of low to moderate flood risk where we are generally managing existing
flood risk effectively This policy will tend to be applied where the risks are currently
appropriately managed and where the risk of flooding is not expected to increase
significantly in the future. However, we keep our approach under review, looking for
improvements and responding to new challenges or information as they emerge. We may
review our approach to managing flood defences and other flood risk management actions,
to ensure that we are managing efficiently and taking the best approach to managing flood
risk in the longer term.
• Policy 4 - Areas of low, moderate or high flood risk where we are already managing the
flood risk effectively but where we may need to take further actions to keep pace with
climate change This policy will tend to be applied where the risks are currently deemed to
be appropriately-managed, but where the risk of flooding is expected to significantly rise in
the future. In this case we would need to do more in the future to contain what would
otherwise be increasing risk. Taking further action to reduce risk will require further
72
River Welland CFMP, Environment Agency 2009, http://publications.environment-agency.gov.uk/pdf/GEAN1209BRIZ-e-e.pdf 73
River Nene CFMP, Environment Agency 2009, http://publications.environment-agency.gov.uk/pdf/GEAN0909BPCD-e-e.pdf
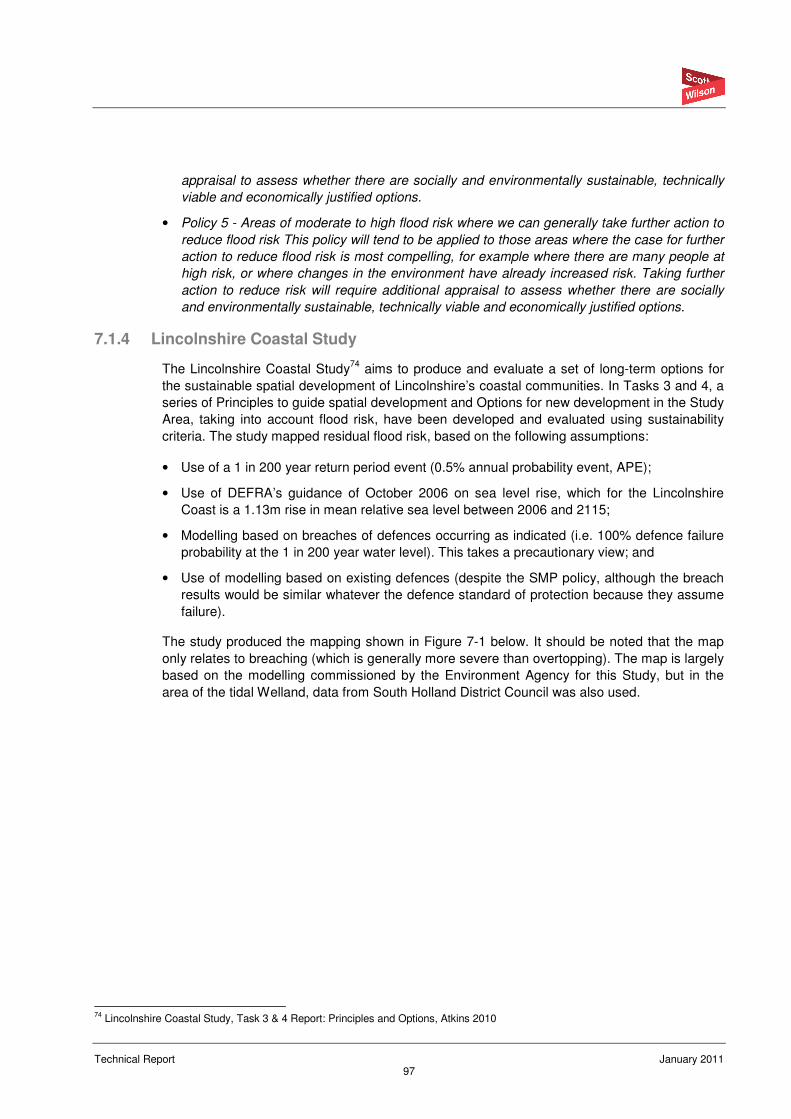
Technical Report January 2011 97
appraisal to assess whether there are socially and environmentally sustainable, technically
viable and economically justified options.
• Policy 5 - Areas of moderate to high flood risk where we can generally take further action to
reduce flood risk This policy will tend to be applied to those areas where the case for further
action to reduce flood risk is most compelling, for example where there are many people at
high risk, or where changes in the environment have already increased risk. Taking further
action to reduce risk will require additional appraisal to assess whether there are socially
and environmentally sustainable, technically viable and economically justified options.
7.1.4 Lincolnshire Coastal Study
The Lincolnshire Coastal Study74
aims to produce and evaluate a set of long-term options for
the sustainable spatial development of Lincolnshire’s coastal communities. In Tasks 3 and 4, a
series of Principles to guide spatial development and Options for new development in the Study
Area, taking into account flood risk, have been developed and evaluated using sustainability
criteria. The study mapped residual flood risk, based on the following assumptions:
• Use of a 1 in 200 year return period event (0.5% annual probability event, APE);
• Use of DEFRA’s guidance of October 2006 on sea level rise, which for the Lincolnshire
Coast is a 1.13m rise in mean relative sea level between 2006 and 2115;
• Modelling based on breaches of defences occurring as indicated (i.e. 100% defence failure
probability at the 1 in 200 year water level). This takes a precautionary view; and
• Use of modelling based on existing defences (despite the SMP policy, although the breach
results would be similar whatever the defence standard of protection because they assume
failure).
The study produced the mapping shown in Figure 7-1 below. It should be noted that the map
only relates to breaching (which is generally more severe than overtopping). The map is largely
based on the modelling commissioned by the Environment Agency for this Study, but in the
area of the tidal Welland, data from South Holland District Council was also used.
74
Lincolnshire Coastal Study, Task 3 & 4 Report: Principles and Options, Atkins 2010
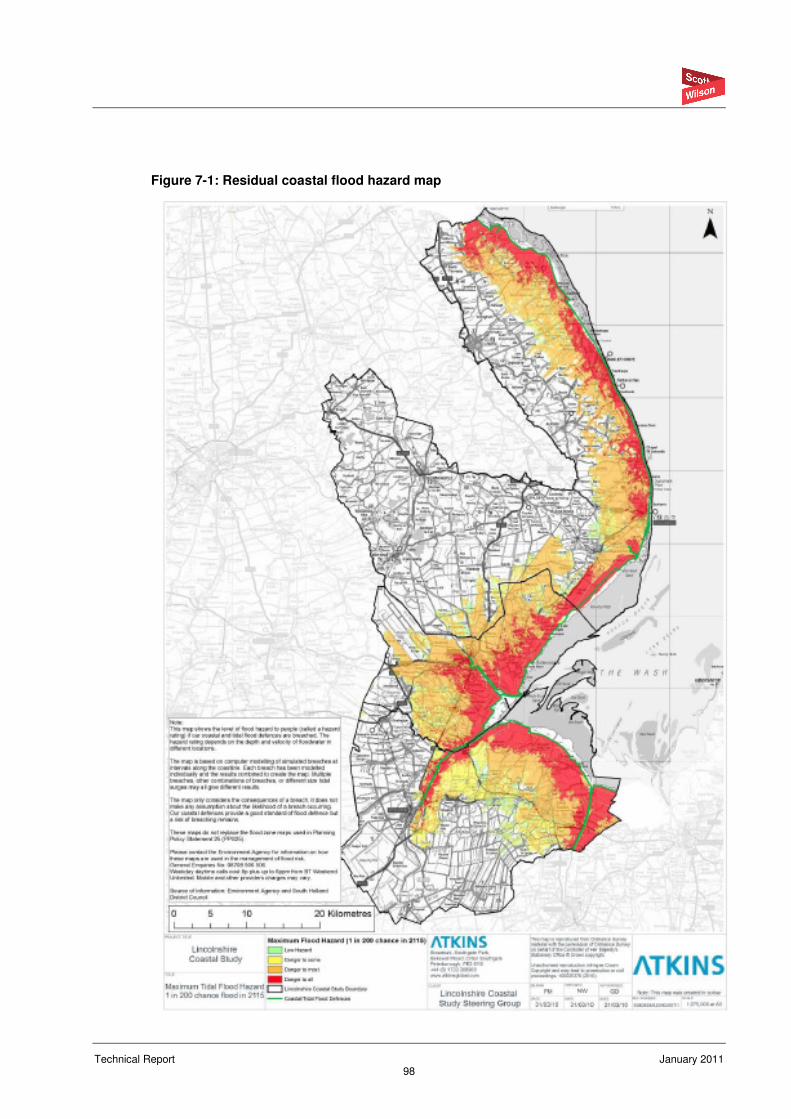
Technical Report January 2011 98
Figure 7-1: Residual coastal flood hazard map
Technical Report January 2011 99
7.1.5 Key Flood Risk issues in South Holland
Both the 2010 SFRA and the 2010 Lincolnshire Coastal Study75
concluded that the principle
flood risks to the District are from the sea, from the rivers and from any shortfalls in capacity in
the internal drainage network. The District is reliant on flood protection given by the various
defence systems and related flood risk management measures, which currently sustain a
largely satisfactory level of flood risk within the District. However, the SFRA concluded that if
the currently projected effects of climate change materialise (with higher sea levels and
increased river flows), but the defence systems are not upgraded from their present form, there
will be significant flood risk within the District by the Year 2115, with impact in the main urban
areas as well as in agricultural areas. The flood risk to people would become unacceptable. A
lesser, but notable, increase in flood risk would also be apparent by the Year 2055.
The SFRA mapped this level of flood risk, to show the areas of the District which may be at risk
of flooding in the future. The actual risk extent for 2055, for a 1% fluvial/0.5% tidal event
probability shows the area adjacent to the coast of the Wash to be most at risk. A large area to
the north west of Spalding, along with the east of the town adjacent to the Coronation Channel,
is also at risk. The flood mapping for the actual risk extent for 2115, for a 1% fluvial/0.5% tidal
event probability, show a much larger area of the District to be affected by flooding. The 2055
and 2115 extents are shown in Figures 7-2 and 7-3 below (taken from the SFRA). . The
Lincolnshire Coastal Study also mapped residual flood risk, which shows the consequences
assuming any part of the raised defences may fail, regardless of apparent standard, together
with the consequences of overtopping that would occur. This gives a wider potential flood risk
area than arises when considering Actual Risk, as displayed above in Figure 7-1.
The SHDC SFRA also assessed and mapped flood hazard across the District. Flood hazard is
a function of the depth and velocity of flood water and is used to reflect potential danger to
people that may arise during a flood event. This has been assessed using the advice given in
the Defra/Environment Agency report FD2320 TR276
. The hazard calculation was made only
for the Spalding and Sutton Bridge areas, these being the larger centres of population most
exposed to a threat of flooding as well as being where most new development is envisaged.
The SFRA concluded that taken overall, under present-day conditions, the risk to people is low
except, as may be expected, in the event of an extreme (0.1% AP) tidal or fluvial flood event.
However, for the future 2115 scenario, the hazard within Spalding and Pinchbeck would be
significant, becoming extreme around the power station area near the tidal River Welland. The
area having significant hazard would extend through the site of the new hospital currently under
construction near Pinchbeck Road. In the Sutton Bridge area, the town centre and parts near
the power station would have a hazard rating of extreme. Overall, the hazard ratings show that
the risk to people would become unacceptable in the future if the assumed climate change
effects materialise and no measures are taken to counter them.
75
Lincolnshire Coastal Study, Task 3 & 4 Report: Principles and Options, Atkins 2010 76
R & D Technical Report FD2320/TR2.Flood Risk Assessment Guidance for New Development Phase 2 – Full Documentation and Tools.
Defra/Environment Agency, October 2005
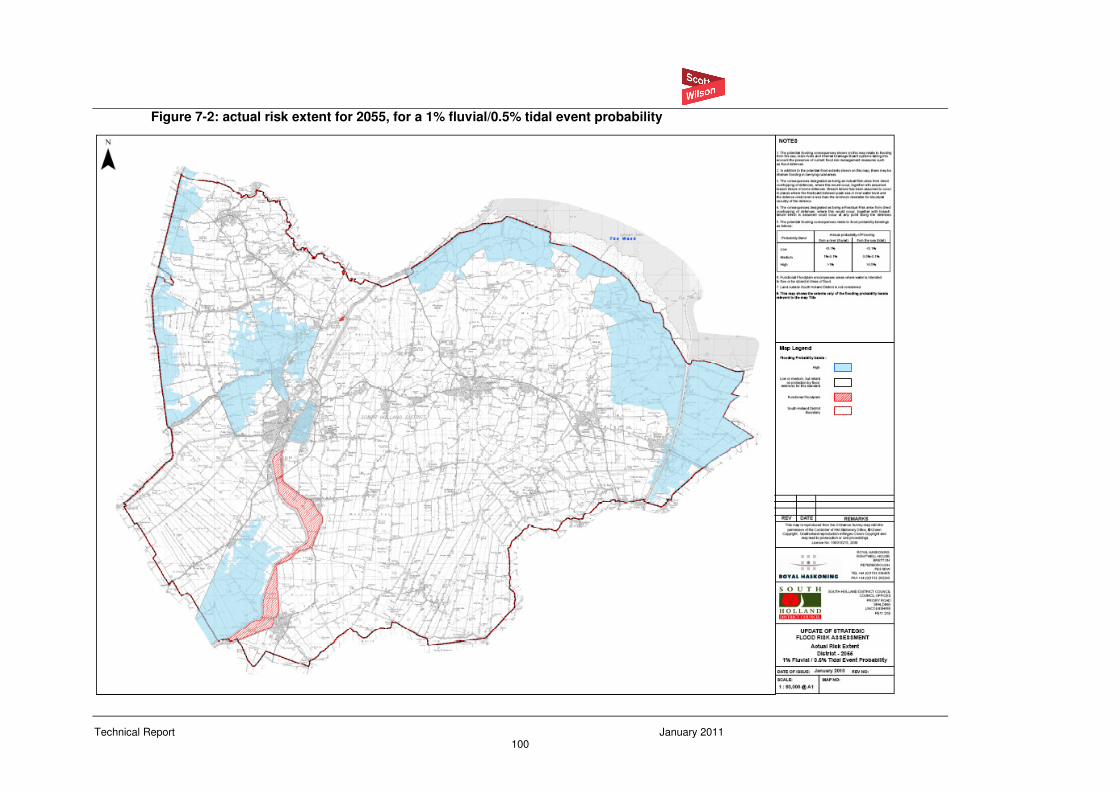
Technical Report January 2011 100
Figure 7-2: actual risk extent for 2055, for a 1% fluvial/0.5% tidal event probability
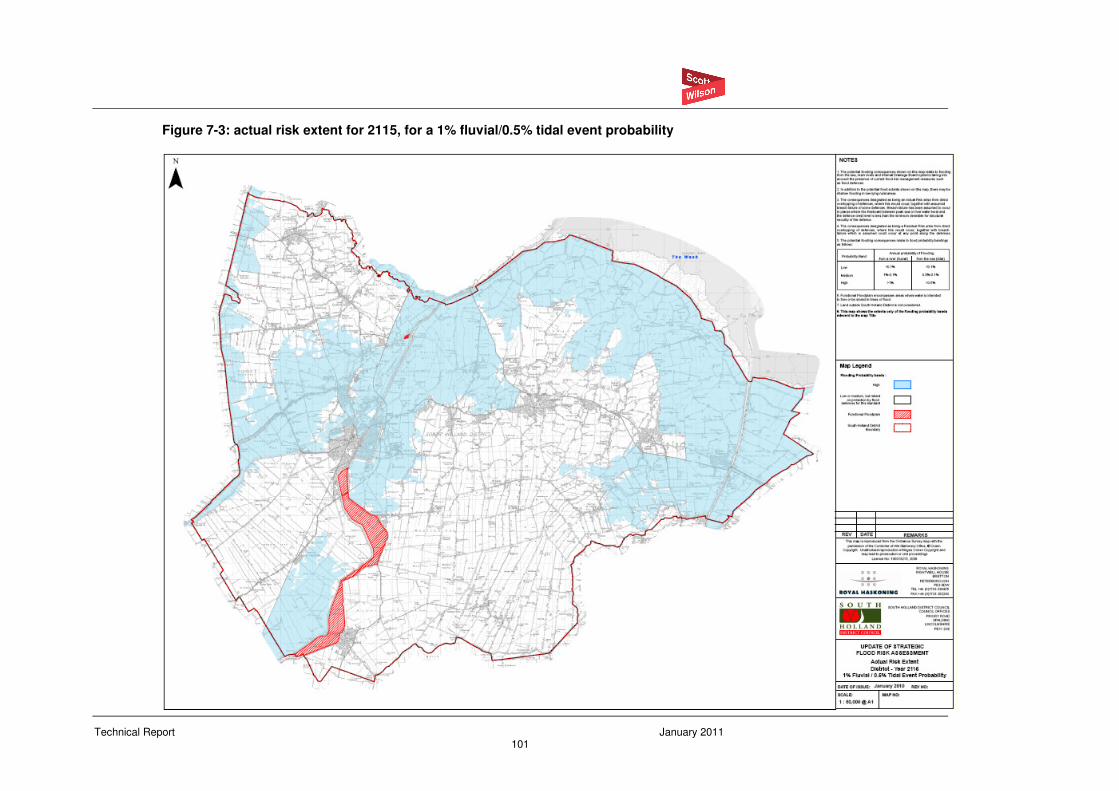
Technical Report January 2011 101
Figure 7-3: actual risk extent for 2115, for a 1% fluvial/0.5% tidal event probability
Technical Report January 2011 102
7.1.6 Key Flood Risk issues in South Kesteven
The SFRA concluded that the areas most at risk from fluvial flooding were associated with the
main rivers systems in the District, namely the Catchment of the Welland and the Witham
(including tributaries). There are also some areas of surface water flood risk, associated with
inadequate or blocked drainage, and groundwater flooding or infrastructure failure.
The SFRA mapped the Flood Zones in the South Kesteven District, as shown below in Figures
7-4 and 7-5 (taken from the SFRA). These maps shows the flood risk to be limited to narrow
strips adjacent to the main river channels and a larger area to the east of the District, along the
border with South Holland District. This area is associated with the low lying Fen area to the
east and reflects the extensive areas of Flood Zone 3 located here.
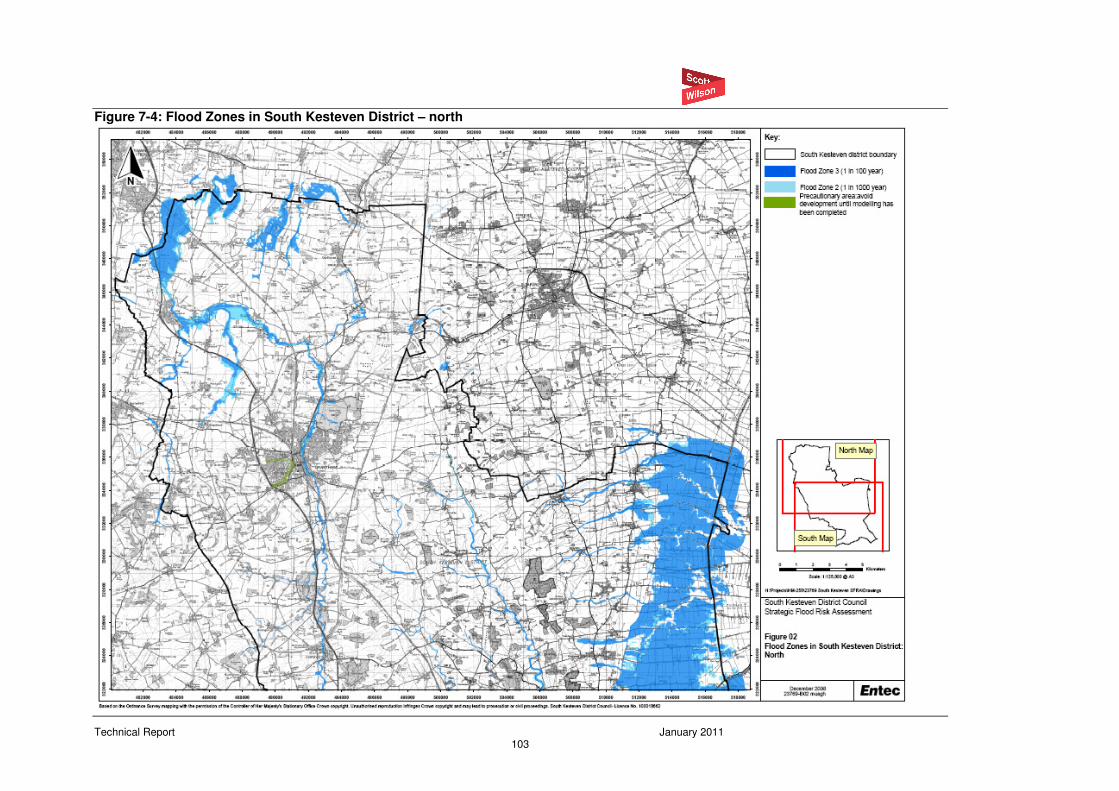
Technical Report January 2011 103
Figure 7-4: Flood Zones in South Kesteven District – north
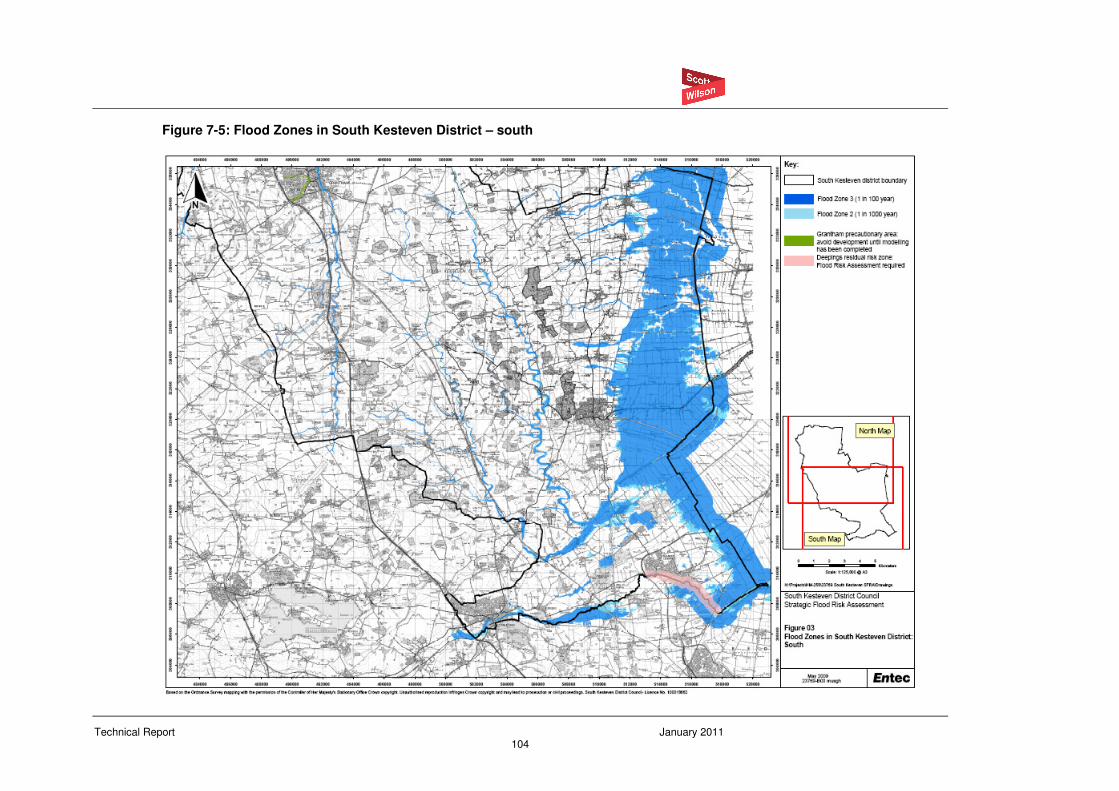
Technical Report January 2011 104
Figure 7-5: Flood Zones in South Kesteven District – south
Technical Report January 2011 105
7.1.7 Key Flood Risk issues in Rutland
Flood mapping produced for the SFRA indicated that fluvial flood risk is of limited spatial extent
within the County and that the majority of the higher risk Flood Zones (2 and 3) are located in
rural areas away from the built environment. See Figure 7-6 below (Taken from the SFRA).
There are a few small settlements where the flood map shows properties at risk and these
include Langham, Whissendine, Cottesmore, Ryhall, Ketton and parts of Oakham.
The SFRA has shown that there is the potential for quite extensive flooding along the main
River Welland; however this does not constitute a major risk to existing development as there
are minimal receptors in the floodplain. Much of Rutland is located in upland areas with many
small watercourses in well defined channels. As such, Flood Zones are limited in extent and it
is likely that there is sufficient room for new development to be located outside of higher risk
Flood Zones. Residual risk from reservoir dam failure has been a considered within the SFRA.
The SFRA advised against development downstream of raised reservoirs such as Rutland
Water and Eyebrook Reservoir.
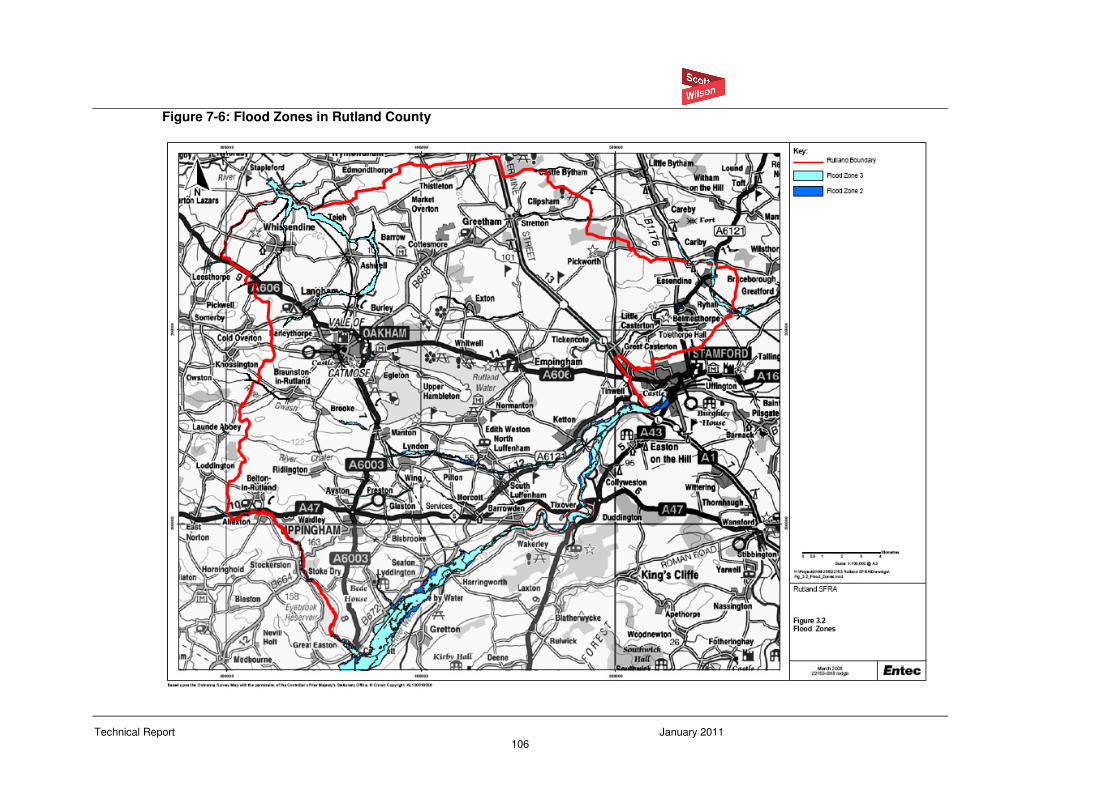
Technical Report January 2011 106
Figure 7-6: Flood Zones in Rutland County
Technical Report January 2011 107
7.2 Flood Risk from Development – Surface Water Management
Surface Water Management is a key consideration when assessing development within large
areas. PPS25 requires that new development does not increase the risk of flooding elsewhere
by managing surface water runoff generated as a result of developing land. Altering large
areas of land by urbanising it fundamentally alters the way in which rainfall drains to
watercourses and has the potential to increase the rate and amount of water that enters
watercourses causing an increase in flood risk.
Surface water management is a key consideration in the study area due to the fact that a large
proportion of land put forward for development, particularly within the South Holland District,
will be within areas where surface water runoff is managed via complex pumping systems to
ensure that surface water flooding does not inundate generally low lying urban areas and high
grade agricultural land. New development must consider the impact of further urbanisation on
the existing pumped system, and discharge of surface water must be mitigated within the
pumped limitations of the drained system.
In many cases, the management of surface water is achieved via a requirement to restrict
runoff from developed sites to that which occurs from the pre-development site usage and this
is achieved by incorporating a range of Sustainable Drainage Systems (SuDS) which aim to
maximise the amount of rainwater which is returned to the ground (infiltration) and then to hold
back (attenuate) excess surface water. Incorporating SuDS often requires a large amount of
space and for large developments often requires the consideration of large scale strategic
features such as balancing ponds which can attenuate and store large volumes of water
generated during very heavy rain storms to prevent flood risk downstream. It is therefore
essential that surface water drainage is managed separately from wastewater, both to reduce
impact on the existing combined system and to meet the requirements of national and regional
policy.
At the present point in the planning process, it has not been possible to determine outline
requirements of the SuDS features that could be possible at each of the growth areas. This is
because specific site details are not known and hence it is not possible to consider potential
sizes of surface water attenuation features or specific topographic/geological constraints at
each site. However, a strategic scale SuDS suitability assessment has been undertaken for
growth towns.
7.2.1 Internal Drainage Boards
The Environment Agency has jurisdiction over designated main rivers under the Water
Resources Act 1991 (WRA) and the Land Drainage and Sea Defence Byelaws. Under the
above legislation, Flood Defence Consent is required prior to the erection of any structure in,
over or under a watercourse which is part of a main river, (indicated with a red line as part of
the Flood Zones held by the Local Planning Authority), and any work carried out within 9
metres of the bank of a main river. This is to ensure that they neither interfere with our work,
nor adversely affect the environment, fisheries, wildlife and flood defence in the locality.
Under Section 23 of the Land Drainage Act 1991, Flood Defence Consent is also required for
any works that affect the flow, (I.e.; culverting, weirs or dams), of an Ordinary watercourse (i.e.
non-main river).
Technical Report January 2011 108
There are numerous Internal Drainage Boards (IDBs) within the study area, which are
responsible for the maintenance and management of certain watercourses, usually heavily
managed and often pumped systems, which do not fall under the jurisdiction of the
Environment Agency.
The following IDBs were consulted as part of this WCS:
• South Holland IDB;
• Black Sluice IDB;
• Upper Witham IDB;
• Welland and Deepings IDB;
• Witham First IDB;
• Kings Lynn IDB;
• North Level IDB.
Comments received from the Upper Witham IDB77
has indicated the following points which they
would wish to see taken into consideration when designing drainage systems and carrying out
site specific FRAs:
• SuDS systems are now expected in all cases. Emphasis should be given to future
maintenance needs and that systems must be practical.
• In addition the Board wishes to highlight the premise within PPS25 where developers,
where possible, reduce flood risk overall (paragraph 22) and that, as far as is practicable,
surface water arising from a developed site should be managed in a sustainable manner to
mimic the surface water flows arising from the site prior to the proposed development
(paragraph F6). This should be considered whether the surface water discharge
arrangements from the site are to connect to a public or private sewer before outfalling into
a watercourse or to outfall directly into a watercourse and should be considered as a
minimum requirement (see below).
• Consideration should be given to the premise that developers should be required to design
to stricter criteria, for example the area of hardstanding/roof area should be increased by a
percentage to allow for permitted development rights, such as conservatories, extensions
etc. This should be considered during the design of any drainage system for a proposed
new development.
• For previously developed and brownfield sites, where a new connection to a watercourse is
proposed (either directly or via a surface water sewer), the maximum discharge rate should
be equal to greenfield runoff rate.
• A minimum 30% reduction to existing discharge rates up to a 1 in 100 year (1% annual
probability) is expected to be achieved for those sites with an existing connection to a
watercourse or a sewer that discharges to a watercourse.
• For greenfield sites, where a new connection to a watercourse is proposed (either directly or
via a surface water sewer), the maximum discharge rate should be less than greenfield
runoff rate.
77
Kenneth J Pratt, Engineer to Board, Upper Witham IDB, Personal Communication, 7th July 2010.
Technical Report January 2011 109
• For discharges of foul effluent to a watercourse, the rates of discharge from this source
must be included within the surface water discharge rates for the site as a whole and not be
in addition to such rates.
It should be noted that the above requirements for restriction of run-off rates are over and
above the requirements of PPS25. However, consultation with the relevant IDBs is essential
when planning new developments which drain to an IDB watercourse.
Comments received from South Holland IDB78
also indicated that maintenance of SuDS was a
concern for the IDB. Maintenance agreement must be made before properties are sold, to
ensure that the systems are correctly maintained. Without regular upkeep, some SuDS
systems can become ineffective in as little as 10 years. The IDB indicated that it would prefer to
see new development connected to an IDB drain, as then future maintenance could be
guaranteed.
While these comments are noted, the 2010 Flood and Water Management Act makes the Lead
Local Flood Authority (in this case – Rutland and Lincolnshire County Councils) responsible for
adopting and maintaining SuDS. This will supersede the above comments made by Upper
Witham and South Holland IDBs.
It was also noted that in areas with a high water table SuDS could exacerbate any existing
groundwater flooding issues, although no examples of settlements where this may be a
particular issue were given.
No comments were received from the other IDBs that were consulted for this WCS.
7.2.2 SuDS suitability
In order to give an indication of SuDS suitability for the WCS, the likely capacity for infiltration
type SuDS for the growth towns has been considered. A high level assessment has therefore
been made based on the geological conditions of the main growth areas as a whole. In
summary the assessment has been made on the following criteria:
• the presence of an aquifer underneath the site and the requirement to protect groundwater
used as potable supply through the designation of SPZs; and
• the rate at which water is able to pass through the soil and underlying geology (referred to
as its permeability).
Due to the reliance of the southern area of the study area on abstractions from groundwater,
consideration of the protection of groundwater from pollution as a result of above ground
development is a key and hence the SuDS suitability assessment has used information on
‘Source Protections Zones’ and areas of ‘Groundwater Vulnerability’.
The SFRAs have been used in this WCS to inform the assessment of SuDS type and this
assessment is included within section 9 of this report (Growth Towns Assessments) where the
water environment and water infrastructure constraints for each key growth location are
summarised.
78
Carl Vines, Drainage Engineer, South Holland IDB, Personal Communication, 17th June 2010.
Technical Report January 2011 110
7.2.3 South Holland
The western part of the District, broadly west of Holbeach, is underlain by Oxford clay, with
Ampthill clay/Kimmeridge clay underlying the eastern part. This solid geology is at a
considerable depth below the surface. Above it, the geology is classified as alluvium, with
areas of peat near the South Forty Foot Drain and in the very south of the District. The surface
soils are fenland in character, predominantly deep silty clay or clay.
As the geology underlying this district is predominantly clay and not able to readily transmit
water there are no designated aquifers. Given the impermeable nature of the geology,
attenuation SuDS are likely to be the most commonly used for new developments. These could
include wetlands, attenuation ponds and/or basins. In some places it may be possible to use a
combination of attenuation and infiltration techniques but this would be subject to a ground
investigation.
7.2.4 South Kesteven
There is a band of limestone aquifer running through the District, from the eastern edge of
Grantham to Stamford in the south. There are a number of springs located in this area and
flooding may develop in low-lying areas when high groundwater levels reach the surface,
although some areas are overlain by less permeable drift deposits. Either side of the limestone
band, to the west and east, the geology is dominated by clays and mudstones, although there
are areas where permeable drift and superficial sediments are found near the surface. As the
geology in this area varies all the SuDS techniques may be suitable and a ground investigation
will be needed to determine the indicative permeability underlying a site.
In the southeast of the District, around the Deepings, the superficial geology is dominated by
permeable sands. In this area it is likely that the underlying geology would be suitable for the
use of infiltration SuDS that could include permeable paving, infiltration trenches or filter drains.
Although, it is likely that these areas are also located on a designated “principal or secondary
aquifer” and restrictions on the discharge to it are likely to be imposed specifically to a site.
7.2.5 Rutland
The geology underlying Oakham consists largely of Jurassic Lias Clays and Marlstones. Clays
are present particularly in areas upstream of Oakham. The relatively impermeable nature of the
geology gives rise to rapid runoff following heavy rain.
In areas such as western Rutland with large areas of impermeable geology attenuation SuDS
are likely to be the most commonly used for new developments. These could include wetlands,
attenuation ponds and/or basins. In some places it may be possible to use a combination of
attenuation and infiltration techniques but this would be subject to a ground investigation.
7.3 Flood Risk from Development - Increased WwTW Discharges
Increased discharges from WwTW due to development may adversely affect flood risk
downstream. PPS25 requires that there is no increase in flood risk downstream due to
development. Mitigation measures may be required where:
• there is a quantifiable increase in frequency of spill from storm storage tanks due to
additional foul flows; or
Technical Report January 2011 111
• the receiving watercourse and associated flood risk area is particularly sensitive to changes
in flows.
AWS should consult with the Environment Agency to identify and agree an appropriate policy
for identifying suitable locations and methods for mitigation measures. For example, mitigation
for the increase in treated wastewater flows could be to provide additional storage volume in
any flood attenuation facilities near to the WwTW. To allow further evaluation of options for
combining storage in strategic flood attenuation facilities, the approximate volume of
compensation storage that could mitigate the increase in flows from each WwTW should be
estimated within the detailed Water Cycle Study. The potential impacts should be assessed for
the treatment works that will receive most of the projected growth.
7.4 Climate Change
Climate change impacts such as changing rainfall patterns and increased river flows and sea
levels are key considerations to future flood risk, surface water management and development
planning throughout the study area. Climate change is the main driver for increasing future
flood risk in the South Holland, South Kesteven and Rutland area.
The Welland and Nene CFMPs and the three SFRAs produced for each of the client
authorities have taken climate change into consideration, in accordance with the requirements
of PPS25. The flood and hazard mapping used for this WCS therefore includes the effects of
climate change, as does the overall assessment of flood risk and within this WCS.
7.5 Conclusion
Due to the low lying nature of the eastern part of the study area and the presence of pumped
watercourses, there are large areas of the study area that lie within Flood Zones 2 and 3. In
accordance with PPS25 and the Sequential Test, development should be directed away from
areas of flood risk and new development should be located in Flood Zone 1. Residential
development should not be located in Flood Zones 2 and 3 unless there are no suitable sites
available in Flood Zone 1. If there is no reasonably available site in Flood Zone 1, the flood
vulnerability of the proposed development (according to Table D.2, Annex D of PPS25) can be
taken into account in locating development in Flood Zone 2 and then Flood Zone 3.
Reference should be made to the mapping contained within the SFRAs for each of the Districts
and the Lincolnshire Coastal Study, to ensure planned development is located away from the
areas of flood risk; see section 9 below for an individual assessment of flood risk to the
proposed growth locations. In addition, site specific Flood Risk Assessments will be required
for all proposed development sites within Flood Zones 2 and 3, and for all sites in Flood Zone 1
which are greater than 1 hectare in area.
In all areas, consideration should be given to the risk of increased flood risk from the
development. Foul and surface water should be separated wherever possible, to reduce the
flows to be treated at WwTW. Surface water should be attenuated and treated with SuDS,
using the hierarchy given in section 7.3 above. The future maintenance needs for SuDS
systems must be considered, as must the practicality of systems. Consultation with the
Environment Agency and/or the relevant IDBs should be undertaken on a site specific basis, to
ensure run-off rates to watercourses are acceptable and will not increase the risk of flooding
elsewhere.
Technical Report January 2011 112
8 Growth Locations Assessment
8.1 Introduction
The WCS report has identified constraints in terms of proposed growth within South Holland,
South Kesteven and Rutland in relation to the six key ‘water cycle’ areas:
• water resources;
• wastewater treatment;
• wastewater transmission;
• ecology;
• flood risk; and
• surface water management.
The resultant outcome was the formulation of a constraints matrix for each of the key
development areas. The matrix has been designed so that the amount of subjective
interpretation of the data is minimised, and hence the traffic lights allocated are based on
factual and quantitative data where possible.
The most relevant and important constraints have been identified to aid in the assessment of
development within South Holland, South Kesteven and Rutland. For the purpose of the
constraints matrices these were amalgamated and put into generic colour coded categories, as
outlined in the following town assessments.
In relation to above colour coding, it is important to note that a colour coding of red does not
necessarily mean that the proposed development cannot take place, merely that if
development were to take place here greater, more significant, and potentially costly
constraints would have to be overcome which would likely involve a higher level of
infrastructure investment or greater strategic planning.
The constraints matrix and traffic light colour coding has been applied to each of the major
settlements in the South Holland, South Kesteven and Rutland where significant levels of
growth are proposed, as described further in the subsequent sections and shown below in
Table 8-1.
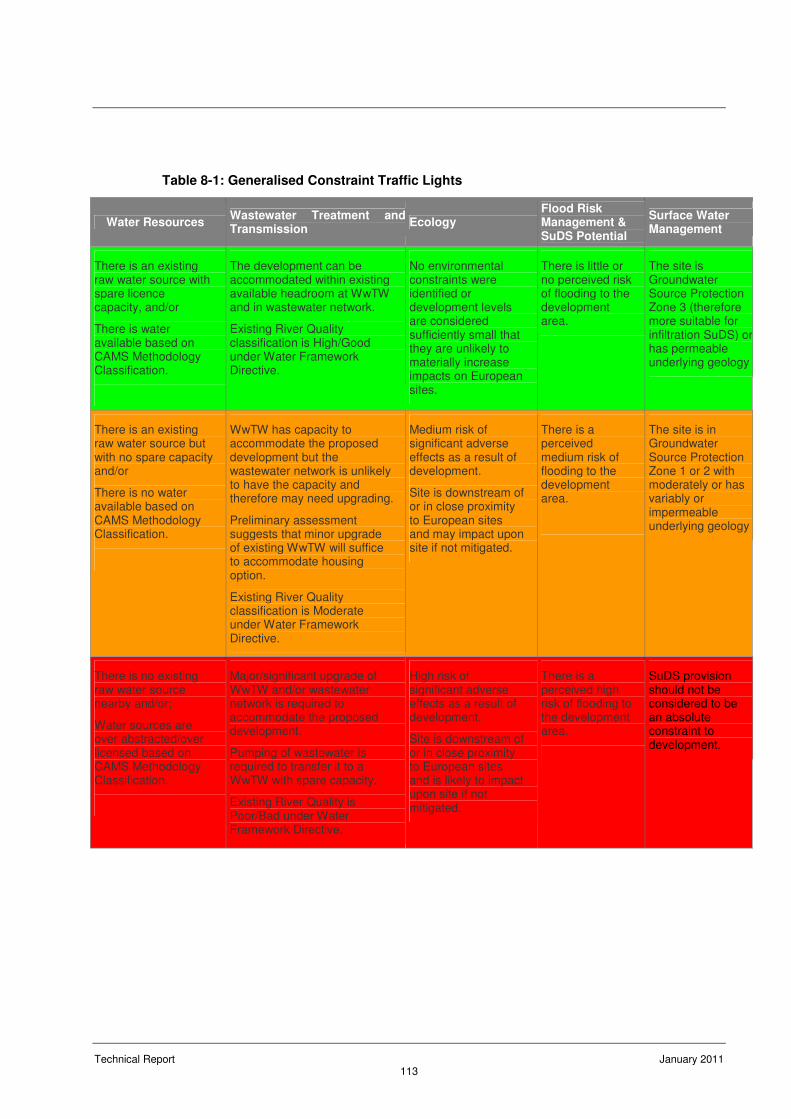
Technical Report January 2011 113
Table 8-1: Generalised Constraint Traffic Lights
Water Resources Wastewater Treatment and Transmission
Ecology Flood Risk Management & SuDS Potential
Surface Water Management
There is an existing raw water source with spare licence capacity, and/or
There is water available based on CAMS Methodology Classification.
The development can be accommodated within existing available headroom at WwTW and in wastewater network.
Existing River Quality classification is High/Good under Water Framework Directive.
No environmental constraints were identified or development levels are considered sufficiently small that they are unlikely to materially increase impacts on European sites.
There is little or no perceived risk of flooding to the development area.
The site is Groundwater Source Protection Zone 3 (therefore more suitable for infiltration SuDS) or has permeable underlying geology
There is an existing raw water source but with no spare capacity and/or
There is no water available based on CAMS Methodology Classification.
WwTW has capacity to accommodate the proposed development but the wastewater network is unlikely to have the capacity and therefore may need upgrading.
Preliminary assessment suggests that minor upgrade of existing WwTW will suffice to accommodate housing option.
Existing River Quality classification is Moderate under Water Framework Directive.
Medium risk of significant adverse effects as a result of development.
Site is downstream of or in close proximity to European sites and may impact upon site if not mitigated.
There is a perceived medium risk of flooding to the development area.
The site is in Groundwater Source Protection Zone 1 or 2 with moderately or has variably or impermeable underlying geology
There is no existing raw water source nearby and/or;
Water sources are over abstracted/over licensed based on CAMS Methodology Classification.
Major/significant upgrade of WwTW and/or wastewater network is required to accommodate the proposed development.
Pumping of wastewater is required to transfer it to a WwTW with spare capacity.
Existing River Quality is Poor/Bad under Water Framework Directive.
High risk of significant adverse effects as a result of development.
Site is downstream of or in close proximity to European sites and is likely to impact upon site if not mitigated.
There is a perceived high risk of flooding to the development area.
SuDS provision should not be considered to be an absolute constraint to development.
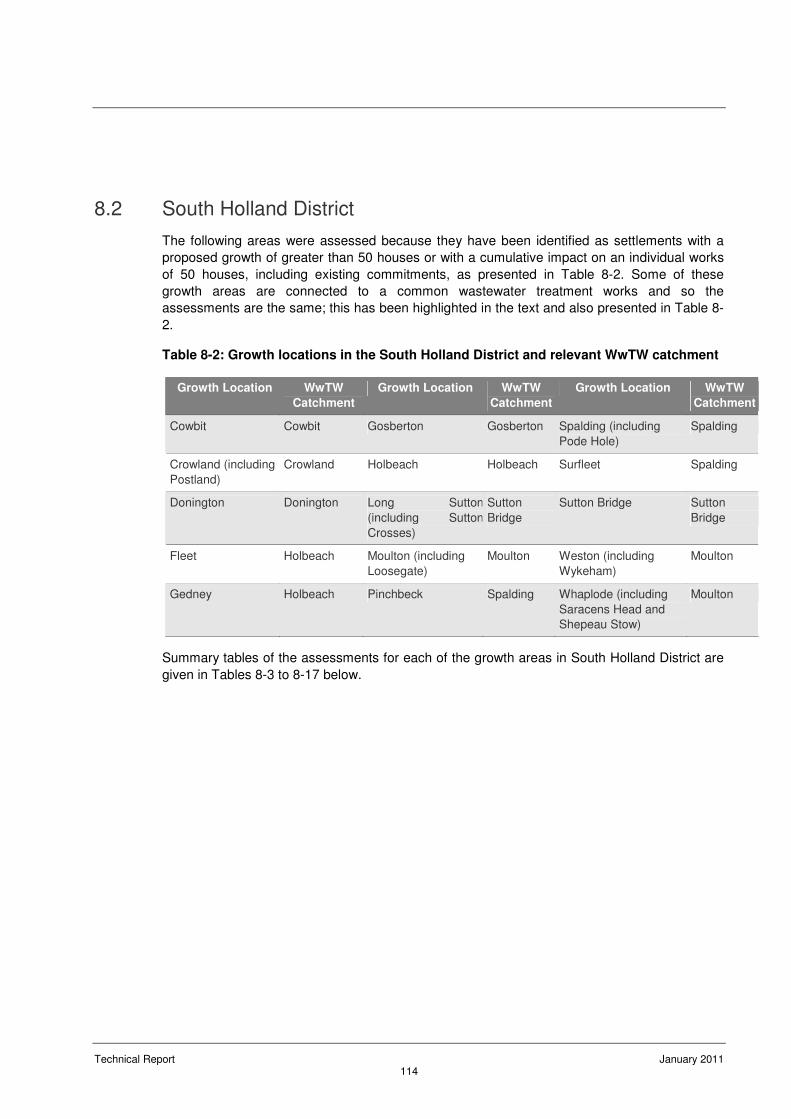
Technical Report January 2011 114
8.2 South Holland District
The following areas were assessed because they have been identified as settlements with a
proposed growth of greater than 50 houses or with a cumulative impact on an individual works
of 50 houses, including existing commitments, as presented in Table 8-2. Some of these
growth areas are connected to a common wastewater treatment works and so the
assessments are the same; this has been highlighted in the text and also presented in Table 8-
2.
Table 8-2: Growth locations in the South Holland District and relevant WwTW catchment
Growth Location WwTW
Catchment
Growth Location WwTW
Catchment
Growth Location WwTW
Catchment
Cowbit Cowbit Gosberton Gosberton Spalding (including
Pode Hole)
Spalding
Crowland (including
Postland)
Crowland Holbeach Holbeach Surfleet Spalding
Donington Donington Long Sutton
(including Sutton
Crosses)
Sutton
Bridge
Sutton Bridge Sutton
Bridge
Fleet Holbeach Moulton (including
Loosegate)
Moulton Weston (including
Wykeham)
Moulton
Gedney Holbeach Pinchbeck Spalding Whaplode (including
Saracens Head and
Shepeau Stow)
Moulton
Summary tables of the assessments for each of the growth areas in South Holland District are
given in Tables 8-3 to 8-17 below.
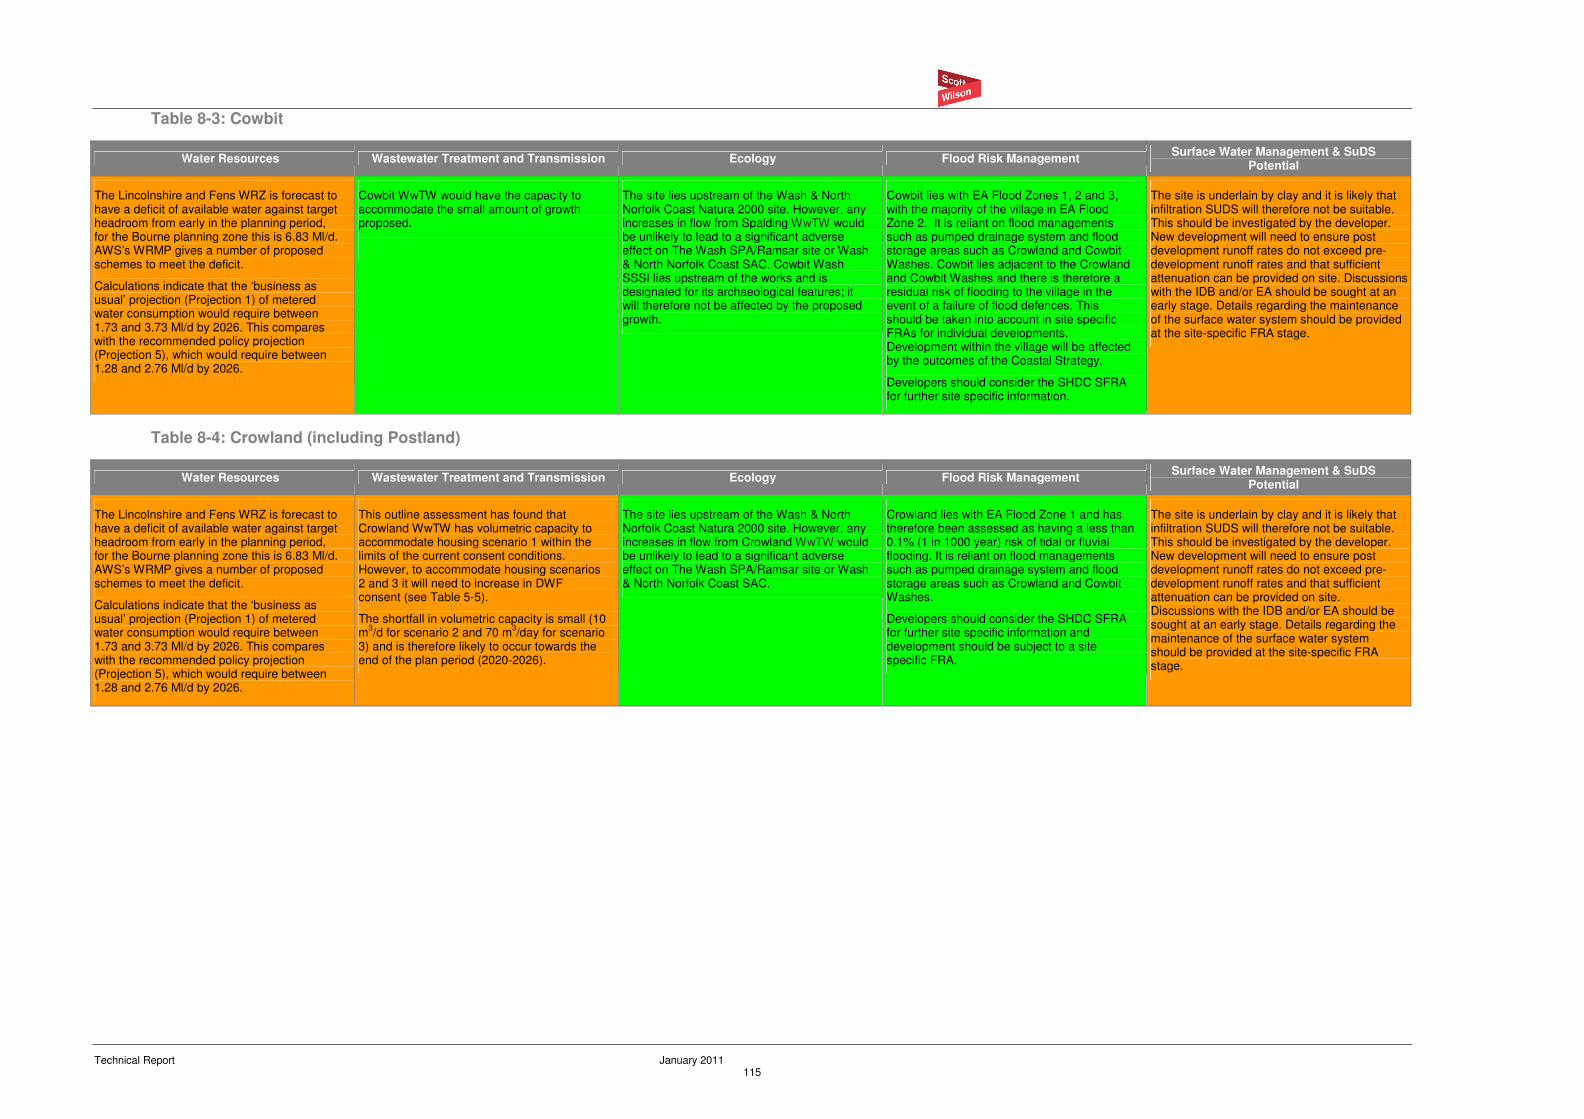
Technical Report January 2011 115
Table 8-3: Cowbit
Water Resources Wastewater Treatment and Transmission Ecology Flood Risk Management Surface Water Management & SuDS
Potential
The Lincolnshire and Fens WRZ is forecast to have a deficit of available water against target headroom from early in the planning period, for the Bourne planning zone this is 6.83 Ml/d. AWS’s WRMP gives a number of proposed schemes to meet the deficit.
Calculations indicate that the ‘business as usual’ projection (Projection 1) of metered water consumption would require between 1.73 and 3.73 Ml/d by 2026. This compares with the recommended policy projection (Projection 5), which would require between 1.28 and 2.76 Ml/d by 2026.
Cowbit WwTW would have the capacity to accommodate the small amount of growth proposed.
The site lies upstream of the Wash & North Norfolk Coast Natura 2000 site. However, any increases in flow from Spalding WwTW would be unlikely to lead to a significant adverse effect on The Wash SPA/Ramsar site or Wash & North Norfolk Coast SAC. Cowbit Wash SSSI lies upstream of the works and is designated for its archaeological features; it will therefore not be affected by the proposed growth.
Cowbit lies with EA Flood Zones 1, 2 and 3, with the majority of the village in EA Flood Zone 2. It is reliant on flood managements such as pumped drainage system and flood storage areas such as Crowland and Cowbit Washes. Cowbit lies adjacent to the Crowland and Cowbit Washes and there is therefore a residual risk of flooding to the village in the event of a failure of flood defences. This should be taken into account in site specific FRAs for individual developments. Development within the village will be affected by the outcomes of the Coastal Strategy.
Developers should consider the SHDC SFRA for further site specific information.
The site is underlain by clay and it is likely that infiltration SUDS will therefore not be suitable. This should be investigated by the developer. New development will need to ensure post development runoff rates do not exceed pre-development runoff rates and that sufficient attenuation can be provided on site. Discussions with the IDB and/or EA should be sought at an early stage. Details regarding the maintenance of the surface water system should be provided at the site-specific FRA stage.
Table 8-4: Crowland (including Postland)
Water Resources Wastewater Treatment and Transmission Ecology Flood Risk Management Surface Water Management & SuDS
Potential
The Lincolnshire and Fens WRZ is forecast to have a deficit of available water against target headroom from early in the planning period, for the Bourne planning zone this is 6.83 Ml/d. AWS’s WRMP gives a number of proposed schemes to meet the deficit.
Calculations indicate that the ‘business as usual’ projection (Projection 1) of metered water consumption would require between 1.73 and 3.73 Ml/d by 2026. This compares with the recommended policy projection (Projection 5), which would require between 1.28 and 2.76 Ml/d by 2026.
This outline assessment has found that Crowland WwTW has volumetric capacity to accommodate housing scenario 1 within the limits of the current consent conditions. However, to accommodate housing scenarios 2 and 3 it will need to increase in DWF consent (see Table 5-5).
The shortfall in volumetric capacity is small (10 m
3/d for scenario 2 and 70 m
3/day for scenario
3) and is therefore likely to occur towards the end of the plan period (2020-2026).
The site lies upstream of the Wash & North Norfolk Coast Natura 2000 site. However, any increases in flow from Crowland WwTW would be unlikely to lead to a significant adverse effect on The Wash SPA/Ramsar site or Wash & North Norfolk Coast SAC.
Crowland lies with EA Flood Zone 1 and has therefore been assessed as having a less than 0.1% (1 in 1000 year) risk of tidal or fluvial flooding. It is reliant on flood managements such as pumped drainage system and flood storage areas such as Crowland and Cowbit Washes.
Developers should consider the SHDC SFRA for further site specific information and development should be subject to a site specific FRA.
The site is underlain by clay and it is likely that infiltration SUDS will therefore not be suitable. This should be investigated by the developer. New development will need to ensure post development runoff rates do not exceed pre-development runoff rates and that sufficient attenuation can be provided on site. Discussions with the IDB and/or EA should be sought at an early stage. Details regarding the maintenance of the surface water system should be provided at the site-specific FRA stage.
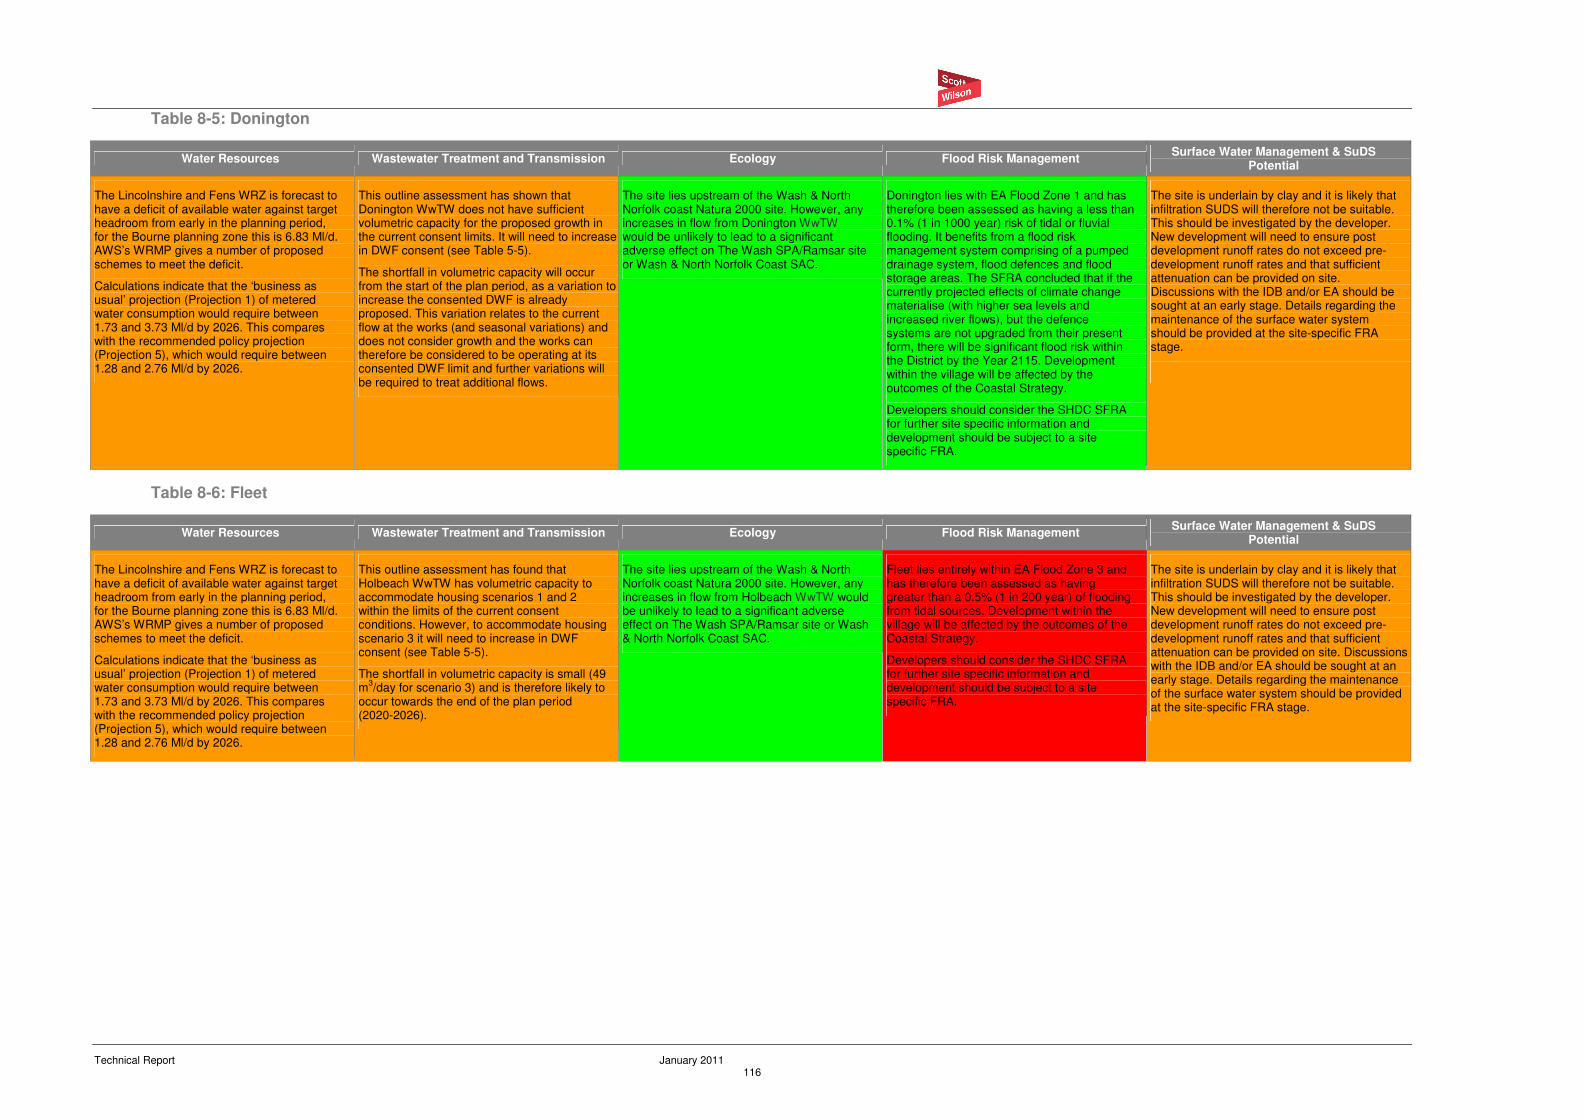
Technical Report January 2011 116
Table 8-5: Donington
Water Resources Wastewater Treatment and Transmission Ecology Flood Risk Management Surface Water Management & SuDS
Potential
The Lincolnshire and Fens WRZ is forecast to have a deficit of available water against target headroom from early in the planning period, for the Bourne planning zone this is 6.83 Ml/d. AWS’s WRMP gives a number of proposed schemes to meet the deficit.
Calculations indicate that the ‘business as usual’ projection (Projection 1) of metered water consumption would require between 1.73 and 3.73 Ml/d by 2026. This compares with the recommended policy projection (Projection 5), which would require between 1.28 and 2.76 Ml/d by 2026.
This outline assessment has shown that Donington WwTW does not have sufficient volumetric capacity for the proposed growth in the current consent limits. It will need to increase in DWF consent (see Table 5-5).
The shortfall in volumetric capacity will occur from the start of the plan period, as a variation to increase the consented DWF is already proposed. This variation relates to the current flow at the works (and seasonal variations) and does not consider growth and the works can therefore be considered to be operating at its consented DWF limit and further variations will be required to treat additional flows.
The site lies upstream of the Wash & North Norfolk coast Natura 2000 site. However, any increases in flow from Donington WwTW would be unlikely to lead to a significant adverse effect on The Wash SPA/Ramsar site or Wash & North Norfolk Coast SAC.
Donington lies with EA Flood Zone 1 and has therefore been assessed as having a less than 0.1% (1 in 1000 year) risk of tidal or fluvial flooding. It benefits from a flood risk management system comprising of a pumped drainage system, flood defences and flood storage areas. The SFRA concluded that if the currently projected effects of climate change materialise (with higher sea levels and increased river flows), but the defence systems are not upgraded from their present form, there will be significant flood risk within the District by the Year 2115. Development within the village will be affected by the outcomes of the Coastal Strategy.
Developers should consider the SHDC SFRA for further site specific information and development should be subject to a site specific FRA.
The site is underlain by clay and it is likely that infiltration SUDS will therefore not be suitable. This should be investigated by the developer. New development will need to ensure post development runoff rates do not exceed pre-development runoff rates and that sufficient attenuation can be provided on site. Discussions with the IDB and/or EA should be sought at an early stage. Details regarding the maintenance of the surface water system should be provided at the site-specific FRA stage.
Table 8-6: Fleet
Water Resources Wastewater Treatment and Transmission Ecology Flood Risk Management Surface Water Management & SuDS
Potential
The Lincolnshire and Fens WRZ is forecast to have a deficit of available water against target headroom from early in the planning period, for the Bourne planning zone this is 6.83 Ml/d. AWS’s WRMP gives a number of proposed schemes to meet the deficit.
Calculations indicate that the ‘business as usual’ projection (Projection 1) of metered water consumption would require between 1.73 and 3.73 Ml/d by 2026. This compares with the recommended policy projection (Projection 5), which would require between 1.28 and 2.76 Ml/d by 2026.
This outline assessment has found that Holbeach WwTW has volumetric capacity to accommodate housing scenarios 1 and 2 within the limits of the current consent conditions. However, to accommodate housing scenario 3 it will need to increase in DWF consent (see Table 5-5).
The shortfall in volumetric capacity is small (49 m
3/day for scenario 3) and is therefore likely to
occur towards the end of the plan period (2020-2026).
The site lies upstream of the Wash & North Norfolk coast Natura 2000 site. However, any increases in flow from Holbeach WwTW would be unlikely to lead to a significant adverse effect on The Wash SPA/Ramsar site or Wash & North Norfolk Coast SAC.
Fleet lies entirely within EA Flood Zone 3 and has therefore been assessed as having greater than a 0.5% (1 in 200 year) of flooding from tidal sources. Development within the village will be affected by the outcomes of the Coastal Strategy.
Developers should consider the SHDC SFRA for further site specific information and development should be subject to a site specific FRA.
The site is underlain by clay and it is likely that infiltration SUDS will therefore not be suitable. This should be investigated by the developer. New development will need to ensure post development runoff rates do not exceed pre-development runoff rates and that sufficient attenuation can be provided on site. Discussions with the IDB and/or EA should be sought at an early stage. Details regarding the maintenance of the surface water system should be provided at the site-specific FRA stage.
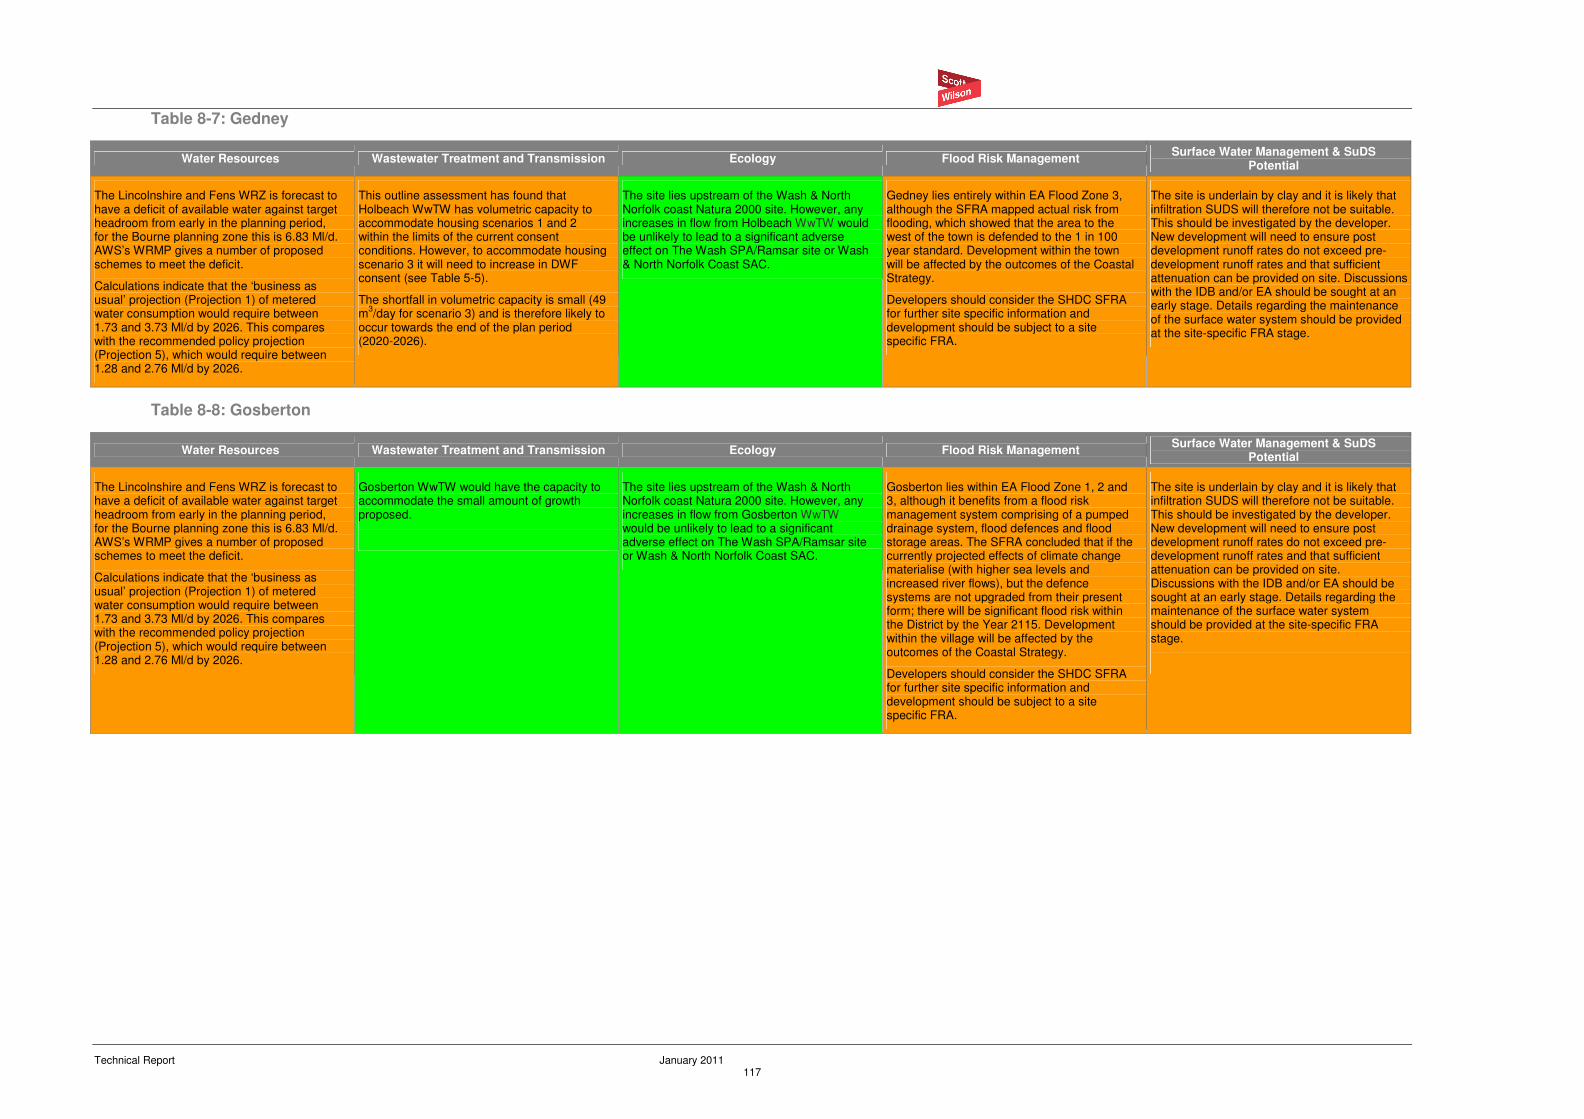
Technical Report January 2011 117
Table 8-7: Gedney
Water Resources Wastewater Treatment and Transmission Ecology Flood Risk Management Surface Water Management & SuDS
Potential
The Lincolnshire and Fens WRZ is forecast to have a deficit of available water against target headroom from early in the planning period, for the Bourne planning zone this is 6.83 Ml/d. AWS’s WRMP gives a number of proposed schemes to meet the deficit.
Calculations indicate that the ‘business as usual’ projection (Projection 1) of metered water consumption would require between 1.73 and 3.73 Ml/d by 2026. This compares with the recommended policy projection (Projection 5), which would require between 1.28 and 2.76 Ml/d by 2026.
This outline assessment has found that Holbeach WwTW has volumetric capacity to accommodate housing scenarios 1 and 2 within the limits of the current consent conditions. However, to accommodate housing scenario 3 it will need to increase in DWF consent (see Table 5-5).
The shortfall in volumetric capacity is small (49 m
3/day for scenario 3) and is therefore likely to
occur towards the end of the plan period (2020-2026).
The site lies upstream of the Wash & North Norfolk coast Natura 2000 site. However, any increases in flow from Holbeach WwTW would be unlikely to lead to a significant adverse effect on The Wash SPA/Ramsar site or Wash & North Norfolk Coast SAC.
Gedney lies entirely within EA Flood Zone 3, although the SFRA mapped actual risk from flooding, which showed that the area to the west of the town is defended to the 1 in 100 year standard. Development within the town will be affected by the outcomes of the Coastal Strategy.
Developers should consider the SHDC SFRA for further site specific information and development should be subject to a site specific FRA.
The site is underlain by clay and it is likely that infiltration SUDS will therefore not be suitable. This should be investigated by the developer. New development will need to ensure post development runoff rates do not exceed pre-development runoff rates and that sufficient attenuation can be provided on site. Discussions with the IDB and/or EA should be sought at an early stage. Details regarding the maintenance of the surface water system should be provided at the site-specific FRA stage.
Table 8-8: Gosberton
Water Resources Wastewater Treatment and Transmission Ecology Flood Risk Management Surface Water Management & SuDS
Potential
The Lincolnshire and Fens WRZ is forecast to have a deficit of available water against target headroom from early in the planning period, for the Bourne planning zone this is 6.83 Ml/d. AWS’s WRMP gives a number of proposed schemes to meet the deficit.
Calculations indicate that the ‘business as usual’ projection (Projection 1) of metered water consumption would require between 1.73 and 3.73 Ml/d by 2026. This compares with the recommended policy projection (Projection 5), which would require between 1.28 and 2.76 Ml/d by 2026.
Gosberton WwTW would have the capacity to accommodate the small amount of growth proposed.
The site lies upstream of the Wash & North Norfolk coast Natura 2000 site. However, any increases in flow from Gosberton WwTW would be unlikely to lead to a significant adverse effect on The Wash SPA/Ramsar site or Wash & North Norfolk Coast SAC.
Gosberton lies within EA Flood Zone 1, 2 and 3, although it benefits from a flood risk management system comprising of a pumped drainage system, flood defences and flood storage areas. The SFRA concluded that if the currently projected effects of climate change materialise (with higher sea levels and increased river flows), but the defence systems are not upgraded from their present form; there will be significant flood risk within the District by the Year 2115. Development within the village will be affected by the outcomes of the Coastal Strategy.
Developers should consider the SHDC SFRA for further site specific information and development should be subject to a site specific FRA.
The site is underlain by clay and it is likely that infiltration SUDS will therefore not be suitable. This should be investigated by the developer. New development will need to ensure post development runoff rates do not exceed pre-development runoff rates and that sufficient attenuation can be provided on site. Discussions with the IDB and/or EA should be sought at an early stage. Details regarding the maintenance of the surface water system should be provided at the site-specific FRA stage.
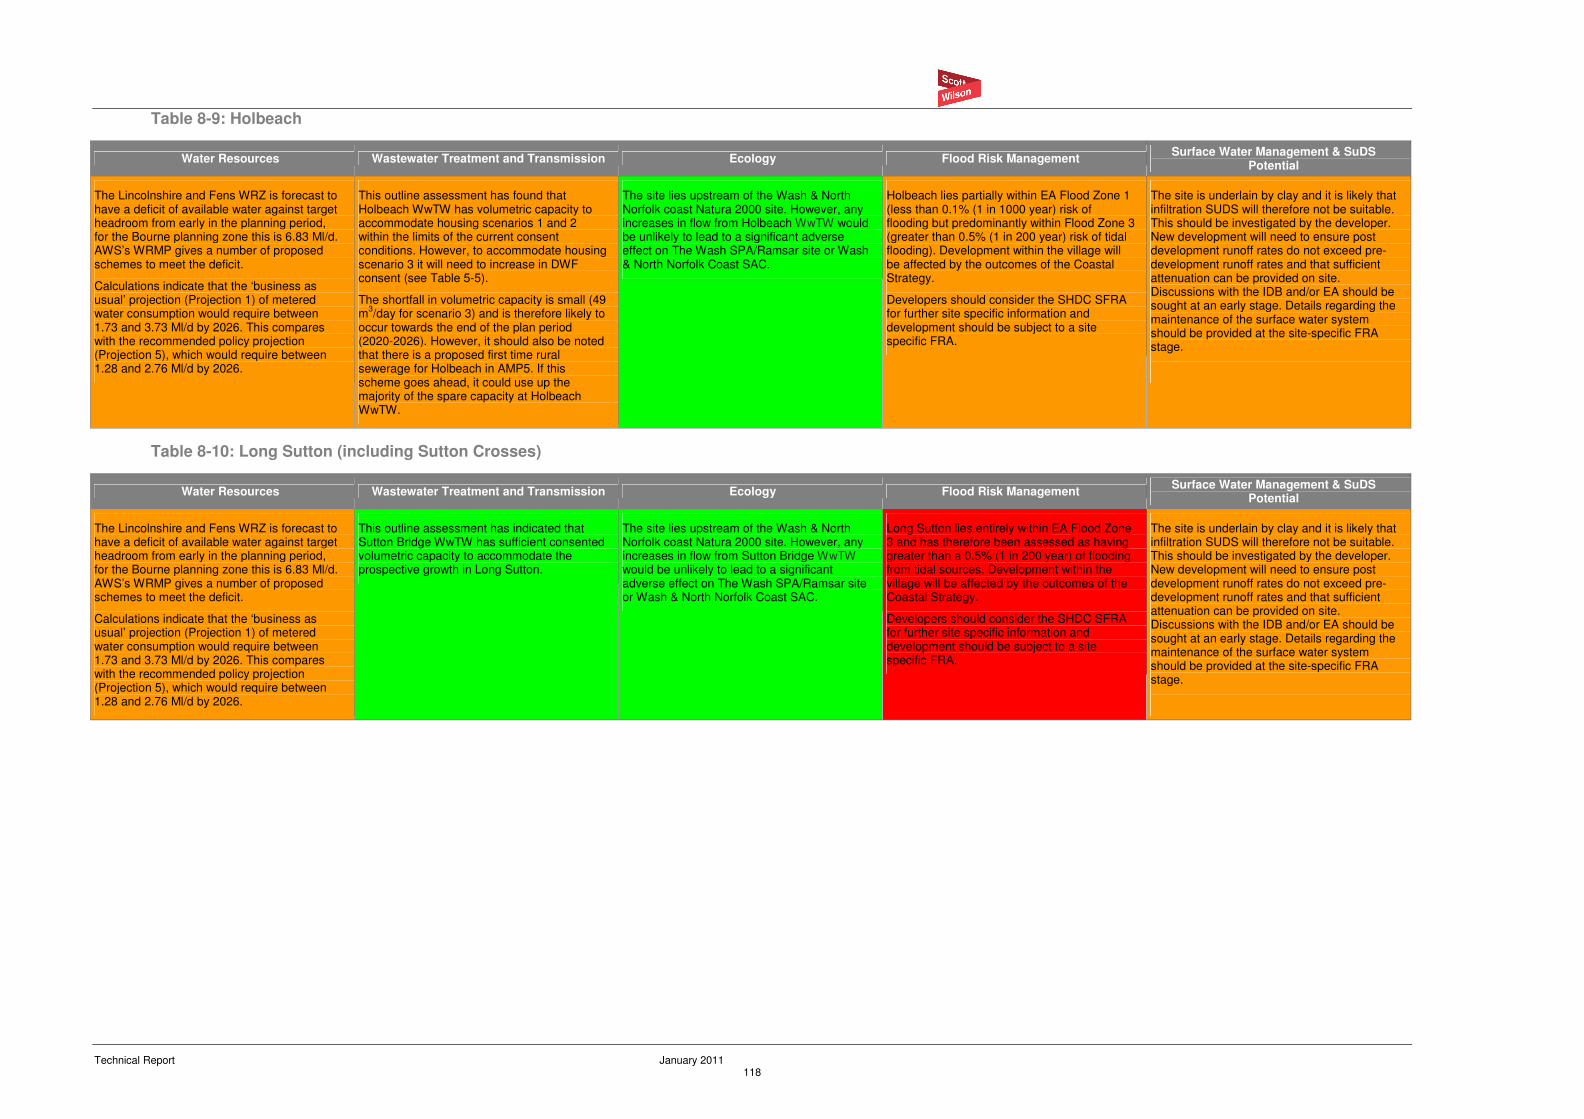
Technical Report January 2011 118
Table 8-9: Holbeach
Water Resources Wastewater Treatment and Transmission Ecology Flood Risk Management Surface Water Management & SuDS
Potential
The Lincolnshire and Fens WRZ is forecast to have a deficit of available water against target headroom from early in the planning period, for the Bourne planning zone this is 6.83 Ml/d. AWS’s WRMP gives a number of proposed schemes to meet the deficit.
Calculations indicate that the ‘business as usual’ projection (Projection 1) of metered water consumption would require between 1.73 and 3.73 Ml/d by 2026. This compares with the recommended policy projection (Projection 5), which would require between 1.28 and 2.76 Ml/d by 2026.
This outline assessment has found that Holbeach WwTW has volumetric capacity to accommodate housing scenarios 1 and 2 within the limits of the current consent conditions. However, to accommodate housing scenario 3 it will need to increase in DWF consent (see Table 5-5).
The shortfall in volumetric capacity is small (49 m
3/day for scenario 3) and is therefore likely to
occur towards the end of the plan period (2020-2026). However, it should also be noted that there is a proposed first time rural sewerage for Holbeach in AMP5. If this scheme goes ahead, it could use up the majority of the spare capacity at Holbeach WwTW.
The site lies upstream of the Wash & North Norfolk coast Natura 2000 site. However, any increases in flow from Holbeach WwTW would be unlikely to lead to a significant adverse effect on The Wash SPA/Ramsar site or Wash & North Norfolk Coast SAC.
Holbeach lies partially within EA Flood Zone 1 (less than 0.1% (1 in 1000 year) risk of flooding but predominantly within Flood Zone 3 (greater than 0.5% (1 in 200 year) risk of tidal flooding). Development within the village will be affected by the outcomes of the Coastal Strategy.
Developers should consider the SHDC SFRA for further site specific information and development should be subject to a site specific FRA.
The site is underlain by clay and it is likely that infiltration SUDS will therefore not be suitable. This should be investigated by the developer. New development will need to ensure post development runoff rates do not exceed pre-development runoff rates and that sufficient attenuation can be provided on site. Discussions with the IDB and/or EA should be sought at an early stage. Details regarding the maintenance of the surface water system should be provided at the site-specific FRA stage.
Table 8-10: Long Sutton (including Sutton Crosses)
Water Resources Wastewater Treatment and Transmission Ecology Flood Risk Management Surface Water Management & SuDS
Potential
The Lincolnshire and Fens WRZ is forecast to have a deficit of available water against target headroom from early in the planning period, for the Bourne planning zone this is 6.83 Ml/d. AWS’s WRMP gives a number of proposed schemes to meet the deficit.
Calculations indicate that the ‘business as usual’ projection (Projection 1) of metered water consumption would require between 1.73 and 3.73 Ml/d by 2026. This compares with the recommended policy projection (Projection 5), which would require between 1.28 and 2.76 Ml/d by 2026.
This outline assessment has indicated that Sutton Bridge WwTW has sufficient consented volumetric capacity to accommodate the prospective growth in Long Sutton.
The site lies upstream of the Wash & North Norfolk coast Natura 2000 site. However, any increases in flow from Sutton Bridge WwTW would be unlikely to lead to a significant adverse effect on The Wash SPA/Ramsar site or Wash & North Norfolk Coast SAC.
Long Sutton lies entirely within EA Flood Zone 3 and has therefore been assessed as having greater than a 0.5% (1 in 200 year) of flooding from tidal sources. Development within the village will be affected by the outcomes of the Coastal Strategy.
Developers should consider the SHDC SFRA for further site specific information and development should be subject to a site specific FRA.
The site is underlain by clay and it is likely that infiltration SUDS will therefore not be suitable. This should be investigated by the developer. New development will need to ensure post development runoff rates do not exceed pre-development runoff rates and that sufficient attenuation can be provided on site. Discussions with the IDB and/or EA should be sought at an early stage. Details regarding the maintenance of the surface water system should be provided at the site-specific FRA stage.
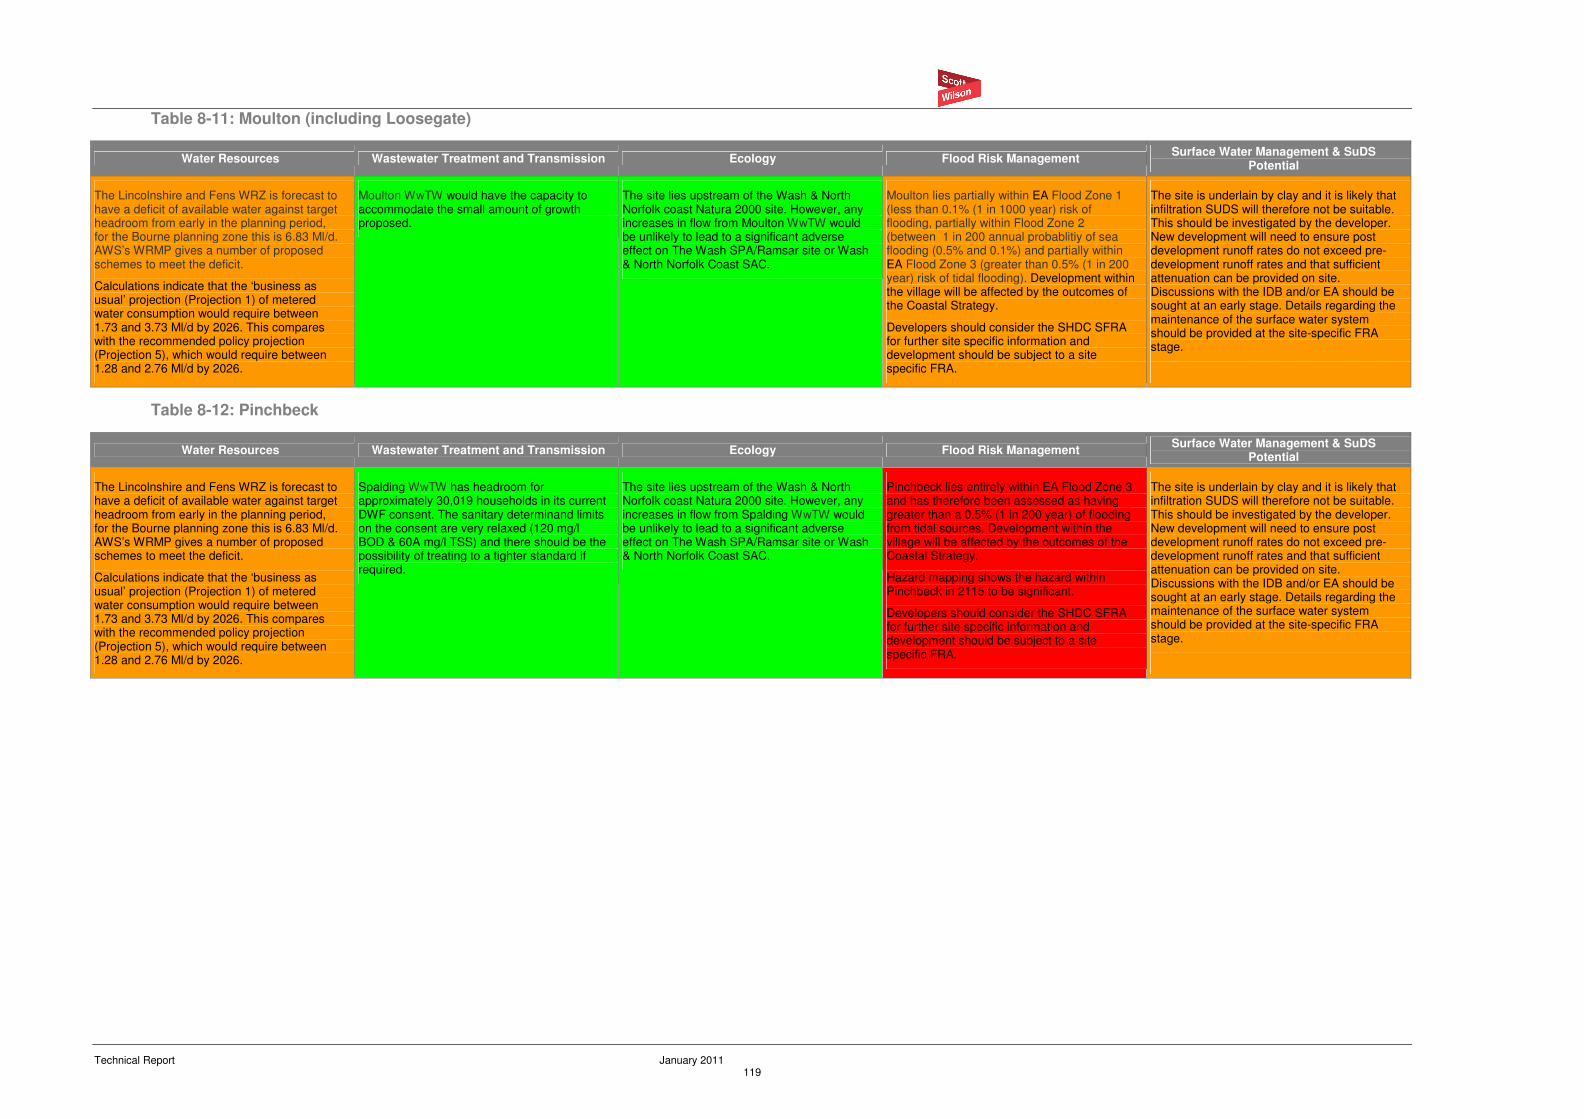
Technical Report January 2011 119
Table 8-11: Moulton (including Loosegate)
Water Resources Wastewater Treatment and Transmission Ecology Flood Risk Management Surface Water Management & SuDS
Potential
The Lincolnshire and Fens WRZ is forecast to have a deficit of available water against target headroom from early in the planning period, for the Bourne planning zone this is 6.83 Ml/d. AWS’s WRMP gives a number of proposed schemes to meet the deficit.
Calculations indicate that the ‘business as usual’ projection (Projection 1) of metered water consumption would require between 1.73 and 3.73 Ml/d by 2026. This compares with the recommended policy projection (Projection 5), which would require between 1.28 and 2.76 Ml/d by 2026.
Moulton WwTW would have the capacity to accommodate the small amount of growth proposed.
The site lies upstream of the Wash & North Norfolk coast Natura 2000 site. However, any increases in flow from Moulton WwTW would be unlikely to lead to a significant adverse effect on The Wash SPA/Ramsar site or Wash & North Norfolk Coast SAC.
Moulton lies partially within EA Flood Zone 1 (less than 0.1% (1 in 1000 year) risk of flooding, partially within Flood Zone 2 (between 1 in 200 annual probablitiy of sea flooding (0.5% and 0.1%) and partially within EA Flood Zone 3 (greater than 0.5% (1 in 200 year) risk of tidal flooding). Development within the village will be affected by the outcomes of the Coastal Strategy.
Developers should consider the SHDC SFRA for further site specific information and development should be subject to a site specific FRA.
The site is underlain by clay and it is likely that infiltration SUDS will therefore not be suitable. This should be investigated by the developer. New development will need to ensure post development runoff rates do not exceed pre-development runoff rates and that sufficient attenuation can be provided on site. Discussions with the IDB and/or EA should be sought at an early stage. Details regarding the maintenance of the surface water system should be provided at the site-specific FRA stage.
Table 8-12: Pinchbeck
Water Resources Wastewater Treatment and Transmission Ecology Flood Risk Management Surface Water Management & SuDS
Potential
The Lincolnshire and Fens WRZ is forecast to have a deficit of available water against target headroom from early in the planning period, for the Bourne planning zone this is 6.83 Ml/d. AWS’s WRMP gives a number of proposed schemes to meet the deficit.
Calculations indicate that the ‘business as usual’ projection (Projection 1) of metered water consumption would require between 1.73 and 3.73 Ml/d by 2026. This compares with the recommended policy projection (Projection 5), which would require between 1.28 and 2.76 Ml/d by 2026.
Spalding WwTW has headroom for approximately 30,019 households in its current DWF consent. The sanitary determinand limits on the consent are very relaxed (120 mg/l BOD & 60A mg/l TSS) and there should be the possibility of treating to a tighter standard if required.
The site lies upstream of the Wash & North Norfolk coast Natura 2000 site. However, any increases in flow from Spalding WwTW would be unlikely to lead to a significant adverse effect on The Wash SPA/Ramsar site or Wash & North Norfolk Coast SAC.
Pinchbeck lies entirely within EA Flood Zone 3 and has therefore been assessed as having greater than a 0.5% (1 in 200 year) of flooding from tidal sources. Development within the village will be affected by the outcomes of the Coastal Strategy.
Hazard mapping shows the hazard within Pinchbeck in 2115 to be significant.
Developers should consider the SHDC SFRA for further site specific information and development should be subject to a site specific FRA.
The site is underlain by clay and it is likely that infiltration SUDS will therefore not be suitable. This should be investigated by the developer. New development will need to ensure post development runoff rates do not exceed pre-development runoff rates and that sufficient attenuation can be provided on site. Discussions with the IDB and/or EA should be sought at an early stage. Details regarding the maintenance of the surface water system should be provided at the site-specific FRA stage.
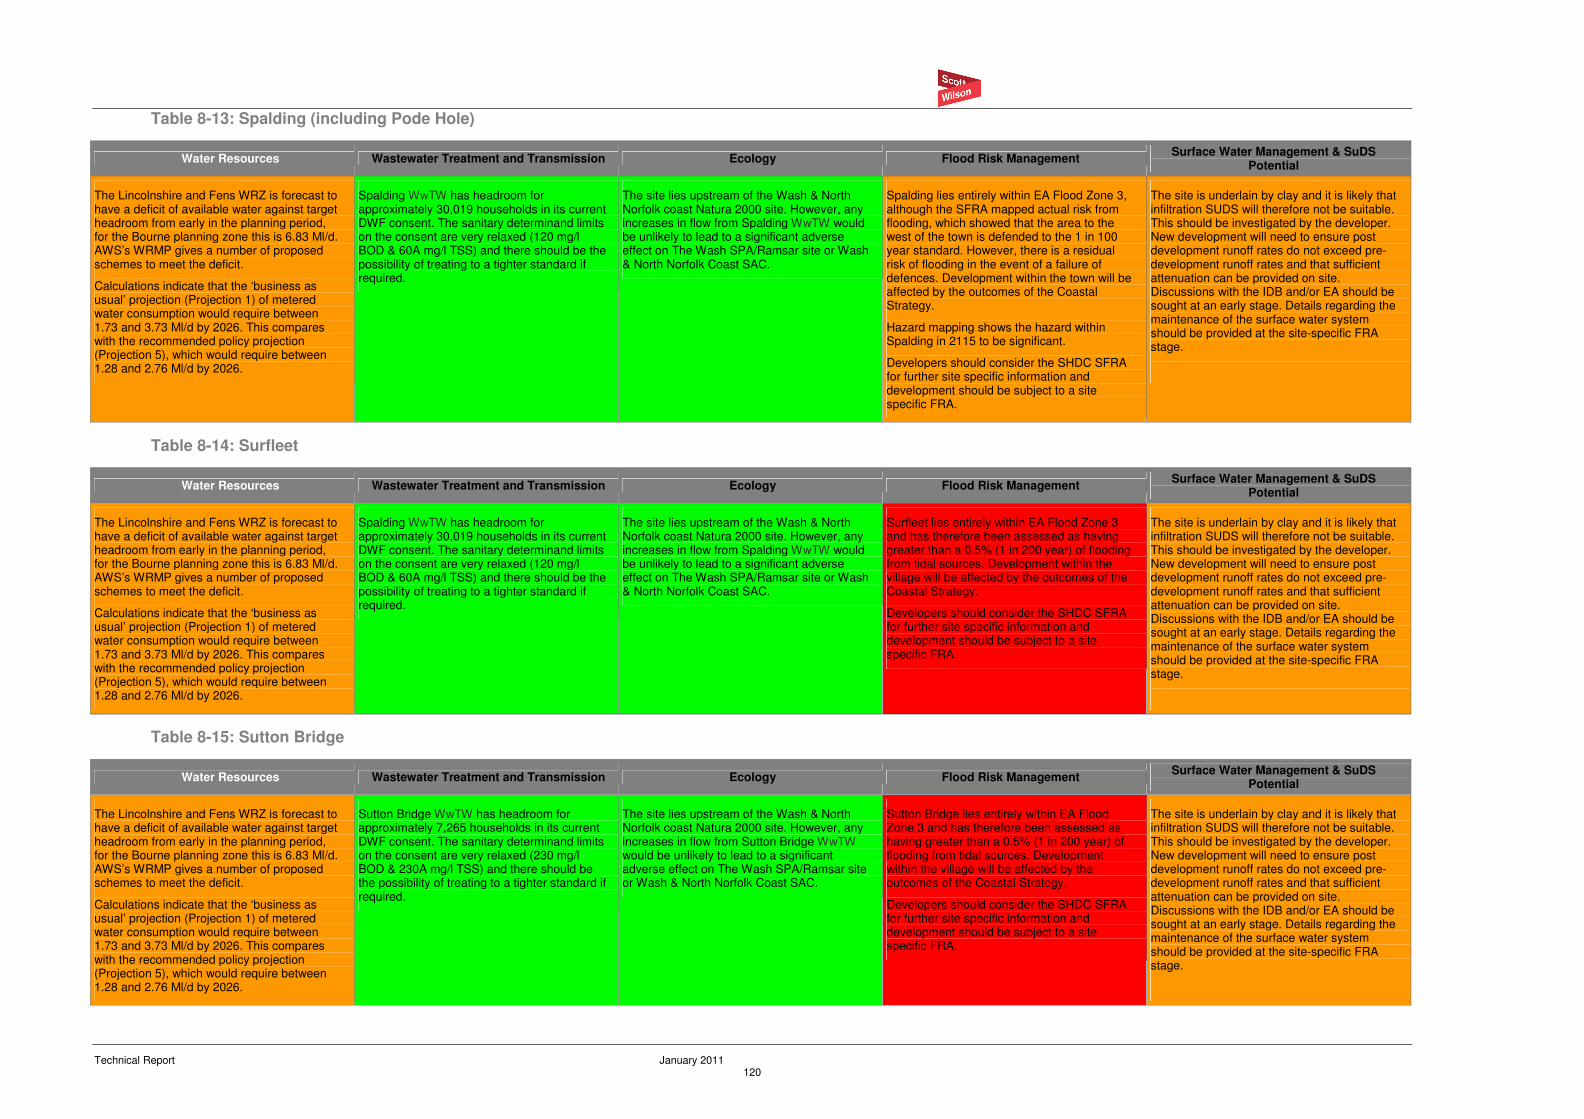
Technical Report January 2011 120
Table 8-13: Spalding (including Pode Hole)
Water Resources Wastewater Treatment and Transmission Ecology Flood Risk Management Surface Water Management & SuDS
Potential
The Lincolnshire and Fens WRZ is forecast to have a deficit of available water against target headroom from early in the planning period, for the Bourne planning zone this is 6.83 Ml/d. AWS’s WRMP gives a number of proposed schemes to meet the deficit.
Calculations indicate that the ‘business as usual’ projection (Projection 1) of metered water consumption would require between 1.73 and 3.73 Ml/d by 2026. This compares with the recommended policy projection (Projection 5), which would require between 1.28 and 2.76 Ml/d by 2026.
Spalding WwTW has headroom for approximately 30,019 households in its current DWF consent. The sanitary determinand limits on the consent are very relaxed (120 mg/l BOD & 60A mg/l TSS) and there should be the possibility of treating to a tighter standard if required.
The site lies upstream of the Wash & North Norfolk coast Natura 2000 site. However, any increases in flow from Spalding WwTW would be unlikely to lead to a significant adverse effect on The Wash SPA/Ramsar site or Wash & North Norfolk Coast SAC.
Spalding lies entirely within EA Flood Zone 3, although the SFRA mapped actual risk from flooding, which showed that the area to the west of the town is defended to the 1 in 100 year standard. However, there is a residual risk of flooding in the event of a failure of defences. Development within the town will be affected by the outcomes of the Coastal Strategy.
Hazard mapping shows the hazard within Spalding in 2115 to be significant.
Developers should consider the SHDC SFRA for further site specific information and development should be subject to a site specific FRA.
The site is underlain by clay and it is likely that infiltration SUDS will therefore not be suitable. This should be investigated by the developer. New development will need to ensure post development runoff rates do not exceed pre-development runoff rates and that sufficient attenuation can be provided on site. Discussions with the IDB and/or EA should be sought at an early stage. Details regarding the maintenance of the surface water system should be provided at the site-specific FRA stage.
Table 8-14: Surfleet
Water Resources Wastewater Treatment and Transmission Ecology Flood Risk Management Surface Water Management & SuDS
Potential
The Lincolnshire and Fens WRZ is forecast to have a deficit of available water against target headroom from early in the planning period, for the Bourne planning zone this is 6.83 Ml/d. AWS’s WRMP gives a number of proposed schemes to meet the deficit.
Calculations indicate that the ‘business as usual’ projection (Projection 1) of metered water consumption would require between 1.73 and 3.73 Ml/d by 2026. This compares with the recommended policy projection (Projection 5), which would require between 1.28 and 2.76 Ml/d by 2026.
Spalding WwTW has headroom for approximately 30,019 households in its current DWF consent. The sanitary determinand limits on the consent are very relaxed (120 mg/l BOD & 60A mg/l TSS) and there should be the possibility of treating to a tighter standard if required.
The site lies upstream of the Wash & North Norfolk coast Natura 2000 site. However, any increases in flow from Spalding WwTW would be unlikely to lead to a significant adverse effect on The Wash SPA/Ramsar site or Wash & North Norfolk Coast SAC.
Surfleet lies entirely within EA Flood Zone 3 and has therefore been assessed as having greater than a 0.5% (1 in 200 year) of flooding from tidal sources. Development within the village will be affected by the outcomes of the Coastal Strategy.
Developers should consider the SHDC SFRA for further site specific information and development should be subject to a site specific FRA.
The site is underlain by clay and it is likely that infiltration SUDS will therefore not be suitable. This should be investigated by the developer. New development will need to ensure post development runoff rates do not exceed pre-development runoff rates and that sufficient attenuation can be provided on site. Discussions with the IDB and/or EA should be sought at an early stage. Details regarding the maintenance of the surface water system should be provided at the site-specific FRA stage.
Table 8-15: Sutton Bridge
Water Resources Wastewater Treatment and Transmission Ecology Flood Risk Management Surface Water Management & SuDS
Potential
The Lincolnshire and Fens WRZ is forecast to have a deficit of available water against target headroom from early in the planning period, for the Bourne planning zone this is 6.83 Ml/d. AWS’s WRMP gives a number of proposed schemes to meet the deficit.
Calculations indicate that the ‘business as usual’ projection (Projection 1) of metered water consumption would require between 1.73 and 3.73 Ml/d by 2026. This compares with the recommended policy projection (Projection 5), which would require between 1.28 and 2.76 Ml/d by 2026.
Sutton Bridge WwTW has headroom for approximately 7,265 households in its current DWF consent. The sanitary determinand limits on the consent are very relaxed (230 mg/l BOD & 230A mg/l TSS) and there should be the possibility of treating to a tighter standard if required.
The site lies upstream of the Wash & North Norfolk coast Natura 2000 site. However, any increases in flow from Sutton Bridge WwTW would be unlikely to lead to a significant adverse effect on The Wash SPA/Ramsar site or Wash & North Norfolk Coast SAC.
Sutton Bridge lies entirely within EA Flood Zone 3 and has therefore been assessed as having greater than a 0.5% (1 in 200 year) of flooding from tidal sources. Development within the village will be affected by the outcomes of the Coastal Strategy.
Developers should consider the SHDC SFRA for further site specific information and development should be subject to a site specific FRA.
The site is underlain by clay and it is likely that infiltration SUDS will therefore not be suitable. This should be investigated by the developer. New development will need to ensure post development runoff rates do not exceed pre-development runoff rates and that sufficient attenuation can be provided on site. Discussions with the IDB and/or EA should be sought at an early stage. Details regarding the maintenance of the surface water system should be provided at the site-specific FRA stage.
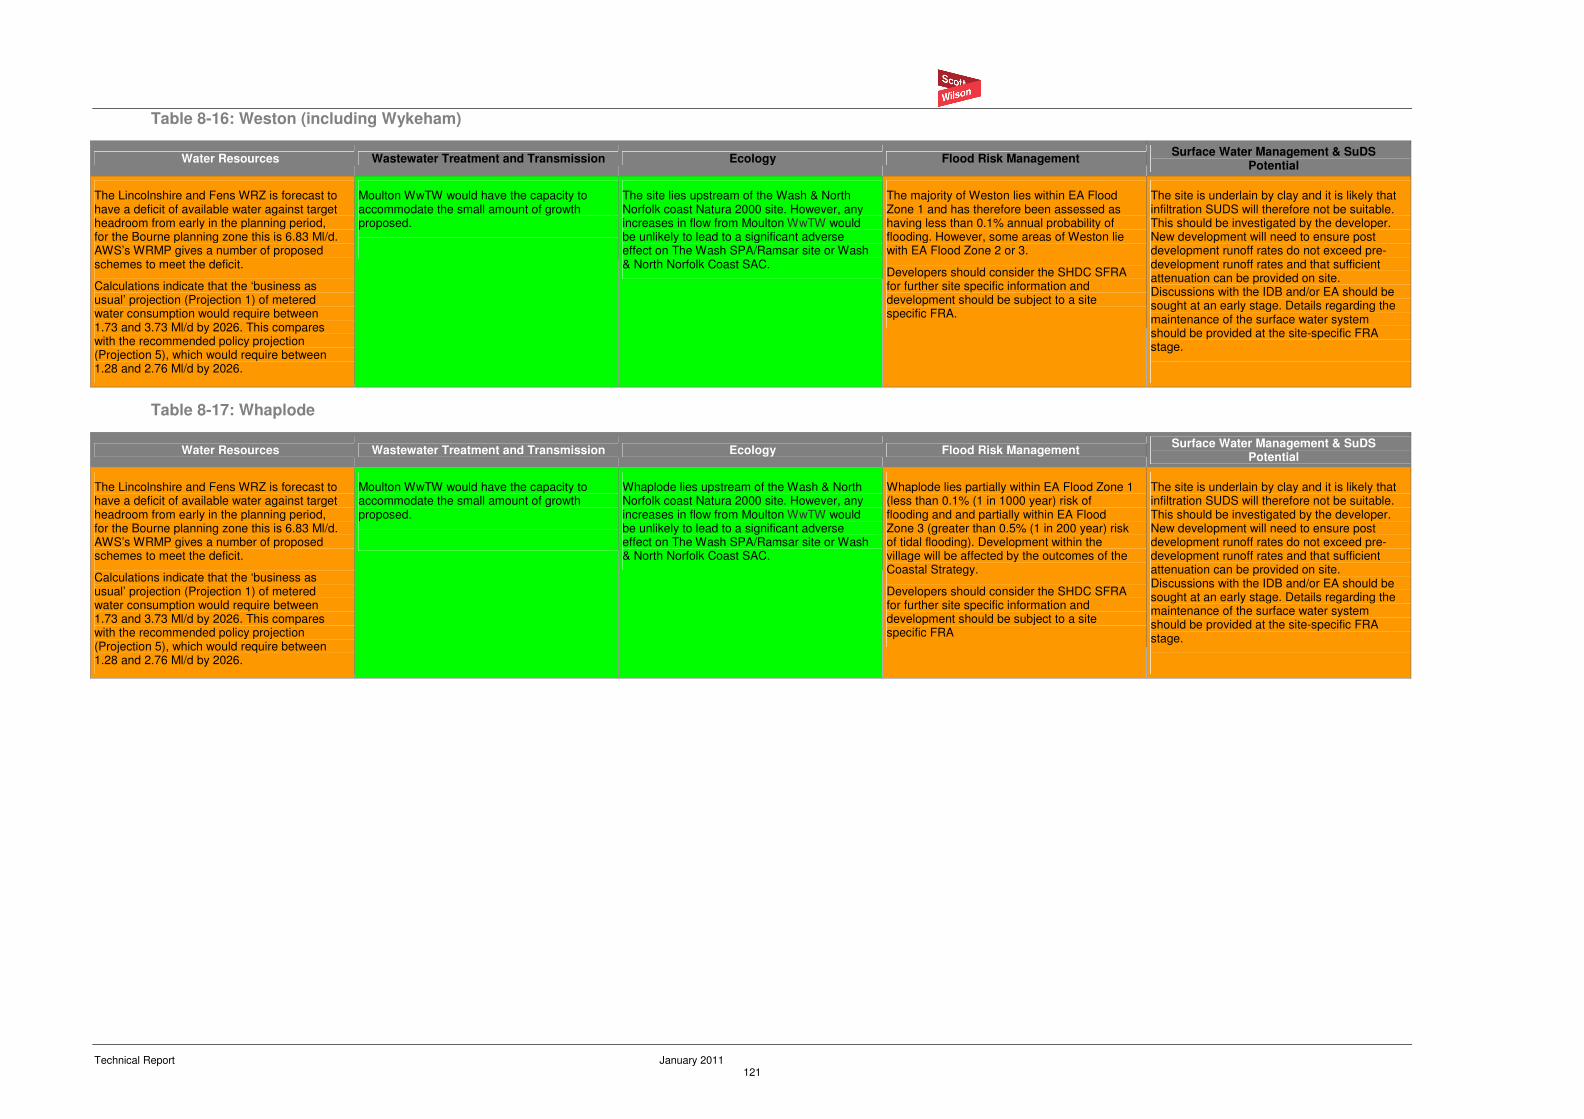
Technical Report January 2011 121
Table 8-16: Weston (including Wykeham)
Water Resources Wastewater Treatment and Transmission Ecology Flood Risk Management Surface Water Management & SuDS
Potential
The Lincolnshire and Fens WRZ is forecast to have a deficit of available water against target headroom from early in the planning period, for the Bourne planning zone this is 6.83 Ml/d. AWS’s WRMP gives a number of proposed schemes to meet the deficit.
Calculations indicate that the ‘business as usual’ projection (Projection 1) of metered water consumption would require between 1.73 and 3.73 Ml/d by 2026. This compares with the recommended policy projection (Projection 5), which would require between 1.28 and 2.76 Ml/d by 2026.
Moulton WwTW would have the capacity to accommodate the small amount of growth proposed.
The site lies upstream of the Wash & North Norfolk coast Natura 2000 site. However, any increases in flow from Moulton WwTW would be unlikely to lead to a significant adverse effect on The Wash SPA/Ramsar site or Wash & North Norfolk Coast SAC.
The majority of Weston lies within EA Flood Zone 1 and has therefore been assessed as having less than 0.1% annual probability of flooding. However, some areas of Weston lie with EA Flood Zone 2 or 3.
Developers should consider the SHDC SFRA for further site specific information and development should be subject to a site specific FRA.
The site is underlain by clay and it is likely that infiltration SUDS will therefore not be suitable. This should be investigated by the developer. New development will need to ensure post development runoff rates do not exceed pre-development runoff rates and that sufficient attenuation can be provided on site. Discussions with the IDB and/or EA should be sought at an early stage. Details regarding the maintenance of the surface water system should be provided at the site-specific FRA stage.
Table 8-17: Whaplode
Water Resources Wastewater Treatment and Transmission Ecology Flood Risk Management Surface Water Management & SuDS
Potential
The Lincolnshire and Fens WRZ is forecast to have a deficit of available water against target headroom from early in the planning period, for the Bourne planning zone this is 6.83 Ml/d. AWS’s WRMP gives a number of proposed schemes to meet the deficit.
Calculations indicate that the ‘business as usual’ projection (Projection 1) of metered water consumption would require between 1.73 and 3.73 Ml/d by 2026. This compares with the recommended policy projection (Projection 5), which would require between 1.28 and 2.76 Ml/d by 2026.
Moulton WwTW would have the capacity to accommodate the small amount of growth proposed.
Whaplode lies upstream of the Wash & North Norfolk coast Natura 2000 site. However, any increases in flow from Moulton WwTW would be unlikely to lead to a significant adverse effect on The Wash SPA/Ramsar site or Wash & North Norfolk Coast SAC.
Whaplode lies partially within EA Flood Zone 1 (less than 0.1% (1 in 1000 year) risk of flooding and and partially within EA Flood Zone 3 (greater than 0.5% (1 in 200 year) risk of tidal flooding). Development within the village will be affected by the outcomes of the Coastal Strategy.
Developers should consider the SHDC SFRA for further site specific information and development should be subject to a site specific FRA
The site is underlain by clay and it is likely that infiltration SUDS will therefore not be suitable. This should be investigated by the developer. New development will need to ensure post development runoff rates do not exceed pre-development runoff rates and that sufficient attenuation can be provided on site. Discussions with the IDB and/or EA should be sought at an early stage. Details regarding the maintenance of the surface water system should be provided at the site-specific FRA stage.
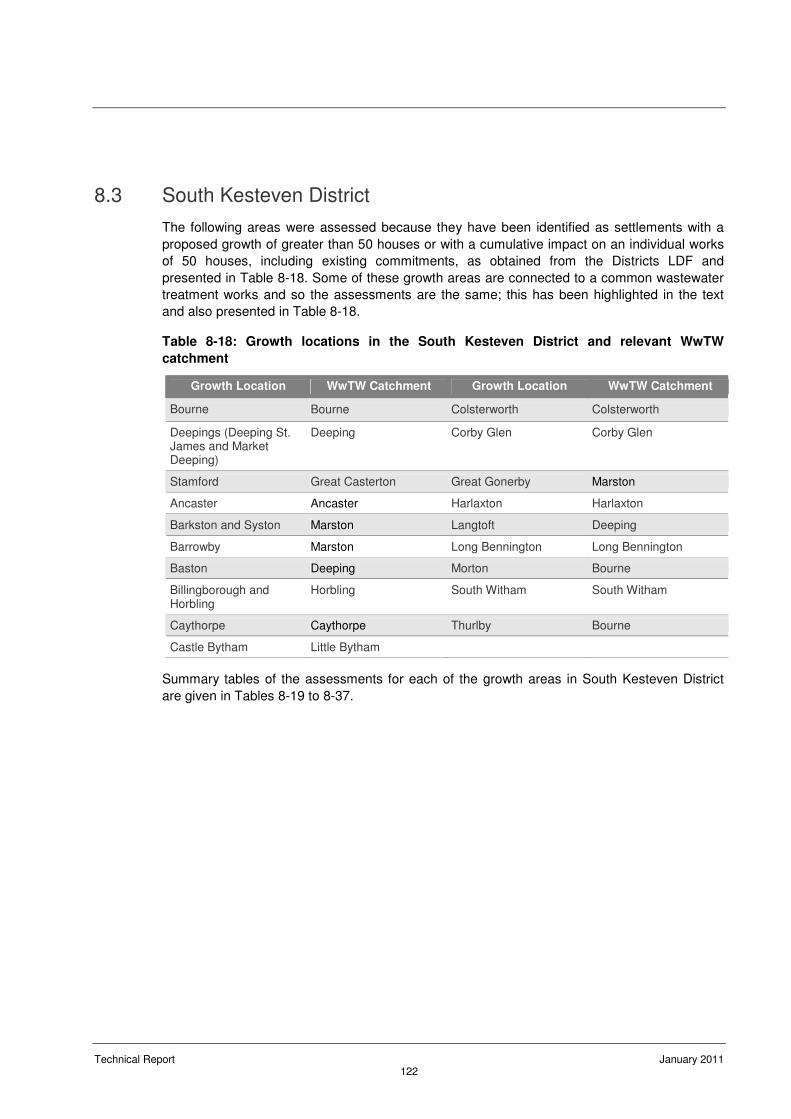
Technical Report January 2011 122
8.3 South Kesteven District
The following areas were assessed because they have been identified as settlements with a
proposed growth of greater than 50 houses or with a cumulative impact on an individual works
of 50 houses, including existing commitments, as obtained from the Districts LDF and
presented in Table 8-18. Some of these growth areas are connected to a common wastewater
treatment works and so the assessments are the same; this has been highlighted in the text
and also presented in Table 8-18.
Table 8-18: Growth locations in the South Kesteven District and relevant WwTW
catchment
Growth Location WwTW Catchment Growth Location WwTW Catchment
Bourne Bourne Colsterworth Colsterworth
Deepings (Deeping St. James and Market Deeping)
Deeping Corby Glen Corby Glen
Stamford Great Casterton Great Gonerby Marston
Ancaster Ancaster Harlaxton Harlaxton
Barkston and Syston Marston Langtoft Deeping
Barrowby Marston Long Bennington Long Bennington
Baston Deeping Morton Bourne
Billingborough and Horbling
Horbling South Witham South Witham
Caythorpe Caythorpe Thurlby Bourne
Castle Bytham Little Bytham
Summary tables of the assessments for each of the growth areas in South Kesteven District
are given in Tables 8-19 to 8-37.
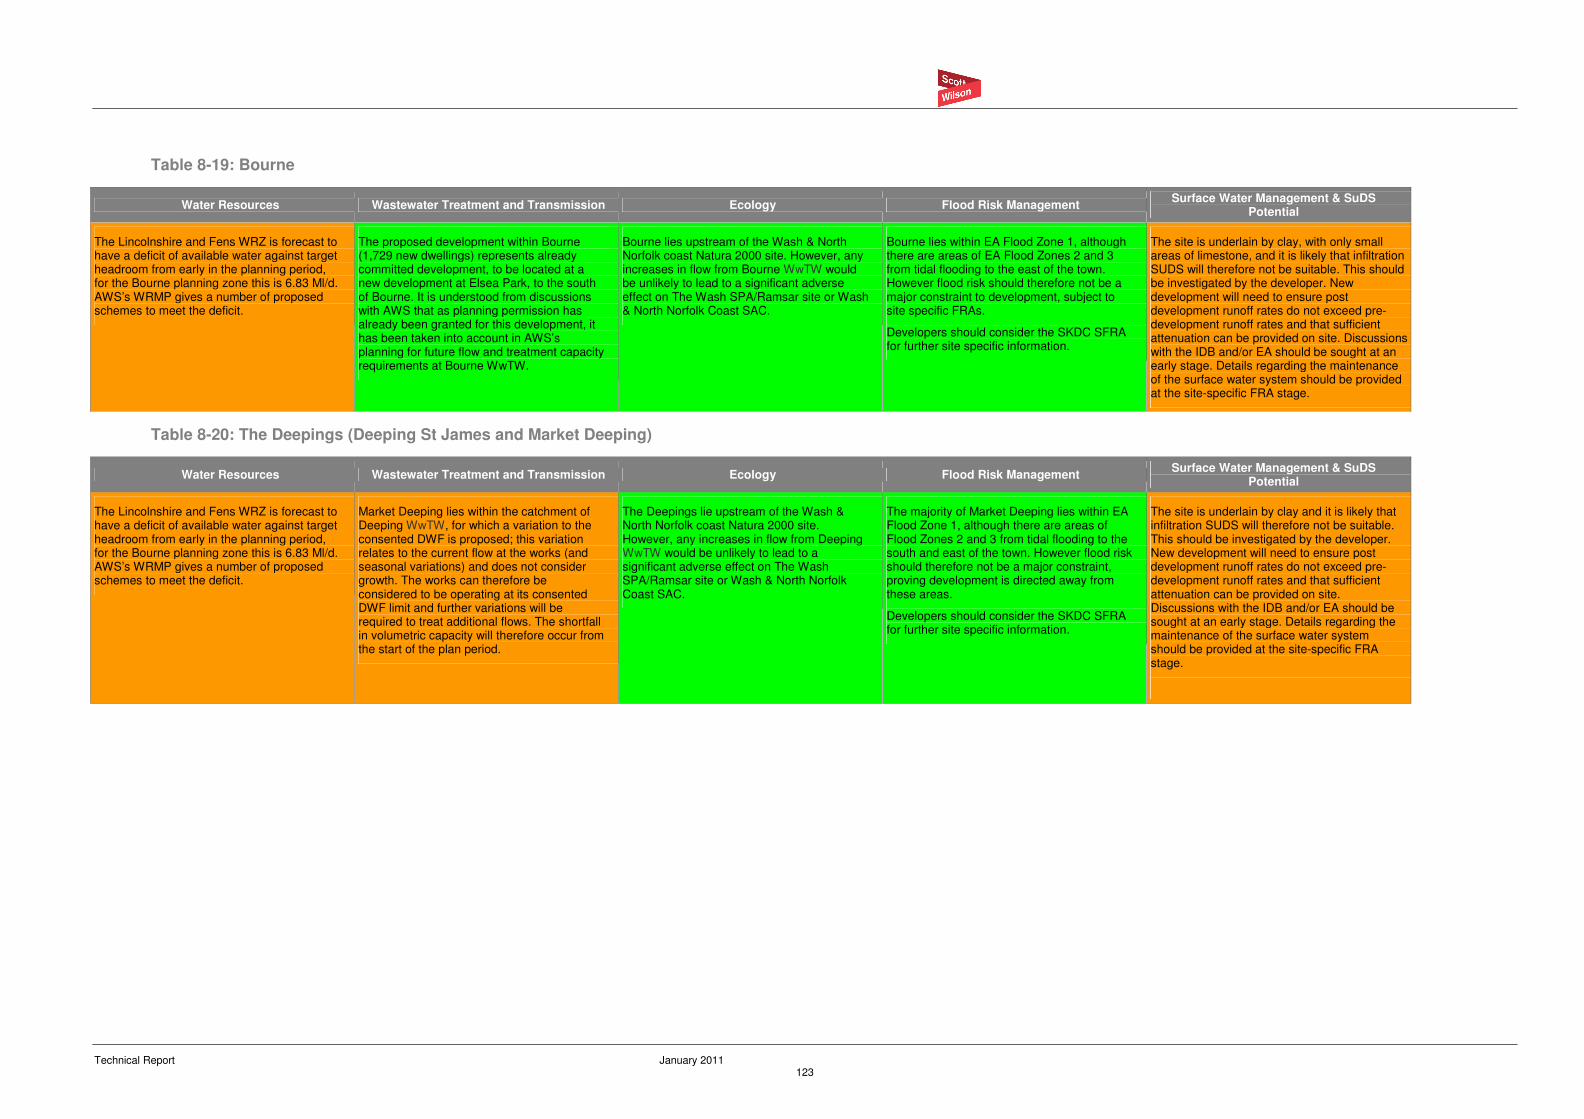
Technical Report January 2011 123
Table 8-19: Bourne
Water Resources Wastewater Treatment and Transmission Ecology Flood Risk Management Surface Water Management & SuDS
Potential
The Lincolnshire and Fens WRZ is forecast to have a deficit of available water against target headroom from early in the planning period, for the Bourne planning zone this is 6.83 Ml/d. AWS’s WRMP gives a number of proposed schemes to meet the deficit.
The proposed development within Bourne (1,729 new dwellings) represents already committed development, to be located at a new development at Elsea Park, to the south of Bourne. It is understood from discussions with AWS that as planning permission has already been granted for this development, it has been taken into account in AWS’s planning for future flow and treatment capacity requirements at Bourne WwTW.
Bourne lies upstream of the Wash & North Norfolk coast Natura 2000 site. However, any increases in flow from Bourne WwTW would be unlikely to lead to a significant adverse effect on The Wash SPA/Ramsar site or Wash & North Norfolk Coast SAC.
Bourne lies within EA Flood Zone 1, although there are areas of EA Flood Zones 2 and 3 from tidal flooding to the east of the town. However flood risk should therefore not be a major constraint to development, subject to site specific FRAs.
Developers should consider the SKDC SFRA for further site specific information.
The site is underlain by clay, with only small areas of limestone, and it is likely that infiltration SUDS will therefore not be suitable. This should be investigated by the developer. New development will need to ensure post development runoff rates do not exceed pre-development runoff rates and that sufficient attenuation can be provided on site. Discussions with the IDB and/or EA should be sought at an early stage. Details regarding the maintenance of the surface water system should be provided at the site-specific FRA stage.
Table 8-20: The Deepings (Deeping St James and Market Deeping)
Water Resources Wastewater Treatment and Transmission Ecology Flood Risk Management Surface Water Management & SuDS
Potential
The Lincolnshire and Fens WRZ is forecast to have a deficit of available water against target headroom from early in the planning period, for the Bourne planning zone this is 6.83 Ml/d. AWS’s WRMP gives a number of proposed schemes to meet the deficit.
Market Deeping lies within the catchment of Deeping WwTW, for which a variation to the consented DWF is proposed; this variation relates to the current flow at the works (and seasonal variations) and does not consider growth. The works can therefore be considered to be operating at its consented DWF limit and further variations will be required to treat additional flows. The shortfall in volumetric capacity will therefore occur from the start of the plan period.
The Deepings lie upstream of the Wash & North Norfolk coast Natura 2000 site. However, any increases in flow from Deeping WwTW would be unlikely to lead to a significant adverse effect on The Wash SPA/Ramsar site or Wash & North Norfolk Coast SAC.
The majority of Market Deeping lies within EA Flood Zone 1, although there are areas of Flood Zones 2 and 3 from tidal flooding to the south and east of the town. However flood risk should therefore not be a major constraint, proving development is directed away from these areas.
Developers should consider the SKDC SFRA for further site specific information.
The site is underlain by clay and it is likely that infiltration SUDS will therefore not be suitable. This should be investigated by the developer. New development will need to ensure post development runoff rates do not exceed pre-development runoff rates and that sufficient attenuation can be provided on site. Discussions with the IDB and/or EA should be sought at an early stage. Details regarding the maintenance of the surface water system should be provided at the site-specific FRA stage.
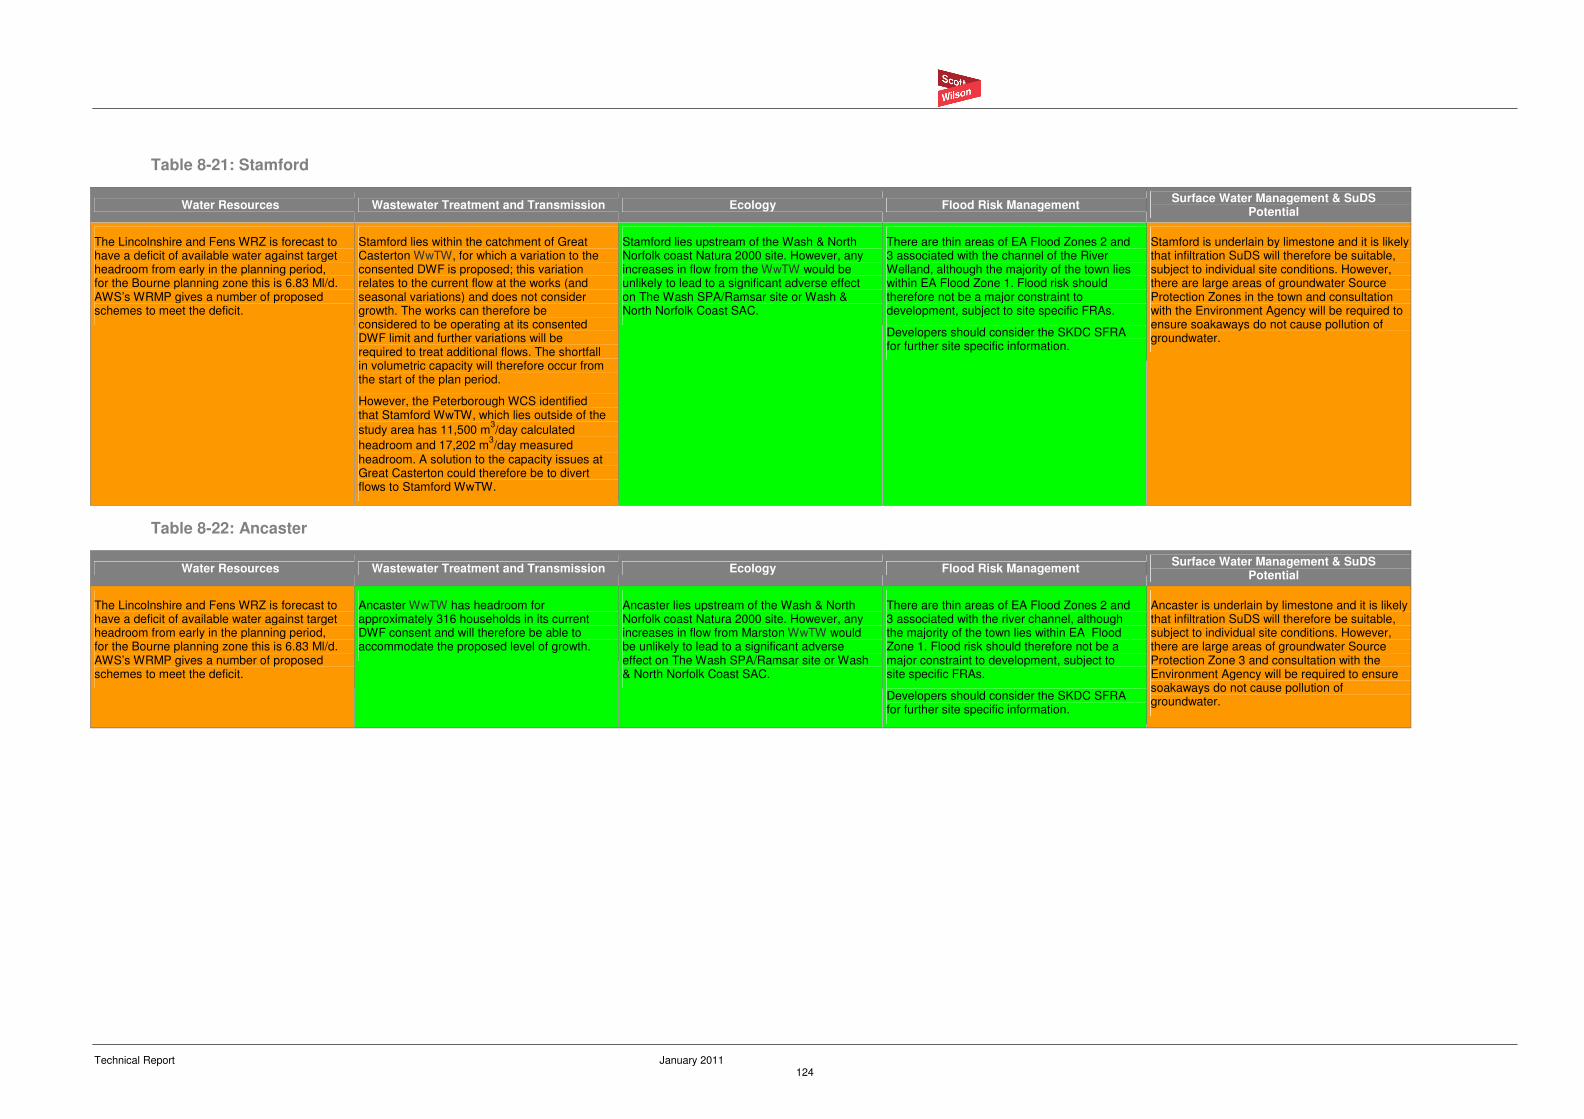
Technical Report January 2011 124
Table 8-21: Stamford
Water Resources Wastewater Treatment and Transmission Ecology Flood Risk Management Surface Water Management & SuDS
Potential
The Lincolnshire and Fens WRZ is forecast to have a deficit of available water against target headroom from early in the planning period, for the Bourne planning zone this is 6.83 Ml/d. AWS’s WRMP gives a number of proposed schemes to meet the deficit.
Stamford lies within the catchment of Great Casterton WwTW, for which a variation to the consented DWF is proposed; this variation relates to the current flow at the works (and seasonal variations) and does not consider growth. The works can therefore be considered to be operating at its consented DWF limit and further variations will be required to treat additional flows. The shortfall in volumetric capacity will therefore occur from the start of the plan period.
However, the Peterborough WCS identified that Stamford WwTW, which lies outside of the
study area has 11,500 m3/day calculated
headroom and 17,202 m3/day measured
headroom. A solution to the capacity issues at Great Casterton could therefore be to divert flows to Stamford WwTW.
Stamford lies upstream of the Wash & North Norfolk coast Natura 2000 site. However, any increases in flow from the WwTW would be unlikely to lead to a significant adverse effect on The Wash SPA/Ramsar site or Wash & North Norfolk Coast SAC.
There are thin areas of EA Flood Zones 2 and 3 associated with the channel of the River Welland, although the majority of the town lies within EA Flood Zone 1. Flood risk should therefore not be a major constraint to development, subject to site specific FRAs.
Developers should consider the SKDC SFRA for further site specific information.
Stamford is underlain by limestone and it is likely that infiltration SuDS will therefore be suitable, subject to individual site conditions. However, there are large areas of groundwater Source Protection Zones in the town and consultation with the Environment Agency will be required to ensure soakaways do not cause pollution of groundwater.
Table 8-22: Ancaster
Water Resources Wastewater Treatment and Transmission Ecology Flood Risk Management Surface Water Management & SuDS
Potential
The Lincolnshire and Fens WRZ is forecast to have a deficit of available water against target headroom from early in the planning period, for the Bourne planning zone this is 6.83 Ml/d. AWS’s WRMP gives a number of proposed schemes to meet the deficit.
Ancaster WwTW has headroom for approximately 316 households in its current DWF consent and will therefore be able to accommodate the proposed level of growth.
Ancaster lies upstream of the Wash & North Norfolk coast Natura 2000 site. However, any increases in flow from Marston WwTW would be unlikely to lead to a significant adverse effect on The Wash SPA/Ramsar site or Wash & North Norfolk Coast SAC.
There are thin areas of EA Flood Zones 2 and 3 associated with the river channel, although the majority of the town lies within EA Flood Zone 1. Flood risk should therefore not be a major constraint to development, subject to site specific FRAs.
Developers should consider the SKDC SFRA for further site specific information.
Ancaster is underlain by limestone and it is likely that infiltration SuDS will therefore be suitable, subject to individual site conditions. However, there are large areas of groundwater Source Protection Zone 3 and consultation with the Environment Agency will be required to ensure soakaways do not cause pollution of groundwater.
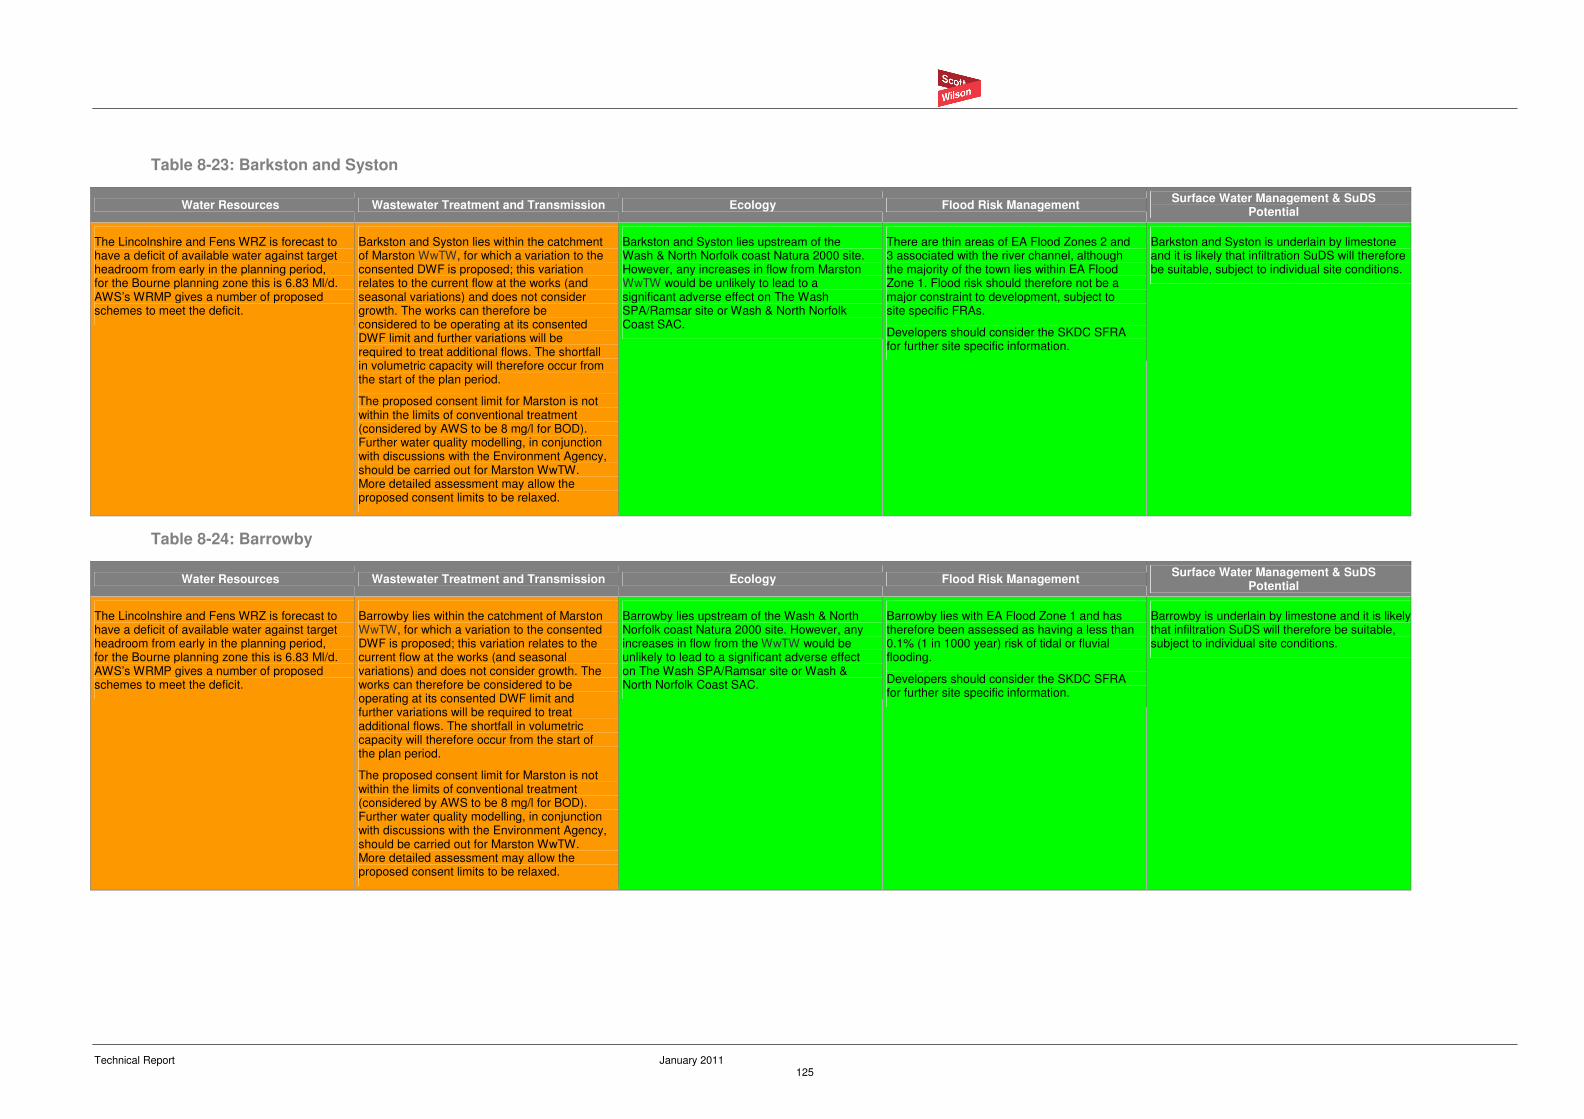
Technical Report January 2011 125
Table 8-23: Barkston and Syston
Water Resources Wastewater Treatment and Transmission Ecology Flood Risk Management Surface Water Management & SuDS
Potential
The Lincolnshire and Fens WRZ is forecast to have a deficit of available water against target headroom from early in the planning period, for the Bourne planning zone this is 6.83 Ml/d. AWS’s WRMP gives a number of proposed schemes to meet the deficit.
Barkston and Syston lies within the catchment of Marston WwTW, for which a variation to the consented DWF is proposed; this variation relates to the current flow at the works (and seasonal variations) and does not consider growth. The works can therefore be considered to be operating at its consented DWF limit and further variations will be required to treat additional flows. The shortfall in volumetric capacity will therefore occur from the start of the plan period.
The proposed consent limit for Marston is not within the limits of conventional treatment (considered by AWS to be 8 mg/l for BOD). Further water quality modelling, in conjunction with discussions with the Environment Agency, should be carried out for Marston WwTW. More detailed assessment may allow the proposed consent limits to be relaxed.
Barkston and Syston lies upstream of the Wash & North Norfolk coast Natura 2000 site. However, any increases in flow from Marston WwTW would be unlikely to lead to a significant adverse effect on The Wash SPA/Ramsar site or Wash & North Norfolk Coast SAC.
There are thin areas of EA Flood Zones 2 and 3 associated with the river channel, although the majority of the town lies within EA Flood Zone 1. Flood risk should therefore not be a major constraint to development, subject to site specific FRAs.
Developers should consider the SKDC SFRA for further site specific information.
Barkston and Syston is underlain by limestone and it is likely that infiltration SuDS will therefore be suitable, subject to individual site conditions.
Table 8-24: Barrowby
Water Resources Wastewater Treatment and Transmission Ecology Flood Risk Management Surface Water Management & SuDS
Potential
The Lincolnshire and Fens WRZ is forecast to have a deficit of available water against target headroom from early in the planning period, for the Bourne planning zone this is 6.83 Ml/d. AWS’s WRMP gives a number of proposed schemes to meet the deficit.
Barrowby lies within the catchment of Marston WwTW, for which a variation to the consented DWF is proposed; this variation relates to the current flow at the works (and seasonal variations) and does not consider growth. The works can therefore be considered to be operating at its consented DWF limit and further variations will be required to treat additional flows. The shortfall in volumetric capacity will therefore occur from the start of the plan period.
The proposed consent limit for Marston is not within the limits of conventional treatment (considered by AWS to be 8 mg/l for BOD). Further water quality modelling, in conjunction with discussions with the Environment Agency, should be carried out for Marston WwTW. More detailed assessment may allow the proposed consent limits to be relaxed.
Barrowby lies upstream of the Wash & North Norfolk coast Natura 2000 site. However, any increases in flow from the WwTW would be unlikely to lead to a significant adverse effect on The Wash SPA/Ramsar site or Wash & North Norfolk Coast SAC.
Barrowby lies with EA Flood Zone 1 and has therefore been assessed as having a less than 0.1% (1 in 1000 year) risk of tidal or fluvial flooding.
Developers should consider the SKDC SFRA for further site specific information.
Barrowby is underlain by limestone and it is likely that infiltration SuDS will therefore be suitable, subject to individual site conditions.
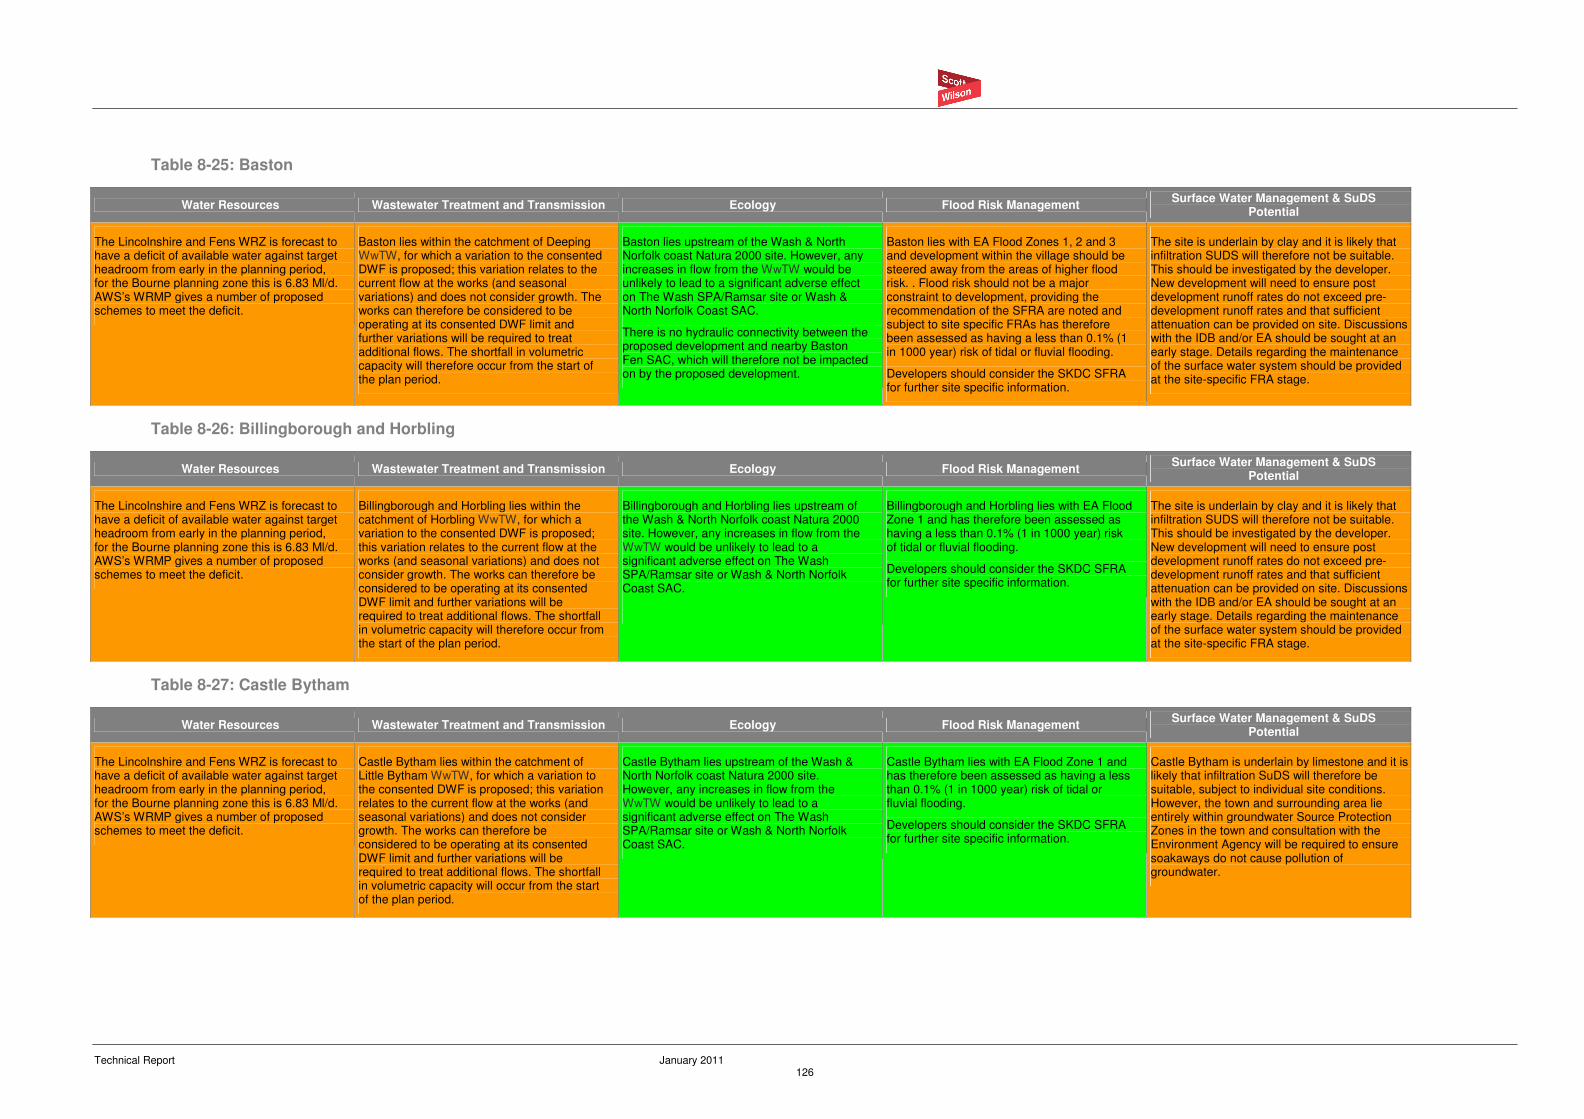
Technical Report January 2011 126
Table 8-25: Baston
Water Resources Wastewater Treatment and Transmission Ecology Flood Risk Management Surface Water Management & SuDS
Potential
The Lincolnshire and Fens WRZ is forecast to have a deficit of available water against target headroom from early in the planning period, for the Bourne planning zone this is 6.83 Ml/d. AWS’s WRMP gives a number of proposed schemes to meet the deficit.
Baston lies within the catchment of Deeping WwTW, for which a variation to the consented DWF is proposed; this variation relates to the current flow at the works (and seasonal variations) and does not consider growth. The works can therefore be considered to be operating at its consented DWF limit and further variations will be required to treat additional flows. The shortfall in volumetric capacity will therefore occur from the start of the plan period.
Baston lies upstream of the Wash & North Norfolk coast Natura 2000 site. However, any increases in flow from the WwTW would be unlikely to lead to a significant adverse effect on The Wash SPA/Ramsar site or Wash & North Norfolk Coast SAC.
There is no hydraulic connectivity between the proposed development and nearby Baston Fen SAC, which will therefore not be impacted on by the proposed development.
Baston lies with EA Flood Zones 1, 2 and 3 and development within the village should be steered away from the areas of higher flood risk. . Flood risk should not be a major constraint to development, providing the recommendation of the SFRA are noted and subject to site specific FRAs has therefore been assessed as having a less than 0.1% (1 in 1000 year) risk of tidal or fluvial flooding.
Developers should consider the SKDC SFRA for further site specific information.
The site is underlain by clay and it is likely that infiltration SUDS will therefore not be suitable. This should be investigated by the developer. New development will need to ensure post development runoff rates do not exceed pre-development runoff rates and that sufficient attenuation can be provided on site. Discussions with the IDB and/or EA should be sought at an early stage. Details regarding the maintenance of the surface water system should be provided at the site-specific FRA stage.
Table 8-26: Billingborough and Horbling
Water Resources Wastewater Treatment and Transmission Ecology Flood Risk Management Surface Water Management & SuDS
Potential
The Lincolnshire and Fens WRZ is forecast to have a deficit of available water against target headroom from early in the planning period, for the Bourne planning zone this is 6.83 Ml/d. AWS’s WRMP gives a number of proposed schemes to meet the deficit.
Billingborough and Horbling lies within the catchment of Horbling WwTW, for which a variation to the consented DWF is proposed; this variation relates to the current flow at the works (and seasonal variations) and does not consider growth. The works can therefore be considered to be operating at its consented DWF limit and further variations will be required to treat additional flows. The shortfall in volumetric capacity will therefore occur from the start of the plan period.
Billingborough and Horbling lies upstream of the Wash & North Norfolk coast Natura 2000 site. However, any increases in flow from the WwTW would be unlikely to lead to a significant adverse effect on The Wash SPA/Ramsar site or Wash & North Norfolk Coast SAC.
Billingborough and Horbling lies with EA Flood Zone 1 and has therefore been assessed as having a less than 0.1% (1 in 1000 year) risk of tidal or fluvial flooding.
Developers should consider the SKDC SFRA for further site specific information.
The site is underlain by clay and it is likely that infiltration SUDS will therefore not be suitable. This should be investigated by the developer. New development will need to ensure post development runoff rates do not exceed pre-development runoff rates and that sufficient attenuation can be provided on site. Discussions with the IDB and/or EA should be sought at an early stage. Details regarding the maintenance of the surface water system should be provided at the site-specific FRA stage.
Table 8-27: Castle Bytham
Water Resources Wastewater Treatment and Transmission Ecology Flood Risk Management Surface Water Management & SuDS
Potential
The Lincolnshire and Fens WRZ is forecast to have a deficit of available water against target headroom from early in the planning period, for the Bourne planning zone this is 6.83 Ml/d. AWS’s WRMP gives a number of proposed schemes to meet the deficit.
Castle Bytham lies within the catchment of Little Bytham WwTW, for which a variation to the consented DWF is proposed; this variation relates to the current flow at the works (and seasonal variations) and does not consider growth. The works can therefore be considered to be operating at its consented DWF limit and further variations will be required to treat additional flows. The shortfall in volumetric capacity will occur from the start of the plan period.
Castle Bytham lies upstream of the Wash & North Norfolk coast Natura 2000 site. However, any increases in flow from the WwTW would be unlikely to lead to a significant adverse effect on The Wash SPA/Ramsar site or Wash & North Norfolk Coast SAC.
Castle Bytham lies with EA Flood Zone 1 and has therefore been assessed as having a less than 0.1% (1 in 1000 year) risk of tidal or fluvial flooding.
Developers should consider the SKDC SFRA for further site specific information.
Castle Bytham is underlain by limestone and it is likely that infiltration SuDS will therefore be suitable, subject to individual site conditions. However, the town and surrounding area lie entirely within groundwater Source Protection Zones in the town and consultation with the Environment Agency will be required to ensure soakaways do not cause pollution of groundwater.
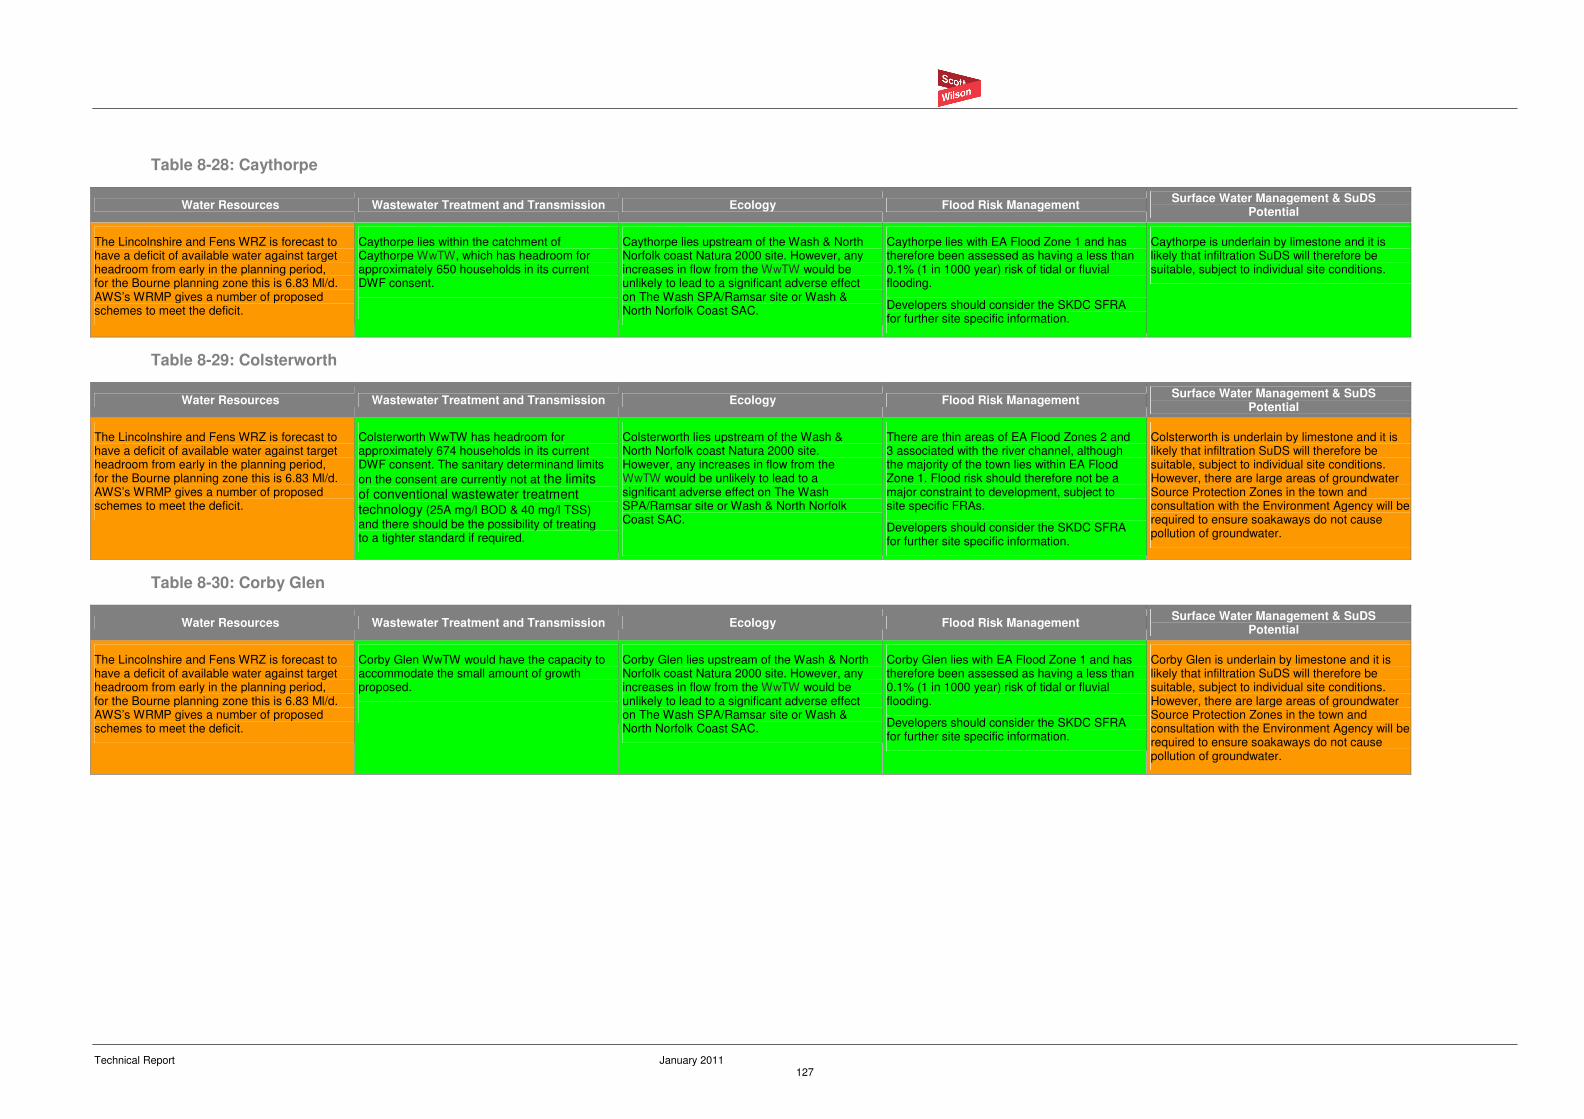
Technical Report January 2011 127
Table 8-28: Caythorpe
Water Resources Wastewater Treatment and Transmission Ecology Flood Risk Management Surface Water Management & SuDS
Potential
The Lincolnshire and Fens WRZ is forecast to have a deficit of available water against target headroom from early in the planning period, for the Bourne planning zone this is 6.83 Ml/d. AWS’s WRMP gives a number of proposed schemes to meet the deficit.
Caythorpe lies within the catchment of Caythorpe WwTW, which has headroom for approximately 650 households in its current DWF consent.
Caythorpe lies upstream of the Wash & North Norfolk coast Natura 2000 site. However, any increases in flow from the WwTW would be unlikely to lead to a significant adverse effect on The Wash SPA/Ramsar site or Wash & North Norfolk Coast SAC.
Caythorpe lies with EA Flood Zone 1 and has therefore been assessed as having a less than 0.1% (1 in 1000 year) risk of tidal or fluvial flooding.
Developers should consider the SKDC SFRA for further site specific information.
Caythorpe is underlain by limestone and it is likely that infiltration SuDS will therefore be suitable, subject to individual site conditions.
Table 8-29: Colsterworth
Water Resources Wastewater Treatment and Transmission Ecology Flood Risk Management Surface Water Management & SuDS
Potential
The Lincolnshire and Fens WRZ is forecast to have a deficit of available water against target headroom from early in the planning period, for the Bourne planning zone this is 6.83 Ml/d. AWS’s WRMP gives a number of proposed schemes to meet the deficit.
Colsterworth WwTW has headroom for approximately 674 households in its current DWF consent. The sanitary determinand limits
on the consent are currently not at the limits of conventional wastewater treatment technology (25A mg/l BOD & 40 mg/l TSS) and there should be the possibility of treating to a tighter standard if required.
Colsterworth lies upstream of the Wash & North Norfolk coast Natura 2000 site. However, any increases in flow from the WwTW would be unlikely to lead to a significant adverse effect on The Wash SPA/Ramsar site or Wash & North Norfolk Coast SAC.
There are thin areas of EA Flood Zones 2 and 3 associated with the river channel, although the majority of the town lies within EA Flood Zone 1. Flood risk should therefore not be a major constraint to development, subject to site specific FRAs.
Developers should consider the SKDC SFRA for further site specific information.
Colsterworth is underlain by limestone and it is likely that infiltration SuDS will therefore be suitable, subject to individual site conditions. However, there are large areas of groundwater Source Protection Zones in the town and consultation with the Environment Agency will be required to ensure soakaways do not cause pollution of groundwater.
Table 8-30: Corby Glen
Water Resources Wastewater Treatment and Transmission Ecology Flood Risk Management Surface Water Management & SuDS
Potential
The Lincolnshire and Fens WRZ is forecast to have a deficit of available water against target headroom from early in the planning period, for the Bourne planning zone this is 6.83 Ml/d. AWS’s WRMP gives a number of proposed schemes to meet the deficit.
Corby Glen WwTW would have the capacity to accommodate the small amount of growth proposed.
Corby Glen lies upstream of the Wash & North Norfolk coast Natura 2000 site. However, any increases in flow from the WwTW would be unlikely to lead to a significant adverse effect on The Wash SPA/Ramsar site or Wash & North Norfolk Coast SAC.
Corby Glen lies with EA Flood Zone 1 and has therefore been assessed as having a less than 0.1% (1 in 1000 year) risk of tidal or fluvial flooding.
Developers should consider the SKDC SFRA for further site specific information.
Corby Glen is underlain by limestone and it is likely that infiltration SuDS will therefore be suitable, subject to individual site conditions. However, there are large areas of groundwater Source Protection Zones in the town and consultation with the Environment Agency will be required to ensure soakaways do not cause pollution of groundwater.
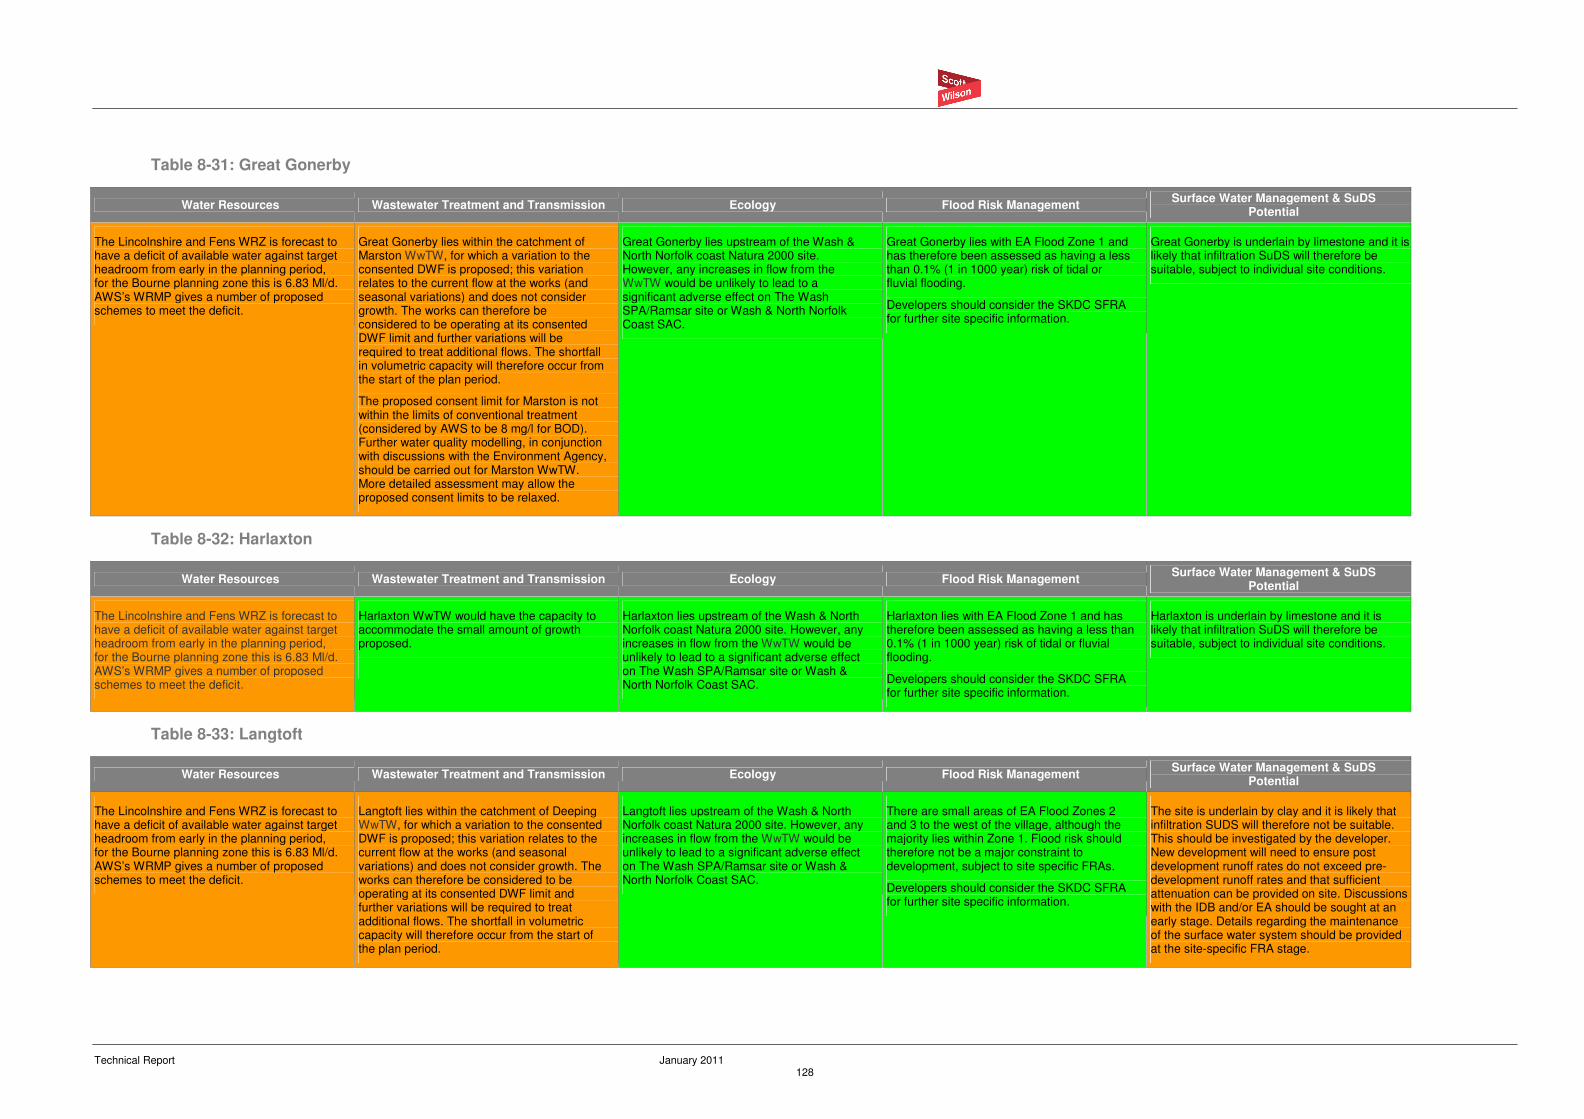
Technical Report January 2011 128
Table 8-31: Great Gonerby
Water Resources Wastewater Treatment and Transmission Ecology Flood Risk Management Surface Water Management & SuDS
Potential
The Lincolnshire and Fens WRZ is forecast to have a deficit of available water against target headroom from early in the planning period, for the Bourne planning zone this is 6.83 Ml/d. AWS’s WRMP gives a number of proposed schemes to meet the deficit.
Great Gonerby lies within the catchment of Marston WwTW, for which a variation to the consented DWF is proposed; this variation relates to the current flow at the works (and seasonal variations) and does not consider growth. The works can therefore be considered to be operating at its consented DWF limit and further variations will be required to treat additional flows. The shortfall in volumetric capacity will therefore occur from the start of the plan period.
The proposed consent limit for Marston is not within the limits of conventional treatment (considered by AWS to be 8 mg/l for BOD). Further water quality modelling, in conjunction with discussions with the Environment Agency, should be carried out for Marston WwTW. More detailed assessment may allow the proposed consent limits to be relaxed.
Great Gonerby lies upstream of the Wash & North Norfolk coast Natura 2000 site. However, any increases in flow from the WwTW would be unlikely to lead to a significant adverse effect on The Wash SPA/Ramsar site or Wash & North Norfolk Coast SAC.
Great Gonerby lies with EA Flood Zone 1 and has therefore been assessed as having a less than 0.1% (1 in 1000 year) risk of tidal or fluvial flooding.
Developers should consider the SKDC SFRA for further site specific information.
Great Gonerby is underlain by limestone and it is likely that infiltration SuDS will therefore be suitable, subject to individual site conditions.
Table 8-32: Harlaxton
Water Resources Wastewater Treatment and Transmission Ecology Flood Risk Management Surface Water Management & SuDS
Potential
The Lincolnshire and Fens WRZ is forecast to have a deficit of available water against target headroom from early in the planning period, for the Bourne planning zone this is 6.83 Ml/d. AWS’s WRMP gives a number of proposed schemes to meet the deficit.
Harlaxton WwTW would have the capacity to accommodate the small amount of growth proposed.
Harlaxton lies upstream of the Wash & North Norfolk coast Natura 2000 site. However, any increases in flow from the WwTW would be unlikely to lead to a significant adverse effect on The Wash SPA/Ramsar site or Wash & North Norfolk Coast SAC.
Harlaxton lies with EA Flood Zone 1 and has therefore been assessed as having a less than 0.1% (1 in 1000 year) risk of tidal or fluvial flooding.
Developers should consider the SKDC SFRA for further site specific information.
Harlaxton is underlain by limestone and it is likely that infiltration SuDS will therefore be suitable, subject to individual site conditions.
Table 8-33: Langtoft
Water Resources Wastewater Treatment and Transmission Ecology Flood Risk Management Surface Water Management & SuDS
Potential
The Lincolnshire and Fens WRZ is forecast to have a deficit of available water against target headroom from early in the planning period, for the Bourne planning zone this is 6.83 Ml/d. AWS’s WRMP gives a number of proposed schemes to meet the deficit.
Langtoft lies within the catchment of Deeping WwTW, for which a variation to the consented DWF is proposed; this variation relates to the current flow at the works (and seasonal variations) and does not consider growth. The works can therefore be considered to be operating at its consented DWF limit and further variations will be required to treat additional flows. The shortfall in volumetric capacity will therefore occur from the start of the plan period.
Langtoft lies upstream of the Wash & North Norfolk coast Natura 2000 site. However, any increases in flow from the WwTW would be unlikely to lead to a significant adverse effect on The Wash SPA/Ramsar site or Wash & North Norfolk Coast SAC.
There are small areas of EA Flood Zones 2 and 3 to the west of the village, although the majority lies within Zone 1. Flood risk should therefore not be a major constraint to development, subject to site specific FRAs.
Developers should consider the SKDC SFRA for further site specific information.
The site is underlain by clay and it is likely that infiltration SUDS will therefore not be suitable. This should be investigated by the developer. New development will need to ensure post development runoff rates do not exceed pre-development runoff rates and that sufficient attenuation can be provided on site. Discussions with the IDB and/or EA should be sought at an early stage. Details regarding the maintenance of the surface water system should be provided at the site-specific FRA stage.
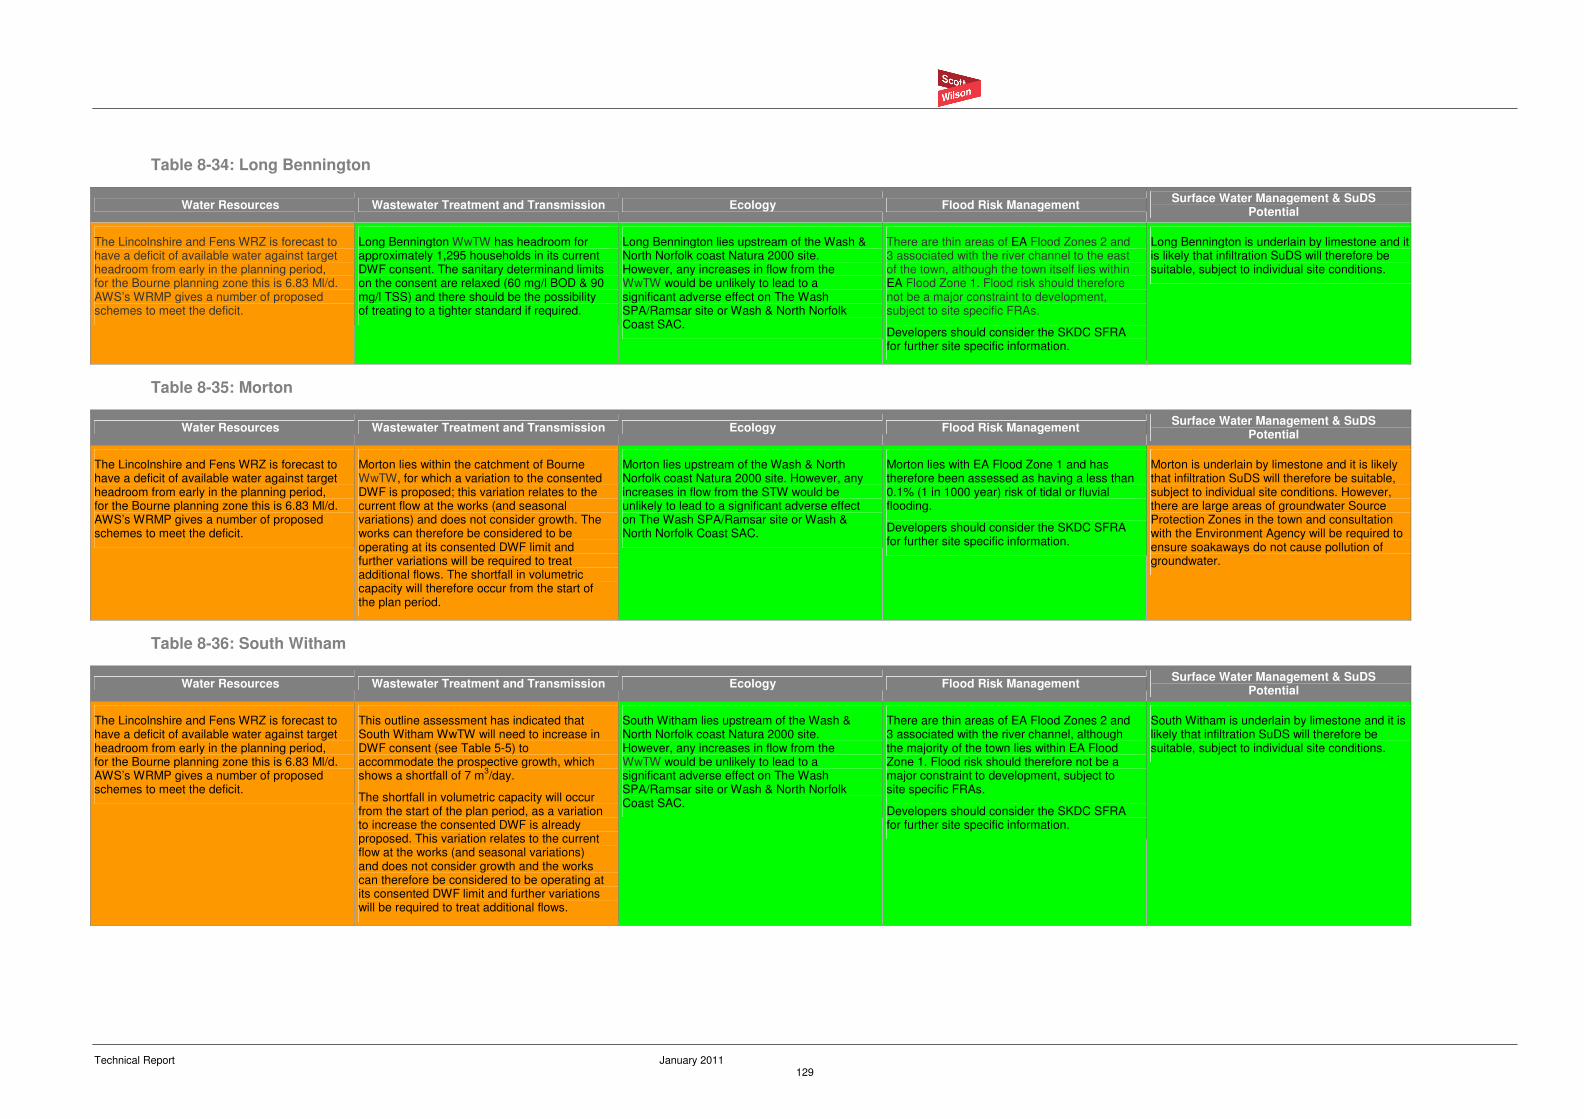
Technical Report January 2011 129
Table 8-34: Long Bennington
Water Resources Wastewater Treatment and Transmission Ecology Flood Risk Management Surface Water Management & SuDS
Potential
The Lincolnshire and Fens WRZ is forecast to have a deficit of available water against target headroom from early in the planning period, for the Bourne planning zone this is 6.83 Ml/d. AWS’s WRMP gives a number of proposed schemes to meet the deficit.
Long Bennington WwTW has headroom for approximately 1,295 households in its current DWF consent. The sanitary determinand limits on the consent are relaxed (60 mg/l BOD & 90 mg/l TSS) and there should be the possibility of treating to a tighter standard if required.
Long Bennington lies upstream of the Wash & North Norfolk coast Natura 2000 site. However, any increases in flow from the WwTW would be unlikely to lead to a significant adverse effect on The Wash SPA/Ramsar site or Wash & North Norfolk Coast SAC.
There are thin areas of EA Flood Zones 2 and 3 associated with the river channel to the east of the town, although the town itself lies within EA Flood Zone 1. Flood risk should therefore not be a major constraint to development, subject to site specific FRAs.
Developers should consider the SKDC SFRA for further site specific information.
Long Bennington is underlain by limestone and it is likely that infiltration SuDS will therefore be suitable, subject to individual site conditions.
Table 8-35: Morton
Water Resources Wastewater Treatment and Transmission Ecology Flood Risk Management Surface Water Management & SuDS
Potential
The Lincolnshire and Fens WRZ is forecast to have a deficit of available water against target headroom from early in the planning period, for the Bourne planning zone this is 6.83 Ml/d. AWS’s WRMP gives a number of proposed schemes to meet the deficit.
Morton lies within the catchment of Bourne WwTW, for which a variation to the consented DWF is proposed; this variation relates to the current flow at the works (and seasonal variations) and does not consider growth. The works can therefore be considered to be operating at its consented DWF limit and further variations will be required to treat additional flows. The shortfall in volumetric capacity will therefore occur from the start of the plan period.
Morton lies upstream of the Wash & North Norfolk coast Natura 2000 site. However, any increases in flow from the STW would be unlikely to lead to a significant adverse effect on The Wash SPA/Ramsar site or Wash & North Norfolk Coast SAC.
Morton lies with EA Flood Zone 1 and has therefore been assessed as having a less than 0.1% (1 in 1000 year) risk of tidal or fluvial flooding.
Developers should consider the SKDC SFRA for further site specific information.
Morton is underlain by limestone and it is likely that infiltration SuDS will therefore be suitable, subject to individual site conditions. However, there are large areas of groundwater Source Protection Zones in the town and consultation with the Environment Agency will be required to ensure soakaways do not cause pollution of groundwater.
Table 8-36: South Witham
Water Resources Wastewater Treatment and Transmission Ecology Flood Risk Management Surface Water Management & SuDS
Potential
The Lincolnshire and Fens WRZ is forecast to have a deficit of available water against target headroom from early in the planning period, for the Bourne planning zone this is 6.83 Ml/d. AWS’s WRMP gives a number of proposed schemes to meet the deficit.
This outline assessment has indicated that South Witham WwTW will need to increase in DWF consent (see Table 5-5) to accommodate the prospective growth, which shows a shortfall of 7 m
3/day.
The shortfall in volumetric capacity will occur from the start of the plan period, as a variation to increase the consented DWF is already proposed. This variation relates to the current flow at the works (and seasonal variations) and does not consider growth and the works can therefore be considered to be operating at its consented DWF limit and further variations will be required to treat additional flows.
South Witham lies upstream of the Wash & North Norfolk coast Natura 2000 site. However, any increases in flow from the WwTW would be unlikely to lead to a significant adverse effect on The Wash SPA/Ramsar site or Wash & North Norfolk Coast SAC.
There are thin areas of EA Flood Zones 2 and 3 associated with the river channel, although the majority of the town lies within EA Flood Zone 1. Flood risk should therefore not be a major constraint to development, subject to site specific FRAs.
Developers should consider the SKDC SFRA for further site specific information.
South Witham is underlain by limestone and it is likely that infiltration SuDS will therefore be suitable, subject to individual site conditions.
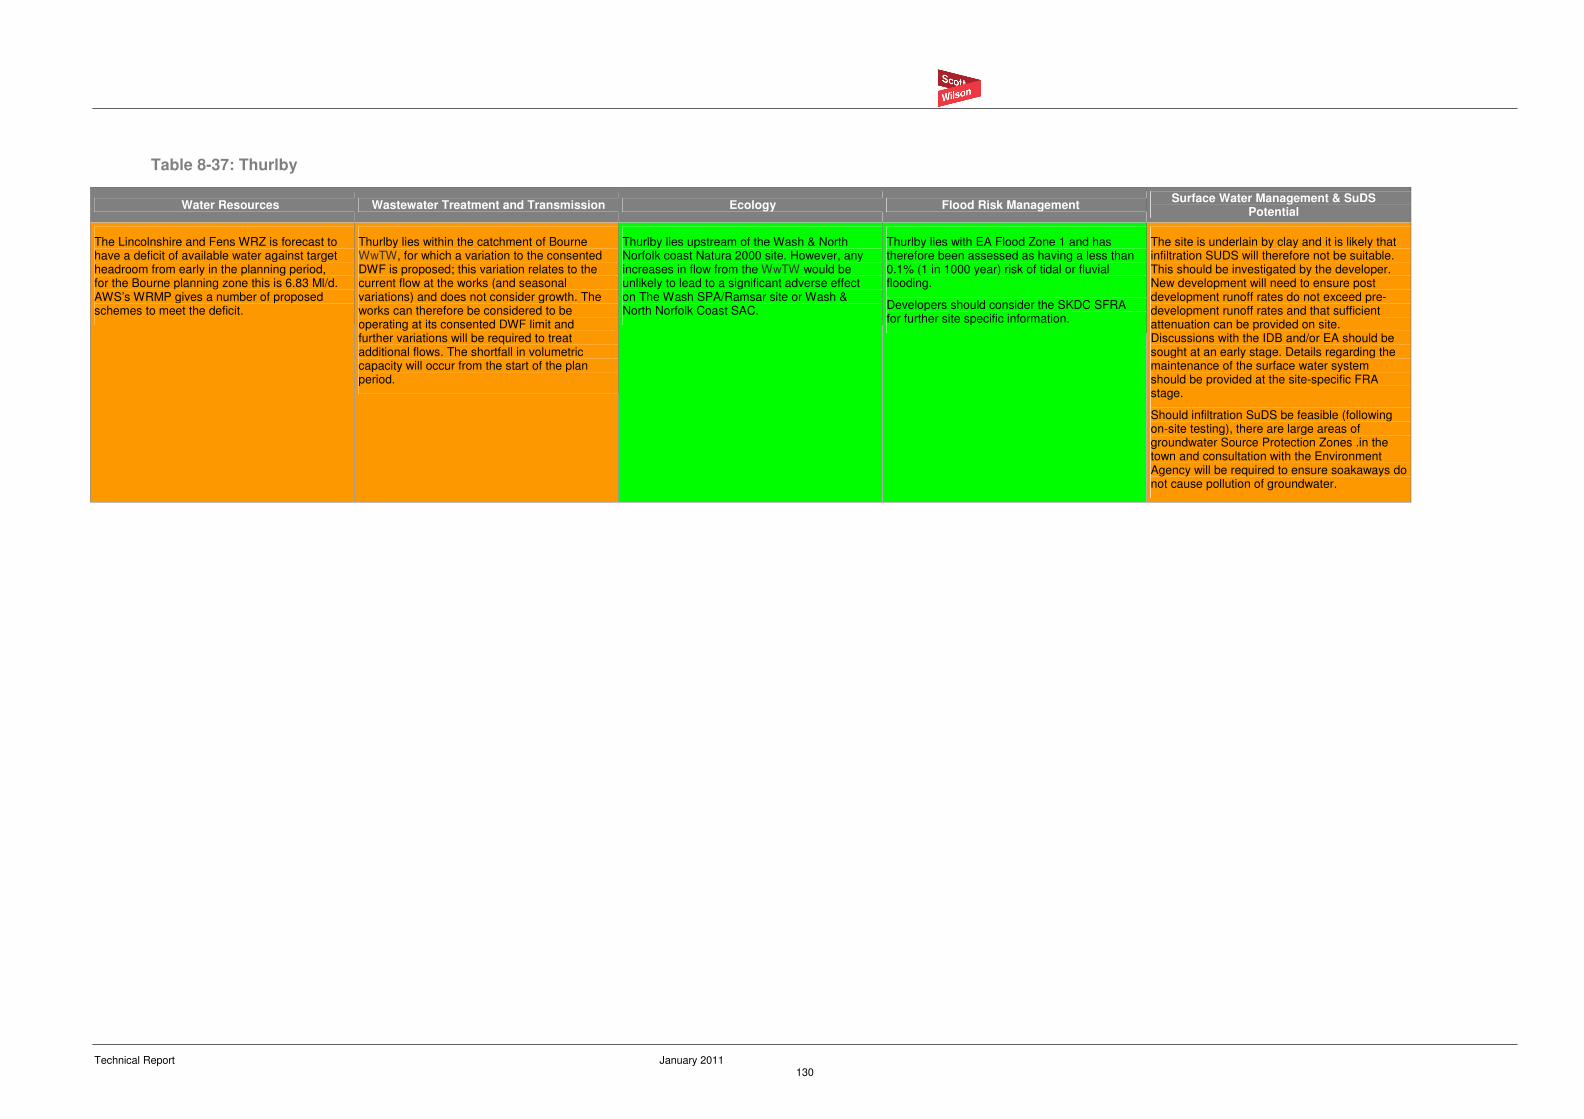
Technical Report January 2011 130
Table 8-37: Thurlby
Water Resources Wastewater Treatment and Transmission Ecology Flood Risk Management Surface Water Management & SuDS
Potential
The Lincolnshire and Fens WRZ is forecast to have a deficit of available water against target headroom from early in the planning period, for the Bourne planning zone this is 6.83 Ml/d. AWS’s WRMP gives a number of proposed schemes to meet the deficit.
Thurlby lies within the catchment of Bourne WwTW, for which a variation to the consented DWF is proposed; this variation relates to the current flow at the works (and seasonal variations) and does not consider growth. The works can therefore be considered to be operating at its consented DWF limit and further variations will be required to treat additional flows. The shortfall in volumetric capacity will occur from the start of the plan period.
Thurlby lies upstream of the Wash & North Norfolk coast Natura 2000 site. However, any increases in flow from the WwTW would be unlikely to lead to a significant adverse effect on The Wash SPA/Ramsar site or Wash & North Norfolk Coast SAC.
Thurlby lies with EA Flood Zone 1 and has therefore been assessed as having a less than 0.1% (1 in 1000 year) risk of tidal or fluvial flooding.
Developers should consider the SKDC SFRA for further site specific information.
The site is underlain by clay and it is likely that infiltration SUDS will therefore not be suitable. This should be investigated by the developer. New development will need to ensure post development runoff rates do not exceed pre-development runoff rates and that sufficient attenuation can be provided on site. Discussions with the IDB and/or EA should be sought at an early stage. Details regarding the maintenance of the surface water system should be provided at the site-specific FRA stage.
Should infiltration SuDS be feasible (following on-site testing), there are large areas of groundwater Source Protection Zones .in the town and consultation with the Environment Agency will be required to ensure soakaways do not cause pollution of groundwater.
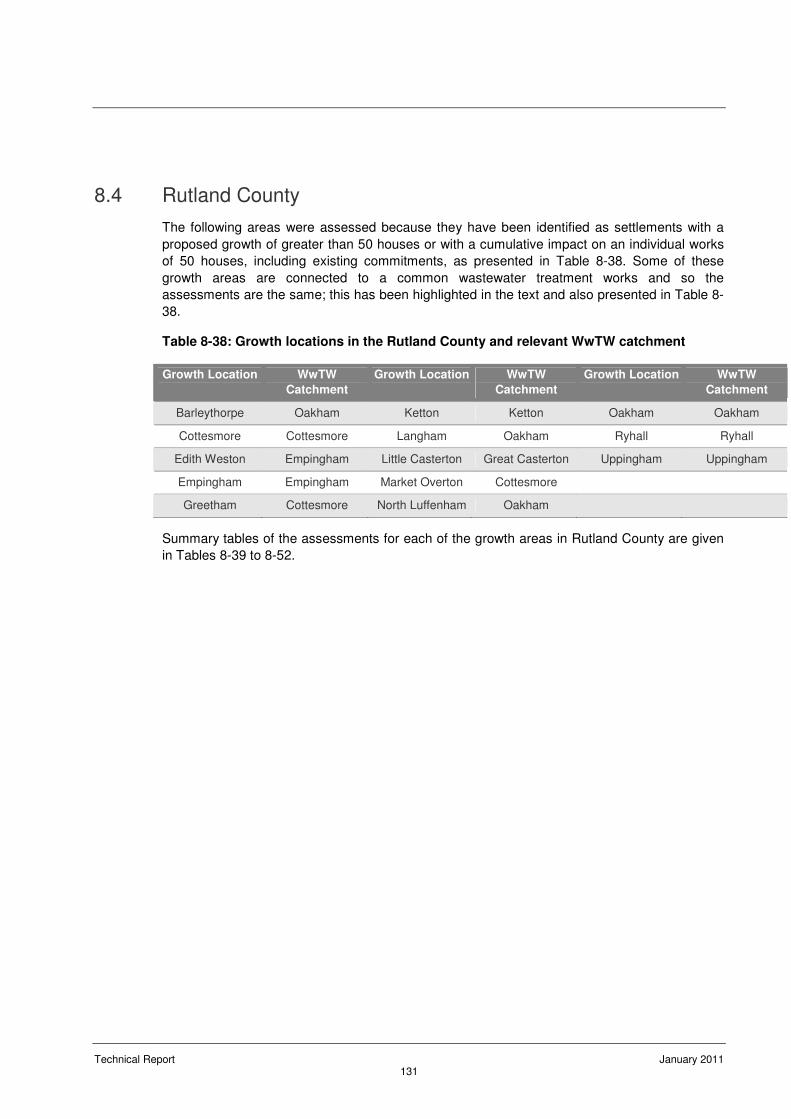
Technical Report January 2011 131
8.4 Rutland County
The following areas were assessed because they have been identified as settlements with a
proposed growth of greater than 50 houses or with a cumulative impact on an individual works
of 50 houses, including existing commitments, as presented in Table 8-38. Some of these
growth areas are connected to a common wastewater treatment works and so the
assessments are the same; this has been highlighted in the text and also presented in Table 8-
38.
Table 8-38: Growth locations in the Rutland County and relevant WwTW catchment
Growth Location WwTW
Catchment
Growth Location WwTW
Catchment
Growth Location WwTW
Catchment
Barleythorpe Oakham Ketton Ketton Oakham Oakham
Cottesmore Cottesmore Langham Oakham Ryhall Ryhall
Edith Weston Empingham Little Casterton Great Casterton Uppingham Uppingham
Empingham Empingham Market Overton Cottesmore
Greetham Cottesmore North Luffenham Oakham
Summary tables of the assessments for each of the growth areas in Rutland County are given
in Tables 8-39 to 8-52.
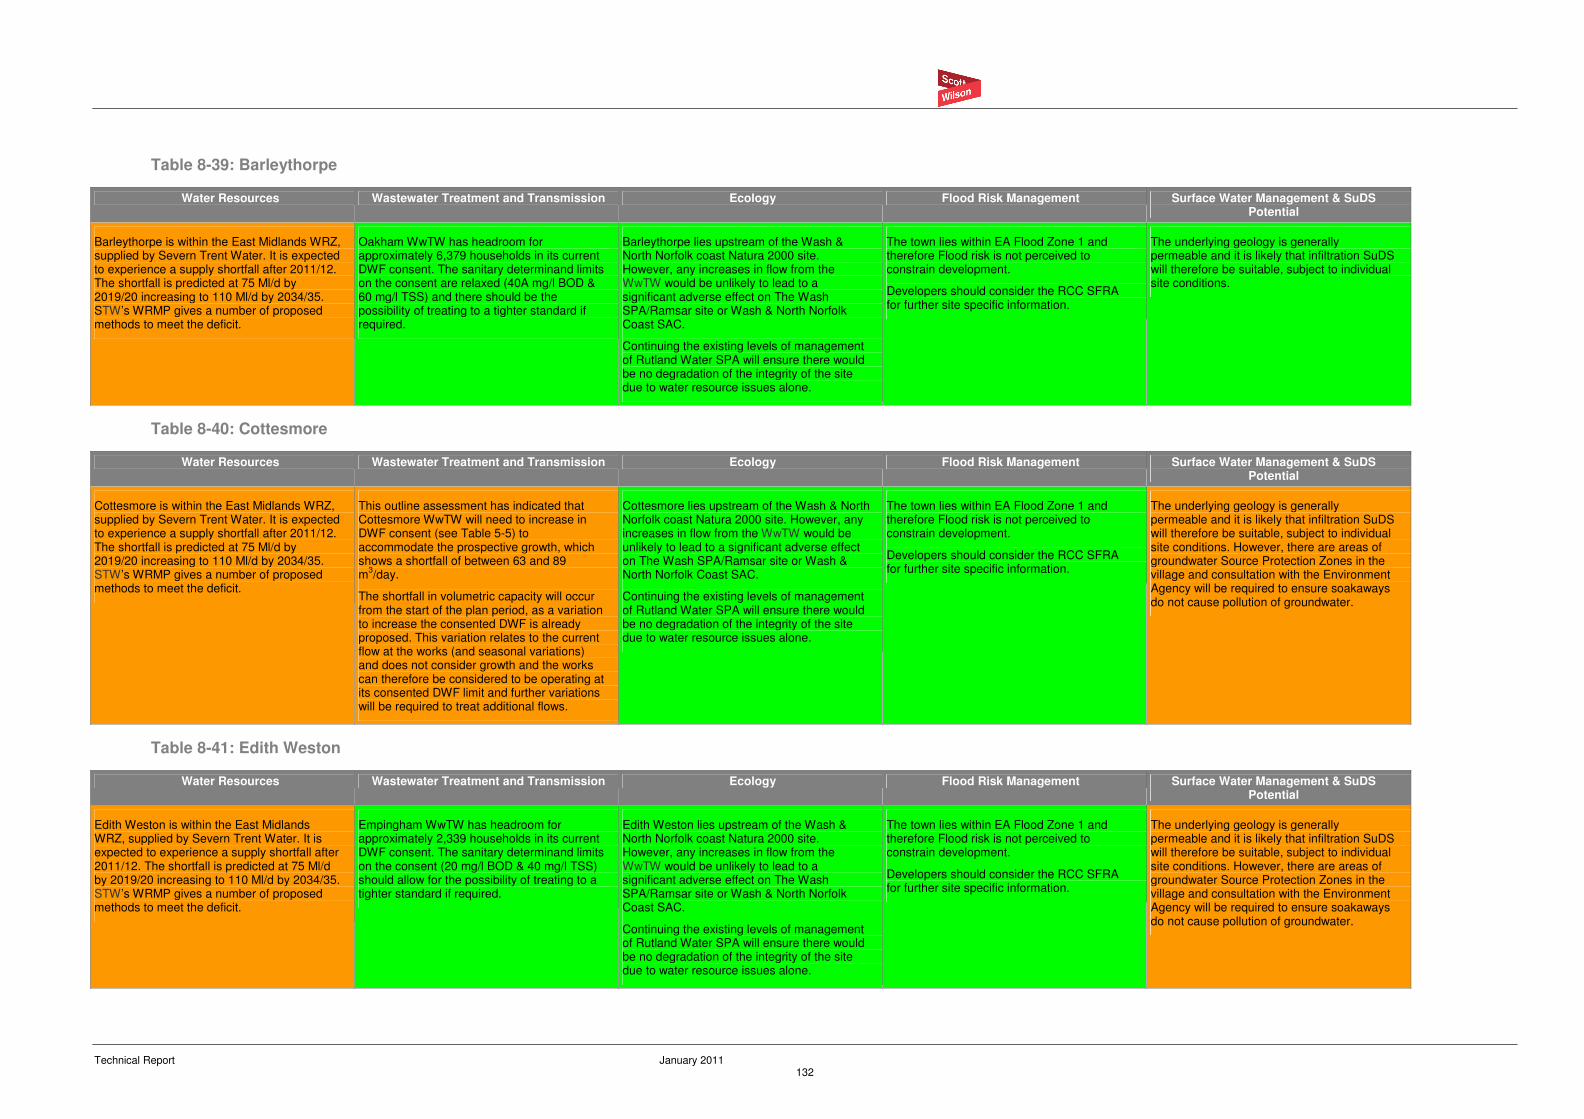
Technical Report January 2011 132
Table 8-39: Barleythorpe
Water Resources Wastewater Treatment and Transmission Ecology Flood Risk Management Surface Water Management & SuDS Potential
Barleythorpe is within the East Midlands WRZ, supplied by Severn Trent Water. It is expected to experience a supply shortfall after 2011/12. The shortfall is predicted at 75 Ml/d by 2019/20 increasing to 110 Ml/d by 2034/35. STW’s WRMP gives a number of proposed methods to meet the deficit.
Oakham WwTW has headroom for approximately 6,379 households in its current DWF consent. The sanitary determinand limits on the consent are relaxed (40A mg/l BOD & 60 mg/l TSS) and there should be the possibility of treating to a tighter standard if required.
Barleythorpe lies upstream of the Wash & North Norfolk coast Natura 2000 site. However, any increases in flow from the WwTW would be unlikely to lead to a significant adverse effect on The Wash SPA/Ramsar site or Wash & North Norfolk Coast SAC.
Continuing the existing levels of management of Rutland Water SPA will ensure there would be no degradation of the integrity of the site due to water resource issues alone.
The town lies within EA Flood Zone 1 and therefore Flood risk is not perceived to constrain development.
Developers should consider the RCC SFRA for further site specific information.
The underlying geology is generally permeable and it is likely that infiltration SuDS will therefore be suitable, subject to individual site conditions.
Table 8-40: Cottesmore
Water Resources Wastewater Treatment and Transmission Ecology Flood Risk Management Surface Water Management & SuDS Potential
Cottesmore is within the East Midlands WRZ, supplied by Severn Trent Water. It is expected to experience a supply shortfall after 2011/12. The shortfall is predicted at 75 Ml/d by 2019/20 increasing to 110 Ml/d by 2034/35. STW’s WRMP gives a number of proposed methods to meet the deficit.
This outline assessment has indicated that Cottesmore WwTW will need to increase in DWF consent (see Table 5-5) to accommodate the prospective growth, which shows a shortfall of between 63 and 89 m
3/day.
The shortfall in volumetric capacity will occur from the start of the plan period, as a variation to increase the consented DWF is already proposed. This variation relates to the current flow at the works (and seasonal variations) and does not consider growth and the works can therefore be considered to be operating at its consented DWF limit and further variations will be required to treat additional flows.
Cottesmore lies upstream of the Wash & North Norfolk coast Natura 2000 site. However, any increases in flow from the WwTW would be unlikely to lead to a significant adverse effect on The Wash SPA/Ramsar site or Wash & North Norfolk Coast SAC.
Continuing the existing levels of management of Rutland Water SPA will ensure there would be no degradation of the integrity of the site due to water resource issues alone.
The town lies within EA Flood Zone 1 and therefore Flood risk is not perceived to constrain development.
Developers should consider the RCC SFRA for further site specific information.
The underlying geology is generally permeable and it is likely that infiltration SuDS will therefore be suitable, subject to individual site conditions. However, there are areas of groundwater Source Protection Zones in the village and consultation with the Environment Agency will be required to ensure soakaways do not cause pollution of groundwater.
Table 8-41: Edith Weston
Water Resources Wastewater Treatment and Transmission Ecology Flood Risk Management Surface Water Management & SuDS Potential
Edith Weston is within the East Midlands WRZ, supplied by Severn Trent Water. It is expected to experience a supply shortfall after 2011/12. The shortfall is predicted at 75 Ml/d by 2019/20 increasing to 110 Ml/d by 2034/35. STW’s WRMP gives a number of proposed methods to meet the deficit.
Empingham WwTW has headroom for approximately 2,339 households in its current DWF consent. The sanitary determinand limits on the consent (20 mg/l BOD & 40 mg/l TSS) should allow for the possibility of treating to a tighter standard if required.
Edith Weston lies upstream of the Wash & North Norfolk coast Natura 2000 site. However, any increases in flow from the WwTW would be unlikely to lead to a significant adverse effect on The Wash SPA/Ramsar site or Wash & North Norfolk Coast SAC.
Continuing the existing levels of management of Rutland Water SPA will ensure there would be no degradation of the integrity of the site due to water resource issues alone.
The town lies within EA Flood Zone 1 and therefore Flood risk is not perceived to constrain development.
Developers should consider the RCC SFRA for further site specific information.
The underlying geology is generally permeable and it is likely that infiltration SuDS will therefore be suitable, subject to individual site conditions. However, there are areas of groundwater Source Protection Zones in the village and consultation with the Environment Agency will be required to ensure soakaways do not cause pollution of groundwater.
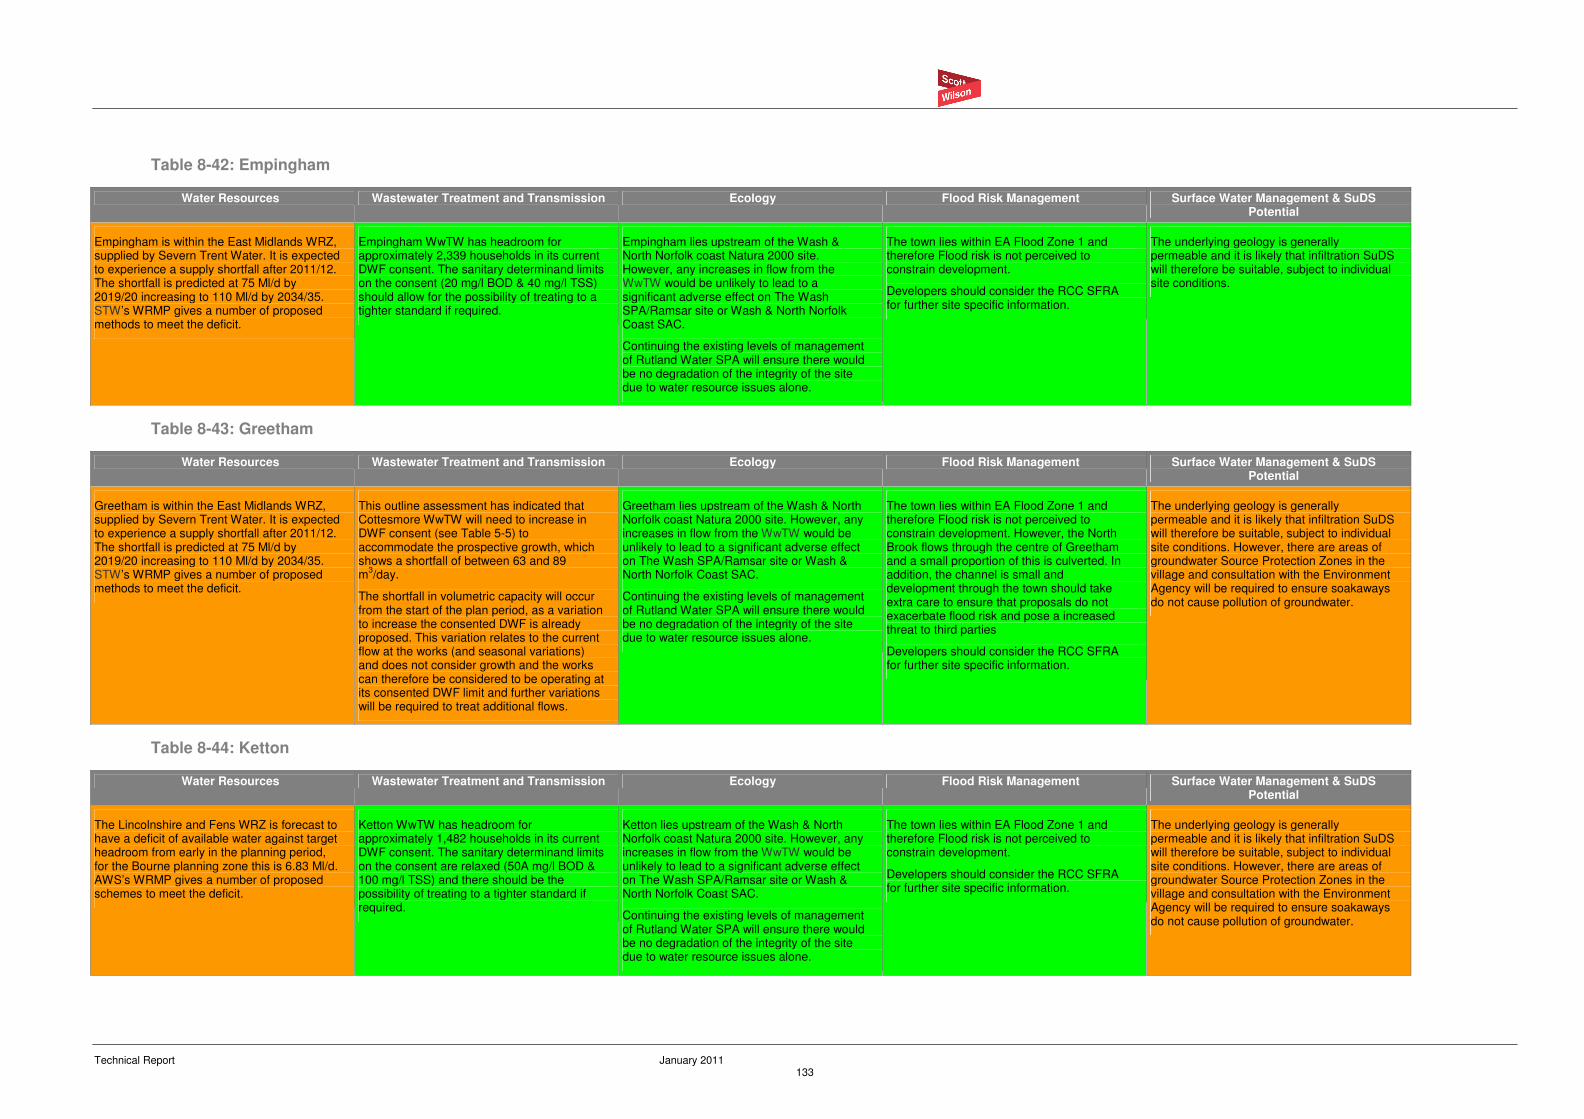
Technical Report January 2011 133
Table 8-42: Empingham
Water Resources Wastewater Treatment and Transmission Ecology Flood Risk Management Surface Water Management & SuDS Potential
Empingham is within the East Midlands WRZ, supplied by Severn Trent Water. It is expected to experience a supply shortfall after 2011/12. The shortfall is predicted at 75 Ml/d by 2019/20 increasing to 110 Ml/d by 2034/35. STW’s WRMP gives a number of proposed methods to meet the deficit.
Empingham WwTW has headroom for approximately 2,339 households in its current DWF consent. The sanitary determinand limits on the consent (20 mg/l BOD & 40 mg/l TSS) should allow for the possibility of treating to a tighter standard if required.
Empingham lies upstream of the Wash & North Norfolk coast Natura 2000 site. However, any increases in flow from the WwTW would be unlikely to lead to a significant adverse effect on The Wash SPA/Ramsar site or Wash & North Norfolk Coast SAC.
Continuing the existing levels of management of Rutland Water SPA will ensure there would be no degradation of the integrity of the site due to water resource issues alone.
The town lies within EA Flood Zone 1 and therefore Flood risk is not perceived to constrain development.
Developers should consider the RCC SFRA for further site specific information.
The underlying geology is generally permeable and it is likely that infiltration SuDS will therefore be suitable, subject to individual site conditions.
Table 8-43: Greetham
Water Resources Wastewater Treatment and Transmission Ecology Flood Risk Management Surface Water Management & SuDS Potential
Greetham is within the East Midlands WRZ, supplied by Severn Trent Water. It is expected to experience a supply shortfall after 2011/12. The shortfall is predicted at 75 Ml/d by 2019/20 increasing to 110 Ml/d by 2034/35. STW’s WRMP gives a number of proposed methods to meet the deficit.
This outline assessment has indicated that Cottesmore WwTW will need to increase in DWF consent (see Table 5-5) to accommodate the prospective growth, which shows a shortfall of between 63 and 89 m
3/day.
The shortfall in volumetric capacity will occur from the start of the plan period, as a variation to increase the consented DWF is already proposed. This variation relates to the current flow at the works (and seasonal variations) and does not consider growth and the works can therefore be considered to be operating at its consented DWF limit and further variations will be required to treat additional flows.
Greetham lies upstream of the Wash & North Norfolk coast Natura 2000 site. However, any increases in flow from the WwTW would be unlikely to lead to a significant adverse effect on The Wash SPA/Ramsar site or Wash & North Norfolk Coast SAC.
Continuing the existing levels of management of Rutland Water SPA will ensure there would be no degradation of the integrity of the site due to water resource issues alone.
The town lies within EA Flood Zone 1 and therefore Flood risk is not perceived to constrain development. However, the North Brook flows through the centre of Greetham and a small proportion of this is culverted. In addition, the channel is small and development through the town should take extra care to ensure that proposals do not exacerbate flood risk and pose a increased threat to third parties
Developers should consider the RCC SFRA for further site specific information.
The underlying geology is generally permeable and it is likely that infiltration SuDS will therefore be suitable, subject to individual site conditions. However, there are areas of groundwater Source Protection Zones in the village and consultation with the Environment Agency will be required to ensure soakaways do not cause pollution of groundwater.
Table 8-44: Ketton
Water Resources Wastewater Treatment and Transmission Ecology Flood Risk Management Surface Water Management & SuDS Potential
The Lincolnshire and Fens WRZ is forecast to have a deficit of available water against target headroom from early in the planning period, for the Bourne planning zone this is 6.83 Ml/d. AWS’s WRMP gives a number of proposed schemes to meet the deficit.
Ketton WwTW has headroom for approximately 1,482 households in its current DWF consent. The sanitary determinand limits on the consent are relaxed (50A mg/l BOD & 100 mg/l TSS) and there should be the possibility of treating to a tighter standard if required.
Ketton lies upstream of the Wash & North Norfolk coast Natura 2000 site. However, any increases in flow from the WwTW would be unlikely to lead to a significant adverse effect on The Wash SPA/Ramsar site or Wash & North Norfolk Coast SAC.
Continuing the existing levels of management of Rutland Water SPA will ensure there would be no degradation of the integrity of the site due to water resource issues alone.
The town lies within EA Flood Zone 1 and therefore Flood risk is not perceived to constrain development.
Developers should consider the RCC SFRA for further site specific information.
The underlying geology is generally permeable and it is likely that infiltration SuDS will therefore be suitable, subject to individual site conditions. However, there are areas of groundwater Source Protection Zones in the village and consultation with the Environment Agency will be required to ensure soakaways do not cause pollution of groundwater.
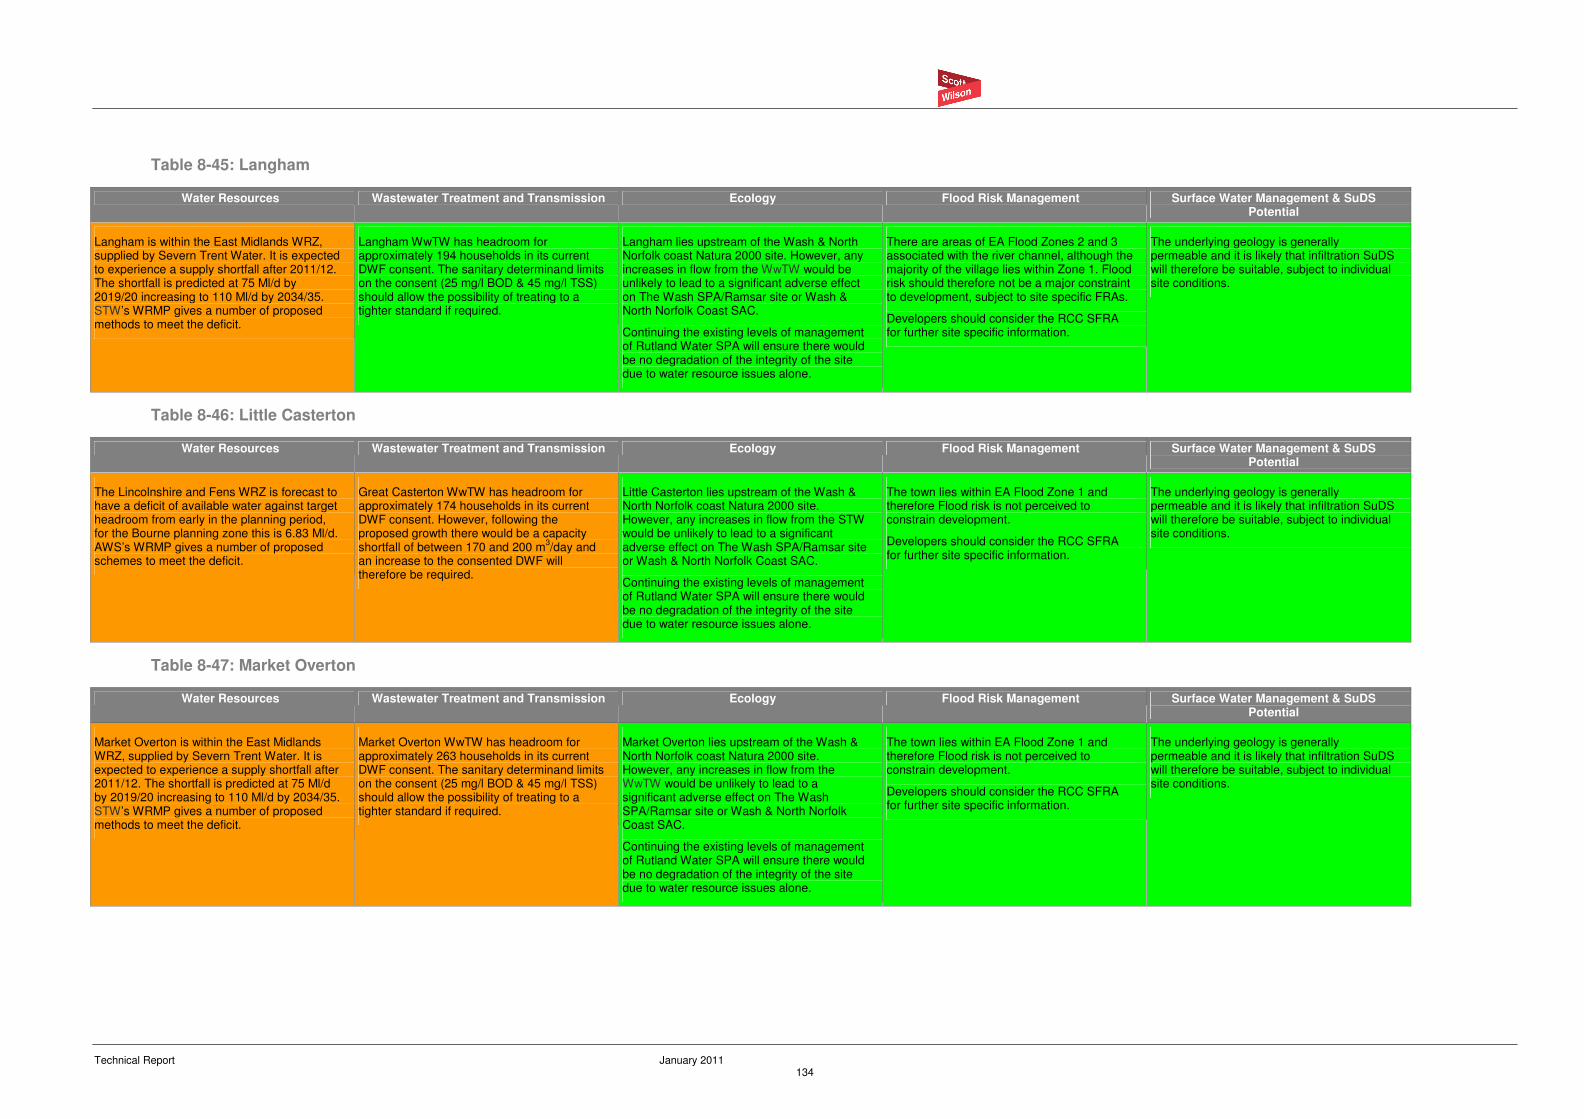
Technical Report January 2011 134
Table 8-45: Langham
Water Resources Wastewater Treatment and Transmission Ecology Flood Risk Management Surface Water Management & SuDS Potential
Langham is within the East Midlands WRZ, supplied by Severn Trent Water. It is expected to experience a supply shortfall after 2011/12. The shortfall is predicted at 75 Ml/d by 2019/20 increasing to 110 Ml/d by 2034/35. STW’s WRMP gives a number of proposed methods to meet the deficit.
Langham WwTW has headroom for approximately 194 households in its current DWF consent. The sanitary determinand limits on the consent (25 mg/l BOD & 45 mg/l TSS) should allow the possibility of treating to a tighter standard if required.
Langham lies upstream of the Wash & North Norfolk coast Natura 2000 site. However, any increases in flow from the WwTW would be unlikely to lead to a significant adverse effect on The Wash SPA/Ramsar site or Wash & North Norfolk Coast SAC.
Continuing the existing levels of management of Rutland Water SPA will ensure there would be no degradation of the integrity of the site due to water resource issues alone.
There are areas of EA Flood Zones 2 and 3 associated with the river channel, although the majority of the village lies within Zone 1. Flood risk should therefore not be a major constraint to development, subject to site specific FRAs.
Developers should consider the RCC SFRA for further site specific information.
The underlying geology is generally permeable and it is likely that infiltration SuDS will therefore be suitable, subject to individual site conditions.
Table 8-46: Little Casterton
Water Resources Wastewater Treatment and Transmission Ecology Flood Risk Management Surface Water Management & SuDS Potential
The Lincolnshire and Fens WRZ is forecast to have a deficit of available water against target headroom from early in the planning period, for the Bourne planning zone this is 6.83 Ml/d. AWS’s WRMP gives a number of proposed schemes to meet the deficit.
Great Casterton WwTW has headroom for approximately 174 households in its current DWF consent. However, following the proposed growth there would be a capacity shortfall of between 170 and 200 m
3/day and
an increase to the consented DWF will therefore be required.
Little Casterton lies upstream of the Wash & North Norfolk coast Natura 2000 site. However, any increases in flow from the STW would be unlikely to lead to a significant adverse effect on The Wash SPA/Ramsar site or Wash & North Norfolk Coast SAC.
Continuing the existing levels of management of Rutland Water SPA will ensure there would be no degradation of the integrity of the site due to water resource issues alone.
The town lies within EA Flood Zone 1 and therefore Flood risk is not perceived to constrain development.
Developers should consider the RCC SFRA for further site specific information.
The underlying geology is generally permeable and it is likely that infiltration SuDS will therefore be suitable, subject to individual site conditions.
Table 8-47: Market Overton
Water Resources Wastewater Treatment and Transmission Ecology Flood Risk Management Surface Water Management & SuDS Potential
Market Overton is within the East Midlands WRZ, supplied by Severn Trent Water. It is expected to experience a supply shortfall after 2011/12. The shortfall is predicted at 75 Ml/d by 2019/20 increasing to 110 Ml/d by 2034/35. STW’s WRMP gives a number of proposed methods to meet the deficit.
Market Overton WwTW has headroom for approximately 263 households in its current DWF consent. The sanitary determinand limits on the consent (25 mg/l BOD & 45 mg/l TSS) should allow the possibility of treating to a tighter standard if required.
Market Overton lies upstream of the Wash & North Norfolk coast Natura 2000 site. However, any increases in flow from the WwTW would be unlikely to lead to a significant adverse effect on The Wash SPA/Ramsar site or Wash & North Norfolk Coast SAC.
Continuing the existing levels of management of Rutland Water SPA will ensure there would be no degradation of the integrity of the site due to water resource issues alone.
The town lies within EA Flood Zone 1 and therefore Flood risk is not perceived to constrain development.
Developers should consider the RCC SFRA for further site specific information.
The underlying geology is generally permeable and it is likely that infiltration SuDS will therefore be suitable, subject to individual site conditions.
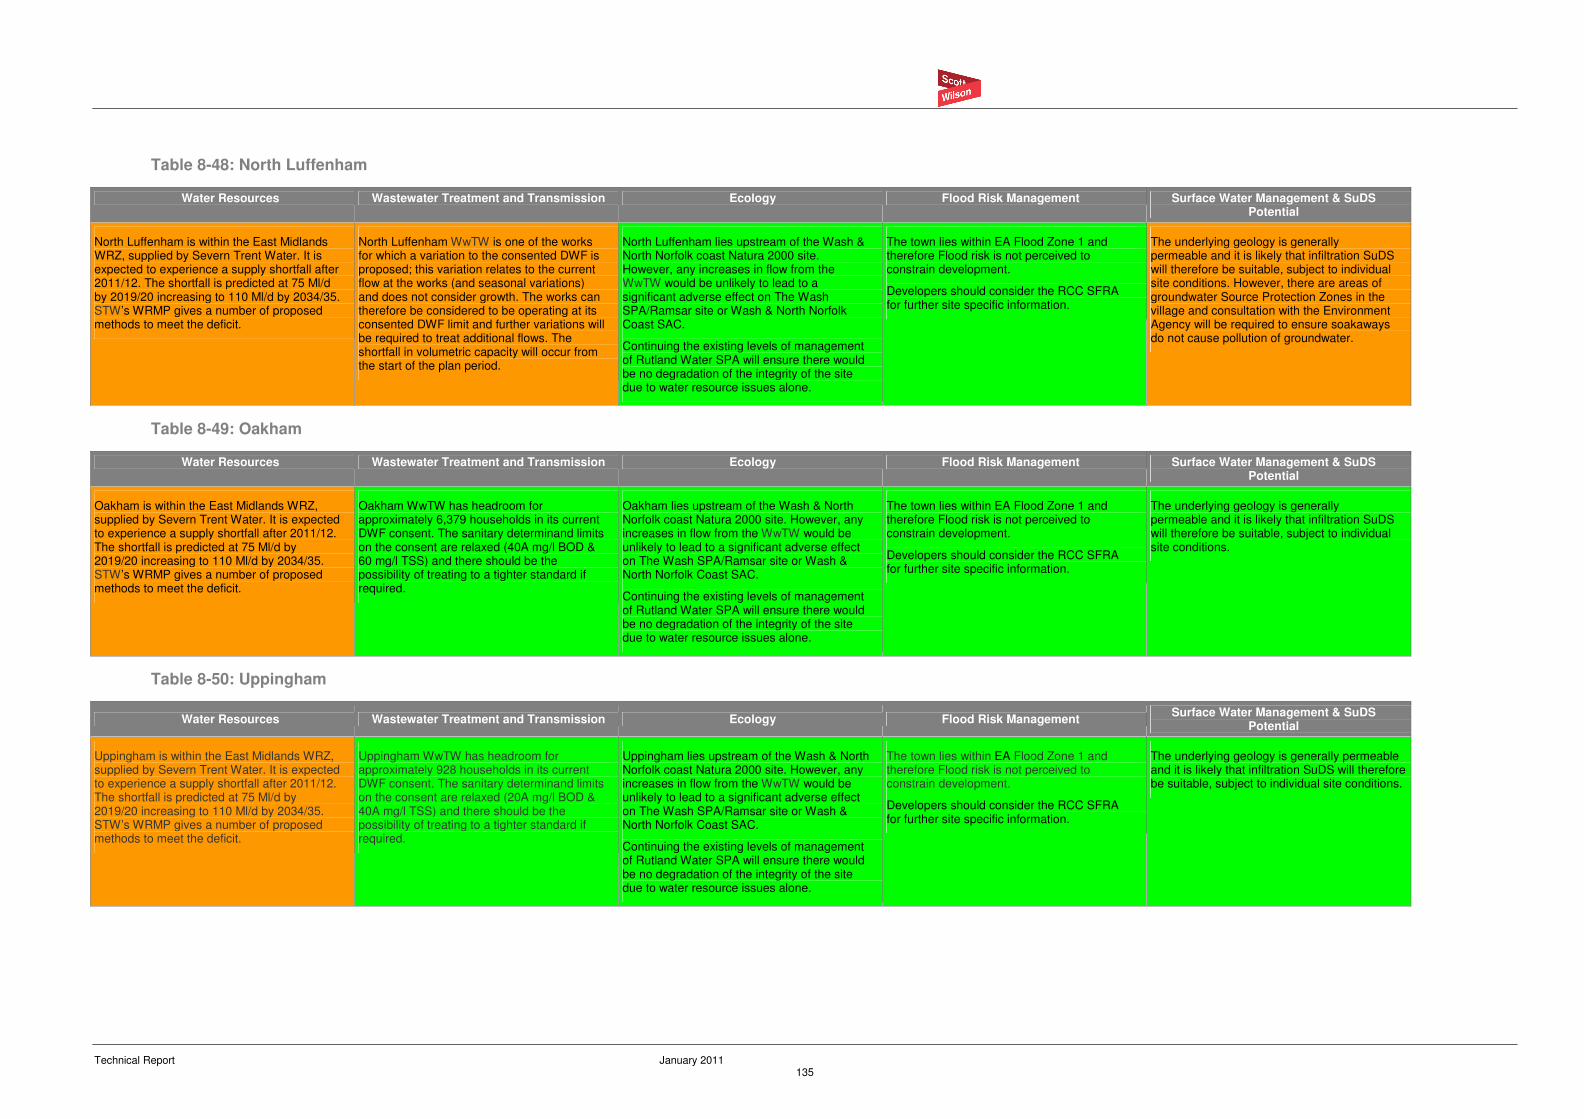
Technical Report January 2011 135
Table 8-48: North Luffenham
Water Resources Wastewater Treatment and Transmission Ecology Flood Risk Management Surface Water Management & SuDS Potential
North Luffenham is within the East Midlands WRZ, supplied by Severn Trent Water. It is expected to experience a supply shortfall after 2011/12. The shortfall is predicted at 75 Ml/d by 2019/20 increasing to 110 Ml/d by 2034/35. STW’s WRMP gives a number of proposed methods to meet the deficit.
North Luffenham WwTW is one of the works for which a variation to the consented DWF is proposed; this variation relates to the current flow at the works (and seasonal variations) and does not consider growth. The works can therefore be considered to be operating at its consented DWF limit and further variations will be required to treat additional flows. The shortfall in volumetric capacity will occur from the start of the plan period.
North Luffenham lies upstream of the Wash & North Norfolk coast Natura 2000 site. However, any increases in flow from the WwTW would be unlikely to lead to a significant adverse effect on The Wash SPA/Ramsar site or Wash & North Norfolk Coast SAC.
Continuing the existing levels of management of Rutland Water SPA will ensure there would be no degradation of the integrity of the site due to water resource issues alone.
The town lies within EA Flood Zone 1 and therefore Flood risk is not perceived to constrain development.
Developers should consider the RCC SFRA for further site specific information.
The underlying geology is generally permeable and it is likely that infiltration SuDS will therefore be suitable, subject to individual site conditions. However, there are areas of groundwater Source Protection Zones in the village and consultation with the Environment Agency will be required to ensure soakaways do not cause pollution of groundwater.
Table 8-49: Oakham
Water Resources Wastewater Treatment and Transmission Ecology Flood Risk Management Surface Water Management & SuDS Potential
Oakham is within the East Midlands WRZ, supplied by Severn Trent Water. It is expected to experience a supply shortfall after 2011/12. The shortfall is predicted at 75 Ml/d by 2019/20 increasing to 110 Ml/d by 2034/35. STW’s WRMP gives a number of proposed methods to meet the deficit.
Oakham WwTW has headroom for approximately 6,379 households in its current DWF consent. The sanitary determinand limits on the consent are relaxed (40A mg/l BOD & 60 mg/l TSS) and there should be the possibility of treating to a tighter standard if required.
Oakham lies upstream of the Wash & North Norfolk coast Natura 2000 site. However, any increases in flow from the WwTW would be unlikely to lead to a significant adverse effect on The Wash SPA/Ramsar site or Wash & North Norfolk Coast SAC.
Continuing the existing levels of management of Rutland Water SPA will ensure there would be no degradation of the integrity of the site due to water resource issues alone.
The town lies within EA Flood Zone 1 and therefore Flood risk is not perceived to constrain development.
Developers should consider the RCC SFRA for further site specific information.
The underlying geology is generally permeable and it is likely that infiltration SuDS will therefore be suitable, subject to individual site conditions.
Table 8-50: Uppingham
Water Resources Wastewater Treatment and Transmission Ecology Flood Risk Management Surface Water Management & SuDS
Potential
Uppingham is within the East Midlands WRZ, supplied by Severn Trent Water. It is expected to experience a supply shortfall after 2011/12. The shortfall is predicted at 75 Ml/d by 2019/20 increasing to 110 Ml/d by 2034/35. STW’s WRMP gives a number of proposed methods to meet the deficit.
Uppingham WwTW has headroom for approximately 928 households in its current DWF consent. The sanitary determinand limits on the consent are relaxed (20A mg/l BOD & 40A mg/l TSS) and there should be the possibility of treating to a tighter standard if required.
Uppingham lies upstream of the Wash & North Norfolk coast Natura 2000 site. However, any increases in flow from the WwTW would be unlikely to lead to a significant adverse effect on The Wash SPA/Ramsar site or Wash & North Norfolk Coast SAC.
Continuing the existing levels of management of Rutland Water SPA will ensure there would be no degradation of the integrity of the site due to water resource issues alone.
The town lies within EA Flood Zone 1 and therefore Flood risk is not perceived to constrain development.
Developers should consider the RCC SFRA for further site specific information.
The underlying geology is generally permeable and it is likely that infiltration SuDS will therefore be suitable, subject to individual site conditions.
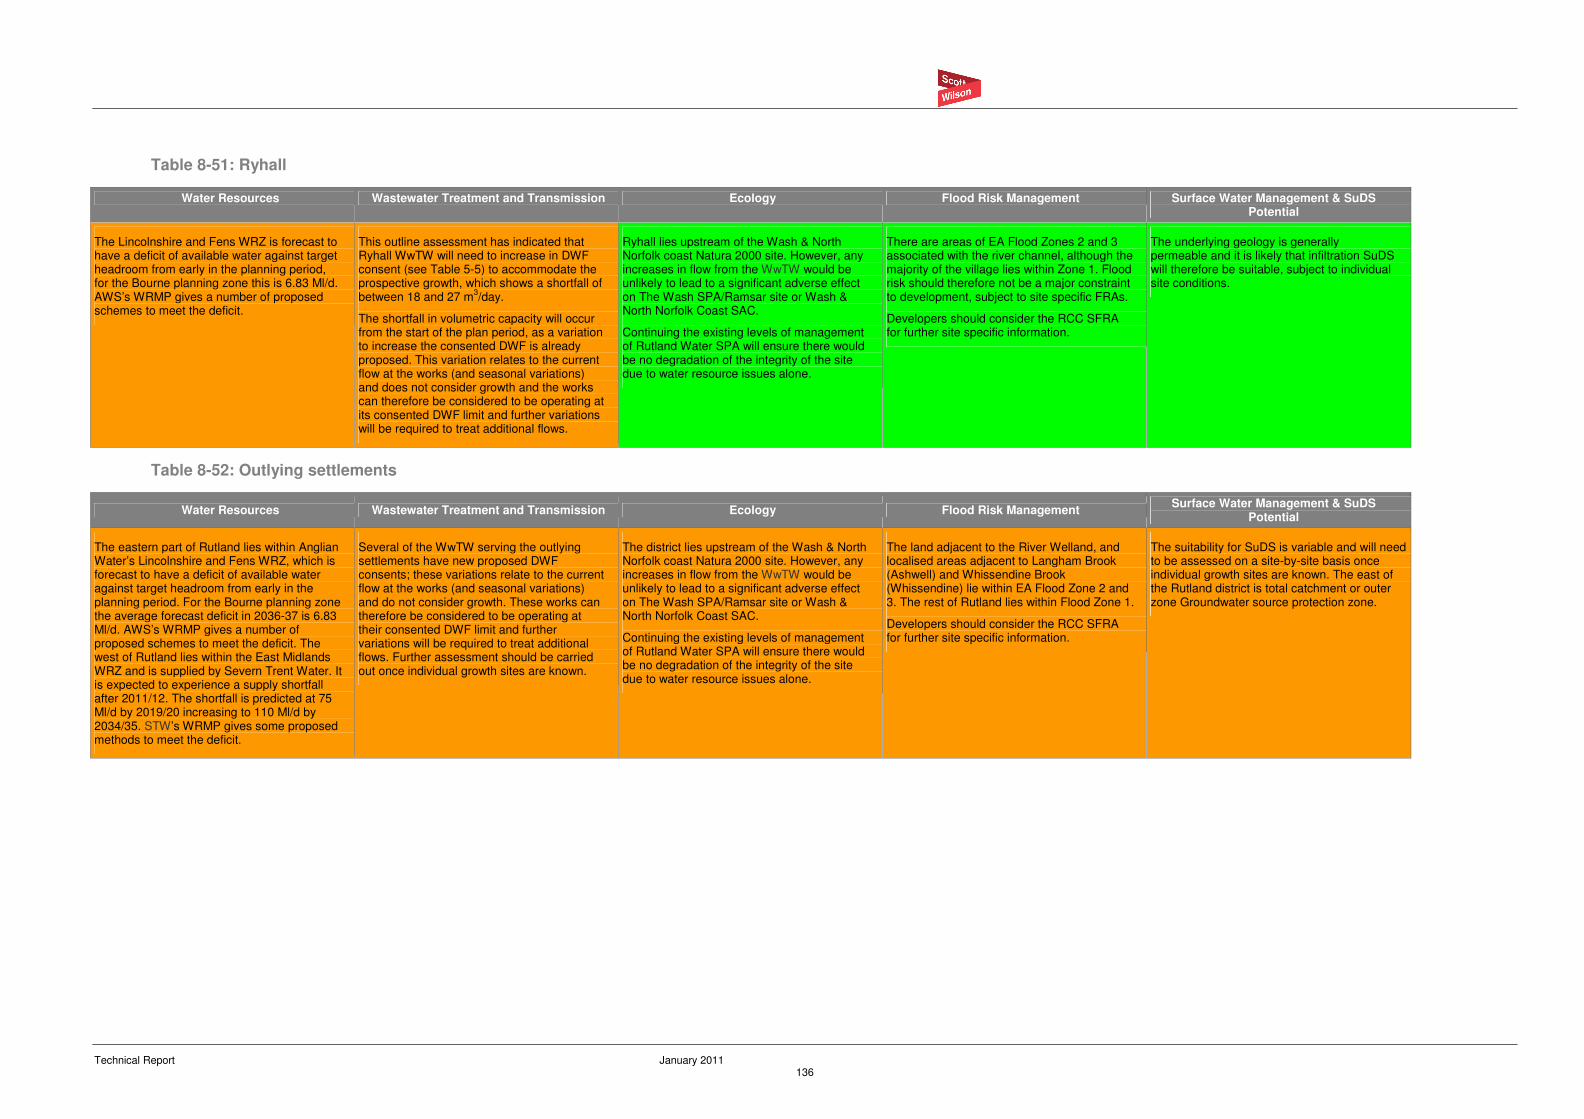
Technical Report January 2011 136
Table 8-51: Ryhall
Water Resources Wastewater Treatment and Transmission Ecology Flood Risk Management Surface Water Management & SuDS Potential
The Lincolnshire and Fens WRZ is forecast to have a deficit of available water against target headroom from early in the planning period, for the Bourne planning zone this is 6.83 Ml/d. AWS’s WRMP gives a number of proposed schemes to meet the deficit.
This outline assessment has indicated that Ryhall WwTW will need to increase in DWF consent (see Table 5-5) to accommodate the prospective growth, which shows a shortfall of between 18 and 27 m
3/day.
The shortfall in volumetric capacity will occur from the start of the plan period, as a variation to increase the consented DWF is already proposed. This variation relates to the current flow at the works (and seasonal variations) and does not consider growth and the works can therefore be considered to be operating at its consented DWF limit and further variations will be required to treat additional flows.
Ryhall lies upstream of the Wash & North Norfolk coast Natura 2000 site. However, any increases in flow from the WwTW would be unlikely to lead to a significant adverse effect on The Wash SPA/Ramsar site or Wash & North Norfolk Coast SAC.
Continuing the existing levels of management of Rutland Water SPA will ensure there would be no degradation of the integrity of the site due to water resource issues alone.
There are areas of EA Flood Zones 2 and 3 associated with the river channel, although the majority of the village lies within Zone 1. Flood risk should therefore not be a major constraint to development, subject to site specific FRAs.
Developers should consider the RCC SFRA for further site specific information.
The underlying geology is generally permeable and it is likely that infiltration SuDS will therefore be suitable, subject to individual site conditions.
Table 8-52: Outlying settlements
Water Resources Wastewater Treatment and Transmission Ecology Flood Risk Management Surface Water Management & SuDS
Potential
The eastern part of Rutland lies within Anglian Water’s Lincolnshire and Fens WRZ, which is forecast to have a deficit of available water against target headroom from early in the planning period. For the Bourne planning zone the average forecast deficit in 2036-37 is 6.83 Ml/d. AWS’s WRMP gives a number of proposed schemes to meet the deficit. The west of Rutland lies within the East Midlands WRZ and is supplied by Severn Trent Water. It is expected to experience a supply shortfall after 2011/12. The shortfall is predicted at 75 Ml/d by 2019/20 increasing to 110 Ml/d by 2034/35. STW’s WRMP gives some proposed methods to meet the deficit.
Several of the WwTW serving the outlying settlements have new proposed DWF consents; these variations relate to the current flow at the works (and seasonal variations) and do not consider growth. These works can therefore be considered to be operating at their consented DWF limit and further variations will be required to treat additional flows. Further assessment should be carried out once individual growth sites are known.
The district lies upstream of the Wash & North Norfolk coast Natura 2000 site. However, any increases in flow from the WwTW would be unlikely to lead to a significant adverse effect on The Wash SPA/Ramsar site or Wash & North Norfolk Coast SAC.
Continuing the existing levels of management of Rutland Water SPA will ensure there would be no degradation of the integrity of the site due to water resource issues alone.
The land adjacent to the River Welland, and localised areas adjacent to Langham Brook (Ashwell) and Whissendine Brook (Whissendine) lie within EA Flood Zone 2 and 3. The rest of Rutland lies within Flood Zone 1.
Developers should consider the RCC SFRA for further site specific information.
The suitability for SuDS is variable and will need to be assessed on a site-by-site basis once individual growth sites are known. The east of the Rutland district is total catchment or outer zone Groundwater source protection zone.
Technical Report January 2011 137
9 Outline Policy Guidance
9.1 Introduction
The following policy recommendations are made to ensure that the emerging Local
Development Frameworks and Core Strategies for the three authorities consider potential
limitations (and opportunities) presented by the water environment and water infrastructure on
growth, and phasing of growth. The policy is also recommended as a starting point to the
replacement of the regional WAT (water based) policies of the revoked RSS.
9.2 Water Cycle Policy
This section draws on the various assessments undertaken in this Outline WCS study and
suggests direction for policies to be included in the LDFs of each of the authorities, to help to
ensure that the aims of this WCS and a sustainable water environment are achieved.
9.2.1 General
Policy Recommendation 1: Development Phasing
New homes should not be built until agreement has been reached with the water and
wastewater provider that sufficient capacity in existing or future water services infrastructure is
available in accordance with the South Holland, South Kesteven and Rutland Outline WCS.
Reason: The WCS has demonstrated some capacity within existing infrastructure; however this
capacity is limited and upgrades (or new) infrastructure is required in some places to deliver full
housing requirements up to 2026. Development must not be permitted to develop until the
water services infrastructure is in place to service it.
9.2.2 Wastewater treatment
Policy Recommendation 2: Strategic Wastewater Treatment
Recognition is made that the provision of upgrades to wastewater treatment facilities at the
following WwTWs in each district is required in order for demands of future growth to be met.
Increased DWF consents, and possibly expansion of the following works will be required:
• Cottesmore;
• Great Casterton;
• North Luffenham;
• Ryhall;
• Crowland;
• Donington;
• Holbeach;
• Deeping;
• Horbling;
Technical Report January 2011 138
• South Witham; and
• Marston; and
• Little Bytham.
Reason: The WCS has demonstrated that some of the WwTW will need increases to
consented DWF (with the possibility of the requirement for the addition of process streams or
expansion the capacity of processes in order to treat the additional flow or to higher standards
to meet current and future water legislation, namely WFD and HD standards). The LDFs need
to ensure that the expansion of WwTW sites, where required, is fully supported.
9.2.3 Water Resources & Supply
Policy Recommendation 3: Protection of Water Resources
New development will not be permitted in Source Protection Zones, as mapped by the
Environment Agency79,
unless the Environment Agency is satisfied that the risk is acceptable.
Reason: The WCS has highlighted that there are numerous Source Protection Zones in the
study area and as such, it is important to continue to protect the areas that recharge the
groundwater through suitable management of surface activities. Several Development locations
are likely to over or close to source protection zones around abstraction boreholes and hence
Environment Agency agreement will need to be achieved for some development types in these
areas.
Policy Recommendation 4: Water demand management
New development should aim to achieve the water use target under Code Levels 3 & 4 of the
Code for Sustainable Homes, and where possible achieve the Environment Agency target for
water neutrality of 95 litres per head per day.
Reason: The WCS has highlighted that higher levels of growth will require new development to
use less water than current policy or legislative requirements and all new development must be
as efficient as possible
9.2.4 Flood risk and drainage
Policy Recommendation 5: Site drainage
All new development, including that on brownfield development, should be served by separate
surface water and wastewater drainage. No new development will be permitted to discharge
runoff to foul drainage connections. Consideration must be given to the requirements of the
various IDBs and an assessment carried out on all receiving watercourses (regardless of
whether it lies within an IDB area) to ensure adequate capacity is available.
Reason: The WCS has highlighted that sewer flooding and Combined Sewer Overflows are an
existing concern in several growth areas in both districts and that with climate change, capacity
will be limited. Therefore further discharges of surface water to foul or combined drainage
should not be permitted to prevent exacerbation of existing problems. Wherever possible,
improvement should be sought to the existing system.
79
http://maps.environment-
agency.gov.uk/wiyby/wiybyController?x=357683.0&y=355134.0&scale=1&layerGroups=default&ep=map&textonly=off&lang=_e&topic=drinkingwater
Technical Report January 2011 139
Policy Recommendation 6: Strategic Flood Risk Assessments
All new development should adhere to the recommendations of the relevant Strategic Flood
Risk Assessment for the District/County.
Reason: To ensure a coordinated approach to flood risk management across the WCS area, in
accordance with the requirements of PPS25.
Policy recommendation 7: Lincolnshire Coastal Study
All new development should adhere to the recommendations of Lincolnshire Coastal Study.
Reason: To ensure a coordinated approach to flood risk management across the WCS area, in
accordance with the requirements of PPS25.
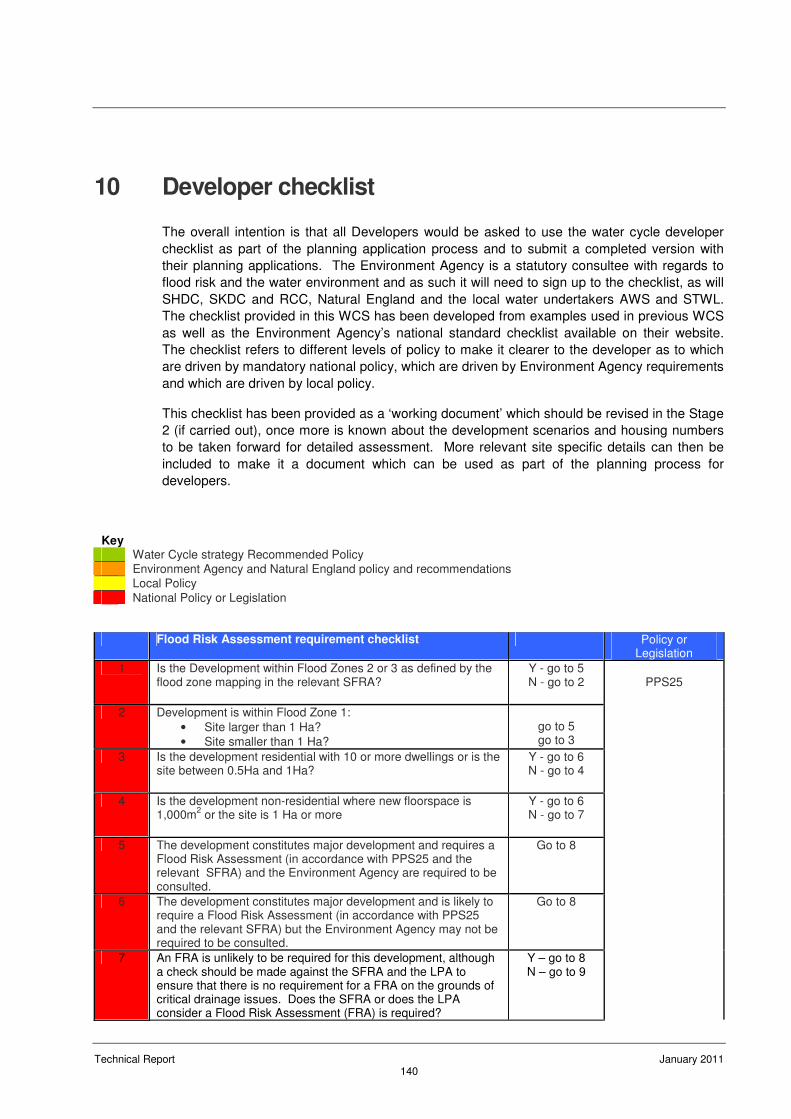
Technical Report January 2011 140
10 Developer checklist
The overall intention is that all Developers would be asked to use the water cycle developer
checklist as part of the planning application process and to submit a completed version with
their planning applications. The Environment Agency is a statutory consultee with regards to
flood risk and the water environment and as such it will need to sign up to the checklist, as will
SHDC, SKDC and RCC, Natural England and the local water undertakers AWS and STWL.
The checklist provided in this WCS has been developed from examples used in previous WCS
as well as the Environment Agency’s national standard checklist available on their website.
The checklist refers to different levels of policy to make it clearer to the developer as to which
are driven by mandatory national policy, which are driven by Environment Agency requirements
and which are driven by local policy.
This checklist has been provided as a ‘working document’ which should be revised in the Stage
2 (if carried out), once more is known about the development scenarios and housing numbers
to be taken forward for detailed assessment. More relevant site specific details can then be
included to make it a document which can be used as part of the planning process for
developers.
Key Water Cycle strategy Recommended Policy Environment Agency and Natural England policy and recommendations Local Policy National Policy or Legislation
Flood Risk Assessment requirement checklist Policy or Legislation
1 Is the Development within Flood Zones 2 or 3 as defined by the flood zone mapping in the relevant SFRA?
Y - go to 5 N - go to 2
2 Development is within Flood Zone 1:
• Site larger than 1 Ha?
• Site smaller than 1 Ha?
go to 5 go to 3
3 Is the development residential with 10 or more dwellings or is the site between 0.5Ha and 1Ha?
Y - go to 6 N - go to 4
4 Is the development non-residential where new floorspace is 1,000m
2 or the site is 1 Ha or more
Y - go to 6 N - go to 7
5 The development constitutes major development and requires a Flood Risk Assessment (in accordance with PPS25 and the relevant SFRA) and the Environment Agency are required to be consulted.
Go to 8
6 The development constitutes major development and is likely to require a Flood Risk Assessment (in accordance with PPS25 and the relevant SFRA) but the Environment Agency may not be required to be consulted.
Go to 8
7 An FRA is unlikely to be required for this development, although a check should be made against the SFRA and the LPA to ensure that there is no requirement for a FRA on the grounds of critical drainage issues. Does the SFRA or does the LPA consider a Flood Risk Assessment (FRA) is required?
Y – go to 8 N – go to 9
PPS25
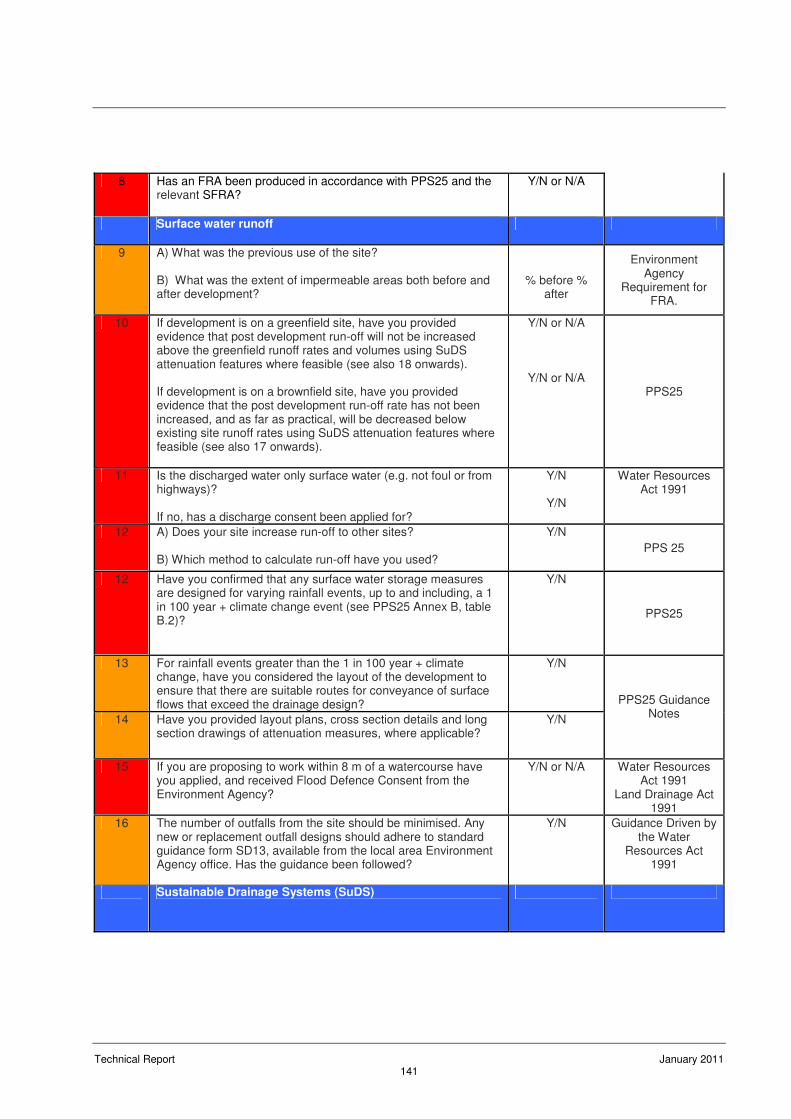
Technical Report January 2011 141
8 Has an FRA been produced in accordance with PPS25 and the relevant SFRA?
Y/N or N/A
Surface water runoff
9 A) What was the previous use of the site? B) What was the extent of impermeable areas both before and after development?
% before % after
Environment Agency
Requirement for FRA.
10 If development is on a greenfield site, have you provided evidence that post development run-off will not be increased above the greenfield runoff rates and volumes using SuDS attenuation features where feasible (see also 18 onwards). If development is on a brownfield site, have you provided evidence that the post development run-off rate has not been increased, and as far as practical, will be decreased below existing site runoff rates using SuDS attenuation features where feasible (see also 17 onwards).
Y/N or N/A
Y/N or N/A PPS25
11 Is the discharged water only surface water (e.g. not foul or from highways)? If no, has a discharge consent been applied for?
Y/N
Y/N
Water Resources Act 1991
12 A) Does your site increase run-off to other sites? B) Which method to calculate run-off have you used?
Y/N
PPS 25
12 Have you confirmed that any surface water storage measures are designed for varying rainfall events, up to and including, a 1 in 100 year + climate change event (see PPS25 Annex B, table B.2)?
Y/N
PPS25
13 For rainfall events greater than the 1 in 100 year + climate change, have you considered the layout of the development to ensure that there are suitable routes for conveyance of surface flows that exceed the drainage design?
Y/N
14 Have you provided layout plans, cross section details and long section drawings of attenuation measures, where applicable?
Y/N
PPS25 Guidance Notes
15 If you are proposing to work within 8 m of a watercourse have you applied, and received Flood Defence Consent from the Environment Agency?
Y/N or N/A Water Resources Act 1991
Land Drainage Act 1991
16 The number of outfalls from the site should be minimised. Any new or replacement outfall designs should adhere to standard guidance form SD13, available from the local area Environment Agency office. Has the guidance been followed?
Y/N Guidance Driven by the Water
Resources Act 1991
Sustainable Drainage Systems (SuDS)
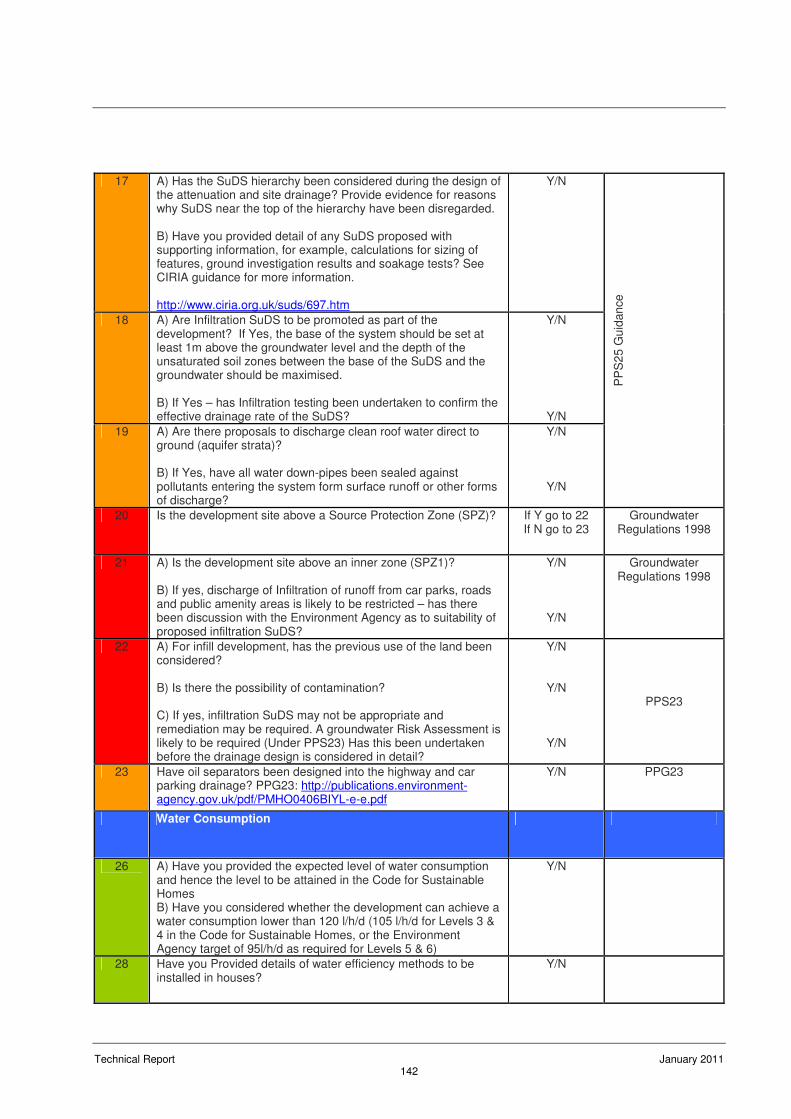
Technical Report January 2011 142
17 A) Has the SuDS hierarchy been considered during the design of the attenuation and site drainage? Provide evidence for reasons why SuDS near the top of the hierarchy have been disregarded. B) Have you provided detail of any SuDS proposed with supporting information, for example, calculations for sizing of features, ground investigation results and soakage tests? See CIRIA guidance for more information. http://www.ciria.org.uk/suds/697.htm
Y/N
18 A) Are Infiltration SuDS to be promoted as part of the development? If Yes, the base of the system should be set at least 1m above the groundwater level and the depth of the unsaturated soil zones between the base of the SuDS and the groundwater should be maximised. B) If Yes – has Infiltration testing been undertaken to confirm the effective drainage rate of the SuDS?
Y/N
Y/N
19 A) Are there proposals to discharge clean roof water direct to ground (aquifer strata)? B) If Yes, have all water down-pipes been sealed against pollutants entering the system form surface runoff or other forms of discharge?
Y/N
Y/N
PP
S2
5 G
uid
an
ce
20 Is the development site above a Source Protection Zone (SPZ)? If Y go to 22 If N go to 23
Groundwater Regulations 1998
21 A) Is the development site above an inner zone (SPZ1)? B) If yes, discharge of Infiltration of runoff from car parks, roads and public amenity areas is likely to be restricted – has there been discussion with the Environment Agency as to suitability of proposed infiltration SuDS?
Y/N
Y/N
Groundwater Regulations 1998
22 A) For infill development, has the previous use of the land been considered? B) Is there the possibility of contamination? C) If yes, infiltration SuDS may not be appropriate and remediation may be required. A groundwater Risk Assessment is likely to be required (Under PPS23) Has this been undertaken before the drainage design is considered in detail?
Y/N
Y/N
Y/N
PPS23
23 Have oil separators been designed into the highway and car parking drainage? PPG23: http://publications.environment-agency.gov.uk/pdf/PMHO0406BIYL-e-e.pdf
Y/N PPG23
Water Consumption
26 A) Have you provided the expected level of water consumption and hence the level to be attained in the Code for Sustainable Homes B) Have you considered whether the development can achieve a water consumption lower than 120 l/h/d (105 l/h/d for Levels 3 & 4 in the Code for Sustainable Homes, or the Environment Agency target of 95l/h/d as required for Levels 5 & 6)
Y/N
28 Have you Provided details of water efficiency methods to be installed in houses?
Y/N
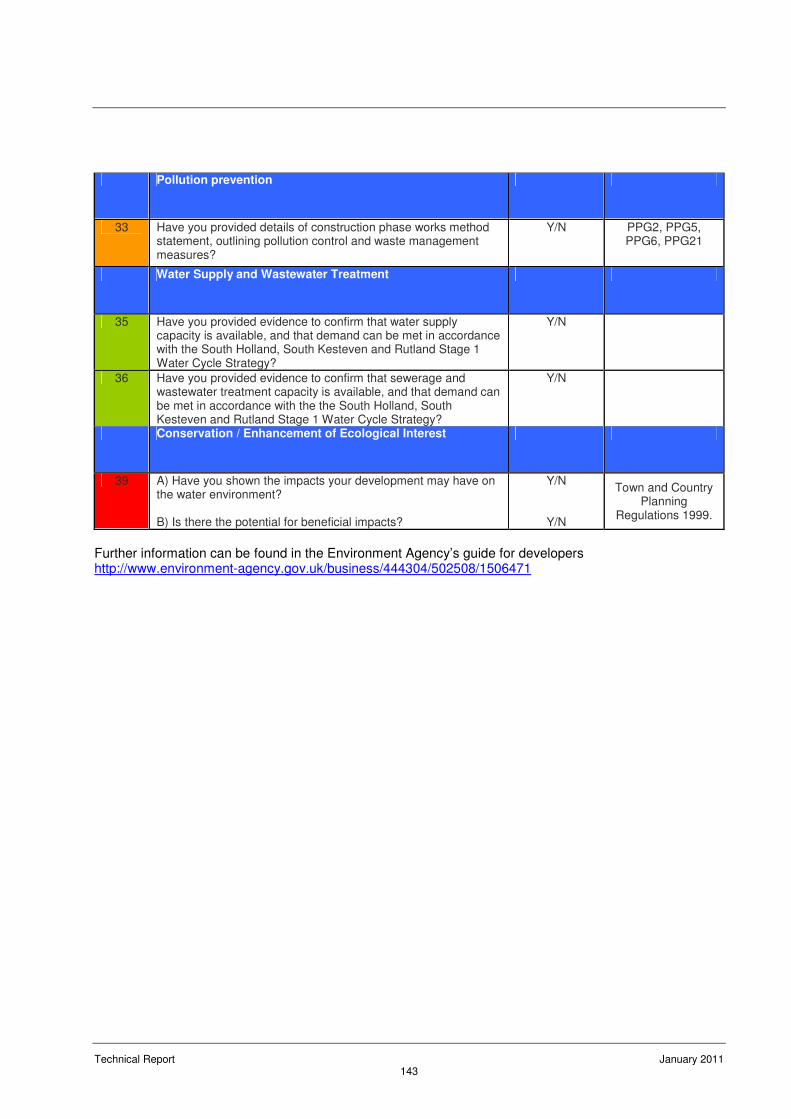
Technical Report January 2011 143
Pollution prevention
33 Have you provided details of construction phase works method statement, outlining pollution control and waste management measures?
Y/N PPG2, PPG5, PPG6, PPG21
Water Supply and Wastewater Treatment
35 Have you provided evidence to confirm that water supply capacity is available, and that demand can be met in accordance with the South Holland, South Kesteven and Rutland Stage 1 Water Cycle Strategy?
Y/N
36 Have you provided evidence to confirm that sewerage and wastewater treatment capacity is available, and that demand can be met in accordance with the the South Holland, South Kesteven and Rutland Stage 1 Water Cycle Strategy?
Y/N
Conservation / Enhancement of Ecological Interest
39 A) Have you shown the impacts your development may have on the water environment? B) Is there the potential for beneficial impacts?
Y/N
Y/N
Town and Country Planning
Regulations 1999.
Further information can be found in the Environment Agency’s guide for developers http://www.environment-agency.gov.uk/business/444304/502508/1506471
Technical Report January 2011 144
11 Recommendations for Detailed Study
This Outline Water Cycle Study has identified the key constraints to growth in the districts of
South Holland, South Kesteven and Rutland for three different growth strategies.
The study has demonstrated that there are twelve WwTW where consented DWF is limited.
Furthermore, the study has shown that higher levels of growth may exceed the limit of growth
catered for in STWL’s and AWS’s current water resource planning and that stringent targets for
water use, and a push towards water neutrality, are likely to be required to deliver higher
growth levels.
This Outline assessment has been undertaken at a strategic level based on best estimates of
where growth is likely to occur on a town or village basis. At the time of undertaking the study,
the preferred list of development sites was not available for the whole study area to allow more
detailed site specific assessments. The following recommendations are therefore made for the
Stage 2 Detailed WCS:
a) It is essential that, if available, preferred development sites are agreed for all authorities and
provided to inform a more detailed assessment in Stage 2;
b) A preferred growth scenario should be selected to allow preferred solutions to be developed
and tested via the sustainability assessment;
c) Options for increased wastewater treatment capacity at twelve WwTW will be required to
allow growth to proceed;
d) Where discharge consent volumes will be increased, an assessment of impact on flood risk
of receiving watercourses should be undertaken;
e) Wastewater network modelling at several locations is required to determine when and where
new developer funded mains will be required;
f) A full assessment of the existing capacity of the sewage pumping stations and location and
type of permitted sewage overflows to watercourses should be made included within the
next phase of the WCS.
g) More detailed SuDS requirements, including options and techniques using the relevant
CIRIA guidance80
, should be provided for preferred development sites when known,
including deriving values for permitted runoff rates, options for linkage with green
infrastructure;
h) Recommendations for the production of a Surface Water Management Plan for all major
areas of allocated urban development; and
i) Infrastructure phasing timelines should be produced for each growth area to determine
impact of infrastructure and mitigation provision on housing delivery.
80
http://www.ciria.com/suds/

Technical Report January 2011 145
12 Appendices
Technical Report January 2011 146
12.1 Appendix A - Stakeholder Communications Strategy
Stakeholder Grouping and Definitions
Tier 1
Lead partner authority provided with fortnightly project updates by email or phone to the lead
project manager; ongoing consultation on the findings of the study; and leaders of all steering
group meetings and report direction.
Tier 2
Wider Steering Group (Environment Agency, Natural England, water companies) – attendance
at proposed stakeholder workshops (see below), monthly steering group updates, attendance at
2 steering group meetings, invitation to comment on Scoping outputs; agreement on final WCS
Outline report.
Tier 3
Wider stakeholders – Contact for additional useful information on local infrastructure, potential
circulation of agreed Scoping Study outputs for information and comment to feed into Phase 2.
This is likely to include British Waterways, IDBs and Highways Agency.
Tier 4
Provide findings of the joint Scoping and Outline Study – this tier is likely to include parish
councils and neighbouring authorities.
Frequency and Level of Consultation
Tier 1
• Contacted for data;
• Fortnightly updates to SHDC specifically;
• Attendance at steering group meetings;
• Provision of comments on draft Outline and Detailed WCS essential; and
• Sign off to final reports essential.
Tier 2
• Contacted for data (EA, NE, AWS, STWL);
• Data specific meetings to discuss methods and data issues (EA, AWS);
• Provision of comments on draft Outline and Detailed WCS essential (EA, AWS, STWL, NE);
• Sign off to final reports essential (AWS, STWL, EA); and
• Sign off to final reports desirable but not essential (NE, IDBs, LCC).
Tier 3
• Requested for specific information/data required for specific elements of the study (not all
stakeholders in this tier will need to be contacted; and
• Provision of Outline WCS report;
Tier 4
• Provision of outline WCS report.
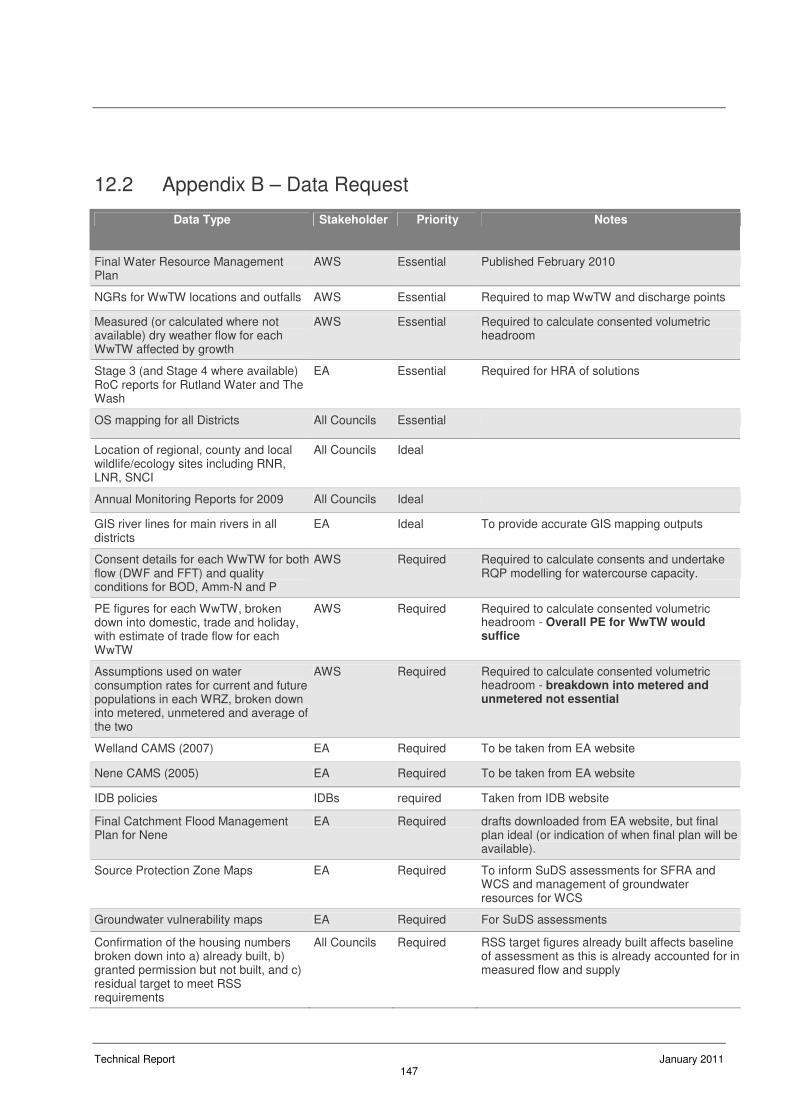
Technical Report January 2011 147
12.2 Appendix B – Data Request
Data Type Stakeholder Priority Notes
Final Water Resource Management Plan
AWS Essential Published February 2010
NGRs for WwTW locations and outfalls AWS Essential Required to map WwTW and discharge points
Measured (or calculated where not available) dry weather flow for each WwTW affected by growth
AWS Essential Required to calculate consented volumetric headroom
Stage 3 (and Stage 4 where available) RoC reports for Rutland Water and The Wash
EA Essential Required for HRA of solutions
OS mapping for all Districts All Councils Essential
Location of regional, county and local wildlife/ecology sites including RNR, LNR, SNCI
All Councils Ideal
Annual Monitoring Reports for 2009 All Councils Ideal
GIS river lines for main rivers in all districts
EA Ideal To provide accurate GIS mapping outputs
Consent details for each WwTW for both flow (DWF and FFT) and quality conditions for BOD, Amm-N and P
AWS Required Required to calculate consents and undertake RQP modelling for watercourse capacity.
PE figures for each WwTW, broken down into domestic, trade and holiday, with estimate of trade flow for each WwTW
AWS Required Required to calculate consented volumetric headroom - Overall PE for WwTW would suffice
Assumptions used on water consumption rates for current and future populations in each WRZ, broken down into metered, unmetered and average of the two
AWS Required Required to calculate consented volumetric headroom - breakdown into metered and unmetered not essential
Welland CAMS (2007) EA Required To be taken from EA website
Nene CAMS (2005) EA Required To be taken from EA website
IDB policies IDBs required Taken from IDB website
Final Catchment Flood Management Plan for Nene
EA Required drafts downloaded from EA website, but final plan ideal (or indication of when final plan will be available).
Source Protection Zone Maps EA Required To inform SuDS assessments for SFRA and WCS and management of groundwater resources for WCS
Groundwater vulnerability maps EA Required For SuDS assessments
Confirmation of the housing numbers broken down into a) already built, b) granted permission but not built, and c) residual target to meet RSS requirements
All Councils Required RSS target figures already built affects baseline of assessment as this is already accounted for in measured flow and supply
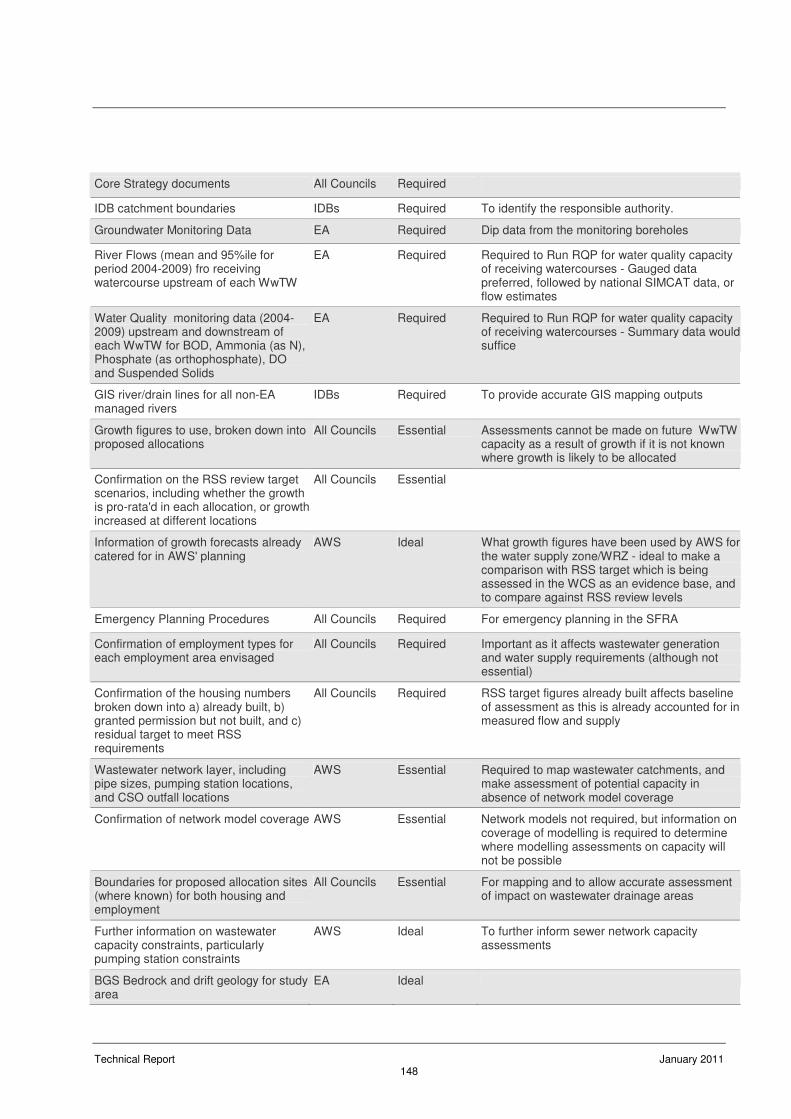
Technical Report January 2011 148
Core Strategy documents All Councils Required
IDB catchment boundaries IDBs Required To identify the responsible authority.
Groundwater Monitoring Data EA Required Dip data from the monitoring boreholes
River Flows (mean and 95%ile for period 2004-2009) fro receiving watercourse upstream of each WwTW
EA Required Required to Run RQP for water quality capacity of receiving watercourses - Gauged data preferred, followed by national SIMCAT data, or flow estimates
Water Quality monitoring data (2004-2009) upstream and downstream of each WwTW for BOD, Ammonia (as N), Phosphate (as orthophosphate), DO and Suspended Solids
EA Required Required to Run RQP for water quality capacity of receiving watercourses - Summary data would suffice
GIS river/drain lines for all non-EA managed rivers
IDBs Required To provide accurate GIS mapping outputs
Growth figures to use, broken down into proposed allocations
All Councils Essential Assessments cannot be made on future WwTW capacity as a result of growth if it is not known where growth is likely to be allocated
Confirmation on the RSS review target scenarios, including whether the growth is pro-rata'd in each allocation, or growth increased at different locations
All Councils Essential
Information of growth forecasts already catered for in AWS' planning
AWS Ideal What growth figures have been used by AWS for the water supply zone/WRZ - ideal to make a comparison with RSS target which is being assessed in the WCS as an evidence base, and to compare against RSS review levels
Emergency Planning Procedures All Councils Required For emergency planning in the SFRA
Confirmation of employment types for each employment area envisaged
All Councils Required Important as it affects wastewater generation and water supply requirements (although not essential)
Confirmation of the housing numbers broken down into a) already built, b) granted permission but not built, and c) residual target to meet RSS requirements
All Councils Required RSS target figures already built affects baseline of assessment as this is already accounted for in measured flow and supply
Wastewater network layer, including pipe sizes, pumping station locations, and CSO outfall locations
AWS Essential Required to map wastewater catchments, and make assessment of potential capacity in absence of network model coverage
Confirmation of network model coverage AWS Essential Network models not required, but information on coverage of modelling is required to determine where modelling assessments on capacity will not be possible
Boundaries for proposed allocation sites (where known) for both housing and employment
All Councils Essential For mapping and to allow accurate assessment of impact on wastewater drainage areas
Further information on wastewater capacity constraints, particularly pumping station constraints
AWS Ideal To further inform sewer network capacity assessments
BGS Bedrock and drift geology for study area
EA Ideal
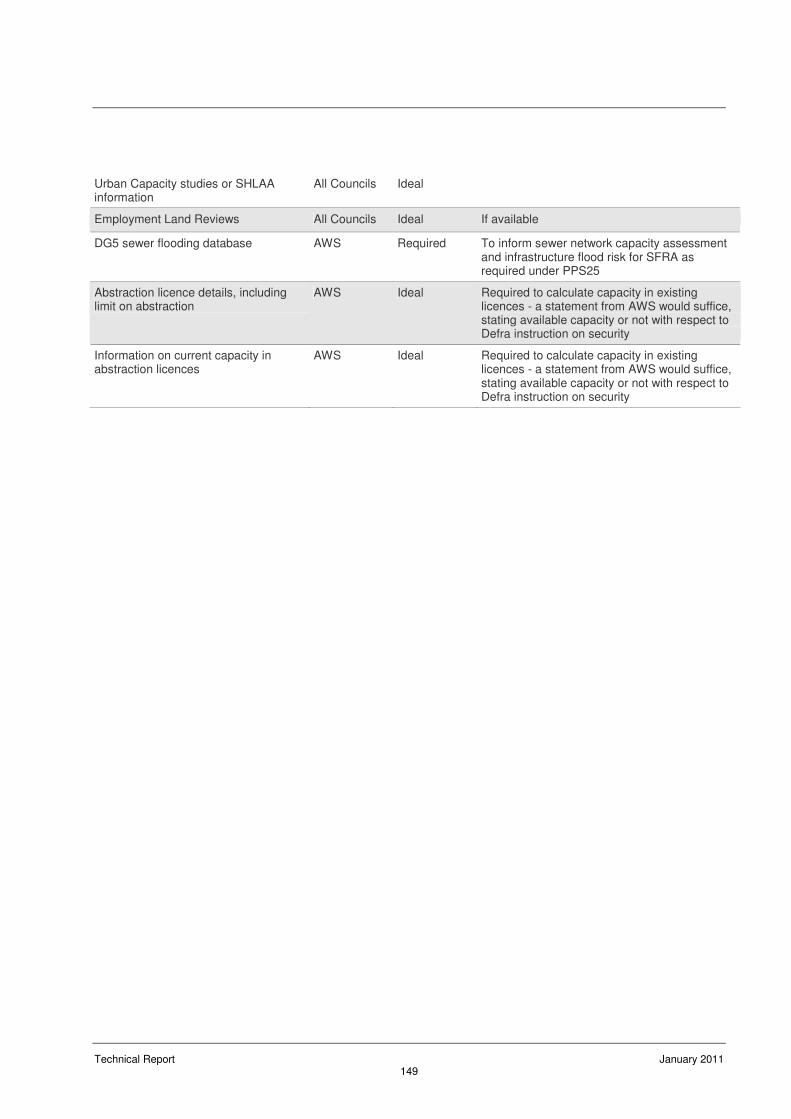
Technical Report January 2011 149
Urban Capacity studies or SHLAA information
All Councils Ideal
Employment Land Reviews All Councils Ideal If available
DG5 sewer flooding database AWS Required To inform sewer network capacity assessment and infrastructure flood risk for SFRA as required under PPS25
Abstraction licence details, including limit on abstraction
AWS Ideal Required to calculate capacity in existing licences - a statement from AWS would suffice, stating available capacity or not with respect to Defra instruction on security
Information on current capacity in abstraction licences
AWS Ideal Required to calculate capacity in existing licences - a statement from AWS would suffice, stating available capacity or not with respect to Defra instruction on security
Related Documents