Prepared for the San Luis Obispo Regional Transit Authority South County Transit Short-Range Transit Plan LSC Transportation Consultants, Inc.

Welcome message from author
This document is posted to help you gain knowledge. Please leave a comment to let me know what you think about it! Share it to your friends and learn new things together.
Transcript

Prepared for the
San Luis Obispo Regional Transit Authority
South County Transit Short-Range Transit Plan
LSC Transportation Consultants, Inc.


San Luis Obispo South County Transit Short-Range Transit Plan
FY’s 2019 – 20 to 2026 – 27
Prepared for the
San Luis Obispo Regional Transit Authority 179 Cross Street
San Luis Obispo, CA 93401 (805) 781-4465
Prepared by
LSC Transportation Consultants, Inc. 2690 Lake Forest Road, Suite C
P.O. Box 5875 Tahoe City, California 96145
(530) 583-4053
December 23, 2019


San Luis Obispo South County Transit LSC Transportation Consultants, Inc Short Range Transit Plan Page i
TABLE OF CONTENTS Chapter 1: Study Setting ............................................................................................................................... 1 Chapter 2: Transportation Services .............................................................................................................. 3 Chapter 3: Review of Existing Plans and Documents .................................................................................. 31 Chapter 4: Review of Existing Goals and Objectives and Monitoring Procedures ..................................... 43 Chapter 5: Service Performance Evaluation ............................................................................................... 53 Chapter 6: Peer System Analysis ................................................................................................................. 87 Chapter 7: Demographic Analysis ............................................................................................................... 93 Chapter 8: Stakeholder Input .................................................................................................................... 101 Chapter 9: Passenger Surveys ................................................................................................................... 105 Chapter 10: SoCo Transit and Avila-Pismo Trolley Service Alternatives ................................................... 113 Chapter 11: Dial-A-Ride and Other Service Alternatives .......................................................................... 137 Chapter 12: Capital Alternatives ............................................................................................................... 159 Chapter 13: Institutional Alternatives ....................................................................................................... 165 Chapter 14: Financial Alternatives ............................................................................................................ 169 Chapter 15: SoCo Transit Short-Range Transit Plan .................................................................................. 171 Chapter 16: Dial-A-Ride Short-Range Transit Plan .................................................................................... 181
LIST OF TABLES TABLE PAGE
1 SoCo Transit Travel Times .............................................................................................................. 10 2 SoCo Transit Annual Ridership ....................................................................................................... 13 3 SoCo Transit Hours and Miles of Service ....................................................................................... 14 4 SoCo Transit Historic Revenue ...................................................................................................... 16 5 SoCo Transit Historic Expenditures ................................................................................................ 18 6 SoCo Transit Cost Allocation Model ............................................................................................... 20 7 SoCo Transit Fleet .......................................................................................................................... 21

LSC Transportation Consultants, Inc. San Luis Obispo South County Transit Page ii Short Range Transit Plan
8 Demand Services Ridership, Hours and Miles ............................................................................... 23 9 SLOCAT County Program Revenues ............................................................................................... 24 10 San Luis Obispo County Services and Expenses ............................................................................. 24 11 County Services Cost Allocation Model ......................................................................................... 25 12 RTA 10 Ridership, Hours, and Miles of Service .............................................................................. 27 13 SoCo Transit Standards of Excellence -- Sections 1 to 3 ................................................................ 47 14 SoCo Transit Standards of Excellence -- Sections 4 to 6 ................................................................ 48 15 SoCo Transit Fixed Route Performance Analysis ........................................................................... 54 16 SoCo Transit Route Ridership & Productivity History .................................................................... 57 17 SoCo Transit Annual Ridership by Day of Week ............................................................................ 58 18 SoCo Transit Annual Ridership by Service Area ............................................................................. 59 19 Avila-Pismo Trolley Ridership and Productivity Trends ................................................................. 60 20 SoCo Transit Ridership by Route by Hour ...................................................................................... 61 21 SoCo Transit On-Time Performance .............................................................................................. 64 22 Average Weekday Passenger Activity by Stop – Route 21 ............................................................ 65 23 Average Weekday Passenger Activity by Stop – Route 24 ............................................................ 67 24 Average Weekday Passenger Activity by Stop – Route 27 ............................................................ 68 25 Average Weekday Passenger Activity by Stop – Route 28 ............................................................ 70 26 SoCo Transit Total Average Weekday Passenger Activity by Stop................................................. 71 27 Average Daily Passenger Activity by Stop: Avila-Pismo Trolley ..................................................... 72 28 SoCo Transit Maximum Passenger Load by Run ............................................................................ 74 29 SoCo Transit Fixed Route Ridership by Fare Type – October 2019 ............................................... 75 30 Dial-a-Ride Performance Analysis .................................................................................................. 77 31 Nipomo Dial-a-Ride Ridership by Day of Week ............................................................................. 79 32 Nipomo Dial-a-Ride Average Boardings per Hour ......................................................................... 79 33 Nipomo Dial-a-Ride Average Daily Trips by Origin and Destination .............................................. 80 34 Paso Robles Dial-a-Ride by Day of Week ....................................................................................... 82 35 Paso Robles Dial-a-Ride Average Boardings by Hour..................................................................... 82 36 Paso Robles Dial-a-Ride Total Monthly Trips by Origin and Destination ....................................... 83 37 Summary of On-Time Performance for Dial-a-Ride Rides ............................................................. 85 38 Dial-a-Ride Cancellation and No Show Rates ................................................................................. 86 39 SoCo Transit Fixed Route Peer Analysis ......................................................................................... 88 40 RTA Dial-a-Ride Peer Analysis ........................................................................................................ 91 41 SoCo Transit Fare Peer Comparison .............................................................................................. 92 42 Population Demographics for South San Luis Obispo County ....................................................... 94 43 Responses to Survey Questions 2,5-11, and 13 ........................................................................... 106 44 Transfers on SoCo Routes ............................................................................................................ 107 45 SoCo Transit Characteristics ........................................................................................................ 109 46 Responses to Survey Questions 16-22 ......................................................................................... 109 47 Service Improvements by Route .................................................................................................. 111 48 SoCo Transit Fixed Route Alternatives Analysis ........................................................................... 114 49 SoCo Transit Fixed Route Service Alternatives Performance Analysis ........................................ 129

San Luis Obispo South County Transit LSC Transportation Consultants, Inc Short Range Transit Plan Page iii
50 Review of Nipomo Dial-a-Ride Availability for Fixed Route Service ............................................ 139 51 Example Schedule of Nipomo 30-Minute Fixed Route ................................................................ 141 52 Analysis of Nipomo Dial-a-Ride Capacity Assuming Fixed Route Service .................................... 141 53 Dial-a-Ride and Other Service Alternatives Analysis ................................................................... 142 54 Example Schedule of Nipomo Hourly Flex Route and Fixed Commuter Routes ......................... 144 55 Dial-a-Ride and Other Fixed Route Service Alternatives Performance Analysis .......................... 152 56 Fleet Replacement ....................................................................................................................... 159 57 SoCo Transit Fixed Route Bus Size Review ................................................................................... 160 58 SoCo Transit Stop Improvements ................................................................................................ 163 59 SoCo Transit Fare Change Analysis .............................................................................................. 169 60 Comparison of SoCo Transit and RTA Fare Structure .................................................................. 170 61 SoCo Transit SRTP Estimated Annual Operating Cost .................................................................. 176 62 SoCo Transit SRTP Estimated Annual Ridership ........................................................................... 177 63 SoCo Transit SRTP Estimated Annual Farebox Revenues ............................................................ 177 64 SoCo Transit SRTP Financial Plan – Financially Constrained ........................................................ 178 65 SoCo Transit Short Range Capital Plan ......................................................................................... 179 66 Dial-a-Ride SRTP Estimated Annual Operating Cost .................................................................... 184 67 Dial-a-Ride SRTP Estimated Annual Ridership ............................................................................. 185 68 Dial-a-Ride SRTP Financial Plan .................................................................................................... 186
LIST OF FIGURES
FIGURE PAGE
1 South County Transit Organization Chart ........................................................................................ 4 2 SLORTA Organizational Chart ........................................................................................................... 5 3 South County Transit Fixed Routes .................................................................................................. 6 4 Dial-a-Ride Service Areas ................................................................................................................. 7 5 Avila/Pismo Trolley Route ................................................................................................................ 8 6 July 2017 – SoCo Transit Passenger Boardings by Fare Type ........................................................ 12 7 SoCo Transit and Trolley Ridership by Month ............................................................................... 14 8 SoCo Transit 2018 Revenues .......................................................................................................... 17 9 SoCo Transit 2018 Expenses .......................................................................................................... 19 10 SoCo Transit Service Productivity by Route and Day of Week ...................................................... 55 11 SoCo Transit Subsidy per Passenger-Trip by Route and Day of Week ........................................... 55 12 SoCo Transit Ridership & Productivity History............................................................................... 57 13 SoCo Transit Hourly Ridership by Route ........................................................................................ 62 14 Route 21 and 24 Average Daily Boarding and Alightings ............................................................... 66 15 Route 27 and 28 Average Daily Boarding and Alightings ............................................................... 69 16 Total Average Daily Boardings and Alightings – Avila-Pismo Trolley ............................................. 73 17 Nipomo Dial-a-Ride Passengers by Hour of Day ............................................................................ 79 18 Nipomo Dial-a-Ride Service Area and Average Weekday Trips by Origin and Destination ........... 81

LSC Transportation Consultants, Inc. San Luis Obispo South County Transit Page iv Short Range Transit Plan
19 Paso Robles Dial-a-Ride Service Area and Average Weekday Trips by Origin and Destination .... 84 20 Youth Population by Census Tract ................................................................................................. 95 21 Senior Population by Census Tract ................................................................................................ 96 22 People Living Below the Poverty Line by Census Tract .................................................................. 98 23 Population with a Disability by Census Tract ................................................................................. 99 24 Zero Vehicle Households by Census Tract ................................................................................... 100 25 Q14 – Opinions of SoCo Transit Services Ranked 1 (Poor) through 4 (Excellent)........................ 108 26 Q22 – What service or customer improvements would you like to see? .................................... 110 27 Nipomo Dial-a-Ride Opinions of SoCo Transit Services Ranked 1 (Poor) through 4 (Excellent) .. 112 28 Potential SoCo Route Revisions ................................................................................................... 118 29 Comparison of Daily Traffic Counts on Avila Beach Drive with Days of Trolley Service .............. 126 30 SoCo Transit Service Alternatives Annual Ridership Impact ........................................................ 130 31 SoCo Transit Service Alternatives Annual Operating Subsidy Impact ......................................... 131 32 SoCo Transit Service Alternatives Passengers per Vehicle Service-Hour..................................... 132 33 SoCo Transit Service Alternatives Operating Subsidy per Passenger .......................................... 133 34 Nipomo Route Alternatives ......................................................................................................... 140 35 Potential Nipomo DAR Service Expansion Area ........................................................................... 145 36 Route 9 Alternative to Serve Eastern Templeton ........................................................................ 150 37 Dial-a-Ride and Other Service Alternatives Annual Ridership Impact ......................................... 153 38 Dial-a-Ride and Other Service Alternatives Annual Operating Subsidy Impact ........................... 154 39 Dial-a-Ride and Other Fixed Route Alternatives Passengers per Vehicle Service-Hour .............. 155 40 Dial-a-Ride and Other Service Alternatives Operating Subsidy per Passenger Trip .................... 156 41 SoCo Transit Short Range Transit Plan ......................................................................................... 172 42 Dial-a-Ride Short Range Transit Plan ........................................................................................... 182
San Luis Obispo South County Transit LSC Transportation Consultants, Inc. Short-Range Transit Plan Page 1
Chapter 1 Study Setting
INTRODUCTION Public transit strategies play a crucial role in the quality of life provided by any community. Access to social and medical services, employment opportunities, educational resources, and basic necessities are topics of universal concern, as they have a strong impact on the economy, ease of movement, and quality of life for the residents of an area. In addition to providing mobility to residents without easy access to a private automobile, transit services can provide a wide range of economic development and environmental benefits. Transit services are important to the South County portion of San Luis Obispo County, including the Five Cities area (Arroyo Grande, Grover Beach, Oceano, Pismo Beach, and Shell Beach), as well as Nipomo and Avila Beach. Services provided by the South County Transit (SoCo Transit), as well as regional services, are currently providing a wide range of benefits to the community. Improvements in transit services are also important elements of local and regional plans to address environmental, economic, and livability goals. The San Luis Obispo Regional Transportation Authority (RTA) has retained LSC Transportation Consultants, Inc., to prepare a Short-Range Transit Plan (SRTP) for the South County area. This study also includes evaluation and planning for four County-funded general public Dial-a-Ride programs: Nipomo, Shandon-Paso Robles, Templeton-Paso Robles and Paso Robles. The study provides an opportunity to develop plans that will tailor transit services to current conditions and provide a “business plan” for the transit program regarding services, capital improvements, marketing, and management strategies.

LSC Transportation Consultants, Inc. San Luis Obispo South County Transit Page 2 Short-Range Transit Plan
This page intentionally left blank.
San Luis Obispo South County Transit LSC Transportation Consultants, Inc. Short-Range Transit Plan Page 3
Chapter 2 Transportation Services
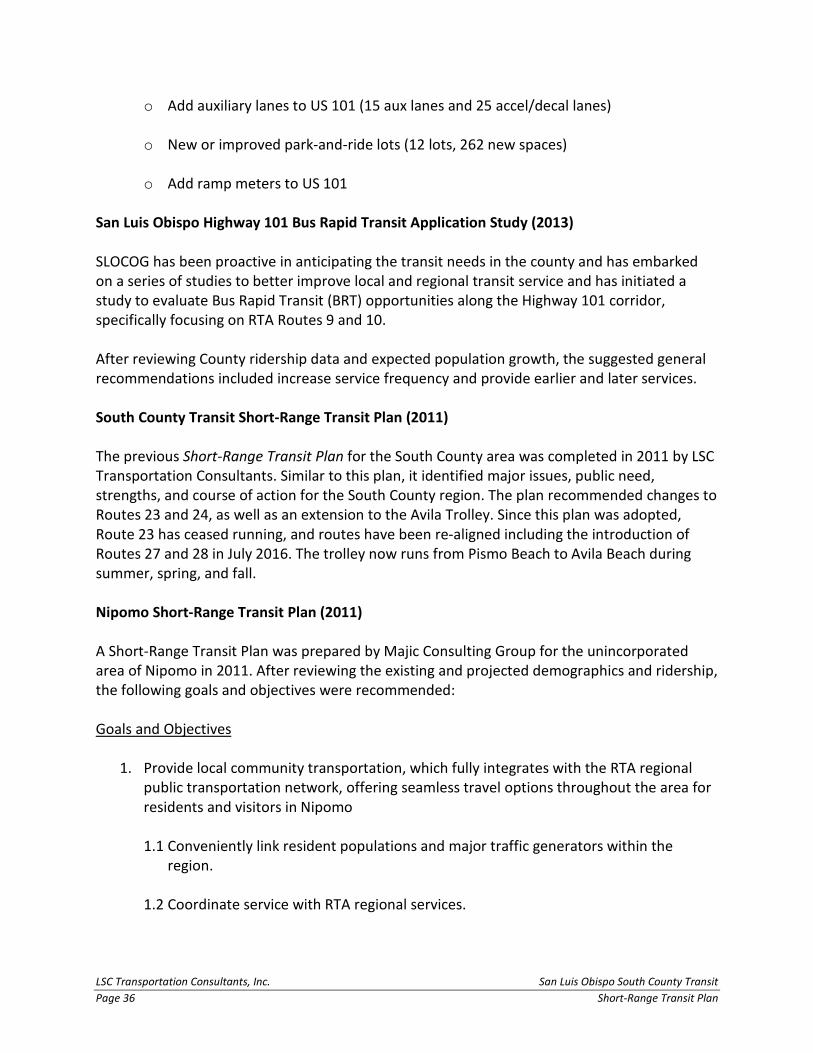
SOUTH COUNTY TRANSIT The South County Transit program – branded and marketed as SoCo Transit in 2016 – is a public fixed route transit system serving the “Five Cities” area in South San Luis Obispo County, including the cities of Pismo Beach, Arroyo Grande and Grover Beach, as well as the unincorporated areas of Oceano, Avila Beach, and Shell Beach. Each of these incorporated cities and San Luis Obispo County entered into a Joint Powers Agreement to form South County Area Transit (SCAT) in 1978. Since 1990, SCAT services have been jointly provided through an agreement with the San Luis Obispo Regional Transit Authority (RTA) which was formed as a Joint Powers Authority (JPA) to provide a county-wide transit system. South County Transit Organization The SoCo Transit program operates under contract with the RTA. The RTA provides day-to-day administration, dispatching services, maintenance and financial management. SoCo Transit also operates under direction of an Executive Committee, which provides technical oversight and policy guidance. The Executive Committee includes the City Managers from each of the cities served by SoCo Transit (Arroyo Grande, Pismo Beach and Grover Beach). Organizational charts for SoCo Transit and the RTA are depicted in Figures 1 and 2. Existing South County Transit Services SoCo Transit provides four year-round fixed routes -- 21, 24, 27, and 28 -- as well as the county funded Avila-Pismo Trolley (operated during occasional Fridays and weekends during the spring, fall, and summer seasons). The existing fixed routes and Dial-a-Ride service areas are shown in Figures 3 and 4, respectively. The Avila-Pismo Trolley route is shown in Figure 5. The SoCo Transit routes are described below. Route 21: This hourly route operates from 6:29 AM to 7:29 PM on weekdays, 7:29 AM to 7:29 PM on Saturdays, and 7:29 AM to 6:29 PM on Sundays. The route consists of a large clockwise loop traveling south on James Way and West Branch serving Arroyo Grande, west on Grand Avenue serving Grover Beach, and north on Price Street and US 101 to complete a smaller counter-clockwise loop serving Pismo and Shell Beach. This route connects with RTA Route 10 at the top of the hour at the Pismo Beach Premium Outlets (Pismo Beach Outlets), and with Routes 24, 27, and 28 at Ramona Garden Park Transit Center in Grover Beach at 29 minutes after the hour.

LSC Transportation Consultants, Inc. San Luis Obispo South County Transit Page 4 Short-Range Transit Plan

San Luis Obispo South County Transit LSC Transportation Consultants, Inc. Short-Range Transit Plan Page 5

LSC Transportation Consultants, Inc. San Luis Obispo South County Transit Page 6 Short-Range Transit Plan

San Luis Obispo South County Transit LSC Transportation Consultants, Inc. Short-Range Transit Plan Page 7
LSC Transportation Consultants, Inc. San Luis Obispo South County Transit Page 8 Short-Range Transit Plan

San Luis Obispo South County Transit LSC Transportation Consultants, Inc. Short-Range Transit Plan Page 9
Route 24: Service is provided hourly from 6:29 AM to 7:29 PM on weekdays, 7:29 AM to 7:29 PM on Saturdays, and 7:29 AM to 6:29 PM on Sundays. This loop route serves the core of Pismo Beach, Grover Beach, and Arroyo Grande primarily in a counter-clockwise direction. It is largely aligned with Route 21, except that Route 24 adds service to downtown Arroyo Grande but does not serve the Shell Beach area of Pismo Beach. From the Pismo Beach Outlets, the route travels northwest towards Pismo Beach circling south down Highway 1 to Ramona Garden Park Transit Center in Grover Beach. The route then travels east on Grand Avenue, north towards Arroyo Grande, and west looping back towards the Town Center/Walmart stop before returning to the Pismo Beach Outlets. Route 27: Hourly service is provided from 6:03 AM to 8:13 PM on weekdays only. This route travels in clockwise direction serving Arroyo Grande, Oceano and the eastern portions of Grover Beach. This route connects with Routes 21 and 24 at Ramona Gardens at 29 minutes after the hour and with Route 28 at 32 minutes after the hour. Route 28: Hourly service is provided from 6:20 AM to 8:14 PM on weekdays, 7:32 AM to 8:14 PM on Saturdays, and 7:32 AM to 7:14 PM on Sundays. This route travels in a counter-clockwise direction serving the same route as Route 27 in reverse order (except for one block around Long Branch Avenue and Oak Park Boulevard). This route connects with Routes 21 and 24 at Ramona Garden Park at 29 minutes after the hour and with Route 27 at 32 minutes after the hour. Avila-Pismo Trolley: The Avila-Pismo Trolley runs April through September during holidays, weekends, and Fridays. Hourly service is generally provided between 10:00 AM to 6:00 PM with hours extending to 9:00 PM during June, July, and August. The trolley connects with SoCo Transit Routes 21 and 24 and RTA 10 at the Pismo Beach Outlets at the top of each hour. No fare is charged on this service. The current SoCo Transit schedules provide driver break/layover times as follows:
• At Pismo Beach Outlets between 51 minutes after the hour and 5 minutes after the hour
for Route 21 and between 55 minutes/10 minutes for Route 24. • At Ramona Garden Park between 13 minutes and 32 minutes for Route 27 and between
14 minutes/32 minutes for Route 28.
Routes 21 and 24 are also scheduled to serve Ramona Garden Park at 29 minutes past the hour, providing the opportunity for direct transfers between all SoCo Transit routes at that time. Travel Times An important service quality factor is the travel time required to complete trips, as well as the need to transfer between buses. Table 1 provides a summary of travel times between major destinations in the South County area. These include the Pismo Beach pier area, Grover Beach

LSC Transportation Consultants, Inc. San Luis Obispo South County Transit Page 10 Short-Range Transit Plan
(4th Street and Grand Avenue), the Oceano Senior Center, Arroyo Grande City Hall, and Arroyo Grande High School, as well as trips between each area and downtown San Luis Obispo and Santa Maria. As shown, approximately 40 percent of trips require transfers between routes (as indicated by the letter “T”), resulting in longer travel times and the uncertainty associated with making the transfer. For instance, it requires roughly 43 minutes to travel from Arroyo Grande High School to Pismo Beach – 3 minutes on Route 28, an 18 minute layover at Grand at AM/PM stop, and 18 minutes on Route 21.
The current service plan provides the most convenient service for trips between Pismo Beach / Grover Beach / Arroyo Grande on Routes 21 and 24 and between Grover Beach / Arroyo Grande / Oceano on Routes 27 and 28. Transfers are typically only necessary when traveling between Pismo Beach and Oceano, or to/from San Luis Obispo and Santa Maria. Regional Transit Authority Transfers A key consideration is transfer opportunities to RTA Route 10, both northbound to San Luis Obispo and southbound to Santa Maria. The key existing transfer location is at the Pismo Beach Outlets in Pismo Beach. As both the northbound and southbound Route 10 buses are at Pismo Beach Outlets at the top of the hour, there is a direct transfer to and from both SoCo Transit Route 21 and 24. Transfers are more difficult between RTA Route 10 and SoCo Transit Routes 27 and 28, as these routes do not serve Pismo Beach Outlets. Instead, passengers can transfer at the Halcyon Park-and-Ride in Arroyo Grande. However, as the current schedules are
TABLE 1: SoCo Transit Travel Times
San Luis Obispo
Pismo Beach
Grover Beach Oceano
Arroyo Grande City Hall
Arroyo Grande High
SchoolSanta Maria
San Luis Obispo ~ 26 m. 56 m. T 73 m. T 45 m. 52 m. ~
Pismo Beach 26 m. ~ 19 m. 41 m. T 18 m. 43 m. T 38 m. Grover Beach 56 m. T 19 m. ~ 17 m. 16m. 24 m. 70 m.
Oceano 73 m. T 41 m. T 17 m. ~ 19 m. 12 m. 105 m. TArroyo
Grande City Hall
45 m. 18 m. 16m. 19 m. ~ 14 m. 100 m. T
Arroyo Grande High
School52 m. 43 m. T 24 m. 12 m. 14 m. ~ 107 m. T
Santa Maria ~ 38 m. 70 m. 105 m. T 100 m. T 107 m. T ~
Note: T = Transfer RequiredSource: SCT/RTA 10 Schedules and Google Maps, Accessed 1/20/2019
Destination
Orig
in

San Luis Obispo South County Transit LSC Transportation Consultants, Inc. Short-Range Transit Plan Page 11
designed for timed transfers at Ramona Gardens, transfers at Halcyon Park-And-Ride are more difficult:
• For northbound RTA Route 10 service to San Luis Obispo, SoCo Transit Route 27
passengers have a relatively convenient transfer opportunity, arriving at Halcyon only a few minutes prior to the northbound Route 10 service time at 49 minutes past the hour. However, SoCo Transit Route 28 passengers must wait approximately 47 minutes, as this route serves Halcyon at 2 minutes past the hour.
• In the opposite direction, southbound RTA Route 10 service from San Luis Obispo
arrives 13 minutes prior to the SoCo Transit Route 28 service time, while connections to SoCo Transit Route 27 require a 57 minute wait.
• For service southbound to Santa Maria, SoCo Transit Route 27 passengers must wait 55
minutes and SoCo Transit Route 28 passengers must wait 39 minutes before boarding the southbound RTA Route 10 bus.
• Returning from Santa Maria, transfers from RTA Route 10 to SoCo Transit Route 27
requires a 5 minute wait time and to Route 29 requires a 21 minute wait time.
In sum, the existing SoCo Transit schedules require Route 27 and Route 28 passengers to wait a total of one hour at Halcyon Park-and-Ride to compete a round-trip via RTA Route 10 to either San Luis Obispo or Santa Maria. Fare Structure SoCo Transit uses a large variety of fare media, including the following:
Cash Fares ($1.50 for the general public, $0.75 for senior or disabled citizens) Day Pass ($3.00/$1.50 Discount- Purchase on Bus) 7-Day Pass ($16.00) 31-Day Pass ($37 Regular/ $18.50 Discount) 20-Ride Pass ($24 Regular/ $12 Discount) VIP Pass: Unlimited rides for seniors aged 80 and over
SoCo Transit offers a special free rate from Memorial Day to Labor Day for students in Kindergarten through 12th grade. As indicated by fare data collected in July 2017 and shown in Figure 6, the most common fare type used is cash (46 percent) followed by SoCo Transit Day Pass (23 percent).

LSC Transportation Consultants, Inc. San Luis Obispo South County Transit Page 12 Short-Range Transit Plan
Operating Characteristics SoCo Transit and Trolley operating characteristics are depicted in Tables 2 and 3 for Fiscal Year (FY) 2013-14 through the most recent FY 2017-18. Discontinued routes are included to show overall increases and decreases throughout the past five years. Ridership SoCo Transit and Avila-Pismo Trolley ridership is shown in Table 2. Total SoCo Transit ridership in FY 2013-14 was 239,101 one-way passenger-trips, while in FY 2017-18, ridership was 181,156. Overall, fixed route ridership declined by 24 percent, though the decline between the last two years of available data (2016/17 to 2017/18 was a relatively modest 2 percent. More detailed, route-specific findings are summarized below:
• Overall ridership has declined for Routes 21 (39 percent) and 24 (36 percent). However, over the past two fiscal years Routes 21 and 24 have only decreased in ridership by 8 and 4 percent, respectively.
• SoCo Transit Routes 27 and 28 have shown increased ridership of 16 and 10 percent
since their implementation in 2016.
• Over the past five fiscal years, Trolley ridership has decreased by 32 percent.

San Luis Obispo South County Transit LSC Transportation Consultants, Inc. Short-Range Transit Plan Page 13
SoCo Transit and Trolley ridership by month from July 2017 to June 2018 is shown in Figure 7. As indicated, ridership on both services is highest in the summer, particularly in July when monthly ridership is roughly 20 percent above the annual average. Ridership is roughly 16 percent below the annual average in February. Hours and Miles of Service Table 3 shows that total SoCo Transit and Trolley hours and miles of service operated have increased by 5 and 7 percent over the past five fiscal years. Additional route-specific findings are summarized below:
• Routes 21 and 24 have both decreased in hours by 18 and 19 percent, respectively. • Route 21 miles of service has increased by 11 percent, while Route 24’miles of service
have decreased 20 percent over the last five years. • Routes 27 and 28 have increased in operable hours since their implementation at the
end of July in 2016 by 9 and 10 percent, respectively. Their miles have also increased by 7 and 12 percent.
• Avila-Pismo Trolley hours and miles have decreased by about 13 and 7 percent,
respectively.
Route FY 2013-14 FY 2014-15 FY 2015-16 FY 2016-17 FY 2017-1821 82,739 78,864 64,545 55,111 50,84922 20,232 N/A N/A N/A N/A23 50,585 66,984 66,070 5,724 N/A24 73,691 66,460 61,406 49,081 47,19825 11,854 11,465 11,288 N/A N/A26 N/A 30 N/A N/A N/A27 N/A N/A N/A 25,175 29,26428 N/A N/A N/A 48,937 53,845
SCT Subtotal
239,101 223,803 203,309 184,028 181,156
Avila Trolley
10,766 8,905 9,787 8,262 7,346
Total 249,867 232,708 213,096 192,290 188,502
Source: SCT Historical Ridership, Provided by SLORTA, 2018
TABLE 2: SoCo Transit Annual Ridership

LSC Transportation Consultants, Inc. San Luis Obispo South County Transit Page 14 Short-Range Transit Plan
It is important to note that the miles and hours presented in this report are considered “service” hours and miles. As such, the reported miles and hours represent of all the time each driver is in the bus, including deadhead time before and after the in-revenue-service time, rather than simply the standard revenue or service-miles/hours.
TABLE 3: SoCo Transit Hours and Miles of Service
Hours Miles Hours Miles Hours Miles Hours Miles Hours Miles21 4,373 61,419 4,226 63,654 4,191 63,400 3,517 67,750 3,575 68,28722 1,022 18,676 -- -- -- -- -- -- -- -- -- -- --23 3,066 52,724 4,171 75,288 4,153 75,160 342 7,440 -- --24 4,397 65,197 4,283 64,550 4,225 64,450 3,339 50,964 3,560 52,41825 197 3,478 198 3,495 197 3,704 -- -- -- -- --27 -- -- -- -- -- -- -- -- 2,552 38,166 2,789 40,67528 -- -- -- -- -- -- -- -- 3,593 50,671 3,948 56,515
Avila Trolley 717 14,906 672 13,816 699 15,576 689 15,995 621 13,914
SCT Total 13,055 201,494 12,877 206,987 12,765 206,714 13,342 214,991 13,872 217,895Grand Total 13,772 216,400 13,550 220,803 13,464 222,291 14,032 230,986 14,493 231,808
Source: SCT and RTA Historical Ridership, Provided by SLORTA, 2018
Route TypeFY 2013-14 FY 2014-15 FY 2015-16 FY 2016-17 FY 2017-18

San Luis Obispo South County Transit LSC Transportation Consultants, Inc. Short-Range Transit Plan Page 15
South County Transit Financial Characteristics Revenues SoCo Transit derives its revenues from a number of sources, as shown in Table 4 and Figure 8. The largest single source is the Federal Transit Administration (FTA) 5307 Urbanized Area Formula Grant program, which accounts for 36 of operating revenues. The Local Transportation Fund (LTF) monies apportioned to the jurisdictions in the Five Cities area account for a total of 34 percent of total revenue. The LTF is based on a quarter-cent sales tax collected by the State of California and returned to the source area. This includes LTF for Arroyo Grande, Grover Beach, Pismo Beach and a portion of San Luis Obispo County for the unincorporated areas of Oceano, as LTF is apportioned based on population. Of all LTF revenue, Arroyo Grande is the highest contributing community at 37 percent of LTF funds received. After LTF, the next largest revenue source is fares at 10 percent of the total operating revenue. SoCo Transit also receives money from RTA to operate the Avila Trolley (3 percent of total revenue), and from the State’s Low Carbon Transit Operations Program (LCTOP) at 13 percent of revenue. Expenses SoCo Transit operating costs have been within the $1.2 million and $1.5 million range for the past three fiscal years (not including capital outlay) as shown in Table 5. As also shown in Figure 9, operating salaries and benefits account for the approximately 47 percent of the operating expenditures. Maintenance is the next largest expense (15 percent of expenses), followed by fuel (14 percent). Administrative expenditures such as insurance, rent, utilities and marketing are 23 percent of the entire expense budget. Fare Revenue Trends Fare revenues over the past three years are shown in Table 4. As indicated, a total of $141,700 in fare revenues was generated in FY 2017-2018. While fare revenue dropped 8 percent from FY 2016-2017 to FY 2017-2018, the FY 2018-2019 revenue expects a slight increase from existing fares up to $142,190. Operating Cost Trends As indicated in Table 5, the annual operating costs increased approximately 3 percent from $1,284,570 in 2016-2017 to $1,322,452 in FY 2017-2018. The budgeted operating cost for FY 2018-2019 is $1,477,520 which is a 12 percent increase over the previous year.

LSC Transportation Consultants, Inc. San Luis Obispo South County Transit Page 16 Short-Range Transit Plan

San Luis Obispo South County Transit LSC Transportation Consultants, Inc. Short-Range Transit Plan Page 17
Cost Allocation A cost allocation model is a useful tool for evaluating current costs as well as for developing service alternatives later on. The costs associated with service factors were evaluated for FY 2017-18 to develop a cost allocation model. Each cost item in the budget is allocated to that quantity – vehicle service hour, vehicle service-mile, or fixed costs – upon which it is most dependent. Fuel costs, for example, are allocated to vehicle service-miles. When divided by the total quantity of service budgeted for FY 2017-18, a “cost equation” can be developed, as presented in Table 6. This equation is:
Operating Cost = $44.11 x annual vehicle service hours + $1.51 x annual vehicle service-miles + $332,383 in annual fixed costs.
This equation can be used to estimate the cost of any changes in service, such as the operation of additional routes or changes in daily hours of operation. It will be used in subsequent tasks as part of this study to evaluate the cost impacts of service alternatives. South County Transit Staffing SoCo Transit has one full-time and one part-time Operations Supervisor, four full time Bus Operators, a part time utility worker (no mechanic) and approximately eight part time Bus Operators based on the time of year (more in the summer to operate the trolley). In addition,

LSC Transportation Consultants, Inc. San Luis Obispo South County Transit Page 18 Short-Range Transit Plan
SoCo Transit receives support from RTA including financial support, planning assistance, maintenance support, and dispatch services. However, staff hours provided by RTA are not specifically tracked, and it is unknown specifically how many hours of support are provided. Additionally, many of the duties undertaken by RTA are undertaken on behalf of both organizations and therefore difficult to allocate.
TABLE 5: SoCo Transit Historic Expenditures
Expenditures FY 16/17 Actual
FY 17/18 Actual
FY 18/19 Budget
FY 16/17 Actual
FY 17/18 Actual
FY 18/19 Budget
Administrative ExpendituresInsurance Liability & Physical Damage $82,000 $101,135 $115,280 - - - Workers Compensation $57,000 $57,997 $51,000 - - - Property Insurance $700 $638 $740 - - -Rent $36,000 $32,555 $30,600 - - -Utilities $8,450 $8,684 $8,980 - - -Radio Expense $1,240 $1,133 $1,240 - - -Legal Services $6,200 $3,875 $1,590 - - -Payroll Processing $1,680 $876 $760 - - -Administration - Staff Time $74,750 $77,600 $81,110 - - -Finance - Staff Time $13,200 $13,700 $14,320 - - -Marketing - Staff Time $5,100 $5,290 $5,530 - - -Office Expense/Miscellaneous $10,370 $7,207 $7,150 - - -Audit $3,000 $3,105 $3,310 - - -Marketing /Community Relations/Printing $25,000 $13,902 $16,000 - - -Uniforms/Laundry/Physcials $10,270 $4,936 $5,660 - - -
Operating Expenditures - - -Salaries/Benefits $579,750 $616,662 $667,510 - - -Maintenance $115,800 $182,755 $226,920 - - -Dispatch - Staff Time $21,850 $22,680 $23,700 - - -Sign Maintenance $3,000SCT Bus Fuel $215,770 $166,972 $201,490 - - -Contingency $12,640 $750 $14,630 - - -
Total Operating Expenditures $1,284,570 $1,322,452 $1,477,520 - - -
Capital Service - - - - - -Support Vehicle - - - - - $33,000Short Range Transit Plan - - - - - $105,000Computer Upgrade - - - - $843 -Vehicles/ITS - - - $156,600 - -Facility Improvements/Bus Stop/Amenities - - - $141,010 - $43,410Transit Centers Improvements - - - $62,500 $120,000 $93,750
Total Use of Resources $1,284,570 $1,322,452 $1,477,520 $360,110 $120,843 $275,160
Source: FY 2017-2018 & 2018-19 South County Transit Budget, April 25, 2018
Operating Capital

San Luis Obispo South County Transit LSC Transportation Consultants, Inc. Short-Range Transit Plan Page 19
SoCo Transit Capital Assets Transit Operations and Parking Facility The SoCo Transit operations and parking facility is located at 800 Rodeo Drive in Arroyo Grande, between West Branch Street and Grace Lane. This is a leased space that includes a bus storage, small administrative space, a small rest space for drivers and no maintenance bay. Buses are washed in the parking lot, with a drain installed to capture runoff. The facility is small and showing its age, with inadequate parking, but is centrally located within Arroyo Grande. Vehicles are fueled on-site with Easy Fuel via wet hose fueling after hours. All maintenance work is done at the RTA facility at 179 Cross Street in San Luis Obispo. Transit Fleet SoCo Transit and the regional Dial-a-Ride share a combined fleet of eight 35-foot buses, two 29-foot trolley replica vehicles and seven cutaway, low floor minivan vehicles as shown in Table 7. Based on industry standards, two of the smaller vehicles will warrant replacement in 2019, with two larger fixed route buses warranting replacement in 2020. The fleet of SoCo Transit fixed route buses seat 35 passengers and run on clean diesel. Each bus is equipped with front bike racks, providing up to three bicycle loading spaces. All of the vehicles are wheelchair lift-equipped with two tie-down positions. The trolleys and smaller Dial-a-Ride vehicles use gasoline.

LSC Transportation Consultants, Inc. San Luis Obispo South County Transit Page 20 Short-Range Transit Plan
Transfer Centers and Passenger Amenities SoCo Transit has three transfer centers: the Pismo Beach Outlets, Ramona Garden Park, and Town Center/Walmart:
The Pismo Outlet facility is on the south side of Five Cities Drive near 4th Street in Pismo Beach. This location has a bus pullout that accommodates four buses, a covered shelter with benches, and an information kiosk. SoCo Transit Routes 21 and 24 serve this stop, as does RTA Route 10. The transfer stop is conveniently located near at an exit/egress to US 101, though the configuration of nearby interchanges requires some out-of-direction travel for northbound Route 10 buses. The Avila-Pismo Trolley also uses this facility.
TABLE 6: SoCo Transit Cost Allocation Model FY 2017-18
Line Item TotalTotal Vehicle Service Hours
Total Vehicle Service Miles Fixed
Administrative ExpendituresInsurance $159,770 - - $159,770Rent $32,555 - - $32,555Utilities $8,684 - - $8,684Radio Expense $1,133 - - $1,133Legal Services $3,875 - - $3,875Payroll Processing $876 - - $876Administration - Staff Time $77,600 - - $77,600Finance - Staff Time $13,700 - - $13,700Marketing - Staff Time $5,290 - - $5,290Office Expense/Miscellaneous $7,207 - - $7,207Audit $3,105 - - $3,105Marketing /Community Relations/Printing $13,902 - - $13,902Uniforms/Laundry/Physcials $4,936 - - $4,936
Operating ExpendituresSalaries/Benefits $616,662 $616,662 - -Maintenance $182,755 - $182,755 -Dispatch - Staff Time $22,680 $22,680 - -SCT Bus Fuel $166,972 - $166,972 -Contingency $750 - - $750
Total Operating Expenditures $1,322,452 $639,342 $349,727 $333,383
Unit Quantities 14,493 231,808 -Cost Per Unit $44.11 $1.51 $333,383
Source: FY 2017-2018 & FY 2018-2019 South County Transit Budget, Dated March 24, 2017 and April 25, 2018

San Luis Obispo South County Transit LSC Transportation Consultants, Inc. Short-Range Transit Plan Page 21
• The Ramona Garden Park transfer center is located on the north side of Ramona Street between 9th and 10th Streets one block north of Grand Avenue in Grover Beach. This location has four sawtooth bus pullouts and three passenger shelters with benches. The park has a community center with bathrooms which are available to passengers (and drivers). All four SoCo Transit routes serve this stop near the bottom of the hour.
• The Town Center/Walmart transfer center is located just outside the Walmart on the westbound side of the Town Center Drive loop. It has one covered shelter with benches and a pull out for buses. It is served by all four SoCo Transit routes.
DEMAND RESPONSE SERVICES The Dial-a-Ride services offer riders curb-to-curb transportation within smaller San Luis Obispo County communities. Paso Robles Dial-a-Ride vehicles are low floor and ramp equipped while cutaway runabout vans are shared for mobility-impaired passengers. Requests for rides may be made up to a week in advance. In order to guarantee a ride, passengers must call by 12:00 noon the day before their trip, though in some regions, same day requests are considered.
TABLE 7: SoCo Transit Fleet
VEHICLE # MILEAGE LENGTH MAKE MODEL YEAR DEPARTMENTREPLACE
DATE
201 466,310 35' GILLIG PHANTOM 2003 SCT-FIXED 2020204 500,176 35' GILLIG PHANTOM 2003 SCT-FIXED 2020
1011 264,599 35' THOR EZ RIDER 2010 SCT-FIXED 20221012 187,186 35' THOR EZ RIDER 2010 SCT-FIXED 20221013 103,562 29' DOUBLE K VILLAGER 2011 CO-TROLLEY 20251308 245,108 35' GILLIG LOW FLOOR 2013 SCT-FIXED 20251309 228,835 35' GILLIG LOW FLOOR 2013 SCT-FIXED 20251310 239,035 35' GILLIG LOW FLOOR 2013 SCT-FIXED 20251509 164,316 35' GILLIG LOW FLOOR 2015 SCT-FIXED 20271707 14,935 29' DOUBLE K VILLAGER 2017 CO-TROLLEY 2032504 176,702 22' DODGE RAM 2500 2002 SCT-SUP 2019516 54,221 22' DODGE GRAND CARAVAN 2014 SCT-SUP 2024517 30,988 22' DODGE GRAND CARAVAN 2014 SCT-SUP 2024
1204 120,960 22' FORD STARCRAFT 2013 CO-DAR 20191511 69,527 22' FORD STARCRAFT E450 2015 CO-DAR 2022729 52,000 22' DODGE BRAUN ENTRAVAN 2013 PASO-DAR 2020730 51,531 22' DODGE BRAUN ENTRAVAN 2013 PASO-DAR 2020
Source: South County Transit Fleet Roster, dated October 1, 2018

LSC Transportation Consultants, Inc. San Luis Obispo South County Transit Page 22 Short-Range Transit Plan
Shandon – Paso Robles Dial-a-Ride Dial-a-Ride service is available to the general public serving residents of Shandon and providing service to/from Paso Robles. Service is available from 8:00 AM to 5:00 PM, Monday, Wednesday, and Friday. The Dial-a-Ride provides transfers to Route 9 at the Paso Robles Train Station. Rides are available through reservations only, with one-way fares of $5.00 for the general public. Same day service is not available for this area. If no requests for service are received by the day prior to a service day, service is not operated. Templeton - Paso Robles Dial-a-Ride Dial-a-Ride service is available to the general public in the Templeton area providing connections to/from Paso Robles. Service is provided from 8:00 AM to 5:00 PM, Tuesday and Thursday. The Dial-a-Ride provides transfers to Route 9 and at the Las Tablas Park-and-Ride. Rides are available through reservations only, with one-way fares of $2.50 for the general public. Same day service is not available for this area and service is not operated without prior reservations. Paso Robles Dial-a-Ride Dial-a-Ride service is available to the general public serving Paso Robles. Service is provided from 7:00 AM to 1:00 PM, Monday through Friday. The Dial-a-Ride provides transfers to Route 9. Rides are available through reservations only, with one-way fares of $5.00 for the general public and $2.50 for senior and disabled passengers. Same day requests may be honored if space is available. Nipomo Dial-a-Ride Dial-a-Ride service is available to the general public serving most of Nipomo. Service is provided from 7:00 AM to 6:30 PM, Monday through Friday. The Dial-a-Ride provides transfers to Route 10, which allows passengers to access SoCo Transit services by transferring at Pismo Beach Outlets. Rides are available through reservations, though same day requests may be honored if space is available. One-way fares are $2.25 for the general public and $1.75 for senior, disabled, and youth passengers. Special 10-ride punch passes are available for adults ($20.00) and children between the ages of K-12th grade ($15.00). Demand Response Ridership, Hours and Miles The FY 2017-2018 total annual ridership for all covered Dial-a-Ride services was 18,497 passengers. Nipomo Dial-a-Ride had the highest ridership at 15,467 passengers (83.6 percent) with Paso Robles Dial-a-Ride serving 2,861 passengers (15.5 percent). The Templeton Dial-a-Ride boarded 167 people (0.9 percent) followed by only 2 people over the past fiscal year.

San Luis Obispo South County Transit LSC Transportation Consultants, Inc. Short-Range Transit Plan Page 23
Revenue hours and vehicle miles follow the same pattern as the overall ridership values as shown in Table 8. The Nipomo Dial-a-Ride operated 74 percent of the total revenue hours with Paso Robles providing approximately 25 percent of the total hours served. Revenue miles by Dial-a-Ride service had a similar breakdown with Nipomo Dial-a-Ride having traveled nearly 75 percent of the total, Paso Robles having traveled 25 percent, and the Templeton and Shandon Dial-a-Rides having traveled a combined 0.6 percent of the fiscal year total.
Demand Response Financial Characteristics Revenues The Dial-a-Ride services derive its revenues from a number of sources, the largest being TDA LTF funding (47 percent of the operating budget). As shown in Table 9, deferred revenue allocation accounts for 29 percent of the proposed FY 2018-2019 revenue. State Transit Assistance (STA) and 5339 Discretionary funding provide 9 and 8 percent of the budget, respectively. The Dial-a-Ride fares have hovered between 3 to 5 percent of total revenue over the past three fiscal years. Expenses Dial-a-Ride operating costs have been fairly consistent over the past three fiscal years (not including capital outlay) as shown in Table 10. Operation labor costs have consistently accounted for between 40 and 41 percent of the total expenditures over the past three fiscal years. Administrative costs are the second highest and most consistent expenditure accounting for between 19 and 21 percent of total costs over the past three fiscal years. Cost Allocation A cost allocation model is a useful tool for evaluating current costs as well as for developing service alternatives later on. A cost allocation model was created using service costs from FY
TABLE 8: Demand Services Ridership, Hours and Miles
# % # % # %
Nipomo Dial-a-Ride 15,467 83.6% 4,128 74.1% 37,383 74.5%
Shandon Dial-a-Ride 2 0.0% 3.69 0.1% 111 0.2%
Templeton Dial-a-Ride 167 0.9% 48.36 0.9% 181 0.4%
Paso Robles Dial-a-Ride 2,861 15.5% 1,391 25.0% 12,535 25.0%
Total 18,497 5,571 50,210
Source: Productivity by Service - FY 2017-2018, Date Received 3/8/2019
Passengers Revenue Hours Revenue MilesFY 2017-2018

LSC Transportation Consultants, Inc. San Luis Obispo South County Transit Page 24 Short-Range Transit Plan
TABLE 9: SLOCAT County Program Revenues
Revenue Items
FY 2016-2017
(Actual)
FY 2017-2018
(Adopted)
FY 2018-2019
(Adopted)Operations
Nipomo Dial A Ride - Fares $28,151 $27,810 $31,400
Templeton/Shandon/Paso Robles DAR - Fares $515 $410 $290
TDA (Transportation Development Act) - LTF - $353,944 $432,812
STA (State Transit Assistance) $43,588 $71,590 $78,380
STA SB1 Augmentation - - $39,050
FTA 5307 (Federal Transit Administration) $160,000 - -
Deferred Revenue Allocation $436,106 $77,276 $262,408
Interest $680 $650 $490
Total $669,040 $531,680 $844,830
Capital
5339 Disctretional (Caltrans) - - $69,300
Revenue Total $669,040 $531,680 $844,830Note: Does not include Five Cities Shuttle and Avila Trolley fare revenueSource: San Luis Obispo County Budget 2018-2019
TABLE 10: San Luis Obispo County Services Expenses
Expense ItemsFY 2016-2017
(Actual) FY 2017-2018
(Adopted)FY 2018-2019
(Adopted)
Administration $92,110 $95,230 $97,630Labor - Operations $187,150 $180,430 $194,140Labor - Operations Workers Comp $21,990 $20,830 $18,780Labor - Mainenance $43,250 $42,140 $44,030Labor - Mainenance Workers Comp $6,440 $6,100 $5,500Fuel $24,790 $21,740 $19,900Insurance $12,100 $11,090 $13,410Special Transit $57,300 $43,900 $43,900Maintenance (Parts, Supplies, Materials) $21,220 $27,630 $29,970Maintenance Contract Costs $6,340 $4,000 $5,530
Total Operations $472,690 $453,090 $472,790
Source: San Luis Obispo RTA Budget 2018-2019

San Luis Obispo South County Transit LSC Transportation Consultants, Inc. Short-Range Transit Plan Page 25
2017-18. Each cost item in the budget is allocated to that quantity – vehicle service hour, vehicle service-mile, or fixed costs – upon which it is most dependent. Fuel costs, for example, are allocated to vehicle service-miles. When divided by the total quantity of service budgeted for FY 2017-18, a “cost equation” can be developed, as presented in Table 11. This equation is:
Operating Cost = $47.52 x annual vehicle service hours + $1.34 x annual vehicle service-miles +
$203,280 in annual fixed costs. This equation can be used to estimate the cost of any changes in service, such as the operation of additional routes or changes in daily hours of operation. It will be used in subsequent tasks as part of this study to evaluate the cost impacts of service alternatives. Operating Cost Trends As indicated in Table 10, the annual operating costs decreased approximately 4 percent from $472,690 in FY 2016-2017 to $453,090 in FY 2017-2018. The budgeted operating cost for FY 2018-2019 is $472,790 which is a 4 percent increase over the previous year.
TABLE 11: County Services Cost Allocation Model
ExpendituresFY 2018-
2019Total Vehicle Service Hours
Total Vehicle Service Miles Fixed
Administration $97,630 - - $97,630Labor - Operations $194,140 $194,140 - -Labor - Operations Workers Comp $18,780 $18,780 - -Labor - Mainenance $44,030 $44,030 - -Labor - Mainenance Workers Comp $5,500 $5,500 - -Fuel $19,900 - $19,900 -Insurance $13,410 - $13,410 -Special Transit $43,900 - - $43,900Avila Trolley $61,750 - - $61,750Maintenance (Parts, Supplies, Materials) $29,970 - $29,970 -Maintenance Contract Costs $5,530 - $5,530 -
Total Operating Expenditures $534,540 $262,450 $68,810 $203,280
Unit Quantities 5,523 51,434 -Cost Per Unit $47.52 $1.34 -
Source: San Luis Obispo County 2017-2018 and 2018-2019 Budget

LSC Transportation Consultants, Inc. San Luis Obispo South County Transit Page 26 Short-Range Transit Plan
Fare Revenue Trends Fare revenues over the past three fiscal years are also shown in Table 9. As indicated, a total of $29,071 in fare revenues was generated in FY 2016-2017. While fare revenue dropped 4 percent from FY 2015-2016 to FY 2017-2018, the FY 2018-2019 revenue expects a 12 percent increase from existing fares.
OTHER TRANSIT SERVICES San Luis Obispo Regional Transit Authority The San Luis Obispo Regional Transit Authority provides regional public transit services across San Luis Obispo County. This section focuses on the sole RTA route serving the South County area. Route 10: San Luis Obispo to Santa Maria Service Connections from the South County area to the cities of San Luis Obispo and Santa Maria are provided by RTA Route 10, which operates along the US 101 corridor. Service levels vary by the day of the week:
• There are 17 runs per weekday on hourly headways, as well as 2 express routes (morning and evening). General weekday operating hours in the South County area (at Pismo Beach Outlets) are between 6:20 AM and 8:00 PM in the northbound direction (towards San Luis Obispo) and 7:00 AM and 9:00 PM in the southbound direction (towards Santa Maria).
• Saturday service consists of five runs in each direction, serving Pismo Beach Outlets between 9:00 AM and 8:00 PM in the southbound direction and 8:00 AM / 7:00 PM in the northbound direction.
• On Sundays, service is limited to three runs in each direction, serving Pismo Beach Outlets at 10:00 AM, 2:00 PM and 6:00 PM in the southbound direction and at 9:00 AM, 1:00 PM and 5:00 PM in the northbound direction.
One-way general public fares are dependent upon the origin and destination:
$1.75 for service wholly within a single area: San Luis Obispo, Pismo Beach/Arroyo
Grande, Nipomo, or Santa Maria/Orcutt. $2.25 for service between San Luis Obispo and Pismo Beach/Arroyo Grande, between
Pismo Beach/Arroyo Grande and Nipomo, and between Nipomo and Santa Maria.

San Luis Obispo South County Transit LSC Transportation Consultants, Inc. Short-Range Transit Plan Page 27
$2.75 for service between San Luis Obispo and Nipomo, and Pismo Beach/Arroyo Grande and Santa Maria.
$3.25 for service between Santa Maria/Orcutt and San Luis Obispo.
Reduced (roughly half-price) fares are provided for seniors age 65 to 79, persons with disabilities, Medicare cardholders and K-12 students. Seniors age 80 or above, ADA cardholders and children 44 inches or shorter ride for free. Operating data for the most recent 12 months (July 2017 through June 2018) shows that Route 10 ridership totaled 232,651 one-way passenger-trips, as shown in Table 12. A review of the monthly data shows that the month of October tends to generate the greatest ridership. Further, in the most recent 12 months, a total of 355,167 miles and 11,139 hours were completed on the route. From a service performance analysis perspective, Route 10 is performing very well, with 20.8 passenger-trips per hour and 0.65 passenger-trips per mile.
Ride-On Transportation Ride-On Transportation is a non-profit organization dedicated to improving transportation services in San Luis Obispo County, California. Started in 1993, Ride-On is comprised of the Consolidated Transportation Service Agency (CTSA) and the Transportation Management Association (TMA) for our county. SLO Regional Rideshare SLO Regional Rideshare, the transportation demand management division of SLOCOG, is dedicated to reducing the number of single occupant vehicles on San Luis Obispo County’s roads and highways, helping commuters save money on gas, and making it easier to get to work or school. SLO Regional Rideshare provides programs for commuters, employers, youth, seniors and visitors.
TABLE 12: RTA 10 Ridership, Hours, and Miles of Service
RTA 10 FY 2013-14 FY 2014-15 FY 2015-16 FY 2016-17 FY 2017-18
Ridership 270,562 251,310 226,862 251,951 232,651Hours 10,469 10,408 10,542 11,780 11,139Miles 342,688 340,681 345,076 373,753 355,168
Source: RTA Historical Ridership, Provided by SLORTA, 2018

LSC Transportation Consultants, Inc. San Luis Obispo South County Transit Page 28 Short-Range Transit Plan
Five Cities Senior Shuttle Dial-a-Ride service is available to the general public within the Five Cities area for ages 65 and up between 8:00 AM and 5:00 PM on Tuesday, Wednesday, and Thursday. Route connections can be made to Route 10 at the Pismo Beach Outlets. Rides are available through reservations only, with one-way fares of $3.00. Same day requests may be honored if space is available. The general public can take advantage of Ride-On services through the airport/train shuttle; special event shuttles; vanpools for commuters; guaranteed/emergency ride home service; and private shuttles for individuals within the county. SLO Regional Rideshare SLOCOG operates a regional rideshare program, designed to educate commuters and promote alternative transportation modes, such as carpool, bicycles and transit. While the program itself does not provide actual transit services, it provides a wealth of information regarding transportation alternatives to employers, residents and transit providers, including trip planners, and marketing services. Runabout Paratransit The Runabout is provided through the regional ADA compliance and provides a paratransit system service along the fixed route corridors, including regional, local, and trolley services for ADA certified passengers only. Fares for the Runabout service range from $3.00 to $11.00 each way. The Runabout provides services every day and reservations can be made between 8:00 AM and 5:00 PM, 7 days a week. Santa Maria Transit (SMAT) SMAT offers eight routes within the City of Santa Maria. General operating hours are between 5:30 AM and 9:30 PM depending on the route. One-way fares are $1.50 for the general public, $1.25 for students, and $0.75 for seniors (60 years and older), those with disabilities and/or Medicare recipients. Children 5 years old or under ride free. SMAT also offers 31-Day unlimited ride passes that are $48.00 for the general public, $31.00 for students, and $24.00 for seniors (60 years and older), those with disabilities and/or Medicare recipients. Amtrak Amtrak currently serves San Luis Obispo County with two rail routes, the Coast Starlight and the Pacific Surfliner. The Coast Starlight train operates between Seattle and Los Angeles, with stops in Paso Robles, San Luis Obispo, and Grover Beach. The Pacific Surfliner, operates between San Luis Obispo and San Diego, and includes stops in San Luis Obispo and Grover Beach. Trains depart the Grover Beach station at 7:15 AM and 4:35 PM each day in the southbound direction, and arrive at the Grover Beach station at 7:55 PM in the northbound direction. Amtrak Thruway

San Luis Obispo South County Transit LSC Transportation Consultants, Inc. Short-Range Transit Plan Page 29
motor coaches are also available for bus connections from the South County area to the Surfliner, Capital Corridor (service to Sacramento from the Bay Area) and the San Joaquin (service from Bakersfield to Sacramento and the East Bay Area) trains.

LSC Transportation Consultants, Inc. San Luis Obispo South County Transit Page 30 Short-Range Transit Plan
This page intentionally left blank.

San Luis Obispo South County Transit LSC Transportation Consultants, Inc. Short-Range Transit Plan Page 31
Chapter 3 Review of Existing Plans and Documents
INTRODUCTION To meet the goals of the study, it is essential that the regulatory and institutional context of the study effort be fully documented. The following summary of findings and recommendations will provide a solid background on local transit planning work already completed, as well as provide a base understanding of the region’s transit needs. Santa Maria – San Luis Obispo Transportation Connectivity Study (2017) The Santa Maria-San Luis Obispo Transportation Connectivity Study was prepared by Nelson/Nygaard for the Santa Barbara County Association of Governments (SBCAG) in partnership with the San Luis Obispo Council of Governments (SLOCOG). The purpose of the study was to identify opportunities to improve transit and ridesharing services between northern Santa Barbara County and southern San Luis Obispo County. The plan reviewed existing SBCAG and SLOCOG plans as well as current Short-Range Transit Plans in the Area. After considering the existing facilities and services within the area, the following recommendations were made for RTA’s Route 10: Short-Term Recommendations
1. Realign RTA Route 10 from Marian Medical Center to Broadway in Santa Maria. 2. Eliminate Hagerman Park-and-Ride and SLO County Regional Airport stops on RTA Route
10 express trips. 3. Serve the following consistent stops on RTA Route 10 Express trips;
o Santa Maria Transit Center o Broadway at Orchard Street / Alvin Avenue o Halcyon Park-and-Ride o SLO Government Center o California Polytechnic State University
Mid-Term Recommendations
1. Increase RTA Route 10 weekday service span. 2. Improve RTA Route 10 weekend headways to 90 minutes.
Long Term Recommendations
1. Improve RTA Route 10 weekday headways to 30 minutes. 2. Improve RTA Route 10 weekend headways to 60 minutes.

LSC Transportation Consultants, Inc. San Luis Obispo South County Transit Page 32 Short-Range Transit Plan
Park-and-Ride Lot Study (2017) A major goal of SLOCOG is to help assure the development of an efficient, coordinated, integrated, and balanced transportation system to meet the mobility needs of the San Luis Obispo region utilizing all modes of transportation. This includes providing designated park-and-ride lot locations throughout the County to encourage commuters to carpool, vanpool, and/or take public transportation. Park-and-ride lots are “change of mode facilities” where individuals meet and then group-travel to their destinations via vanpool, carpool or transit. These facilities can be vacant lots where commuters pre-determine to meet, or large intermodal transportation facilities that link individuals to many other modes of transportation, including bus and rail. Previous studies were completed in 2005, 2008, and 2013. Since the previous 2013 study, SLOCOG has added 30 additional parking spaces in Paso Robles and 20 additional parking spaces in Nipomo park-and-ride lots. A new Grover Beach Train Station park-and-ride lot has been planned as well. The next study update will be in the 2021.Based on the findings of the 2017 study, the following general recommendations were suggested:
1. Encourage the County and local jurisdictions to require park-and-ride lot spaces as a Condition of Approval for “major” new development where appropriate and encourage the Air Pollution Control District (APCD) to request Park-and-Ride spaces when applicable.
2. Encourage Caltrans to continue maintaining existing park-and-ride lots in State Right-of-
Way, including resealing, restriping, debris removal, weed abatement, etc. 3. Recommend $100,000 per year be set aside to maintain and improve existing lots (i.e.
ongoing maintenance needs, lighting, solar shade structures, uniform signage with 511, shade trees and landscaping, irrigation and upkeep, etc.), renew existing lease agreements and to secure new lease agreements, and contracting for repaving, overlays/resealing, and restriping as needed.
4. Recommend funding for project development, construction, and capital needs of future
park-and-ride lots, including land purchase (additional funding for the development of major lots to be determined at a later date).
5. Continue to work with partner agencies to secure new lots. 6. Strive to locate a park-and-ride lot in every community:
a. Meet certain improvement standards. b. Conduct annual usage (i.e. counts) and improvement assessment.

San Luis Obispo South County Transit LSC Transportation Consultants, Inc. Short-Range Transit Plan Page 33
7. Continue to promote and maintain the bike locker program. 8. Encourage Low Impact Development (LID) practices and pursue grants to install Electric
Vehicle (EV) charging stations where appropriate. 9. Include transit service as a consideration in all future park-and-ride lots. 10. Conduct park-and-ride Survey Report and update park-and-ride Study every 4 years.
RTA Short-Range Transit Plan (2016) A Short-Range Transit Plan was prepared by LSC Transportation Consultants for both the RTA and City of San Luis Obispo transit programs, completed in August 2016. Existing transit services were reviewed and route alternatives were offered. RTA Route 10’s ridership and stop activity were analyzed and the following major recommendations for RTA Route 10 were made as a result of the plan. Mid-Day Weekday Express Service -- Through the implementation of a mid-day weekday express service, Route 10 would be limited to the following stops:
o Cal Poly (Kennedy Library) o Government Center o Pismo Beach Outlets o Halcyon Park-and-Ride o East Grand Avenue/El Camino Real o Tefft/Carillo o Santa Maria Transit Center
Expanding Evening Services -- The plan recommended adding later weekday service runs at 8:14 PM and 9:14 PM northbound from Santa Maria, as well as on additional southbound run from San Luis Obispo at 9:33 PM. It also recommended adding on additional Saturday northbound run departing at 8:14 PM and southbound run departing at 9:33 PM. Finally, an additional Sunday route departing northbound at 7:14 PM and southbound at 8:33 PM was suggested. SLOCOG Coordinated Human Services Public Transportation Plan (2016) The Coordinated Human Services Public Transportation Plan identifies the needs of transportation-disadvantaged populations in San Luis Obispo County, such as seniors, individuals with disabilities, and people with low incomes. The most recent update to the Coordinated Plan covered fiscal year 2016-2017 through fiscal year 2021-2022. The plan identified the following three priority outcomes, each with one to two corresponding actions.
• Priority Outcome #1: Improve communication and coordination among local agencies
involved in all levels of coordinating social service and public transportation programs.

LSC Transportation Consultants, Inc. San Luis Obispo South County Transit Page 34 Short-Range Transit Plan
o Action 1.1: SLOCOG to establish an MOU with Rode-On covering CTSA expectations o Action 1.1 Transition Regional Mobility Management Functions toward Support of
SSTAC and 5310 Programming.
• Priority Outcome #2: Increase independence among seniors and people with disabilities. o Action 2.1: SLOCOG to consolidate travel-training functions and seek professional
services through an RFP to provide regionalized travel training.
• Priority Outcome #3: Increase transportation options for low-income families and workers. o Action 3.1: Ride on to expand supports for community-based transportation services o Action 3.2: SLOCOG to work with Caltrans to coordinate 5310 grant program to fund
and implement other innovative projects.
Ride-On Short-Range Transit Plan Update (2015) The Ride-On Short-Range Transit Plan Update considered CTSA, TMA, and Vanpool Programs within San Luis Obispo County. The Plan’s recommendations focus on a specific set of strategies that Ride-On has identified as being critical to its growth and development. The plan developed the following immediate and mid-term strategies: Immediate
• Improve marketing strategies. • Implement new services for the CTSA including the addition of group trips to the senior
shuttle program. • Enhance volunteer driver program. • Grow existing services by including online reservation requests and automated
scheduling. • Expand commuter vanpool program

San Luis Obispo South County Transit LSC Transportation Consultants, Inc. Short-Range Transit Plan Page 35
Mid-Term
• Implementation of a countywide human service transportation brokerage.
• Ride-on is to position itself as a contract operator for paratransit operations. Organizational
• Ensure that Board of Directors has the right experience and skills to oversee the transportation programs
• Improve performance monitoring and reporting
• Implement some additional technology upgrades
• Improve the relationships with partner agencies including SLOCOG and Rideshare.
• Create a CTSA Advisory Committee
US 101 Corridor Mobility Master Plan - San Luis Obispo County, California (2014) This Master Plan comprehensively examined both existing and future conditions along approximately 70 miles of the corridor (county line to county line) in San Luis Obispo County to identify improvements that address existing and future needs in the corridor. Phase I of the US 101 Corridor Mobility Master Plan used performance measures to identify four Focus Segments of greatest need spanning approximately 25 miles of the 70 mile corridor. More detailed and scale sensitive performance measure assessments were then applied in Phase II to analyze each of the various improvement concepts considered within each Focus Segment. Both Phase I and Phase II of the plan were each informed through a comprehensive public outreach process that included both traditional (i.e., workshops and presentations) and nontraditional (web-based tools and surveys) methods for maximum effectiveness. The study area most relevant to our analysis was “Segment 1,” which included sections of US 101 between Avila Beach down through Arroyo Grande. The following was recommended as part of the Master Plan:
• Arroyo Grande – Improve Fair Oaks Boulevard / Orchard Avenue Intersection
• Pismo Beach – Extend Price Street
• Five Cities Area o Add HOV Lanes to US 101
LSC Transportation Consultants, Inc. San Luis Obispo South County Transit Page 36 Short-Range Transit Plan
o Add auxiliary lanes to US 101 (15 aux lanes and 25 accel/decal lanes) o New or improved park-and-ride lots (12 lots, 262 new spaces) o Add ramp meters to US 101
San Luis Obispo Highway 101 Bus Rapid Transit Application Study (2013) SLOCOG has been proactive in anticipating the transit needs in the county and has embarked on a series of studies to better improve local and regional transit service and has initiated a study to evaluate Bus Rapid Transit (BRT) opportunities along the Highway 101 corridor, specifically focusing on RTA Routes 9 and 10. After reviewing County ridership data and expected population growth, the suggested general recommendations included increase service frequency and provide earlier and later services. South County Transit Short-Range Transit Plan (2011) The previous Short-Range Transit Plan for the South County area was completed in 2011 by LSC Transportation Consultants. Similar to this plan, it identified major issues, public need, strengths, and course of action for the South County region. The plan recommended changes to Routes 23 and 24, as well as an extension to the Avila Trolley. Since this plan was adopted, Route 23 has ceased running, and routes have been re-aligned including the introduction of Routes 27 and 28 in July 2016. The trolley now runs from Pismo Beach to Avila Beach during summer, spring, and fall. Nipomo Short-Range Transit Plan (2011) A Short-Range Transit Plan was prepared by Majic Consulting Group for the unincorporated area of Nipomo in 2011. After reviewing the existing and projected demographics and ridership, the following goals and objectives were recommended: Goals and Objectives
1. Provide local community transportation, which fully integrates with the RTA regional public transportation network, offering seamless travel options throughout the area for residents and visitors in Nipomo 1.1 Conveniently link resident populations and major traffic generators within the
region. 1.2 Coordinate service with RTA regional services.

San Luis Obispo South County Transit LSC Transportation Consultants, Inc. Short-Range Transit Plan Page 37
2. Provide excellent, effective and efficient public transportation services, which are safe, reliable and accessible. 2.1 Provide safe public transportation. 2.2 Provide reliable public transportation. 2.3 Provide effective public transportation. 2.4 Provide efficient public transportation. 2.5 Provide comfortable transportation.
3. Provide market-driven services in a cost effective manner through the intelligent use of technology and best management practices. 3.1 Achieve a highly rated level customer satisfaction. 3.2 Provide services that are supported by market needs. 3.3 Manage services in a cost effective manner. 3.4 Employ technology cost effectively.
4. Ensure strong awareness and knowledge of Nipomo Dial-a-Ride and connecting public transportation and its value to the quality of life exists within the community, especially among disadvantaged segments, such as seniors, students, persons with disabilities, and persons with limited income. 4.1 Provide accountability and transparency 4.2 Increase use and support of public transportation in Nipomo. 4.3 Implement an annual Marketing Plan. 4.4 Use public funding efficiently in meeting the public transportation needs of Nipomo. 4.5 Educate community and business leaders and the public on the availability
To further fulfill the goals and objectives, the SRTP developed a “Performance Measurement System” and offered two different route alternatives. The first alternative was to use the Dial-a-Ride service as a fixed route with only nominal amount of deviation. The second alternative was to turn the current Nipomo Dial-a-Ride into a deviated fixed route with a looser, hourly schedule.

LSC Transportation Consultants, Inc. San Luis Obispo South County Transit Page 38 Short-Range Transit Plan
Transportation Development Act Triennial Performance Audits The focus of the Triennial Performance Audit (TPA) is to fulfill the requirements of the State of California Transportation Development Act (TDA). Under California law (PUC Section 99246), transit operators must monitor and report on an annual basis the following five performance indicators:
1. Operating costs per passenger; 2. Operating costs per revenue vehicle service hour; 3. Passengers per vehicle service hour; 4. Passengers per vehicle service mile; and 5. Revenue vehicle service hours per full-time employee equivalent.
TPA final reports review an agency’s ability to meet objectives and performance standards. San Luis Obispo Regional Transportation Authority In 2014, under direction from SLOCOG, Nelson/Nygaard conducted an audit that examined FY 2009-2010 through 2012-2013 performance standards. The six near-term recommendations were the following:
1. The next SRTP update is intended to be a cooperative effort with SLO Transit. One of the
primary objectives of this SRTP update should be to develop action oriented strategies to improve coordination between the two systems.
This was a carryover recommendation from the previous audit intended to strengthen the communication between the SLO Transit and RTA.
2. RTA should explore the feasibility and practicality of employing a subsidized taxi
program for a portion of the Runabout service. A subsidized taxi program can be a cost effective strategy for serving some of the longer distance rides and supplement service during peak periods.
This was previously recommended but not elected for pursuit in previous audits. The plan recognized RTA’s efforts in experimenting with services such as Ride-On.
3. Consider exploring the option of in-person assessments for determining ADA eligibility.
This could include interviews or functional assessments, or having a subset or all applicants come in for an assessment. The goal should never be to simply deny eligibility to applicants; it should, however, ensure that applicants are matched to the transportation mode that is most suited to their functional ability.

San Luis Obispo South County Transit LSC Transportation Consultants, Inc. Short-Range Transit Plan Page 39
4. RTA should develop goals and attainable performance standards for the four County services and create periodic and annual reports that tie performance statistics directly to adopted goals and standards. These reports should be shared with County staff and the Board of Supervisors.
While the Shandon, Templeton and Nipomo Dial-a-Ride services may provide “lifeline service” for people who have limited mobility with no other travel options, their performance should be assessed against realistic standards on a regular basis to determine if the services should be continued, modified, or eliminated.
5. To maximize sales distribution of RTA passes, all Joint Powers Authority (JPA) member
jurisdictions should agree to sell RTA passes at their respective city hall or county offices.
6. Work with San Luis Obispo County to review and update the Operating Agreement for
Avila Beach Trolley Services. In 2017, an audit was prepared by Majic Consulting Group and AMMA Transit Planning. The document reviewed FY 2013-2014, 2014-2015, and 2015-2016. Of the six recommendations stated in the previous TPA, two were implemented, two were partially implemented, and two were not implemented. The recommendations that were not implemented were related to the County performance standards and the Avila Beach trolley operations agreement. The audit suggested the following four recommendations to RTA:
1. Analyze the integration of current services and assess most efficient and effective ways
to serve populations in service corridors. 2. Continue to improve the efficiency and effectiveness of Runabout paratransit
operations and dispatch. 3. Enhance public participation, customer service, and marketing. 4. Realign responsibilities to augment RTA’s organizational capabilities and oversight.
Improving the efficiency of the Runabout paratransit services and enhancing public participation were recommended as high priority. The next expected TPA will be completed in 2020. South County Transit In 2014, under direction from SLOCOG, Nelson\Nygaard conducted an audit that examined FY 2009-2010 through 2012-2013. The TPA major findings concluded that SoCo Transit met a majority of its adopted standards with the exception of the following:

LSC Transportation Consultants, Inc. San Luis Obispo South County Transit Page 40 Short-Range Transit Plan
• The farebox recovery ratio for fixed route service and for the system as a whole did not meet SoCo Transit's 15% target set by the 2011 South County Transit Plan (since increased to 20% with the 2010 Census urbanized area designation).
• The system efficiency did not meet the target of increasing at a slower pace than the
local consumer price index (CPI) each year. This was due to increased fuel costs and an upward adjustment to the wage scale in FY 2011/12.
• Performance data was not available for several standards, including on-time
performance, passenger injuries, bus and shelter cleaning, and passenger amenities. Two of the four recommendations from the last performance audit (published in 2010) were fully implemented and two are only partially complete:
• Recommendation #3: Adopt and report on Key Performance Indicators (KPIs) on a
routine basis. SoCo Transit has partially implemented the updated reporting system, and will finalize this based on the recommendations of the Strategic Business Plan currently under development.
• Recommendation #4: Update and implement the RTA/SCAT Marketing Plan and improve
opportunities for local participation. SoCo Transit has implemented many of the marketing recommendations from the 2011 South County Transit Plan, including updating the rider guides, adopting a new name (changing from SCAT to SoCo Transit), developing "how to ride the bus" videos, and engaging in promotional outreach campaigns. However, many of the recommendations have not been fully implemented, including developing a distinctive logo and recording and reporting on-time performance statistics.
The report suggested the following six recommendations as a result of their audit:
1. Adopt and report on Key Performance Indicators (KPIs) on a routine basis. 2. Update and implement the RTA/SoCo Transit Marketing Plan and improve opportunities
for local participation. 3. Create a standalone website for SoCo Transit that is separate from the RTA site. 4. Review the amount of time RTA staff devotes to SoCo Transit service and revisit the
agreement between SoCo Transit and RTA for financial and administrative services to ensure it is fair and accurate.
5. Review the SoCo Transit fare structure and fare policies to meet the increased 20%
farebox recovery ratio requirement.
San Luis Obispo South County Transit LSC Transportation Consultants, Inc. Short-Range Transit Plan Page 41
6. Revisit the original SoCo Transit JPA Agreement (1978) between the member agencies.
In 2017, an audit was prepared by Majic Consulting Group and AMMA Transit Planning. The document reviewed FY 2013-2014, 2014-2015, and 2015-2016. Of the six recommendations stated in the previous TPA, four were completely implemented and two were partially implemented. The two that were partially implemented related to marketing and website. The report suggested the following two recommendations:
1. Consider consolidation with RTA, which would be accompanied with a realignment of the RTA management function to ensure SoCo Transit maintains a local focus
2. Work with RTA and Rideshare to enhance the SoCo Transit brand, develop a sustained
marketing program, improve the availability of public information, and provide additional opportunities for public participation.
SLOCOG Unmet Transit Needs Reports SLOCOG, as the administrator of TDA funds for San Luis Obispo County, performs the annual Unmet Transit Needs study. The purpose of this study is to ensure that any unmet transit needs that are found reasonable to meet are met before TDA funds are expended for non-transit uses, such as streets and roads. A request must meet all of the four (4) adopted criteria if it is to be determined an "unmet need": 1) the request fills gap in service or is identified as a deficiency, 2) sufficient broad-based community support is demonstrated, 3) the request is a current need, 4) the request is for new or expanded service. In addition, an unmet need must meet all of the following four (4) adopted criteria in order for it to be deemed "reasonable to meet": 1) the request is projected to generate the required farebox recovery ratio, 2) service will not involve funding from a non-served entity, 3) service is comparable with similar transit services, 4) the request is fundable with existing TDA funds. 2015-2016, 2016-2017 and 2017-2018 Unmet Transit Needs Reports SLOCOG includes an Unmet Transit Needs Annual report summarizing the requests received and hearings as required by Section 99401.5 of the California Public Utilities Code. The past three Unmet Needs Reports have received a total of 130 requests for RTA, the Runabout, South County Transit, and SLO Transit services. The reports included a summary of services like the following:
• Better advanced coordination/notification to RTA riders of detours/delays due to
construction projects

LSC Transportation Consultants, Inc. San Luis Obispo South County Transit Page 42 Short-Range Transit Plan
• Provide later RTA Route 10 service to Ramona Garden Park in Grover Beach • Provide a weekly commuting route through the five cities for 8:00 AM and 5:00 PM
workers. • Provide later Dial-a-Ride services past 6:00 PM • Upgrade bus bike racks to accommodate more bicycles • Provide text alerts to users • Provide later service on weekend nights around Cal Poly campus • Provide RTA Route 10 bus stop at Costco in Santa Maria • Provide year route and weekday Avila Beach Trolley service • Provide more shelters and benches at bus stops in South County
Of these requests, none were found to meet the adopted “Unmet Needs” Criteria and were deemed “operational” in nature and forwarded to transit operators for review and responses.

San Luis Obispo South County Transit LSC Transportation Consultants, Inc. Short-Range Transit Plan Page 43
Chapter 4 Review of Existing Goals and Objectives and Monitoring Procedures
This discussion first focuses on the South County Transit fixed route services, followed by the Dial-A-Ride services. SOUTH COUNTY TRANSIT Existing Goals and Policies The key management document for South County Transit is the South County Transit Strategic Business Plan. The current version, covering the years 2018 to 2020, was approved by the Board on April 25, 2018. Updates to this plan occur every three to four years. Elements of this Plan are as follows:
• Vision Statement • Mission Statement • Vision Elements • Strategic Direction • Long-Term Goals • Objectives to meet long-term goals • Business Direction • Focused 2018-20 Strategic Business Plan Goals and Objectives • Focused 2018-20 Strategic Business Plan Standards of Excellence
The key policy statements in this document are summarized below. Vision Statement The SoCo Transit of the future will help meet residents’ and visitor’s diverse transportation needs in the Five Cities Area. Mission Statement SoCo Transit is committed to providing safe, friendly, and reliable service to the citizens of and visitors to the Five Cites Area. Vision Elements
1. Continue successful partnerships with jurisdictions, county, other public agencies,
businesses and schools.

LSC Transportation Consultants, Inc. San Luis Obispo South County Transit Page 44 Short-Range Transit Plan
2. Provide excellent, reliable, sustainable seamless service that is effective in getting residents and visitors where they want to travel.
3. Secure reliable funding. 4. Sustain and continue to improve the Intelligent Transportation Systems (ITS) program to
improve service quality and provide efficiencies. 5. Develop a well-executed image-building campaign with a single face for public
transportation.
Strategic Direction 1. Stabilize and grow funding. 2. Continue to improve service quality: On-time performance, scheduling and routing,
customer amenities on our vehicles and at our bus stops, operating procedures. 3. Consolidate and streamline operations to improve efficiency and effectiveness of public
transportation throughout the county. 4. Include public transportation as part of the lifestyle evolution needed to confront climate
change. 5. Reduce private automobile Vehicle Miles Traveled in private automobiles. 6. Improve SoCo Transit’s farebox recovery ratio to avoid Transportation Development Act (TDA) penalties. 7. Embrace technological improvements that will positively impact efficiency and quality of
service.
Long-Term Goals 1. Provide market-driven service that meets the needs of the communities that we serve but
that will also attract discretionary riders. 2. Provide transportation services that are safe, reliable, economical and accessible in an
efficient manner with innovative management practices and technological advancements.
3. Lead and participate in the analysis of the integration of transit operations throughout
the county to ensure that customers are provided seamless transit alternatives and services that attract discretionary riders from every community that SoCo Transit serves.

San Luis Obispo South County Transit LSC Transportation Consultants, Inc. Short-Range Transit Plan Page 45
4. Promote the value of SoCo Transit and public transportation to the quality of life in the Five Cities Area and the environmental rewards of utilizing public transportation and the
reduction of vehicle miles traveled.
The Plan includes 16 objectives established to meet these long-term goals. Focused 2018029 Strategic Business Plan Goals and Objectives
1. Increase Ridership – Increase ridership through improved system design by attracting
discretionary customers and improving sub-regional transit alternatives. 2. Key Performance Indicators – Expand the development and use of our KPIs to enhance
system performance, employee performance and improve service quality to our customers.
3. Innovation – Explore innovative opportunities to improve our service for our customers
and potential customers.
A total of 11 objectives are defined to achieve these three goals. These focus on monitoring services, expanding public awareness and exploring new service strategies and technologies. Standards of Excellence At the core of the Plan is a series of 27 “standards of excellence” that define the metrics to be used to assess progress on the overall plan, as well as the appropriate reporting and review process. These standards are presented in Tables 13 and 14. Monitoring, Reporting and Review Processes Tables 13 and 14 present the monitoring process regarding the individual standards. To assess how this process is being carried out, Board meeting minutes for the most recent year was reviewed. Staff regularly reviews and presents to the Board the most recent data (by route and weekday vs. weekend) on:
• Passenger Ridership • Service Miles • Service Hours • Fare Revenues • Expenditures (administrative, marketing, operations, fuel, insurance)
These figures are used to calculate the riders per mile, riders per hour, cost per passenger and subsidy per passenger. In addition, detailed administrative, operating and capital expenditures are provided for the SoCo transit program as a whole, and compared against the adopted budget.

LSC Transportation Consultants, Inc. San Luis Obispo South County Transit Page 46 Short-Range Transit Plan
Discussion of Existing Policies Overall, the Strategic Business Plan provides a comprehensive framework to improve services, as well as to recognize and address issues as they arise. It provides a clear summary of organizational goals and strategies to the Board, staff and public. The update process also provides an important opportunity to step back from the day-to-day issues of providing transit service to see the big picture and shift organizational priorities. The inclusion of robust data collection processes (such as the Community Perception Survey) is a positive attribute of the plan, as is the comprehensive monitoring and reporting process. Overall, the Consultant finds that the policy statements are appropriate for the organization. They reflect a good understanding of the desire and strategies to improve service quality and to consider innovations in the transit field, while understanding that it is also crucial to maintain a balanced budget. The schedule for data collection, review reporting is appropriate, providing a balance between the staff costs associated with these tasks and the need for the public and decision makers to have current information readily available. The Board is receiving useful data in a timely manner, and is kept aware of trends and issues as they arise. Discussion of Revisions to Standards A review of Table 13 indicates 2 of the 26 standards are not currently attained. Based on these findings and an evaluation of current conditions, the Consultant has the following recommended revision to the standards:
• Farebox Recovery Ratio – The current standard of 20.0 percent is a result of the redesignation of the service area as “urban” for purposes of TDA regulations. The current service generates a 12.3 percent ratio for all services, and 12.2 percent excluding the Avila Trolley. Given current costs and ridership demand, attaining a 20 percent farebox ratio is not viable except by a substantial increase in fares (which would further reduce the passengers per vehicle service hour below the standard) or a substantial reduction in service (including elimination of one or more routes). Attaining this standard without significantly reducing mobility options in the 5 Cities area will therefore require consolidation of the relatively low-performing SoCo Transit services with higher-performing transit services in order for an overall farebox return ratio to be attained.

San Luis Obispo South County Transit LSC Transportation Consultants, Inc. Short-Range Transit Plan Page 47
TABL
E 13
: SoC
o Tr
ansit
Sta
ndar
ds o
f Exc
elle
nce
-- Se
ctio
ns 1
to 3
Curr
ent S
tand
ard
Revi
ew/R
epor
ting
Proc
ess
Curr
ent S
tatu
s of S
tand
ard
Reco
mm
ende
d Ch
ange
s to
Stan
dard
1Pa
ssen
gers
per
veh
icle
ser
vice
hou
r will
be
17 o
r gre
ater
.Ad
min
istra
tor w
ill re
view
mon
thly
and
repo
rt at
eac
h Bo
ard
mee
ting.
Not A
ttain
ed (1
6.3)
None
2Th
e Se
rvic
e De
liver
y ra
te fo
r all
regu
larly
sch
edul
ed /
year
-roun
d se
rvic
es s
hall
be 9
9% o
r gr
eate
r.Re
view
ed q
uarte
rly b
y O
pera
tions
, and
repo
rted
by A
dmin
istra
tor b
i-an
nual
ly to
the
Boar
d.At
tain
ed (1
00%
)No
ne
3
The
On-
time
Perfo
rman
ce fo
r all
regu
larly
-sch
edul
ed /
year
-roun
d se
rvic
es s
hall
be 9
0% o
r gr
eate
r. “O
n-tim
e” is
def
ined
as
no la
ter t
han
six
min
utes
from
any
tim
epoi
nt in
the
publ
ishe
d sc
hedu
le. W
e re
cogn
ize th
at m
akin
g sc
hedu
led
trans
fers
bet
wee
n bu
ses
is v
itally
im
porta
nt to
ride
rs, a
nd s
taff
will
exp
lore
met
hods
of r
egul
arly
mea
surin
g m
isse
d tra
nsfe
rs.
Adm
inis
trato
r will
repo
rt bi
-ann
ually
to th
e Bo
ard.
Atta
ined
(93%
)No
ne
4So
Co T
rans
it w
ill m
ake
cons
iste
nt e
fforts
to e
xplo
re n
ew s
ervi
ce a
nd s
ervi
ce d
eliv
ery
optio
ns a
s w
ell a
s w
ork
with
regi
onal
effi
cien
cies
in th
e de
liver
y of
tran
spor
tatio
n to
the
juris
dict
ions
Revi
ewed
qua
rterly
by
Ope
ratio
ns, a
nd re
porte
d by
Adm
inis
trato
r an
nual
ly to
the
Boar
d.At
tain
edNo
ne
5
SoCo
Tra
nsit
will
mea
sure
ove
rcro
wdi
ng a
s th
e fre
quen
cy o
f ins
tanc
es th
at th
e nu
mbe
r of
pass
enge
rs o
n a
bus
exce
eds
the
num
ber o
f sea
ts (i
.e.,
34 p
asse
nger
s on
a 3
4-se
at b
us
equa
tes
to a
Loa
d Fa
ctor
of 1
.00)
, as
wel
l as
the
dura
tion
of e
xcee
danc
es. T
he
Ove
rcro
wdi
ng s
tand
ard
for r
egul
ar fi
xed-
rout
e se
rvic
es is
no
mor
e th
an 1
0% o
f the
mon
thly
to
tal n
umbe
r of b
us tr
ips
that
exc
eed
a Lo
ad F
acto
r of 1
.25
for g
reat
er th
an 2
0 m
inut
es.
Revi
ewed
qua
rterly
by
Ope
ratio
ns, a
nd re
porte
d by
the
Adm
inis
trato
r bi
annu
ally
to th
e Bo
ard.
Atta
ined
None
1Th
e an
nual
ope
ratin
g bu
dget
will
be
base
d up
on p
roje
cted
reve
nue
bala
nced
with
oth
er
elig
ible
TDA
use
s an
d th
e to
tal o
pera
ting
cost
will
not
exc
eed
the
budg
et a
dopt
ed b
y th
e Bo
ard.
Adm
inis
trato
r will
revi
ew m
onth
ly a
nd re
port
at e
ach
regu
larly
sc
hedu
led
Boar
d m
eetin
g.At
tain
edNo
ne
2Fa
rebo
x Re
cove
ry R
atio
sha
ll be
gre
ater
than
the
min
imum
sta
ndar
d re
quire
d by
SLO
COG
to
mee
t TDA
requ
irem
ents
. In
FY17
-18,
that
min
imum
was
20%
.Ad
min
istra
tor w
ill re
view
mon
thly
and
repo
rt at
eac
h re
gula
rly
sche
dule
d Bo
ard
mee
ting.
12.3
%Se
e Te
xt
3No
sig
nific
ant a
nnua
l fis
cal a
nd c
ompl
ianc
e au
dit f
indi
ngs.
Fina
nce
and
Adm
inis
tratio
n w
ill re
port
any
nega
tive
audi
t fin
ding
s to
th
e Bo
ard.
Atta
ined
None
4En
sure
that
all
capi
tal p
rocu
rem
ents
pro
vide
goo
d va
lue
to o
ur c
usto
mer
s an
d ou
r em
ploy
ees.
Eval
uate
d th
roug
h th
e M
arke
ting
Depa
rtmen
t’s b
iann
ual C
omm
unity
Pe
rcep
tion
Surv
ey, f
eedb
ack
from
com
mun
ities
and
revi
ew o
f the
an
nual
5-y
ear c
apita
l pro
gram
by
the
Boar
d.At
tain
edNo
ne
1Ra
te o
f pre
vent
able
veh
icle
col
lisio
ns w
ill n
ot e
xcee
d 1.
0 pe
r 100
,000
mile
s.Ra
te s
hall
be tr
acke
d by
the
Safe
ty a
nd T
rain
ing
Man
ager
, and
repo
rted
annu
ally
to th
e Bo
ard.
Atta
ined
None
2Ad
dres
s al
l saf
ety
haza
rds
iden
tifie
d an
d re
porte
d to
the
join
t RTA
/ So
Co T
rans
it Sa
fety
Re
sour
ce C
omm
ittee
.Li
st s
hall
be c
ompi
led
with
act
ion
item
s an
d tim
elin
es b
y th
e Sa
fety
an
d Tr
aini
ng M
anag
er.
Atta
ined
None
3Pr
even
tabl
e w
orke
rs c
ompe
nsat
ion
lost
-tim
e cl
aim
s w
ill n
ot e
xcee
d 4
annu
ally
, and
pr
even
tabl
e m
edic
al-o
nly
clai
ms
will
not
exc
eed
5 an
nual
ly.
All w
ork
com
p cl
aim
s sh
all b
e du
ly in
vest
igat
ed a
nd im
med
iate
ly
repo
rted
by F
inan
ce a
nd A
dmin
istra
tion
to o
ur w
ork
com
p ca
rrier
.At
tain
ed (0
/1)
None
4Cu
stom
er a
nd C
omm
unity
per
cept
ion
of s
yste
m s
afet
y w
ill b
e at
leas
t 90%
.As
mea
sure
d by
bia
nnua
l Com
mun
ity P
erce
ptio
n Su
rvey
.At
tain
edNo
ne
5To
tal r
isk
man
agem
ent c
osts
sha
ll no
t exc
eed
indu
stry
nor
ms.
Sta
ff w
ill u
nder
take
al
tern
atin
g m
arke
t sur
veys
eve
ry fo
ur y
ears
for v
ehic
le li
abili
ty /
phys
ical
dam
age
cove
rage
an
d fo
r wor
kers
com
pens
atio
n co
vera
ge.
Repo
rted
by F
inan
ce a
nd A
dmin
istra
tion
in fi
nanc
ials
and
repo
rted
at
each
regu
larly
sch
edul
ed B
oard
mee
ting.
Atta
ined
None
Sect
ion
1: S
ervi
ce Q
ualit
y an
d Ef
ficie
ncy
– W
e w
ill d
eliv
er d
epen
dabl
e, c
usto
mer
focu
sed
and
effic
ient
tran
sit se
rvic
es to
the
com
mun
ities
that
we
serv
e. F
urth
er, w
e w
ill lo
ok fo
r opp
ortu
nitie
s to
depl
oy in
nova
tive
new
serv
ice
with
in
budg
etar
y co
nstr
aint
s.
Sect
ion
2: R
even
ue a
nd R
esou
rces
– W
hile
pro
vidi
ng e
xcel
lent
serv
ice
to o
ur c
usto
mer
s and
com
mun
ities
, we
will
do
so w
ithin
the
finan
cial
reso
urce
s ava
ilabl
e to
us.
The
finan
cial
hea
lth o
f the
org
aniza
tion
will
not
be
com
prom
ised,
an
d w
e w
ill w
ork
to d
eliv
er g
ood
valu
e fo
r the
taxp
ayer
s’ in
vest
men
t in
SoCo
Tra
nsit.
Sect
ion
3: S
afet
y –
We
reco
gnize
the
trem
endo
us im
port
ance
of s
afet
y in
the
oper
atio
n of
SoC
o Tr
ansit
serv
ice
to o
ur c
usto
mer
s and
com
mun
ities
. The
refo
re, t
he sa
fety
of o
ur c
usto
mer
s and
em
ploy
ees w
ill b
e an
org
aniza
tiona
l pr
iorit
y an
d w
e w
ill b
e pr
oact
ive
in p
rom
otin
g sy
stem
safe
ty.

LSC Transportation Consultants, Inc. San Luis Obispo South County Transit Page 48 Short-Range Transit Plan
TABL
E 14
: SoC
o Tr
ansit
Sta
ndar
ds o
f Exc
elle
nce
-- Se
ctio
ns 4
to 6
Curr
ent S
tand
ard
Revi
ew/R
epor
ting
Proc
ess
Curr
ent S
tatu
s of S
tand
ard
Reco
mm
ende
d Ch
ange
s to
Stan
dard
1Re
crui
t, pr
omot
e an
d re
tain
hig
hly
qual
ified
em
ploy
ees
to a
chie
ve o
ur s
ervi
ce s
tand
ards
.An
nual
ass
essm
ent b
y Ad
min
istra
tor a
nd D
epar
tmen
t Hea
ds.
Atta
ined
None
2Pr
ovid
e co
ntin
uous
dev
elop
men
t of o
rgan
izatio
nal s
kills
thro
ugh
ongo
ing
train
ing
and
deve
lopm
ent
prog
ram
s th
at re
sult
in p
erso
nal a
nd p
rofe
ssio
nal g
row
th.
Trai
ning
nee
ds w
ill b
e re
view
ed a
nnua
lly a
s pa
rt of
the
budg
et
proc
ess.
Atta
ined
None
3En
able
our
em
ploy
ees
to a
chie
ve e
xcel
lenc
e in
ser
ving
our
cus
tom
ers
by b
uild
ing
team
wor
k an
d un
ders
tand
ing
effe
ctiv
e co
mm
unic
atio
n w
ithin
the
orga
niza
tion.
Ong
oing
wee
kly
man
agem
ent t
eam
mee
tings
, bi-w
eekl
y ke
y st
aff
coor
dina
tion
mee
tings
and
bi-m
onth
ly D
river
's F
orum
s.At
tain
edNo
ne
4Em
ploy
ees
will
be
eval
uate
d an
nual
ly in
a fa
ir an
d eq
uita
ble
way
to ju
dge
perfo
rman
ce a
nd b
e pr
ovid
ed a
dev
elop
men
tal p
lan
for t
he n
ext f
isca
l yea
r.
Empl
oyee
mer
it ev
alua
tions
will
be
prov
ided
to e
ach
empl
oyee
an
nual
ly w
ith th
e ev
alua
tion
grad
ing
mea
sure
men
t of a
ttain
men
t of
depa
rtmen
t obj
ectiv
es d
evel
oped
dur
ing
the
budg
et p
roce
ss a
nd
achi
evem
ent o
f our
Sta
ndar
ds a
nd K
PIs.
Atta
ined
None
1
If fu
ndin
g pe
rmits
, SoC
o Tr
ansi
t will
mat
ch S
LO T
rans
it’s
and
the
RTA’
s st
anda
rd o
f rep
laci
ng
reve
nue
vehi
cles
whe
n th
ey re
ach
the
FTA-
defin
ed u
sefu
l life
min
imum
s in
term
s of
ser
vice
yea
rs
or m
iles.
If fu
ndin
g re
mai
ns c
onst
rain
ed, n
egot
iate
with
SLO
Tra
nsit
and
the
RTA
to e
nsur
e no
ag
ency
’s b
uses
sur
pass
40%
bey
ond
the
FTA
stan
dard
s.
As tr
acke
d by
Fin
ance
and
Adm
inis
tratio
n as
par
t of g
rant
-mak
ing
effo
rts.
Atta
ined
for t
he fl
eet a
s a
who
le.
2 bu
ses
(201
and
204
) ar
e at
the
end
of th
eir u
sefu
l lif
e.
None
2Ro
ad c
alls
will
not
exc
eed
5 pe
r 100
,000
veh
icle
ser
vice
mile
s. A
road
cal
l is
defin
ed a
s al
l m
echa
nica
l or o
ther
veh
icle
-rela
ted
failu
res
that
affe
ct th
e co
mpl
etio
n of
a s
ched
uled
reve
nue
trip
or th
e st
art o
f the
nex
t sch
edul
ed re
venu
e tri
p, in
clud
ing
failu
res
durin
g de
adhe
adin
g an
d la
yove
r.
As tr
acke
d an
d re
porte
d by
the
Mai
nten
ance
Dep
artm
ent,
and
repo
rted
bian
nual
ly to
the
Boar
d.At
tain
ed (3
.1)
None
3M
aint
ain
a cl
ean,
attr
activ
e fle
et. M
aint
ain
our f
acili
ties
so th
at th
ey a
re s
afe
and
appe
alin
g to
cu
stom
ers
and
empl
oyee
s.As
mea
sure
d by
em
ploy
ee a
nd c
usto
mer
feed
back
.At
tain
edNo
ne
4Ac
hiev
e an
80%
favo
rabl
e ra
ting
of b
us s
top
appe
aran
ce b
y cu
stom
ers
and
the
com
mun
ities
that
w
e se
rve.
As m
easu
red
in th
e bi
annu
al C
omm
unity
Per
cept
ion
Surv
ey.
Atta
ined
None
5
Achi
eve
all f
eder
al- a
nd s
tate
-man
date
d m
aint
enan
ce m
inim
ums,
as
wel
l as
vend
or re
com
men
ded
mai
nten
ance
sch
edul
es, f
or o
ur fl
eet a
nd fa
cilit
ies.
The
follo
win
g st
anda
rds
appl
y: A
. No
nega
tive
CHP
Annu
al T
erm
inal
Insp
ectio
n, F
TA T
rienn
ial R
evie
w o
r TDA
Trie
nnia
l Per
form
ance
Aud
it fin
ding
s.
B. P
reve
ntat
ive
mai
nten
ance
sch
edul
es fo
r all
equi
pmen
t sha
ll be
don
e on
a ti
mel
y ba
sis
(3,0
00
mile
inte
rval
s or
as
man
date
d by
equ
ipm
ent O
EM v
endo
r).
As tr
acke
d by
the
Mai
nten
ance
Dep
artm
ent,
and
repo
rted
annu
ally
to
the
Boar
d.At
tain
edNo
ne
1M
aint
ain
coop
erat
ive
rela
tions
hips
with
fede
ral,
stat
e an
d lo
cal f
undi
ng a
genc
ies.
Will
be
revi
ewed
by
staf
f and
the
Boar
d.At
tain
edNo
ne
2De
velo
p pa
rtner
ship
s w
ith s
take
hold
ers,
com
mun
ity le
ader
s an
d de
cisi
on m
aker
s ke
epin
g th
em
wel
l inf
orm
ed o
f the
inte
gral
role
of S
oCo
Tran
sit a
nd c
ontri
butio
ns to
the
com
mun
ities
that
we
serv
e.To
be
eval
uate
d an
d m
onito
red
by th
e Bo
ard.
Atta
ined
None
3Pr
omot
e ef
fect
ive
inte
rnal
com
mun
icat
ions
and
pro
mot
e th
e va
lues
of t
he o
rgan
izatio
n.To
be
eval
uate
d by
the
Adm
inis
trato
r.At
tain
edNo
ne
4Pr
ovid
e ef
fect
ive
lead
ersh
ip fo
r pub
lic tr
ansp
orta
tion
with
in th
e Fi
ve C
ities
Are
a.To
be
eval
uate
d by
the
Adm
inis
trato
r and
Boa
rd.
Atta
ined
None
Sect
ion
4: H
uman
Res
ourc
es –
Our
em
ploy
ees a
re th
e fo
unda
tion
of th
e or
gani
zatio
n. W
e w
ill su
ppor
t our
em
ploy
ees i
n ac
hiev
ing
exce
llenc
e th
roug
h tr
aini
ng a
nd d
evel
opm
ent,
team
wor
k, a
nd c
ontin
uous
effo
rts a
t effe
ctiv
e co
mm
unic
atio
n w
hile
trea
ting
each
with
inte
grity
and
dig
nity
.
Sect
ion
5: F
leet
and
Fac
ility
– W
e w
ill o
pera
te a
nd m
aint
ain
a m
oder
n an
d cl
ean
fleet
and
faci
litie
s tha
t will
be
plea
sing
to o
ur c
usto
mer
s and
a so
urce
of p
ride
for o
ur e
mpl
oyee
s and
our
com
mun
ities
.
Sect
ion
6: L
eade
rshi
p –
We
will
striv
e to
be
one
of th
e na
tion’
s lea
ding
smal
l tra
nsit
oper
ator
s. W
e w
ill w
ork
to m
aint
ain
colla
bora
tive
rela
tions
hips
with
in th
e in
dust
ry, w
ithin
our
com
mun
ity, a
nd w
ith o
ur st
akeh
olde
rs. W
e w
ill
deve
lop
futu
re le
ader
s fro
m w
ithin
our
org
aniza
tion.

San Luis Obispo South County Transit LSC Transportation Consultants, Inc. Short-Range Transit Plan Page 49
The other standard not attained is the productivity standard (passengers per vehicle service hour). The current standard is to achieve 17 passengers per vehicle-service hour, while the Fiscal Year 2017-18 indicates that the SoCo Transit system generates 16.3 passengers per vehicle-service (excluding the Avila Trolley). No change is recommended, as the current standard is reasonably achievable and provides incentive for improvements to overall productivity. Also, it should be noted that if SoCo Transit is merged into RTA, the policy statements and standards of the RTA should be reviewed and revised to address the additional services. DIAL-A-RIDE SERVICES Existing Goals and Policies Existing policies regarding the general public Dial-a-Ride services are limited. The Paso Robles Dial-a-Ride is funded through the City of Paso Robles. Their Council goals for 2018 include “Upgrade multi-modal transportation opportunities.” The City’s General Plan (most recently amended in 2012) identifies Policy CE-1 D, “Improve and expand transit services.” A total of ten action items are listed under this policy. While most focus on fixed route or regional services, the following pertain to the Dial-a-Ride service:
• Action Item 1. Continue operation of local bus service including inter-connectivity with
regional transit. • Action Item 2. Coordinate with the San Luis Obispo Regional Transit Authority to improve
information available on transit options and support advertising/outreach programs for transit.
• Action Item 10. Develop a plan to monitor transit system performance and evaluate
expansions to transit service.
The RTA provides the County Dial-a-Ride services (Nipomo, Shandon and Templeton) under a contract with the County dated June 19th, 2012 (which was a continuation of a previous contract). The contract, among other things, calls for the RTA to track revenues, expenditures and ridership on a monthly basis. The South County Coastal Area Plan addresses the County’s plan for the Nipomo area, and was last updated in 1988. It includes the policy statement “Inter-Community Transit System. The county should continue planning efforts to provide Nipomo with an inter-community transit system to connect to the Five Cities area.” The Nipomo Community Plan (1994) also mentions the desire for transit services, including fixed route service, but does not mention the Dial-a-Ride service.

LSC Transportation Consultants, Inc. San Luis Obispo South County Transit Page 50 Short-Range Transit Plan
The Shandon Community Plan (2012) includes the following implementation program “Work with the community, SLOCOG and the Regional Transit Authority to develop a long-term transit plan and improve access to transit options.” It also calls for development of a park-and-ride lot, and for developers to work with the RTA in planning stop improvements. The Dial-a-Ride service is not specifically mentioned. The most recent Short-Range Transit Plan Update for Nipomo Transit (Majic Consulting Group, December 2010) provides a series of policy statements, consisting of vision elements, mission, goals, objectives and standards. Perhaps reflecting that this plan was developed as a “stand alone” document, the overall policies and performance measures are quite extensive (including 23 individual objectives/standards). Monitoring, Reporting and Review Processes RTA policy decisions for the Dial-a-Ride services are the responsibility of the Board of Directors, with input from the Regional Transit Advisory Committee. The Board meets monthly, while the Advisory Committee meets quarterly. Both the Advisory Committee and the Board regularly receives ridership, service level and revenue/expenditure reports, along with key performance measures. Annual performance reports are prepared. These include figures for Nipomo Dial-a-Ride and “Paso DAR”. Monitoring data regarding the Shandon and Templeton services are reported separately and directly to the County. Recommendations Over the last ten years, the overall policy framework for the RTA has been enhanced through the adoption and incremental improvements to the San Luis Obispo Regional Transit Authority Strategic Business Plan. The most recent version encompasses the 2018-2020 period. LSC’s recommendation is that the policies and standards for the DARs be addressed through the overall RTA policy process, rather than developing an additional policy document for the DARs. Specifically, the DARs should be included and addressed in the RTA’s Strategic Business Plan. This will be a more effective use of management resources, and will ensure that these services are evaluated in parallel with the other RTA services. In making modifications to the Strategic Business Plan, a distinction should be made between the more urban services (Nipomo and Paso Robles) and the more rural services (Templeton and Shandon). The Shandon and Templeton rural dial-a-rides are “lifeline” services established many years ago to address unmet needs in specific areas, with the RTA effectively serving as a contractor to the County. As such, it is not appropriate to define specific minimum productivity measures. Rather, the purpose of these services is to ensure that these needs are fully met. RTA staff should monitor the services to identify if there are any requests for service that cannot be served. In addition, requests received for service outside of existing hours/days of service should be logged. On at least a bi-annual basis, RTA staff should review the service requests as
San Luis Obispo South County Transit LSC Transportation Consultants, Inc. Short-Range Transit Plan Page 51
well as the performance of the services. These reports should also discuss whether RTA service remains appropriate, or whether other means of addressing the mobility needs should be considered. The following modifications to that document to address the DARs are recommended:
• Executive Summary -- A sentence should be added indicating that “This Plan addresses
all services provided by the RTA, with the exception of the South County Transit program (which is addressed in a separate Strategic Business Plan.”1
• Standard 1, Item C – Change to “Runabout, Nipomo Dial-a-Ride and Paso Robles Dial-a-
Ride demand response services will be 2.0 or greater.” • Standard 1 – Change last sentence to “Any recommended to seasonal or lifeline services
(i.e., Shandon Dial-A-Ride, Templeton Dial-A-Ride) will include target productivity standards that must be met in order to qualify for continued funding.”
With these modifications, the Strategic Business Plan will serve as the policy document for the Dial-a-Ride programs. The Strategic Business Plan standards do not specifically identify the “window” used to define on-time performance, only that 95 percent or more of trips shall be considered on time. The current window used by RTA for Dial-a-Ride service is within 30 minutes (either early or late) of the scheduled pick-up time. Given the smaller service areas of the DARs (other than Runabout) a smaller window of 15 minutes is recommended. A review of on-time performance data for July 2018 through March of 2019 indicates that all four services easily meet this more restrictive standard.
1 If SoCo Transit is merged into RTA, this would be amended.

LSC Transportation Consultants, Inc. San Luis Obispo South County Transit Page 52 Short-Range Transit Plan
This page intentionally left blank.

San Luis Obispo South County Transit LSC Transportation Consultants, Inc. Short-Range Transit Plan Page 53
Chapter 5 Service Performance Evaluation
This chapter presents a detailed review of existing SoCo Transit and the four Dial-A-Ride programs. This detailed analysis includes a review of existing ridership patterns, the performance of the services and the trends in ridership and performance over the past ten years. This is important information with regards to developing and accessing potential future changes in the programs. SoCo Transit and Avila-Pismo Trolley Performance Analysis A performance analysis is a useful means of considering the relative effectiveness of various elements of a transit program. This analysis was conducted for the 2017-18 fiscal year for each SoCo Transit fixed route for weekdays, Saturdays and Sundays as well as for the seasonal Avila-Pismo Trolley service. Marginal operating costs were calculated using the cost model presented in Table 6 of Chapter 2. This analysis is presented in Table 15 and indicates the following: A key transit performance measure is the passenger-trips per vehicle-hour of service (also referred to as a transit system’s “productivity”). Overall, the SoCo Transit fixed routes carry 15.9 passenger-trips per vehicle hour. This total is highest on weekdays (16.2), while slightly lower on Saturdays (15.3) and Sundays (14.4). On weekdays, as shown in Figure 10, Routes 21 and 24 are the most productive, at 18.2 and 18.3, respectively. Route 28 is slightly lower at 16.8 and Route 27 is substantially lower at 11.5. The three routes operated on Saturdays are all relatively similar (between 15.1 and 15.5), with Sunday’s Route 28 as the most productive at 17.1 and Routes 21 and 24 as essentially equal at 13.1. The overall figure for the Avila-Pismo Trolley is lower, at 12.0, but this is still a reasonable value for a seasonal small urban transit route.
• Another measure of effectiveness is the passenger-trips per vehicle-mile of service.
Overall, this figure is 1.01 for the SoCo Transit fixed routes and 0.54 for the Avila-Pismo Trolley. Route 24 is the best SoCo Transit route by this measure on weekdays, at 1.24, and Route 28 is the best route on Saturdays (1.09) and on Sundays (1.18).
• The marginal operating cost per passenger-trip is $4.27 for the SoCo Transit fixed routes
and $6.47 for the Avila-Pismo Trolley. This figure ranges between $4.19 for weekday fixed routes as a whole to $4.44 for Saturday and $4.74 for Sunday. The most cost-efficient service is Route 24 weekday service, which requires $3.63 in costs per passenger-trip, while the least cost-efficient fixed route service is the Route 27 weekday service at $5.75.
• Subtracting the fare revenues from the operating costs yields the marginal operating
subsidy per passenger-trip. This is a key measure of the efficient use of tax dollars to provide mobility. The SoCo Transit fixed routes overall require $3.57 in operating subsidy per passenger-trip, while the Avila-Pismo Trolley requires $6.12. As is also
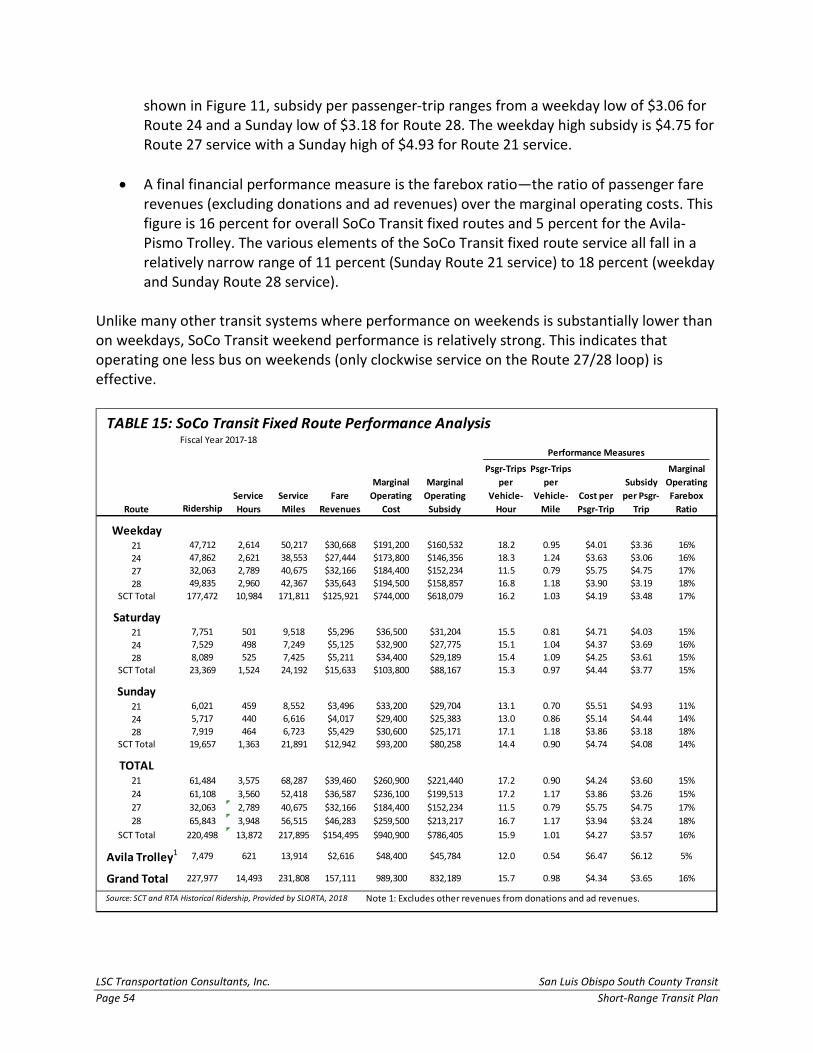
LSC Transportation Consultants, Inc. San Luis Obispo South County Transit Page 54 Short-Range Transit Plan
shown in Figure 11, subsidy per passenger-trip ranges from a weekday low of $3.06 for Route 24 and a Sunday low of $3.18 for Route 28. The weekday high subsidy is $4.75 for Route 27 service with a Sunday high of $4.93 for Route 21 service.
• A final financial performance measure is the farebox ratio—the ratio of passenger fare
revenues (excluding donations and ad revenues) over the marginal operating costs. This figure is 16 percent for overall SoCo Transit fixed routes and 5 percent for the Avila-Pismo Trolley. The various elements of the SoCo Transit fixed route service all fall in a relatively narrow range of 11 percent (Sunday Route 21 service) to 18 percent (weekday and Sunday Route 28 service).
Unlike many other transit systems where performance on weekends is substantially lower than on weekdays, SoCo Transit weekend performance is relatively strong. This indicates that operating one less bus on weekends (only clockwise service on the Route 27/28 loop) is effective.
TABLE 15: SoCo Transit Fixed Route Performance AnalysisFiscal Year 2017-18
Ridership
Weekday21 47,712 2,614 50,217 $30,668 $191,200 $160,532 18.2 0.95 $4.01 $3.36 16%24 47,862 2,621 38,553 $27,444 $173,800 $146,356 18.3 1.24 $3.63 $3.06 16%27 32,063 2,789 40,675 $32,166 $184,400 $152,234 11.5 0.79 $5.75 $4.75 17%28 49,835 2,960 42,367 $35,643 $194,500 $158,857 16.8 1.18 $3.90 $3.19 18%
SCT Total 177,472 10,984 171,811 $125,921 $744,000 $618,079 16.2 1.03 $4.19 $3.48 17%
Saturday21 7,751 501 9,518 $5,296 $36,500 $31,204 15.5 0.81 $4.71 $4.03 15%24 7,529 498 7,249 $5,125 $32,900 $27,775 15.1 1.04 $4.37 $3.69 16%28 8,089 525 7,425 $5,211 $34,400 $29,189 15.4 1.09 $4.25 $3.61 15%
SCT Total 23,369 1,524 24,192 $15,633 $103,800 $88,167 15.3 0.97 $4.44 $3.77 15%
Sunday21 6,021 459 8,552 $3,496 $33,200 $29,704 13.1 0.70 $5.51 $4.93 11%24 5,717 440 6,616 $4,017 $29,400 $25,383 13.0 0.86 $5.14 $4.44 14%28 7,919 464 6,723 $5,429 $30,600 $25,171 17.1 1.18 $3.86 $3.18 18%
SCT Total 19,657 1,363 21,891 $12,942 $93,200 $80,258 14.4 0.90 $4.74 $4.08 14%
TOTAL21 61,484 3,575 68,287 $39,460 $260,900 $221,440 17.2 0.90 $4.24 $3.60 15%24 61,108 3,560 52,418 $36,587 $236,100 $199,513 17.2 1.17 $3.86 $3.26 15%27 32,063 2,789 40,675 $32,166 $184,400 $152,234 11.5 0.79 $5.75 $4.75 17%28 65,843 3,948 56,515 $46,283 $259,500 $213,217 16.7 1.17 $3.94 $3.24 18%
SCT Total 220,498 13,872 217,895 $154,495 $940,900 $786,405 15.9 1.01 $4.27 $3.57 16%
Avila Trolley1 7,479 621 13,914 $2,616 $48,400 $45,784 12.0 0.54 $6.47 $6.12 5%
Grand Total 227,977 14,493 231,808 157,111 989,300 832,189 15.7 0.98 $4.34 $3.65 16%
Source: SCT and RTA Historical Ridership, Provided by SLORTA, 2018 Note 1: Excludes other revenues from donations and ad revenues.
Route
Performance Measures
Fare Revenues
Marginal Operating
Cost
Marginal Operating
Subsidy
Psgr-Trips per
Vehicle-Hour
Psgr-Trips per
Vehicle-Mile
Cost per Psgr-Trip
Subsidy per Psgr-
Trip
Marginal Operating Farebox
RatioService Hours
Service Miles

San Luis Obispo South County Transit LSC Transportation Consultants, Inc. Short-Range Transit Plan Page 55

LSC Transportation Consultants, Inc. San Luis Obispo South County Transit Page 56 Short-Range Transit Plan
Recent Service and Fare Changes
A review of the recent history of SoCo Transit service changes is a useful basis for considering future improvements. Major changes over the last ten years consist of the following:
• In August of 2009, weekday evening service between roughly 7:30 PM and 9:30 PM was
eliminated. • After completion of the 2011 South County Short-Range Transit Plan, service in the
Oceano and southern Grover Beach area was reconfigured into two routes—adding Route 24 service and reconfiguring Route 23—starting in January 2012. This service was subsequently eliminated in March of 2014, in response to low productivity and budget limitations.
• On August 31, 2015, the layover point for Routes 21 and 24 was shifted from Ramona
Garden Park to the Pismo Beach Outlets. This was done to improve transfer opportunities to/from RTA Route 10.
• A substantial route and fare change was implemented on July 31, 2016. Route 23 and
the school-tripper Route 25 were eliminated and replaced with current Routes 27 and 28. Route 23 served much of the same area but consisted of a single vehicle operating large one-way loops, with separate one-way loops in the Arroyo Grande area and the Grover Beach/Oceano area. This resulted in many long travel times (such as a 53 minute travel time between downtown Arroyo Grande and the Arroyo Grande Hospital). This change eliminated service to seven existing stops (such as along Farroll Avenue at 8th Street and along Oak Park between The Pike and Farroll Avenue), but each stop either would be within one city block of a remaining stop or had very low ridership (less than 1.6 boardings per day). For cost savings, Route 27 was operated (and continues to be operated) on weekdays only.
• At the same time, base one-way fares increased from $1.25 to $1.50. Other fare
instruments generally were increased by 20 to 25 percent, except the 20-ride discounted pass was increased from $8 to $12 (by 50 percent). It also introduced the day pass and eliminated the free transfer between SoCo Transit routes.
• In addition, the Avila-Pismo Trolley was extended to Pismo Beach in 2012, Friday night
Farmers Market service was added and winter service (in November through February) was eliminated.
Review of Recent SoCo Transit and Avila-Pismo Trolley Productivity Trends Table 16 presents the ridership and productivity figures for both SoCo Transit and the Avila-Pismo Trolley over the past ten years. Overall, SoCo Transit ridership has fluctuated during this period, dropping 21 percent between FY 2008/09 to a low of 213,620, increasing 38 percent to

San Luis Obispo South County Transit LSC Transportation Consultants, Inc. Short-Range Transit Plan Page 57
a high of 239,101 in FY 2013/14, declining 9 percent to another low of 203,309 in FY 2015/16 before a more recent increase of 8 percent. Overall, total ridership is currently very close to the total of ten years previously. These figures are also presented in Figure 12.
TABLE 16: SoCo Transit Fixed Route Ridership & Productivity History
21 22 23 24 25 27 28 Total
FY08-09 74,180 -- 74,419 63,515 6,568 -- -- 218,682 13,025 16.8FY09-10 65,550 -- 67,141 51,973 7,143 -- -- 191,807 14,878 12.9FY10-11 63,018 -- 57,261 46,208 7,015 -- -- 173,502 14,545 11.9FY11-12 77,532 14,490 53,187 62,163 6,248 -- -- 213,620 13,928 15.3FY12-13 81,695 31,531 37,823 71,609 12,032 -- -- 234,690 13,276 17.7FY13-14 82,739 20,232 50,585 73,691 11,854 -- -- 239,101 13,055 18.3FY14-15 78,864 -- 66,984 66,460 11,465 -- -- 223,773 12,877 17.4FY15-16 64,545 -- 66,070 61,406 11,288 -- -- 203,309 12,765 15.9FY16-17 65,242 -- 5,823 54,091 -- 35,740 64,175 225,071 13,342 16.9FY17-18 61,484 -- -- 61,108 -- 32,063 65,843 220,498 13,872 15.9Est. FY 18-19 61,014 -- -- 60,114 -- 33,884 64,463 219,455 13,872 15.8
Source: RTA ridership and service records. Ridership for last three years based on APC counts.
Productivity (Psgr-Trips per Veh-Hr)
SCT RouteTotal Vehicle
Service- Hours

LSC Transportation Consultants, Inc. San Luis Obispo South County Transit Page 58 Short-Range Transit Plan
Total service levels (as measured in vehicle service-hours) has increased by 6 percent per year overall, reflecting an increase to a high of 14,878 in FY 2009/10 and a low of 12,765 of FY 2015/16 12,765 to a level of 13,872 in FY 2017/18. Considering both ridership and service levels, productivity dropped from 16.8 passenger-trips per vehicle-hour in FY 2008/09 to a low of 11.9 in FY 2010/11, rose to a high of 18.3 in FY 2013/14 and has stabilized around 15.9 over recent years. This is also shown in Figure 12. Historical ridership trends were also reviewed by day of the week, as shown in Table 17. Saturday ridership has dropped slightly over the past ten years, while weekday and Sunday has increased slightly. Overall, however, the proportion of SoCo Transit ridership on the various days of the week is currently very similar to the proportions in FY 2008/09.
It is also possible to review ridership and productivity trends for the two key subareas of the SoCo Transit service area. While routes have varied over the years, in general Routes 21 and 24 have always served Pismo Beach, the northern portion of Grover Beach (north of Grand Avenue) and the northern and downtown Arroyo Grande. The other routes have served Oceano and the areas of Grover Beach and Arroyo Grande to the south. Table 18 presents the annual ridership, vehicle-hours and productivity for the routes in these two areas. Overall ridership has increased by roughly 18,000 passenger-trips per year in the southern (Oceano, etc.) area with a roughly equal decline in the northern (Pismo Beach, etc.) area. As a result, while the northern routes generated 70 percent more ridership than the southern routes in FY 2008/09, at present the northern route ridership is only 23 percent higher. Service levels have also increased in the southern area, particularly with the initiation of Route 28 service in 2016 after a relatively low level of service in FY 2012/13. Overall, current levels are
TABLE 17: SoCo Transit Annual Ridership by Day of Week
Weekday Saturday Sunday Weekday Saturday Sunday
FY08-09 175,944 25,550 17,188 80% 12% 8%FY09-10 154,366 21,057 16,384 80% 11% 9%FY10-11 145,108 15,754 12,640 84% 9% 7%FY11-12 177,722 21,001 14,897 83% 10% 7%FY12-13 190,863 25,097 18,730 81% 11% 8%FY13-14 193,753 26,129 19,219 81% 11% 8%FY14-15 181,672 24,584 17,517 81% 11% 8%FY15-16 167,513 20,816 14,980 82% 10% 7%FY16-17 184,078 22,800 18,193 82% 10% 8%FY17-18 177,472 23,369 19,657 80% 11% 9%Est. FY 18-19 177,026 22,841 19,608 81% 10% 9%
Source: SoCo Transit Ridership Reports.
Percent of Total RidershipTotal Annual Ridership

San Luis Obispo South County Transit LSC Transportation Consultants, Inc. Short-Range Transit Plan Page 59
34 percent higher than ten years previously. The northern routes show an opposite trend, increasing from FY 2008/09 to FY 2009/10 followed by a decline to a FY 2018/19 level that is 11 percent lower than ten years previously. Service levels have also increased in the southern area, particularly with the initiation of Route 28 service in 2016 after a relatively low level of service in FY 2012/13. Overall, current levels are 34 percent higher than ten years previously. The northern routes show an opposite trend, increasing from FY 2008/09 to FY 2009/10 followed by a decline to a FY 2018/19 level that is 11 percent lower than ten years previously. As a result, productivity in the southern area increased between FY 2008/09 to a high of 19.3 passenger-trips per vehicle hour in FY 2013/14, but has declined somewhat to a current level of 14.6 (due to the expansion of service). In the northern area, productivity dropped substantially between FY 2008/09 and FY 2010/11 to a low of 12.0 before an increase to a high of 17.8 in FY 2013/14 and then an overall slight decline to 17.0. Overall, this review indicates that the SoCo Transit service changes in 2011 (along with the overall recovery from the Great Recession) were successful in increasing ridership and productivity. The service reductions in 2014 resulted in a modest reduction in ridership, though overall relatively high levels of productivity were maintained. The 2016 expansion was successful in generating new ridership (even with the negative ridership impacts of a fare increase), accompanied by a small reduction in productivity. Table 19 presents ridership and productivity historical data for the Avila-Pismo Trolley. This indicates that ridership increased from FY 2008/09 to FY 2013/14 by full 59 percent, while annual vehicle-hours declined by 8 percent. This indicates that the extension of service to
TABLE 18: SoCo Transit Annual Ridership by Service Area
Oceano / S. Grover Beach / S.
Arroyo Grande Area
Pismo Beach / N. Grover Beach /N.
Arroyo Grande Area
Oceano / S. Grover Beach / S.
Arroyo Grande Area
Pismo Beach / N. Grover Beach /N.
Arroyo Grande Area
Oceano / S. Grover Beach / S.
Arroyo Grande Area
Pismo Beach / N. Grover Beach /N.
Arroyo Grande Area
FY08-09 80,987 137,695 5,038 7,987 16.1 17.2FY09-10 74,284 117,523 5,620 9,258 13.2 12.7FY10-11 64,276 109,226 5,467 9,078 11.8 12.0FY11-12 73,925 139,695 4,887 9,041 15.1 15.5FY12-13 81,386 153,304 4,268 9,008 19.1 17.0FY13-14 82,671 156,430 4,285 8,770 19.3 17.8FY14-15 78,449 145,324 4,368 8,509 18.0 17.1FY15-16 77,358 125,951 4,350 8,415 17.8 15.0FY16-17 105,738 119,333 6,486 6,856 16.3 17.4FY17-18 97,906 122,592 6,737 7,135 14.5 17.2Est. FY 18-19 98,327 121,128 6,737 7,135 14.6 17.0
Source: SoCo Transit Ridership Reports.
Ridership Vehicle Hours Productivity

LSC Transportation Consultants, Inc. San Luis Obispo South County Transit Page 60 Short-Range Transit Plan
Pismo Beach Outlets as well as Friday evening service were successful in generating new ridership, while elimination of winter service allowed service levels to decline and productivity to improve. Over the most recent five years, ridership has declined by 25 percent while service levels have declined by 13 percent, resulting in a 14 percent decline in productivity. Overall, however, productivity over the 10-year period improved by a full 46 percent. SoCo Transit Ridership by Route and by Hour A review of ridership patterns by hour and by day of the week for the various routes is useful in assessing the relatively effectiveness of various elements of a transit services “span of service.” As shown in Table 20, ridership data for the month of October 2018 was analyzed to determine the proportion of passenger boardings in each hour of the service day, and then factored by the average daily ridership (for weekdays versus weekend days) to identify the average daily ridership by hour for each route. These results are also depicted in Figure 13. In addition, the hourly ridership was divided by the vehicle-hours of service provided in each hour (including the tripper runs) to identify the productivity of each route in each hour of the day, as measured by the passenger boardings per vehicle hour. A review of this data indicates the following:
Fiscal YearAnnual
RidershipAnnual
Vehicle-Hours Productivity
FY08-09 6,947 783 8.9FY09-10 7,339 943 7.8FY10-11 8,618 998 8.6FY11-12 10,499 831 12.6FY12-13 10,514 614 17.1FY13-14 10,766 717 15.0FY14-15 8,905 672 13.3FY15-16 9,787 699 14.0FY16-17 8,262 689 12.0FY17-18 7,479 621 12.0Est. FY 18-19 8,040 621 12.9
Source: SoCo Transit Ridership Reports.
TABLE 19: Avila-Pismo Trolley Ridership and Productivity Trends

San Luis Obispo South County Transit LSC Transportation Consultants, Inc. Short-Range Transit Plan Page 61
TABL
E 20
: SoC
o Tr
ansi
t Rid
ersh
ip b
y Ro
ute
by H
our
Rout
e6:
00 A
M7:
00 A
M8:
00 A
M9:
00 A
M10
:00
AM11
:00
AM12
:00
PM1:
00 P
M2:
00 P
M3:
00 P
M4:
00 P
M5:
00 P
M6:
00 P
M7:
00 P
M8:
00 P
MTo
tal
AVER
AGE
DAIL
Y RI
DERS
HIP
Wee
kday
214
1218
1213
1414
1819
1720
1110
6--
189
245
1113
1314
1218
1720
1818
1511
5--
189
275
77
55
46
56
575
64
51
127
287
4016
159
1410
1513
1811
138
81
197
Tota
l21
7053
4540
4547
5558
110
5345
3324
270
1
Wee
kend
Day
21--
414
912
1013
1114
1313
127
2--
135
24--
59
98
1013
1212
1612
137
2--
130
28--
69
1112
1514
1717
1514
1211
40
157
Tota
l--
1533
2933
3441
4043
4439
3925
80
422
PERC
ENT
OF
AVER
AGE
DAIL
Y RI
DERS
HIP
BY H
OUR
Wee
kday
212.
2%6.
6%9.
4%6.
4%6.
7%7.
4%7.
3%9.
7%10
.0%
9.1%
10.4
%6.
0%5.
5%3.
2%--
100.
0%24
2.7%
6.0%
6.9%
6.8%
7.2%
6.6%
9.5%
8.8%
10.6
%9.
7%9.
3%7.
7%5.
6%2.
7%--
100.
0%27
3.7%
5.7%
5.3%
4.1%
3.8%
3.4%
4.4%
3.7%
4.6%
44.7
%4.
0%4.
8%3.
4%3.
8%0.
5%10
0.0%
283.
7%20
.1%
8.0%
7.5%
4.7%
7.0%
5.1%
7.7%
6.8%
9.2%
5.4%
6.6%
3.8%
3.9%
0.5%
100.
0%To
tal
3.0%
10.0
%7.
6%6.
4%5.
8%6.
4%6.
8%7.
9%8.
3%15
.6%
7.6%
6.4%
4.7%
3.4%
0.2%
100.
0%
Wee
kend
Day
21--
3.0%
10.4
%6.
6%8.
8%7.
4%9.
8%8.
3%10
.5%
9.3%
9.9%
9.2%
5.4%
1.4%
--10
0.0%
24--
4.1%
7.1%
7.0%
6.5%
7.6%
10.3
%9.
4%9.
2%12
.2%
9.2%
10.3
%5.
6%1.
5%--
100.
0%28
--3.
6%5.
7%7.
2%7.
8%9.
4%8.
9%10
.7%
10.8
%9.
8%8.
8%7.
8%6.
8%2.
8%0.
0%10
0.0%
Tota
l--
3.5%
7.8%
6.9%
7.8%
8.1%
9.7%
9.4%
10.2
%10
.4%
9.3%
9.1%
5.9%
1.9%
0.0%
100.
0%
PRO
DUCT
IVIT
Y (P
asse
nger
-Trip
s per
Veh
icle
-Hou
r)W
eekd
ay21
8.0
12.4
17.8
12.1
12.6
14.0
13.8
18.4
18.9
17.2
19.7
11.4
10.5
12.4
--14
.524
9.8
11.4
13.0
12.8
13.6
12.4
17.9
16.6
20.1
18.3
17.6
14.6
10.6
10.7
--14
.527
5.0
7.3
6.8
5.2
4.8
4.3
5.6
4.8
5.8
41.0
5.1
6.1
4.3
4.9
2.8
8.7
2810
.951
.315
.414
.19.
213
.810
.115
.213
.318
.110
.612
.97.
67.
84.
214
.3To
tal
8.0
18.5
13.3
11.1
10.1
11.1
11.8
13.8
14.6
25.0
13.3
11.2
8.2
8.0
3.5
12.9
Wee
kend
Day
21--
7.8
14.0
8.9
11.9
10.0
13.2
11.2
14.2
12.6
13.3
12.5
9.9
7.7
--11
.724
--10
.49.
29.
18.
59.
813
.412
.211
.915
.811
.913
.49.
88.
0--
11.3
28--
12.0
8.9
11.3
12.3
14.7
13.9
16.7
16.9
15.4
13.8
12.3
10.6
7.2
0.0
12.9
Tota
l--
9.9
11.0
9.7
10.9
11.4
13.6
13.2
14.3
14.7
13.1
12.9
10.0
7.2
--12
.0
Sour
ce: 2
017/
18 a
vera
ge d
aily
ride
rshi
p by
day
of w
eek,
fact
ored
by
prop
ortio
n of
ride
rshi
p by
hou
r in
Oct
ober
, 201
8.
Hour
Beg
inni
ng

LSC Transportation Consultants, Inc. San Luis Obispo South County Transit Page 62 Short-Range Transit Plan
• The Arroyo Grande High School service times are very evident in the data, as shown by the 40 boardings on Route 28 in the 7:00 AM weekday hour and the 57 boardings on Route 27 in the 3:00 PM weekday hour.
• Other than these school-related peaks, in general SoCo Transit ridership reaches a peak in the early afternoon on both weekdays and weekend days. This indicates that the service is used for a wide variety of trip purposes, rather than focusing on work trips (that would tend to occur in the AM and PM commute periods).
FIGURE 13: SoCo Transit Hourly Ridership by Route
0
10
20
30
40
50
60Av
erag
e Ri
ders
hip
by H
our
Average Weekday
Route 21 Route 24 Route 27 Route 28
0
10
20
30
40
50
60
Aver
age
Ride
rshi
p by
Hou
r
Average Weekend Day
Route 21 Route 24 Route 28
San Luis Obispo South County Transit LSC Transportation Consultants, Inc. Short-Range Transit Plan Page 63
• Overall weekday productivity is highest during the school bell times. Other than these peaks, productivity is relatively strong (with over 10 passenger boardings per vehicle-hour) throughout the weekday service day on Routes 21 and 24. Route 28 has relatively high productivity prior to 10 AM and from 11:00 AM through 5:00 PM but declines in the early evening as well as in the 10 AM hour. Other than the afternoon school-related peak in the 3 PM hour, productivity on Route 27 (weekdays only) is only 5.2 boardings per vehicle-hour. Productivity on both Routes 27 and 28 is relatively low starting at 6:00 PM but stays relatively high on Routes 21 and 24.
• Productivity on weekend days is lower in the first few hours of the day but actually exceeds productivity on weekdays in most hours between 10:00 AM and 6:00 PM, if the school ridership is excluded from the weekday figures. Note that this is due in part to the fact that Route 27 is not operated on weekend days.
SoCo Transit On-Time Performance On-time performance is an important measure of the overall quality of service provided by a transit program. SoCo Transit’s standard is to provide a minimum of 90 percent of runs within six minutes of the scheduled time. Table 21 presents on-time performance data for Fiscal Year 2017/18. The standard was met for all routes for the year as a whole, ranging from 91 percent on-time service on Route 27 up to 94 percent on Route 24. Performance fell below the 90 percent standard in some months on each of the four routes. In particular, on-time performance has been impacted in the summer on Routes 21, 24 and 28 by seasonal traffic congestion (particularly in downtown Pismo Beach). Route 27’s on-time performance is relatively high in summer as it does not operated on weekends when congestion is worst. SoCo Transit Passenger Activity by Stop The Automatic Passenger Counters on SoCo Transit fixed-route buses provide useful information on ridership activity by stop along the individual routes. Data for July 2017 through June of 2018 were analyzed and factored by the average weekday ridership totals in order to identify the average weekday passenger activity by stop for the individual routes:
Route 21—As shown in Table 22 and Figure 14, ridership activity on Route 21 is concentrated at the Pismo Beach Outlets (33 percent of all boardings and alightings), followed by Ramona Garden Park (17 percent) and Walmart (9 percent). Ridership is also relatively strong along Grand Avenue and in downtown Pismo Beach. The section west of Bay Street, which is not also served by Route 24, generates relatively low ridership (35 passengers per day), which is 9 percent of the total route passenger activity. The stops along Mattie Road (at Valencia, City Hall and Foothill) are particularly low generators, totaling only 1.2 passenger boardings or alightings per day.

LSC Transportation Consultants, Inc. San Luis Obispo South County Transit Page 64 Short-Range Transit Plan
• Route 24—The busiest stops on Route 24 are very similar to those of Route 21,
consisting of Pismo Beach Outlets (34 percent), Ramona Garden Park (17 percent) and Walmart (9 percent), along with stops along Grand Avenue and in downtown Pismo Beach. These figures are shown in Table 23 and Figure 14. The stops along James Way departing the Pismo Beach Outlets and at Ridge Road generate low ridership.
• Route 27—Table 24 and Figure 15 indicate that ridership on this route is concentrated
at Ramona Garden Park (46 percent of all boardings and alightings), followed by Walmart (10 percent) and the Arroyo Grande High School (8 percent). No other stop generates more than 5 percent of total activity. Given the time needed to cross Highway 1 and serve the Oceano Airport stop (approximately 6 minutes); the ridership generated by this stop (6.6 passenger-trips per day) is modest.
• Route 28—Ramona Garden Park generates 37 percent of all passenger activity on Route
28, as shown in Table 25. This is followed by Walmart at 9 percent and Wilmar/19th at 6 percent. While the proportion of total ridership generated by Arroyo Grande High School is lower than on Route 27 (at 5 percent), the actual passenger activity is identical (21.2). Ridership at the Oceano Airport stop (15.0 per day) is substantially higher than on Route 27. There are also several other stops in the Oceano area that generate more ridership on Route 28 than on Route 27.
TABLE 21: SoCo Transit On-Time PerformanceFiscal Year 2017/18
21 24 27 28 Total
July 87% 86% 91% 89% 88%August 89% 89% 93% 92% 90%September 93% 95% 93% 92% 93%October 95% 95% 93% 94% 95%November 94% 96% 93% 92% 94%December 90% 94% 91% 88% 91%January 94% 93% 90% 96% 94%February 95% 95% 91% 93% 94%March 96% 93% 89% 95% 93%April 95% 96% 90% 96% 95%May 94% 96% 89% 94% 93%June 91% 95% 90% 90% 92%Annual 93% 94% 91% 93% 93%
ROUTE
Source: RTA Connexionz data. On-time standard is within 6 minutes of published schedule time.

San Luis Obispo South County Transit LSC Transportation Consultants, Inc. Short-Range Transit Plan Page 65
Stop Boardings Alightings Total Rank
Pismo Beach Premium Outlets 66.2 59.0 125.2 33% 1James Way & 4th 1.3 1.6 2.8 1% 22James Way & Ridge 0.4 0.3 0.8 0% 26James Way & Oak Park 4.3 4.9 9.2 2% 8Walmart Shopping Center 14.1 18.9 33.0 9% 3Grand @ AM PM 5.3 2.4 7.7 2% 9Grand & Halcyon 3.2 2.6 5.8 2% 15Grand & Alder 3.4 2.8 6.1 2% 14Grand & Elm 6.0 6.5 12.4 3% 6Grand & 16th 6.9 11.0 17.9 5% 5Grand & 13th 2.3 3.5 5.8 2% 16Ramona Garden Park 40.3 24.3 64.6 17% 26th & Grand 5.2 1.2 6.4 2% 12Grand & 2nd 3.8 2.7 6.5 2% 11Highway 1 & Le Sage 0.4 0.5 0.9 0% 24Dolliver & Frady 1.5 4.1 5.6 1% 18Dolliver & Pomeroy 4.6 17.4 22.0 6% 4Dolliver & San Luis 1.6 2.5 4.0 1% 19Price & Harbor View 1.3 1.1 2.3 1% 23Lighthouse Inn North 1.2 5.1 6.4 2% 13Mattie & Foothill 0.1 0.2 0.2 0% 27Pismo Beach City Hall 0.5 0.4 0.9 0% 25Mattie & Valencia 0.0 0.1 0.1 0% 28Shell Beach & Seacliff 4.9 7.5 12.4 3% 7Shell Beach & Terrace 1.5 1.9 3.4 1% 20Shell Beach & Cuyama 1.8 1.4 3.2 1% 21Shell Beach & Pier 3.2 2.4 5.7 2% 17Price & Stimson 3.9 2.7 6.6 2% 10Grand Total 189.0 189.0 378.0 100%
Source: RTA APC data for July 2017 to June 2018
% of All Activity
TABLE 22: Average Weekday Passenger Activity by Stop -- Route 21
Avg Daily

LSC Transportation Consultants, Inc. San Luis Obispo South County Transit Page 66 Short-Range Transit Plan
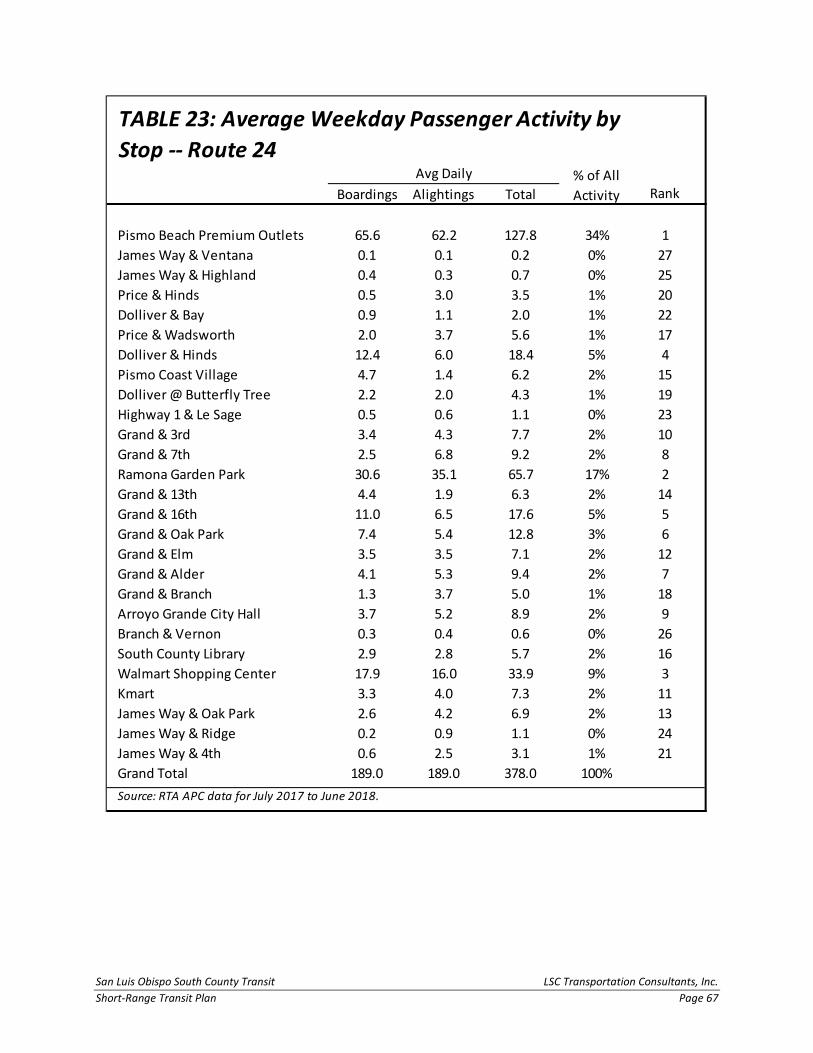
San Luis Obispo South County Transit LSC Transportation Consultants, Inc. Short-Range Transit Plan Page 67
Boardings Alightings Total Rank
Pismo Beach Premium Outlets 65.6 62.2 127.8 34% 1James Way & Ventana 0.1 0.1 0.2 0% 27James Way & Highland 0.4 0.3 0.7 0% 25Price & Hinds 0.5 3.0 3.5 1% 20Dolliver & Bay 0.9 1.1 2.0 1% 22Price & Wadsworth 2.0 3.7 5.6 1% 17Dolliver & Hinds 12.4 6.0 18.4 5% 4Pismo Coast Village 4.7 1.4 6.2 2% 15Dolliver @ Butterfly Tree 2.2 2.0 4.3 1% 19Highway 1 & Le Sage 0.5 0.6 1.1 0% 23Grand & 3rd 3.4 4.3 7.7 2% 10Grand & 7th 2.5 6.8 9.2 2% 8Ramona Garden Park 30.6 35.1 65.7 17% 2Grand & 13th 4.4 1.9 6.3 2% 14Grand & 16th 11.0 6.5 17.6 5% 5Grand & Oak Park 7.4 5.4 12.8 3% 6Grand & Elm 3.5 3.5 7.1 2% 12Grand & Alder 4.1 5.3 9.4 2% 7Grand & Branch 1.3 3.7 5.0 1% 18Arroyo Grande City Hall 3.7 5.2 8.9 2% 9Branch & Vernon 0.3 0.4 0.6 0% 26South County Library 2.9 2.8 5.7 2% 16Walmart Shopping Center 17.9 16.0 33.9 9% 3Kmart 3.3 4.0 7.3 2% 11James Way & Oak Park 2.6 4.2 6.9 2% 13James Way & Ridge 0.2 0.9 1.1 0% 24James Way & 4th 0.6 2.5 3.1 1% 21Grand Total 189.0 189.0 378.0 100%Source: RTA APC data for July 2017 to June 2018.
% of All Activity
TABLE 23: Average Weekday Passenger Activity by Stop -- Route 24
Avg Daily

LSC Transportation Consultants, Inc. San Luis Obispo South County Transit Page 68 Short-Range Transit Plan
Boardings Alightings Total Rank
Ramona Garden Park 53.2 63.8 117.0 46% 1Grand & 13th 2.3 7.3 9.6 4% 5Grand & 16th 4.0 1.2 5.2 2% 9Oak Park & Grand 2.9 2.0 5.0 2% 10Oak Park & Newport 0.7 0.8 1.5 1% 20Walmart Shopping Center 14.6 11.4 26.0 10% 2Grand & Branch 1.9 0.8 2.8 1% 19Fair Oaks & Traffic Way 1.6 2.2 3.8 1% 15Arroyo Grande High School 18.6 2.6 21.2 8% 3Fair Oaks & Halcyon 2.6 1.9 4.4 2% 13Elm & Fair Oaks 1.4 3.9 5.3 2% 8Elm & The Pike 0.9 1.9 2.8 1% 18Elm & Paul 0.3 1.0 1.3 1% 21Highway 1 & 25th 3.5 4.2 7.7 3% 6Highway 1 & 21st 5.1 7.9 13.0 5% 419th & Wilmar 1.7 2.5 4.1 2% 14Wilmar & 13th 1.3 1.9 3.2 1% 16Oceano Airport 3.9 2.7 6.6 3% 713th & Highway 1 3.5 1.3 4.8 2% 1113th & Wilmar 0.9 0.2 1.0 0% 2213th & Farroll 1.0 2.1 3.0 1% 1713th & Trouville 1.1 3.5 4.6 2% 12Grand Total 127.0 127.0 254.0 100%
Source: RTA APC data for July 2017 to June 2018.
TABLE 24: Average Weekday Passenger Activity by Stop -- Route 27
Percent of Total
Avg Daily
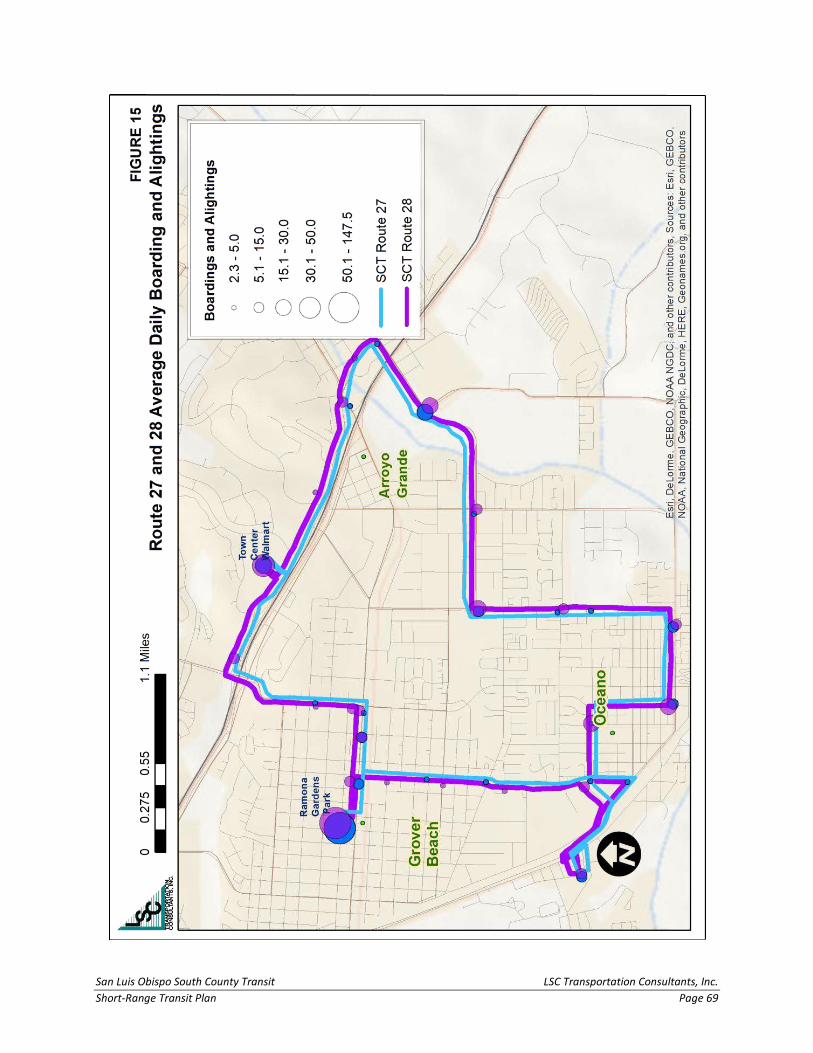
San Luis Obispo South County Transit LSC Transportation Consultants, Inc. Short-Range Transit Plan Page 69

LSC Transportation Consultants, Inc. San Luis Obispo South County Transit Page 70 Short-Range Transit Plan
Table 26 presents a summary of total weekday passenger activity on the four SoCo Transit routes in order of relative activity. Reflecting that it is the key transfer point, the Ramona Garden Park stop is the busiest single stop with 395 passengers boarding or deboarding a bus (28 percent of all activity). This is followed by the Pismo Beach Outlets (18 percent) and Walmart (9 percent). No other stop generates more than 3 percent of total ridership. Twelve stops serve more than 20 passengers per day, while six (largely in the Shell Beach area) serve less than one passenger per day.
Boardings Alightings Total Rank
Ramona Garden Park 78.5 69.0 147.5 37% 113th & Long Branch 3.0 0.4 3.4 1% 2213th & Mentone 2.3 2.0 4.4 1% 2013th & Messina 1.5 1.1 2.6 1% 2413th & Belridge 2.1 5.3 7.4 2% 15Oceano Airport 7.7 7.3 15.0 4% 713th & Highway 1 4.6 3.4 8.0 2% 14Wilmar & 19th 13.0 9.9 22.9 6% 3Highway 1 & 21st 10.6 7.3 17.9 5% 5Highway 1 & 25th St 7.9 5.4 13.3 3% 8Elm & The Pike 3.8 2.0 5.8 1% 18Elm & Fair Oaks 9.1 6.4 15.5 4% 6Arroyo Grande Hospital 2.5 3.5 5.9 2% 17Arroyo Grande High School 4.2 17.0 21.2 5% 4Traffic & Firefighters Park 1.9 2.4 4.3 1% 21Grand & Branch 1.6 1.1 2.7 1% 23Grand @ AM PM 6.0 7.2 13.2 3% 9Halcyon Park & Ride 2.2 2.8 4.9 1% 19Walmart Shopping Center 15.6 18.9 34.6 9% 2Kmart 4.0 4.2 8.2 2% 11Oak Park & Newport 0.4 1.8 2.3 1% 25Oak Park & Ramona 1.3 7.0 8.2 2% 12Oak Park & Long Branch 4.4 5.5 9.9 3% 10Grand & 16th 2.7 4.0 6.7 2% 16Grand & 13th 5.9 2.2 8.1 2% 13Grand Total 197.0 197.0 394.0 100%Source: RTA APC data for July 2017 to June 2018.
TABLE 25: Average Weekday Passenger Activity by Stop -- Route 28
Percent of Total
Avg Daily

San Luis Obispo South County Transit LSC Transportation Consultants, Inc. Short-Range Transit Plan Page 71
Boardings Alightings Total Rank
Ramona Garden Park 202.6 192.2 394.8 28% 1Pismo Beach Premium Outlets 131.7 121.3 253.0 18% 2Walmart Shopping Center 62.2 65.1 127.4 9% 3Grand & 16th 24.7 22.6 47.3 3% 4Arroyo Grande High School 22.8 19.7 42.4 3% 5Highway 1 & 21st 15.7 15.2 30.9 2% 6Grand & 13th 14.9 14.9 29.8 2% 7Wilmar & 19th 13.0 9.9 22.9 2% 8Dolliver & Pomeroy 4.6 17.4 22.0 2% 9Oceano Airport 11.5 10.0 21.6 2% 10Grand @ AM PM 11.3 9.6 20.9 2% 11Elm & Fair Oaks 10.6 10.2 20.8 1% 12Grand & Elm 9.5 10.0 19.5 1% 13Dolliver & Hinds 12.4 6.0 18.4 1% 14James Way & Oak Park 6.9 9.1 16.0 1% 15Grand & Alder 7.5 8.1 15.6 1% 16Kmart 0.0 0.0 0.0 0% 72Highway 1 & 25th St 7.9 5.4 13.3 1% 1713th & Highway 1 8.1 4.7 12.9 1% 18Grand & Oak Park 7.4 5.4 12.8 1% 19Shell Beach & Seacliff 4.9 7.5 12.4 1% 20Grand & Branch 4.8 5.7 10.5 1% 21Oak Park & Long Branch 4.4 5.5 9.9 1% 22Grand & 7th 2.5 6.8 9.2 1% 23Arroyo Grande City Hall 3.7 5.2 8.9 1% 24Elm & The Pike 4.7 3.9 8.6 1% 25Oak Park & Ramona 1.3 7.0 8.2 1% 26Highway 1 & 25th 3.5 4.2 7.7 1% 27Grand & 3rd 3.4 4.3 7.7 1% 2813th & Belridge 2.1 5.3 7.4 1% 29Price & Stimson 3.9 2.7 6.6 0% 30Grand & 2nd 3.8 2.7 6.5 0% 316th & Grand 5.2 1.2 6.4 0% 32Lighthouse Inn North 1.2 5.1 6.4 0% 33Pismo Coast Village 4.7 1.4 6.2 0% 34Arroyo Grande Hospital 2.5 3.5 5.9 0% 35James Way & 4th 1.8 4.1 5.9 0% 36Grand & Halcyon 3.2 2.6 5.8 0% 37South County Library 2.9 2.8 5.7 0% 38Shell Beach & Pier 3.2 2.4 5.7 0% 39Price & Wadsworth 2.0 3.7 5.6 0% 40Dolliver & Frady 1.5 4.1 5.6 0% 41Oak Park & Grand 2.9 2.0 5.0 0% 42Halcyon Park & Ride 2.2 2.8 4.9 0% 4313th & Trouville 1.1 3.5 4.6 0% 44Fair Oaks & Halcyon 2.6 1.9 4.4 0% 4513th & Mentone 2.3 2.0 4.4 0% 46Traffic & Firefighters Park 1.9 2.4 4.3 0% 47Dolliver @ Butterfly Tree 2.2 2.0 4.3 0% 4819th & Wilmar 1.7 2.5 4.1 0% 49Dolliver & San Luis 1.6 2.5 4.0 0% 50Fair Oaks & Traffic Way 1.6 2.2 3.8 0% 51Oak Park & Newport 1.1 2.6 3.8 0% 52Price & Hinds 0.5 3.0 3.5 0% 53Shell Beach & Terrace 1.5 1.9 3.4 0% 5413th & Long Branch 3.0 0.4 3.4 0% 55Wilmar & 13th 1.3 1.9 3.2 0% 56Shell Beach & Cuyama 1.8 1.4 3.2 0% 5713th & Farroll 1.0 2.1 3.0 0% 5813th & Messina 1.5 1.1 2.6 0% 59Price & Harbor View 1.3 1.1 2.3 0% 60Highway 1 & Le Sage 0.9 1.2 2.1 0% 61Dolliver & Bay 0.9 1.1 2.0 0% 62James Way & Ridge 0.6 1.2 1.8 0% 63Elm & Paul 0.3 1.0 1.3 0% 6413th & Wilmar 0.9 0.2 1.0 0% 65Pismo Beach City Hall 0.5 0.4 0.9 0% 66James Way & Highland 0.4 0.3 0.7 0% 67Branch & Vernon 0.3 0.4 0.6 0% 68Mattie & Foothill 0.1 0.2 0.2 0% 69James Way & Ventana 0.1 0.1 0.2 0% 70Mattie & Valencia 0.0 0.1 0.1 0% 71Source: RTA APC data for July 2017 to June 2018.
Percent of Total
Avg Daily
TABLE 26: SoCo Transit Total Average Weekday Passenger Activity by Stop
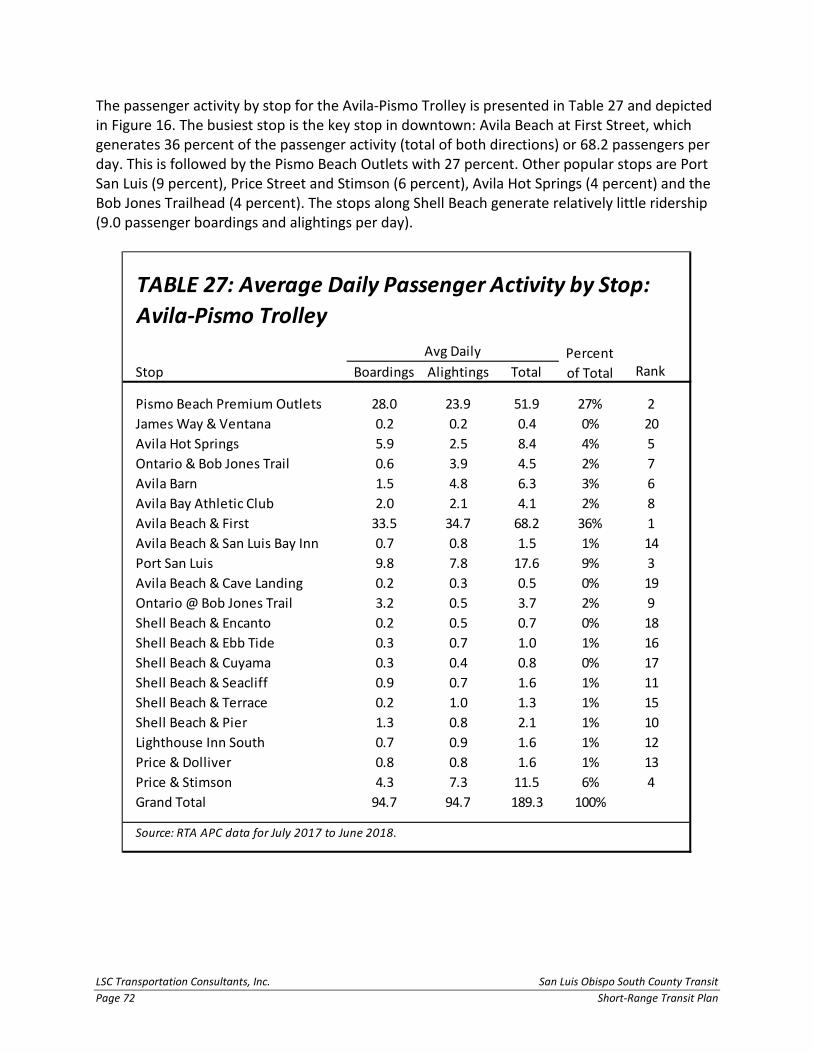
LSC Transportation Consultants, Inc. San Luis Obispo South County Transit Page 72 Short-Range Transit Plan
The passenger activity by stop for the Avila-Pismo Trolley is presented in Table 27 and depicted in Figure 16. The busiest stop is the key stop in downtown: Avila Beach at First Street, which generates 36 percent of the passenger activity (total of both directions) or 68.2 passengers per day. This is followed by the Pismo Beach Outlets with 27 percent. Other popular stops are Port San Luis (9 percent), Price Street and Stimson (6 percent), Avila Hot Springs (4 percent) and the Bob Jones Trailhead (4 percent). The stops along Shell Beach generate relatively little ridership (9.0 passenger boardings and alightings per day).
Stop Boardings Alightings Total Rank
Pismo Beach Premium Outlets 28.0 23.9 51.9 27% 2James Way & Ventana 0.2 0.2 0.4 0% 20Avila Hot Springs 5.9 2.5 8.4 4% 5Ontario & Bob Jones Trail 0.6 3.9 4.5 2% 7Avila Barn 1.5 4.8 6.3 3% 6Avila Bay Athletic Club 2.0 2.1 4.1 2% 8Avila Beach & First 33.5 34.7 68.2 36% 1Avila Beach & San Luis Bay Inn 0.7 0.8 1.5 1% 14Port San Luis 9.8 7.8 17.6 9% 3Avila Beach & Cave Landing 0.2 0.3 0.5 0% 19Ontario @ Bob Jones Trail 3.2 0.5 3.7 2% 9Shell Beach & Encanto 0.2 0.5 0.7 0% 18Shell Beach & Ebb Tide 0.3 0.7 1.0 1% 16Shell Beach & Cuyama 0.3 0.4 0.8 0% 17Shell Beach & Seacliff 0.9 0.7 1.6 1% 11Shell Beach & Terrace 0.2 1.0 1.3 1% 15Shell Beach & Pier 1.3 0.8 2.1 1% 10Lighthouse Inn South 0.7 0.9 1.6 1% 12Price & Dolliver 0.8 0.8 1.6 1% 13Price & Stimson 4.3 7.3 11.5 6% 4Grand Total 94.7 94.7 189.3 100%
Source: RTA APC data for July 2017 to June 2018.
TABLE 27: Average Daily Passenger Activity by Stop: Avila-Pismo Trolley
Percent of Total
Avg Daily

San Luis Obispo South County Transit LSC Transportation Consultants, Inc. Short-Range Transit Plan Page 73

LSC Transportation Consultants, Inc. San Luis Obispo South County Transit Page 74 Short-Range Transit Plan
SoCo Transit Passenger Loads Overcrowding on buses can be a serious issue to transit passengers and operators, and it is important that services be designed to avoid excessive loads that cause standees on buses or even passengers left at the stop. The passenger activity data collected by LSC (for each run on of each route on a weekday2) was analyzed to identify the passenger load along each route and summarized in Table 28. With the exclusion of the school tripper runs, the maximum load from the limited sample was 5 passengers on Route 27, 9 passengers on Route 21, 12 passengers on Route 24 and 13 passengers on Route 28. Given that the buses used on these routes seat 35 passengers, the maximum load on any of the routes used 37 percent of the seating capacity. Crowding is therefore not an issue on SoCo Transit.
2 Note that the 12:30 and 1:30 PM run on Route 27 was missed in the survey. (Onboard passenger surveys, boarding and alightings were conducted in March 2019.)
TABLE 28: SoCo Transit Maximum Passenger Load by Run
6:30 AM 2 6:30 AM 3 6:30 AM 2 6:00 AM 37:00 AM 6 7:00 AM 6 7:30 AM 5 7:07 AM 278:00 AM 9 8:00 AM 7 8:30 AM 3 7:30 AM 39:00 AM 6 9:00 AM 3 9:30 AM 4 8:30 AM 210:00 AM 3 10:00 AM 9 10:30 AM 5 9:30 AM 611:00 AM 7 11:00 AM 8 11:30 AM 4 10:30 AM 312:00 PM 4 12:00 PM 7 12:30 PM 27 11:30 AM 51:00 PM 8 1:00 PM 6 1:30 PM 1 12:30 PM 22:00 PM 9 2:00 PM 9 2:30 PM 2 1:30 PM 53:00 PM 5 3:00 PM 12 3:10 PM 5 2:30 PM 134:00 PM 5 4:00 PM 3 3:30 PM 4 3:30 PM 75:00 PM 6 5:00 PM 5 4:30 PM 1 3:30 PM 66:00 PM 5 6:00 PM 5 5:30 PM 1 5:30 PM 67:00 PM 3 7:00 PM 1 6:30 PM 1 6:30 PM 2
-- -- -- -- 7:30 PM 1 7:30 PM 3Maximum 8:00 AM 9 3:00 PM 12 10:30 AM 5 7:07 AM 27Maximum Excluding Trippers
8:00 AM 9 3:00 PM 12 10:30 AM 5 2:30 PM 13
Maximum % Load
Peak Load Point (Excluding Trippers)
Source: LSC Boarding/Alighting Counts.
Run
Star
t Tim
e
Tripper Bus
Route 21 Route 24 Route 27 Route 28
26% 34% 14% 37%
Downtown Pismo and Grand E. of Ramona Garden
Premium Outlet to Ramona Garden
13th/Farroll to Ramona Garden
E. Grand/El Camino Real to Oak
Park/Newport
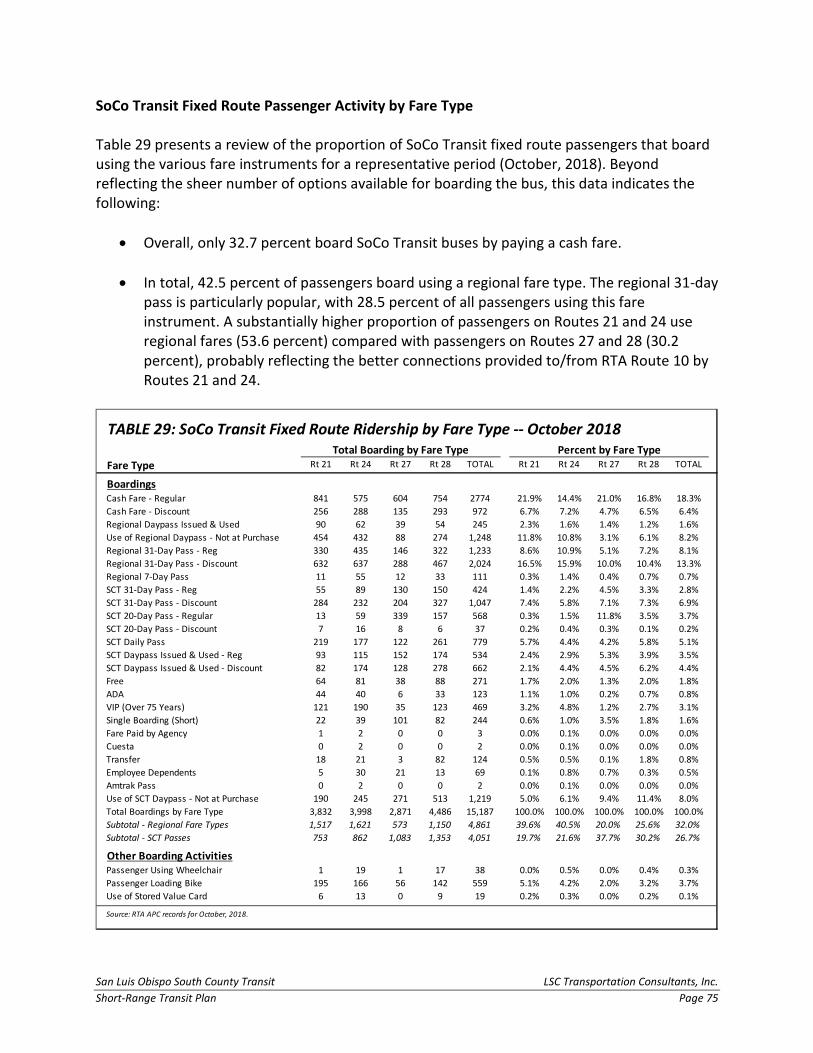
San Luis Obispo South County Transit LSC Transportation Consultants, Inc. Short-Range Transit Plan Page 75
SoCo Transit Fixed Route Passenger Activity by Fare Type Table 29 presents a review of the proportion of SoCo Transit fixed route passengers that board using the various fare instruments for a representative period (October, 2018). Beyond reflecting the sheer number of options available for boarding the bus, this data indicates the following:
• Overall, only 32.7 percent board SoCo Transit buses by paying a cash fare.
• In total, 42.5 percent of passengers board using a regional fare type. The regional 31-day pass is particularly popular, with 28.5 percent of all passengers using this fare instrument. A substantially higher proportion of passengers on Routes 21 and 24 use regional fares (53.6 percent) compared with passengers on Routes 27 and 28 (30.2 percent), probably reflecting the better connections provided to/from RTA Route 10 by Routes 21 and 24.
TABLE 29: SoCo Transit Fixed Route Ridership by Fare Type -- October 2018
Fare Type Rt 21 Rt 24 Rt 27 Rt 28 TOTAL Rt 21 Rt 24 Rt 27 Rt 28 TOTAL
BoardingsCash Fare - Regular 841 575 604 754 2774 21.9% 14.4% 21.0% 16.8% 18.3%Cash Fare - Discount 256 288 135 293 972 6.7% 7.2% 4.7% 6.5% 6.4%Regional Daypass Issued & Used 90 62 39 54 245 2.3% 1.6% 1.4% 1.2% 1.6%Use of Regional Daypass - Not at Purchase 454 432 88 274 1,248 11.8% 10.8% 3.1% 6.1% 8.2%Regional 31-Day Pass - Reg 330 435 146 322 1,233 8.6% 10.9% 5.1% 7.2% 8.1%Regional 31-Day Pass - Discount 632 637 288 467 2,024 16.5% 15.9% 10.0% 10.4% 13.3%Regional 7-Day Pass 11 55 12 33 111 0.3% 1.4% 0.4% 0.7% 0.7%SCT 31-Day Pass - Reg 55 89 130 150 424 1.4% 2.2% 4.5% 3.3% 2.8%SCT 31-Day Pass - Discount 284 232 204 327 1,047 7.4% 5.8% 7.1% 7.3% 6.9%SCT 20-Day Pass - Regular 13 59 339 157 568 0.3% 1.5% 11.8% 3.5% 3.7%SCT 20-Day Pass - Discount 7 16 8 6 37 0.2% 0.4% 0.3% 0.1% 0.2%SCT Daily Pass 219 177 122 261 779 5.7% 4.4% 4.2% 5.8% 5.1%SCT Daypass Issued & Used - Reg 93 115 152 174 534 2.4% 2.9% 5.3% 3.9% 3.5%SCT Daypass Issued & Used - Discount 82 174 128 278 662 2.1% 4.4% 4.5% 6.2% 4.4%Free 64 81 38 88 271 1.7% 2.0% 1.3% 2.0% 1.8%ADA 44 40 6 33 123 1.1% 1.0% 0.2% 0.7% 0.8%VIP (Over 75 Years) 121 190 35 123 469 3.2% 4.8% 1.2% 2.7% 3.1%Single Boarding (Short) 22 39 101 82 244 0.6% 1.0% 3.5% 1.8% 1.6%Fare Paid by Agency 1 2 0 0 3 0.0% 0.1% 0.0% 0.0% 0.0%Cuesta 0 2 0 0 2 0.0% 0.1% 0.0% 0.0% 0.0%Transfer 18 21 3 82 124 0.5% 0.5% 0.1% 1.8% 0.8%Employee Dependents 5 30 21 13 69 0.1% 0.8% 0.7% 0.3% 0.5%Amtrak Pass 0 2 0 0 2 0.0% 0.1% 0.0% 0.0% 0.0%Use of SCT Daypass - Not at Purchase 190 245 271 513 1,219 5.0% 6.1% 9.4% 11.4% 8.0%Total Boardings by Fare Type 3,832 3,998 2,871 4,486 15,187 100.0% 100.0% 100.0% 100.0% 100.0%Subtotal - Regional Fare Types 1,517 1,621 573 1,150 4,861 39.6% 40.5% 20.0% 25.6% 32.0%Subtotal - SCT Passes 753 862 1,083 1,353 4,051 19.7% 21.6% 37.7% 30.2% 26.7%
Other Boarding ActivitiesPassenger Using Wheelchair 1 19 1 17 38 0.0% 0.5% 0.0% 0.4% 0.3%Passenger Loading Bike 195 166 56 142 559 5.1% 4.2% 2.0% 3.2% 3.7%Use of Stored Value Card 6 13 0 9 19 0.2% 0.3% 0.0% 0.2% 0.1%
Source: RTA APC records for October, 2018.
Total Boarding by Fare Type Percent by Fare Type

LSC Transportation Consultants, Inc. San Luis Obispo South County Transit Page 76 Short-Range Transit Plan
• Overall, 35.4 percent of passengers use some form of SoCo Transit pass. SoCo Transit day passes are the most popular (17.3 percent) followed by SoCo Transit 31-day passes (14.2 percent).
• Of the various regional and SoCo Transit pass options, the regional 7-day pass is the
least used, representing 1.0 percent of all boardings. • Other fare options with very low levels of use are the Amtrak transfer passes and Cuesta
free passes. • Overall, only 0.3 percent of boardings were by passengers using a wheelchair. This
ranged from a high of 0.6 percent on Route 24 to a low of 0.0 percent (only 1 boarding over the month) on both Routes 21 and 27.
• 4.9 percent of passengers loaded a wheelchair on the bus bike racks. This proportion
was highest on Routes 21 (7.6 percent) and Route 24 (5.3 percent), and lowest on Route 27 (2.6 percent).
DIAL-A-RIDE PROGRAMS Dial-A-Ride Performance Analysis A performance analysis for the four individual Dial-a-Ride services is presented in Table 30. Note that the analysis for the Shandon and Templeton services was for a full year, while the Nipomo and Paso Robles analysis was conducted for a typical month during the school year (October, 2018). A review of these results indicates the following:
• The ridership levels are very different. With only 2 passenger-trips over an entire year,
the Shandon Dial-a-Ride had only 0.01 passenger for every day that the service was available, compared with 1.8 for the Templeton DAR, 10.6 for the Paso Robles Dial-a-Ride and 82.3 for the Nipomo Dial-a-Ride. The relatively high level for the Nipomo service is a reflection of the concentration of ridership generated by the schools.
• The passenger-trips per revenue vehicle-hour (“productivity”) is highest for the Nipomo Dial-a-Ride at 4.6, followed by 3.5 for the Templeton Dial-a-Ride, 1.8 for the Paso Robles Dial-a-Ride and only 0.5 for the Shandon Dial-a-Ride.
• The Templeton Dial-a-Ride is the most productive on a per-revenue-mile basis at 0.92, reflecting the short length of travel while the passengers are on the vehicle. This is followed by the Nipomo service at 0.60, the Paso Robles service at 0.22 and the Shandon service at 0.02.

San Luis Obispo South County Transit LSC Transportation Consultants, Inc. Short-Range Transit Plan Page 77
• Costs for the individual services were calculated at the marginal rate of $119 per revenue hour for the Shandon and Templeton services (reflecting relatively long trips in for both revenue and deadhead elements), $96 for the Paso Robles service and $93 for the Nipomo service. The marginal cost per passenger-trip is “best” (lowest) for the Nipomo Dial-a-Ride at $20 and highest for the Shandon Dial-a-Ride at $220.
• Subtracting passenger fare revenues, the marginal operating subsidy per passenger-trip
is best for the Nipomo Dial-a-Ride at $19, followed by $32 for the Templeton Dial-a-Ride, $50 for the Paso Robles Dial-a-Ride and reaching $217 for the Shandon Dial-a-Ride.
Overall, these results reflect the very different functions of the Dial-a-Ride programs. The Nipomo Dial-a-Ride provides elementary school transportation, which tends to improve the performance results by concentrating trips into a “many to one” pattern that is more efficient than a “one to one” dispersed pattern, as well as a modest level of general Dial-a-Ride trips around a core area. The Paso Robles Dial-a-Ride does not serve any significant number of student trips but instead serves “one to one” trips over a larger area, which inherently tends to result in lower performance results. Finally, the Templeton and Shandon Dial-a-Ride services are “lifeline” in nature, serving very occasional trips that cannot be accommodated in other ways. Given this sporadic trip pattern and long travel distances (either in revenue service or deadheading), the performance of these rural Dial-a-Ride services is poorer. Dial-A-Ride Ridership Patterns Nipomo Dial-A-Ride A detailed analysis of ridership records for October 2018 was conducted to provide additional information on the use patterns of the service.
TABLE 30: Dial-A-Ride Performance Analysis
From To
Templeton DAR 7/1/2017 6/30/2018 167 61 220 181 60.0 48.4 $405 $5,755 $5,350
Shandon DAR 7/1/2017 6/30/2018 2 153 146 111 4.9 3.7 $5 $439 $434
Nipomo DAR 10/1/2018 10/31/2018 1,892 23 3,288 3,149 442.3 413.2 $3,402 $38,423 $35,021
Paso Robles DAR 10/1/2018 10/31/2018 243 23 1,205 1,130 160.5 132.4 $560 $12,710 $12,150
Source: RouteMatch Productivity by Service reports..
Performance Analysis Psgr per Revenue Vehicle-Mile
Input Data
$32
$217
Ridership
Total Service Miles
Marginal Subsidy per Psgr
Marginal Cost per Psgr
Ridership per Available Service Day
Psgr per Revenue Vehicle-Hour
SubsidyService
DaysRevenue
MilesData Range
Total Service Hours
Templeton DAR
Shandon DAR
Nipomo DAR
Paso Robles DAR
0.92
0.02
0.60
0.22
1.8
0.01
Revenue Hours
Fare Revenue
Marginal Operating
Cost
82.3
10.6
3.45
0.54
4.58
1.84
$19
$50
$34
$220
$20
$52
LSC Transportation Consultants, Inc. San Luis Obispo South County Transit Page 78 Short-Range Transit Plan
Ridership by Day of Week Table 31 presents the average ridership by day of week. This data was also categorized by full school days versus minimum school days (a total of five minimum school days). As shown, the highest passenger activity was on Friday on the full school days and Wednesday on the minimum school days. Ridership on the minimum school days was observed to be 5 to 10 percent above the average full school day. Ridership by Hour The average passenger boardings by hour for both full school days and minimum school days is shown in Table 32 and depicted in Figure 17. This reflects the strong concentration in ridership during the school bell times: the 8:00 AM hour and 3:00 PM hour on the full school days and in the 8:00 AM hour and 12:00 PM (noon) hour on minimum days. School Trip Passenger Rosters RTA maintains a passenger roster for students attending the three elementary schools in Nipomo (Nipomo, Dorothea Lange and Dana). All requests for Nipomo Elementary and Dorothea Lane Elementary can be accommodated within the van capacity but a waiting list is maintained for Dana Elementary students. Passenger Trip Origin / Destination Patterns
The monthly trip logs were analyzed to tally the trip origins versus destination pairs. The results are presented in Table 33 and plotted in Figure 18. A review of this data indicates the following:
• Of all trips, the elementary schools are the origin or destination of the following proportion of all trips: o Dana Elementary—40 percent of all trips o Nipomo Elementary—34 percent of all trips o Dorothea Lang Elementary—5 percent of all trips o In total, 79 percent of all trips are to/from the elementary schools.
• Trips not made to the elementary schools total an average of 18.6 one-way passenger-
trips per day. • No strong pattern was found in the trips not to or from the elementary schools. • While service is available to a broader area, all trips in October 2018 occurred to and
from locations in the central portion of Nipomo south of Sandydale Drive.

San Luis Obispo South County Transit LSC Transportation Consultants, Inc. Short-Range Transit Plan Page 79
Full School DayMinimum
School Day
Monday 87 -- 97% --Tuesday 90 94 100% 105%Wednesday 84 99 94% 110%Thursday 88 94 98% 105%Friday 99 -- 110% --Note: For Oct 1 to 26, 2018. All weekdays were full or minimum school days.Source: SoCo Transit Dial-a-Ride Ridership Reports.
TABLE 31: Nipomo Dial-a-Ride Ridership by Day of Week
Percent of Average Full School Full School
DayMinimum
School Day
Regular School Day Minimum Day6:00 AM 1.8 2.07:00 AM 4.3 6.38:00 AM 30.1 34.79:00 AM 7.6 3.010:00 AM 3.2 3.711:00 AM 2.5 3.012:00 PM 4.9 26.71:00 PM 3.1 2.32:00 PM 3.3 2.73:00 PM 25.4 7.74:00 PM 2.5 2.75:00 PM 0.6 0.76:00 PM 0.8 0.3Note: For Oct 1 to 26, 2018. All weekdays were full or minimum school days.Source: SoCo Transit Nipomo DAR Boarding Analysis, 2018.
TABLE 32: Nipomo Dial-a-Ride Average Boardings by Hour

LSC Transportation Consultants, Inc. San Luis Obispo South County Transit Page 80 Short-Range Transit Plan

San Luis Obispo South County Transit LSC Transportation Consultants, Inc. Short-Range Transit Plan Page 81

LSC Transportation Consultants, Inc. San Luis Obispo South County Transit Page 82 Short-Range Transit Plan
Paso Robles Dial-A-Ride Trip Patterns Ridership pattern data for the Paso Robles Dial-A-Ride, as shown in Table 34, were also analyzed for October 2018 (1st to 26th). The analysis provided the following highlights:
• A total of 197 passenger-trips were served over this period. • As shown ridership was highest on Thursday (11.5 passenger-trips per day) and Friday
(11.3), and lowest on Wednesday (8.0) followed by Monday (8.3).
• Average boardings in each hour were highest in the 10:00 AM hour, as shown in Table
35, with 2.0 passenger-trips. Ridership was at least 1.2 passenger-trips per hour in each of the scheduled hours, with a few trips (6 over the 20 days) served after the formal 1:00 PM end of scheduled service due to delays. Ridership within the scheduled hours is lowest in the 7:00 AM hour, at 1.2 boardings per hour.
• Table 36 and Figure 19 show the distribution of individual passenger-trip origin vs.
destination pairs. Overall travel patterns are very dispersed, with no specific location generation more than 1 trip origin or destination per day (20 over the 20 service-days analyzed).
Average Ridership Percent of Average
Monday 8.3 84%Tuesday 10.3 104%Wednesday 8.0 81%Thursday 11.5 117%Friday 11.3 114%
TABLE 34: Paso Robles Dial-a-Ride by Day of Week
Note: For Oct 1 to 26, 2018.
Hour Beginning Hourly Boardings Percent of Peak
7:00 AM 1.2 58%8:00 AM 1.5 75%9:00 AM 1.8 88%
10:00 AM 2.0 100%11:00 AM 1.8 88%12:00 PM 1.4 70%1:00 PM 0.3 15%
TABLE 35: Paso Robles Dial-a-Ride Average Boardings by Hour
Note: For Oct 1 to 26, 2018.

San Luis Obispo South County Transit LSC Transportation Consultants, Inc. Short-Range Transit Plan Page 83
TABL
E 36
: Pas
o Ro
bles
Dia
l-a-R
ide
Tota
l Mon
thly
Trip
s by
Orig
in a
nd D
estin
atio
nO
ctob
er 1
to 2
6, 2
018
(20
Serv
ice
Days
) ORIGIN TOTAL
1100 Block of Olive St1100 Block of Stoney Creek Rd1100 Block of Caddie Ln1100 Block of Creston Rd1100 Block of Creston Rd11000 Block of Los Osos Valley Rd100 Block of Niblick Rd1200 Block of Dorothy St1300 Block of White Clover Ln1400 Block of Park St1400 Block of Creston Rd1400 Block of Creston Rd100 Block of Niblick Rd100 Block of Flag Way1400 Block of Creston Rd1500 Block of Spring St1700 Block of Kings Dr100 Block of Niblick Rd100 Block of Niblick Rd1900 Block of Creston Rd100 Block of Niblick Rd2000 Block of Spring St2100 Block of Golden Hill Rd2100 Block of Spring St200 Block of Oak Hill Rd2200 Block of Villa Ln2425 Golden Hill Rd2400 Block of Theater Dr200 Block of Scott St2700 Block of Buena Vista Dr2800 Block of Riverside Ave300 Block of Primrose Ln3400 Block of Dry Creek Rd400 Block of Oak Hill Rd400 Block of Spring St400 Block of 16th St40 Block of W 12th St500 Block of Queenanne Rd60 Block of 12th St600 Block of Queenanne Rd600 Block of Nicklaus St700 Block of Pine St700 Block of Gardenia Cir700 Block of 23rd St80 Block of Cary800 Block of 6th St800 Block of 28th St800 Block of 6th St800 Block of 14th St
26 Locations with 1 Trip Destination
DEST
INAT
ION
TO
TAL
23
23
91
11
106
41
11
21
312
121
21
12
18
22
52
14
2013
12
11
21
62
120
21
51
226
1100
Blo
ck o
f Oliv
e St
21
111
00 B
lock
of S
tone
y Cr
eek
Rd5
11
13
1100
Blo
ck o
f Cad
die
Ln1
11
1100
Blo
ck o
f Cre
ston
Rd
42
11
111
00 B
lock
of C
rest
on R
d10
81
10
1100
Blo
ck o
f Los
Oso
s Val
ley
Rd1
112
00 B
lock
of D
orot
hy S
t2
11
213
00 B
lock
of L
arks
pur L
n20
200
1300
Blo
ck o
f Whi
te C
love
r Lan
e13
12
14
12
13
1400
Blo
ck o
f Par
k St
55
014
00 B
lock
of C
rest
on R
d4
11
21
100
Bloc
k of
Nib
lick
Rd1
11
1400
Blo
ck o
f Cre
ston
Rd
22
017
00 B
lock
of K
ings
Dr
21
10
100
Bloc
k of
Nib
lick
Rd13
12
14
11
11
100
Bloc
k of
Nib
lick
Rd12
11
41
13
210
0 Bl
ock
of N
iblic
k Rd
21
121
00 B
lock
of G
olde
n Hi
ll Rd
11
121
00 B
lock
of S
prin
g St
22
022
00 B
lock
of V
illa
Ln8
80
2400
Blo
ck o
f Gol
den
Hill
Rd2
20
2400
Blo
ck o
f The
ater
Dr
21
11
200
Bloc
k of
Sco
tt S
t5
14
127
00 B
lock
of B
uena
Vis
ta D
r2
20
300
Bloc
k of
Prim
rose
Ln4
11
21
400
Bloc
k of
Oak
Hill
Rd
141
24
52
040
0 Bl
ock
of 1
6th
St2
20
600
Bloc
k of
Que
enan
ne R
d1
11
600
Bloc
k of
Nic
klau
s St
66
070
0 Bl
ock
of C
rest
on R
d2
20
700
Bloc
k of
Pin
e St
55
070
0 Bl
ock
of O
xen
Ct2
20
800
Bloc
k of
6th
St
21
10
800
Bloc
k of
Pin
e St
1414
080
0 Bl
ock
of 2
8th
St5
12
11
280
0 Bl
ock
of H
ogan
Pl
11
180
0 Bl
ock
of 7
th S
t2
11
080
0 Bl
ock
of B
olen
Dr
22
020
Oth
er Lo
catio
ns w
ith 1
Trip
O
rigin
200
21
10
11
01
01
00
00
00
22
00
01
10
00
00
00
01
00
00
00
11
00
00
11
00
TRIP
DES
TIN
ATIO
NORIGIN

LSC Transportation Consultants, Inc. San Luis Obispo South County Transit Page 84 Short-Range Transit Plan

San Luis Obispo South County Transit LSC Transportation Consultants, Inc. Short-Range Transit Plan Page 85
Templeton Dial-A-Ride Trip Patterns Trips on the Templeton Dial-a-Ride service are largely between residences in Templeton and the medical facilities at or near the Twin Cities Community Hospital. This typically consists of one passenger being provided with a round-trip on a day when any service is requested. Shandon Dial-A-Ride Trip Patterns The two individual passenger-trips served over the FY 2017/18 fiscal year consisted of trips between a Shandon residence and Paso Robles or Templeton. Dial-A-Ride On-Time Performance A summary of on-time performance of the four Dial-a-Ride services over a 9 month period is presented in Table 37. As shown, all four services are easily meeting the existing standard that at least 95 percent of runs are served within 30 minutes of the scheduled pick-up time. This actual percentage is at least 99 percent on all services. At least 97 percent of pick-ups occur at the specific scheduled time on the Nipomo, Shandon and Templeton Dial-a-Ride services. Performance of the Paso Robles Dial-a-Ride is poorer with 83 percent occurring at the specific scheduled time, 0.8 percent occurring late and 16.2 percent occurring early, but 99 percent are still within 30 minutes of the scheduled time and 93.1 percent are within 10 minutes.
For all trips July 2018 through March 2019
Nipomo DAR
Paso Robles DAR
Shandon DAR
Templeton DAR
>30 0.4% 0.8% 0.0% 0.0%26-30 0.0% 0.3% 0.0% 0.0%21-25 0.0% 0.7% 0.0% 0.0%16-20 0.1% 1.1% 0.0% 0.0%11-15 0.2% 2.4% 0.0% 0.0%6-10 0.2% 5.9% 0.0% 0.0%1-5 0.4% 5.0% 0.0% 0.0%
On-Time 97.4% 83.0% 100.0% 97.4%1-5 0.4% 0.2% 0.0% 0.0%6-10 0.3% 0.1% 0.0% 0.0%11-15 0.1% 0.1% 0.0% 2.6%16-20 0.1% 0.0% 0.0% 0.0%21-25 0.0% 0.1% 0.0% 0.0%26-30 0.0% 0.1% 0.0% 0.0%>30 0.3% 0.2% 0.0% 0.0%
On-Time Window
Percent in On-Time Window 99.3% 99.0% 100.0% 100.0%
Source: Routematch reports.
EARL
YLA
TE
95% Within 30 Minutes of Scheduled Time
TABLE 37: Summary of On-Time Performance for Dial-A-Rides

LSC Transportation Consultants, Inc. San Luis Obispo South County Transit Page 86 Short-Range Transit Plan
Dial-A-Ride No-Show and Late Cancellation Rates An important factor in the operation of a demand-response service is the proportion of passenger-trips that are “no shows” (are not available for travel at the scheduled pick-up time, thereby wasting resources) or cancel a reservation too late for the driver and vehicle to be scheduled to serve another passenger (within 2 hours of the reservation time). These rates are shown in Table 38. The cancellation rate is highest (10.9 percent) for the Templeton Dial-a-Ride, though fortunately this does not reflect a high number of trips. Late cancellations are also relatively high (3.9 percent) on the Paso Robles Dial-a-Ride. No-show passengers are concentrated on the Nipomo Dial-a-Ride service, where 10.5 percent of trips are no-shows. A review of trip patterns indicates that the large majority of these are students. As there are typically other students in the same vicinity that are not no-shows, trips are still productive and this results in a smaller impact on overall operations than would otherwise be the case. However, these no-shows still take up capacity that could otherwise be used for other passengers on the waiting list, and as a result RTA does monitor and enforce passenger policies to curb this problem. The Templeton Dial-a-Ride also has a relatively high no-show rate of 6.0 percent, though this average only 1 such trip per month on average. As a point of comparison, no-show rates on public Dial-a-Ride typically are between 2.5 and 3.0 percent.
From To Ridership # Rate # Rate
Templeton DAR
7/1/2017 6/30/2018 167 22 10.9% 12 6.0%
Shandon DAR 7/1/2017 6/30/2018 2 0 0.0% 0 0.0%
Nipomo DAR 10/1/2018 10/31/2018 1,892 44 2.0% 227 10.5%
Paso Robles DAR
10/1/2018 10/31/2018 243 10 3.9% 6 2.3%
No ShowsLate
Cancellations
TABLE 38: Dial-A-Ride Cancellation and No Show Rates
Data Range
Source: RouteMatch Productivity by Service reports.

San Luis Obispo South County Transit LSC Transportation Consultants, Inc. Short-Range Transit Plan Page 87
Chapter 6 Peer System Analysis
A “peer analysis” is a useful tool in comparing a transit program with other, similar programs. This provides good context for the ridership and performance figures and helps in identifying areas of relative strength and weaknesses. This discussion first presents the peer systems selected for comparison, followed by the data and analysis. FIXED ROUTE TRANSIT PEER OPERATORS Table 39 displays operating data for five municipally operated transit systems servicing similar areas. These operators were chosen based on the following characteristics:
• Service areas with similar population (50,000 to 90,000). • Service areas of that range between 10 to 22 square miles. SoCo Transit serves 15
square miles. • Absence of a major university or four-year college. • A location not immediately adjacent to a major metropolitan area. • A service area located within California. A brief overview of each California-based peer transit system is as follows: • Lompoc Transit—The City Lompoc is a coastal town located 27 miles south of Santa
Maria. Lompoc Transit serves a population of 55,666 people with four routes operating weekdays between 6:30 AM and 7:00 PM and Saturdays between 9:00 AM and 5:00 PM.
• Petaluma Transit—The City of Petaluma is located approximately 40 miles north of San
Francisco. Petaluma Transit serves a population of 60,530 people with six routes. They provide service seven days per week with hours of operation Monday through Friday between 6:30 AM and 8:22 PM, Saturdays between 7:30 AM and 7:52 PM, and Sundays between 8:30 AM and 4:52 PM.
• Delano Area Rapid Transit (DART)—The City of Delano is 30 miles north of Bakersfield.
DART provides service to a population of 54,372 people along four routes. Hours of service include weekdays between 7:00 AM and 5:00 PM and Saturdays between 8:30 AM 4:00 PM. Bus routes operate every 30 minutes from the central Delano Station.

LSC Transportation Consultants, Inc. San Luis Obispo South County Transit Page 88 Short-Range Transit Plan
• City of Lodi Transit: The Grapeline—The City of Lodi is located 40 miles south of Sacramento. The Grapeline provides five routes and serves a population of 68,738 people. Hours of service include weekdays and Saturdays between 6:30 AM and 7:20 PM and Sundays between 7:30 AM and 9:20 PM.
• Porterville Transit—The City of Porterville is located 51 miles north of Bakersfield.
Porterville Transit operates nine routes on weekdays between 6:00 AM and 10:15 PM, Saturdays between 8:00 AM and 10:15 PM and Sundays between 8:00 AM and 6:05 PM.
• City of Turlock Transit – The City of Turlock is located 15 miles south from Modesto,
California. This system provides service on weekdays between 6:00 AM and 8:55 PM and Saturdays from 9:10 AM to 6:55 PM. The system runs six routes that pulse from a central Turlock Regional Transit Center every 30 minutes.
The Simi Valley and City of Visalia transit systems were also considered but ultimately not included in the peer analysis due to their service area populations being over 120,000 people. Transit system data was collected for fiscal year 2017/18 (the most recent year with audited data available). As shown in the top of Table 39, the SoCo Transit program has the smallest service area population of the six peer systems (though only 2,494 people less than Delano Area Rapid Transit). It also has a relatively small fixed route transit program, ranking sixth in
TABLE 39: SoCo Transit Fixed Route Peer Analysis
Transit SystemService Area Population
Annual Ridership
Vehicle Revenue
Miles
Vehicle Revenue
HoursSquare Miles
of Service
Annual Operating
CostsFare
Revenues
Peak Buses in Service
SoCo Transit 51,878 154,655 217,895 14,493 15 $1,322,452 $162,511 5Lompoc Transit (COLT) 55,666 93,528 212,083 16,034 11 $1,056,318 $140,090 8Petaluma Transit 60,530 343,616 246,443 19,797 12 $1,749,315 $221,598 14Delano Area Rapid Transit (DART) 54,372 101,416 131,275 10,250 10 $876,916 $77,169 4City of Lodi 68,738 272,990 259,734 22,511 16 $1,944,395 $156,811 8City of Porterville 70,272 620,420 701,880 50,183 21 $3,270,987 $524,987 9City of Turlock Transit 87,867 117,295 390,710 24,695 22 $1,011,912 $65,549 6
Peer Average 66,241 258,211 323,688 23,912 15.3 $1,651,641 $197,701 8SoCo Transit Percent of Peer Average -22% -40% -33% -39% -2% -20% -18% -39%
SoCo Transit Ranking (1 = Highest) 7 4 5 6 4 4 3 6
Annual Vehicle Service Hours
per Capita
Annual Ridership per Capita
Passengers per Vehicle-
HourPassengers
per MileOperating
Cost per HourCost per Psgr-
TripSubsidy Per
Psgr-TripFarebox
RatioSoCo Transit 0.28 2.98 10.7 0.71 $91.25 $8.55 $7.50 12%Lompoc Transit (COLT) 0.29 1.68 5.8 0.44 $65.88 $11.29 $9.80 13%Petaluma Transit 0.33 5.68 17.4 1.39 $88.36 $5.09 $4.45 13%Delano Area Rapid Transit (DART) 0.19 1.87 9.9 0.77 $85.55 $8.65 $7.89 9%City of Lodi 0.33 3.97 12.1 1.05 $86.38 $7.12 $6.55 8%City of Porterville 0.71 8.83 12.4 0.88 $65.18 $5.27 $4.43 16%City of Turlock Transit 0.28 1.33 4.7 0.30 $40.98 $8.63 $8.07 6%
Peer Average 0.35 3.89 10.4 0.81 $72.05 $7.68 $6.86 11%SoCo Transit Percent of Peer Average -21% -23% 3% -12% 27% 11% 9% 13%
SoCo Transit Ranking (1=Best) 6 4 4 5 7 4 4 4
Source: NTD Profile Summaries, Fiscal Year 2017-18
Performance Measures
Input Data

San Luis Obispo South County Transit LSC Transportation Consultants, Inc. Short-Range Transit Plan Page 89
terms of annual vehicle-service hours and peak buses in operation and fifth in terms of annual vehicle-miles. The bottom portion of Table 39 presents a performance analysis of the various peer systems. A review of this indicates the following:
• The operating cost per vehicle-hour of service ranges between $40.98 for Turlock
Transit and $91.25 for SoCo Transit. SoCo Transit costs are approximately 27 percent higher than the peer average of $72.05. However, this hourly cost is only approximately $3 higher than Petaluma Transit.
• The annual vehicle service hours per capita provided by SoCo Transit is 0.28. With a
peer average of 0.35, SoCo Transit is 21 percent below the peer average. (Note that the SoCo Transit service area is also served by RTA Route 10, which is not included in this figure.) This indicates that the SoCo Transit program is in line with the other peer communities, although on the low side.
• SoCo Transit fixed route service generates a good number of passenger trips per
vehicle-hour of service (also known as the service productivity). At 10.7, this figure is 3 percent above the peer average.
• SoCo Transit serves a relatively average to low number of passenger-trips per vehicle-
mile of service, coming in just behind DART at 12 percent below the peer average. • The use of public transit in the South County region ranks fourth at 2.98 transit trips per
person per year. • SoCo Transit’s fixed route cost per passenger-trip of $8.55 is just over the peer average
($7.68) by 11 percent. • An important measure of a transit service is the operating subsidy (costs minus
passenger fares) per passenger-trip. This compares the key public “input” to a transit program (public funding) to the key desired “output” (passenger-trips). SoCo Transit ranks fourth of the six peer systems by this measure, as it requires $7.50 compared to a range of the peers between $4.43 and $9.80.
• Finally, the “farebox ratio” is the proportion of operating costs that are covered by the
passenger fares. The peer systems range from a low of 6 percent in Turlock to a high of 16 percent in Porterville. The SoCo Transit fixed routes generate a figure of 12 percent, slightly above the average of 11 percent.
Overall, these figures reflect well on the cost-efficiency of the SoCo Transit program (particularly given the relatively high wage rates along the West Coast). The relatively low
LSC Transportation Consultants, Inc. San Luis Obispo South County Transit Page 90 Short-Range Transit Plan
vehicle-hours per capita, average vehicle service-hours per capita and above average passengers per vehicle-hour indicate that service could be modified while still resulting in transit figures that stay well within those of the peer systems. DIAL-A-RIDE TRANSIT PEER OPERATORS A similar peer analysis was conducted for the demand response paratransit services operated in each community. As shown in the top portion of Table 40, a review of the characteristics of the various services indicates the following:
• Service levels are relatively moderate with annual vehicle service-hours 11 percent
below the average and service-miles 25 percent more than the average. • Annual operating costs and fare revenues are also relatively low. RTA operating costs
rank third compared to the operating costs of similar systems with fare revenue ranking fourth.
• Annual RTA Dial-a-Ride ridership ranks third out of the six systems, even with an annual
ridership that is greater than the peer average. • The operating cost per passenger-trip for RTA Dial-a-Ride is $28.90, making it the
lowest of the peer systems, fully 36 percent below the peer average of $44.89. • RTA Dial-a-Ride ranks first of the peers with regards to the lowest subsidy per
passenger-trip, requiring $27.02 compared to a peer average of $42.52. • The farebox ratio for RTA Dial-a-Ride is 7 percent. This is 22 percent more than the peer
average of 5 percent.
Overall, this analysis indicates that the RTA Dial-a-Ride is very efficient with regards to the costs of serving paratransit passengers with operating costs and subsidy per trip much lower than the peer average. This is a result of relatively high passenger-trips per service-hour (tied for second from the highest) and relatively low cost per service-hour (second from the lowest). In review of these results, it should be kept in mind that the goal of a paratransit program is typically not to maximize ridership. As the cost to serve a passenger-trip on a paratransit service is much higher than fixed route services (approximately 4 times, in the case of the RTA Dial-a-Ride program), the goal of a paratransit program is to fully serve those persons in need of door-to-door service at a high quality rather than maximizing ridership.

San Luis Obispo South County Transit LSC Transportation Consultants, Inc. Short-Range Transit Plan Page 91
The peer performance analysis for the demand response services shown in the bottom portion of Table 40 indicates the following:
• RTA Dial-a-Ride is relatively cost-efficient, ranking second with regards to the operating
cost per vehicle service-hour and 25 percent below the peer average. • The annual ridership per capita, at 0.36 trips per person per year, is 47 percent greater
than the peer average. • The productivity (passenger-trips per vehicle service-hour) of RTA Dial-a-Ride ranks
third of all the peers at 3.3 passengers per hour. This is 21 percent higher than the peer average of 2.7.
• Similarly, the passengers per vehicle service-mile (0.37) ranks second of the peers and
is 46 percent less than the peer average of 0.68.
TABLE 40: RTA Dial-a-Ride Peer Analysis
Transit SystemService Area Population
Annual Ridership
Vehicle Revenue
Miles
Vehicle Revenue
HoursSquare Miles
of Service
Annual Operating
CostsFare
Revenues
Peak Buses in Service
Nipomo Dial-a-Ride 16,117 15,467 33,288 4,128 8 $397,013 $27,810 1Paso Robles Dial-a-Ride 32,446 2,861 11,575 1,391 12 $131,333 $6,598 1Shandon / Templeton Dial-a-Ride 18,408 169 292 52 6 $6,194 $410 2
RTA Dial-a-Ride Total 51,878 18,497 50,210 5,571 26 $534,540 $34,818 4Lompoc Transit (COLT) 55,666 7,983 36,849 4,570 11 $285,235 $14,489 2Petaluma Transit 60,530 19,421 75,496 9,251 12 $906,039 $43,277 7Delano Area Rapid Transit (DART) 54,372 14,502 49,693 6,608 10 $688,403 $47,203 4City of Lodi 68,738 32,485 11,706 12,074 16 $1,289,341 $63,407 6City of Porterville 70,272 10,480 39,256 2,384 21 $584,179 $20,817 3City of Turlock Transit 87,867 8,706 28,873 2,609 22 $383,708 $26,206 4
Peer Average 66,241 15,596 40,312 6,249 15 $689,484 $35,900 4.3RTA Dial-a-Ride Percent of Peer Average -22% 19% 25% -11% 70% -22% -3% -8%
RTA Dial-a-Ride Ranking (1 = Highest) 7 3 2 4 1 3 4 3
Annual Vehicle Service Hours per
Capita
Annual Ridership per Capita
Passengers per Vehicle-
HourPassengers
per MileOperating
Cost per HourCost per Psgr-Trip
Subsidy Per Psgr-Trip
Farebox Ratio
Nipomo Dial-a-Ride 0.26 0.96 3.7 0.46 $96.18 $25.67 $23.87 7%Paso Robles Dial-a-Ride 0.04 0.09 2.1 0.25 $94.42 $45.90 $43.60 5%Shandon / Templeton Dial-a-Ride 0.00 0.01 3.2 0.58 $118.89 $36.65 $34.22 7%
RTA Dial-a-Ride Total 0.11 0.36 3.3 0.37 $95.95 $28.90 $27.02 7%Lompoc Transit (COLT) 0.08 0.14 1.7 0.22 $62.41 $35.73 $33.92 5%Petaluma Transit 0.15 0.32 2.1 0.26 $97.94 $46.65 $44.42 5%Delano Area Rapid Transit (DART) 0.12 0.27 2.2 0.29 $104.18 $47.47 $44.21 7%City of Lodi 0.18 0.47 2.7 2.78 $106.79 $39.69 $37.74 5%City of Porterville 0.03 0.15 4.4 0.27 $245.04 $55.74 $53.76 4%City of Turlock Transit 0.03 0.10 3.3 0.30 $147.07 $44.07 $41.06 7%
Peer Average 0.10 0.24 2.7 0.68 $127.24 $44.89 $42.52 5%RTA Dial-a-Ride Percent of Peer Average 8% 47% 21% -46% -25% -36% -36% 22%
RTA Dial-a-Ride Ranking (1=Best) 4 2 3 2 2 1 1 3
Source: NTD Profile Summaries, Fiscal Year 2017-18.
Performance Measures
Input Data
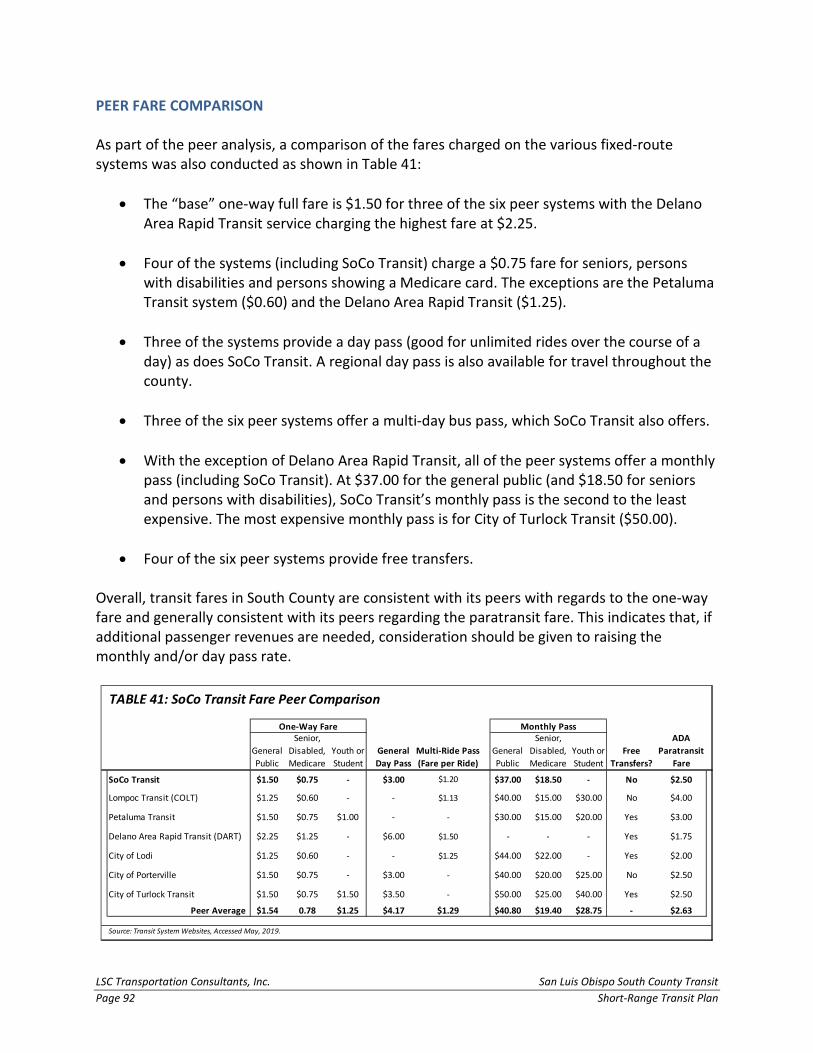
LSC Transportation Consultants, Inc. San Luis Obispo South County Transit Page 92 Short-Range Transit Plan
PEER FARE COMPARISON As part of the peer analysis, a comparison of the fares charged on the various fixed-route systems was also conducted as shown in Table 41:
• The “base” one-way full fare is $1.50 for three of the six peer systems with the Delano
Area Rapid Transit service charging the highest fare at $2.25. • Four of the systems (including SoCo Transit) charge a $0.75 fare for seniors, persons
with disabilities and persons showing a Medicare card. The exceptions are the Petaluma Transit system ($0.60) and the Delano Area Rapid Transit ($1.25).
• Three of the systems provide a day pass (good for unlimited rides over the course of a
day) as does SoCo Transit. A regional day pass is also available for travel throughout the county.
• Three of the six peer systems offer a multi-day bus pass, which SoCo Transit also offers. • With the exception of Delano Area Rapid Transit, all of the peer systems offer a monthly
pass (including SoCo Transit). At $37.00 for the general public (and $18.50 for seniors and persons with disabilities), SoCo Transit’s monthly pass is the second to the least expensive. The most expensive monthly pass is for City of Turlock Transit ($50.00).
• Four of the six peer systems provide free transfers.
Overall, transit fares in South County are consistent with its peers with regards to the one-way fare and generally consistent with its peers regarding the paratransit fare. This indicates that, if additional passenger revenues are needed, consideration should be given to raising the monthly and/or day pass rate.
TABLE 41: SoCo Transit Fare Peer Comparison
General Public
Senior, Disabled, Medicare
Youth or Student
General Day Pass
Multi-Ride Pass (Fare per Ride)
General Public
Senior, Disabled, Medicare
Youth or Student
Free Transfers?
ADA Paratransit
Fare
SoCo Transit $1.50 $0.75 - $3.00 $1.20 $37.00 $18.50 - No $2.50
Lompoc Transit (COLT) $1.25 $0.60 - - $1.13 $40.00 $15.00 $30.00 No $4.00
Petaluma Transit $1.50 $0.75 $1.00 - - $30.00 $15.00 $20.00 Yes $3.00
Delano Area Rapid Transit (DART) $2.25 $1.25 - $6.00 $1.50 - - - Yes $1.75
City of Lodi $1.25 $0.60 - - $1.25 $44.00 $22.00 - Yes $2.00
City of Porterville $1.50 $0.75 - $3.00 - $40.00 $20.00 $25.00 No $2.50
City of Turlock Transit $1.50 $0.75 $1.50 $3.50 - $50.00 $25.00 $40.00 Yes $2.50
Peer Average $1.54 0.78 $1.25 $4.17 $1.29 $40.80 $19.40 $28.75 - $2.63
Source: Transit System Websites, Accessed May, 2019.
One-Way Fare Monthly Pass

San Luis Obispo South County Transit LSC Transportation Consultants, Inc. Short-Range Transit Plan Page 93
Chapter 7 Demographic Analysis
DEMOGRAPHIC AND TRANSIT STANDARDS ANALYSIS Public transportation is an important service in the southern region of San Luis Obispo County. Transit services provide mobility to residents, including access to important educational, medical, recreational, social and economic services. In addition to being important to residential quality of life, public transit services assist in supporting educational programs, public and private employers and social service programs throughout the region. Transit Dependent Populations A review of current population and demographic characteristics by census tract is discussed below and shown in Table 42. Data from the 2013-2017 American Community Survey is provided for each of the population subsets that are considered to be “transit dependent.” In other words, these groups tend to rely more frequently on public transportation for their mobility needs based on age, income status or lack of private vehicles available to them. Understanding the population trends, as well as where these transit-dependent populations are located, transit can help service providers better define transit needs and determine if the transit program is serving these groups. Population and demographics characteristics are represented by fixed route and dial-a-ride service areas. Demographic data mapping for the dial-a-ride services can be found in the 2016 San Luis Obispo Regional Transportation Authority Short-Range Transit Plan. Youth (5 to 17 years old) For the purposes of this study, the youth population is defined as persons who are between 5 and 17 years of age. The study area as a whole has a total youth population of 14 percent. The highest youth concentrations, as shown in Figure 20, are located within the eastern portions of Grover Beach (17.8 percent, Oceano (16.3 percent), and the downtown area of Arroyo Grande (14.6 percent). Both census tract areas of Nipomo have high rates of youth populations as well, at 15 percent and 17.7 percent. Senior (65 and Over) Another important group to consider for transit services is the senior population, defined as persons age 65 and older. The total senior population within the study area is 11,097, which is 21.4 percent of the total population. The highest concentrations of senior persons are shown in Figure 21. These larger senior populations are located within the eastern areas of Pismo Beach (33.3 percent), the southeast areas of Arroyo Grande (29 percent) and Avila Beach (29 percent). Nipomo has slightly lower senior population at 14.8 percent and 15 percent.

LSC Transportation Consultants, Inc. San Luis Obispo South County Transit Page 94 Short-Range Transit Plan
TABL
E 42
: Pop
ulat
ion
Dem
ogra
phic
s for
Sou
th S
an Lu
is O
bisp
o Co
unty
Cens
us
Trac
tDe
scrip
tion
Tota
l Po
pula
tion
#
% o
f Ce
nsus
Tr
act
#
% o
f Ce
nsus
Tr
act
#
% o
f Ce
nsus
Tr
act
#
% o
f Ce
nsus
Tr
act
#%
of
Hous
ehol
ds
116
Avila
Bea
ch3,
898
538
13.8
%11
3129
.0%
166
4.3%
492
12.6
%2,
229
90.
4%11
7.01
Pism
o Be
ach
- Eas
t 4,
301
299
7.0%
1432
33.3
%28
36.
6%71
116
.5%
2,92
619
86.
8%11
7.04
Pism
o Be
ach
- Wes
t 3,
718
302
8.1%
920
24.7
%39
710
.7%
346
9.3%
2,66
964
2.4%
118
Arro
yo G
rand
e - V
illag
e7,
372
1078
14.6
%19
5526
.5%
385
5.2%
946
12.8
%3,
167
762.
4%11
9.01
Arro
yo G
rand
e - S
outh
east
3,16
441
413
.1%
919
29.0
%24
57.
7%43
013
.6%
1,45
318
1.2%
119.
02Ar
royo
Gra
nde
- Sou
thw
est
8,66
312
5814
.5%
1538
17.8
%49
55.
7%80
19.
2%3,
730
228
6.1%
120
Grov
er B
each
- Ea
st7,
883
1402
17.8
%99
312
.6%
1220
15.5
%11
3214
.4%
3,13
611
43.
6%12
1.02
Grov
er B
each
- W
est
5,64
179
714
.1%
882
15.6
%64
611
.5%
915
16.2
%2,
610
196
7.5%
122
Oce
ano
7,23
811
8016
.3%
1327
18.3
%14
2919
.7%
1191
16.5
%3,
054
551.
8%51
,878
7,26
814
.0%
11,0
9721
.4%
5,26
610
.2%
6,96
413
.4%
24,9
7495
83.
8%
101.
01Pa
so R
oble
s - W
est
1,91
322
211
.6%
371
19.4
%25
213
.2%
158
8.3%
846
101.
2%10
1.02
Paso
Rob
les
- Cen
tral
7,12
211
1515
.7%
638
9.0%
1270
17.8
%48
46.
8%2,
967
135
4.6%
102.
01Pa
so R
oble
s - N
orth
6,92
713
6419
.7%
1300
18.8
%33
74.
9%69
110
.0%
2,95
437
1.3%
102.
02Pa
so R
oble
s - S
outh
east
5,49
411
1920
.4%
955
17.4
%53
59.
7%49
89.
1%2,
131
105
4.9%
102.
04Pa
so R
oble
s - S
outh
6,50
411
4917
.7%
911
14.0
%90
613
.9%
713
11.0
%2,
413
197
8.2%
102.
05Pa
so R
oble
s - W
est
4,48
676
117
.0%
545
12.1
%53
411
.9%
479
10.7
%1,
585
110.
7%10
3Sh
ando
n &
Whi
tley
Gard
ens
8,97
412
8314
.3%
1786
19.9
%83
69.
3%99
911
.1%
4,11
573
1.8%
124.
01Ni
pom
o - E
ast
6,14
592
215
.0%
907
14.8
%53
08.
6%65
410
.6%
2,15
846
2.1%
124.
02Ni
pom
o - W
est
9,97
217
6417
.7%
1497
15.0
%11
1111
.1%
792
7.9%
3,56
664
1.8%
127.
04Te
mpl
eton
9,43
415
5316
.5%
2309
24.5
%54
95.
8%11
6712
.4%
3,65
110
32.
8%66
,971
11,2
5216
.8%
11,2
1916
.8%
6,86
010
.2%
6,63
59.
9%26
,386
781
3.0%
118,
849
18,5
2015
.6%
22,3
1618
.8%
12,1
2610
.2%
13,5
9911
.4%
51,3
601,
739
3.4%
Dial
-a-R
ide
Serv
ice
Area
Sub
tota
l
SoCo
Tra
nsit
Dem
ogra
phic
Tot
al
Zero
Veh
icle
Ho
useh
olds
Tota
l Ho
useh
olds
Sour
ce: U
S Ce
nsus
Am
erica
n Co
mm
unity
Sur
vey
2013
- 20
17 E
stim
ates
.
Yout
h (A
ges 5
-17
)Se
nior
(Age
s 65
& o
lder
)Lo
w In
com
eDi
sabl
ed
Fixe
d Ro
ute
Serv
ice
Area
Sub
tota
l
Fixe
d Ro
ute
Serv
ice
Area
s
Dial
-a-R
ide
Serv
ice
Area

San Luis Obispo South County Transit LSC Transportation Consultants, Inc. Short-Range Transit Plan Page 95

LSC Transportation Consultants, Inc. San Luis Obispo South County Transit Page 96 Short-Range Transit Plan

San Luis Obispo South County Transit LSC Transportation Consultants, Inc. Short-Range Transit Plan Page 97
Low Income Low income persons are defined by poverty status reported to the US Census, which are persons who have been living below or at the poverty line over the previous 12 months. The data indicates that approximately 10.2 percent of the population served by SoCo Transit and Dial-a-Ride is considered low income. The areas with the highest concentrations include Oceano (19.7 percent) and eastern Pismo Beach (16.5 percent). The western area of Nipomo has a low income population of 11.1 percent. This information is presented in Figure 22. Disabled Approximately 13,599 persons, or 11.4 percent, of the population within the study area have a disability that limits a person’s mobility and potential to use public transportation. As shown in Figure 23, areas that include the highest populations of disabled persons include Oceano (16.5 percent) and eastern Pismo Beach (16.5 percent). Zero Vehicle Households Households that do not have a vehicle available for use typically are more reliant on public transportation as there are no other options available besides getting a ride with a friend or family member. As shown in Table 42, roughly 3.8 percent of households within the fixed route service area do not have a vehicle available. The highest concentrations of zero vehicle households are within the areas of western Grover Beach (7.5 percent) and eastern Pismo Beach (6.8 percent) as shown in Figure 24.

LSC Transportation Consultants, Inc. San Luis Obispo South County Transit Page 98 Short-Range Transit Plan

San Luis Obispo South County Transit LSC Transportation Consultants, Inc. Short-Range Transit Plan Page 99

LSC Transportation Consultants, Inc. San Luis Obispo South County Transit Page 100 Short-Range Transit Plan

San Luis Obispo South County Transit LSC Transportation Consultants, Inc. Short-Range Transit Plan Page 101
Chapter 8 Stakeholder Input
PROCESS Key persons regarding the management and oversight of the South County Transit and dial-a-ride programs were identified and interviewed to define their opinions. Although the specific persons interviewed are not identified (to encourage a broader discussion), they include representatives of the SoCo Transit Board and the local jurisdictions funding the Dial-a-Ride programs. A summary of the input received is presented below. Existing Strengths of the Transit Program
• Buses are clean. • Service is reliable. • RTA management does a good job of addressing passenger issues in a punctual manner.
• Changes to Route 27 and 28 have been a big improvement. Providing service to
Walmart has benefited ridership. • Transfers at Pismo Beach Outlets works very well. • Very few constituent complaints regarding either SoCo Transit or the Dial-a-Ride
services. • The SoCo Transit program is improving the lives of local residents who are big fans of
the program. Existing Areas for Improvement
• Better service between Nipomo and Santa Maria, particularly for medical trips. • Drivers need to be assured that workplace issues such as seniority will be adequately
addressed in any future changes. • Homeless persons loitering on the buses are a concern. • There is not a great, urgent need for expansion in SoCo Transit services. SoCo Transit
should continue to serve the limited needs of the community, but should not expand in an attempt to generate more ridership that is not there.

LSC Transportation Consultants, Inc. San Luis Obispo South County Transit Page 102 Short-Range Transit Plan
Opinion About Merging SoCo Transit into the RTA
• Seems to be a good idea as it reduces bureaucracy. • It is needed to address the SoCo Transit farebox ratio issue. • Much support for the idea. It would improve the overall efficiency of transit services.
The possibility of “losing local control” is not an issue. • Need to address employee concerns regarding changes in work rules and seniority.
Retirement costs need to be considered. • Merger would allow improvements to be more easily implemented, such as flexible
services for seniors. • Staff supports a merger as it would reduce overall costs.
Changes in the Service Area Over the Next Decade that Will Impact Transit
• Aging of the population will increase need for service. • Growth in population—Paso Robles is expected to increase from today’s 31,000
population to a buildout figure of 44,000. • New developments serving seniors, particularly in southeast Paso Robles and in the
Nipomo area (such as Trilogy).
Recommended Strategies and Changes for Transit Services
• Improve medical transportation between Five Cities, Nipomo and Santa Maria. • Although there has been discussion about fixed route service in Nipomo, it probably
does not make sense. • Given the low ridership on the Shandon and Templeton services, they should be
eliminated. • Some RTA Route 10 runs should serve more stops in the Nipomo area (“local” service). • Some RTA Route 9 runs could serve additional stops in Templeton east of US 101. • The Avila-Pismo Trolley could be better integrated into the RTA program. A regular bus
could be used rather than a trolley replica.

San Luis Obispo South County Transit LSC Transportation Consultants, Inc. Short-Range Transit Plan Page 103
Other Comments
• The fact that few complaints are received regarding the services is a good thing! Stakeholder Nipomo DAR.
• Paso Robles is considering a downtown/special event shuttle service. • Los Osos would be better served with a direct route into San Luis Obispo rather than
through Morro Bay.

LSC Transportation Consultants, Inc. San Luis Obispo South County Transit Page 104 Short-Range Transit Plan
This page intentionally left blank.

San Luis Obispo South County Transit LSC Transportation Consultants, Inc. Short-Range Transit Plan Page 105
Chapter 9 Passenger Surveys
SURVEY METHODOLOGY AND RESULTS Onboard passenger surveys were conducted in the beginning of March 2019 on all of SoCo Transit’s fixed routes and Dial-a-Ride services. During selected surveying days, the passenger surveys were handed out and collected by trained LSC staff. The survey instruments consisted of a one-page questionnaire in English on one side and Spanish on the reverse side, all printed on card stock. The surveys included a simple introduction with 23 questions and were distributed on all SoCo Transit fixed routes (21, 24, 27, and 28) and Dial-A-Ride services. An analysis of these surveys by service type is described below. Fixed Route Survey Results A total of 133 people participated in the survey (22 in Spanish and 111 in English). Not all respondents answered all questions, but some provided multiple answers (when the survey allowed). Of the surveys completed, 47 percent of the surveys were completed on Route 21, followed by 26 percent on Route 24, 16 percent on Route 28 and 11 percent on Route 27. Each question below notes the number of individual and multiple responses collected during the survey process. Question 1. What Time did you board this bus? (121 individual responses): The highest rate of response was between 11:30 AM and noon, followed by the morning (between 7:30 AM and 8:00 AM). Of those surveyed, 18 percent did not specify the exact time they boarded the bus, however 13% of those surveyed indicated it was sometime in the AM hours. Questions 2, 5-11, and 13. (107 to 128 responses): The following highlights summarize the data presented in Table 43.
• Most surveyed passengers walked to and from the bus (78 percent and 70 percent respectively). This reflects the importance of sidewalks and other pedestrian facilities in accessing bus stops.
• Overall, 20 percent of passengers got to the bus that they were surveyed on by
transferring, and 23 percent planned on transferring to another bus. This reflects the interdependent nature of the route structure and the need for convenient transfer opportunities. As shown in Table 44, the proportion transferring is particularly high among Route 27 and Route 21 passengers.

LSC Transportation Consultants, Inc. San Luis Obispo South County Transit Page 106 Short-Range Transit Plan
• A majority of passengers have traveled round trip by bus (69 percent). • When asked what the main purpose of their trip was, 60 percent of passengers said they
were on their way to or from work, followed by shopping (16 percent). • Of those surveyed, 66 percent ride SoCo Transit four or more times per week. • If SoCo Transit was not available, 43 percent said they would walk followed by 28
percent who said they would get a ride with someone else.
TABLE 43: Responses to Survey Questions 2, 5-11, and 13
Questions # % Questions # %
Q2. How did you get to the bus? Q9.
Walked 99 78% Taxi 2 2%Transferred from another Route 25 20% Walk 52 43%Drove alone 1 1% Bike 9 8%Wheelchair 0 0% Wouldn’t make trip 14 12%Other 2 2% Uber/Lyft 7 6%
Ride with someone 34 28%Drive my car 0 0%Other (Please Specify 2 2%
Walk 90 70%Bicycle 4 3% Q10. How long have you been using the bus?Picked Up 4 3% First Time 6 5%Transfer to another route 30 23% 6 Months to a Year 17 14%Drive Alone 0 0% Under 6 Months 14 11%Wheelchair 0 0% More than a year 88 70%Other (Please Specify) 0 0%
Q11. Do you use Transit Tracker?Q6. Are you travelling round trip by bus today? Yes 31 28%
Yes 85 69% No 80 72%No 38 31%
Q13. What is your age?Q7. What is the main purpose of your trip? 6 to 11 1 1%
Work 64 60% 12 to 18 5 4%School/College 10 9% 19 to 25 19 15%Shopping 17 16% 25 to 44 44 36%Recreation/Social/Visiting 8 7% 45 to 64 44 36%Medical/Dental/Social Services 8 7% 65 and older 10 8%Personal Business/Other 0 0%
Q8. How often do you ride the bus?4 or more times/Week 84 66%1 to 3 times/Week 22 17%1 to 3 times/Month 14 11%Less than 1 time/Month 8 6%
Source: SoCo Transit Onboard Passenger Surveys, March 2019.
How will you get to your destination after you get off this bus?
Survey Responses Survey Responses
How would you make this trip if SoCo Transit was not available?
Q5.

San Luis Obispo South County Transit LSC Transportation Consultants, Inc. Short-Range Transit Plan Page 107
• 70 percent of those surveyed said that they have been riding SoCo Transit for more than
a year. Only 5 percent mentioned they have been riding the bus for the first time. • When asked whether passengers use the Transit Tracker phone app, 72 percent said no. • The majority (72 percent) of those surveyed were between the ages 25 and 64.
Questions 3 and 4. Where did you get on and off this bus? (127 individual responses): The most frequently recorded on and off boardings were the following:
• Ramona Garden • Pismo Beach Outlets • Walmart • 7th and Grand Avenue
Question 12. What is your home zip code? (103 individual responses): Nearly 39 percent of those surveyed live in Grover Beach, followed by 20 percent living within Arroyo Grande and 13 percent living in Oceano. Questions 14 and 15. Please indicate your opinion of the SoCo Transit bus service and Overall Service: Passengers were asked to rate the transit system on a scale of 1 (poor) to 4 (excellent) on various service characteristics, as well as for the service as a whole. As shown in Figure 25, overall SoCo Transit passengers have an excellent (62 percent) or good (26 percent) opinion of the service, with only 12 percent indicating their opinion is fair or poor. The highest “excellent” ranking characteristics included driver courtesy (79 percent), transfer convenience (68 percent) and bus cleanliness (65 percent). The poorest perceptions are regarding safety (onboard vehicles and at stops) with 23 percent indicating poor or fair, followed by crowding on the buses (18 percent poor or fair).
TABLE 44: Transfers on SoCo Routes
# % # % # %
21 13 21.0% 12 19.4% 25 40.3%
24 6 17.1% 6 17.1% 12 34.3%
27 1 6.7% 7 46.7% 8 53.3%
28 3 14.3% 4 19.0% 7 33.3%
Total 23 17.3% 29 21.8% 52 39.1%
Transferred From Another Route
Transfer To Another Route
Transfer Both Directions
Source: Onboard surveys conducted April, 2019 on SoCo routes. Did not include surveys on RTA Route 10.

LSC Transportation Consultants, Inc. San Luis Obispo South County Transit Page 108 Short-Range Transit Plan
To assess how the relatively low opinions relate to the individual routes, a cross-tabulation was conducted as shown in Table 45. A poor or fair opinion of crowding on the buses is particularly common on Route 24 (63 percent) followed by Route 27 (27 percent). Much of the poor or fair perceptions regarding safety are also found on Route 24 (43 percent of respondents) with little or no such responses on other routes. Finally, poor or fair perceptions of on-time performance were slightly higher on Route 27 and slightly lower on Route 24. Questions 16 – 22. (97 to 114 individual responses): The following highlights summarize the data presented in Table 46:
• Over half of those surveyed said they get information about SoCo Transit through the
printed bus schedule, while only 8 percent indicated they get information through the website.
• Twenty-two percent of those surveyed had some sort of disability that limits their ability
to drive. • When asked whether passengers had a driver’s license, 44 percent said yes, while 56
percent said no. • A large majority of passengers (85 percent) do not have a car available to them. • There were 10 percent more male than female survey participants.

San Luis Obispo South County Transit LSC Transportation Consultants, Inc. Short-Range Transit Plan Page 109
TABLE 45: SoCo Transit Characteristics
Characteristics Poor Fair Good ExcellentService Overall 2.5% 9.2% 26.1% 62.2% 3.5
Driver Courtesy & Competency 0.0% 4.3% 16.5% 79.1% 3.7On-time performance (Reliability) 1.7% 3.5% 26.1% 68.7% 3.6Frequency of Service 4.5% 9.9% 21.6% 64.0% 3.5Trip Duration 4.5% 6.3% 27.0% 62.2% 3.5Cost of Bus Fares 4.5% 12.5% 29.5% 53.6% 3.3Bus Cleanliness 0.9% 6.3% 27.7% 65.2% 3.6Crowding Onboard Buses 4.6% 13.9% 18.5% 63.0% 3.4Safety (onboard vehicles & at stops) 2.2% 21.3% 16.9% 59.6% 3.3Convenience of transfers 4.6% 11.0% 16.5% 67.9% 3.5Walking distance to/from stops 3.6% 10.8% 25.2% 60.4% 3.4
Source: SoCo Transit Onboard Passenger Surveys, March 2019.
Ranking Overall Score
TABLE 46: Responses to Survey Questions 16 - 22
Questions # % Questions # %
Q16. Q20.Bus Schedule 64 56% Male 53 55%Friend/Co-Worker 7 6% Female 44 45%Driver of bus 18 16%Telephone 11 10% Q21.Website 9 8% Full-time Employed 54 47%Other (Please Specify) 5 4% Homemaker 2 2%
Retired 8 7%Q17. Unable to work 8 7%
Yes 25 22% Part-time Employed 19 17%No 89 78% Student 6 5%
Not Employed 17 15%Q18.
Yes 50 44% Q22.No 63 56% Less than $23,000 64 60%
$23,000 to $34,000 24 22%Q19. $34,000 to $57,000 10 9%
Yes 17 15% Greater than $57,000 9 8%No 97 85%
Source: SoCo Transit Onboard Passenger Surveys, March 2019.
Did you have a car available for this trip?
What is your family's annual income?
Are you Male or Female?
What is your main occupation?
Survey Responses Survey Responses
How do you get information about SoCo Transit?
Do you have a disability that limits driving?
Do you have a drivers license?
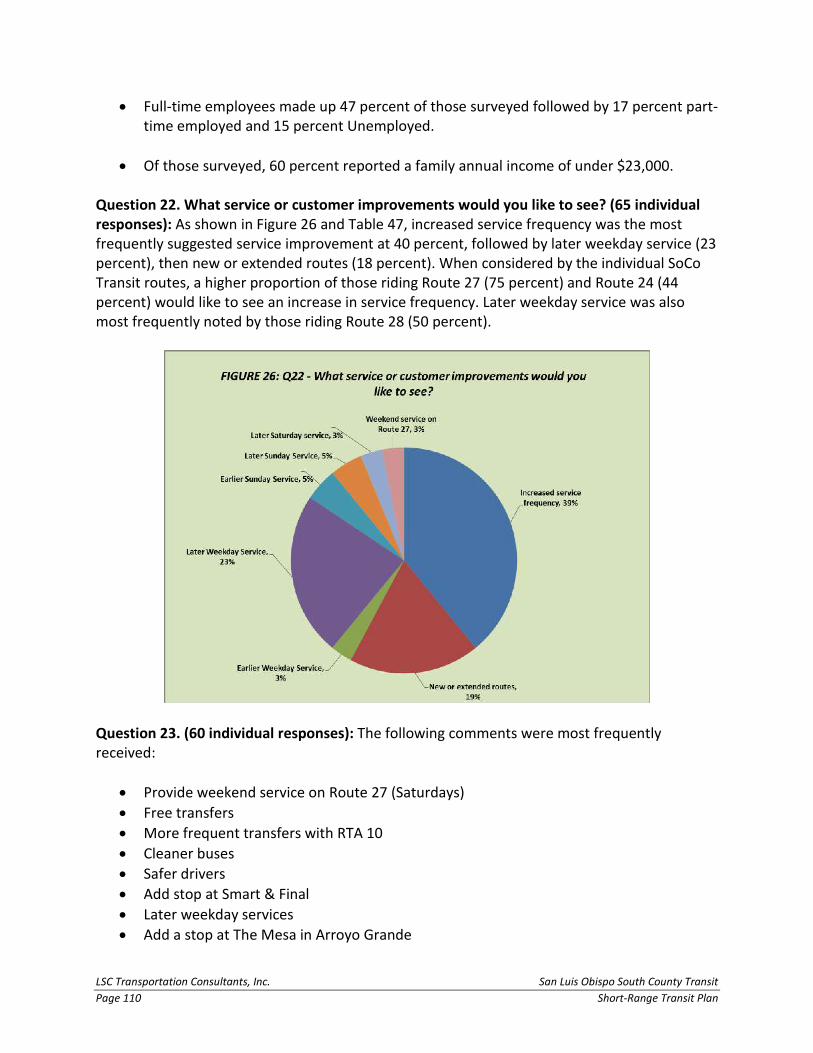
LSC Transportation Consultants, Inc. San Luis Obispo South County Transit Page 110 Short-Range Transit Plan
• Full-time employees made up 47 percent of those surveyed followed by 17 percent part-time employed and 15 percent Unemployed.
• Of those surveyed, 60 percent reported a family annual income of under $23,000.
Question 22. What service or customer improvements would you like to see? (65 individual responses): As shown in Figure 26 and Table 47, increased service frequency was the most frequently suggested service improvement at 40 percent, followed by later weekday service (23 percent), then new or extended routes (18 percent). When considered by the individual SoCo Transit routes, a higher proportion of those riding Route 27 (75 percent) and Route 24 (44 percent) would like to see an increase in service frequency. Later weekday service was also most frequently noted by those riding Route 28 (50 percent).
Question 23. (60 individual responses): The following comments were most frequently received:
• Provide weekend service on Route 27 (Saturdays) • Free transfers • More frequent transfers with RTA 10 • Cleaner buses • Safer drivers • Add stop at Smart & Final • Later weekday services • Add a stop at The Mesa in Arroyo Grande

San Luis Obispo South County Transit LSC Transportation Consultants, Inc. Short-Range Transit Plan Page 111
Dial-a-Ride Survey Results A total of 39 Dial-a-Ride surveys were completed on both the Nipomo and Paso Robles Dial-a-Ride services in March and April, 2019. Not all passengers completed every question, so the number of responses per question is listed as appropriate. Nipomo Dial-a-Ride Service (34 Responses)
• Sixty-two percent of those surveyed made their ride reservations between four and
seven days in advance, followed by one day in advance (23 percent). • Forty-eight percent of passengers were using the service to get to and from school,
followed by shopping and medical/dental (15 percent).
• Only 5 of the 22 passengers said they had a car available to make the trip. Moreover, 30 percent said they would not make the trip if service were not available.
• Forty-five percent said they use the service 2 to 4 times per week.
• Fifty-two percent were under the age of 12, followed by 28 percent who were ages 75 and older.
• Passengers were asked to rank services on a scale of 1 (poor) to 5 (excellent), and the
majority rated most factors “5”, as indicated in Figure 27. Of the characteristics described, travel time and driver courtesy were ranked the excellent by 78 percent and 79 percent of those surveyed respectively. Reservation procedures and telephone information was ranked poorly by 5 percent of those who participated in the survey.
TABLE 47: Service Improvements by Route
Service Improvements 21 24 27 28Increased service frequency 44.4% 30.0% 75.0% 20.0%New or extended routes 22.2% 20.0% 0.0% 20.0%Earlier Weekday Service 3.7% 5.0% 0.0% 0.0%Later Weekday Service 18.5% 25.0% 0.0% 50.0%Earlier Sunday Service 3.7% 5.0% 12.5% 0.0%Later Sunday Service 7.4% 0.0% 0.0% 10.0%Later Saturday service 0.0% 10.0% 0.0% 0.0%Weekend service on Route 27 0.0% 5.0% 12.5% 0.0%
Source: SoCo Transit Onboard Passenger Surveys, March 2019.
Route

LSC Transportation Consultants, Inc. San Luis Obispo South County Transit Page 112 Short-Range Transit Plan
• Significantly, all of the passengers completing surveys thought the service was very good
or excellent.
• Passengers were asked to list specific improvements they would like to see. Several of the comments were compliments relating to considerate, helpful and friendly drivers, but suggestions included: − Provide Saturday half-day or part-time services (access to local events) − Make it easier to book subscription rides.
Paso Robles Dial-a-Ride Service (5 Responses)
• Three out of five surveys indicated that they called to reserve their rides two days in
advance. • Three out of five surveys indicated that the main purpose of their trip was work. • Two out of five passengers indicated that they use Dial-a-Ride daily. • Three out of five indicated that they were between the ages of 25 and 59. • Three out of five indicated that they would like extended service hours.

San Luis Obispo South County Transit LSC Transportation Consultants, Inc. Short-Range Transit Plan Page 113
Chapter 10 SoCo Transit and Avila-Pismo Trolley Service Alternatives
This chapter presents a detailed analysis of potential service alternatives for the SoCo Transit program as well as for the Avila-Pismo Trolley. (Service alternatives for the Dial-A-Ride programs are presented in the following chapter.) These alternatives have been identified through public input, the consultant’s review of existing services, a review of previous documents, as well as staff input. Note that this document presents a wide range of alternatives, not all of which will be part of the SRTP. Based on the results of these evaluations as well as further discussions, the specific SRTP will be developed. Operating costs are estimated based on the following cost model equation, developed from the adopted FY 2019/20 budget: Marginal Operating Costs = $50.65 X Marginal Vehicle-Hours of Service + $1.51 X Marginal Vehicle-Miles of Service SoCo Transit Route Alternatives Revise Routes 21 and 24 to Better Service Grover Beach Amtrak Station and New Convention Center The Grover Beach Amtrak station is currently undergoing a $3.1 million expansion of parking and bus loading areas. This will allow the existing connecting bus service stop to be moved from the east side of the tracks to the west side and immediately adjacent to the rail platform. The Grover Beach Lodge is also planned for a site on the north side of the westernmost end of Grand Avenue. It is currently envisioned as a 150-room hotel with 4,000 square feet of meeting space with a potential future phase of adding full convention center facilities. The nearest existing stops are along Grand Avenue. Route 21 serves a stop at 2nd Street westbound (approximately a 400-foot walk from the train station) while Route 24 serves an eastbound stop at 3rd Street (approximately a 700-foot walk). These are roughly a two-to-three-minute walk from the train station. These stops serve an average of 6.5 and 7.7 passengers per weekday (total of boardings and alightings). Extending the routes to the train station would add 0.3 miles to the length of each route. Both routes would also have to pass through the Grand/SR 1 signal one additional time each hour. The overall impact would be to add approximately two minutes to the running time on each route. This could add to current challenges in providing adequate driver breaks. The additional annual mileage would increase costs by an estimated $4,800 per year, as shown in Table 48. Southbound Amtrak service is currently limited to southbound Surfliner rail service at 7:15 AM and 4:35 PM, and southbound Thruway bus service at 4: 25 AM, 9:45 AM and 1:35 PM.

LSC Transportation Consultants, Inc. San Luis Obispo South County Transit Page 114 Short-Range Transit Plan
Northbound service consists of Surfliner rail stops at 2:01 PM and 7:55 PM and Thruway bus service at 8:45 AM, 4:55 PM and 11:55 PM. Note that the latest rail and bus arrival times are after the end of SoCo services. There are also southbound buses on the Visalia-Santa Maria route at 1:45 PM and 10:35 PM (after the end of SoCo service), as well as northbound departures at 6:10 AM and 2:25 PM (associated with the San Joaquin rail service) and Capital Corridor Thruway buses southbound at 4:25 AM (prior to SoCo service), 1:55 PM and 7:30 PM (after SoCo service) and with northbound stops at 8:00 AM, 9:55 AM, 12:20 PM and 11:55 PM (after SoCo service). Excluding those services operating outside of the SoCo span of service, Amtrak serves the station seven times per day in the southbound direction and seven times per day in the northbound direction. Overall, 7 of the 13 daily SoCo Route 21 and 24 runs would provide a useful connection, with connection times ranging from a few minutes to 55 minutes.
TABLE 48: SoCo Transit Fixed Route Alternatives AnalysisAnnual
Hours Miles Wkdy Sat Sun Wkdy Sat Sun Hours Miles Cost
Revise Routes 21 and 24 to Better Serve Grover Beach Amtrak Station Route 21 0 0.3 13 12 11 259 51 55 0 1,375 $2,400 Route 24 0 0.3 13 12 11 259 51 55 0 1,375 $2,400 Total 0 2,750 $4,800 700 $400 $4,400
Shift Transfer Point From Ramona Garden to Grover Beach Train Station Route 21 0 0.3 13 12 11 259 51 55 0 1,375 $2,400 Route 24 0 0.3 13 12 11 259 51 55 0 1,375 $2,400 Route 27 0 1 13 0 0 259 51 55 0 3,367 $5,900 Route 28 0 1.1 13 12 11 259 51 55 0 5,042 $8,800 Total 0 11,160 $19,500 -2,100 -$1,300 $20,800
Revisions to Route 27 to Better Serve RTA Route 10 Route 27 0 0.9 13 0 0 259 51 55 0 3,030 $5,300 1,900 $1,500 $3,800
Reroute Routes 27 and 28 to Better Service Neighborhood North of Ramona Garden Route 27 0 -0.2 13 0 0 259 51 55 0 -673 -$1,200 4,600 $3,700 -$4,900
Eliminate Route 27 Service to Oceano Airport Stop and Serve Valley Road Instead Route 27 0 0.7 13 0 0 259 51 55 0 2,357 $4,100 2,200 $1,800 $2,300
Saturday Route 27 Service Route 27 1 10.7 0 12 0 0 51 0 612 6,548 $42,400 3,400 $2,700 $39,700
Sunday Route 27 Service Route 27 1 10.7 0 11 0 0 51 0 561 6,003 $38,900 3,300 $2,600 $36,300
Evening Weekday Service Until 9:30 PM – Routes 21 and 28 Route 21 1 14.9 2.1 0 0 259 0 0 544 8,104 $41,600 3,800 $2,400 Route 28 1 10.4 1.45 0 0 259 0 0 376 3,906 $25,800 2,600 $2,200 Additional Runabout Svc. 1 17.2 0.5 0 0 259 0 0 130 2,221 $10,400 50 $150 Total 1,049 14,231 $77,800 6,450 $4,750 $73,050
Evening Weekday Service Until 9:30 PM – Routes 21, 24 and 28 Route 21 1 14.9 2 0 0 259 0 0 518 7,718 $39,700 2,500 $1,600 Route 24 1 11.3 2 0 0 259 0 0 518 5,853 $36,400 2,500 $1,400 Route 28 1 10.4 1.45 0 0 259 0 0 376 3,906 $25,800 2,600 $2,200 Additional Runabout Svc. 1 17.2 0.5 0 0 259 0 0 130 2,221 $10,400 50 $150 Total 1,541 19,698 $112,300 7,650 $5,350 $106,950
Eliminate 6:30 PM and 7:30 PM Weekday Runs on Route 27 Route 27 1 10.7 -2 0 0 259 0 0 -518 -5,543 -$35,900 -4,500 -$4,500 -$31,400
Serve Lopez High School 2.5 26.9 1 0 0 185 0 0 463 4,977 $32,100 3,700 $3,100 $29,000
Extend Avila Trolley Service to First Weekend in November Avila Trolley 1 22.4 8 8 8 1 6 6 104 2,329 $9,300 1,500 $0 $9,300
Grand Avenue Trolley 1 Trolley Option 0.33 7.0 15 15 15 102 51 51 1,010 21,420 $88,400 2 Trolleys Option 0.33 7.0 29 29 29 102 51 51 1,952 41,412 $170,900
Run Parameters Daily Runs Days per Year AnnualRidership
Fare Revenues
Operating Subsidy

San Luis Obispo South County Transit LSC Transportation Consultants, Inc. Short-Range Transit Plan Page 115
Amtrak ridership figures indicate that the Grover Beach station serves a total of 19,758 passenger-trips in 2018 (up five percent from 2017), or an average of 54 per day. This reflects rail passengers only, excluding Thruway buses (for which ridership by stop data is not available). Given the overall cost and time commitment of an intercity rail or bus/rail trip, saving the two to three minutes of walk time from the nearest SoCo stop would not significantly increase public transit ridership. However, direct service would be a convenience to intercity passengers and would tend to promote the rail service. A modest ridership increase of two passenger-trips per day is estimated. Shift the Transfer Point from Ramona Garden to Grover Beach Train Station Another option to improve transit access to the Grover Beach Train Station and the nearby existing and planned uses along the western end of Grand Avenue would be to relocate the Ramona Garden transit hub to the train station and reconfigure the routes and schedules of the four SoCo fixed routes to serve this new hub. This would require a minor change in Routes 21 and 24 to extend from Highway 1/Grand Avenue south to the station but would require a greater extension of Routes 27 and 28. One route option for these routes would be to use Highway 1 between Pershing Drive and Grand Avenue rather than 13th Street. This would provide a substantial running time reduction (on the order of five minutes). However, the ridership potential along this stretch of the state highway is low. In addition, traffic volumes on this section of Highway 1 are 8,000 to 10,000 vehicles per day—too high to serve bus stops while blocking travel lanes. Barring the costly construction of bus pullouts, it would not be possible to serve and stops along this segment. Another option would be to use Farroll Avenue and 4th Street rather than 13th Street between Farroll/13th and Grand Avenue. This would extend Route 27 from 10.7 to 11.7 miles, while Route 28 would extend from 10.4 to 11.5 miles. Running time on both routes would be increased by roughly three minutes, both which can be served within an hour schedule. Routes 21 and 24 would also be extended by 0.3 miles (which can also be accommodated in the existing schedule). The additional mileage would total 11,160 annually, increasing costs by $19,500. This option would eliminate service to the following existing stops:
• 13th/Long Branch Southbound (Route 28)—3.4 passengers per day • 13th/Trouville Northbound (Route 27) —4.6 passengers per day • 13th/Mentone Southbound (Route 28) —4.4 passengers per day
In addition, the existing northbound Route 27 stop on 13th just north of Farroll would need to be relocated nearby on the remaining route. The 13th/Long Branch stop is within walking distance of the stops along Grand Avenue west of 13th Street. As a result, this option would eliminate convenient service to a total of 9 passenger boardings or alightings per day. Service would be provided to a new area west of 9th Street and south of Seabright Avenue, which includes homes and light industrial uses. The discontinued Route 23 used to travel along this route (in one direction only), serving a stop at Farroll Road/8th Street, which served 6 passengers per day. Considering that this alternative would serve this area in both directions,

LSC Transportation Consultants, Inc. San Luis Obispo South County Transit Page 116 Short-Range Transit Plan
the ridership generated by the new service area would roughly offset the loss in ridership at existing stops, resulting in no significant change in total ridership. This would have the result of shifting Route 21 service at the transfer hub approximately 4 minutes later and Route 24 service approximately 4 minutes earlier. Both of these routes are timed to provide direct transfers to/from RTA Route 10 at Pismo Beach Outlets at the top of the hour. While Route 21 cannot be shifted earlier without resulting in insufficient overlap with Route 10 service times, Route 24 could be shifted 4 minutes later (departing the Pismo Beach Outlets at 14 after and arriving at 59 after). This would result in service at a Grover Beach Train Station hub at 29 minutes after on Route 24 and 33 minutes after the hour on Route 21. Routes 27 and 28 would be shifted to arrive at the train station transit hub at 20 minutes after the hour and departing at 35 minutes after the hour, which would still provide direct transfers to both Routes 21 and 24 (though at different times), as well as 15 minutes of layover/driver break time per hour. This option would also require that the improved train station have adequate capacity for the four SoCo buses at peak times, as well as the 8-times-a-day Amtrak Thruway buses. The Ramona Garden hub currently provide five saw-tooth bays over a length of 300 feet, which allows full independent operation of the four routes (the presence of buses in any of the bays does not preclude buses entering or existing any of the individual bays). The improved train station bus loading area will provide approximately 200 feet of straight curb. This is sufficient to provide for independent operation of the Amtrak Thruway bus and two SoCo buses, but not the peak of four SoCo buses. Conversion to allow for four SoCo buses would require a substantial redesign, eliminating much of the expanded auto parking spaces and/or expansion of parking or transit bays to the south. Another consideration is that the transit hub, with service by all four SoCo routes, provides a relatively high level of transit access. As such, it is beneficial to be convenient to a high level of transit trip generators. Approximately 800 residences are within a five-minute walk of Ramona Gardens, as well as the commercial businesses along Grand Avenue between 7th Street and 12th Street and the seasonal Exploration Station. In comparison, a five-minute walk from the bus loading area at the train station (constrained by the presence of the tracks to the east and Highway 1 to the west) includes the Grand Junction and Beach Place multiuse areas along the south side of Grand Avenue west of 4th Street, low density commercial uses on the north side of Grand Avenue, a few residences behind the commercial uses and the planned hotel site. Shifting the hub would therefore make the transit service less convenient to passengers overall, resulting in a net loss of 2,100 passenger-trips per year. In summary, it would be operationally feasible to shift the transit hub from Ramona Garden to the Grover Beach train station. However, it would require a substantial capital investment in reconfiguring the bus and parking area at the train station (beyond the cost incurrent in removing the bus bays from Ramona Park), and would not provide any overall benefit to transit ridership.

San Luis Obispo South County Transit LSC Transportation Consultants, Inc. Short-Range Transit Plan Page 117
Revisions to Route 27 and 28 to Better Serve RTA Route 10 While SoCo Routes 21 and 24 provide convenient direct transfers to RTA Route 10 at Pismo Beach Outlets, direct transfers to the regional route are not currently available on Routes 27 and 28. As a result, residents of Oceano and the southern portion of Grover Beach face relatively long travel times to travel to San Luis Obispo and Santa Maria. Route 27 does not serve the Halcyon PnR. The route gets close, coming southbound on El Camino Real to Halcyon Road but then makes a left turn to the 101 southbound onramp. This is necessary because the lack of a traffic signal at the El Camino Real/Grand Avenue intersection makes a left-turn onto Grand Avenue infeasible at peak times. Several options were explored to provide a Route 27 stop within a reasonable walk distance of the Halcyon PnR bus stop:
• A bus stop could be created at the beginning of the US 101 southbound on-ramp, similar to stops along US 101 interchanges in Marin County. However, Caltrans has determined this not to be feasible.
• A bus stop could be created on southbound El Camino Real north of Halcyon Road, which could be served prior to the left turn onto US 101. However, this would require a pullout (stopping in the travel lane would be infeasible), and the right-of way is constrained by the presence to the west of a cemetery and a line of mature trees.
• A stop could be created on southbound El Camino Real opposite the existing Halcyon
PnR stop. The route would extend south on El Camino Real to this stop and then turn right onto Faeh Avenue followed by a right onto eastbound Halcyon Road to the interchange. This would require elimination of the 10 parking spaces on the west side of El Camino Real. It would also require reconfiguration of the El Camino Real/Faeh/Bell intersection to provide a bus travel path that does not encroach onto the traffic lanes in the opposite directions, which in turn would require an additional right-of-way.
• The southbound bus could turn right on Halcyon Road and then left onto Faeh Avenue
followed by a second left from Faeh Avenue to northbound El Camino Real to serve the existing stop and shelter. This rerouting is shown in Figure 28. The Faeh Avenue/El Camino Real intersection is complicated by the presence of Bell Street as a fourth leg of the intersection. The bus driver would need to start the turn and pull roughly perpendicular to El Camino Real, which could momentarily block movements on Bell Street. Traffic activity in this intersection is generally low enough to make this maneuver but practice runs at peak times would be needed to define whether it could be made reliably and safely. This option would add 0.3 miles and about two minutes to the route running time during peak periods. While this additional running time could probably be accommodated within the existing schedule, the additional mileage would increase operating costs by $1,800 per year.

LSC Transportation Consultants, Inc. San Luis Obispo South County Transit Page 118 Short-Range Transit Plan

San Luis Obispo South County Transit LSC Transportation Consultants, Inc. Short-Range Transit Plan Page 119
• The route could continue to make the left turn at N. Halcyon Road onto 101 southbound and exiting at E. Grand Avenue, and then double back to the Park and Ride by making right turns onto E. Grand Avenue and El Camino Real, serve the Park and Ride and then make the right turn back onto 101 southbound, before continuing the existing route with a left turn onto E. Grand Avenue. This option would add 0.9 miles to the length of Route 27, which would increase annual operating costs by $5,300.
On balance, the latter of these options is preferable. However, the additional running time would negatively impact the on-time performance of the route. Serving Halcyon with Route 27 would change transit travel options in the following ways:
• Trips from Oceano (and Southern Grover Beach) to the North—Assuming current schedules, Route 27 would serve a Halcyon stop at 46 minutes past the hour. This would be convenient for travel to the north as the northbound Route 10 bus serves the stop at 49 minutes past the hour. However, the key trip origin areas in Grover Beach would not be provided a shorter trip as this would only substitute a trip on Route 27 with a transfer to northbound Route 10 at Halcyon for a trip on Route 21 or 24 with a transfer to northbound Route 10 at Pismo Beach Outlets. The current trip from Oceano to destinations on Route 10 to the north (such as San Luis Obispo) currently requires either 104 minutes (via Route 28 and a single transfer at Halcyon) or 87 minutes (via Route 27, a transfer to 21 or 24 at Ramona Garden and a second transfer at Pismo Beach Outlets). It would be possible to shift the Route 27 schedule by 3 minutes to provide a direct transfer to the northbound bus, which would also shorten trips from the south to destinations in Oceano and Grover Beach. This would still result in an overall travel time of 88 minutes but provide this relatively short travel time with the need for only one transfer from Route 27 to Route 10 at Halcyon. This would be perceived as a modest improvement in service to the rider.
• Trips to Oceano (and Southern Grover Beach) from the North—The fastest transit travel time from San Luis Obispo, consisting of a southbound Route 10 leg, a transfer to Route 21 at the AM PM on Grand Avenue just west of US 101, and a second transfer to Route 28 at Ramona Garden for an overall travel time of 73 minutes. With a transfer opportunity at Halcyon to Route 27, passengers would be faced with a long layover (from 5 after to 46 after) before boarding Route 27 with an overall travel time of 87 minutes. Passengers making this trip therefore would not benefit.
• Trips from Oceano (and Southern Grover Beach) to the South—A trip from Oceano to
Santa Maria via Route 28, a transfer at Halcyon and a second leg on Route 10 takes 58 minutes to complete. As serving Halcyon with Route 27 would not provide shorter travel times, passengers making this trip would not benefit.
• Trips to Oceano (and Southern Grover Beach) from the South—This trip currently
requires 91 minutes, including a 12 minute layover at Halcyon between Route 10 and

LSC Transportation Consultants, Inc. San Luis Obispo South County Transit Page 120 Short-Range Transit Plan
Route 28. Shifting the Route 27 schedule by three minutes and serving Halcyon to provide a direct transfer from the northbound bus would shorten trips from the south to destinations in Oceano and Grover Beach to only 49 minutes—fully 42 minutes shorter.
In summary, service quality would improve modestly for passengers headed from the Oceano area to the north and would improve significantly for passengers headed to Oceano from the south. The potential ridership market that would benefit from these improvements in service quality can be analyzed using the onboard surveys conducted as part of the San Luis Obispo Regional Transit Authority Short-Range Transit Plan, which was prepared in 2016. Of the 336 surveys completed on Route 10, 23 were from passengers reporting they transferred to or from a SoCo route. Of these, 17 were to or from Routes 21 or 24, while six were to/from Route 23 (the predecessor of today’s Routes 27 and 28). Factoring for the average weekday ridership, this indicates a current estimate of 42 daily passenger-trips to/from Routes 21/24 and 15 to/from Routes 27/28. In other words, Route 10 passengers transferring to/from Routes 27/28 are roughly 35 percent of the number transferring to/from Routes 27/28. A review of the population served by the two pairs of routes indicates that approximately 40 percent of the ridership potential in the overall fixed-route service area is only served by Routes 27/28. If transfer opportunities were equal, this indicates that transfers to/from Routes 27/28 should be 66 percent (40 divided by 60) of Routes 21/24 transfers. This “missing” proportion translates to roughly 13 passenger-trips per day. Even with a Route 27 stop at Halcyon, the convenience of the transfer would not be equal to the timed bus-to-bus connections available at Pismo Beach Outlets for Routes 21/24. Shifting Routes 27 and 28 schedules 3-4 minutes forward would provide direct transfers between Route 27 and the northbound Route 10 as well as between Route 28 and the southbound Route 10. However, this shift is not feasible as it would impact the coordination with bell times at Arroyo Grande High School. The overall benefit of these improved Route 10 transfer opportunities is therefore estimated to be limited to six passengers per weekday, or a total of 1,900 over the course of a year, due to the reduction in the need for transfers between the Routes 27/28 service area and destinations along RTA Route 10. Reroute Routes 27 and 28 to Better Serve the Neighborhood North of Ramona Garden The current routes have both the 21/24 pair and the 27/28 pair serving the Grand Avenue corridor between Ramona Garden and Oak Park Boulevard. There is a substantial residential area to the north of this area that is not within a convenient (five-minute or quarter-mile) walk of a bus stop. One option would be to shift Routes 27 and 28 to serve this area, as shown in Figure 28. Departing Ramona Gardens, Route 27 would turn right on 9th Street and head north, turning right on Atlantic City Avenue, right on 16th Street, left on Saratoga Avenue and left on Oak Park
San Luis Obispo South County Transit LSC Transportation Consultants, Inc. Short-Range Transit Plan Page 121
Boulevard (at the 4-Way Stop)3. Route 28 would leave the current route by turning right (west) from Oak Park Boulevard to Atlantic City Avenue, then left (south) on 9th Street, and lefts on Brighton Avenue, 10th Street and Ramona Avenue to enter the transit center. New stops would be established (in both directions) near the Atlantic City/9th and Atlantic City/12th intersections as well as at Saratoga/Oak Park (Route 27) and Atlantic City/Oak Park (Route 28). Route 27 would be 0.2 miles shorter than at present, while the length of Route 28 would not change. This would result in a modest ($1,200) reduction in annual operating costs. These new stops would provide service within a five-minute walk of an area roughly bounded by Newport Avenue on the south, 6th Street on the west, Ocean View Avenue/Ritchie Road on the north and 14th Street on the east. While much of this area is single family homes, north of Atlantic City Avenue there are several multifamily complexes, including Vista Pacific Apartments. This realignment would eliminate Route 27 service to the stops at Grand/16th and Oak Park/Grand that serve a total of 10.2 passenger boardings and alightings per day, thereby shifting the 1.5 passengers using the Oak Park/Newport stop one block north to Saratoga. Route 28 service would be eliminated to the Oak Park/Ramona, Oak Park/Long Branch and Grand/16th stops (serving an average of 24.8 boardings and alightings per day) and the Oak Park/Newport stop (with 2.3 passengers per day) shifted to Saratoga. As all of the stops eliminated from Route 27/28 service would still be within a short walking distance of stops served by Route 21/24, some service would still be available (though a transfer might be required for specific trips). In total, 35.0 existing Route 27/28 daily passenger-trips would be impacted, of which approximately 25 per day would shift to other stops and 10 would choose to stop using the service. Over the course of the year, this would equal a loss of 3,200 passenger-trips. An analysis of the potential new service area indicates that an additional 540 dwelling units would be served. Considering the overall transit ridership per household in the SoCo fixed-route service area and the relatively high proportion of low-income and zero-vehicle households in the new service area, this shift in service would generate 7,800 new annual passenger-trips. The net impact of this route realignment would be an increase of 4,600 passenger-trips. Between the reduction in cost and a $3,700 increase in fare revenues, this option would reduce overall subsidy by $4,900 per year. Reduce/Eliminate Route 21 Service along Mattie Road North of the Mattie Road interchange in the Shell Beach area, Route 21 serves three stops on the east side of US 101 along Mattie Road (at Foothill, Pismo Beach City Hall) and four stops on the south side along Shell Beach Road. The stops on the north side along Mattie Road only serve a total of 1.2 passengers (total of boardings plus alightings) per day. As such, shifting the service to US 101 northbound was considered. Using US 101 instead would not significantly
3 The left turn from Atlantic City Avenue to Oak Park Boulevard would not be consistently feasible for a transit bus.
LSC Transportation Consultants, Inc. San Luis Obispo South County Transit Page 122 Short-Range Transit Plan
change the route length, and would only save approximately one minute of travel time, which is not sufficient to be of use somewhere else along the route. While ridership along Mattie Road is low, it is important to provide transit service to a city hall. Therefore, this option is not considered further. Eliminate Route 27 Service to Oceano Airport Stop and Instead Serve Valley Road Serving the Oceano Airport stop requires seven minutes of running time each hour on Routes 27 and 28. This stop serves on average only 6.6 passengers on Route 27 and 15.0 on Route 28. If Route 27 were to no longer serve this stop, some travel times for individual trips would get longer, resulting in roughly half the passengers shifting to the remaining Route 28 and the other half eliminating their use of the transit service. Over the course of a year, this would equal to a loss of approximately 800 passenger-trips. Near the other end of Route 27, the southeastern portion of Arroyo Grande along Valley Road is presently not served by SoCo. The existing Route 27 westbound on Fair Oaks Avenue could turn south on Valley Road and travel approximately one mile to make a right on Leanna Drive and travel around a loop with Pearl Drive before returning north to Fair Oaks Avenue. This area includes the Sunrise Terrace Mobile Home Park, with approximately 300 units4, as well as approximately 145 single family homes and 18 multifamily units (all within the Arroyo Grande city limits). If service were eliminated to Oceano Airport (and the route to serve the 13th & Highway 1 stop modified to travel south on 15th Street and west on Paso Robles Street, rather than on Belridge Street and Highway One) and the service along Valley Road added, the net impact would be to extend the route length from the existing 10.7 miles to 11.4 miles. The resulting route, however, could still be operated within an hour schedule with adequate driver break and layover time. Annual operating costs would be increased by $4,100 per year. The new service area is shown in Figure 27. Ridership per household would be relatively high, considering the demographics of the area. On the other hand, the fact that service (other than to Arroyo Grande High School) would be in one direction only would tend to reduce the ridership potential. Overall, this new service area would generate approximately 3,000 passenger-trips per year. The net impact of this shift in Route 27, therefore, would be an increase of 2,200 passenger-trips. SoCo Transit Span of Service Alternatives Saturday Route 27 Service Route 27 currently does not operate on Saturdays or Sundays. This limits service on the Route 27/28 loop to counterclockwise service only. As a result, some trips require long in-vehicle
4 Only 40 of these mobile homes are within a five-minute walk of Valley Road. An alternative turnaround for this route could potentially be provided in the entrance loop within the mobile home park, with approval by the landowner.

San Luis Obispo South County Transit LSC Transportation Consultants, Inc. Short-Range Transit Plan Page 123
travel times. As an example, a trip from Walmart to the Elm/Fair Oaks stop requires 48 minutes on the bus. In effect, service only in one direction means that any round-trip on the Route 27/28 loop requires a total of an hour on the bus. For some passengers also served by Routes 21/24 (central Grover Beach, downtown Arroyo Grande and along West Branch), long out-of-direction trips can be avoided by using Routes 21 or 24 instead. Operating this route on Saturdays would increase annual operating costs by $42,400 per year. The potential ridership can be estimated by considering the relative productivity (passengers per vehicle-hour) on weekdays vs. Saturday for the SoCo routes, recognizing that some of the existing Saturday ridership on Route 28 consists of riders that would shift to Route 27 if available and that the Arroyo Grande High School does not generate ridership on a Saturday. This indicates that the net impact on ridership would be an increase of 3,400 annual passenger-trips. Subsidy would be increased by $39,700 per year. Sunday Route 27 Service Adding Sunday service on Route 27 would have a slightly lower cost of $38,900 per year, reflecting one less hour per day of service. Ridership would also be slightly lower, based on ridership patterns on the other routes, at 3,300 passenger-trips per year. This would yield an annual subsidy requirement of $36,300. Evening Weekday Service – Routes 21 and 28 SoCo weekday services end at 7:29 PM on Routes 21 and 24, 8:13 PM on Route 27 and one minute later on Route 28. The last time that passengers can transfer to outbound Routes 21 and 24 at Ramona Garden occurs at 6:30 PM and to outbound Routes 27 and 28 at 7:30 PM. The last opportunity to transfer from RTA Route 10 to a SoCo bus at Pismo Beach Outlets occurs at 7:00 PM. Provision of service later into the evening has been a common passenger requests over the years. In particular, the 7:33 PM and 8:33 PM southbound Route 10 departures from San Luis Obispo arrive in Pismo Beach at 8:00 PM and 9:00 PM, when no connecting SoCo service is available. The final northbound Route 10 bus (arriving in Pismo Beach at 8:00 PM) also has no connecting service available. These runs current generate a total of 7 deboardings per day (based on the ridership counts conducted as part of the 2016 RTA SRTP) and could generate more if local service was available. Based on ridership patterns in similar communities, a reasonable option would be to provide service until roughly 9:30 PM, operating both route pairs only in one direction (the busier of the routes). Specifically, slightly more than two additional runs would be operated on Route 21 (until 9:35 PM, ending at Dolliver/Pomeroy) and roughly 1.5 additional runs would be operated on Route 28 (until 9:41 PM at the Oceano Airport). This would provide service to all the communities after the 9:00 PM transfer from Route 10. This additional fixed-route service would increase annual operating costs by $67,400 per year. While additional dispatcher costs would not be necessary (RTA dispatchers could serve this role

LSC Transportation Consultants, Inc. San Luis Obispo South County Transit Page 124 Short-Range Transit Plan
in the extended hours), the additional hours of fixed-route service would increase the potential demand for Runabout ADA service. As Runabout services current end around 9:00 PM, an additional 0.5 hours of Runabout service per day is included in the cost estimates, bringing the total cost of this option to $77,800 per year. Ridership can be evaluated based upon the ridership-per-hour data for similar local transit services in other communities as well as the Route 10 ridership by run data. A total of 3,800 additional passenger-trips would be served on Route 21 (including some passengers that currently do not use the service earlier in the day as they cannot get home) and 2,600 on Route 28, for a total of 6,400 fixed-route passenger-trips per year. Including 50 additional Runabout passengers (based on current ridership in the evening hours), total ridership would increase by 6,450 annually. Subtracting the additional fare revenue, subsidy requirements would be increased by $73,050. Evening Weekday Service – Routes 21, 24 and 28 A disadvantage of operating Route 21 but not 24 in the evening would be the long travel times for specific trips (such as from Pismo Beach Outlets to downtown Pismo Beach) as well as the fact that service is not provided to downtown Arroyo Grande. A more extensive weekday evening option would be to also operate Route 24. As Route 24 could serve the final stops in Pismo Beach, both Routes 21 and 24 would end at 9:29 at Ramona Garden, while Route 28 would still end at 9:41 PM at the Oceano Airport. Including the additional Runabout ADA service, this option would increase annual operating costs by $123,300 per year. Ridership would total 7,650 additional passenger-trips per year, yielding $5,350 in additional fare revenues. The net impact on annual operating subsidy would be an increase of $106,950. Eliminate 6:30 PM and 7:30 PM Weekday Runs on Route 27 Route 27 is funded through a 5-year Low Carbon Transit Operations Program (LCTOP) grant, which is set to expire in 2022. As funding may then require additional local funds, it is worth considering means of reducing the costs of this service. A review of the ridership served by the last three daily runs of Route 27 indicates relatively low patronage as follows:
5:30 PM Run—4.6 passengers 6:30 PM Run—3.7 passengers
These two runs incur an annual operating cost of $35,900. Eliminating these runs would require passengers to shift to other routes (largely Route 28), increasing travel times for some. Considering the reduction in service quality and that some passengers would choose to stop making trips earlier in the day due to the longer return trip, this option is estimated to reduce ridership by 4,500 passenger-trips per year. With the loss in fare revenues, overall operating subsidy would be reduced by $31,400 per year.

San Luis Obispo South County Transit LSC Transportation Consultants, Inc. Short-Range Transit Plan Page 125
Serve Halcyon Park-and-Ride on Route 27 and Route 28 Tripper Runs The Route 27 (afternoon) and Route 28 (morning) tripper runs timed to serve Arroyo Grande High School bell times operate between Ramona Garden and the High School only. While these runs are useful for residents of Oceano and central Grover Beach, students living further from the school (such as Pismo Beach) have long travel times. One option would be to extend these runs to also serve the Halcyon Park-and-Ride, allowing a transfer to or from RTA Route 10. A review of potential schedules indicates that this strategy would not significantly reduce travel times. In the morning, a Halcyon stop would need to be added prior to the existing start time at Ramona Garden at 7:07 AM (most days), which means a Halcyon departure at 6:55 AM – before the 7:06 AM southbound arrival of Route 10. While a better connection could be provided in the afternoon (3:45 Route 27 tripper arrival at Halcyon, for a 3:49 NB Route 10 transfer and then another transfer at the Pismo Beach Outlets to 21 and 24, this still doesn’t provide a quicker trip home along 21 or 24 than just transferring at Ramona Garden at 3:33 PM. Another option could be to deviate from the existing 27/28 route to serve Halcyon just prior to the High School in the morning and immediately after the High School in the afternoon. However, this would add about 7 minutes travel time to all existing riders, and would still result in long layovers at Halcyon to/from Route 10 runs, so no travel time would be saved. As no benefit would be provided, this option is not considered further. Serve Lopez Continuation High School The Lopez Continuation High School, located at 1055 Mesa View Drive, is a 2.9 mile one-way drive from the nearest existing SoCo Transit stop (at Highway 1 and Elm Street). Adding a stop at the High School would add approximately 10 minutes to the running time on Route 27 or 28. Given available time and the need to maintain an hourly schedule, simply adding service to the High School is infeasible. Another option that could potentially be operated would be to extend the service period for the Route 28 School Tripper after the drop-off time at ACHS at 7:30 AM to provide an arrival at Lopez High School at 9:00 AM, and to start afternoon Route 27 School Tripper service at Lopez High School at 2:00 PM to operate a run prior to the 3:05 PM service time at ACHS. This would add approximately 2.5 hours of tripper service and 27miles of service per day. Over the course of the school year, this would increase SoCo Transit operating costs by $32,100. Given the attendance levels for various programs at Lopez High School, a reasonable estimate of ridership would be 20 passenger-trips per day or 3,700 over the course of the year. Subtracting $3,100 in additional fare revenue, this option would increase subsidy needs by approximately $29,000 per year. Avila-Pismo Trolley The Avila-Pismo Trolley is generally performing well, with 12.9 passenger-trips per vehicle-hour, and is providing an important public transit service to Avila Beach and the western portion of Pismo Beach. The service currently operates on Fridays, Saturdays and Sundays from early April through late September (as well as Memorial Day, 4th of July and Labor Day) with longer hours

LSC Transportation Consultants, Inc. San Luis Obispo South County Transit Page 126 Short-Range Transit Plan
during the peak summer months of June, July and August. A review of the existing calendar of service was conducted by comparing the days of service with traffic count data collected by San Luis Obispo County on Avila Beach Road, which provides an indicator of tourism activity. This comparison, as shown in Figure 29, indicates that the existing service is aligned with much of the busier periods, but that there are days both prior to and after the existing Trolley season with high traffic counts. The weekend immediately prior to the current beginning of the service is relatively busy, and weekends stay busy after the current end of service through the first weekend in November (though this can be dependent on the weather)5. The productivity of the Trolley is relatively strong (exceeding the yearly average) in the fall after Labor Day, also indicating that a longer season could be beneficial. As the Farmers Market ends at the end of September, service through the first weekend of November would be operated on Saturday and Sunday only. A reasonable option would be to start service one weekend earlier (last weekend in March), and extend service by five additional weekends until the first weekend in November. These additional 13 days of service would increase costs by $9,300 per year but would generate approximately 1,500 additional riders (a 20 percent increase over the year). This ridership, however, could vary year-to-year depending on the weather.
5 Valentine’s Day weekend is also busy, but this is too far from the existing schedule of service and is thus not considered in this analysis.

San Luis Obispo South County Transit LSC Transportation Consultants, Inc. Short-Range Transit Plan Page 127
Grand Avenue Trolley The Cities of Grover Beach and Arroyo Grande are striving to encourage economic activity along the Grand Avenue corridor that stretches from the Village area of Arroyo Grande west to the Pacific. The planned hotel/convention center at the west end of this corridor, in particular, is expected to generate more potential for visitor activity and travel along the corridor. A rubber-tired trolley service along this corridor could be part of this overall strategy. At seven miles of route length per round-trip, one vehicle could provide service roughly every 40 minutes, or two vehicles could provide service on a more convenient 20-minute frequency. In assessing this option, the following should be considered:
• The corridor is already well served by public transit with Route 21/24 providing hour service along the corridor in both directions and Route 27/28 providing additional transit options between downtown Arroyo Grande and the central Grover Beach area. There is therefore not a strong public transit role left for a trolley service to fill. This trolley, like many similar trolley services, is more of an economic development tool. It would provide enhanced mobility along this specific corridor but is not necessary to provide mobility throughout the South County service area.
• Visitors drawn by a new hotel/convention center will largely generate the need for transportation services based on specific event schedules. This “market” is best served by private shuttle companies, at least at the outset. If a steady pattern of visitor travel demand emerges, then the possibility of a schedule ongoing trolley service would be increased.
• Some visitor-oriented transit services operate free to the rider (“free-fare”) as
evidenced by the Avila-Pismo Beach Trolley. The Grand Avenue corridor, however, is also served by the existing fare SoCo fixed-routes6. If a trolley service were operated free-fare, it can be expected that a substantial amount of existing SoCo ridership would shift over to the free option (particularly from Routes 21 and 24). This would reduce fare revenue, as well as raise issues of equity as passengers in some neighborhoods served by SoCo would be provided with free transit while other would not. Establishing a fare consistent with SoCo fixed-route fares and then providing free day passes for guests staying along the corridor could address this issue while still encouraging visitor use of the trolley service.
A reasonable operating plan would be to provide trolley service from 11 AM to 9 PM, Thursdays through Sundays. If operated year-round with one trolley (service every 40 minutes), the service would incur an operating cost of $88,400 per year. With 20-minute service (two trolleys), costs would be $170,900 per year. Similar to the Avila-Pismo Trolley, SoCo Transit should be open to the possibility of obtaining, operating and marketing a Grand Avenue Trolley
6 While the Avila-Pismo Trolley overlaps with some of the Route 21 and 24 stops, this overlap is a relatively small portion of the SoCo routes.

LSC Transportation Consultants, Inc. San Luis Obispo South County Transit Page 128 Short-Range Transit Plan
service. However, local funding should be provided by the two jurisdictions (or economic interests) outside of the existing SoCo Transit arrangement, given that the service is in addition to the regional public transit network. As development occurs along the corridor, the resulting travel patterns should be reviewed to identify when a trolley program may be feasible and the specific hours and days of service that are warranted. Based upon the productivity of similar rubber-tired trolley services and the characteristics of the corridor, a reasonable range of productivity is 7 to 10 passenger-trips per vehicle-hour of service. This figure and the resulting ridership will greatly depend on the span of service, the fare structure and the future development (and visitor-trip generation) along the corridor.
COMPARISON OF SOCO TRANSIT FIXED-ROUTE ALTERNATIVES The ridership impacts of the fixed-route service alternatives, presented in Table 49 and Figure 30, range from an increase of 7,650 (for evening weekday service on Route 21, 24 and 28) to a loss of 4,500 resulting from the elimination of Route 27 early evening runs. Other alternatives with relatively high ridership potential are the evening service on Route 21 and 28 (6,450) and the rerouting to serve the neighborhood north of Ramona Garden (4,600). The operating subsidy impacts vary widely, as shown in Figure 31. The most costly options would be evening weekday service on Routes 21, 24 and 28 ($106,950) followed by weekday evening service on Routes 21 and 28 only ($73,050 per year). Other alternatives would have a relatively modest impact on subsidy needs. Eliminating the last two weekday Route 27 runs would reduce subsidy (by $31,400 per year), while rerouting Route 27 and 28 north of Ramona Garden would have a small ($4,900 per year) reduction. Fixed-Route Alternatives Performance Analysis An analysis of the performance of the service alternatives is presented in the right side of Table 49. This considers the following key transit service performance measures. Passenger-Trips per Vehicle-Hour The marginal passenger-trips per vehicle-hour is a key measure of the productivity of a transit service. Note that several of the alternatives do not result in a change in vehicle-hours, making this measure inapplicable. These values are charted in Figure 32. The existing SoCo performance standard is to generate a minimum of 17 passenger-trips per vehicle-hour. As shown, none of the alternatives that increase vehicle-hours would attain this standard. The best of the alternatives by this measure is extending the Avila-Pismo Trolley season, at 14.4. The other alternatives that would increase vehicle-hours (evening service and Saturday service) range between 5.0 and 8.0 passenger-trips per vehicle-hours.

San Luis Obispo South County Transit LSC Transportation Consultants, Inc. Short-Range Transit Plan Page 129
TABL
E 49
: SoC
o Tr
ansi
t Fix
ed R
oute
Ser
vice
Alte
rnat
ives
Per
form
ance
Ana
lysi
s
Net A
nnua
l Ri
ders
hip
Net A
nnua
l Ve
hicl
e-Ho
urs
Net A
nnua
l Re
venu
e
Net A
nnua
l O
pera
ting
Subs
idy
Psgr
-Trip
s pe
r Se
rvic
e-Ho
ur
Mar
gina
l Su
bsid
y pe
r Ps
gr-T
rip
Mar
gina
l Fa
rebo
x Re
turn
Ra
tio
17.0
No S
tand
ard
20%
700
0$4
00$4
,400
--$6
.29
9%
-2,1
000
-$1,
300
$20,
800
---$
9.90
-6%
1,90
00
$1,5
00$3
,800
--$2
.00
39%
4,60
00
$3,7
00-$
4,90
0--
-$1.
07-7
6%
2,20
00
$1,8
00$2
,300
--$1
.05
78%
3,40
061
2$2
,700
$39,
700
5.6
$11.
687%
3,30
056
1$2
,600
$36,
300
5.9
$11.
007%
6,45
01,
049
$4,7
50$7
3,05
06.
1$1
1.33
7%
7,65
01,
541
$5,3
50$1
06,9
505.
0$1
3.98
5%
-4,5
00-5
18-$
4,50
0-$
31,4
008.
7$6
.98
14%
3,70
046
3$3
,100
$29,
000
8.0
$7.8
411
%
1,50
010
4$0
$9,3
0014
.4$6
.20
0%
Chan
ge F
rom
Exi
stin
g Se
rvic
ePe
rfor
man
ce M
easu
res
Revi
sion
s to
Rou
te 2
7 to
Bet
ter S
erve
RTA
Rou
te 1
0
Exis
ting
Fixe
d Ro
ute
Perfo
rman
ce S
tand
ards
Alte
rnat
ive
Atta
inin
g St
anda
rd S
hade
d
Revi
se R
oute
s 21
and
24
to B
ette
r Ser
ve G
rove
r Be
ach
Amtra
k St
atio
n
Shift
Tra
nsfe
r Poi
nt F
rom
Ram
ona
Gard
en to
Gro
ver
Beac
h Tr
ain
Stat
ion
Rero
ute
Rout
es 2
7 an
d 28
to B
ette
r Ser
vice
Ne
ighb
orho
od N
orth
of R
amon
a Ga
rden
Elim
inat
e Ro
ute
27 S
ervi
ce to
Oce
ano
Airp
ort S
top
and
Serv
e Va
lley
Road
Inst
ead
Even
ing
Wee
kday
Ser
vice
Unt
il 9:
30 P
M –
Rou
tes
21
and
28
Satu
rday
Rou
te 2
7 Se
rvic
e
Sund
ay R
oute
27
Serv
ice
Exte
nd A
vila
Tro
lley
Serv
ice
to F
irst W
eeke
nd in
No
vem
ber
Even
ing
Wee
kday
Ser
vice
Unt
il 9:
30 P
M –
Rou
tes
21,
24 a
nd 2
8
Elim
inat
e 6:
30 P
M a
nd 7
:30
PM W
eekd
ay R
uns
on
Rout
e 27
Serv
e Lo
pez H
igh
Scho
ol
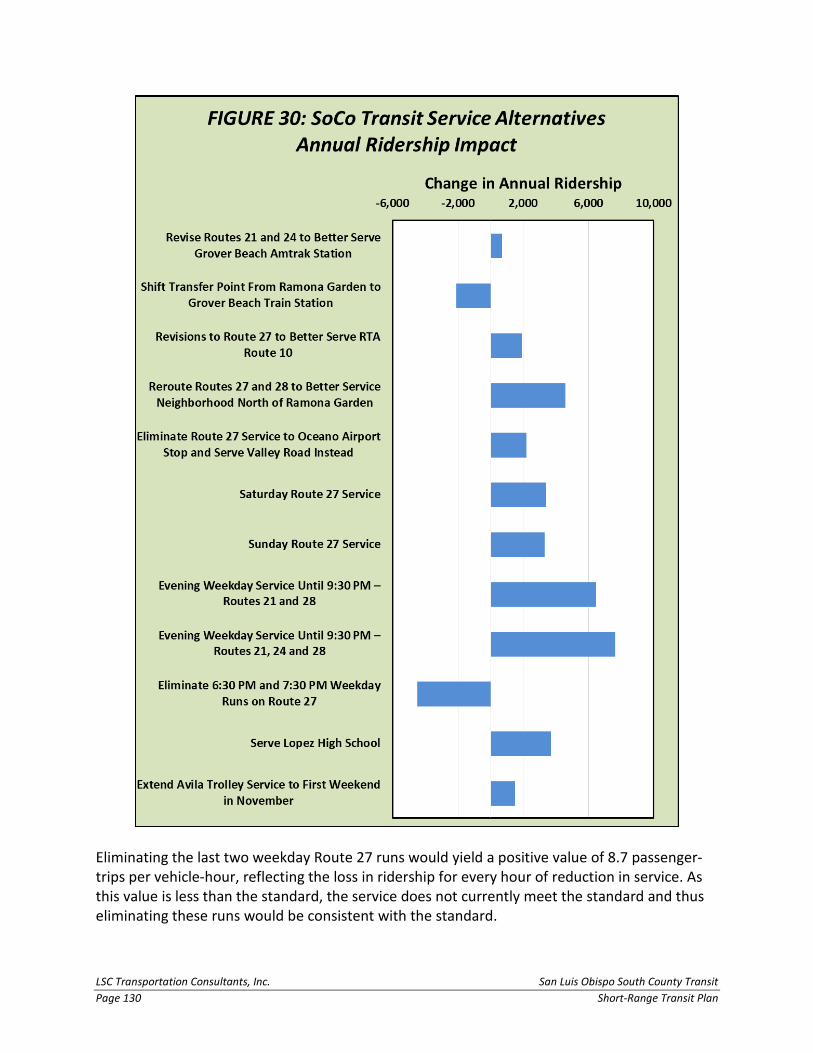
LSC Transportation Consultants, Inc. San Luis Obispo South County Transit Page 130 Short-Range Transit Plan
Eliminating the last two weekday Route 27 runs would yield a positive value of 8.7 passenger-trips per vehicle-hour, reflecting the loss in ridership for every hour of reduction in service. As this value is less than the standard, the service does not currently meet the standard and thus eliminating these runs would be consistent with the standard.

San Luis Obispo South County Transit LSC Transportation Consultants, Inc. Short-Range Transit Plan Page 131
Marginal Subsidy per Passenger-Trip This measure directly relates the key public input (tax funding) to the key desired output (ridership). Note that there is no standard established for this measure. As shown in Figure 33, by this measure the “best” alternative is rerouting Routes 27 and 28 to the neighborhood north of Ramona Garden; the negative figure of -$1.07 reflects a reduction in subsidy divided by an increase in passenger-trips.

LSC Transportation Consultants, Inc. San Luis Obispo South County Transit Page 132 Short-Range Transit Plan

San Luis Obispo South County Transit LSC Transportation Consultants, Inc. Short-Range Transit Plan Page 133

LSC Transportation Consultants, Inc. San Luis Obispo South County Transit Page 134 Short-Range Transit Plan
The majority of these values reflect an increase in subsidy divided by an increase in ridership, in which case a lower value indicates a “better” alternative in that fewer dollars are needed to expand the ridership. Of these, the best performing alternative is the shift in Route 27 service from Oceano Airport to Valley Road, which requires $1.05 in additional subsidy per passenger-trip. This is followed by revising Route 27 to serve the Halcyon Park-and-Ride, which increases subsidy by $2.00 for every new passenger-trip. Other options expanding service and ridership require between $6.20 per passenger-trip (expanding the Avila-Pismo Trolley season) to $13.98 (evening weekday service with three routes). In the other direction, eliminating the final two weekday runs on Route 27 yields a positive $6.98 as a result of a reduction in subsidy divided by a reduction in ridership. At the other extreme, the negative figure for the shift in the transfer point from Ramona Garden to the Grover Beach Train Station reflects an increase in subsidy needs over a reduction in ridership. Marginal Farebox Return Ratio Consideration of the change in fare revenue divided by the change in operating costs yields a wide range of results:
• The small increase in fare revenues generated by better Route 27 connections to Route
10 ($1,500) divided by the increase in operating costs ($5,300) yields a 39 percent farebox return ratio.
• Shifting Route 27 service from the Oceano Airport to Valley Road yields a 78 percent
farebox return ratio, far exceeding the standard of 20 percent. • The revision of Routes 27 and 28 to serve the neighborhood north of Ramona Garden
yields a value of -76 percent, which is a positive outcome as it reflects an increase in fare revenue divided by a reduction in operating cost.
• The elimination of the last two weekday runs on Route 27 yields a value of 14 percent,
indicating that this alternative is consistent with the adopted standard in that the existing service to be eliminated does not meet the standard.
• The negative value for shifting the transfer point to the Grover Beach Train Station
reflects a reduction in fare revenue divided by an increase in operating costs. • The other alternatives that increase both fare revenues and operating costs yield values
ranging from 5 percent to 11 percent—all less than the 20 percent standard.
San Luis Obispo South County Transit LSC Transportation Consultants, Inc. Short-Range Transit Plan Page 135
Fixed-Route Alternatives Conclusions The review above provides useful information for making decisions regarding the individual alternatives. It is also important to consider that there are many other factors (in particular, the ability to provide a dependable and safe transit service) beyond these financial and performance measures. There also is a benefit in providing a consistent service that is easy to communicate and understand. Nonetheless, the following are key overall findings that result from this evaluation:
• Revising Routes 27 and 28 to serve the neighborhood north of Ramona Garden would be an overall benefit.
• Shifting Route 27 service from the Oceano Airport to instead serve the Valley Road corridor would also provide a net overall benefit.
• Rerouting Route 27 to serve the Halcyon Park-and-Ride stop would provide a modest
benefit, if operationally feasible.
• While serving the Grover Beach Amtrak Station with Route 21 and 24 could encourage additional future public transit use, this would not meet standards in the short run and could impact on-time performance.
• Providing fixed route service to Lopez High School would not meet adopted performance standards.
• None of the alternatives that expand fixed-route service (Saturday Route 27 service,
Sunday Route 27 service or evening service) meet any of the standards and would be a relatively poor use of public funding.
• Extending the Avila-Pismo Trolley service season further into the fall would generate ridership levels similar to that of existing service.
• Shifting the transfer center from Ramona Garden to the train station would not provide benefits to the transit system, but would reduce ridership (at least in the near term prior to substantial development in the area of the train station) and incur substantial capital costs.

LSC Transportation Consultants, Inc. San Luis Obispo South County Transit Page 136 Short-Range Transit Plan
This page intentionally left blank.

San Luis Obispo South County Transit LSC Transportation Consultants, Inc. Short-Range Transit Plan Page 137
Chapter 11 Dial-A-Ride and Other Service Alternatives
This chapter focuses on service alternatives for the existing Dial-A-Ride areas. In addition to changes in the Dial-a-Ride services, it also includes a discussion of fixed-route options in these areas. Nipomo Area
The existing Dial-A-Ride service in Nipomo largely serves school trips, specifically to the three local elementary schools. As discussed in detail in Chapter 2, fully 79 percent of existing ridership during the school year consists of elementary students traveling to or from the schools. Existing ridership excluding school trips is low, averaging only 18.6 passenger-trips per day. In summer, the service carries 25 passenger-trips per day, or 1.5 passenger-trips per service hour. For a community of approximately 16,100 residents, this indicates that there is substantial potential transit demand that is currently not being served. As discussed below, two options were developed and evaluated to provide scheduled service in Nipomo. Provide Half-Hour Fixed-Route Service Outside of the peak demand periods associated with the school bell times, there are many times of day when there is excess time available on the existing Dial-a-Ride service. This capacity could potentially be used to operate a fixed-route service over half of each hour, providing dial-a-ride service during the other half of the hour with the same vehicle. The concept would be to adequately serve the existing ridership (with some shifts in specific service times to avoid the fixed-route service times) while also serve new ridership attracted by the convenience of fixed-route service. Specifically, there are many transit riders that find the convenience and dependability of serve at specific times to be attractive compared with the need for advance reservations and the uncertain service time “windows” required for Dial-A-Ride service. One key question is whether (and when) a fixed-route schedule could be operated without the need for significant increases in transit service levels. The existing service averages 19.25 total service hours (18.00 revenue hours) per day during the school year, on weekdays only. When local schools are not in session, an average of 16.36 service hours and 13.24 revenue hours are operated. This typically consists of three individual shifts that vary depending on demand but are generally as follows: 601—In service from 7:50 AM to 8:50 AM 602—In service from 6:45 AM to 3:30 PM 603—In service from 12:15 PM to 6:30 PM In total, two vehicles are typically in operation from 7:50 AM to 8:50 AM as well as from 12:15 PM to 3:30 PM while one vehicle is in operation during the other periods from approximately
LSC Transportation Consultants, Inc. San Luis Obispo South County Transit Page 138 Short-Range Transit Plan
6:45 AM to 6:30 PM. To gain further insight regarding when capacity could be available, a detailed evaluation was conducted of Dial-a-Ride passenger activity by shift for a total of six days during the school year. As shown in Table 50, the periods during which each individual bus is in use serving the pulses in student transportation around bell times are shown in yellow, while blue indicates the periods when a bus is available for other more dispersed Dial-a-Ride passenger-trips7. As shown, both buses in service at peak times are needed to serve the school bell time trips. The specific schedule for these school trips varies with the school operating schedule, but typically occurs between 7:45 AM and 9:45 AM, 12:30 PM to 1:00 PM and 3:15 PM to 3:45 PM. As shown in the right side of this table, this leaves the other periods of the operating day when at least one vehicle could be available to operate a fixed-route run every other half-hour. In considering a fixed-route schedule, it is important to consider the schedule of the RTA Route 10 service: southbound Route 10 buses serve Nipomo (Tefft at Carillo) at 19 minutes past the hour, while northbound stops are scheduled to occur at 35 minutes past the hour. Given the uncertainties of travel times considering the potential for traffic delays on US 101, it is prudent to provide some cushion during the transfer times. A reasonable schedule would be to operate the fixed route between 45 minutes after the hour and 15 minutes after the hour (leaving the vehicle available for Dial-a-Ride service between 15 minutes and 45 minutes after the hour). Considering the periods when a Dial-a-Ride bus is available, runs could be provided at 6:45 AM, 9:45 AM, 10:45 AM, 11:45 AM and every hour from 1:45 PM to 5:45 PM (a total of nine daily runs). While breaks in scheduled service always reduce the overall convenience of a transit service, these runs do provide the opportunity to connect to Route 10 runs in both directions during the AM and PM commute periods, the ability to conduct a shopping or other short trip in the late morning and the opportunity for trips throughout the afternoon. A potential route is shown in Figure 34. This route is of necessity relatively short (6.4 miles) in order to ensure that it can be reliably operated within a half-hour (including 5 minutes for recovery). The bus would first head east from the Route 10 transfer point and Park-n-Ride at Tefft and Carillo, making a counter-clockwise loop (left turns) around Wilson Street, E. Price Street and S. Thompson Street before heading west on Tefft Street8. The route would turn left onto S. Mary Avenue, right on Hill Street, left on Blume Street, left on Grande Street, right on S. Frontage Road, right on Division Street, right on Mercury Drive, right on Starlite Drive, left on Hazel Lane and right on W. Tefft Street to return to the start. This route connects the major commercial centers with the denser residential areas of Nipomo, including the multifamily residential areas. The resulting schedule is presented in Table 51. It is next necessary to evaluate whether the remaining Dial-a-Ride capacity is adequate to accommodate the Dial-a-Ride demand (conservatively assuming that none of the existing Dial-a-Ride passengers choose to shift to the fixed-route service).
7 This includes some individual trips to/from schools, similar to other non-bell-time trips. 8 Service to the high school was considered, but this would add several minutes of running time to a stop that is also accessible by RTA Route 10 and by DAR, and which generates little ridership at present.

San Luis Obispo South County Transit LSC Transportation Consultants, Inc. Short-Range Transit Plan Page 139
TABLE 50: Review of Nipomo Dial-a-Ride Availability For Fixed Route ServicePeriods When School Bell Time Trips ServedPeriods When Other Trips Served
601 602 603 601 602 603 601 602 603 601 602 603 601 602 603 601 602 603
6:30 AM6:45 AM7:00 AM7:15 AM7:30 AM7:45 AM8:00 AM8:15 AM8:30 AM8:45 AM9:00 AM9:15 AM9:30 AM9:45 AM
10:00 AM10:15 AM10:30 AM10:45 AM11:00 AM11:15 AM11:30 AM11:45 AM12:00 PM12:15 PM12:30 PM12:45 PM1:00 PM1:15 PM1:30 PM1:45 PM2:00 PM2:15 PM2:30 PM2:45 PM3:00 PM3:15 PM3:30 PM3:45 PM4:00 PM4:15 PM4:30 PM4:45 PM5:00 PM5:15 PM5:30 PM5:45 PM6:00 PM6:15 PM
Note 1: At least 1 vehicle in revenue service not serving school bell time trips on all days.
15-Min Period Starting
Capacity Potentially Available for Fixed
Route (1)1-Oct-18 2-Oct-18 3-Oct-18 4-Oct-18 8-Oct-18 9-Oct-18

LSC Transportation Consultants, Inc. San Luis Obispo South County Transit Page 140 Short-Range Transit Plan

San Luis Obispo South County Transit LSC Transportation Consultants, Inc. Short-Range Transit Plan Page 141
Non-school-bell-time trips were summarized by hour for the six days analyzed and compared with the capacity remaining after the fixed-route service times are considered. As shown in Table 52, on most days between five and nine passengers would not be accommodated within the existing hour of service. Some of these trips could (with negotiation) be shifted to other hours of the day when capacity is available. Overall, however, it is conservative to assume that an additional 1.5 revenue vehicle hours would be needed to ensure all existing Dial-a-Ride passengers are adequately served. As shown in Table 53, between the additional mileage
TABLE 51: Example Schedule of Nipomo 30-Minute Fixed RouteLeave
Tefft/Carillo Eastbound
Thompson & Price
Tefft/Carillo Westbound
Division & Frontage
Division & Mercury
Tefft & Pomeroy
Arrive Tefft/Carillo
6:45 6:47 6:49 6:55 7:00 7:06 7:109:45 9:47 9:49 9:55 10:00 10:06 10:10
10:45 10:47 10:49 10:55 11:00 11:06 11:1011:45 11:47 11:49 11:55 12:00 12:06 12:101:45 1:47 1:49 1:55 2:00 2:06 2:102:45 2:47 2:49 2:55 3:00 3:06 3:103:45 3:47 3:49 3:55 4:00 4:06 4:104:45 4:47 4:49 4:55 5:00 5:06 5:105:45 5:47 5:49 5:55 6:00 6:06 6:10
Bold is PM.
TABLE 52: Analysis of Nipomo Dial-a-Ride Capacity Assuming Fixed-Route Service
10/1 10/2 10/3 10/4 10/8 10/9 10/1 10/2 10/3 10/4 10/8 10/9 10/1 10/2 10/3 10/4 10/8 10/9 Average
6:00 AM 0 1 1 1 0 1 0 0 0 0 0 0 0 1 1 1 0 17:00 AM 2 2 2 2 1 2 3 3 3 2 3 2 0 0 0 0 0 08:00 AM 1 0 0 0 2 1 2 1 0 0 3 1 0 0 0 0 0 09:00 AM 0 4 3 2 0 2 0 7 3 3 0 3 0 0 0 0 0 0
10:00 AM 4 3 4 4 1 3 2 6 2 2 2 2 2 0 2 2 0 111:00 AM 4 3 3 3 0 4 2 6 2 2 2 2 2 0 1 1 0 212:00 PM 3 4 0 1 1 3 3 3 1 1 5 6 0 1 0 0 0 01:00 PM 3 3 1 1 0 5 3 5 3 2 6 6 0 0 0 0 0 02:00 PM 1 1 3 4 3 1 2 2 2 2 4 4 0 0 1 2 0 03:00 PM 0 3 3 1 0 3 0 0 2 2 0 0 0 3 1 0 0 34:00 PM 3 3 4 2 1 1 3 2 2 0 2 2 0 1 2 2 0 05:00 PM 0 0 2 0 0 0 2 2 2 0 0 2 0 0 0 0 0 06:00 PM 2 0 1 0 0 0 1 0 0 0 0 0 1 0 1 0 0 0
Total 23 27 27 21 9 26 5 6 9 8 0 7
Required Addl Hours 1.25 1.5 2.25 2 0 1.75 1.46
Hour Beginning
Non-School Bell Time Passenger-Trips
Available Dial-a-Ride Capacity With Fixed Route for Non-School
Bell Time TripsDial-a-Ride Trips Not Served by Existing
Capacity

LSC Transportation Consultants, Inc. San Luis Obispo South County Transit Page 142 Short-Range Transit Plan
operated for the fixed route and the additional hours (and miles) of Dial-a-Ride service, this service would increase annual operating costs by an estimated $35,300 per year.
This route would serve approximately 3,400 households (equal to 59 percent of all Nipomo residences). Considering the demographic characteristics of the area, and the limitations on the convenience of the service (the limited runs, and the long waits for some transfers to/from Route 10), this service is estimated to generate approximately 15,300 passenger-trips per year. Assuming average fare revenues equal to that of the existing SoCo fixed-routes, $10,700 in fare revenues would be generated. This yields a net operating subsidy requirement of $24,600 annually. Provide Hourly Flex Route Service Another option would be to provide an hour route deviation service, or “flex route.” Under this operating plan, a longer route would be operated on an hour schedule. This dedicated bus would operate on a fixed schedule but would have the flexibility to accommodate one to two deviations (close to the route) to serve passengers that otherwise would use the Dial-a-Ride service. This route is also shown in Figure 34 that serves the half-hour route and also extends further to the east, southwest and northwest. A total of eight daily runs could be served while still accommodating the school bell time Dial-a-Ride demand. As shown in Table 54, the schedule would best coordinate with the RTA Route 10
TABLE 53: Dial-A-Ride and Other Service Alternatives AnalysisAnnual
Hours Miles Wkdy Sat Sun Wkdy Sat Sun Hours Miles Cost
Nipomo Half-Hour Fixed Route Mileage -- 2.6 9 0 0 259 0 0 0 6,035 $10,500
Additional DAR 1.5 11.4 -- -- -- 259 0 0 389 2,961 $24,800Total 389 8,996 $35,300 15,300 $10,700 $24,600
Nipomo Hour Flex Route Mileage -- 4.4 8 0 0 259 0 0 0 9,071 $15,800
Additional DAR 4.00 30.5 -- -- -- 259 0 0 1,036 7,896 $66,200Total 1,036 16,968 $82,000 20,600 $14,400 $67,600
Nipomo Commute Fixed Route
1 12 4 0 0 259 0 0 1,036 12,432 $74,100 12,000 $8,400 $65,700
Reduce Summer Nipomo DAR to 1 Van
-5.00 -37.2 -- -- -- 15 0 0 -75 -558 -$4,800 0 $0 -$4,800
Revise Route Route 10 to Serve Southern Nipomo
0.18 1.8 29 10 6 251 52 52 1,487 14,600 $100,700 -2,300 -$3,400 $104,100
Eliminate Nipomo DAR Service After 5 PM
-0.58 -4.3 -- -- -- 259 0 0 -151 -1,123 -$9,600 -350 -$630 -$8,970
Eliminate Nipomo DAR Service After 6 PM
-0.13 -1.0 -- -- -- 259 0 0 -34 -250 -$2,100 -190 -$340 -$1,760
Revise RTA Route 9 to Serve Eastern Templeton
0.10 0.85 26 10 6 251 52 52 736 6,254 $48,200 5,600 $8,300 $39,900
Eliminate Shandon DAR Service
-- -- -- -- -- -- -- -- -5 -146 -$500 -2 -$5 -$495
Eliminate Templeton DAR Service
-- -- -- -- -- -- -- -- -60 -220 -$3,420 -167 -$405 -$3,015
Fare Revenues
Operating Subsidy
Run Parameters Daily Runs Days per Year AnnualRidership
San Luis Obispo South County Transit LSC Transportation Consultants, Inc. Short-Range Transit Plan Page 143
schedules by departing on the western loop at 40 minutes past the hour (five minutes after the scheduled time for the northbound Route 10), return to the transfer point at the same time as the southbound Route 10 (19 minutes after the hour) and then operate the eastern loop before arriving for a layover at the transfer point at 26 minutes after the hour. As the route bus would not be available for Dial-a-Ride trips (other than a limited number of deviations), additional Dial-a-Ride service would be needed. An analysis of capacity versus demand for this alternative indicates the need for four additional Dial-a-Ride vehicle-hours of daily service. In addition, in order to avoid operating three total vehicles at peak times approximately four existing passengers per day would need to be rescheduled by up to an hour from their current service times to periods with adequate capacity. Between the additional Dial-a-Ride service and the additional miles of route operation, this option would increase operating costs by an estimated $82,000 per year. The service area for this option encompasses approximately 5,000 households, equal to 87 percent of all Nipomo households. Considering the demographic characteristics and service quality characteristics (such as the long in-vehicle travel times associated with a large one-way loop), this option is estimated to serve approximately 20,600 annual passenger-trips. Subtracting the resulting fare revenue, subsidy requirements would be approximately $67,600 per year. Provide Commute-Period Fixed Route Service A more straightforward option for Nipomo fixed route service would be to simply operate a fixed route over the hourly route shown in Figure 34, leaving the existing Dial-a-Ride service unchanged. Due to the limited potential demand, a reasonable option would be to operate two runs in the morning commute period and two in the afternoon commute period. As shown in the bottom portion of Table 54, these runs would be scheduled to provide a direct transfer to the southbound Route 10 bus in the morning and from the northbound Route 10 bus in the evening, and a 16 minute wait for the passengers transferring to the northbound Route 10 bus in the morning and the southbound Route 10 bus in the evening. This additional service would incur an operating cost of $74,100 per year. Ridership is estimated to total 12,000 passenger-trips per year, resulting in an operating subsidy of $65,700 per year. This would also require an additional vehicle. Expand the Nipomo Dial-a-Ride Service Area The current boundaries of the Nipomo Dial-a-Ride service area were defined in 2010, and do not reflect more recent development. The analysis of existing capacity and ridership demand discussed in previous alternatives indicate that there is some modest level of available capacity to expand the service area. The data reflected in Table 43, above, was evaluated to identify the daily number of periods with sufficient length to serve a new passenger-trip in an outlying area. Given the longer travel times to serve more remote areas, a half-hour-long trip was assumed to

LSC Transportation Consultants, Inc. San Luis Obispo South County Transit Page 144 Short-Range Transit Plan
be required. This analysis yielded the following daily capacity to accommodate new trips within the existing driver shift:
• 10/1/18 – 7 trips • 10/2/18 – 10 trips • 10/3/18 – 4 trips
• 10/4/18 – 4 trips • 10/8/18 – 12 trips • 10/9/18 – 9 trips
To be able to accommodate new trips on all days, it is appropriate to take the lowest of these figures (4 trips per day) as the design level. In considering potential new service areas, the area to the west of the current area stands out as having the greatest overall population area. As shown in Figure 35, this area of new service lies east of SR 1 (south of Willow Road, and extended to the north) and as far north as the drainage way north of Willow Road on the north and as far south as the agricultural lands on the south. The key developed area within this expansion area is the Trilogy at Monarch Dunes, which is a rapidly developing area that currently includes 1,688 dwelling units (a mix of single-family and multifamily units). The expansion area also includes some additional low-density residential areas to the north and east.
Hourly Flex RouteLeave
Tefft/Carillo Westbound
Division & Frontage
Tefft/ Las Flores
Pomerly/ Waypoint
Tefft/Carillo Eastbound
Thompson & Beechnut
Arrive Tefft/Carillo
6:40 6:50 6:59 7:10 7:19 7:22 7:269:40 9:50 9:59 10:10 10:19 10:22 10:26
10:40 10:50 10:59 11:10 11:19 11:22 11:2611:40 11:50 11:59 12:10 12:19 12:22 12:261:40 1:50 1:59 2:10 2:19 2:22 2:263:40 3:50 3:59 4:10 4:19 4:22 4:264:40 4:50 4:59 5:10 5:19 5:22 5:265:40 5:50 5:59 6:10 6:19 6:22 6:26
Hourly Commuter Route Tefft/Carillo
Frontage
Flores
Waypoint
Eastbound
Beechnut
Tefft/Carillo
6:33 6:43 6:52 7:03 7:12 7:15 7:197:33 7:43 7:52 8:03 8:12 8:15 8:194:35 4:45 4:54 5:05 5:14 5:17 5:215:35 5:45 5:54 6:05 6:14 6:17 6:21
TABLE 54: Example Schedule of Nipomo Hourly Flex Route and Fixed Commuter Routes

San Luis Obispo South County Transit LSC Transportation Consultants, Inc. Short-Range Transit Plan Page 145

LSC Transportation Consultants, Inc. San Luis Obispo South County Transit Page 146 Short-Range Transit Plan
Reflecting the population of this area, the characteristics of this population and the observed non-school trip rate for the Nipomo Dial-a-Ride service, expanding service to this area is expected to increase overall ridership by approximately 2.3 passenger-trips per day (or 600 passenger-trips per year). Note that this demand could increase in the future as the population ages. While this ridership can be served without adding vehicle-hours, it would increase annual mileage by approximately 2,900 vehicle-miles per year, resulting in an increase in annual operating costs of $5,000 annually. Subtracting $400 in additional fare revenues, subsidy requirements would be increased by $4,600 per year. Reduction of Nipomo Dial-a-Ride Summer Service to One Vehicle Given the low ridership on the Nipomo Dial-a-Ride when school is not in session, the service could be adequately provided using a single van, between approximately July 15th and August 5th (a total of 15 non-holiday weekdays). This would result in an operating cost savings of $4,800 per year. This would have a negligible impact on ridership and fare revenues, yielding a reduction in subsidy requirements of $4,800 per year. Revisions to Route 10 to Service Additional Areas of Nipomo In the course of this study several comments were received regarding the desirability of revising some Route 10 runs to serve other areas of Nipomo. One option would be to serve the Nipomo Mesa area. While there is a substantial overall population, the area wide density is low and the roadway network is limited, making it difficult to provide transit service efficiently. A minimal option would be to head west from US 101 on Willow Road and then south on Pomeroy Road, west on Dawn Road, north on Sundale Way and returning east on Willow Road to US 1019. This would add six miles to each one-way bus trip, requiring 15 minutes of additional running time. The ridership potential for this area would be modest and would be more than offset by the reduction in existing ridership due to the longer in-vehicle travel times. It is recommended that this option not be considered further. Another option would be to revise Route 10 to serve more residential areas west of US 101 and south of Tefft Street. The southbound current route serves Thompson Avenue (including Nipomo High School) and Tefft Street and then uses US 101 directly to Santa Maria. Instead, the route could continue west on Tefft over US 101, then south on Mary Avenue, east on Hill Street, south on the US 101 Frontage Road, west on Division Street and south on Orchard Road to regain US 101 at the SR 166 interchange. This route segment would be 6.1 miles in length and take approximately 16 minutes, compared to the current route of 4.3 miles and a five-minute running time (barring freeway congestion). At present the southbound Route 10 buses arrive in Santa Maria at 43 minutes past the hour and depart at 14 minutes past the hour.
9 An alternative would be to access the area via Tefft Avenue and Pomeroy Road, but this would eliminate service to the Nipomo High School.

San Luis Obispo South County Transit LSC Transportation Consultants, Inc. Short-Range Transit Plan Page 147
With these additional running times, buses would instead arrive at 54 minutes after the hour and depart at three minutes after the hour. This would not provide sufficient layover and makeup time to operate dependably without causing the potential for cascading delays to Route 10 service. As a result, it would be necessary to start southbound Route 10 runs earlier and end them later, in order to provide the necessary layover time. The overall ridership impact of this option would consist of an increase in ridership generated at new bus stops in the Nipomo area offset by the reduction in existing ridership resulting from the increase in travel times for existing passengers. The revised route would serve approximately 850 new households in southwest Nipomo. Based on the demographics of this area and the convenience of direct service, an estimated 6,700 passenger-trips would be generated by these new stops. On the other hand, passenger survey data generated for the 2016 RTA Short-Range Transit Plan indicates that 37 percent of all Route 10 riders are onboard between Nipomo and Santa Maria. Considering the ridership on the local runs, a total of 73,000 passenger-trips per year would be impacted by the additional travel time. Onboard travel time for these passengers would increase from a current duration of approximately 60 minutes to 71 minutes. Elasticity analysis indicates that this reduction in the convenience of Route 10 service would reduce existing ridership by 9,000 passenger-trips per year. On balance, this option would result in a net loss of approximately 2,300 passengers per year. Eliminate Nipomo Dial-a-Ride Service after 5 PM While Nipomo Dial-a-Ride service is available until 6:30 PM, ridership on the Nipomo Dial-a-Ride service drops off substantially after the 4 PM hour. Only 1.5 percent of all ridership is picked up after 5:00 PM, of which half occurs in the 5:00 PM hour and half in the 6:00 PM hour. Even excluding the school passenger-trips, only roughly 7.4 percent of passengers board at or after 5:00 PM. If no reservations are made for service after 5:00 PM, drivers return to the operations facility to clock out (saving operating costs). However, if a ride at 6:00 PM is requested without a ride during the 5:00 PM hour, drivers must stay on the clock to provide the ride, resulting in a relatively high cost per passenger-trip served. Reducing the service hours to end at 5:00 PM would save an estimated $9,600 in annual operating costs, but would eliminate 350 annual vehicle-trips. Total subsidy requirements would be reduced by $8,970. Eliminate Nipomo Dial-a-Ride Service after 6 PM A less impactful alternative would be to end service at 6:00 PM rather than 6:30 PM. The number of passenger-trips eliminated would drop to only 190 but the subsidy savings would be only $1,760 per year.

LSC Transportation Consultants, Inc. San Luis Obispo South County Transit Page 148 Short-Range Transit Plan
Nipomo – Santa Maria Medical Transportation Service Reflecting the short distance between Nipomo and Santa Maria as well as the concentration of medical services in Santa Maria, many residents of the Nipomo area travel to Santa Maria for medical appointments. While services (such as Senior Go!) are available for medical travel within San Luis Obispo County, the ability of Nipomo residents to access medical services in Santa Maria (particularly those not able to use fixed route transit services is limited. A transportation service could be operated two days per week (Tuesday and Thursday), consisting of a mid-morning run (around 9 AM) and a mid-afternoon run (around 2 PM). This would allow some trips to be served by the existing Nipomo Dial-a-Ride drivers in the periods after the AM school bell period and prior to the PM school bell period, when there is lower demand for service in Nipomo. For scheduling purposes, reservations at least 2 days in advance would be required. If a service day falls on a holiday, service would be made available on the following day. A reasonable fare would be $4.00 per one-way trip, consistent with the Senior Go! fare for a trip of similar length (5 to 10 miles). A review of available Nipomo Dial-a-Ride capacity indicates that roughly half of the trips could be made using the existing Nipomo Dial-a-Ride vehicle-hours, while the other half would require additional drivers/vehicles. Applying this assumption, annual operating costs for this service would be $20,600 per year. Based on the observed trip rate for medical transit trips, a reasonable estimate is that the service would serve approximately 500 passenger-trips per year (two to three passenger round-trips per service day). At the $4.00 fare, it would require an operating subsidy of $18,600. Expansion of Paso Robles Dial-a-Ride to Accommodate Growth in Demand The 2050 Regional Growth Forecast for San Luis Obispo County (SLOCOG, June 2017) indicates that Paso Robles population is forecast to grow by 1,559 residents between 2020 and 2025. This is equal to a 4.8 percent increase, above the 3.6 percent increase for the county as a whole. There are also current and planned developments in southeast Paso Robles that can be expected to modestly increase demand for the Dial-a-Ride service. At an average of 1.84 passenger-trips per revenue vehicle hour, there is currently substantial unused capacity10. This is corroborated by the on-time performance, which indicates only 0.6 percent of trips served more than five minutes late. The existing capacity is expected to remain sufficient to meet growth in demand over the five-year SRTP plan period. 10 As an aside, means of reducing this service were considered, such as cutting hours of service or days of service. At only 6 hours of service, weekdays only, any cuts in service would substantially reduce the utility of the program, and were not considered further.

San Luis Obispo South County Transit LSC Transportation Consultants, Inc. Short-Range Transit Plan Page 149
Revisions to Route 9 to Serve Additional Areas of Templeton East of 101 At present, RTA services in the Templeton area are limited to stops at the Templeton Park-and-Ride and at Twin Cities Community Hospital with no stops served east of US 101. Considered in the northbound direction, an option to the current service directly northbound to the Las Tablas interchange would be to instead exit at the Vineyard Drive interchange, travel east on Vineyard Drive, north on Main Street, west on 1st Street, jog north on Old County Road and travel west on Las Tablas Drive to serve the existing stops. This alternative route is shown in Figure 36. No roadway improvements would be required, though some tree trimming would be needed along Las Tablas Drive. This route option would not serve the newer residential areas in the northern Templeton area (east of Main Street). Given the geography of the area, service along the portion of Main Street north of the Las Tablas Road corridor would require inefficient doubling back on the route. It would also be difficult given the limited geometrics of the intersections along Old County Road and would require residents of this newer residential area to cross Main Street at uncontrolled locations to reach southbound bus stops. The revised route is 1.65 miles in length, which is 0.85 miles longer than the current route. It would serve the commercial establishments along Main Street as well as the residential neighborhoods along Las Tablas Road east of US 101 and near Main Street. It would add approximately six minutes to the Route 9 running time. This route currently has only seven minutes of layover time at the northern end (for most runs) at Cuesta College in Paso Robles. This additional service would therefore require starting round-trip runs earlier and ending them later, thus increasing costs. It would also change service times in Paso Robles and San Luis Obispo, potentially impacting the convenience of transfers to Paso Express, SLO Transit and other RTA services. This new service area includes approximately 850 households or roughly 23 percent of all households in the Templeton area. This includes multifamily areas such as Serenity Hills. Considering the demographic characteristics of the area, residents will generate approximately 4,500 passenger-trips per year. The new route would also serve Templeton High School and Middle School, as well as the commercial/retail establishments along South Main Street (including a pharmacy). Overall, ridership generated in this new service area is estimated to total 11,300 passenger-trips per year. Route 9 passenger boarding/alighting counts indicate that an estimated 67,000 passenger-trips currently pass through Templeton on local runs each year. The increased in-vehicle travel time for these existing passengers would result in a reduction of approximately 5,600 passenger-trips per year. In total, therefore, this option would increase overall ridership by 5,700 passenger-trips per year. Subtracting $8,300 in additional fare revenues, it would require $39,900 in increased annual operating subsidy. This option is best evaluated as part of an overall analysis of RTA Route 9 corridor services.

LSC Transportation Consultants, Inc. San Luis Obispo South County Transit Page 150 Short-Range Transit Plan

San Luis Obispo South County Transit LSC Transportation Consultants, Inc. Short-Range Transit Plan Page 151
Eliminate Shandon DAR DAR service is currently available to the general public in Shandon from 8 AM to 5 PM on Mondays, Wednesdays and Fridays. Ridership has fallen to very low levels: from July 2017 through June 2018, only two passenger-trips were carried on this service. As service is only operated when requests are received at least a day in advance, marginal operating costs incurred for this service are also low, totaling $500 over this same period. In addition to saving these operating costs, eliminating this service would reduce staff time and reporting time needed for monitoring and auditing the service. This would also eliminate a service that is not filling a significant public need, and that could raise issues of equity with regards to other small outlying residential areas not provided with transit service. Eliminate Templeton-Paso Robles DAR The Templeton-Paso Robles Dial-a-Ride operates on a similar structure, except that service is available on Tuesdays and Thursdays. Ridership totals 167 passenger-trips per year or an average of 2.7 per service day. On most days that any passengers are served, a single round-trip is provided to and from a medical facility in Templeton. Eliminating this service would reduce operating costs by approximately $3,420 per year and reduce subsidy requirements by $3,015 per year. It would also reduce management, reporting and audit costs. Along with elimination of the Shandon DAR, it would increase availability of a vehicle for other services. There is also the potential for this service to be provided by the City of Atascadero, which is discussed in Technical Memorandum 6: Institutional and Capital Alternatives. COMPARISON OF SERVICE ALTERNATIVES Table 55 presents a summary of the service alternatives discussed in this chapter. As also shown in Figure 37, these alternatives have annual ridership impacts that range from an increase of 20,600 (Nipomo hour flex route service) to a loss of 2,300 (Route 10 revisions to serve southern Nipomo). Operating subsidy impacts range from an increase of $104,100 (the Route 10 revisions) to a savings of $8,970 (eliminating Nipomo Dial-a-Ride service after 5 PM) as also shown in Figure 38. The performance analysis for these alternatives is shown in the right side of Table 55. For the fixed-route options, the consistency with fixed-route standards is considered. As discussed in previous chapters, there are no specific adopted standards for the Dial-a-Ride services. The results regarding the passenger-trips per vehicle-hour of service are shown in Figure 39. These results fall into several categories:

LSC Transportation Consultants, Inc. San Luis Obispo South County Transit Page 152 Short-Range Transit Plan
TABL
E 55
: Dia
l-a-R
ide
and
Oth
er F
ixed
Rou
te S
ervi
ce A
ltern
ativ
es P
erfo
rman
ce A
naly
sis
Net A
nnua
l Ri
ders
hip
Net A
nnua
l Ve
hicl
e-Ho
urs
Net A
nnua
l Re
venu
e
Net A
nnua
l O
pera
ting
Subs
idy
Psgr
-Trip
s pe
r Ser
vice
-Ho
ur
Mar
gina
l Su
bsid
y pe
r Ps
gr-T
rip
Mar
gina
l Fa
rebo
x Re
turn
17.0
No S
tand
ard
20%
15,3
0038
9$1
0,70
0$2
4,60
039
.4$1
.61
43%
20,6
001,
036
$14,
400
$67,
600
19.9
$3.2
821
%
12,0
001,
036
$8,4
00$6
5,70
011
.6$5
.48
13%
600
0$4
00$4
,300
--$7
.17
9%
Redu
ce S
umm
er N
ipom
o DA
R to
1 V
an0
-75
$0-$
4,80
00.
0--
0%
-2,3
001,
487
-$3,
400
$104
,100
-1.5
-$45
.26
-3%
-350
-151
-$63
0-$
8,97
02.
3$2
5.63
7%
-190
-34
-$34
0-$
1,76
05.
6$9
.26
19%
700
156
$2,8
00$1
7,80
04.
5$2
5.43
16%
5,60
073
6$8
,300
$39,
900
7.6
$7.1
321
%
-2-5
-$5
-$49
50.
4$2
481%
-167
-60
-$40
5-$
3,01
52.
8$1
8.05
13%
Elim
inat
e Te
mpl
eton
DAR
Ser
vice
Chan
ge F
rom
Exi
stin
g Se
rvic
ePe
rfor
man
ce M
easu
res
Fixe
d Ro
ute
Perfo
rman
ce S
tand
ards
Fixe
d Ro
ute
Alte
rnat
ive
Atta
inin
g St
anda
rd S
hade
d
Nipo
mo
Half-
Hour
Fix
ed R
oute
Nipo
mo
Hour
Fle
x Ro
ute
Revi
se R
oute
Rou
te 1
0 to
Ser
ve S
outh
ern
Nipo
mo
Elim
inat
e Ni
pom
o DA
R Se
rvic
e Af
ter 5
PM
Elim
inat
e Ni
pom
o DA
R Se
rvic
e Af
ter 6
PM
Revi
se R
TA R
oute
9 to
Ser
ve E
aste
rn T
empl
eton
Elim
inat
e Sh
ando
n DA
R Se
rvic
e
Nipo
mo
Com
mut
e Fi
xed
Rout
e
Expa
nd N
ipom
o DA
R Se
rvic
e Ar
ea
Nipo
mo
- San
ta M
aria
Med
ical
Ser
vice

San Luis Obispo South County Transit LSC Transportation Consultants, Inc. Short-Range Transit Plan Page 153
• For those options increasing both passenger-trips as well as vehicle-hours, the best option is the Nipomo half-hour fixed-route, with 39.4 passenger-trips per additional vehicle-hour (benefited from the fact that many of the vehicle-hours are already being used for the Dial-a-Ride service). The Nipomo hour flex-route also has a relatively good value of 19.9, exceeding the standard of 17.0. Revising Route 9 to serve eastern Templeton generates a relatively low figure of 7.6. Expanding the Nipomo Dial-a-Ride service area cannot be evaluated using this measure, as ridership would be increased while avoiding the need to expand vehicle-hours.
• In the other direction are the options that decrease both passenger-trips and vehicle-
hours. These results range from 5.9 (for eliminating Nipomo Dial-a-Ride service after 6 PM) to 0.4 (eliminating Shandon Dial-a-Ride service).
• Finally, the revision to Route 10 to serve southern Nipomo decreases passenger-trips
while increasing vehicle-hours, resulting in a disadvantageous figure of -1.5.

LSC Transportation Consultants, Inc. San Luis Obispo South County Transit Page 154 Short-Range Transit Plan
The operating subsidy per passenger-trip also falls into three categories, as shown in Figure 40:
• Of those options that increase both subsidy needs and ridership, the “best” is the Nipomo half-hour fixed-route, which requires a relatively low $1.61 per new passenger-trip served. At the other extreme, the Nipomo-Santa Maria medical transportation service requires $25.43 per passenger-trip.
• Those options that decrease both subsidy needs and ridership also yield a positive result
for this performance measure, but in this case a “better” alternative saves more subsidy per passenger-trip and thus has a higher value. The “best” by this measure is the elimination of Shandon Dial-a-Ride service, which saves $248 per passenger-trip. The elimination of Nipomo Dial-a-Ride after 5 PM also yields a relatively high savings of $25.63.
• The negative value of $45.26 for the Route 10 service to southern Nipomo reflects an increase in subsidy and decrease in passenger-trips, thus indicating a poor alternative by this measure.

San Luis Obispo South County Transit LSC Transportation Consultants, Inc. Short-Range Transit Plan Page 155
The review of marginal farebox return ratio is straightforward for those alternatives that increase both fare revenues and costs. Three of these alternatives result in a farebox return ratio exceeding the fixed-route standard of 20 percent: 21 percent for the Route 9 service to eastern Templeton and the Nipomo hour flex route and 43 percent for the Nipomo half-hour fixed-route. The Route 9 revision to serve eastern Templeton has a lower figure of 13 percent, not attaining the standard. Those options that reduce both fare revenue and costs result in values ranging from 1 percent (eliminating Shandon DAR) to 19 percent (eliminating Nipomo Dial-a-Ride after 6 PM). A lower value represents a “better” alternative in these cases, as it indicates elimination of a service with relatively low existing farebox return ratio. Finally, the negative value for the Route 10 service to southern Nipomo reflects a poor outcome as revenues decrease while costs increase. Selecting appropriate service strategies requires consideration of more than the relatively straightforward quantitative analysis presented in Table 55. Based on these results and the discussion above, the following conclusions can be drawn:
• Conversion of the Nipomo Dial-a-Ride to provide a combination of half-hour-long fixed-route service (every hour) as well as Dial-a-Ride service is a promising alternative with the potential for a substantial ridership increase at a relatively modest cost. While the hour option also achieves standards, it would be more costly. An evaluation of the
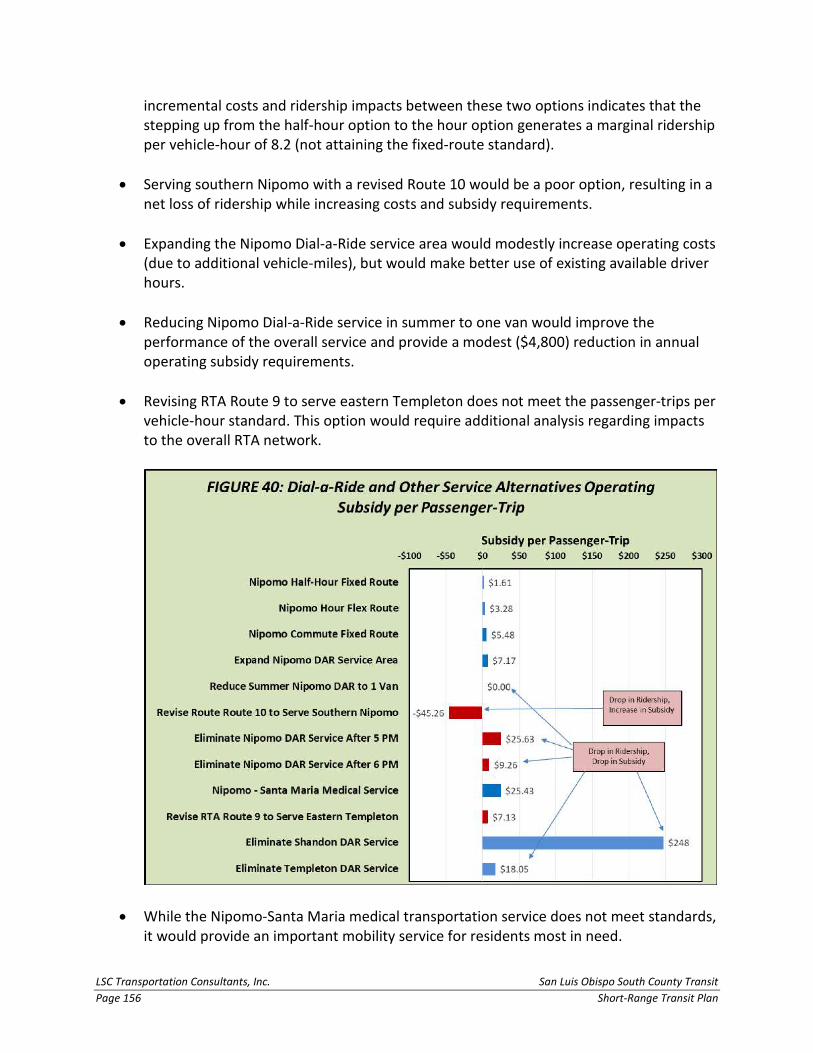
LSC Transportation Consultants, Inc. San Luis Obispo South County Transit Page 156 Short-Range Transit Plan
incremental costs and ridership impacts between these two options indicates that the stepping up from the half-hour option to the hour option generates a marginal ridership per vehicle-hour of 8.2 (not attaining the fixed-route standard).
• Serving southern Nipomo with a revised Route 10 would be a poor option, resulting in a
net loss of ridership while increasing costs and subsidy requirements. • Expanding the Nipomo Dial-a-Ride service area would modestly increase operating costs
(due to additional vehicle-miles), but would make better use of existing available driver hours.
• Reducing Nipomo Dial-a-Ride service in summer to one van would improve the
performance of the overall service and provide a modest ($4,800) reduction in annual operating subsidy requirements.
• Revising RTA Route 9 to serve eastern Templeton does not meet the passenger-trips per
vehicle-hour standard. This option would require additional analysis regarding impacts to the overall RTA network.
• While the Nipomo-Santa Maria medical transportation service does not meet standards,
it would provide an important mobility service for residents most in need.

San Luis Obispo South County Transit LSC Transportation Consultants, Inc. Short-Range Transit Plan Page 157
• Eliminating the Templeton Dial-a-Ride is on the cusp. If the ridership were to shift to Runabout, the fact that the average subsidy per passenger-trip for Runabout is higher than that of the Templeton Dial-a-Ride is a consideration. However, dropping this service would reduce management, reporting and auditing requirements.
• Eliminating Shandon Dial-a-Ride service would be very cost-effective as it would drop a
service that is not filling a significant unmet need. It is however, a relatively low annual cost for a lifeline service.

LSC Transportation Consultants, Inc. San Luis Obispo South County Transit Page 158 Short-Range Transit Plan
This page intentionally left blank.

San Luis Obispo South County Transit LSC Transportation Consultants, Inc. Short-Range Transit Plan Page 159
Chapter 12 Capital Alternatives
Capital items required for the transit program consists of vehicles, bus stop facilities, transit centers and transit operations facilities. These elements are discussed below. VEHICLE FLEET Fleet Replacement As shown in Table 56, over the next five years, a total of 15 SoCo Transit vehicles will warrant replacement: two 22-passenger Starcrafts, four 5-passenger Dodge Entravan/Caravans, two 37-passenger Gillig Phantoms, two 45-passenger Gillig Phantoms, and three 34-passenger Gillig Low Floor buses. In addition, one 31-passenger Double K Villager trolley and one company Dodge Ram vehicle will need to be replaced as well.
Vehicle Size At present, the SoCo Transit fixed routes are typically operated using standard 35-foot-long buses, with a capacity of 32 to 38 seated passengers. Existing passenger levels, however, are largely much lower than these capacities other than on the limited school “tripper” bus runs, indicating the potential to operate much of the service with smaller vehicles. Table 57 presents an evaluation of the peak design load for each route and run. This is based on the peak passenger loads observed during an on-board survey in March of 2019 (as presented in Table
TABLE 56: Fleet Replacement
Vehicle # Make Model Mileage LengthSeating
Capacity Year DepartmentYear of
Replacement1204 FORD STARCRAFT 120,960 22' 20 + 2 w/c 2013 CO-DAR 2019504 DODGE RAM 2500 176,702 22' 2 + 0 w/c 2002 SCT-SUP 2019729 DODGE BRAUN ENTRAVAN 52,000 -- 4 + 1 w/c 2013 PASO-DAR 2020730 DODGE BRAUN ENTRAVAN 51,531 -- 4 + 1 w/c 2013 PASO-DAR 2020201 GILLIG PHANTOM 466,310 35' 35 + 2w/c 2003 SCT-FIXED 2020204 GILLIG PHANTOM 500,176 35' 35 + 2w/c 2003 SCT-FIXED 2020
1011 THOR EZ RIDER 264,599 35' 32 + 2 w/c 2010 SCT-FIXED 20221012 THOR EZ RIDER 187,186 35' 32 + 2 w/c 2010 SCT-FIXED 20221511 FORD STARCRAFT E450 69,527 22' 20 + 2 w/c 2015 CO-DAR 2022516 DODGE GRAND CARAVAN 54,221 -- 4 + 1 w/c 2014 SCT-SUP 2024517 DODGE GRAND CARAVAN 30,988 -- 4 + 1 w/c 2014 SCT-SUP 2024
1013 DOUBLE K VILLAGER 103,562 29' 29 + 2 w/c 2011 CO-TROLLEY 20251308 GILLIG LOW FLOOR 245,108 35' 32 + 2 w/c 2013 SCT-FIXED 20251309 GILLIG LOW FLOOR 228,835 35' 32 + 2 w/c 2013 SCT-FIXED 20251310 GILLIG LOW FLOOR 239,035 35' 32 + 2 w/c 2013 SCT-FIXED 20251509 GILLIG LOW FLOOR 164,316 35' 32 + 2 w/c 2015 SCT-FIXED 20271707 DOUBLE K VILLAGER 14,935 29' 29 + 2 w/c 2017 CO-TROLLEY 2032
Source: South County Transit Fleet Roster, dated October 1, 2018

LSC Transportation Consultants, Inc. San Luis Obispo South County Transit Page 160 Short-Range Transit Plan
28), increased based on monthly ridership data to reflect ridership in the busiest month of the year. In addition, a 20 percent factor was added to reflect the natural day-to-day variation in ridership. As shown, passengers could be seated on all of the runs using a smaller “cutaway” vehicle with 20 passenger seats, with one exception: on the day that Route 27 was surveyed, Arroyo Grande High School operated a half-day schedule, resulting in 12 passengers boarding at the High School stop. On a typical school day, the design load for this run is 8 passengers, which could also be accommodated with a smaller bus. In sum, this review indicates that a smaller vehicle could serve all runs, except for the tripper runs and regular runs impacted by specific events such as changes in school times.
As driver costs do not differ depending on the size of the vehicle, the cost impacts of operating smaller buses is a factor of the difference in fuel and maintenance costs. RTA vehicle records were reviewed for FY 2018/19, which indicate that the larger Gillig low-floor buses typically used for the SoCo fixed route incur fuel and maintenance costs of $0.94 per mile, while the smaller 20-seat Ford Starcraft vehicles have equivalent costs of $0.75 per mile. Over the course of a year the non-tripper SoCo fixed route runs require a total of 250,292 vehicle-miles (both in service as well as deadhead). Multiplied by the $0.19 in operating cost savings per mile, overall annual operating costs would be reduced by an estimated $46,700.
TABLE 57: SoCo Transit Fixed Route Bus Size Review
RunDesign
Load RunDesign
Load RunDesign
Load RunDesign
Load6:30 AM 3 6:30 AM 4 6:30 AM 3 6:00 AM 57:00 AM 10 7:00 AM 9 7:30 AM 7 7:07 AM 278:00 AM 15 8:00 AM 10 8:30 AM 4 7:30 AM 59:00 AM 10 9:00 AM 4 9:30 AM 6 8:30 AM 310:00 AM 5 10:00 AM 13 10:30 AM 7 9:30 AM 911:00 AM 11 11:00 AM 12 11:30 AM 6 10:30 AM 512:00 PM 7 12:00 PM 10 12:30 PM 27 11:30 AM 81:00 PM 13 1:00 PM 9 1:30 PM 1 12:30 PM 32:00 PM 15 2:00 PM 13 2:30 PM 3 1:30 PM 83:00 PM 8 3:00 PM 17 3:10 PM 7 2:30 PM 204:00 PM 8 4:00 PM 4 3:30 PM 6 3:30 PM 115:00 PM 10 5:00 PM 7 4:30 PM 1 3:30 PM 96:00 PM 8 6:00 PM 7 5:30 PM 1 5:30 PM 97:00 PM 5 7:00 PM 1 6:30 PM 1 6:30 PM 3
-- -- -- -- 7:30 PM 1 7:30 PM 5
Source: LSC Boarding/Alighting Counts, adjusted by RTA daily ridership counts.
Run
Star
t Tim
e
Runs That Can be Served with 20-Passenger Cutaway Without Standees
Tripper Bus Runs
Note: On day of survey, Arroyo Grande High School operated a half-day, generating the high 12:30 PM run ridership load.
Route 21 Route 24 Route 27 Route 28

San Luis Obispo South County Transit LSC Transportation Consultants, Inc. Short-Range Transit Plan Page 161
There are other factors to consider beyond capacity and costs in defining the appropriate vehicle size to operate:
• Larger buses provide greater flexibility to accommodate infrequent peaks in passenger loads, such as school field trips.
• Smaller buses have less noise and visual presence impacts on neighborhoods than do larger vehicles.
• Larger buses have a substantially longer useful life (15 years) compared to that of smaller buses (4 to 7 years). While smaller buses are less expensive to purchase than larger buses, much of the cost of bus purchases is be funded through state or Federal funding programs. Overall, the per-hour capital costs are roughly similar.
• Larger buses provide a smoother ride than do smaller buses, and can better accommodate passengers with disabilities. Overall, passengers prefer using larger buses.
• The larger low-floor buses are easier for persons using mobility devices to board and deboard, and reduce delays associated with this process.
Battery Electric Buses The fleet examined as part of this study is currently a mix of diesel and gasoline fueled vehicles. The California Air Resource Board (CARB) has recently implemented new regulations (the “Transit Fleet Rule”) that will ultimately require all public transit fleets in the state to use only Zero Emission Bus (ZEB) vehicles. ZEB technologies consist of Battery Electric Buses (BEBs) and hydrogen fuel cell buses. Of these two options, BEB technology is substantially more feasible for smaller transit agencies. The Innovative Clean Transit Regulation was approved on August 13, 2019 and went into effect October 1, 2019. The regulation applies to all public transit agencies that own, lease, or operate buses with a gross vehicle weight rating greater than 14,000 lbs. According to the rule, cutaway buses will not be included in the initial implementation requirement as there are currently no ZEB Altoona-tested cutaway vehicles (as required to be eligible for federal funding), and it is unclear when a fully tested zero-emission cutaway will be available. Cutaway vehicle will be subject to the rule beginning January 1, 2026; if Altoona tested vehicles are available. There are also other potentially acceptable reasons to defer ZEB purchase requirements, including (1) infrastructure delays beyond a transit agency’s control, (2) available ZEB range (mileage) that is not sufficient to meet daily running mileage needs, (3) available ZEB power is not sufficient for the grades operated by the transit agency and (4) financial hardship. Specific timing of requirements depends on fleet size, which in turn is based on the number of buses in the active fleet in 2019. A large transit agency is defined as a transit agency that operates either in the South Coast or the San Joaquin Valley Air Basin and operates more than
LSC Transportation Consultants, Inc. San Luis Obispo South County Transit Page 162 Short-Range Transit Plan
65 buses in annual maximum service, or a transit agency that has at least 100 buses in annual maximum service in an urbanized area with a population of at least 200,000 as last published by the Bureau of Census before December 31, 2017. A small transit agency is defined as all other transit agencies that do not fit into the “large” category. By this definition, both SoCo Transit and RTA as a whole are “small” transit agencies. For small transit agencies, the key requirements are (1) beginning on January 1, 2026 25 percent of all new bus purchases must be ZEB and (2) beginning on January 1, 2029 all transit fleet new bus purchases must be ZEBs. The purchase requirement applies only to the total number of NEW bus purchases in a calendar year, not used buses. Transit agencies may also take part in a “bonus credit” program, if there were ZEB buses in the fleet as of January 1, 2018. Bonus credits can be used to meet the ZEB bus purchase requirement until December 31, 2028 when the 100 percent zero emission bus purchase requirement goes into effect. Bonus credits cannot be used more than once. Zero emission mobility options are also possible in lieu of meeting the required number of minimum ZEB bus purchases. ZEB mobility options include services using bicycles, scooters or other zero emission vehicles with a GVWR of 14,000 pounds or less. To participate in this option, the transit agency must track zero-emission passenger miles. One credit is equal to 180,000 zero-emission passenger miles per year for small transit agencies. Transit agencies must submit a “Rollout Plan” to the CARB Executive Officer which outlines how the agency will achieve the goal of full transition to zero-emissions by 2040, types of buses to be purchased, schedule of construction for infrastructure facilities, training plan, funding sources and how ZEBs will be deployed in disadvantaged communities. There are many substantial issues regarding implementation of these requirements, including the impact on facilities, vehicle costs, operating range, charging options and time-of-day charging strategies. As SoCo and Dial-a-Ride services are provided using a combined overall RTA fleet, this issue is better addressed at the broader RTA level rather than for the SoCo or Dial-a-Ride systems. BUS STOP IMPROVEMENTS Passenger facilities include all equipment and amenities that serve the passenger as they access the bus. This includes bus stop shelters, benches and signs, information kiosks, pedestrian crossing amenities and transfer centers. The quality of passenger amenities is a very important factor in a passenger’s overall perception of a transit service. Depending on the trip, a passenger can spend a substantial proportion of their total time using the transit service waiting at their boarding location. If this is an uncomfortable experience, if it is perceived to be unsafe, or if it does not provide adequate protection from rain and inclement weather, the bus stop can be the deciding factor regarding a potential passenger’s use of the transit system. Criteria that should be considered in siting new bus shelters are as follows:

San Luis Obispo South County Transit LSC Transportation Consultants, Inc. Short-Range Transit Plan Page 163
• Passenger activity—Shelters are typically considered to be warranted when 10 or more
passengers board over the course of an average day. If passengers at a particular stop tend to be more sensitive to environmental conditions (such as a stop at a Senior Center or social service provider), a lower number is appropriate.
• The presence of existing shelter—A stop immediately adjacent to a commercial building
with adequate roof overhang to provide protection from rain, for example, may not need an additional shelter.
• Spacing along the route—A long route segment of stops that individually do not warrant
shelters could benefit from provision of a shelter, particularly if it is needed to provide at least one shelter for a defined residential or commercial activity area.
The adopted bus stop improvement plan strives to provide seating (such as a bench) for stops that average 10 or more boardings per day and shelter for stops that average 20 or more boardings per day. Using the above criteria, an analysis of existing stops and their average daily ridership was performed with recommendations for potential bench and shelter locations as summarized in Table 58. As shown, six new shelters and two benches are recommended. In addition, the Oceano Airport stop needs a wheelchair pad. San Luis Obispo County should also be encouraged to provide sidewalks along Air Park Drive to connect this stop with nearby residences. In addition, the service alternatives that would include new fixed route corridors would require new stops. This will be assessed as part of the overall plan development, once service strategies have been defined.
TABLE 58: SoCo Transit Stop Improvements
StopAvg. Boarding &
AlightingRecommended Improvement
Grand & 16th 64.9 ShelterHighway 1 & 21st 30.9 ShelterGrand & 13th 29.8 ShelterDolliver & Pomeroy 22.0 ShelterHighway 1 & 25th 21.0 ShelterGrand & Elm 19.5 ShelterDolliver & Hinds 18.4 BenchOceano Airport 15.0 Pad, SidewalkShell Beach & Seacliff 12.4 Bench
LSC Transportation Consultants, Inc. San Luis Obispo South County Transit Page 164 Short-Range Transit Plan
Transit Center Improvements The Pismo Beach Outlets transfer point is a key stop in the SoCo fixed route network. The Santa Maria – San Luis Obispo Transportation Connectivity Study (Nelson/Nygaard, 2018) recommends a westbound bus stop for Route 10 on the northeast side of Five Cities Drive, opposite the existing bus bays. This would reduce the westbound route running time by approximately 5 minutes, providing additional layover/makeup time and improving Route 10 on-time performance. This improvement is best addressed as part of RTA plans, rather than SoCo Transit plans.
Bus Parking Facility Improvements
The SoCo Transit bus operations facility on Rodeo Drive in Arroyo Grande is generally adequate to support existing and foreseeable services. The asphalt pavement is in adequate but deteriorating condition, and will warrant a full new base and pavement replacement by the end of the five-year plan period. $200,000 is a reasonable estimate of the costs of this project. The two vehicles used for the Nipomo Dial-a-Ride service are currently parked overnight in the Vons parking lot along West Tefft Street in Nipomo. This reduces the costs and wear-and-tear of deadhead travel to/from the Rodeo Drive facility, but it does increase the potential for vandalism and leaves the transit program open to the possibility that the property owner could revoke permission. One option would be to purchase and improve a secure parking facility in Nipomo, but this would incur costs more than the potential benefit. Instead, transit system management could contact other public entities (such as the County or School District) to see if there are opportunities available to establish secure overnight parking (with 24-hour staff access) at little or no cost to the transit program.
San Luis Obispo South County Transit LSC Transportation Consultants, Inc. Short-Range Transit Plan Page 165
Chapter 13 Institutional Alternatives
This chapter presents several options regarding the institutional framework for SoCo Transit and dial-a-ride services. In addition, changes to the Strategic Business Plan are discussed regarding these services. DISSOLVE SOUTH COUNTY TRANSIT AND INCORPORATE THE SOCO TRANSIT PROGRAM INTO THE REGIONAL TRANSIT AUTHORITY Over the last several years, the RTA Board and staff have been considering the consolidation of the South County transit program into the RTA. This has included meetings with funding sources (notably SLOCOG), employee meetings, analysis of institutional and financial issues and development of a draft amended RTA Joint Powers Agreement that reflects the inclusion of the SoCo program. In short, this amended JPA would allocate existing SoCo funding to RTA for direct provision of service and establish a South County Transit Committee, comprised of representatives of Arroyo Grande, Grover Beach, Pismo Beach and the County of San Luis Obispo. This committee would meet at least annually, and would have responsibility to define service levels, set fare policy and define South County operating and capital budgets. This change would have a number of benefits:
• It would reduce staff and board member time needed for the separate quarterly SoCo Board meetings. While some resources would still be required to conduct South County Transit Committee meetings, overall administrative procedures would be streamlined.
• An analysis in 2018 indicated that a combination of cost savings and additional STA funding would increase the overall financial bottom line by $88,000 per year.
• It would provide the opportunity to market all regional services as a single brand. This
can raise the overall public awareness of the regional transit service, reduce uncertainty about using different elements of the transit program and encourage higher use of the service.
Most significantly, this merger would address the serious issue of attaining the minimum farebox return ratio identified under the Transportation Development Act (TDA). Put simply, the TDA requires SoCo Transit to attain this farebox ratio or pay a “penalty” in terms of reduced TDA funding equal to the difference in fares required to meet this standard and the actual fares. The most recent TDA Audit (FY 2016 – 17) indicated a farebox ratio of 13.7 percent. While the 2016 fare increase would indicate a higher farebox ratio at present, increases in operating costs indicate that the overall program remains significantly under the 20 percent standard. As a result, the SoCo Transit program on its own would either need a very substantial combination of fare increase and service reduction or see an ongoing reduction in TDA revenues.
LSC Transportation Consultants, Inc. San Luis Obispo South County Transit Page 166 Short-Range Transit Plan
Incorporation of SoCo Transit into the overall RTA organization, however, would “blend” the fare and costs for the South County transit program into the overall regional farebox ratio calculations. Due to the higher productivity and fare generation of the regional routes (in particular), the overall RTA with South County services included would yield a farebox return ratio well above the required 20 percent figure.
There are many steps that must be addressed to complete consolidation:
• Finalize plans to transition health insurance benefits to the RTA plans.
• Transition risk management commitments to RTA.
• Finalize plans for transition of branding into the unified regional branding.
• Work with funding and regulatory partners to define reporting and financial mechanism.
• Transition vendor agreements and other business arrangements.
• Determine local fare levels; in particular, determine whether the current fares for SoCo fixed routes ($1.50 base fare) should be raised to the $1.75 RTA base-zone fare.
• Finalize and adopt the revised JPA after public and stakeholder input.
PROVIDE TEMPLETON DIAL-A-RIDE SERVICE THROUGH THE CITY OF ATASCADERO RTA is currently spending $5,800 in operating costs to serve 167 passenger-trips on the Templeton Dial-a-Ride service. As discussed in Chapter 2, these passengers make short trips within Templeton, largely to and from medical appointments. One option would be for RTA to “contract” with the City of Atascadero to provide this service. As the City’s Dial-a-Ride service already serves Templeton (for trips to and from Atascadero), it could potentially combine trips and provide service at a reduced cost. City of Atascadero staff has indicated an interest in discussions regarding this option. A per-trip charge could be negotiated between the RTA and the city as well as monthly billings submitted by the city (along with trip data necessary for reporting purposes) for compensation. REVISE STRATEGIC BUSINESS PLAN TO BETTER ADDRESS DIAL-A-RIDES A key guiding document for the overall RTA program (including the Dial-A-Ride services) is the Strategic Business Plan. This document includes a productivity standard of 2.0 for “runabout and other demand response services.” As “lifeline” services, the Shandon and Templeton rural dial-a-ride services are intended to address unmet needs. Given the sporadic nature of these needs and the rural areas served, this standard is not pertinent to these services. In addition, the Strategic Business Plan currently includes little mention of the rural dial-a-ride programs, which makes them easy to overlook. As discussed in Chapter 4 of this study, the

San Luis Obispo South County Transit LSC Transportation Consultants, Inc. Short-Range Transit Plan Page 167
following modifications are recommended to ensure that the county-funded Dial-A-Ride services are included in the Plan policies:
• Executive Summary—A sentence should be added indicating that “This Plan addresses all services provided by the RTA, with the exception of the South County Transit program, which is addressed in a separate Strategic Business Plan.”11
• Standard 1, Item C—Change to “Runabout, Nipomo Dial-a-Ride and Paso Robles Dial-a-
Ride demand response services will be 2.0 or greater.” • Standard 1 – Change last sentence to “Any recommended to seasonal or lifeline services
(i.e., Shandon Dial-A-Ride or Templeton Dial-A-Ride) will include target productivity standards that must be met in order to qualify for continued funding.”
The standards included in the Strategic Business Plan identify an-time performance standard of 95% or greater for the dial-a-ride services with an on-time window of “within 30 minutes of appointed pick-up time.” Given the small size of the rural Dial-a-Ride service areas, a smaller window of 15 minutes is recommended. In addition, RTA staff should ensure that the rural dial-a-ride program’s on-time performance is reported in the Strategic Business Plan performance reports.
11 Of course, if the SoCo Transit is merged into RTA, this would be amended.

LSC Transportation Consultants, Inc. San Luis Obispo South County Transit Page 168 Short-Range Transit Plan
This page intentionally left blank.

San Luis Obispo South County Transit LSC Transportation Consultants, Inc. Short-Range Transit Plan Page 169
Chapter 14 Financial Alternatives
The financial implications of institutional changes are discussed in the previous chapter. This chapter presents other options focusing on the transit fares. CHANGES IN SOCO TRANSIT FARES Two fare options are discussed below. First, consideration is given to a fare increase not as part of consolidation with RTA. Secondly, the impacts of aligning fares fully with RTA fares are considered. Fare Increase to Base Fare of $1.75 SoCo Transit fares were most recently increased on July 30, 2016, when base one-way fares increased from $1.25 to $1.50 and discount fares increased from $0.60 to $0.75. At that time, a day pass was also offered, which was priced at twice the one-way fare. If a fare increase is implemented, a reasonable “next step” would be to increase the base fare to $1.75. This would be accompanied by an increase in the discount single-boarding fare to $0.85, the regular day pass to $3.50, the discount day pass to $1.70, the regular 31-day pass to $43.00 and the discount 31-day pass to $21.50. An elasticity analysis of this fare increase is shown in the top portion of Table 59. This is based on the existing SoCo Transit fare revenues and passenger boarding by fare type (as shown in Table 29 of Chapter 5). As indicated, this fare increase is forecast to reduce ridership by an estimated 4,300 passenger boardings per year or 2.7 percent of total ridership. Considering both the loss in ridership and increased fare rates, total fare revenues would be increased by $9,500, or 6.1 percent. Dividing the increase in fare revenues by the loss in ridership, the program would save $1.58 in operating subsidy for every passenger-trip lost. In comparison the existing SoCo Transit fixed routes incur a subsidy of $3.57 per passenger-trip.
TABLE 59: SoCo Transit Fare Change Analysis
Existing FuturePercent Change Existing1 Future Change
Percent Change Existing Future Change
Percent Change
Regular $1.50 $1.75 16.7% 40,300 38,200 -2,100 -5.2% $43,500 $48,100 $4,600 10.6%Discount $0.75 $0.85 13.3% 14,100 13,500 -600 -4.3% $7,600 $8,200 $600 7.9%Regular $3.00 $3.50 16.7% 20,700 19,600 -1,100 -5.3% $16,700 $18,400 $1,700 10.2%Discount $1.50 $1.70 13.3% 25,700 24,600 -1,100 -4.3% $10,400 $11,300 $900 8.7%Regular $37.00 $43.00 16.2% 6,200 5,900 -300 -4.8% $7,400 $8,200 $800 10.8%Discount $18.50 $21.50 16.2% 15,200 14,400 -800 -5.3% $9,200 $10,100 $900 9.8%
98,300 98,300 0 0.0% $59,700 $59,700 $0 0.0%Total 220,500 116,200 -6,000 -2.7% $154,500 $164,000 $9,500 6.1%
Note 1: Excludes other passenger categories with fares unchanged.
31-Day Pass
Single Boarding
Day Pass
Annual Passenger-Trips Annual Fare RevenueFare Level
Other Fare Categories (Unchanged)

LSC Transportation Consultants, Inc. San Luis Obispo South County Transit Page 170 Short-Range Transit Plan
Fare Changes to Bring SoCo Transit in line with RTA
If SoCo Transit were to be fully integrated into the RTA, one option (though not a necessity) would be to eliminate any specific fares for south county services and convert to the RTA single-zone fares and pass rates. A comparison of the two fare structures is shown in Table 60. This would have the following impacts:
• The existing fares for SCT fixed route boardings are $1.50 for a regular passenger and $0.75 for seniors (age 65 to 79), Medicare cardholders and persons with disabilities. RTA local fares are $1.75 for regular passengers and $0.85 for the discounted categories, including persons with disabilities, seniors (65 to 79), Medicare cardholders and K-12 students.
• SoCo Transit offers a day pass at $3.00 for regular passengers and $1.50 discounted. However, the only day pass offered on RTA is a regional day pass at $5.50 for everyone. This would result in a very large increase in the cost of this fare instrument.
• The 31 day pass rate would increase from $37.00 to $47.00 for regular riders and $18.50 to $23.50 for discount riders.
• There is no existing discount for students on the SoCo local routes. As students make up a large proportion of SoCo ridership, providing the RTA fare of $0.85 would significantly reduce fare revenues, adding to the existing challenges with attaining minimum farebox return ratios.
Overall, providing a fare structure consistent with RTA would create significant problems within the South County transit program. Similar to the local Paso Robles fare structure, it is recommended that the fare structure within the Five Cities area remain appropriate for the ridership needs of the area.
TABLE 60: Comparison of SoCo Transit and RTA Fare Structure
SoCo Transit RTA 1-Zone
Regular $1.50 $1.75 Seniors 65-79, Disabled, Medicare Cardholders
$0.75 $0.85
Senior (80+)ADA CardholdersStudents (K–12) $1.50 $0.85
Regular $3.00 --Discount $1.50 --
Regional Day Pass AllRTA & SoCo 7-Day Pass All
RegularDiscount
20-Ride Pass AllRegular $37.00 $47.00
Discount $18.50 $23.50
$24.00
Day Pass
Single Boarding
Regional 31-Day Pass
31 Day Pass
$5.50
Free with VIP CardFree with ADA Card
$68.00$16.00
$34.00

San Luis Obispo South County Transit LSC Transportation Consultants, Inc. Short-Range Transit Plan Page 171
Chapter 15 SoCo Transit Short-Range Transit Plan
INTRODUCTION The following plan presents service enhancements, capital improvements, and management plan elements as well as marketing and financial strategies to enhance public transit services in the Five Cities region. It is based on a review of existing transit service and demand conditions, analysis of a wide range of alternatives and public input. This chapter presents the individual plan elements in brief based on the substantial discussions presented in previous chapters; the reader is encouraged to refer to previous chapters for additional background on the plan elements. The overall plan features are presented graphically in Figure 41. These service changes build upon the “base” of the existing services, which are planned to continue except as modified by the plan elements. Per the San Luis Obispo County 2040 Population, Housing and Employment Forecast (SLOCOG, 2011), the Five Cities area is forecast to increase by 0.5 percent per year from 2020 to 2025. The base transit ridership is assumed to increase at this rate of population growth. INSTITUTIONAL PLAN Incorporate the SoCo Transit Program into the RTA The SoCo Transit organization will be dissolved and functions incorporated into the Regional Transit Authority, through the adoption of an amended RTA Joint Powers Agreement. This will have the following benefits to the SoCo Transit programs and riders:
• Most importantly, it will address the existing issue regarding non-attainment of the Transportation Development Act’s (TDA) minimum farebox return ratio requirements. By “blending” the relatively low farebox return ratio of local service with the higher figures for regional services, the overall RTA program (with SoCo Transit included) will easily attain the regional ratio requirements. Absent this institutional change, the SoCo Transit program would be faced with a combination of (1) significant reductions in services, (2) significant increases in fares and/or (3) cuts in TDA revenues that can be spent on local services.
• It will reduce administrative costs associated with full separate management of the SoCo Transit program.
• It will provide substantial cost savings.
• It enhances opportunities for joint marketing campaigns.
It is important to note that proposals to date will create a separate SoCo Transit Committee, comprised of representatives of the City of Arroyo Grande, City of Grover Beach, City of Pismo Beach and County of San Luis Obispo. This will be the governance body for a separate SoCo Transit budget. This will continue to ensure that SoCo Transit services are under the guidance of Board members that have the best local knowledge of needs and conditions in the area.

LSC Transportation Consultants, Inc. San Luis Obispo South County Transit Page 172 Short-Range Transit Plan

San Luis Obispo South County Transit LSC Transportation Consultants, Inc. Short-Range Transit Plan Page 173
Incorporate the Avila-Pismo Trolley into the RTA South County Service While the Avila-Pismo Trolley originated as a limited service focusing solely on Avila Beach visitors, it has grown into an important element of the South County regional public transit network. Unlike when the Trolley service started, it now operates wholly within the Arroyo Grande-Grover Beach Urbanized Area (with the exception of the last two stops in Port San Luis). It also serves trips within the SoCo Transit service area along Price Street. The inclusion of the Avila Beach area population in unincorporated San Luis Obispo County helps to achieve Urbanized Area status, which makes the overall area eligible for Federal Transit Administration 5307 urban formula funds. As such, the Trolley route should be managed and funded as part of the overall SoCo Transit program. The current “service contract” funding agreement with San Luis Obispo County will be terminated, and instead the costs of this route allocated through the overall SoCo Transit funding agreement. This will allow all planning and operations to be under the management of the RTA’s SoCo Transit Committee. SERVICE PLAN Financially Constrained Operating Plan Shift Routes 27 and 28 to Serve the Neighborhood North of Ramona Garden Routes 27 and 28 will be revised to serve an additional neighborhood along 9th Street and Atlantic City Avenue north of Ramona Garden. This will provide new service within a convenient walking distance of an additional 1,300 residents, including many residents with a high potential of using transit services, such as residents of the Vista Pacific Apartments. Riders at the stops no longer served by Routes 27 and 28 will continue to be served by Routes 21 and 24, or be within a short walk of the new stops. This shift will result in a modest ($1,200 per year) savings in operating costs, as the routes would be slightly shorter than at present, and increase overall ridership by an estimated 4,600 boardings per year. While this will require the operation of one bus per hour in each direction on streets currently not carrying buses, the shift to smaller vehicles will tend to offset the impacts. Financially Unconstrained Operating Plan Serve Lopez Continuation High School
If new funding sources can be generated to cover operating subsidy needs, the schedules of the existing Route 27 and Route 28 tripper runs should be extended to provide service to Lopez Continuation High School on Mesa View Drive during school days. This would help to provide educational access to several elements of the school community. Approximately $29,000 in additional funding would need to be secured. Review Days of Avila-Pismo Trolley Service Visitation patterns to Avila Beach could shift in the future based on factors such as the growth in tourism and expanded activity outside of the traditional summer season. Trends should be monitored, and service plans modified to match ridership demands as warranted and as funding availability allows.

LSC Transportation Consultants, Inc. San Luis Obispo South County Transit Page 174 Short-Range Transit Plan
CAPITAL PLAN Operate SoCo Transit Routes with Smaller Vehicles Excepting Tripper Buses This planning study has identified that the four SoCo Transit routes can be operated using smaller vehicles on most runs, which can reduce operating and capital costs while also reducing noise and other neighborhood impacts. Accordingly, as larger vehicles warrant replacement new smaller low-floor cutaway vehicles (with a capacity of approximately 20 seated passengers as well as two wheelchair positions) will be purchased. While a specific manufacturer and vehicle model is yet to be identified, it will ultimately be a low-floor model with easier passenger movement and driver space than the cutaway currently being used on Route 21. In 2020 (when existing vehicles 201 and 204 warrant replacement), smaller vehicles will be implemented on Routes 27 and 28. After several months, staff will survey the passengers and review operating results (such as on-time performance) to determine if an overall benefit to the transit program has occurred. If so, vehicles 1011 and 1012 will be replaced with smaller vehicles for conversion of Routes 21 and 24 in 2022. This will still provide four 35-foot buses (Gilligs) in the SoCo Transit fleet for tripper use. The tripper runs will continue to be operated using larger buses to accommodate the larger passenger loads. In addition, there are some specific runs (such as for school trips) that are known in advance and will be operated using larger buses. This strategy will reduce operating costs by an estimated $46,700, over all four routes. Replacing the larger buses with less expensive smaller cutaways will also reduce total initial capital costs by approximately $1.2 Million. Vehicle Replacement Plan Reflecting the use of smaller vehicles where appropriate, the following SoCo Transit replacement vehicles will be purchased over the five-year SRTP planning period:
• Two 35-foot Gillig buses (201 and 204) will be replaced by low-floor cutaway vehicles in FY 2020-21.
• Assuming the smaller vehicles are found to be satisfactory, two 35-foot Thor buses will be replaced by low-floor cutaway vehicles in FY 2022-23.
• Two Dodge Grand Caravan minivans will require replacement in 2024-25.
At the current unit costs of $50,000 for a minivan and $150,000 for a low-floor cutaway bus (with farebox and other equipment), and assuming a 3 percent annual rate of inflation in capital costs, these vehicle purchases will require an estimated $752,700 over the five-year plan period. Note that these costs assume standard fossil fuels, pending the results of a comprehensive zero emission vehicle readiness plan for the region.
San Luis Obispo South County Transit LSC Transportation Consultants, Inc. Short-Range Transit Plan Page 175
Zero Emission Vehicles The California Air Resource Board’s (CARB) “Transit Fleet Rule” requires that all public transit fleets in the state ultimately use only Zero Emission Bus (ZEB) vehicles. ZEB technologies consist of Battery Electric Buses (BEBs) and hydrogen fuel cell buses. With limited exceptions, beginning on January 1, 2026, 25 percent of all new bus purchases must be ZEB and beginning on January 1, 2029 all transit fleet new bus purchases must be ZEBs. A transition rollout plan is required to be completed by 2023, which considers technology, vehicles and charging/fueling options. As SoCo Transit and Dial-a-Ride services will be provided using a combined overall RTA fleet, this issue will be addressed at the broader RTA level rather than for the SoCo Transit system alone. Bus Stop Improvements The quality of passenger amenities is important in the convenience and safety of a public transit trip, and can “make or break” an individual’s decision on using transit services. The following bus stop improvements are included in this plan:
Shelters: Grand Avenue & 16th Street, Highway 1 and 21st Street, Grand Avenue & 13th Street, Dolliver Avenue & Pomeroy Avenue, Highway 1 & 25th Street, Grand Avenue & Elm Street. Benches: Dolliver Avenue & Hinds Avenue, Shell Beach Road & Seacliff Drive Concrete Wheelchair Pad: Oceano Airport. In addition, San Luis Obispo County is encouraged to provide sidewalks along Air Park Drive to connect this stop with nearby residences.
Funding for stop improvements are included in this plan, equal to the existing FY 2019/20 funding level ($45,590) increasing by 3 percent per year for inflation.
Premium Outlets Transfer Center Improvements
While improvements are best accomplished through comprehensive RTA plans, a westbound bus stop for northbound Route 10 on the northeast side of Five Cities Drive (opposite the existing bus bays) would benefit SoCo Transit passengers and operations by improving the reliability of connections at this key location. Bus Parking Facility Improvements Pavement conditions at the SoCo Transit bus operations facility on Rodeo Drive in Arroyo Grande are in adequate but deteriorating condition. The plan includes $200,000 for repaving the parking lot and access drives at this facility. In addition, transit management staff should investigate the provision of secured parking in the Nipomo area for the two vehicles used for the Nipomo Dial-a-Ride service. Specifically, other public entities (such as the County or School District) should be contacted to see if there are opportunities available to establish secure overnight parking (with 24-hour staff access) at little or no cost to the transit program.
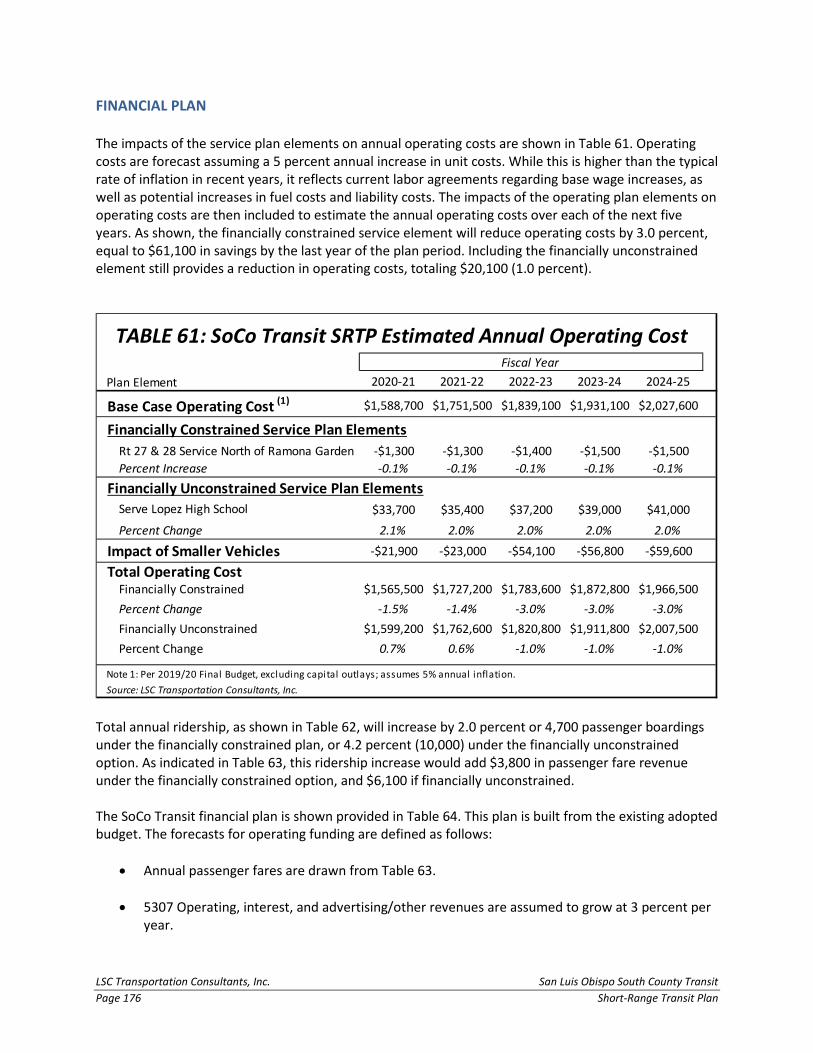
LSC Transportation Consultants, Inc. San Luis Obispo South County Transit Page 176 Short-Range Transit Plan
FINANCIAL PLAN The impacts of the service plan elements on annual operating costs are shown in Table 61. Operating costs are forecast assuming a 5 percent annual increase in unit costs. While this is higher than the typical rate of inflation in recent years, it reflects current labor agreements regarding base wage increases, as well as potential increases in fuel costs and liability costs. The impacts of the operating plan elements on operating costs are then included to estimate the annual operating costs over each of the next five years. As shown, the financially constrained service element will reduce operating costs by 3.0 percent, equal to $61,100 in savings by the last year of the plan period. Including the financially unconstrained element still provides a reduction in operating costs, totaling $20,100 (1.0 percent).
Total annual ridership, as shown in Table 62, will increase by 2.0 percent or 4,700 passenger boardings under the financially constrained plan, or 4.2 percent (10,000) under the financially unconstrained option. As indicated in Table 63, this ridership increase would add $3,800 in passenger fare revenue under the financially constrained option, and $6,100 if financially unconstrained. The SoCo Transit financial plan is shown provided in Table 64. This plan is built from the existing adopted budget. The forecasts for operating funding are defined as follows:
• Annual passenger fares are drawn from Table 63.
• 5307 Operating, interest, and advertising/other revenues are assumed to grow at 3 percent per year.
Plan Element 2020-21 2021-22 2022-23 2023-24 2024-25
Base Case Operating Cost (1) $1,588,700 $1,751,500 $1,839,100 $1,931,100 $2,027,600
Financially Constrained Service Plan ElementsRt 27 & 28 Service North of Ramona Garden -$1,300 -$1,300 -$1,400 -$1,500 -$1,500Percent Increase -0.1% -0.1% -0.1% -0.1% -0.1%
Financially Unconstrained Service Plan ElementsServe Lopez High School $33,700 $35,400 $37,200 $39,000 $41,000Percent Change 2.1% 2.0% 2.0% 2.0% 2.0%
Impact of Smaller Vehicles -$21,900 -$23,000 -$54,100 -$56,800 -$59,600
Total Operating CostFinancially Constrained $1,565,500 $1,727,200 $1,783,600 $1,872,800 $1,966,500Percent Change -1.5% -1.4% -3.0% -3.0% -3.0%Financially Unconstrained $1,599,200 $1,762,600 $1,820,800 $1,911,800 $2,007,500Percent Change 0.7% 0.6% -1.0% -1.0% -1.0%
Note 1: Per 2019/20 Final Budget, excluding capital outlays; assumes 5% annual inflation.Source: LSC Transportation Consultants, Inc.
Fiscal Year
TABLE 61: SoCo Transit SRTP Estimated Annual Operating Cost

San Luis Obispo South County Transit LSC Transportation Consultants, Inc. Short-Range Transit Plan Page 177
TABLE 62: SoCo Transit SRTP Estimated Annual Ridership
Plan Element 2020-21 2021-22 2022-23 2023-24 2024-25
Base Case (1)
SoCo Transit 221,600 222,700 223,800 224,900 226,100Avila Trolley 9,200 9,300 9,300 9,400 9,400Total 230,800 232,000 233,100 234,300 235,500
Financially Constrained Service Plan ElementsRt 27 & 28 Service North of Ramona Garden 3,100 4,600 4,700 4,700 4,700Percent Increase 1.3% 2.0% 2.0% 2.0% 2.0%
Financially Unconstrained Service Plan ElementsServe Lopez High School 3,700 3,700 3,800 3,800 3,800Percent Increase 1.6% 1.6% 1.6% 1.6% 1.6%
Total RidershipFinancially Constrained 233,900 236,600 237,800 239,000 240,200Financially Unconstrained 237,600 240,300 241,600 242,800 244,000
Note 1: Base case ridership assumed to grow at the pace of population growth (0.5% annually).Source: LSC Transportation Consultants, Inc.
Fiscal Year
Plan Element 2020-21 2021-22 2022-23 2023-24 2024-25
Base Case (1)
SoCo Transit $153,500 $154,300 $155,100 $155,800 $156,600Avila Trolley $8,800 $8,900 $8,900 $9,000 $9,000Total $162,300 $163,200 $164,000 $164,800 $165,600
Financially Constrained Service Plan ElementsRt 27 & 28 Service North of Ramona Garden $2,500 $3,700 $3,800 $3,800 $3,800
Financially Unconstrained Service Plan ElementsServe Lopez High School $3,100 $3,100 $3,100 $3,200 $3,200
TotalFinancially Constrained $164,800 $166,900 $167,800 $168,600 $169,400Percent Increase 1.5% 2.3% 2.3% 2.3% 2.3%Financially Unconstrained $167,900 $170,000 $170,900 $171,800 $172,600Percent Increase 3.5% 4.2% 4.2% 4.2% 4.2%
Note 1: Base case ridership assumed to grow at the pace of population growth (0.5% annually).Source: LSC Transportation Consultants, Inc.
Fiscal Year
TABLE 63: SoCo Transit SRTP Estimated Annual Farebox Revenues

LSC Transportation Consultants, Inc. San Luis Obispo South County Transit Page 178 Short-Range Transit Plan
• The Low Carbon Transit Grant program ends after Fiscal Year 2020-21.
• The existing San Luis Obispo County operating funds for the Avila Trolley are assumed to be eliminated, as this service is folded into the SoCo Transit program.
• The remaining funding requirements will be met by Local Transportation Funds (LTF). In total,
these funds will need to increase by $577,000 per year, driven by the end of the Low Carbon Transit Grant program, the loss of separate County trolley funding and the effects of inflation. This is equal to a 127 percent increase in LTF funding. This total LTF requirement is allocated to the individual jurisdictions based on the proportion of population, per the SoCo Transit joint powers agreement. Note that the current proportions are applied over the plan period, though these proportions may change based upon 2020 Census results.
TABLE 64: SoCo Transit SRTP Financial Plan -- Financially Constrained
2020-21 2021-22 2022-23 2023-24 2024-25
OPERATING ELEMENTSBase Case Costs $1,588,700 $1,668,100 $1,751,500 $1,839,100 $1,931,000Operating Plan Elements (From Table 61) ($23,200) ($24,300) ($55,500) ($58,300) ($61,100)
Total Operating Costs $1,565,500 $1,643,800 $1,696,000 $1,780,800 $1,869,900Operating Revenues1
Passenger Fares (From Table 63) $164,800 $166,900 $167,800 $168,600 $169,400Low Carbon Transit Grant $309,000 $0 $0 $0 $0FTA 5307 Operating $575,900 $593,200 $611,000 $629,300 $648,200SLO County Trolley Operations $0 $0 $0 $0 $0Advertising & Other $5,200 $5,400 $5,600 $5,800 $6,000Local Transportation Funds- Arroyo Grande $189,100 $328,600 $341,100 $365,900 $392,000- Grover Beach $144,300 $250,800 $260,300 $279,200 $299,200- Pismo Beach $84,600 $147,000 $152,600 $163,700 $175,400- SLO County $79,600 $138,400 $143,600 $154,000 $165,100- Subtotal $497,500 $864,800 $897,700 $962,800 $1,031,600Interest $13,100 $13,500 $13,900 $14,300 $14,700TOTAL $1,565,500 $1,643,800 $1,696,000 $1,780,800 $1,869,900
Balance $0 $0 $0 $0 $0
CAPITAL ELEMENTS TotalCapital Costs (From Table 64) $356,000 $48,400 $577,600 $51,300 $168,800 $1,202,100Capital Revenues
FTA 5307 Capital(2) $247,200 $0 $262,240 $0 $92,720 $602,160
FTA 5339 Capital(2) $37,600 $38,720 $199,840 $41,040 $42,320 $359,520STA (Local Match) $71,200 $9,680 $115,520 $10,260 $33,760 $240,420Total Capital Revenues $356,000 $48,400 $577,600 $51,300 $168,800 $1,202,100
Balance $0 $0 $0 $0 $0
Note 1: 2019-20 figures based upon adopted budget.Note 2: 80 percent Federal / 20 percent local match.Note 3: The Low Carbon Transit Grant discontinues after FY 2020-21
Source: LSC Transportation Consultants, Inc.
Fiscal Year

San Luis Obispo South County Transit LSC Transportation Consultants, Inc. Short-Range Transit Plan Page 179
Total forecast capital costs are shown in Table 65. As indicated, the capital improvements total $1,202,100 over the coming five years (assuming a 3 percent annual inflation rate for capital items). Funding for capital improvements is expected to be provided as follows:
• Federal Transit Administration (FTA) Section 5307 Urbanized Area Formula Program funds are used to fund 80 percent of the vehicle purchase costs.
• FTA 5339 Bus and Bus Facility funds (administered through the Caltrans Division of Rail and
Mass Transportation) are used to fund 80 percent of the facility improvement costs.
• State Transit Assistance (STA) funds are used as the 20 percent local match for the FTA funding.
These funding sources will provide a balanced capital budget.
CONCLUSION In sum, this plan will increase ridership modestly (2.0 to 4.2 percent), while yielding a net reduction in annual operating costs (0.4 to 3.0 percent). It will provide the Trolley with a permanent source of funding, and result in important capital improvements. Finally, this plan will provide the basis for full integration of the SoCo Transit program into the Regional Transit Authority.
TABLE 65: SoCo Transit Short Range Capital PlanFY 2019-20
Plan Element Unit Cost 2020-21 2021-22 2022-23 2023-24 2024-25
Vehicle PurchasesNumber of Buses -- Replacement Minivan $50,000 0 0 0 0 2 2 Cutaway $150,000 2 0 2 0 0 4Total Cost (1) $309,000 $0 $327,800 $0 $115,900 $752,700
Bus Stop Improvement Program $47,000 $48,400 $49,800 $51,300 $52,900 $249,400
Bus Operations Facility Paving $0 $0 $200,000 $0 $0 $200,000
Total Capital Plan Elements $356,000 $48,400 $577,600 $51,300 $168,800 $1,202,100
Source: LSC Transportation Consultants, Inc.
5-Year Plan Total
Fiscal Year
Note 1: All costs include 3 percent annual inflation.

LSC Transportation Consultants, Inc. San Luis Obispo South County Transit Page 180 Short-Range Transit Plan
This page intentionally left blank.
San Luis Obispo South County Transit LSC Transportation Consultants, Inc. Short-Range Transit Plan Page 181
Chapter 16 Dial-A-Ride Short-Range Transit Plan
This chapter presents the plan for service enhancements, capital improvements, management elements and financial strategies to support and improve the various Dial-A-Ride programs, building from the data and analyses presented in previous chapters. The reader is encouraged to refer to previous chapters for additional background on the plan elements. The overall plan features are presented graphically in Figure 42. These service changes build upon the “base” of the existing services, which are planned to continue except as modified by the plan elements. Per the San Luis Obispo County 2040 Population, Housing and Employment Forecast (SLOCOG, 2011), the rural areas of San Luis Obispo County are forecast to increase by 0.9 percent per year from 2020 to 2025. The base transit ridership is assumed to increase at this rate of population growth. SERVICE PLAN Expand Nipomo Dial-a-Ride Service Area The existing Nipomo Dial-a-Ride service area will be extended westward approximately 1 to 1.5 miles from the existing western boundary (as far west as Via Conchina Road) to the Highway 1 alignment. This area includes the Trilogy development as well as other nearby residential areas. The analysis of existing ridership and service patterns for the Nipomo Dial-a-Ride indicates that there are substantial periods (outside of the school bell times) when there are available resources to expand service. A review of existing capacity indicates that service to this area can be provided without adding additional drivers or vehicles (while further expansion to other area would trigger increased service levels). While this will increase the mileage operated (and thus costs), it will make better use of the existing resources and serve more residents of the area. Provide Nipomo – Santa Maria Medical Trips On a demonstration basis, the Nipomo Dial-a-Ride program will be expanded to include two-days-a-week service to medical destinations in Santa Maria on Tuesdays and Thursdays. Two runs a day (mid-morning and mid-afternoon) will be offered on a reservation basis (with a minimum of 2 days advance reservation). Marketing efforts will be made to make Nipomo area residents aware of the service. Ridership, costs and the ability to provide these trips using existing drivers/vehicles (or the need to provide additional service) will be monitored for a minimum of 6 months. This service will fill an existing need for door-to-door service across the county line for persons who cannot use the fixed route service. A fare of $5.00 per one-way trip will be charged, which is slightly higher than with the Senior Go! fare for a trip of similar length. Continue to Monitor Nipomo Dial-a-Ride Service Levels The demand for Nipomo Dial-a-Ride service can vary substantially by day, by season, and over successive years. Changes in factors such as school and summer student programs can impact service. RTA should continue to review ridership demands and tailor the level of service (number of vehicles in operation) to maximize the efficiency of this service.

LSC Transportation Consultants, Inc. San Luis Obispo South County Transit Page 182 Short-Range Transit Plan

San Luis Obispo South County Transit LSC Transportation Consultants, Inc. Short-Range Transit Plan Page 183
Eliminate Nipomo Dial-a-Ride Pickups After 5 PM The hours of the Nipomo Dial-a-Ride service, which currently ends at 6:30 PM, will be reduced to stop picking up new passengers after 5:00 PM (though passengers picked up before 5:00 PM will be transported home). A review of ridership data indicates that only an average of 1.4 passengers per day board after 5:00 PM (or 1.5 percent of all riders), and keeping the drivers on the clock for later pick-ups increases annual operating costs by $9,600 per year. Consider Route 9 Service to Eastern Templeton as Part of Next RTA SRTP or North County Corridor Plan The revision of RTA Route 9 to serve the eastern portion of Templeton (including South Main Street between Templeton Road and 1st Street) has the potential to expand Route 9 ridership and expand service to new residential areas, schools and businesses. Overall, a ridership increase of 4,500 per year would be provided, while operating costs would be increased by an estimated $48,100. As the additional running time also has the potential to impact transfer opportunities elsewhere along the route, this option should be considered as part of a future larger RTA study encompassing the entire route. CAPITAL PLAN Replacement Vehicles As detailed in Table 56, above, a total of three Dial-a-Ride cutaway buses will require replacement over the coming five years: two Braun Entravans in 2020-21 and one Starcraft in 2022-23. These vehicles will be replaced with vehicles of similar size. While a larger bus for Nipomo Dial-a-Ride school trips would allow additional ridership (and reduce the waiting list), it would not be appropriate for the remainder of the service day. INSTITUTIONAL PLAN Pursue Provision of Templeton Dial-a-Ride Service by City of Atascadero RTA should lead discussions with San Luis Obispo County and the City of Atascadero for the City to serve the modest (167 per year, or only an average of 3.2 one-way passenger-trips per week) trips on the Templeton Dial-a-Ride service. The City has recently expanded service to Templeton for Atascadero resident trips and has the potential to serve these passengers for less than the $5,800 per year currently incurred by RTA. Management, monitoring and billing procedures would need to be addressed. FINANCIAL PLAN Pursue Grant Funding to Provide Nipomo Dial-a-Ride / RTA Fixed Route Day Pass At present, Nipomo residents not living near the few Route 10 stops must pay separate fares for Nipomo Dial-a-Ride and RTA fixed route service. As a result, a relatively short trip to and from Santa Maria can cost $9.00 ($2.25 per one-way trip on Nipomo Dial-a-Ride plus $2.25 per one-way trip in RTA) for general public and $5.70 ($1.75 and $1.10, times two) for seniors age 65 to 79 and persons with disabilities. A Day Pass is good for a single round-trip on Nipomo Dial-a-Ride as well as unlimited regional

LSC Transportation Consultants, Inc. San Luis Obispo South County Transit Page 184 Short-Range Transit Plan
fixed route service would aid Nipomo residents in reaching destinations in other communities, such as for medical, recreational, shopping or cultural purposes. A reasonable cost for this Day Pass (considering existing single fares and Day Pass options) would be $7.00 for the general public and $3.50 for seniors and persons with disabilities. Specific costs and ridership impacts of this strategy would need to be based on passenger surveys, but are expected to be modest. This would be a good opportunity for grant programs (such as Area Agency on Aging) focused on senior and/or disabled resident mobility needs. Planned Funding Sources Forecast Dial-a-Ride service annual operating costs under this plan are shown in Table 66. This reflects the cost impacts of the service plan elements, the existing base FY 2020-21 budgeted operating costs, and includes a 5 percent per year inflation factor. The expansion of the Nipomo Dial-a-Ride area as well as the medical transportation service to Santa Maria is assumed to be implemented in July of 2020. As it takes time for a new service to reach full ridership potential, two-thirds of the full potential ridership is assumed for the first year (based on studies of ridership impacts typically seen for new services). As modifications to existing Dial-a-Ride service, the marginal costs of these services correspond to the level of ridership. To reflect this, the operating cost impacts in the first year are also factored by two-thirds.
As indicated, the plan elements are forecast to increase operating costs by $25,900 per year by the end of the five-year plan period, or 4.1 percent above the base case costs. Including the impacts of inflation, total annual operating costs for the Dial-a-Ride services are forecast to increase to $650,100. Annual ridership forecasts, as presented in Table 67, include a modest 0.9 percent per year growth in base ridership (reflecting the forecasts in annual population for unincorporated San Luis Obispo County) as well as the ridership generated by the service plan elements. This total service plan element ridership increase (950 per year) is equal to a 5.1 percent increase over current Dial-a-Ride ridership.
Plan Element 2020-21 2021-22 2022-23 2023-24 2024-25
Base Case Operating Cost (1) $513,500 $539,200 $566,200 $594,500 $624,200
Service Plan ElementsExpand Nipomo DAR Service Area(2) $3,300 $5,200 $5,400 $5,700 $6,000Nipomo-Santa Maria Medical Trips(2) $17,000 $27,000 $28,400 $29,800 $31,300Eliminate Nipomo DAR Service After 5 PM -$9,400 -$9,900 -$10,400 -$10,900 -$11,400Subtotal $10,900 $22,300 $23,400 $24,600 $25,900Percent Increase 2.1% 4.1% 4.1% 4.1% 4.1%
Total Operating Cost $524,400 $561,500 $589,600 $619,100 $650,100
Note 2: Assumes 2/3 of full ridership potential in first year, with corresponding cost impact.Source: LSC Transportation Consultants, Inc.
Note 1: Per 2019/20 Final Budget, excluding capital outlays and Avila Trolley, Special Transit costs; assumes 5% annual inflation.
Fiscal Year
TABLE 66: Dial-a-Ride SRTP Estimated Annual Operating Cost

San Luis Obispo South County Transit LSC Transportation Consultants, Inc. Short-Range Transit Plan Page 185
The financial plan for operating elements is presented in the top of Table 68. Total operating revenues are defined as follows:
• Fare revenues are estimated based on the growth in base ridership as well as the fares generated by the expanded services. Between both factors, fare revenues will increase by $3,270 per year.
• State Transit Assistance Funds is assumed to equal the currently budgeted amount for FY 2020-21 ($206,000), increasing by the rate of inflation.
• The balance of required funding is assumed to consist of Local Transportation Funds provided
through San Luis Obispo County for the Nipomo and Shandon/Templeton services, and the City of Paso Robles for the Paso Robles Dial-a-Ride. These funds range from $266,020 in the first year of the plan to $341,270 in the fifth year, largely due to the impacts of inflation.
Capital costs for the Dial-a-Ride services are generated by the replacement of three vehicles, with a total estimated cost of $472,900. Approximately 80 percent of these funds are defined to come from the Federal Transit Administration 5339 Bus and Bus Facilities program (administered by Caltrans), while local match funds will come from State Transit Assistance funds.
TABLE 67: Dial-a-Ride SRTP Estimated Annual Ridership
Plan Element 2020-21 2021-22 2022-23 2023-24 2024-25
Base Case (1)
Nipomo Dial-a-Ride 15,544 15,700 15,800 16,000 16,100Shandon Dial-a-Ride 2 2 2 2 2Templeton Dial-a-Ride 168 170 170 170 170Paso Robles Dial-a-Ride 2,875 2,900 2,930 2,950 2,980Total 18,589 18,772 18,902 19,122 19,252
Service Plan ElementsExpand Nipomo DAR Service Area(2) 400 600 600 600 600Nipomo-Santa Maria Medical Trips(2) 460 700 700 700 700Eliminate Nipomo DAR Service After 5 PM -350 -350 -350 -350 -350Subtotal 510 950 950 950 950
Total Ridership 19,099 19,722 19,852 20,072 20,202Percent Increase 2.7% 5.1% 5.0% 5.0% 4.9%
Note 1: Base case ridership assumed to grow at the pace of population growth (0.5% annually).Source: LSC Transportation Consultants, Inc.
Fiscal Year

LSC Transportation Consultants, Inc. San Luis Obispo South County Transit Page 186 Short-Range Transit Plan
CONCLUSION This plan will expand the overall benefits of the Nipomo Dial-a-Ride service to Nipomo area residents, including new service areas and mobility options to medical services, while improving the effectiveness of the remaining services. It also continues existing services to other areas of unincorporated San Luis Obispo County, and allows for replacement of vehicles as needed to ensure the sustainability of the services.
TABLE 68: Dial-a-Ride SRTP Financial Plan
2020-21 2021-22 2022-23 2023-24 2024-25
OPERATING ELEMENTSOperating CostsBase Case Costs $513,500 $539,200 $566,200 $594,500 $624,200Operating Plan Elements (From Table 66) $10,900 $22,300 $23,400 $24,600 $25,900
Total Operating Costs $524,400 $561,500 $589,600 $619,100 $650,100Operating Revenues1
Passenger Fares- Base $50,440 $50,890 $51,810 $53,220 $55,160- Expanded Nipomo DAR Service Area $260 $400 $400 $400 $400- Nipomo-Santa Maria Medical Svc $2,310 $3,500 $3,500 $3,500 $3,500- End Nipomo DAR Pickups After 5 PM ($630) ($630) ($630) ($630) ($630)- Subtotal $52,380 $54,160 $55,080 $56,490 $58,430Local Transportation Funds $266,020 $291,040 $307,420 $324,110 $341,270STA (Including SB1) $206,000 $216,300 $227,100 $238,500 $250,400TOTAL $524,400 $561,500 $589,600 $619,100 $650,100
Balance $0 $0 $0 $0 $0
CAPITAL ELEMENTSCapital Costs
Vehicle Replacement TotalNumber of Cutaways 2 0 1 0 0 3Total Cost $309,000 $0 $163,900 $0 $0 $472,900
Capital RevenuesFTA 5339 Capital(2) $247,200 $0 $131,100 $0 $0 $378,300STA (Local Match) $61,800 $0 $32,800 $0 $0 $94,600Total Capital Revenues $309,000 $0 $163,900 $0 $0 $472,900
Balance $0 $0 $0 $0 $0
Note 1: 2019-20 figures based upon adopted budget.Note 2: 80 percent Federal / 20 percent local match.Source: LSC Transportation Consultants, Inc.
Fiscal Year
Related Documents