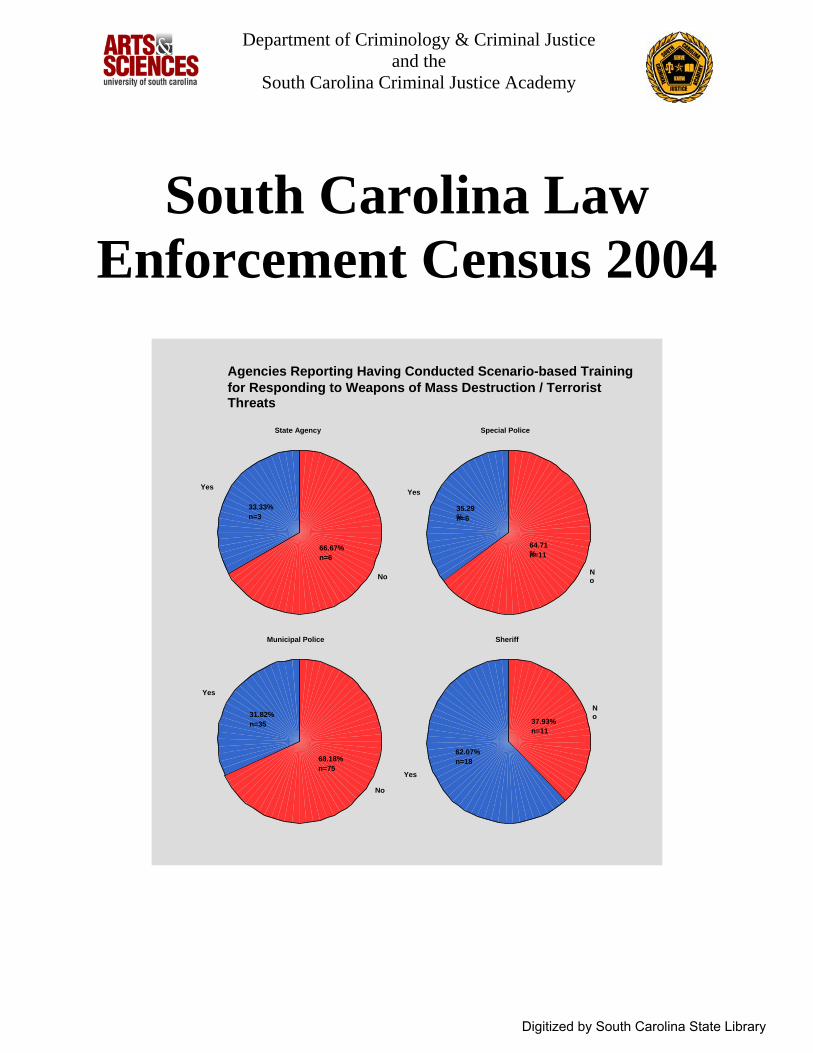
Department of Criminology & Criminal Justice and the South Carolina Criminal Justice Academy South Carolina Law Enforcement Census 2004 State Agency Special Police Municipal Police Sheriff No 66.67% n=6 Yes 33.33% n=3 N o 64.71 % n=11 Yes 35.29 % n=6 No 68.18% n=75 Yes 31.82% n=35 N o 37.93% n=11 Yes 62.07% n=18 Agencies Reporting Having Conducted Scenario-based Training for Responding to Weapons of Mass Destruction / Terrorist Threats Digitized by South Carolina State Library

Welcome message from author
This document is posted to help you gain knowledge. Please leave a comment to let me know what you think about it! Share it to your friends and learn new things together.
Transcript
Department of Criminology & Criminal Justice and the
South Carolina Criminal Justice Academy
South Carolina Law Enforcement Census 2004
State Agency Special Police
Municipal Police Sheriff
No
66.67%n=6
Yes 33.33% n=3
No
64.71%n=11
Yes
35.29%n=6
No
68.18%n=75
Yes 31.82% n=35
No 37.93%
n=11
Yes
62.07%n=18
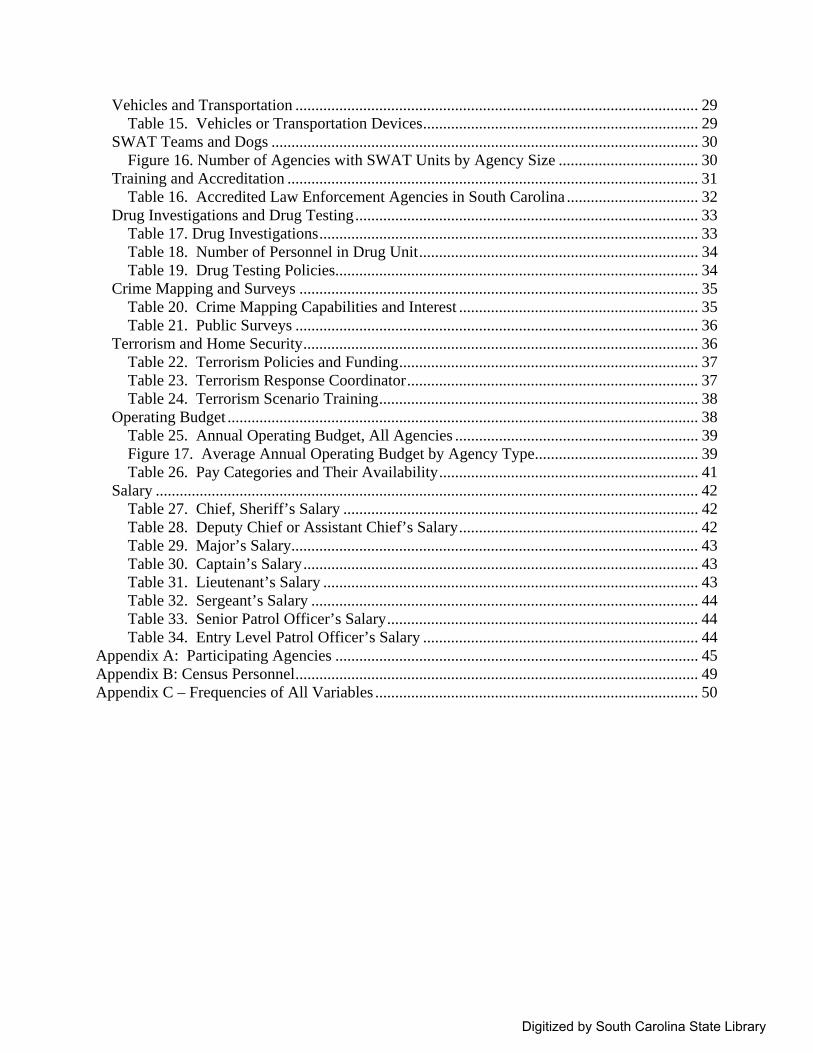
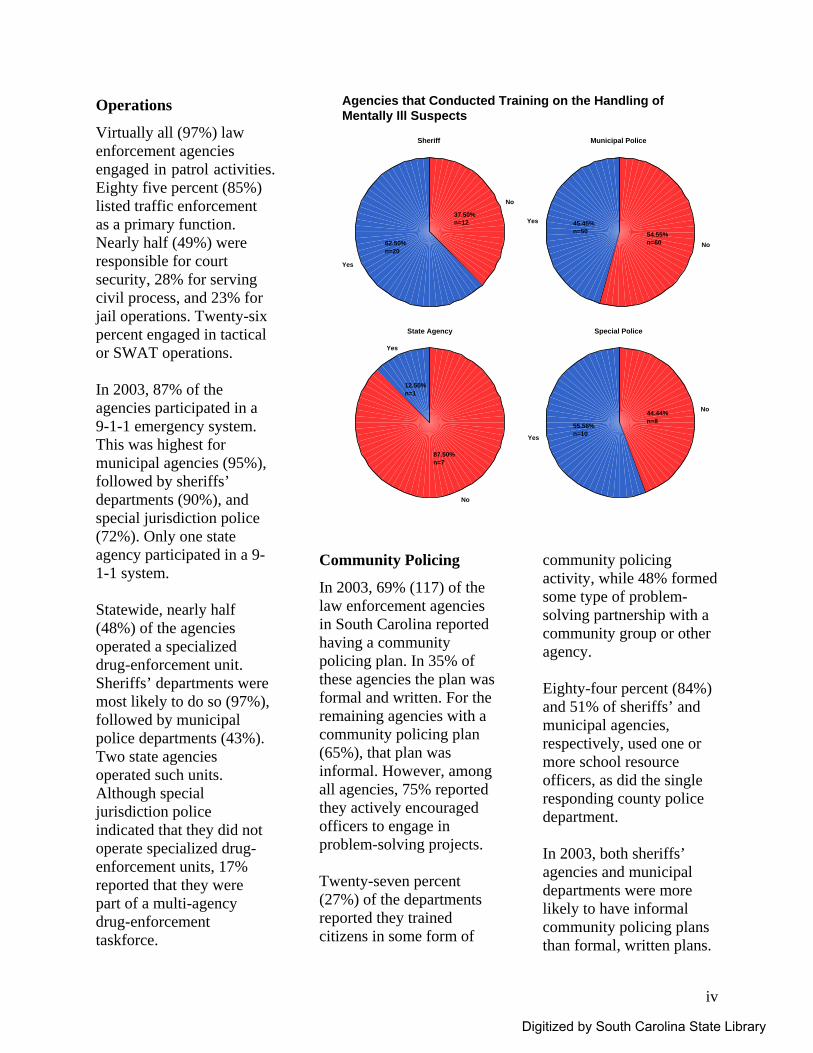
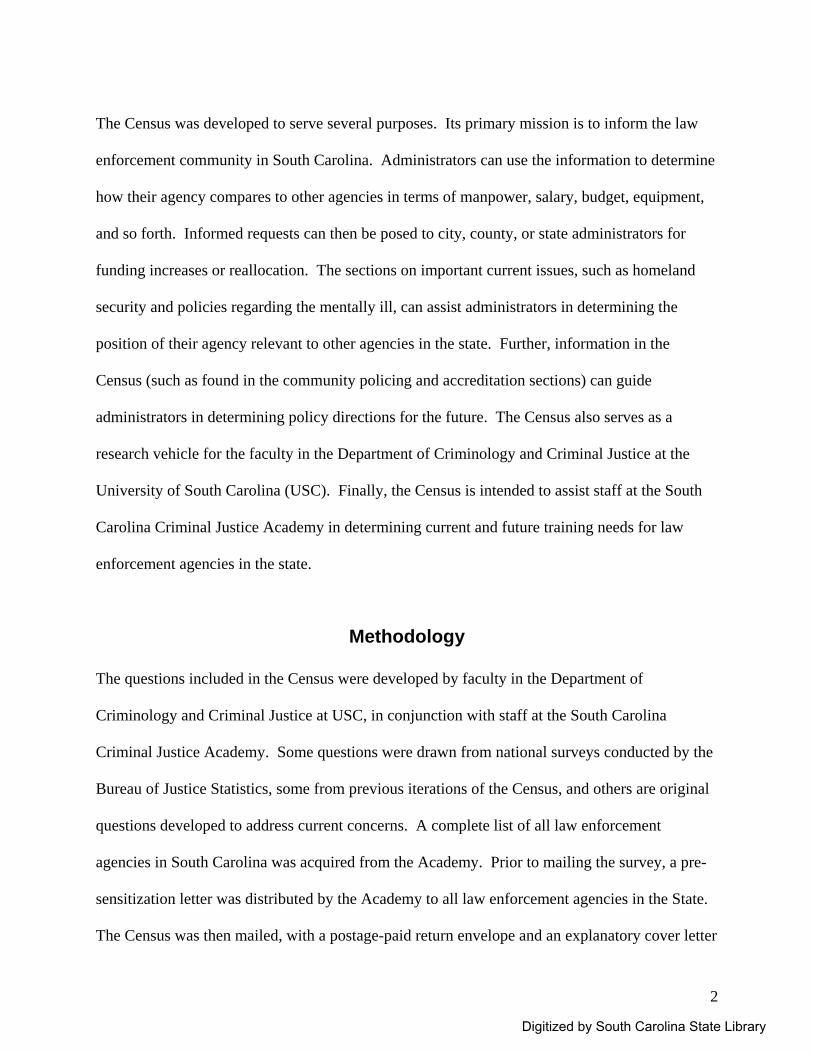
Agencies Reporting Having Conducted Scenario-based Training for Responding to Weapons of Mass Destruction / Terrorist Threats
Digitized by South Carolina State Library
South Carolina Law Enforcement Census 2004
A Collaborative Research Project Between the
Department of Criminology and Criminal Justice, University of South Carolina
and the
South Carolina Criminal Justice Academy
Robert J. Kaminski, Ph.D. Department of Criminology and Criminal Justice
University of South Carolina
William V. Pelfrey, Jr., Ph.D. Department of Criminal Justice
University of Wisconsin—Milwaukee
March, 2005
Digitized by South Carolina State Library
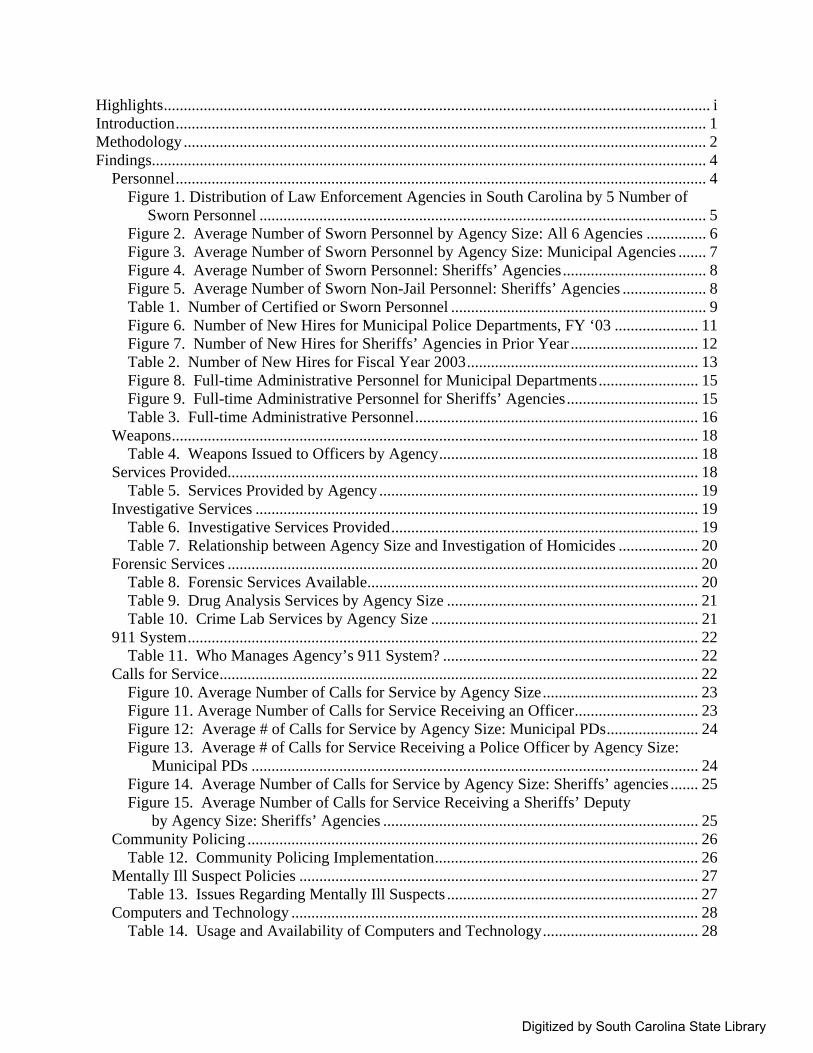
Highlights......................................................................................................................................... i Introduction..................................................................................................................................... 1 Methodology................................................................................................................................... 2 Findings........................................................................................................................................... 4
Personnel..................................................................................................................................... 4 Figure 1. Distribution of Law Enforcement Agencies in South Carolina by 5 Number of Sworn Personnel ................................................................................................................ 5 Figure 2. Average Number of Sworn Personnel by Agency Size: All 6 Agencies ............... 6 Figure 3. Average Number of Sworn Personnel by Agency Size: Municipal Agencies ....... 7 Figure 4. Average Number of Sworn Personnel: Sheriffs’ Agencies.................................... 8 Figure 5. Average Number of Sworn Non-Jail Personnel: Sheriffs’ Agencies ..................... 8 Table 1. Number of Certified or Sworn Personnel ................................................................ 9 Figure 6. Number of New Hires for Municipal Police Departments, FY ‘03 ..................... 11 Figure 7. Number of New Hires for Sheriffs’ Agencies in Prior Year ................................ 12 Table 2. Number of New Hires for Fiscal Year 2003.......................................................... 13 Figure 8. Full-time Administrative Personnel for Municipal Departments......................... 15 Figure 9. Full-time Administrative Personnel for Sheriffs’ Agencies................................. 15 Table 3. Full-time Administrative Personnel....................................................................... 16
Weapons.................................................................................................................................... 18 Table 4. Weapons Issued to Officers by Agency................................................................. 18
Services Provided...................................................................................................................... 18 Table 5. Services Provided by Agency ................................................................................ 19
Investigative Services ............................................................................................................... 19 Table 6. Investigative Services Provided............................................................................. 19 Table 7. Relationship between Agency Size and Investigation of Homicides .................... 20
Forensic Services ...................................................................................................................... 20 Table 8. Forensic Services Available................................................................................... 20 Table 9. Drug Analysis Services by Agency Size ............................................................... 21 Table 10. Crime Lab Services by Agency Size ................................................................... 21
911 System................................................................................................................................ 22 Table 11. Who Manages Agency’s 911 System? ................................................................ 22
Calls for Service........................................................................................................................ 22 Figure 10. Average Number of Calls for Service by Agency Size....................................... 23 Figure 11. Average Number of Calls for Service Receiving an Officer............................... 23 Figure 12: Average # of Calls for Service by Agency Size: Municipal PDs....................... 24 Figure 13. Average # of Calls for Service Receiving a Police Officer by Agency Size:
Municipal PDs ................................................................................................................ 24 Figure 14. Average Number of Calls for Service by Agency Size: Sheriffs’ agencies ....... 25 Figure 15. Average Number of Calls for Service Receiving a Sheriffs’ Deputy
by Agency Size: Sheriffs’ Agencies ............................................................................... 25 Community Policing ................................................................................................................. 26
Table 12. Community Policing Implementation.................................................................. 26 Mentally Ill Suspect Policies .................................................................................................... 27
Table 13. Issues Regarding Mentally Ill Suspects ............................................................... 27 Computers and Technology ...................................................................................................... 28
Table 14. Usage and Availability of Computers and Technology....................................... 28
Digitized by South Carolina State Library
Vehicles and Transportation ..................................................................................................... 29 Table 15. Vehicles or Transportation Devices..................................................................... 29
SWAT Teams and Dogs ........................................................................................................... 30 Figure 16. Number of Agencies with SWAT Units by Agency Size ................................... 30
Training and Accreditation ....................................................................................................... 31 Table 16. Accredited Law Enforcement Agencies in South Carolina ................................. 32
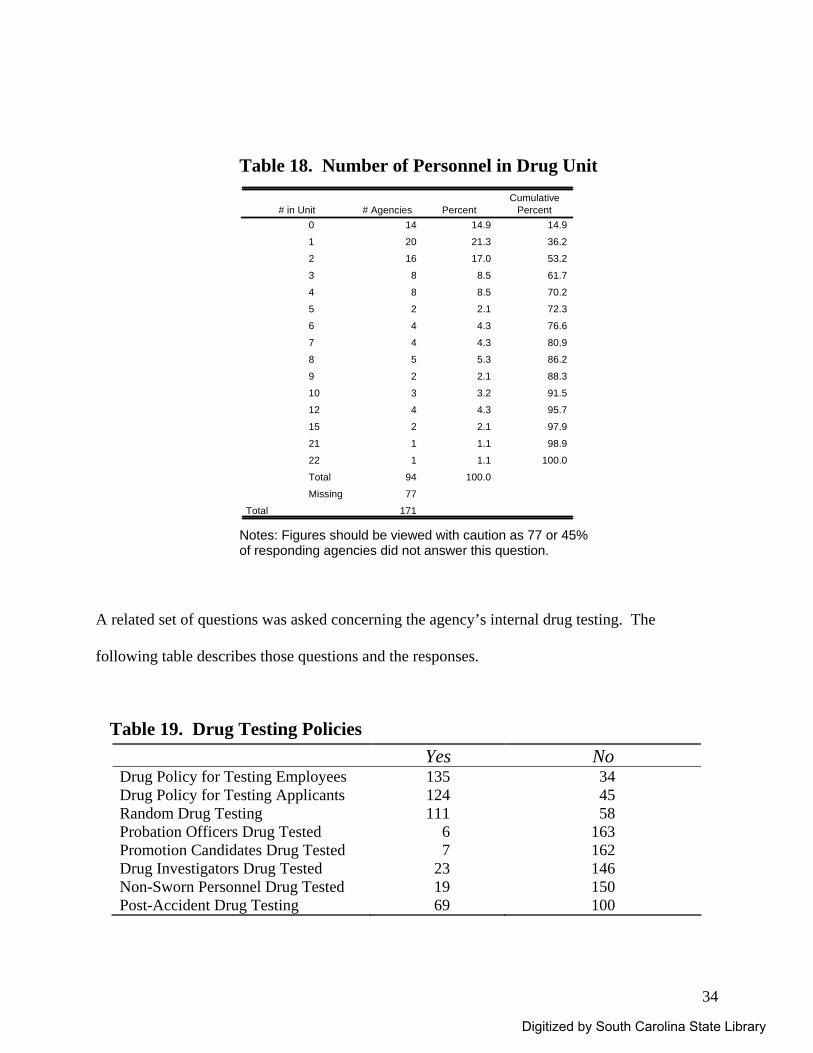
Drug Investigations and Drug Testing...................................................................................... 33 Table 17. Drug Investigations............................................................................................... 33 Table 18. Number of Personnel in Drug Unit...................................................................... 34 Table 19. Drug Testing Policies........................................................................................... 34
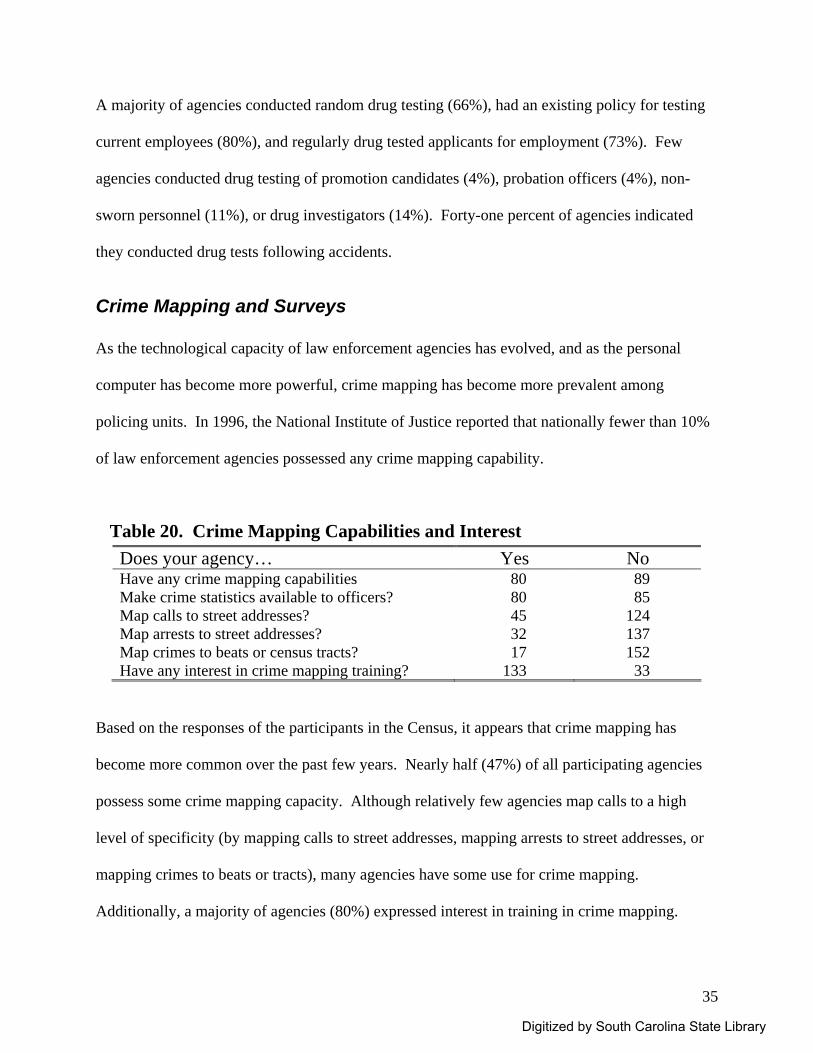
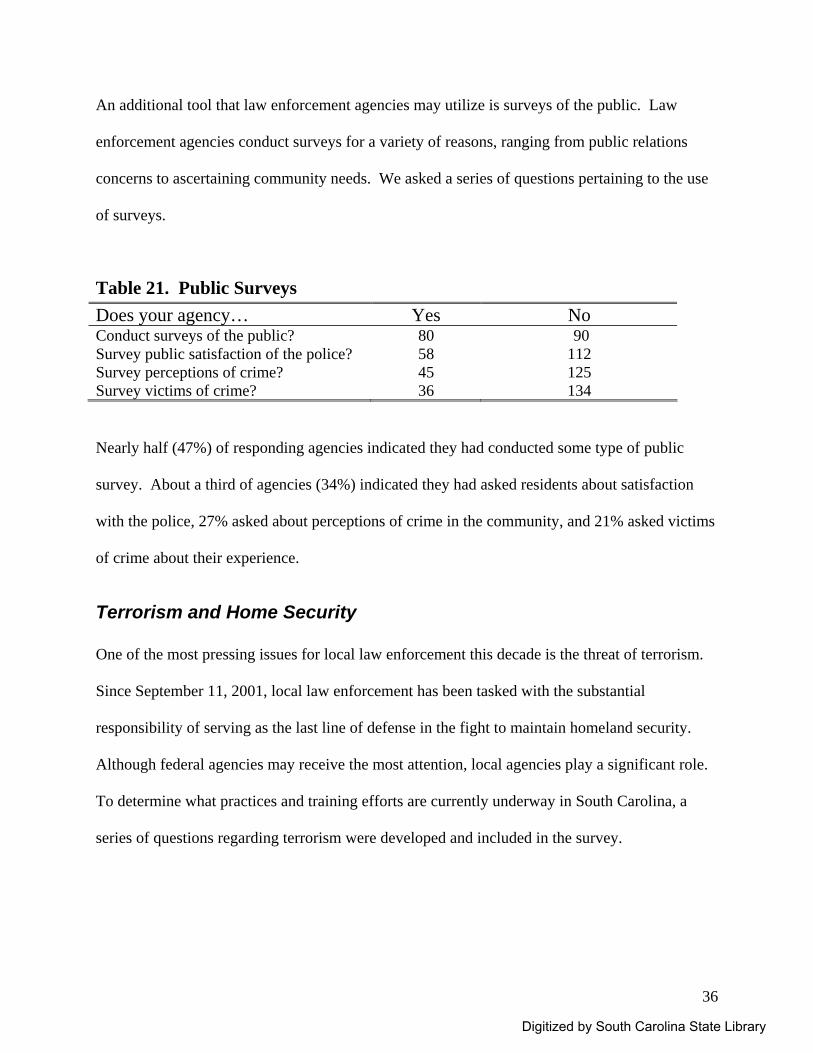
Crime Mapping and Surveys .................................................................................................... 35 Table 20. Crime Mapping Capabilities and Interest ............................................................ 35 Table 21. Public Surveys ..................................................................................................... 36
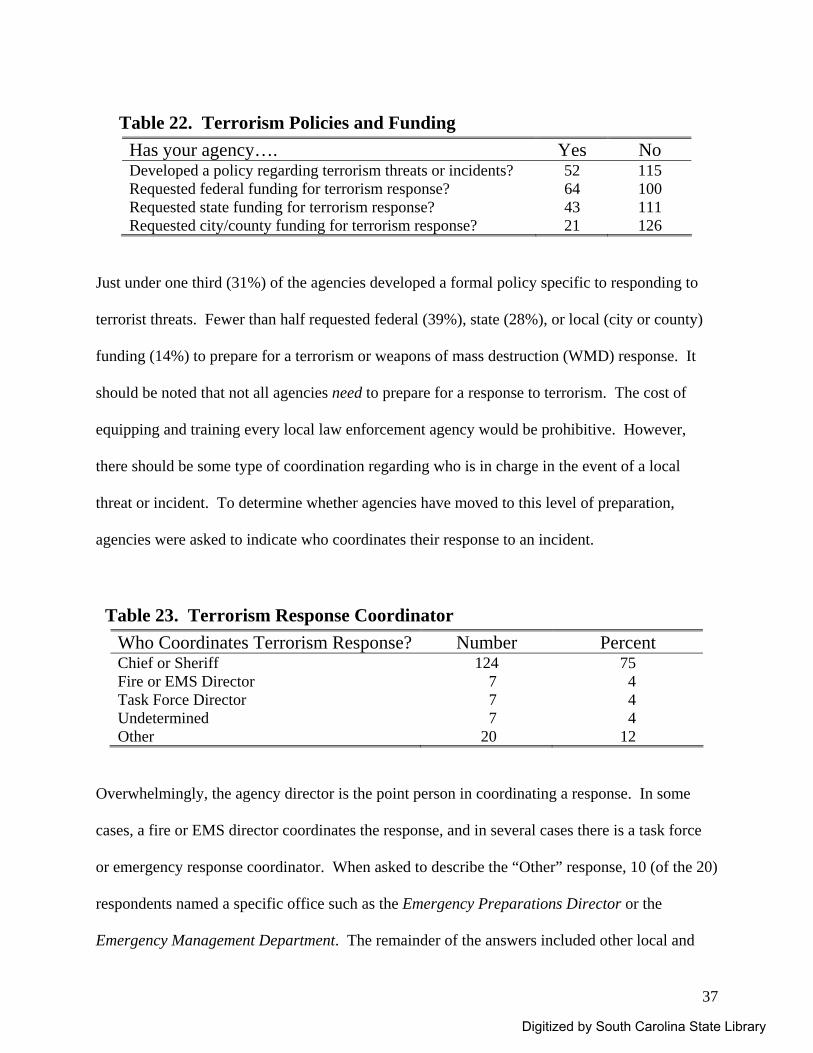
Terrorism and Home Security................................................................................................... 36 Table 22. Terrorism Policies and Funding........................................................................... 37 Table 23. Terrorism Response Coordinator......................................................................... 37 Table 24. Terrorism Scenario Training................................................................................ 38
Operating Budget ...................................................................................................................... 38 Table 25. Annual Operating Budget, All Agencies ............................................................. 39 Figure 17. Average Annual Operating Budget by Agency Type......................................... 39 Table 26. Pay Categories and Their Availability................................................................. 41
Salary ........................................................................................................................................ 42 Table 27. Chief, Sheriff’s Salary ......................................................................................... 42 Table 28. Deputy Chief or Assistant Chief’s Salary............................................................ 42 Table 29. Major’s Salary...................................................................................................... 43 Table 30. Captain’s Salary................................................................................................... 43 Table 31. Lieutenant’s Salary .............................................................................................. 43 Table 32. Sergeant’s Salary ................................................................................................. 44 Table 33. Senior Patrol Officer’s Salary.............................................................................. 44 Table 34. Entry Level Patrol Officer’s Salary ..................................................................... 44
Appendix A: Participating Agencies ........................................................................................... 45 Appendix B: Census Personnel..................................................................................................... 49 Appendix C – Frequencies of All Variables ................................................................................. 50
Digitized by South Carolina State Library
i
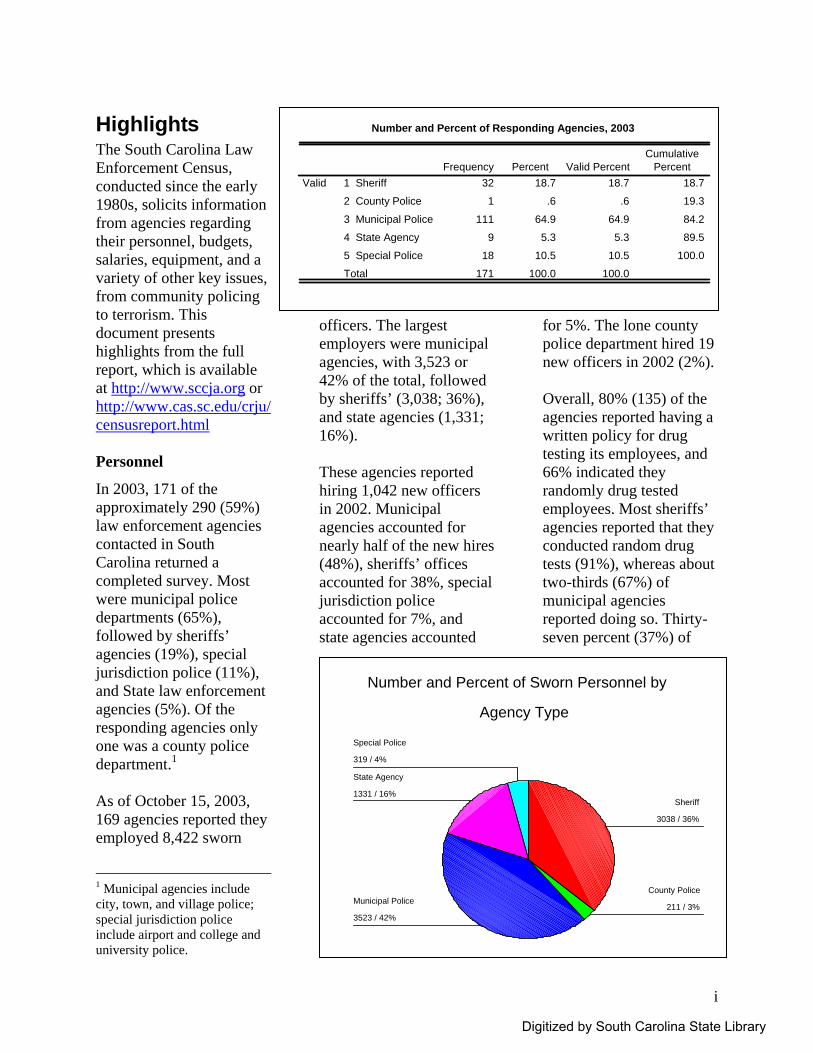
Number and Percent of Responding Agencies, 2003
32 18.7 18.7 18.7
1 .6 .6 19.3
111 64.9 64.9 84.2
9 5.3 5.3 89.5
18 10.5 10.5 100.0
171 100.0 100.0
1 Sheriff
2 County Police
3 Municipal Police
4 State Agency
5 Special Police
Total
ValidFrequency Percent Valid Percent
CumulativePercent
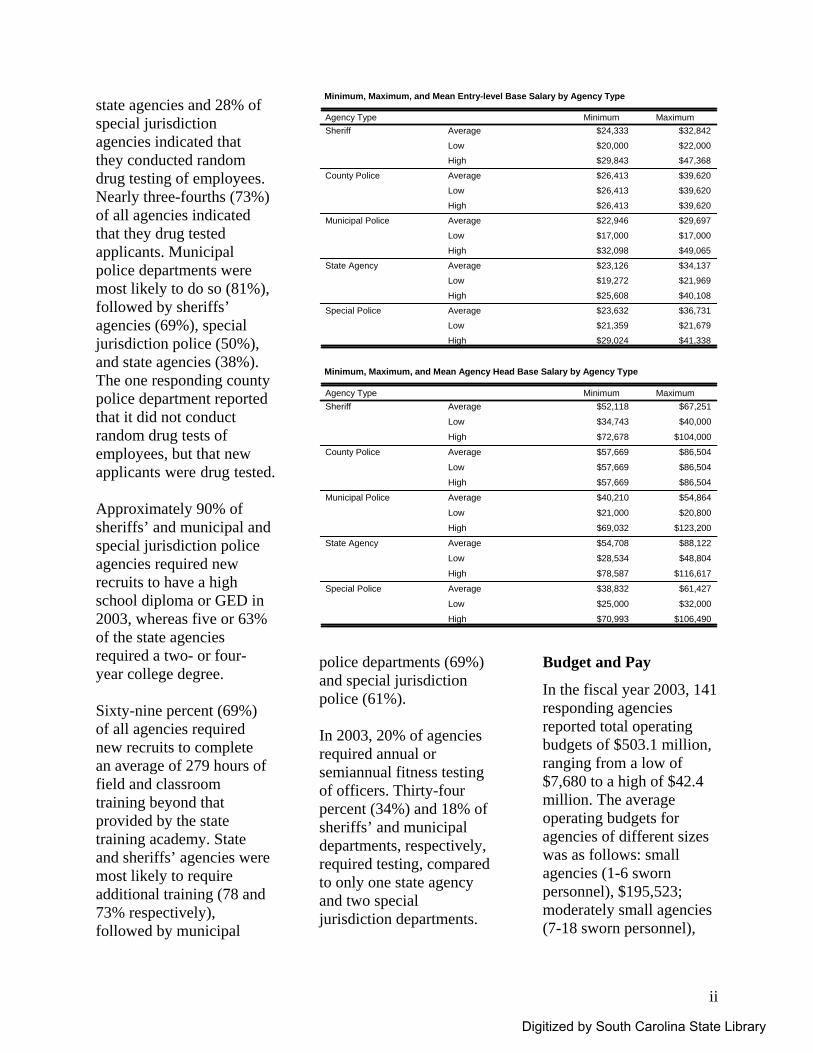
Number and Percent of Sworn Personnel by
Agency Type
319 / 4%
1331 / 16%
3523 / 42%211 / 3%
3038 / 36%
Special Police
State Agency
Municipal PoliceCounty Police
Sheriff
Highlights The South Carolina Law Enforcement Census, conducted since the early 1980s, solicits information from agencies regarding their personnel, budgets, salaries, equipment, and a variety of other key issues, from community policing to terrorism. This document presents highlights from the full report, which is available at http://www.sccja.org or http://www.cas.sc.edu/crju/censusreport.html Personnel
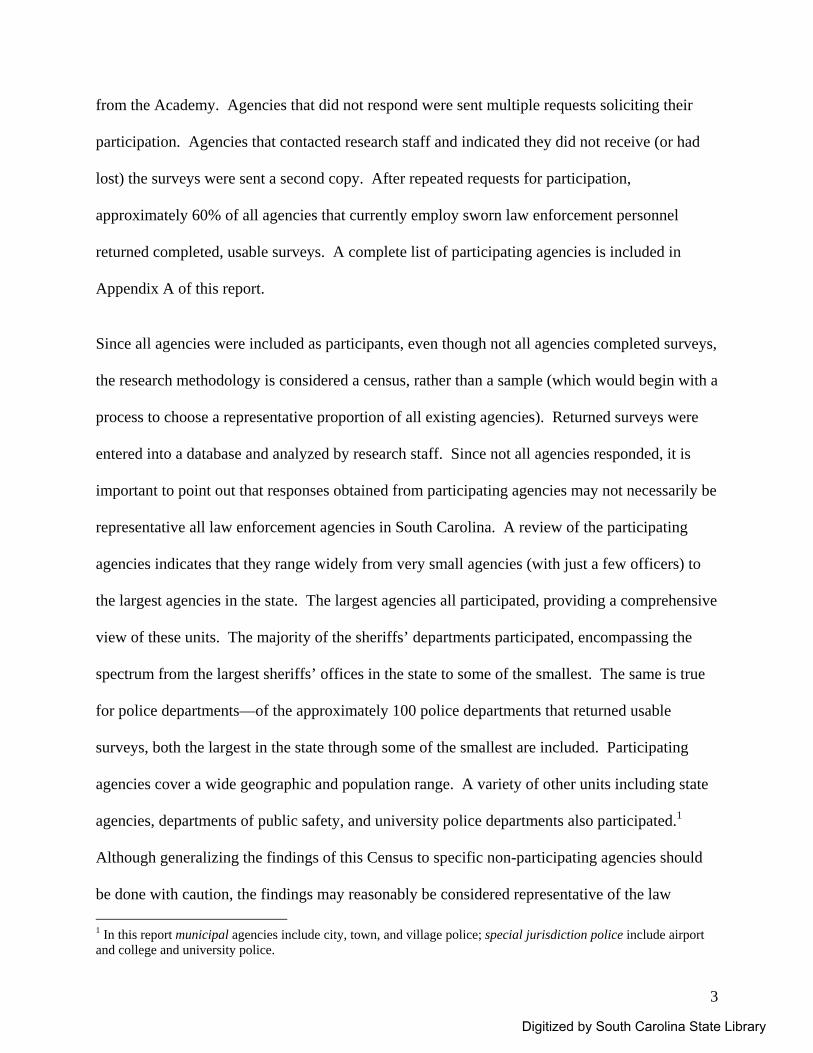
In 2003, 171 of the approximately 290 (59%) law enforcement agencies contacted in South Carolina returned a completed survey. Most were municipal police departments (65%), followed by sheriffs’ agencies (19%), special jurisdiction police (11%), and State law enforcement agencies (5%). Of the responding agencies only one was a county police department.1 As of October 15, 2003, 169 agencies reported they employed 8,422 sworn
1 Municipal agencies include city, town, and village police; special jurisdiction police include airport and college and university police.
officers. The largest employers were municipal agencies, with 3,523 or 42% of the total, followed by sheriffs’ (3,038; 36%), and state agencies (1,331; 16%). These agencies reported hiring 1,042 new officers in 2002. Municipal agencies accounted for nearly half of the new hires (48%), sheriffs’ offices accounted for 38%, special jurisdiction police accounted for 7%, and state agencies accounted
for 5%. The lone county police department hired 19 new officers in 2002 (2%). Overall, 80% (135) of the agencies reported having a written policy for drug testing its employees, and 66% indicated they randomly drug tested employees. Most sheriffs’ agencies reported that they conducted random drug tests (91%), whereas about two-thirds (67%) of municipal agencies reported doing so. Thirty-seven percent (37%) of
Digitized by South Carolina State Library
ii
state agencies and 28% of special jurisdiction agencies indicated that they conducted random drug testing of employees. Nearly three-fourths (73%) of all agencies indicated that they drug tested applicants. Municipal police departments were most likely to do so (81%), followed by sheriffs’ agencies (69%), special jurisdiction police (50%), and state agencies (38%). The one responding county police department reported that it did not conduct random drug tests of employees, but that new applicants were drug tested. Approximately 90% of sheriffs’ and municipal and special jurisdiction police agencies required new recruits to have a high school diploma or GED in 2003, whereas five or 63% of the state agencies required a two- or four-year college degree. Sixty-nine percent (69%) of all agencies required new recruits to complete an average of 279 hours of field and classroom training beyond that provided by the state training academy. State and sheriffs’ agencies were most likely to require additional training (78 and 73% respectively), followed by municipal
police departments (69%) and special jurisdiction police (61%). In 2003, 20% of agencies required annual or semiannual fitness testing of officers. Thirty-four percent (34%) and 18% of sheriffs’ and municipal departments, respectively, required testing, compared to only one state agency and two special jurisdiction departments.
Budget and Pay
In the fiscal year 2003, 141 responding agencies reported total operating budgets of $503.1 million, ranging from a low of $7,680 to a high of $42.4 million. The average operating budgets for agencies of different sizes was as follows: small agencies (1-6 sworn personnel), $195,523; moderately small agencies (7-18 sworn personnel),
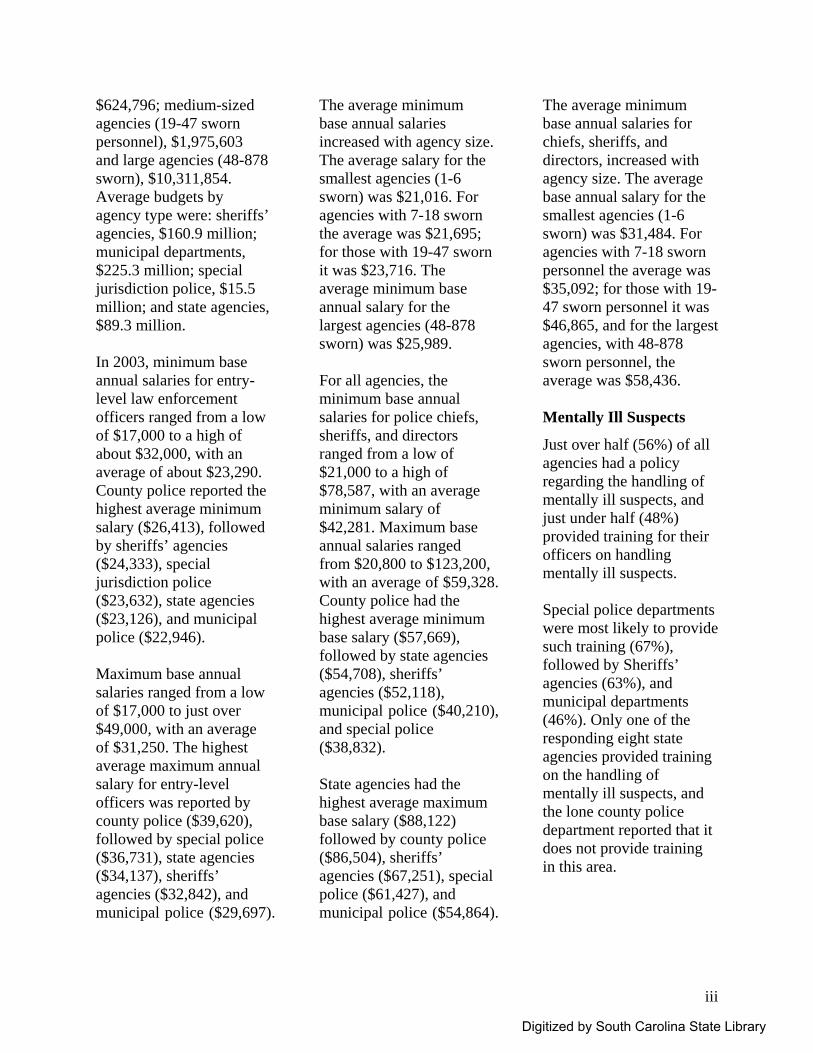
Minimum, Maximum, and Mean Agency Head Base Salary by Agency Type
$52,118 $67,251
$34,743 $40,000
$72,678 $104,000
$57,669 $86,504
$57,669 $86,504
$57,669 $86,504
$40,210 $54,864
$21,000 $20,800
$69,032 $123,200
$54,708 $88,122
$28,534 $48,804
$78,587 $116,617
$38,832 $61,427
$25,000 $32,000
$70,993 $106,490
Average
Low
High
Average
Low
High
Average
Low
High
Average
Low
High
Average
Low
High
Agency TypeSheriff
County Police
Municipal Police
State Agency
Special Police
Minimum Maximum
Minimum, Maximum, and Mean Entry-level Base Salary by Agency Type
$24,333 $32,842
$20,000 $22,000
$29,843 $47,368
$26,413 $39,620
$26,413 $39,620
$26,413 $39,620
$22,946 $29,697
$17,000 $17,000
$32,098 $49,065
$23,126 $34,137
$19,272 $21,969
$25,608 $40,108
$23,632 $36,731
$21,359 $21,679
$29,024 $41,338
Average
Low
High
Average
Low
High
Average
Low
High
Average
Low
High
Average
Low
High
Agency TypeSheriff
County Police
Municipal Police
State Agency
Special Police
Minimum Maximum
Digitized by South Carolina State Library
iii
$624,796; medium-sized agencies (19-47 sworn personnel), $1,975,603 and large agencies (48-878 sworn), $10,311,854. Average budgets by agency type were: sheriffs’ agencies, $160.9 million; municipal departments, $225.3 million; special jurisdiction police, $15.5 million; and state agencies, $89.3 million. In 2003, minimum base annual salaries for entry-level law enforcement officers ranged from a low of $17,000 to a high of about $32,000, with an average of about $23,290. County police reported the highest average minimum salary ($26,413), followed by sheriffs’ agencies ($24,333), special jurisdiction police ($23,632), state agencies ($23,126), and municipal police ($22,946). Maximum base annual salaries ranged from a low of $17,000 to just over $49,000, with an average of $31,250. The highest average maximum annual salary for entry-level officers was reported by county police ($39,620), followed by special police ($36,731), state agencies ($34,137), sheriffs’ agencies ($32,842), and municipal police ($29,697).
The average minimum base annual salaries increased with agency size. The average salary for the smallest agencies (1-6 sworn) was $21,016. For agencies with 7-18 sworn the average was $21,695; for those with 19-47 sworn it was $23,716. The average minimum base annual salary for the largest agencies (48-878 sworn) was $25,989. For all agencies, the minimum base annual salaries for police chiefs, sheriffs, and directors ranged from a low of $21,000 to a high of $78,587, with an average minimum salary of $42,281. Maximum base annual salaries ranged from $20,800 to $123,200, with an average of $59,328. County police had the highest average minimum base salary ($57,669), followed by state agencies ($54,708), sheriffs’ agencies ($52,118), municipal police ($40,210), and special police ($38,832). State agencies had the highest average maximum base salary ($88,122) followed by county police ($86,504), sheriffs’ agencies ($67,251), special police ($61,427), and municipal police ($54,864).
The average minimum base annual salaries for chiefs, sheriffs, and directors, increased with agency size. The average base annual salary for the smallest agencies (1-6 sworn) was $31,484. For agencies with 7-18 sworn personnel the average was $35,092; for those with 19-47 sworn personnel it was $46,865, and for the largest agencies, with 48-878 sworn personnel, the average was $58,436. Mentally Ill Suspects
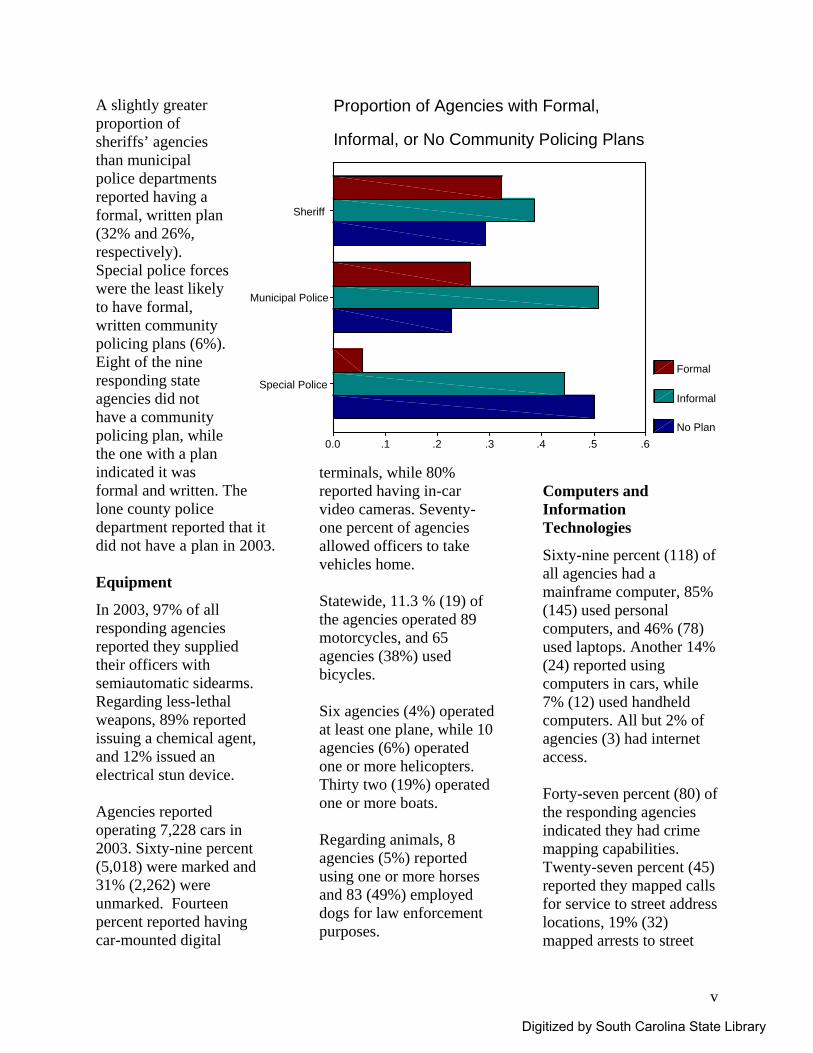
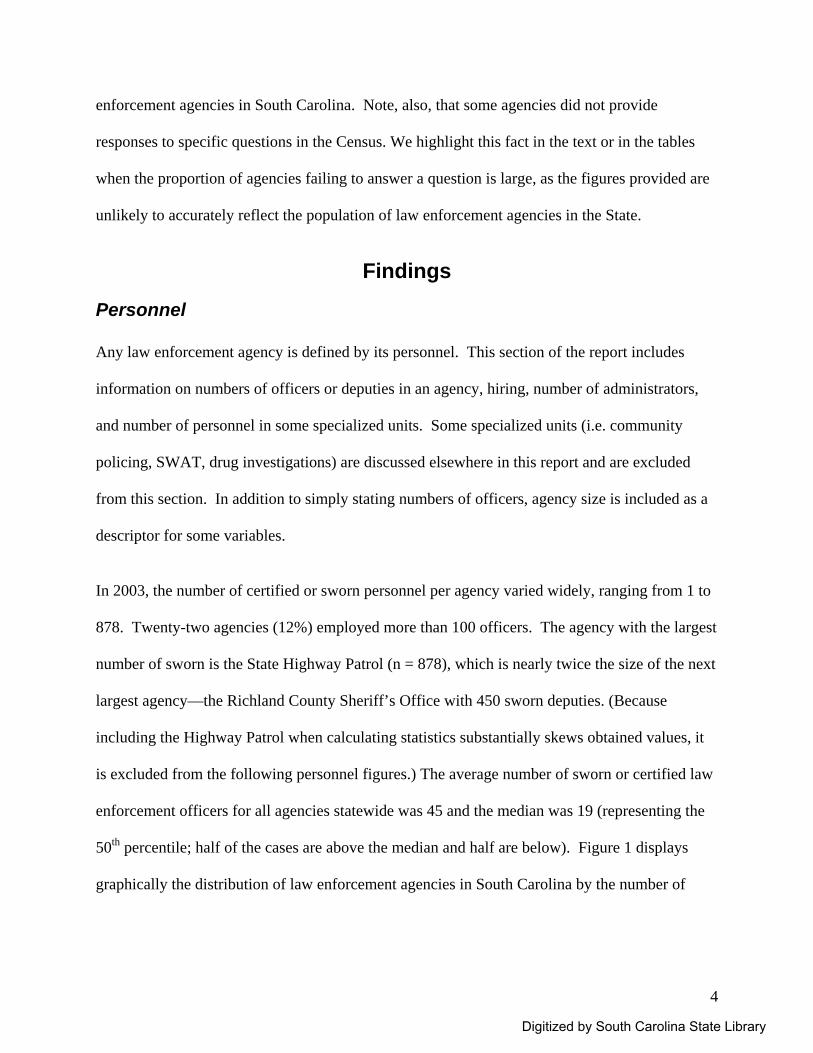
Just over half (56%) of all agencies had a policy regarding the handling of mentally ill suspects, and just under half (48%) provided training for their officers on handling mentally ill suspects. Special police departments were most likely to provide such training (67%), followed by Sheriffs’ agencies (63%), and municipal departments (46%). Only one of the responding eight state agencies provided training on the handling of mentally ill suspects, and the lone county police department reported that it does not provide training in this area.
Digitized by South Carolina State Library
iv
No
37.50%n=12
Yes
62.50%n=20
Sheriff Municipal Police
State Agency Special Police
No54.55%n=60
Yes 45.45%n=50
No
87.50%n=7
Yes
12.50%n=1
No44.44%n=8
Yes
55.56%n=10
Agencies that Conducted Training on the Handling ofMentally Ill Suspects
Operations
Virtually all (97%) law enforcement agencies engaged in patrol activities. Eighty five percent (85%) listed traffic enforcement as a primary function. Nearly half (49%) were responsible for court security, 28% for serving civil process, and 23% for jail operations. Twenty-six percent engaged in tactical or SWAT operations. In 2003, 87% of the agencies participated in a 9-1-1 emergency system. This was highest for municipal agencies (95%), followed by sheriffs’ departments (90%), and special jurisdiction police (72%). Only one state agency participated in a 9-1-1 system. Statewide, nearly half (48%) of the agencies operated a specialized drug-enforcement unit. Sheriffs’ departments were most likely to do so (97%), followed by municipal police departments (43%). Two state agencies operated such units. Although special jurisdiction police indicated that they did not operate specialized drug-enforcement units, 17% reported that they were part of a multi-agency drug-enforcement taskforce.
Community Policing
In 2003, 69% (117) of the law enforcement agencies in South Carolina reported having a community policing plan. In 35% of these agencies the plan was formal and written. For the remaining agencies with a community policing plan (65%), that plan was informal. However, among all agencies, 75% reported they actively encouraged officers to engage in problem-solving projects. Twenty-seven percent (27%) of the departments reported they trained citizens in some form of
community policing activity, while 48% formed some type of problem-solving partnership with a community group or other agency. Eighty-four percent (84%) and 51% of sheriffs’ and municipal agencies, respectively, used one or more school resource officers, as did the single responding county police department. In 2003, both sheriffs’ agencies and municipal departments were more likely to have informal community policing plans than formal, written plans.
Digitized by South Carolina State Library
v
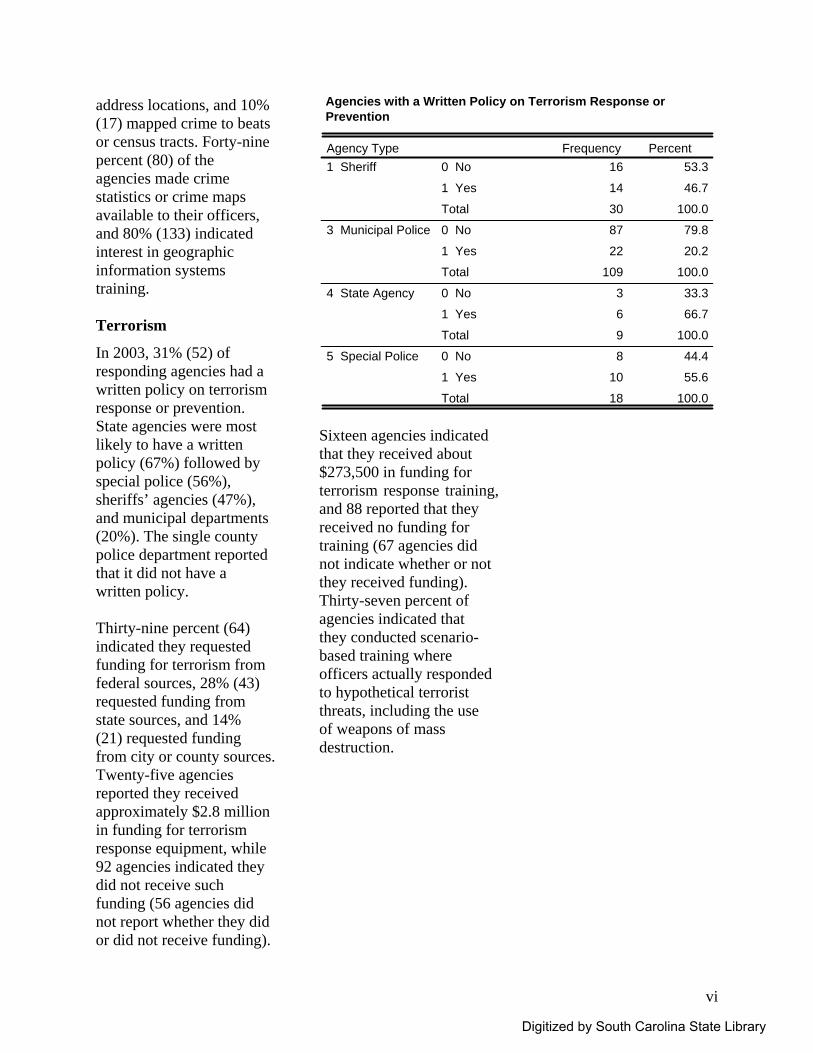
Proportion of Agencies with Formal,
Informal, or No Community Policing Plans
Sheriff
Municipal Police
Special Police
.6.5.4.3.2.10.0
Formal
Informal
No Plan
A slightly greater proportion of sheriffs’ agencies than municipal police departments reported having a formal, written plan (32% and 26%, respectively). Special police forces were the least likely to have formal, written community policing plans (6%). Eight of the nine responding state agencies did not have a community policing plan, while the one with a plan indicated it was formal and written. The lone county police department reported that it did not have a plan in 2003. Equipment
In 2003, 97% of all responding agencies reported they supplied their officers with semiautomatic sidearms. Regarding less-lethal weapons, 89% reported issuing a chemical agent, and 12% issued an electrical stun device. Agencies reported operating 7,228 cars in 2003. Sixty-nine percent (5,018) were marked and 31% (2,262) were unmarked. Fourteen percent reported having car-mounted digital
terminals, while 80% reported having in-car video cameras. Seventy-one percent of agencies allowed officers to take vehicles home. Statewide, 11.3 % (19) of the agencies operated 89 motorcycles, and 65 agencies (38%) used bicycles. Six agencies (4%) operated at least one plane, while 10 agencies (6%) operated one or more helicopters. Thirty two (19%) operated one or more boats. Regarding animals, 8 agencies (5%) reported using one or more horses and 83 (49%) employed dogs for law enforcement purposes.
Computers and Information Technologies
Sixty-nine percent (118) of all agencies had a mainframe computer, 85% (145) used personal computers, and 46% (78) used laptops. Another 14% (24) reported using computers in cars, while 7% (12) used handheld computers. All but 2% of agencies (3) had internet access. Forty-seven percent (80) of the responding agencies indicated they had crime mapping capabilities. Twenty-seven percent (45) reported they mapped calls for service to street address locations, 19% (32) mapped arrests to street
Digitized by South Carolina State Library
vi
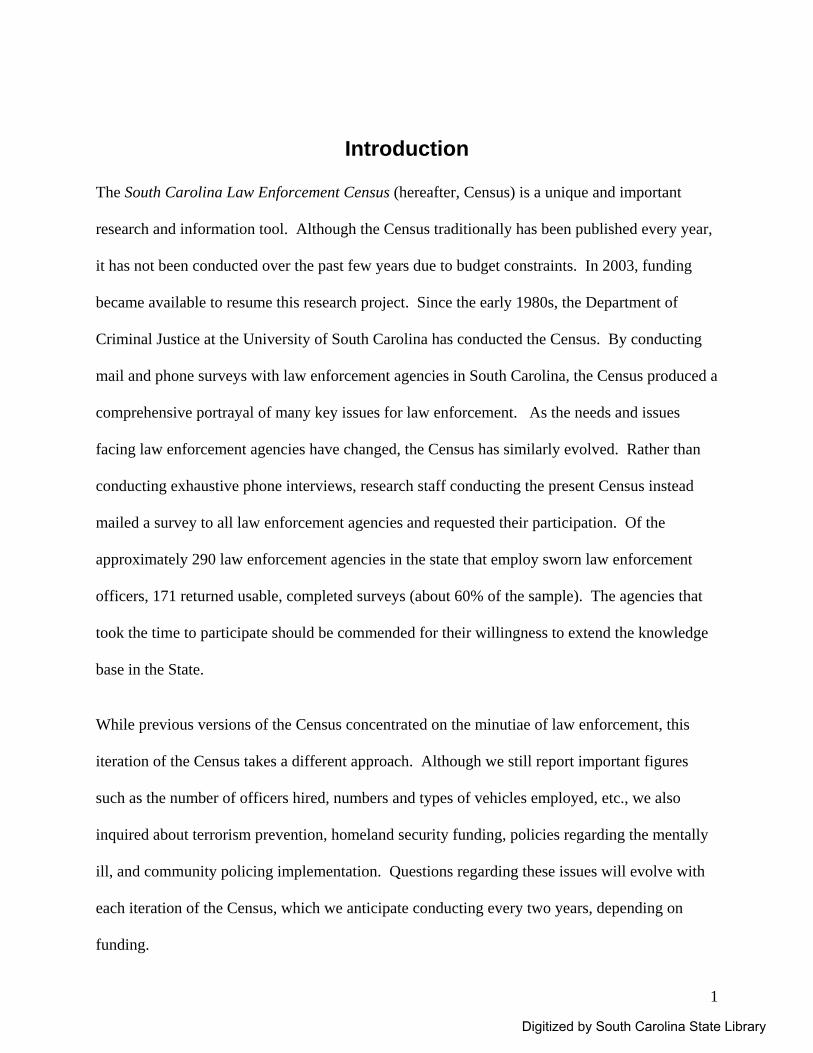
Agencies with a Written Policy on Terrorism Response orPrevention
16 53.3
14 46.7
30 100.0
87 79.8
22 20.2
109 100.0
3 33.3
6 66.7
9 100.0
8 44.4
10 55.6
18 100.0
0 No
1 Yes
Total
0 No
1 Yes
Total
0 No
1 Yes
Total
0 No
1 Yes
Total
Agency Type1 Sheriff
3 Municipal Police
4 State Agency
5 Special Police
Frequency Percent
address locations, and 10% (17) mapped crime to beats or census tracts. Forty-nine percent (80) of the agencies made crime statistics or crime maps available to their officers, and 80% (133) indicated interest in geographic information systems training. Terrorism
In 2003, 31% (52) of responding agencies had a written policy on terrorism response or prevention. State agencies were most likely to have a written policy (67%) followed by special police (56%), sheriffs’ agencies (47%), and municipal departments (20%). The single county police department reported that it did not have a written policy. Thirty-nine percent (64) indicated they requested funding for terrorism from federal sources, 28% (43) requested funding from state sources, and 14% (21) requested funding from city or county sources. Twenty-five agencies reported they received approximately $2.8 million in funding for terrorism response equipment, while 92 agencies indicated they did not receive such funding (56 agencies did not report whether they did or did not receive funding).
Sixteen agencies indicated that they received about $273,500 in funding for terrorism response training, and 88 reported that they received no funding for training (67 agencies did not indicate whether or not they received funding). Thirty-seven percent of agencies indicated that they conducted scenario-based training where officers actually responded to hypothetical terrorist threats, including the use of weapons of mass destruction.
Digitized by South Carolina State Library
1
Introduction The South Carolina Law Enforcement Census (hereafter, Census) is a unique and important
research and information tool. Although the Census traditionally has been published every year,
it has not been conducted over the past few years due to budget constraints. In 2003, funding
became available to resume this research project. Since the early 1980s, the Department of
Criminal Justice at the University of South Carolina has conducted the Census. By conducting
mail and phone surveys with law enforcement agencies in South Carolina, the Census produced a
comprehensive portrayal of many key issues for law enforcement. As the needs and issues
facing law enforcement agencies have changed, the Census has similarly evolved. Rather than
conducting exhaustive phone interviews, research staff conducting the present Census instead
mailed a survey to all law enforcement agencies and requested their participation. Of the
approximately 290 law enforcement agencies in the state that employ sworn law enforcement
officers, 171 returned usable, completed surveys (about 60% of the sample). The agencies that
took the time to participate should be commended for their willingness to extend the knowledge
base in the State.
While previous versions of the Census concentrated on the minutiae of law enforcement, this
iteration of the Census takes a different approach. Although we still report important figures
such as the number of officers hired, numbers and types of vehicles employed, etc., we also
inquired about terrorism prevention, homeland security funding, policies regarding the mentally
ill, and community policing implementation. Questions regarding these issues will evolve with
each iteration of the Census, which we anticipate conducting every two years, depending on
funding.
Digitized by South Carolina State Library
2
The Census was developed to serve several purposes. Its primary mission is to inform the law
enforcement community in South Carolina. Administrators can use the information to determine
how their agency compares to other agencies in terms of manpower, salary, budget, equipment,
and so forth. Informed requests can then be posed to city, county, or state administrators for
funding increases or reallocation. The sections on important current issues, such as homeland
security and policies regarding the mentally ill, can assist administrators in determining the
position of their agency relevant to other agencies in the state. Further, information in the
Census (such as found in the community policing and accreditation sections) can guide
administrators in determining policy directions for the future. The Census also serves as a
research vehicle for the faculty in the Department of Criminology and Criminal Justice at the
University of South Carolina (USC). Finally, the Census is intended to assist staff at the South
Carolina Criminal Justice Academy in determining current and future training needs for law
enforcement agencies in the state.
Methodology The questions included in the Census were developed by faculty in the Department of
Criminology and Criminal Justice at USC, in conjunction with staff at the South Carolina
Criminal Justice Academy. Some questions were drawn from national surveys conducted by the
Bureau of Justice Statistics, some from previous iterations of the Census, and others are original
questions developed to address current concerns. A complete list of all law enforcement
agencies in South Carolina was acquired from the Academy. Prior to mailing the survey, a pre-
sensitization letter was distributed by the Academy to all law enforcement agencies in the State.
The Census was then mailed, with a postage-paid return envelope and an explanatory cover letter
Digitized by South Carolina State Library
3
from the Academy. Agencies that did not respond were sent multiple requests soliciting their
participation. Agencies that contacted research staff and indicated they did not receive (or had
lost) the surveys were sent a second copy. After repeated requests for participation,
approximately 60% of all agencies that currently employ sworn law enforcement personnel
returned completed, usable surveys. A complete list of participating agencies is included in
Appendix A of this report.
Since all agencies were included as participants, even though not all agencies completed surveys,
the research methodology is considered a census, rather than a sample (which would begin with a
process to choose a representative proportion of all existing agencies). Returned surveys were
entered into a database and analyzed by research staff. Since not all agencies responded, it is
important to point out that responses obtained from participating agencies may not necessarily be
representative all law enforcement agencies in South Carolina. A review of the participating
agencies indicates that they range widely from very small agencies (with just a few officers) to
the largest agencies in the state. The largest agencies all participated, providing a comprehensive
view of these units. The majority of the sheriffs’ departments participated, encompassing the
spectrum from the largest sheriffs’ offices in the state to some of the smallest. The same is true
for police departments—of the approximately 100 police departments that returned usable
surveys, both the largest in the state through some of the smallest are included. Participating
agencies cover a wide geographic and population range. A variety of other units including state
agencies, departments of public safety, and university police departments also participated.1
Although generalizing the findings of this Census to specific non-participating agencies should
be done with caution, the findings may reasonably be considered representative of the law 1 In this report municipal agencies include city, town, and village police; special jurisdiction police include airport and college and university police.
Digitized by South Carolina State Library
4
enforcement agencies in South Carolina. Note, also, that some agencies did not provide
responses to specific questions in the Census. We highlight this fact in the text or in the tables
when the proportion of agencies failing to answer a question is large, as the figures provided are
unlikely to accurately reflect the population of law enforcement agencies in the State.
Findings
Personnel Any law enforcement agency is defined by its personnel. This section of the report includes
information on numbers of officers or deputies in an agency, hiring, number of administrators,
and number of personnel in some specialized units. Some specialized units (i.e. community
policing, SWAT, drug investigations) are discussed elsewhere in this report and are excluded
from this section. In addition to simply stating numbers of officers, agency size is included as a
descriptor for some variables.
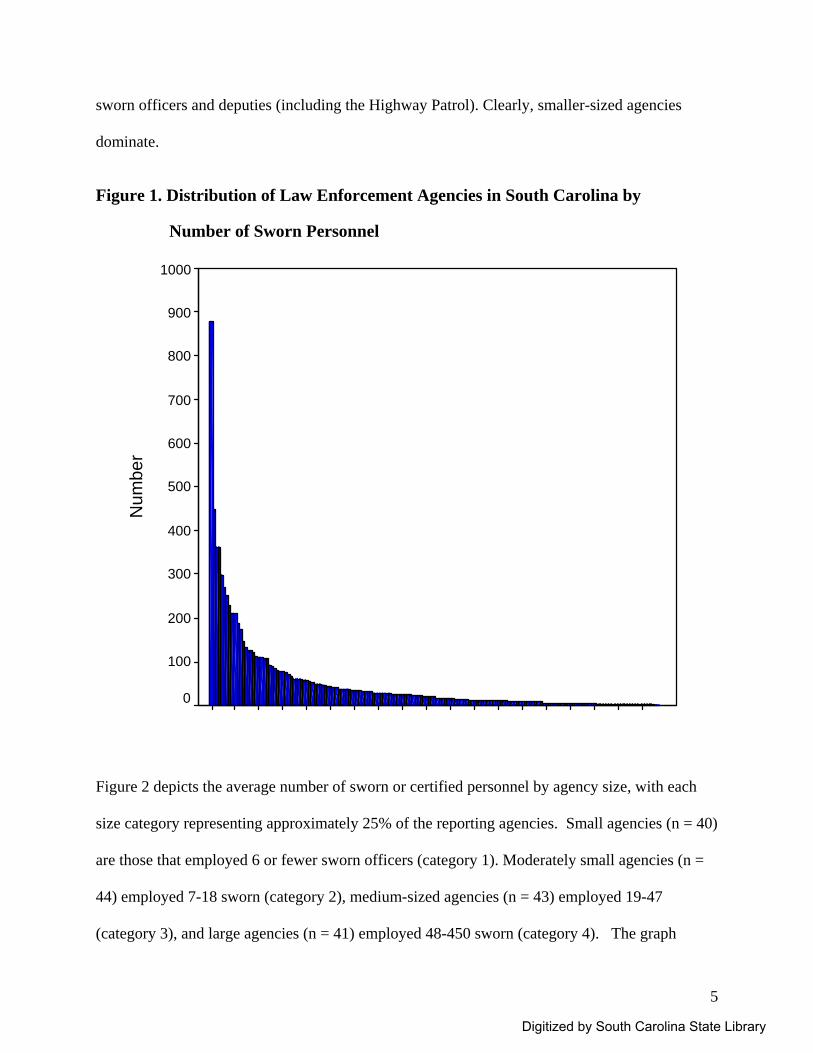
In 2003, the number of certified or sworn personnel per agency varied widely, ranging from 1 to
878. Twenty-two agencies (12%) employed more than 100 officers. The agency with the largest
number of sworn is the State Highway Patrol (n = 878), which is nearly twice the size of the next
largest agency—the Richland County Sheriff’s Office with 450 sworn deputies. (Because
including the Highway Patrol when calculating statistics substantially skews obtained values, it
is excluded from the following personnel figures.) The average number of sworn or certified law
enforcement officers for all agencies statewide was 45 and the median was 19 (representing the
50th percentile; half of the cases are above the median and half are below). Figure 1 displays
graphically the distribution of law enforcement agencies in South Carolina by the number of
Digitized by South Carolina State Library
5
sworn officers and deputies (including the Highway Patrol). Clearly, smaller-sized agencies
dominate.
Figure 1. Distribution of Law Enforcement Agencies in South Carolina by
Number of Sworn Personnel
Num
ber
1000
900
800
700
600
500
400
300
200
100
0
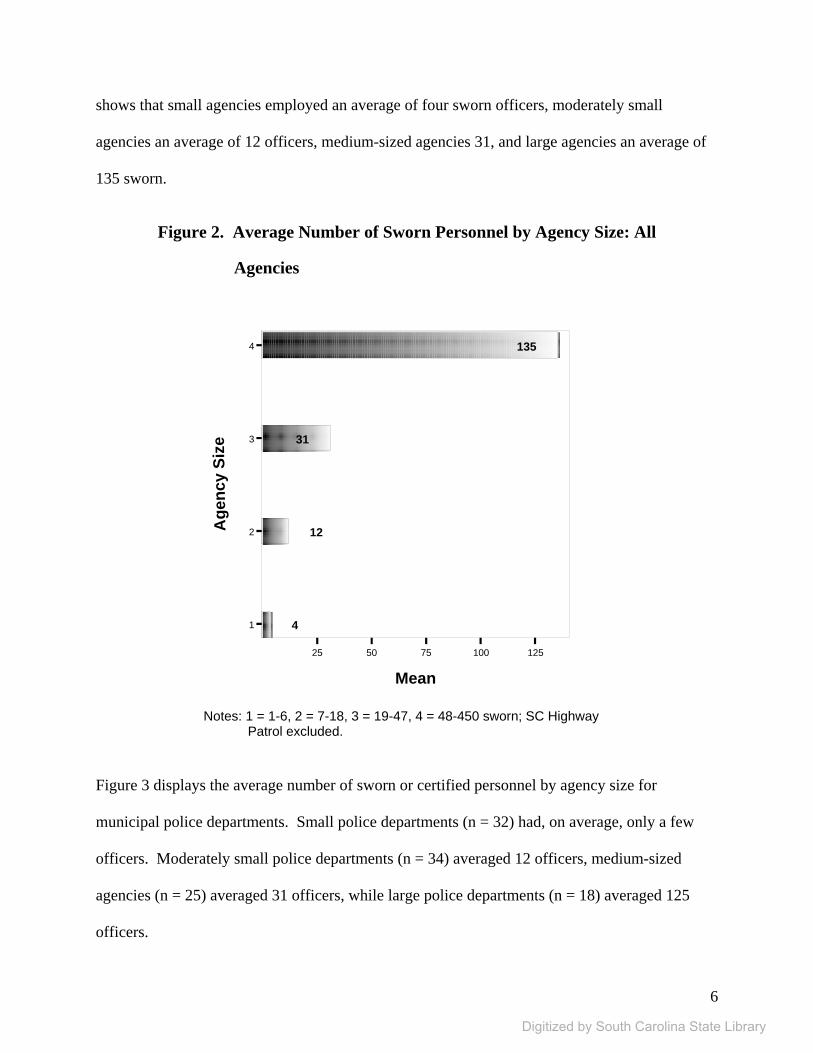
Figure 2 depicts the average number of sworn or certified personnel by agency size, with each
size category representing approximately 25% of the reporting agencies. Small agencies (n = 40)
are those that employed 6 or fewer sworn officers (category 1). Moderately small agencies (n =
44) employed 7-18 sworn (category 2), medium-sized agencies (n = 43) employed 19-47
(category 3), and large agencies (n = 41) employed 48-450 sworn (category 4). The graph
Digitized by South Carolina State Library
6
shows that small agencies employed an average of four sworn officers, moderately small
agencies an average of 12 officers, medium-sized agencies 31, and large agencies an average of
135 sworn.
Figure 2. Average Number of Sworn Personnel by Agency Size: All
Agencies
25 50 75 100 125
Mean
1
2
3
4
Age
ncy
Size
4
12
31
135
Notes: 1 = 1-6, 2 = 7-18, 3 = 19-47, 4 = 48-450 sworn; SC Highway Patrol excluded.
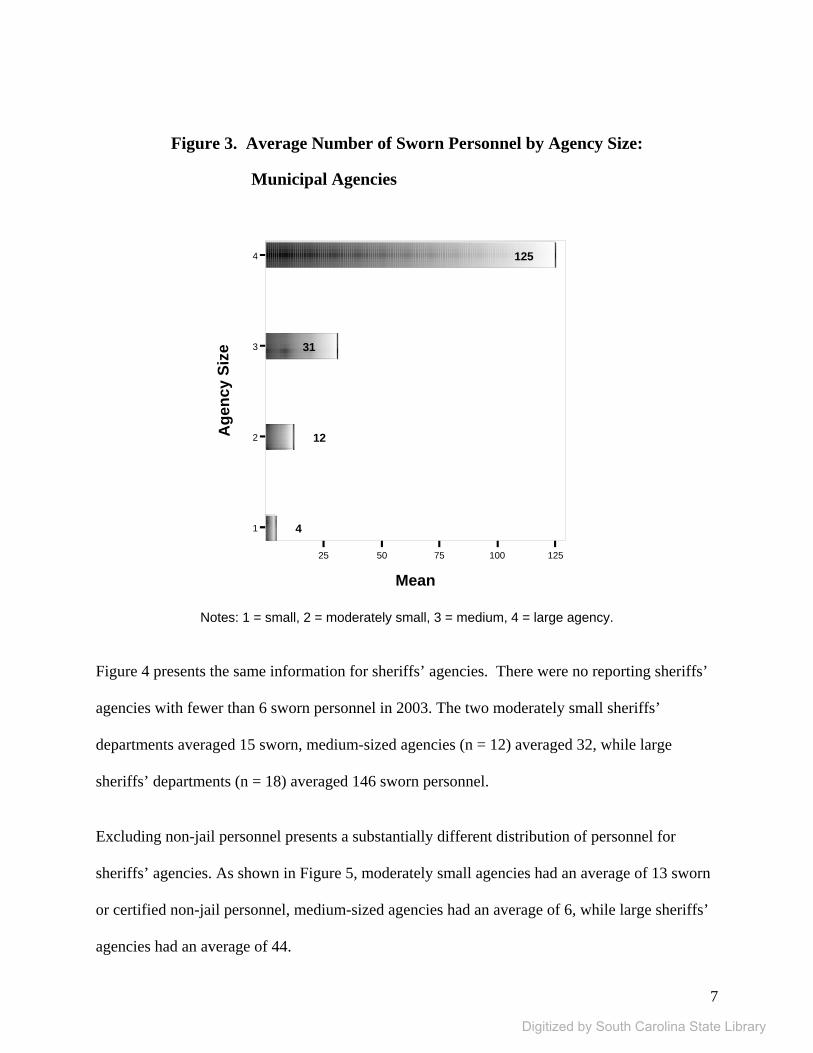
Figure 3 displays the average number of sworn or certified personnel by agency size for
municipal police departments. Small police departments (n = 32) had, on average, only a few
officers. Moderately small police departments (n = 34) averaged 12 officers, medium-sized
agencies (n = 25) averaged 31 officers, while large police departments (n = 18) averaged 125
officers.
Digitized by South Carolina State Library
7
Figure 3. Average Number of Sworn Personnel by Agency Size:
Municipal Agencies
25 50 75 100 125
Mean
1
2
3
4
Age
ncy
Size
4
12
31
125
Notes: 1 = small, 2 = moderately small, 3 = medium, 4 = large agency.
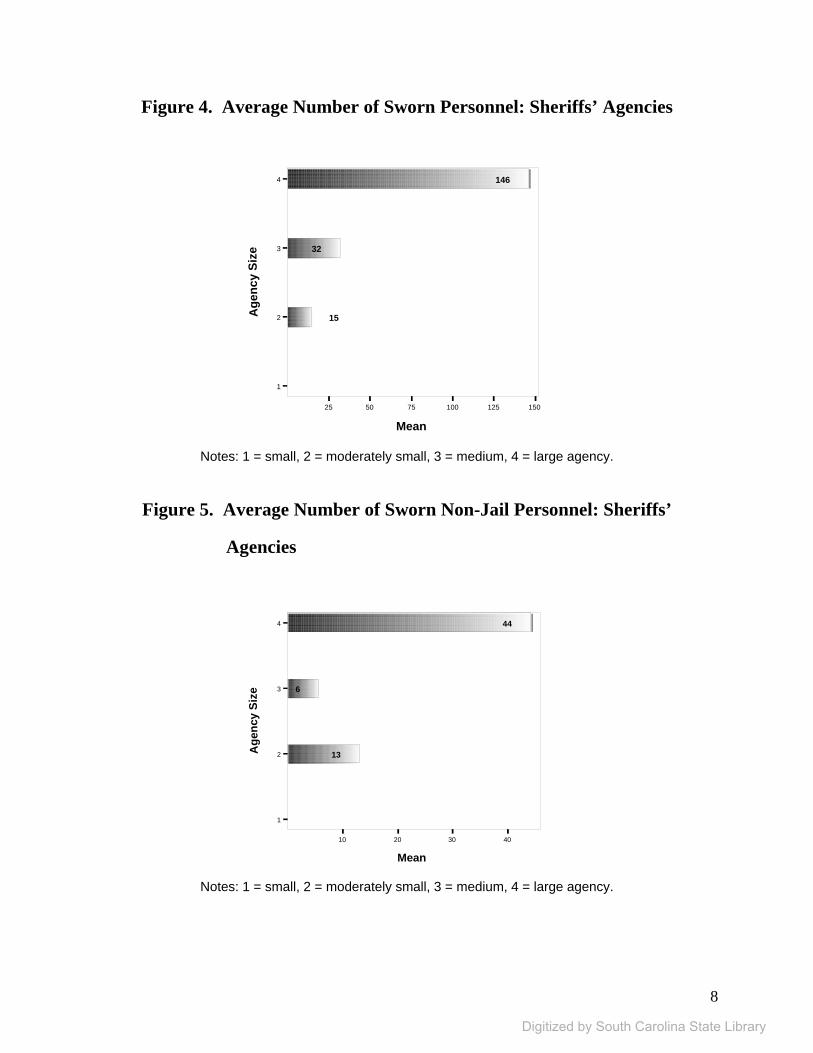
Figure 4 presents the same information for sheriffs’ agencies. There were no reporting sheriffs’
agencies with fewer than 6 sworn personnel in 2003. The two moderately small sheriffs’
departments averaged 15 sworn, medium-sized agencies (n = 12) averaged 32, while large
sheriffs’ departments (n = 18) averaged 146 sworn personnel.
Excluding non-jail personnel presents a substantially different distribution of personnel for
sheriffs’ agencies. As shown in Figure 5, moderately small agencies had an average of 13 sworn
or certified non-jail personnel, medium-sized agencies had an average of 6, while large sheriffs’
agencies had an average of 44.
Digitized by South Carolina State Library
8
Figure 4. Average Number of Sworn Personnel: Sheriffs’ Agencies
Notes: 1 = small, 2 = moderately small, 3 = medium, 4 = large agency.
Figure 5. Average Number of Sworn Non-Jail Personnel: Sheriffs’
Agencies
Notes: 1 = small, 2 = moderately small, 3 = medium, 4 = large agency.
10 20 30 40
Mean
1
2
3
4
Age
ncy
Size
13
6
44
25 50 75 100 125 150
Mean
1
2
3
4
Age
ncy
Size
15
32
146
Digitized by South Carolina State Library
9
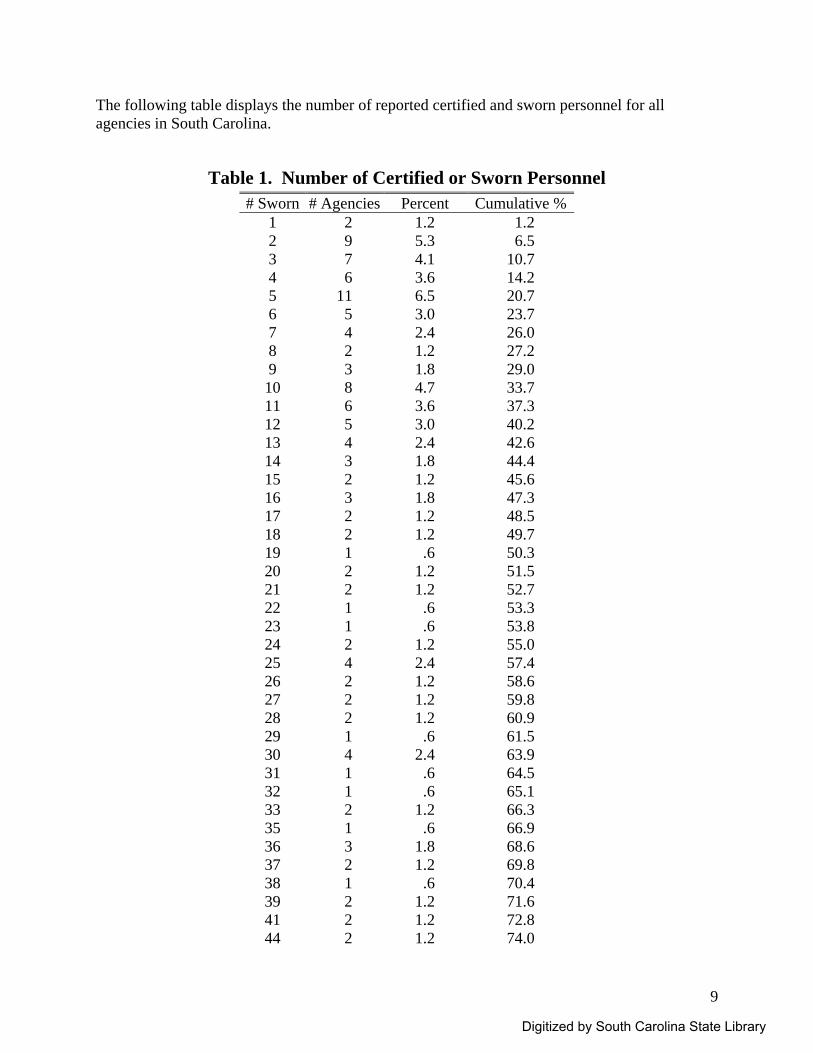
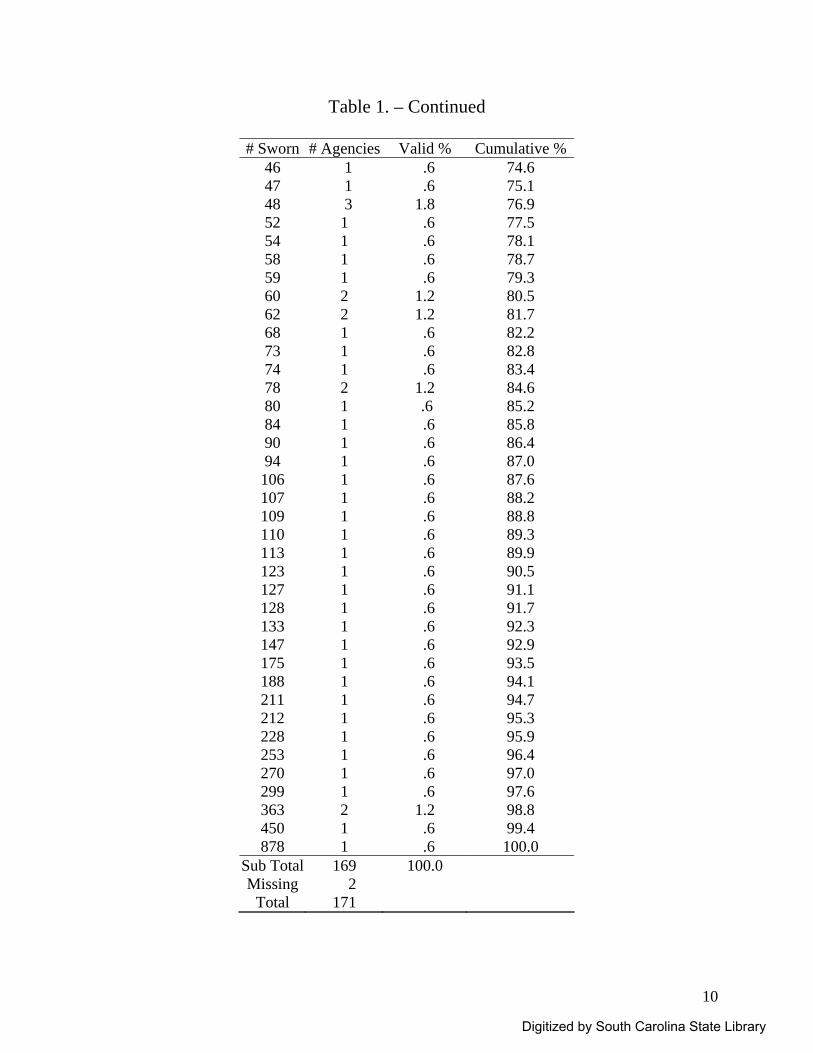
The following table displays the number of reported certified and sworn personnel for all agencies in South Carolina.
Table 1. Number of Certified or Sworn Personnel # Sworn # Agencies Percent Cumulative %
1 2 1.2 1.2 2 9 5.3 6.5 3 7 4.1 10.7 4 6 3.6 14.2 5 11 6.5 20.7 6 5 3.0 23.7 7 4 2.4 26.0 8 2 1.2 27.2 9 3 1.8 29.0 10 8 4.7 33.7 11 6 3.6 37.3 12 5 3.0 40.2 13 4 2.4 42.6 14 3 1.8 44.4 15 2 1.2 45.6 16 3 1.8 47.3 17 2 1.2 48.5 18 2 1.2 49.7 19 1 .6 50.3 20 2 1.2 51.5 21 2 1.2 52.7 22 1 .6 53.3 23 1 .6 53.8 24 2 1.2 55.0 25 4 2.4 57.4 26 2 1.2 58.6 27 2 1.2 59.8 28 2 1.2 60.9 29 1 .6 61.5 30 4 2.4 63.9 31 1 .6 64.5 32 1 .6 65.1 33 2 1.2 66.3 35 1 .6 66.9 36 3 1.8 68.6 37 2 1.2 69.8 38 1 .6 70.4 39 2 1.2 71.6 41 2 1.2 72.8 44 2 1.2 74.0
Digitized by South Carolina State Library
10
Table 1. – Continued
# Sworn # Agencies Valid % Cumulative % 46 1 .6 74.6 47 1 .6 75.1 48 3 1.8 76.9 52 1 .6 77.5 54 1 .6 78.1 58 1 .6 78.7 59 1 .6 79.3 60 2 1.2 80.5 62 2 1.2 81.7 68 1 .6 82.2 73 1 .6 82.8 74 1 .6 83.4 78 2 1.2 84.6 80 1 .6 85.2 84 1 .6 85.8 90 1 .6 86.4 94 1 .6 87.0 106 1 .6 87.6 107 1 .6 88.2 109 1 .6 88.8 110 1 .6 89.3 113 1 .6 89.9 123 1 .6 90.5 127 1 .6 91.1 128 1 .6 91.7 133 1 .6 92.3 147 1 .6 92.9 175 1 .6 93.5 188 1 .6 94.1 211 1 .6 94.7 212 1 .6 95.3 228 1 .6 95.9 253 1 .6 96.4 270 1 .6 97.0 299 1 .6 97.6 363 2 1.2 98.8 450 1 .6 99.4 878 1 .6 100.0
Sub Total 169 100.0 Missing 2
Total 171
Digitized by South Carolina State Library
11
Agencies also were asked how many new officers were hired in the past year. Approximately
15% of reporting agencies (a total of 25) reported zero new hires. Although the range of new
hires was 1 to 62, the average was 6 and the median was 3. Thus, approximately half of
reporting agencies indicated they hired fewer than 3 officers. Sheriffs’ agencies hired an average
of 12 officers, state agencies hired an average of 6, municipal departments an average of 5,
special police an average of 4, and the single responding county police department reported
hiring 19 officers. Small agencies hired an average of 1 officer, moderately small agencies hired
an average of 2 officers, medium-sized agencies hired 5, and large agencies hired an average of
17 officers.
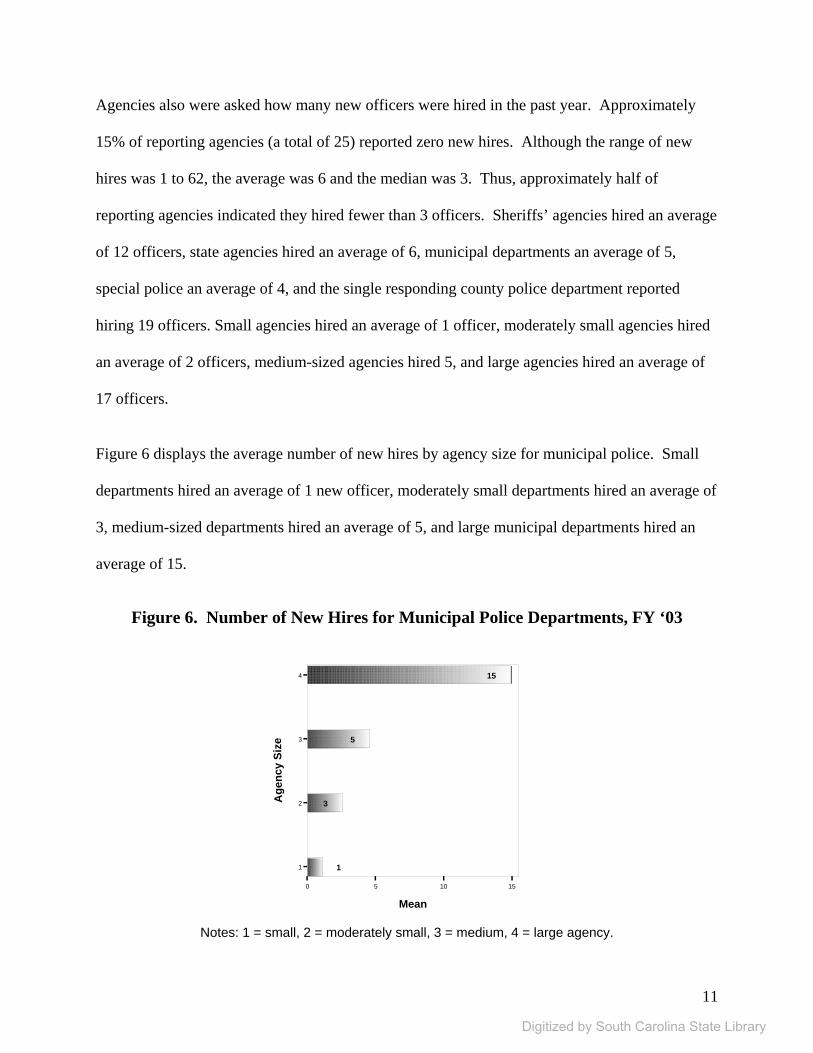
Figure 6 displays the average number of new hires by agency size for municipal police. Small
departments hired an average of 1 new officer, moderately small departments hired an average of
3, medium-sized departments hired an average of 5, and large municipal departments hired an
average of 15.
Figure 6. Number of New Hires for Municipal Police Departments, FY ‘03
0 5 10 15
Mean
1
2
3
4
Age
ncy
Size
1
3
5
15
Notes: 1 = small, 2 = moderately small, 3 = medium, 4 = large agency.
Digitized by South Carolina State Library
12
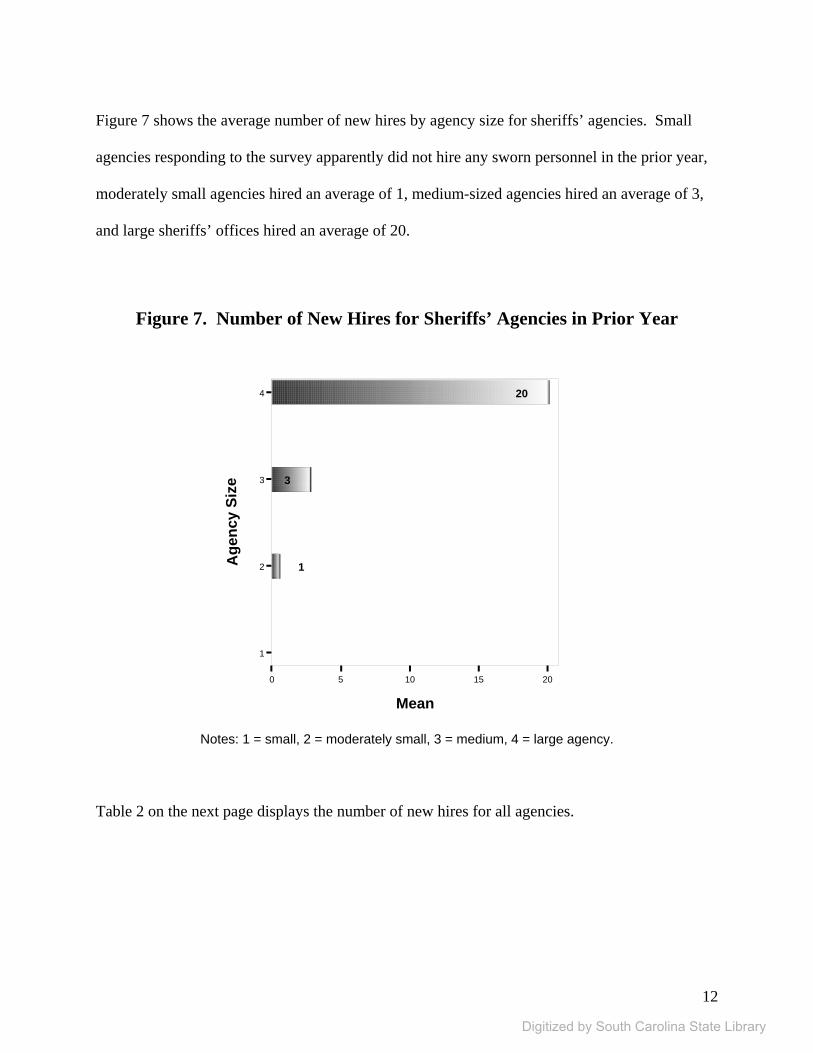
Figure 7 shows the average number of new hires by agency size for sheriffs’ agencies. Small
agencies responding to the survey apparently did not hire any sworn personnel in the prior year,
moderately small agencies hired an average of 1, medium-sized agencies hired an average of 3,
and large sheriffs’ offices hired an average of 20.
Figure 7. Number of New Hires for Sheriffs’ Agencies in Prior Year
0 5 10 15 20
Mean
1
2
3
4
Age
ncy
Size
1
3
20
Notes: 1 = small, 2 = moderately small, 3 = medium, 4 = large agency.
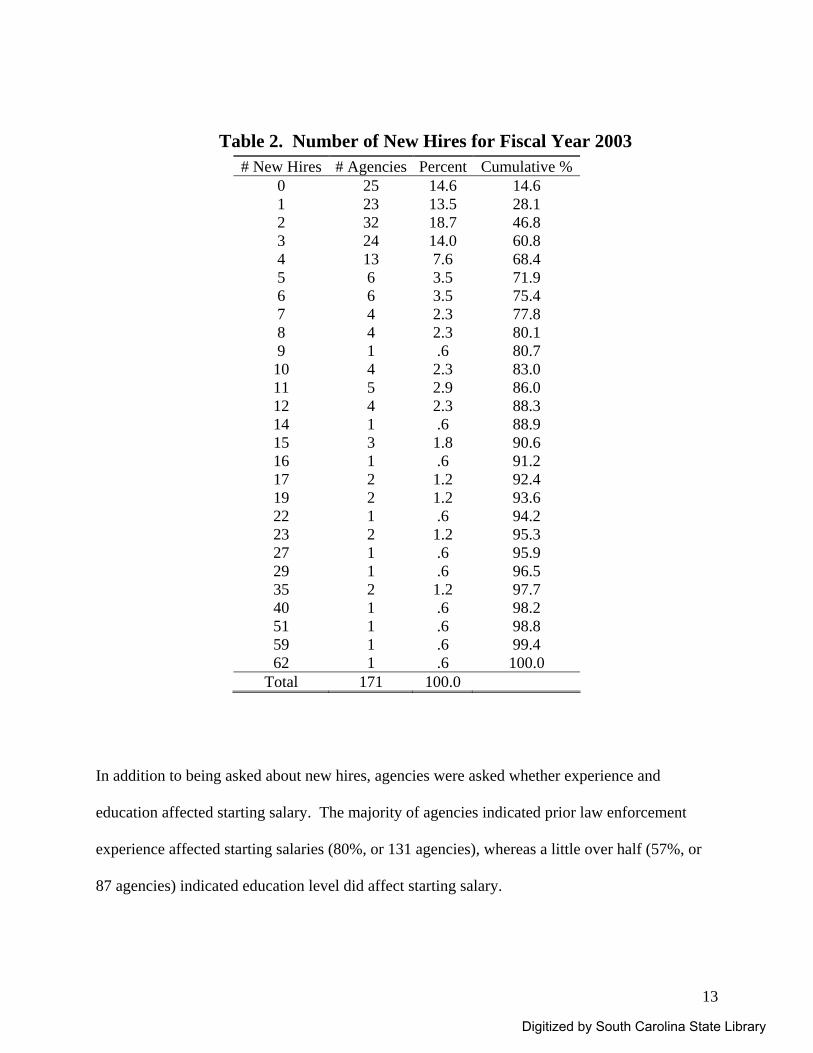
Table 2 on the next page displays the number of new hires for all agencies.
Digitized by South Carolina State Library
13
Table 2. Number of New Hires for Fiscal Year 2003 # New Hires # Agencies Percent Cumulative %
0 25 14.6 14.6 1 23 13.5 28.1 2 32 18.7 46.8 3 24 14.0 60.8 4 13 7.6 68.4 5 6 3.5 71.9 6 6 3.5 75.4 7 4 2.3 77.8 8 4 2.3 80.1 9 1 .6 80.7 10 4 2.3 83.0 11 5 2.9 86.0 12 4 2.3 88.3 14 1 .6 88.9 15 3 1.8 90.6 16 1 .6 91.2 17 2 1.2 92.4 19 2 1.2 93.6 22 1 .6 94.2 23 2 1.2 95.3 27 1 .6 95.9 29 1 .6 96.5 35 2 1.2 97.7 40 1 .6 98.2 51 1 .6 98.8 59 1 .6 99.4 62 1 .6 100.0
Total 171 100.0
In addition to being asked about new hires, agencies were asked whether experience and
education affected starting salary. The majority of agencies indicated prior law enforcement
experience affected starting salaries (80%, or 131 agencies), whereas a little over half (57%, or
87 agencies) indicated education level did affect starting salary.
Digitized by South Carolina State Library
14
An important component to any personnel discussion is a consideration of administrative staff.
Participants were asked to provide the number of full-time administrators in their agency. It is
important to note that agencies were allowed to define what “administrator” meant. This could
lead to differing definitions. For example, some agencies may describe the most senior patrol
officer on a shift as an administrator while other agencies may restrict the title administrator to a
specific rank.
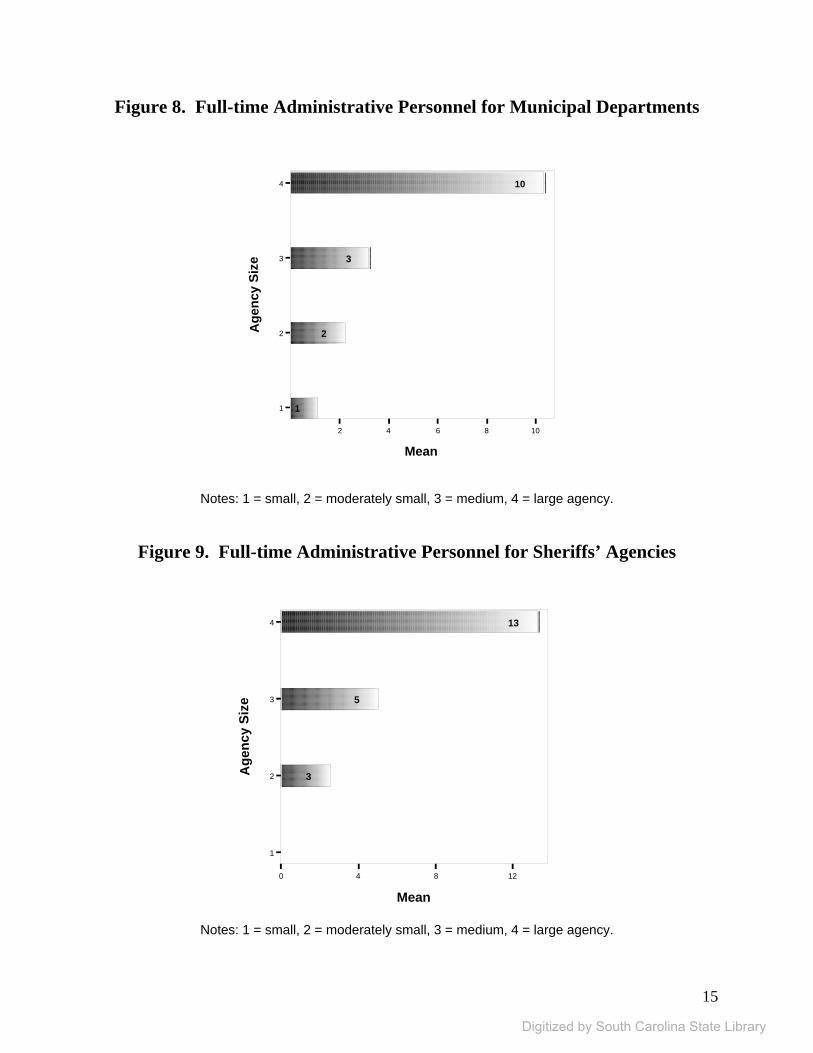
The number of administrators ranged from 0 to 52. Five agencies reported having no full-time
administrator. The average was 5 and the median was 2. Thus, about half the agencies in South
Carolina reported 2 or fewer full-time administrators. Small agencies reported an average of 1
full-time administrator; moderately small agencies reported 2, medium-sized agencies reported 4,
and large agencies reported 13. Municipal and special police departments both indicated an
average of 3 full-time administrators, sheriffs’ agencies had an average of 9, state agencies an
average of 13, and the county police department reported having 7 full-time administrators.
The following two figures present the average number of full-time administrative personnel for
municipal police departments and sheriffs’ agencies by agency size.
Digitized by South Carolina State Library
15
2 4 6 8 10
Mean
1
2
3
4
Age
ncy
Size
1
2
3
10
0 4 8 12
Mean
1
2
3
4
Age
ncy
Size
3
5
13
Figure 8. Full-time Administrative Personnel for Municipal Departments
Notes: 1 = small, 2 = moderately small, 3 = medium, 4 = large agency.
Figure 9. Full-time Administrative Personnel for Sheriffs’ Agencies
Notes: 1 = small, 2 = moderately small, 3 = medium, 4 = large agency.
Digitized by South Carolina State Library
16
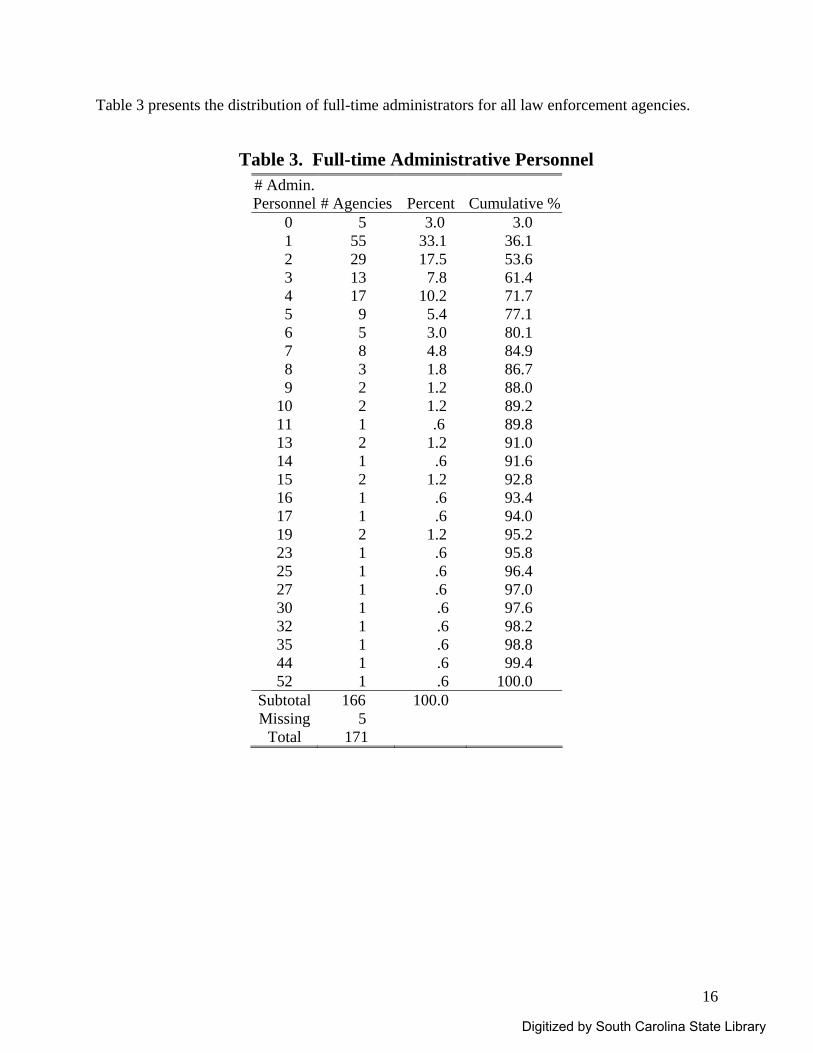
Table 3 presents the distribution of full-time administrators for all law enforcement agencies.
Table 3. Full-time Administrative Personnel # Admin. Personnel
# Agencies
Percent
Cumulative %
0 5 3.0 3.0 1 55 33.1 36.1 2 29 17.5 53.6 3 13 7.8 61.4 4 17 10.2 71.7 5 9 5.4 77.1 6 5 3.0 80.1 7 8 4.8 84.9 8 3 1.8 86.7 9 2 1.2 88.0 10 2 1.2 89.2 11 1 .6 89.8 13 2 1.2 91.0 14 1 .6 91.6 15 2 1.2 92.8 16 1 .6 93.4 17 1 .6 94.0 19 2 1.2 95.2 23 1 .6 95.8 25 1 .6 96.4 27 1 .6 97.0 30 1 .6 97.6 32 1 .6 98.2 35 1 .6 98.8 44 1 .6 99.4 52 1 .6 100.0
Subtotal 166 100.0 Missing 5
Total 171
Digitized by South Carolina State Library
17
When asked to indicate the number of technical support personnel, responses ranged from zero
to 182. The average was 11, and the median indicates just over half of all agencies had 4 or
fewer. One-fifth of participating agencies (30) indicated they had zero full-time technical
support personnel. Twenty-five percent of agencies indicated they have more than 10 full-time
technical support personnel.
Since a significant responsibility of many agencies, particularly sheriffs’ offices, is the
management of jails and the provision of court services, agencies were asked to report the
number of full-time jail and court personnel. The majority of law enforcement agencies in South
Carolina did not employ full-time jail personnel (76%, or 90). (Fifty-three agencies or 31% did
not answer this question.) Of the 23 sheriffs’ agencies answering the question, only 7 indicated
they did not employ jail personnel (9 sheriffs’ agencies did not answer). The number of full-time
jail personnel in sheriffs’ departments ranged from 0 to 306, with an average of 39. Eighty-four
percent (63) of municipal police departments did not employ full-time jail personnel and 12 did.
The number employed ranged from 1 to 33 with an average of 1.4. (Thirty-five municipal
departments or 32% did not answer this question.)
Sixty-nine percent (86) of law enforcement agencies indicated they do not employ any full-time
court operations personnel. The number employed ranged from 0 to 76 with a mean of 3. (Forty-
seven agencies or 28% did not answer this question.) Of the 28 sheriffs’ agencies answering the
question (4 did not), only five indicated they did not employ any full-time court operations
personnel. The number employed ranged from 0 to 76 with an average of 13. Only 13 municipal
police departments reported employing full-time court operations personnel, while 83% (63) did
Digitized by South Carolina State Library
18
not. (Thirty-five or 32% did not answer the question.) The number employed ranged from 0 to
10 with an average of .5.
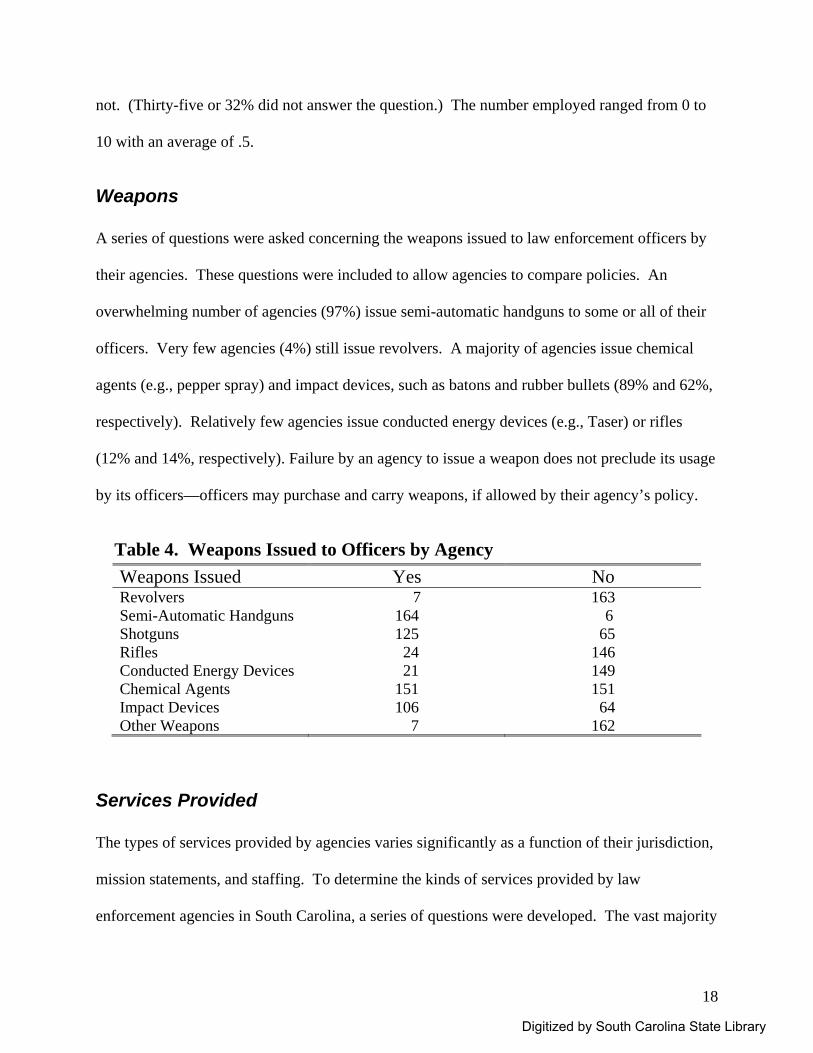
Weapons A series of questions were asked concerning the weapons issued to law enforcement officers by
their agencies. These questions were included to allow agencies to compare policies. An
overwhelming number of agencies (97%) issue semi-automatic handguns to some or all of their
officers. Very few agencies (4%) still issue revolvers. A majority of agencies issue chemical
agents (e.g., pepper spray) and impact devices, such as batons and rubber bullets (89% and 62%,
respectively). Relatively few agencies issue conducted energy devices (e.g., Taser) or rifles
(12% and 14%, respectively). Failure by an agency to issue a weapon does not preclude its usage
by its officers—officers may purchase and carry weapons, if allowed by their agency’s policy.
Table 4. Weapons Issued to Officers by Agency Weapons Issued Yes No Revolvers 7 163 Semi-Automatic Handguns 164 6 Shotguns 125 65 Rifles 24 146 Conducted Energy Devices 21 149 Chemical Agents 151 151 Impact Devices 106 64 Other Weapons 7 162
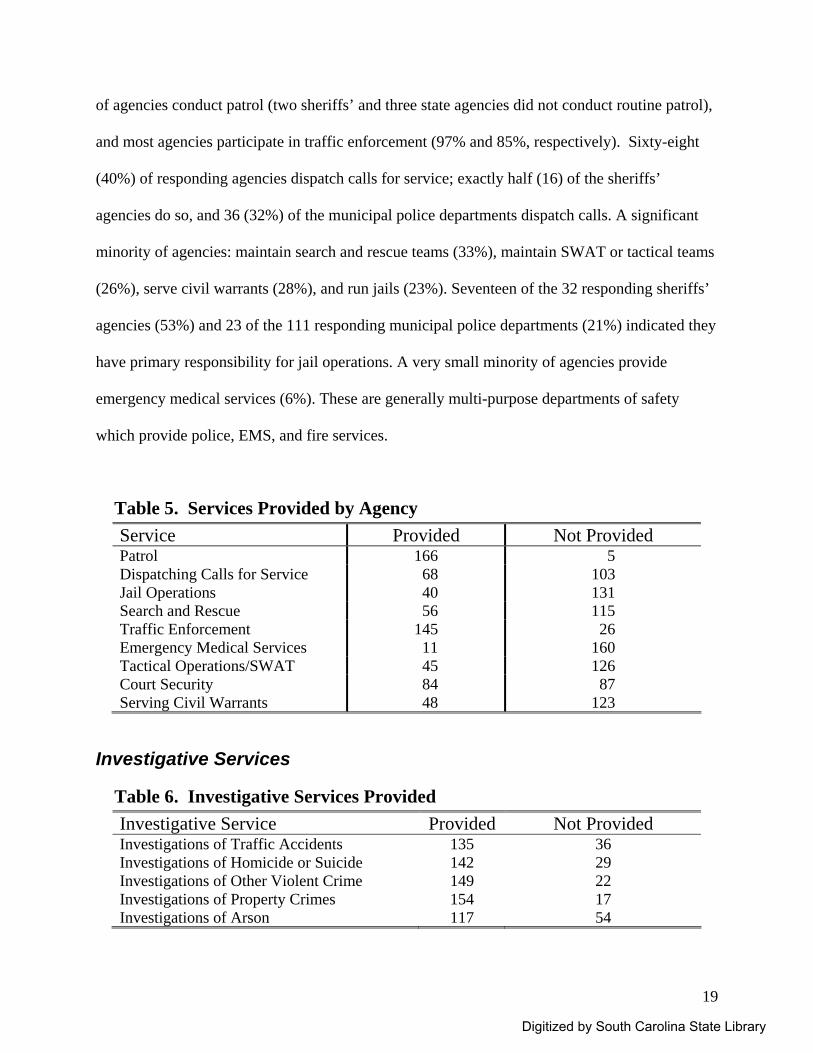
Services Provided The types of services provided by agencies varies significantly as a function of their jurisdiction,
mission statements, and staffing. To determine the kinds of services provided by law
enforcement agencies in South Carolina, a series of questions were developed. The vast majority
Digitized by South Carolina State Library
19
of agencies conduct patrol (two sheriffs’ and three state agencies did not conduct routine patrol),
and most agencies participate in traffic enforcement (97% and 85%, respectively). Sixty-eight
(40%) of responding agencies dispatch calls for service; exactly half (16) of the sheriffs’
agencies do so, and 36 (32%) of the municipal police departments dispatch calls. A significant
minority of agencies: maintain search and rescue teams (33%), maintain SWAT or tactical teams
(26%), serve civil warrants (28%), and run jails (23%). Seventeen of the 32 responding sheriffs’
agencies (53%) and 23 of the 111 responding municipal police departments (21%) indicated they
have primary responsibility for jail operations. A very small minority of agencies provide
emergency medical services (6%). These are generally multi-purpose departments of safety
which provide police, EMS, and fire services.
Table 5. Services Provided by Agency Service Provided Not Provided Patrol 166 5 Dispatching Calls for Service 68 103 Jail Operations 40 131 Search and Rescue 56 115 Traffic Enforcement 145 26 Emergency Medical Services 11 160 Tactical Operations/SWAT 45 126 Court Security 84 87 Serving Civil Warrants 48 123
Investigative Services
Table 6. Investigative Services Provided Investigative Service Provided Not Provided Investigations of Traffic Accidents 135 36 Investigations of Homicide or Suicide 142 29 Investigations of Other Violent Crime 149 22 Investigations of Property Crimes 154 17 Investigations of Arson 117 54
Digitized by South Carolina State Library
20
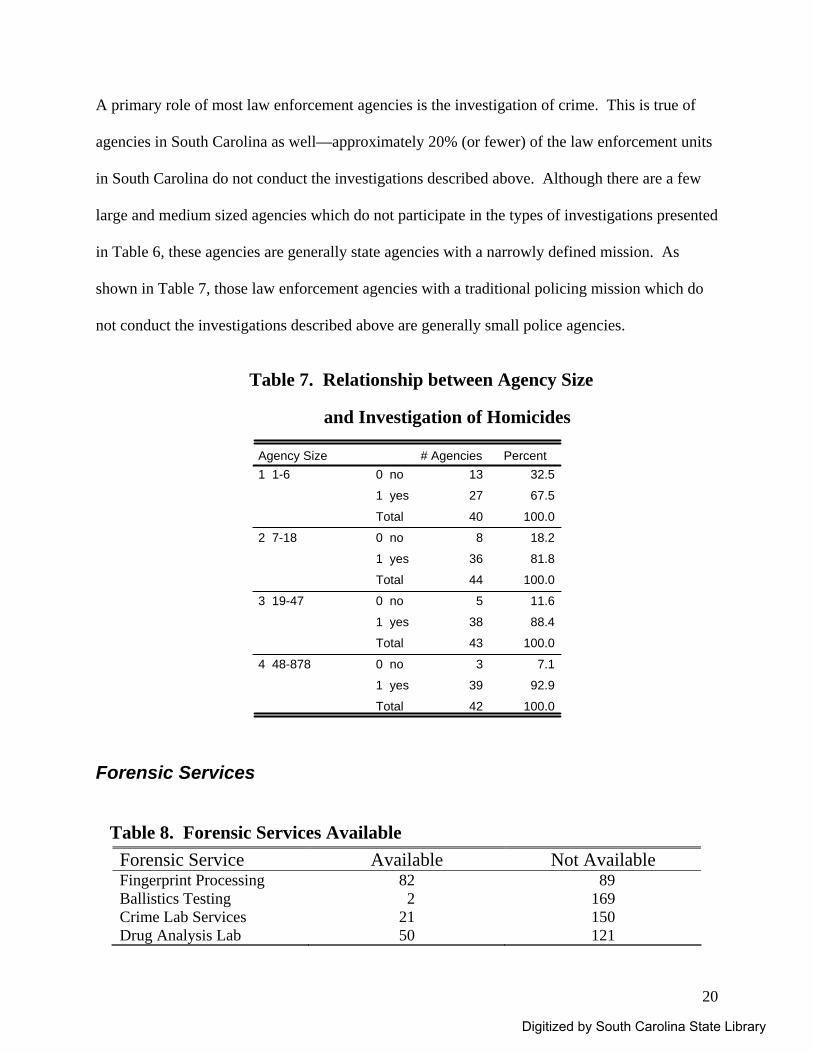
A primary role of most law enforcement agencies is the investigation of crime. This is true of
agencies in South Carolina as well—approximately 20% (or fewer) of the law enforcement units
in South Carolina do not conduct the investigations described above. Although there are a few
large and medium sized agencies which do not participate in the types of investigations presented
in Table 6, these agencies are generally state agencies with a narrowly defined mission. As
shown in Table 7, those law enforcement agencies with a traditional policing mission which do
not conduct the investigations described above are generally small police agencies.
Table 7. Relationship between Agency Size
and Investigation of Homicides
13 32.5
27 67.5
40 100.0
8 18.2
36 81.8
44 100.0
5 11.6
38 88.4
43 100.0
3 7.1
39 92.9
42 100.0
0 no
1 yes
Total
0 no
1 yes
Total
0 no
1 yes
Total
0 no
1 yes
Total
Agency Size1 1-6
2 7-18
3 19-47
4 48-878
# Agencies Percent
Forensic Services
Table 8. Forensic Services Available Forensic Service Available Not Available Fingerprint Processing 82 89 Ballistics Testing 2 169 Crime Lab Services 21 150 Drug Analysis Lab 50 121
Digitized by South Carolina State Library
21
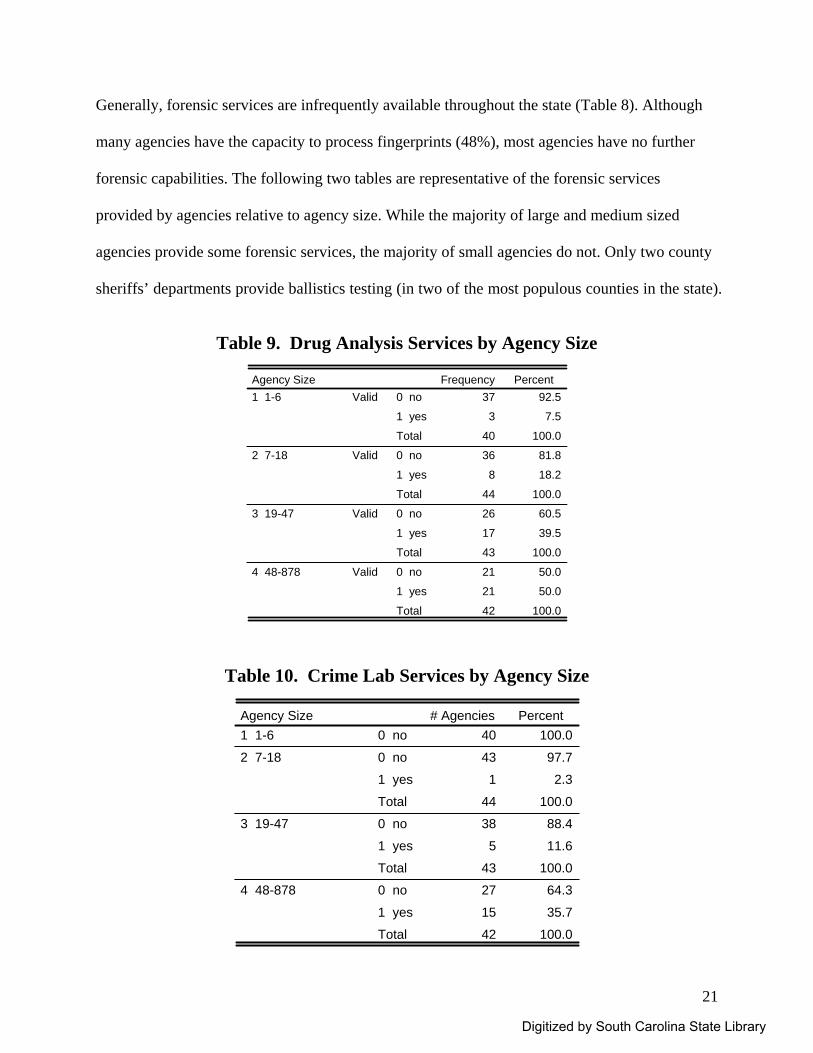
Generally, forensic services are infrequently available throughout the state (Table 8). Although
many agencies have the capacity to process fingerprints (48%), most agencies have no further
forensic capabilities. The following two tables are representative of the forensic services
provided by agencies relative to agency size. While the majority of large and medium sized
agencies provide some forensic services, the majority of small agencies do not. Only two county
sheriffs’ departments provide ballistics testing (in two of the most populous counties in the state).
Table 9. Drug Analysis Services by Agency Size
37 92.5
3 7.5
40 100.0
36 81.8
8 18.2
44 100.0
26 60.5
17 39.5
43 100.0
21 50.0
21 50.0
42 100.0
0 no
1 yes
Total
Valid
0 no
1 yes
Total
Valid
0 no
1 yes
Total
Valid
0 no
1 yes
Total
Valid
Agency Size1 1-6
2 7-18
3 19-47
4 48-878
Frequency Percent
Table 10. Crime Lab Services by Agency Size
40 100.0
43 97.7
1 2.3
44 100.0
38 88.4
5 11.6
43 100.0
27 64.3
15 35.7
42 100.0
0 no
0 no
1 yes
Total
0 no
1 yes
Total
0 no
1 yes
Total
Agency Size1 1-6
2 7-18
3 19-47
4 48-878
# Agencies Percent
Digitized by South Carolina State Library
22
911 System Of the 171 agencies responding, 87% (144 agencies) indicated they use a 911 system. The
following table describes who runs those 911 systems. While the city or county represents a slim
majority, it is common for the agency to run the 911 system.
Table 11. Who Manages Agency’s 911 System?
30 17.5
86 50.3
28 16.4
5 2.9
149 87.1
Your Agency
City or County
CountySheriff's Dept.
Other
Total
Frequency Percent
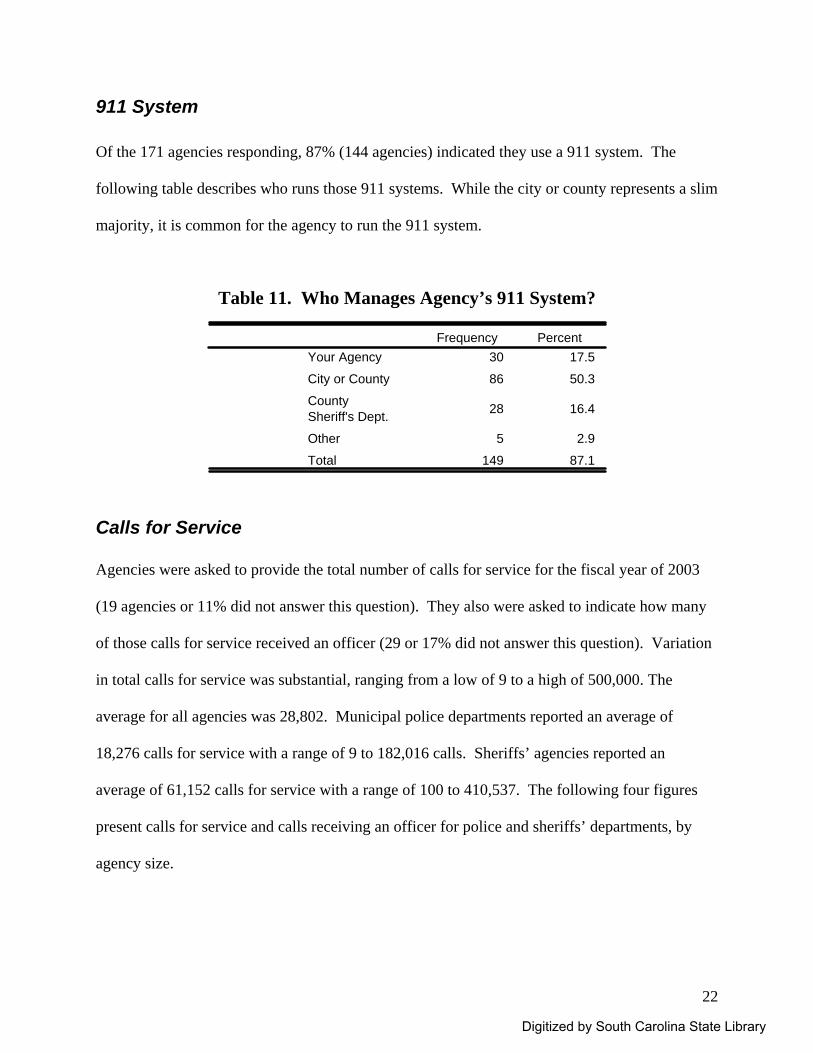
Calls for Service Agencies were asked to provide the total number of calls for service for the fiscal year of 2003
(19 agencies or 11% did not answer this question). They also were asked to indicate how many
of those calls for service received an officer (29 or 17% did not answer this question). Variation
in total calls for service was substantial, ranging from a low of 9 to a high of 500,000. The
average for all agencies was 28,802. Municipal police departments reported an average of
18,276 calls for service with a range of 9 to 182,016 calls. Sheriffs’ agencies reported an
average of 61,152 calls for service with a range of 100 to 410,537. The following four figures
present calls for service and calls receiving an officer for police and sheriffs’ departments, by
agency size.
Digitized by South Carolina State Library
23
Figure 10. Average Number of Calls for Service by Agency Size
Notes: 1 = 1-6, 2 = 7-18, 3 = 19-47, 4 = 48-878 sworn.
Figure 11. Average Number of Calls for Service Receiving an Officer
Notes: 1 = 1-6, 2 = 7-18, 3 = 19-47, 4 = 48-878 sworn; 17% (29) of the agencies did not answer this question.
0 25000 50000 75000
Mean
1
2
3
4
Age
ncy
Size
5099
4601
14963
86543
0 20000 40000 60000
Mean
1
2
3
4
Age
ncy
Size
4350
3853
12913
66330
Digitized by South Carolina State Library
24
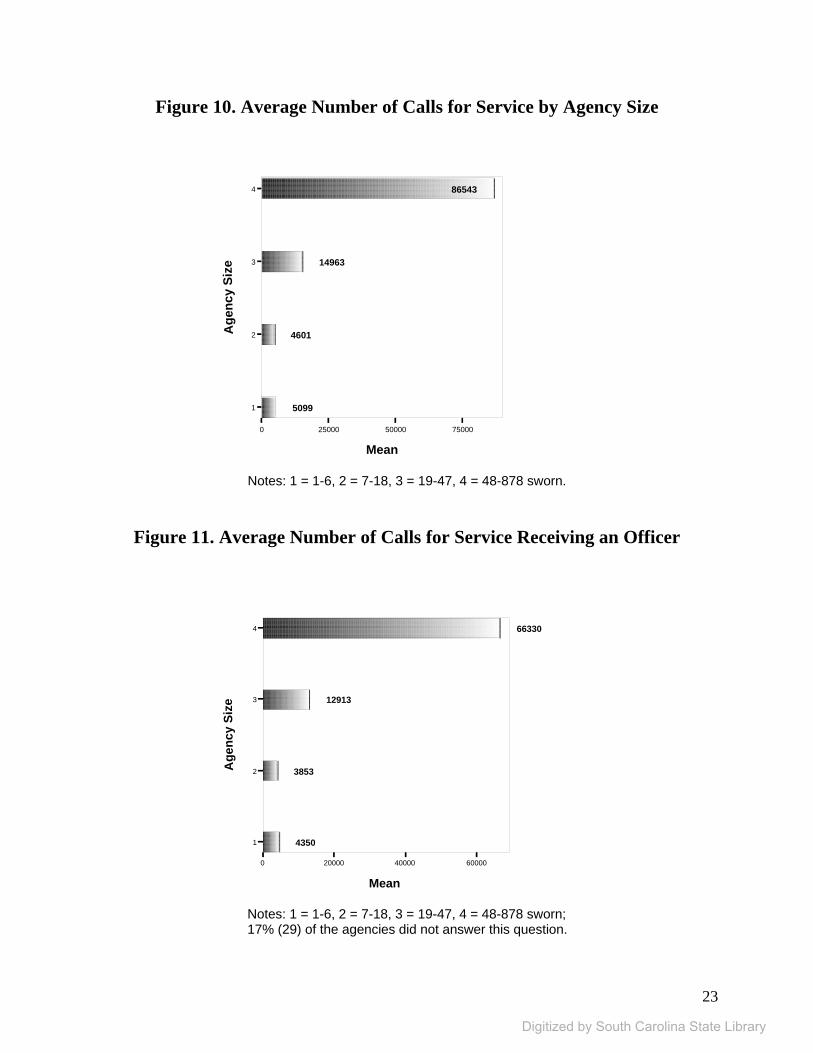
Figure 12: Average # of Calls for Service by Agency Size: Municipal PDs
Notes: 1 = small, 2 = moderately small, 3 = medium, 4 = large agency.
Figure 13. Average # of Calls for Service Receiving a Police Officer by Agency Size: Municipal PDs
Notes: 1 = small, 2 = moderately small, 3 = medium, 4 = large agency.
0 20000 40000 60000
Mean
1
2
3
4
Age
ncy
Size
5774
3549
13228
72025
0 20000 40000 60000
Mean
1
2
3
4
Age
ncy
Size
4940
2942
10779
60424
Digitized by South Carolina State Library
25
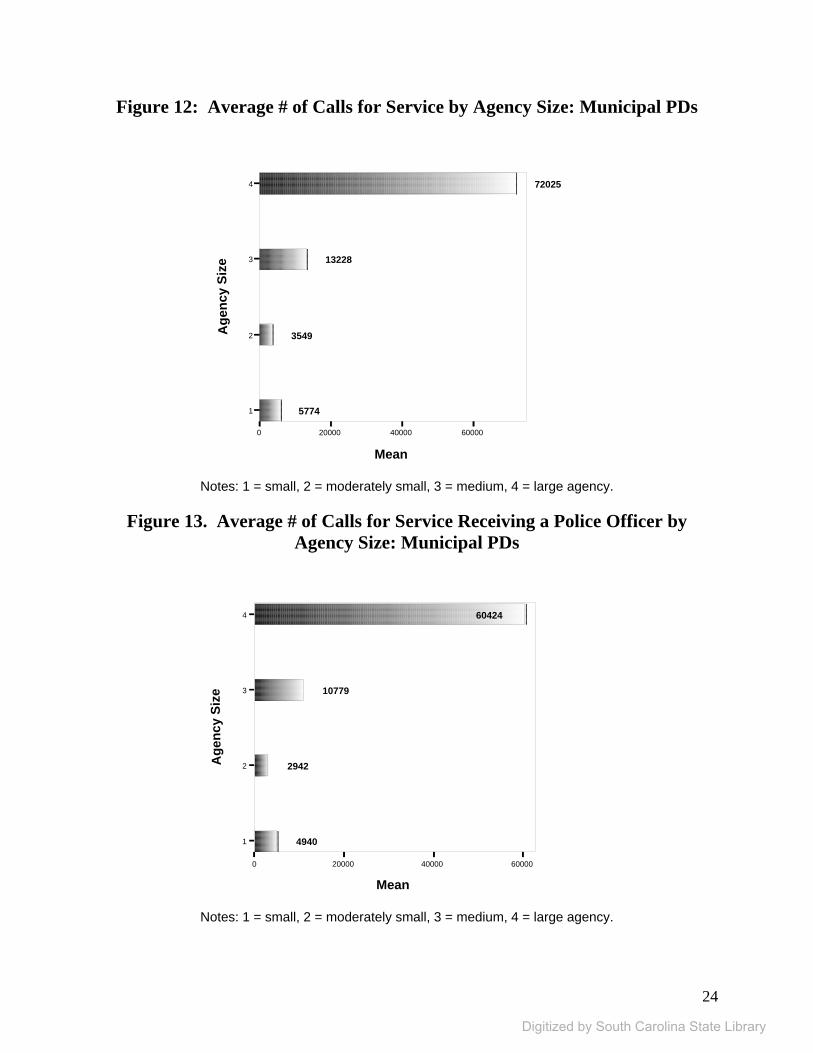
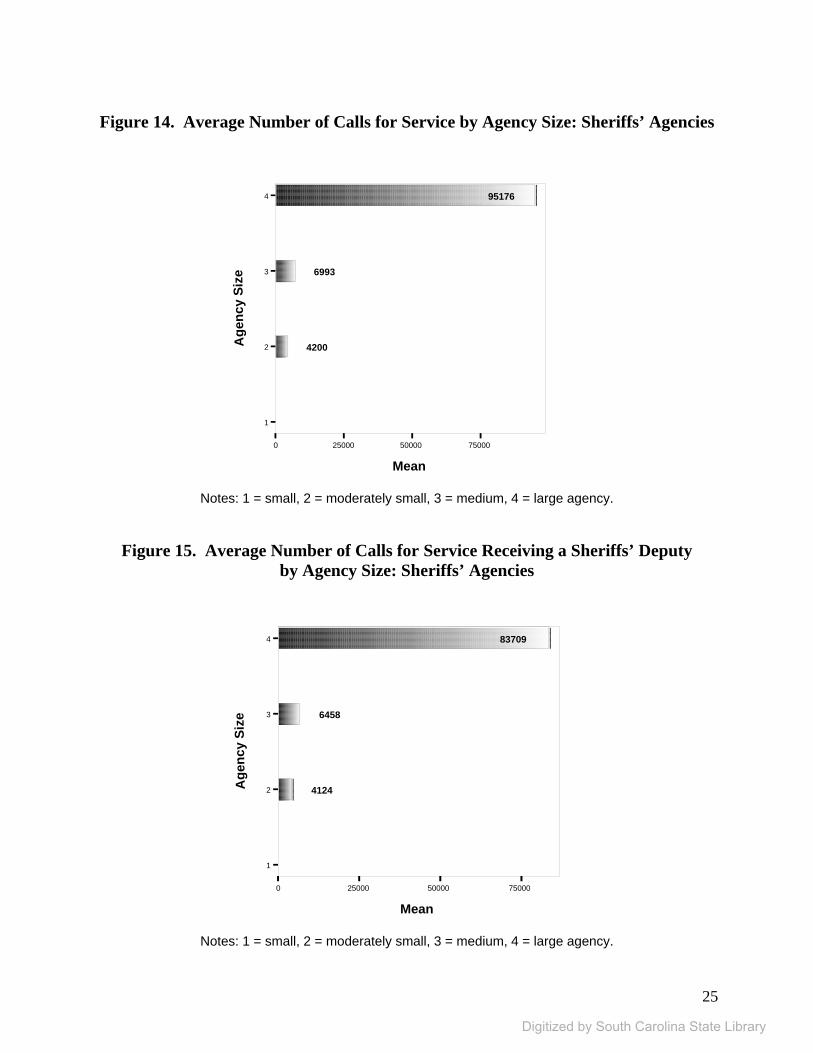
Figure 14. Average Number of Calls for Service by Agency Size: Sheriffs’ Agencies
Notes: 1 = small, 2 = moderately small, 3 = medium, 4 = large agency.
Figure 15. Average Number of Calls for Service Receiving a Sheriffs’ Deputy by Agency Size: Sheriffs’ Agencies
Notes: 1 = small, 2 = moderately small, 3 = medium, 4 = large agency.
0 25000 50000 75000
Mean
1
2
3
4
Age
ncy
Size
4200
6993
95176
0 25000 50000 75000
Mean
1
2
3
4
Age
ncy
Size
4124
6458
83709
Digitized by South Carolina State Library
26
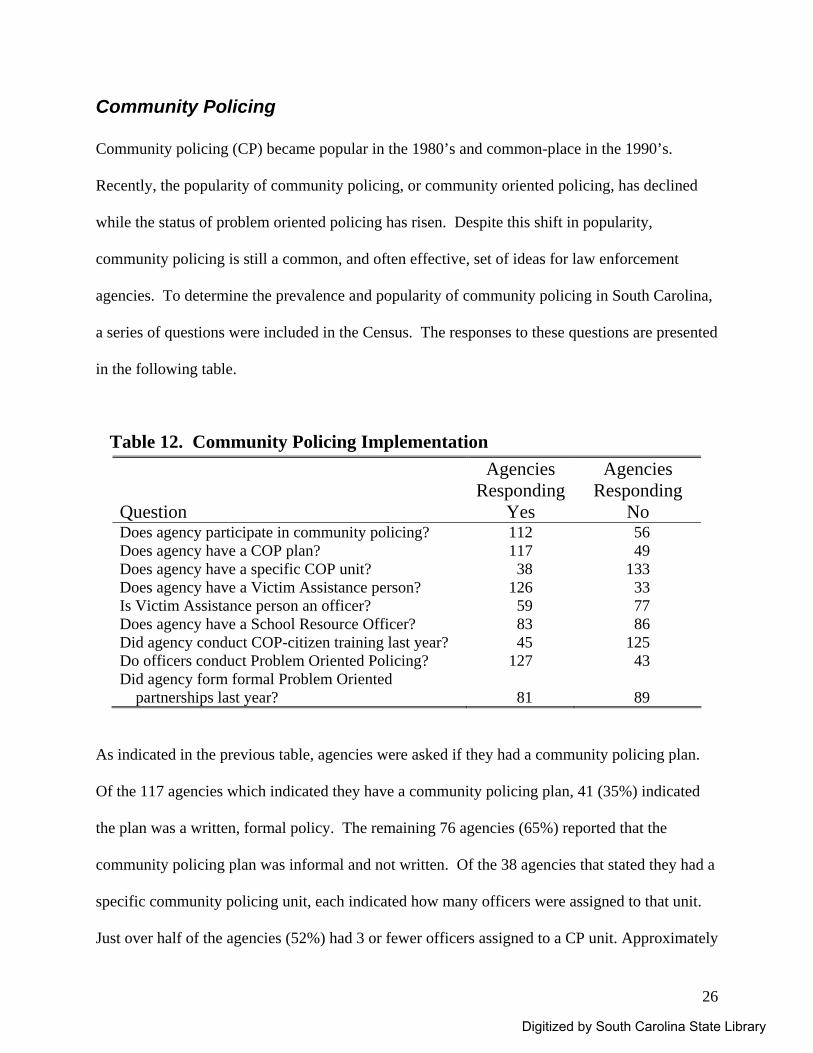
Community Policing Community policing (CP) became popular in the 1980’s and common-place in the 1990’s.
Recently, the popularity of community policing, or community oriented policing, has declined
while the status of problem oriented policing has risen. Despite this shift in popularity,
community policing is still a common, and often effective, set of ideas for law enforcement
agencies. To determine the prevalence and popularity of community policing in South Carolina,
a series of questions were included in the Census. The responses to these questions are presented
in the following table.
Table 12. Community Policing Implementation Question
Agencies Responding
Yes
Agencies Responding
No Does agency participate in community policing? 112 56 Does agency have a COP plan? 117 49 Does agency have a specific COP unit? 38 133 Does agency have a Victim Assistance person? 126 33 Is Victim Assistance person an officer? 59 77 Does agency have a School Resource Officer? 83 86 Did agency conduct COP-citizen training last year? 45 125 Do officers conduct Problem Oriented Policing? 127 43 Did agency form formal Problem Oriented partnerships last year?
81
89
As indicated in the previous table, agencies were asked if they had a community policing plan.
Of the 117 agencies which indicated they have a community policing plan, 41 (35%) indicated
the plan was a written, formal policy. The remaining 76 agencies (65%) reported that the
community policing plan was informal and not written. Of the 38 agencies that stated they had a
specific community policing unit, each indicated how many officers were assigned to that unit.
Just over half of the agencies (52%) had 3 or fewer officers assigned to a CP unit. Approximately
Digitized by South Carolina State Library
27
another third (32%) had 4 to 9 officers in a CP unit, while the remaining 4 agencies assigned 12
to 27 officers to a CP unit.
Respondents also were asked if their agency supplied one or more School Resource Officers
(SROs), and if so, how many. (Note that 76 or nearly half (44%) of the reporting agencies did
not indicate how many SROs they had. Thus the following figures must be viewed with caution
as they are unlikely to reflect the true distribution of SROs across law enforcement agencies in
South Carolina.) Eighty-three or just under half (49%) of the 169 agencies that answered this
question indicated they assign one or more SRO officers. Of these agencies, about half (51%)
had 1 or 2 SROs and about another third (31%) had 3 to 5. Of the remaining 15 agencies, 10 had
6 to 10 SRO officers, 4 had 12 to 19, and one agency reported having 55 SROs.
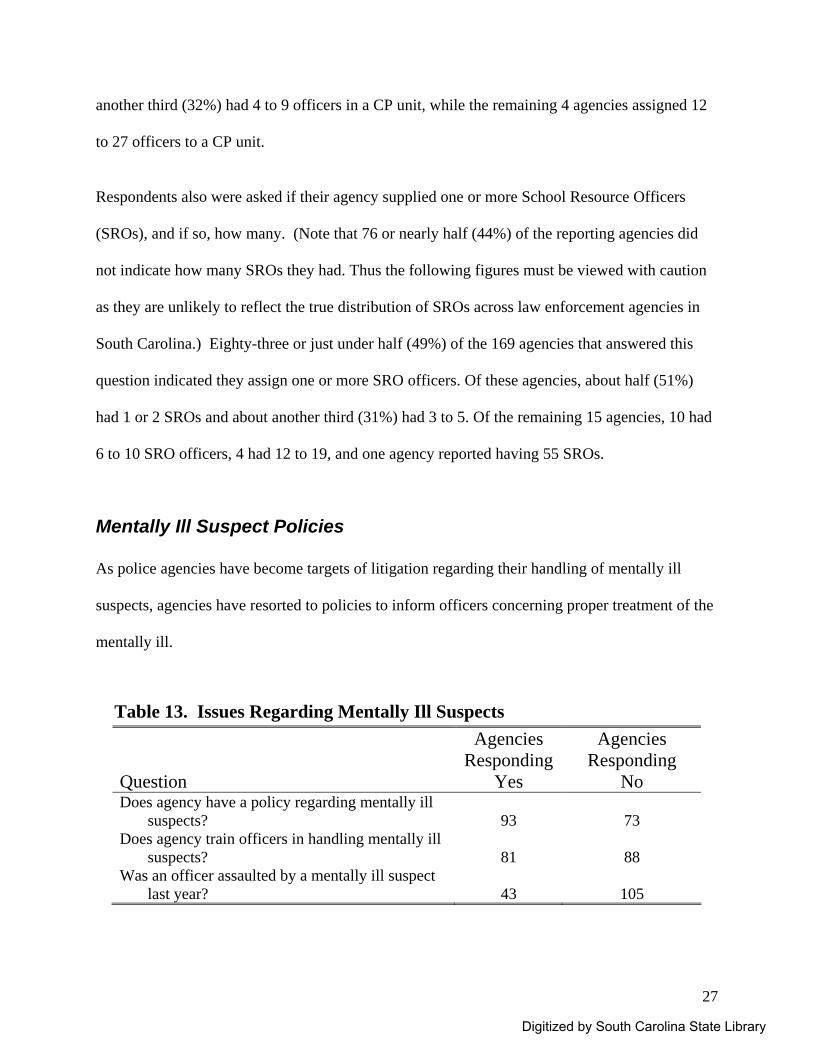
Mentally Ill Suspect Policies As police agencies have become targets of litigation regarding their handling of mentally ill
suspects, agencies have resorted to policies to inform officers concerning proper treatment of the
mentally ill.
Table 13. Issues Regarding Mentally Ill Suspects Question
Agencies Responding
Yes
Agencies Responding
No Does agency have a policy regarding mentally ill suspects?
93
73
Does agency train officers in handling mentally ill suspects?
81
88
Was an officer assaulted by a mentally ill suspect last year?
43
105
Digitized by South Carolina State Library
28
Although over half of the agencies (56%) have a policy regarding the handling of mentally ill
suspects, fewer than half of the responding agencies conduct training specific to this area (48%).
This is particularly noteworthy as nearly a third of agencies (29%) reported that an officer was
assaulted by a mentally ill suspect in the past year (note that 23% of the agencies did not respond
to this question). That officers were assaulted by mentally ill suspects in almost a third of
responding agencies suggests that more agencies should considering developing policies and
training to address the handling of these suspects.
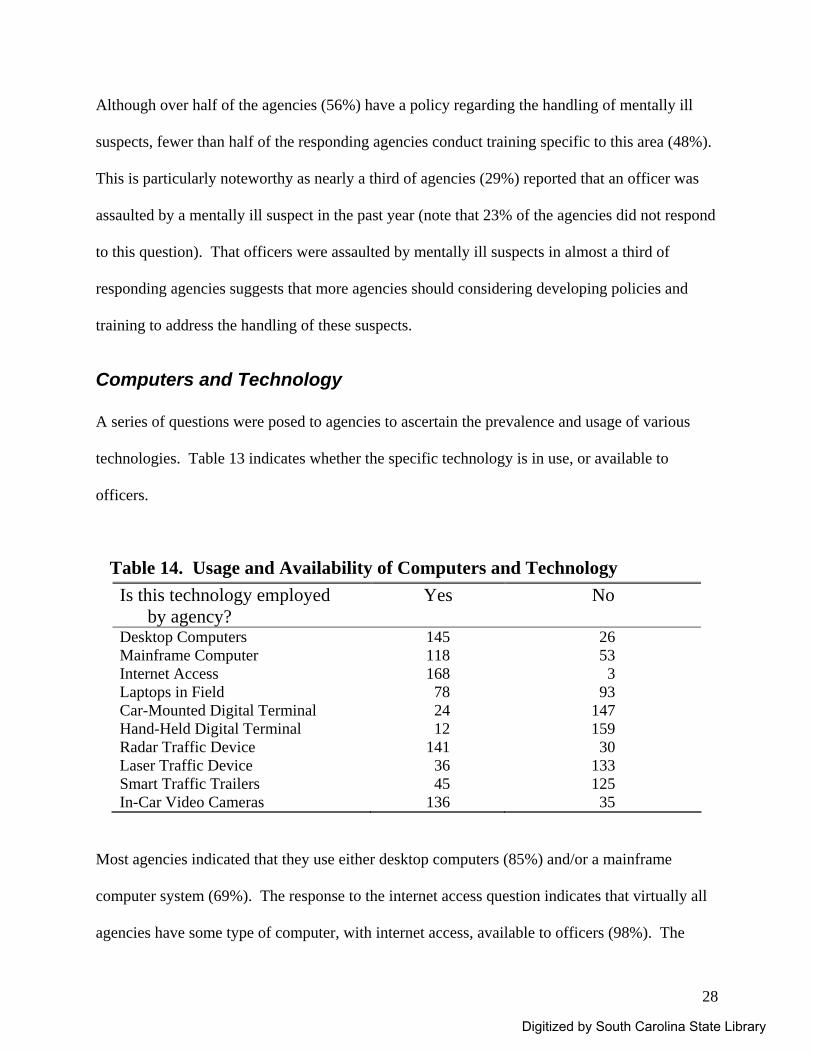
Computers and Technology A series of questions were posed to agencies to ascertain the prevalence and usage of various
technologies. Table 13 indicates whether the specific technology is in use, or available to
officers.
Table 14. Usage and Availability of Computers and Technology Is this technology employed by agency?
Yes No
Desktop Computers 145 26 Mainframe Computer 118 53 Internet Access 168 3 Laptops in Field 78 93 Car-Mounted Digital Terminal 24 147 Hand-Held Digital Terminal 12 159 Radar Traffic Device 141 30 Laser Traffic Device 36 133 Smart Traffic Trailers 45 125 In-Car Video Cameras 136 35
Most agencies indicated that they use either desktop computers (85%) and/or a mainframe
computer system (69%). The response to the internet access question indicates that virtually all
agencies have some type of computer, with internet access, available to officers (98%). The
Digitized by South Carolina State Library
29
usage of laptop computers in the field is much less common, with fewer than half of all agencies
indicating usage of these devices (46%). This will likely change over the years with the
continuing decline in computer prices and the increased reliance on computer aided dispatch.
Few agencies use either car or hand held digital terminals (14% and 7%, respectively). These
devices are useful for quick exchange of information between dispatchers, officers, and
investigators. However, they are expensive and difficult to integrate into routine patrol work.
Most agencies (83%) use a radar device for identifying vehicles traveling over the speed limit.
Laser and smart-trailers are less common (21% and 27%, respectively). Finally, 80% of
reporting agencies indicate that they are currently using in-car video cameras.
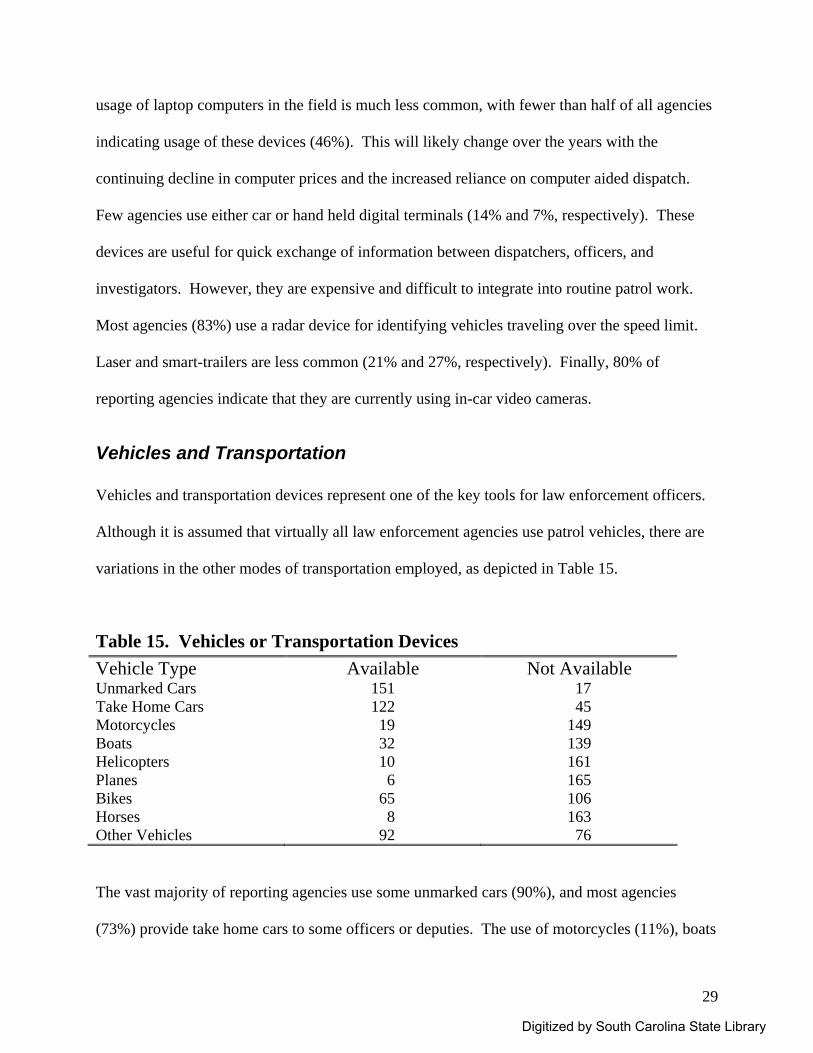
Vehicles and Transportation Vehicles and transportation devices represent one of the key tools for law enforcement officers.
Although it is assumed that virtually all law enforcement agencies use patrol vehicles, there are
variations in the other modes of transportation employed, as depicted in Table 15.
Table 15. Vehicles or Transportation Devices Vehicle Type Available Not Available Unmarked Cars 151 17 Take Home Cars 122 45 Motorcycles 19 149 Boats 32 139 Helicopters 10 161 Planes 6 165 Bikes 65 106 Horses 8 163 Other Vehicles 92 76
The vast majority of reporting agencies use some unmarked cars (90%), and most agencies
(73%) provide take home cars to some officers or deputies. The use of motorcycles (11%), boats
Digitized by South Carolina State Library
30
(19%), and horses (5%) are relatively rare among reporting agencies. Surprisingly, bikes are
used by 38% of reporting agencies. A few agencies have access to helicopters and planes,
although these are typically in the largest agencies.
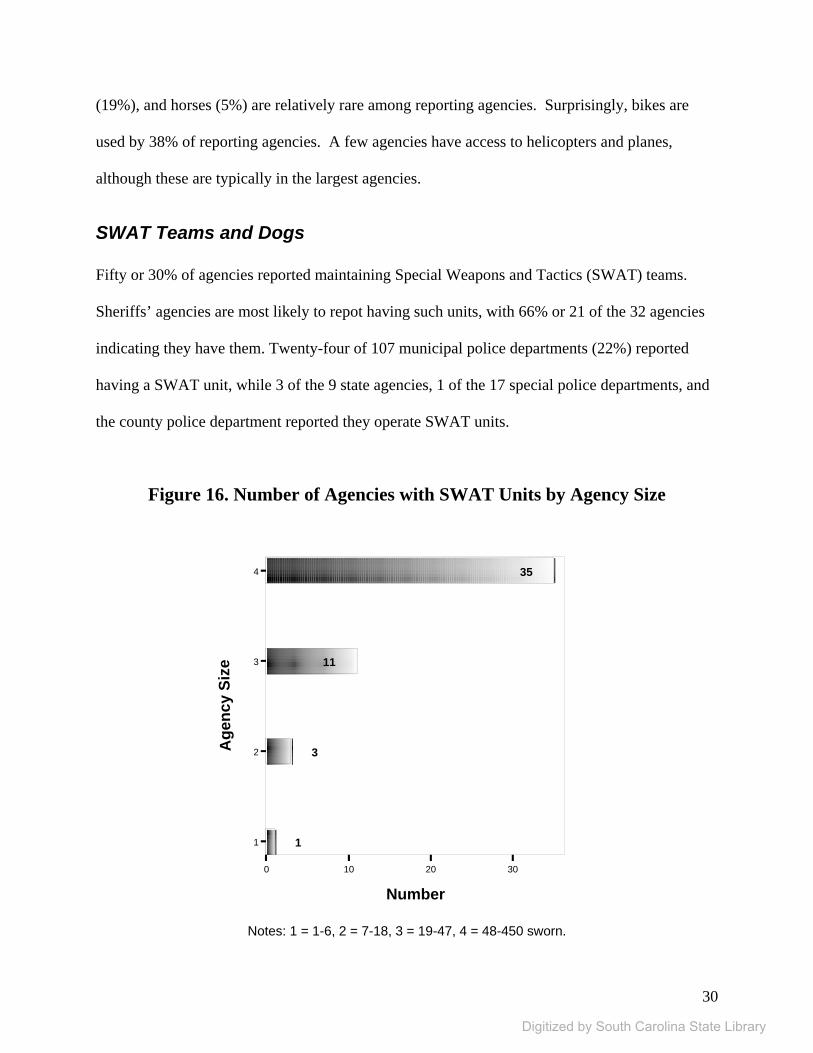
SWAT Teams and Dogs Fifty or 30% of agencies reported maintaining Special Weapons and Tactics (SWAT) teams.
Sheriffs’ agencies are most likely to repot having such units, with 66% or 21 of the 32 agencies
indicating they have them. Twenty-four of 107 municipal police departments (22%) reported
having a SWAT unit, while 3 of the 9 state agencies, 1 of the 17 special police departments, and
the county police department reported they operate SWAT units.
Figure 16. Number of Agencies with SWAT Units by Agency Size
0 10 20 30
Number
1
2
3
4
Age
ncy
Size
1
3
11
35
Notes: 1 = 1-6, 2 = 7-18, 3 = 19-47, 4 = 48-450 sworn.
Digitized by South Carolina State Library
31
Although 105 or 61% of responding agencies did not indicate how many of their officers were
assigned to a SWAT unit, the 54 agencies that did report figures indicated the size of their
SWAT teams ranged from 1 to 30 officers (12 agencies indicated they had zero officers
assigned). Over half (56%) of all SWAT teams had between 12 and 30 officers. Note that since
so many reporting agencies did not answer this question, these figures are unlikely to reflect the
true distribution of the number of officers assigned to SWAT units in South Carolina. Figure 16
above indicates the mean number of SWAT officers relative to the size of the agency.
Regarding dogs, 83 law enforcement agencies indicated they retain them (either for use in
tracking suspects or locating drugs/weapons/explosive devices) while 88 agencies do not keep
dogs. Nearly all sheriffs’ agencies used dogs for law enforcement purposes (88%), while 46% of
municipal police departments, a third of state agencies, and the county police department
reported doing so. None of the responding special police departments indicated they used dogs.
Training and Accreditation South Carolina is fortunate to have a single training academy to serve all law enforcement
agencies in the state. However, post-academy training policies vary significantly among
agencies. Several questions were posed regarding their post-academy training programs and the
length of those programs.
A substantial majority, 116 of the 171 reporting agencies (69%), indicated that they require post-
academy training. These post-academy training programs fall into two categories—classroom
hours and supervised hours. The number of required classroom hours ranged from 2 to 440. The
average number of classroom training hours was 48 and the median was about 40 hours. Thus,
Digitized by South Carolina State Library
32
about one fifth (22%) of agencies required no classroom training following the academy, about
one forth (27%) required approximately 40 hours (or one week) of classroom training, and about
another fourth of reporting agencies required either more than 40 hours of classroom training.
The figures for the number of classroom training hours should be viewed with caution since 66
or 39% of the reporting agencies did not answer this question.
Even a greater proportion of agencies required a post-academy period of supervised hours,
generally considered to be a probationary period during which new officers are evaluated and
trained by senior officers. The range of supervised hours was substantial; the low was 4 hours
and the high was 960 hours. Of the 119 agencies answering this question, all but 6 or 95%
indicated they required supervised hours following completion of the academy. The mean
number of required hours was 226 and the median was approximately 200 hours. The figures for
the number of supervised hours should be viewed with caution since 52 or 30% of the reporting
agencies did not answer this question.
When asked about accreditation, 22 (13%) of the 170 agencies indicated they are accredited by a
national accrediting agency. Another 36 (24%) of 147 responding agencies indicated they are
currently seeking accreditation by a national accrediting agency (24 or 14% did not answer this
question). To recognize the diligence of those agencies that have gained accreditation, and to
provide a resource to those agencies currently pursuing accreditation, the following list is
provided.
Table 16. Accredited Law Enforcement Agencies in South Carolina BUREAU OF PROTECTIVE SERVICES CHARLESTON COUNTY AVIATION AUTH. POLICE DEPT. CHARLESTON COUNTY SHERIFF'S OFFICE CHARLESTON POLICE DEPARTMENT
Digitized by South Carolina State Library
33
Table 16. Continued
COLUMBIA POLICE DEPARTMENT ESTILL POLICE DEPARTMENT GOOSE CREEK POLICE DEPARTMENT GREENVILLE COUNTY SHERIFF’S OFFICE GREENWOOD POLICE DEPARTMENT GREER POLICE DEPARTMENT ISLE OF PALMS POLICE DEPARTMENT LEXINGTON COUNTY SHERIFF’S OFFICE MAULDIN CITY POLICE DEPARTMENT MEDICAL UNIV. OF SC DEPARTMENT OF PUBLIC SAFETY MOUNT PLEASANT POLICE DEPARTMENT ORANGEBURG DEPARTMENT OF PUBLIC SAFETY RIDGELAND POLICE DEPARTMENT ROCK HILL POLICE DEPARTMENT SOCIETY HILL POLICE DEPARTMENT
SOUTH CAROLINA HIGHWAY PATROL SPARTANBURG PUBLIC SAFETY DEPARTMENT UNIV. OF SOUTH CAROLINA LAW ENFORCEMENT DIV.
Drug Investigations and Drug Testing Drug investigations have long been an important responsibility of law enforcement agencies.
Several questions were posed to agencies regarding the separation of drug investigations from
traditional investigations. These findings are presented in Table 17. Just under half (48%) of
agencies had a drug unit and just over half (55%) participated in a multiagency drug task force.
The subsequent table describes how many personnel are assigned to drug units. The average
number was 4 and the median was 2.
Table 17. Drug Investigations Question Yes No Is there a Drug Unit in Agency? 82 89 Agency participates in a Multiagency Drug Task Force? 93 75
Digitized by South Carolina State Library
34
Table 18. Number of Personnel in Drug Unit
14 14.9 14.9
20 21.3 36.2
16 17.0 53.2
8 8.5 61.7
8 8.5 70.2
2 2.1 72.3
4 4.3 76.6
4 4.3 80.9
5 5.3 86.2
2 2.1 88.3
3 3.2 91.5
4 4.3 95.7
2 2.1 97.9
1 1.1 98.9
1 1.1 100.0
94 100.0
77
171
# in Unit0
1
2
3
4
5
6
7
8
9
10
12
15
21
22
Total
Missing
Total
# Agencies PercentCumulative
Percent
Notes: Figures should be viewed with caution as 77 or 45% of responding agencies did not answer this question.
A related set of questions was asked concerning the agency’s internal drug testing. The
following table describes those questions and the responses.
Table 19. Drug Testing Policies Yes No Drug Policy for Testing Employees 135 34 Drug Policy for Testing Applicants 124 45 Random Drug Testing 111 58 Probation Officers Drug Tested 6 163 Promotion Candidates Drug Tested 7 162 Drug Investigators Drug Tested 23 146 Non-Sworn Personnel Drug Tested 19 150 Post-Accident Drug Testing 69 100
Digitized by South Carolina State Library
35
A majority of agencies conducted random drug testing (66%), had an existing policy for testing
current employees (80%), and regularly drug tested applicants for employment (73%). Few
agencies conducted drug testing of promotion candidates (4%), probation officers (4%), non-
sworn personnel (11%), or drug investigators (14%). Forty-one percent of agencies indicated
they conducted drug tests following accidents.
Crime Mapping and Surveys As the technological capacity of law enforcement agencies has evolved, and as the personal
computer has become more powerful, crime mapping has become more prevalent among
policing units. In 1996, the National Institute of Justice reported that nationally fewer than 10%
of law enforcement agencies possessed any crime mapping capability.
Table 20. Crime Mapping Capabilities and Interest Does your agency… Yes No Have any crime mapping capabilities 80 89 Make crime statistics available to officers? 80 85 Map calls to street addresses? 45 124 Map arrests to street addresses? 32 137 Map crimes to beats or census tracts? 17 152 Have any interest in crime mapping training? 133 33
Based on the responses of the participants in the Census, it appears that crime mapping has
become more common over the past few years. Nearly half (47%) of all participating agencies
possess some crime mapping capacity. Although relatively few agencies map calls to a high
level of specificity (by mapping calls to street addresses, mapping arrests to street addresses, or
mapping crimes to beats or tracts), many agencies have some use for crime mapping.
Additionally, a majority of agencies (80%) expressed interest in training in crime mapping.
Digitized by South Carolina State Library
36
An additional tool that law enforcement agencies may utilize is surveys of the public. Law
enforcement agencies conduct surveys for a variety of reasons, ranging from public relations
concerns to ascertaining community needs. We asked a series of questions pertaining to the use
of surveys.
Table 21. Public Surveys Does your agency… Yes No Conduct surveys of the public? 80 90 Survey public satisfaction of the police? 58 112 Survey perceptions of crime? 45 125 Survey victims of crime? 36 134
Nearly half (47%) of responding agencies indicated they had conducted some type of public
survey. About a third of agencies (34%) indicated they had asked residents about satisfaction
with the police, 27% asked about perceptions of crime in the community, and 21% asked victims
of crime about their experience.
Terrorism and Home Security One of the most pressing issues for local law enforcement this decade is the threat of terrorism.
Since September 11, 2001, local law enforcement has been tasked with the substantial
responsibility of serving as the last line of defense in the fight to maintain homeland security.
Although federal agencies may receive the most attention, local agencies play a significant role.
To determine what practices and training efforts are currently underway in South Carolina, a
series of questions regarding terrorism were developed and included in the survey.
Digitized by South Carolina State Library
37
Table 22. Terrorism Policies and Funding Has your agency…. Yes No Developed a policy regarding terrorism threats or incidents? 52 115 Requested federal funding for terrorism response? 64 100 Requested state funding for terrorism response? 43 111 Requested city/county funding for terrorism response? 21 126
Just under one third (31%) of the agencies developed a formal policy specific to responding to
terrorist threats. Fewer than half requested federal (39%), state (28%), or local (city or county)
funding (14%) to prepare for a terrorism or weapons of mass destruction (WMD) response. It
should be noted that not all agencies need to prepare for a response to terrorism. The cost of
equipping and training every local law enforcement agency would be prohibitive. However,
there should be some type of coordination regarding who is in charge in the event of a local
threat or incident. To determine whether agencies have moved to this level of preparation,
agencies were asked to indicate who coordinates their response to an incident.
Table 23. Terrorism Response Coordinator Who Coordinates Terrorism Response? Number Percent Chief or Sheriff 124 75 Fire or EMS Director 7 4 Task Force Director 7 4 Undetermined 7 4 Other 20 12
Overwhelmingly, the agency director is the point person in coordinating a response. In some
cases, a fire or EMS director coordinates the response, and in several cases there is a task force
or emergency response coordinator. When asked to describe the “Other” response, 10 (of the 20)
respondents named a specific office such as the Emergency Preparations Director or the
Emergency Management Department. The remainder of the answers included other local and
Digitized by South Carolina State Library
38
state law enforcement officers (e.g., County Sheriff, SLED Director) or specific officers within
the agency (e.g., Captain of Patrol).
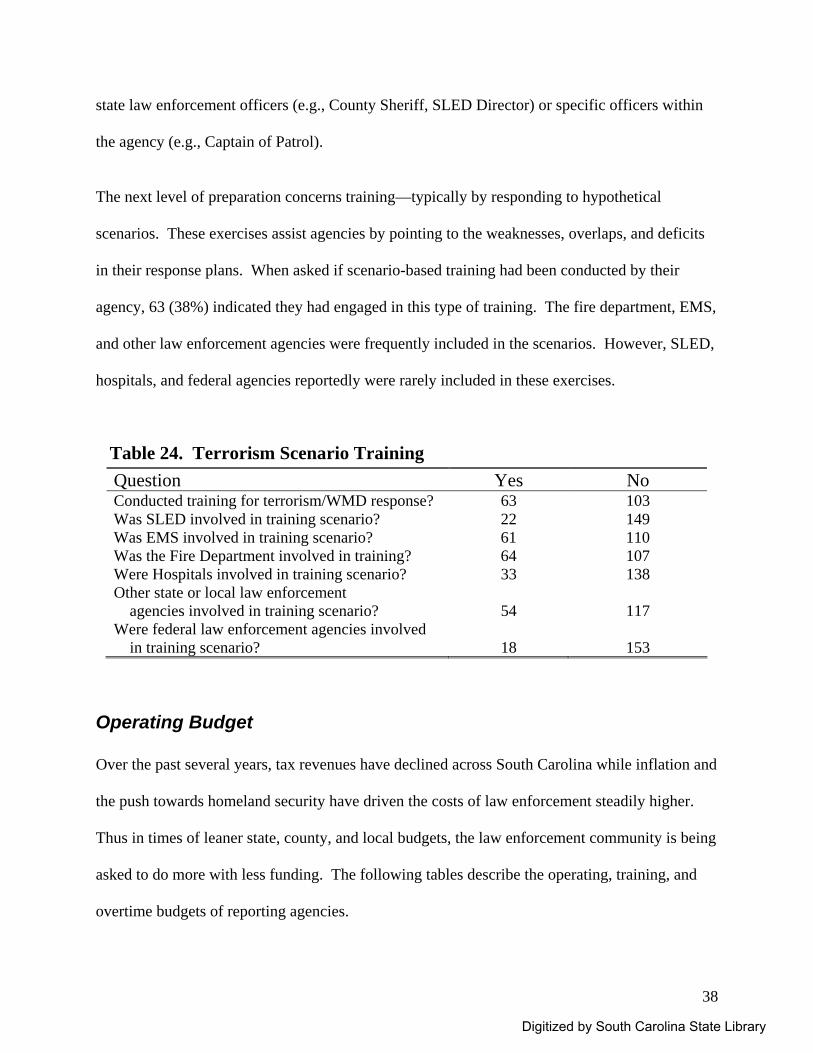
The next level of preparation concerns training—typically by responding to hypothetical
scenarios. These exercises assist agencies by pointing to the weaknesses, overlaps, and deficits
in their response plans. When asked if scenario-based training had been conducted by their
agency, 63 (38%) indicated they had engaged in this type of training. The fire department, EMS,
and other law enforcement agencies were frequently included in the scenarios. However, SLED,
hospitals, and federal agencies reportedly were rarely included in these exercises.
Table 24. Terrorism Scenario Training Question Yes No Conducted training for terrorism/WMD response? 63 103 Was SLED involved in training scenario? 22 149 Was EMS involved in training scenario? 61 110 Was the Fire Department involved in training? 64 107 Were Hospitals involved in training scenario? 33 138 Other state or local law enforcement agencies involved in training scenario?
54
117
Were federal law enforcement agencies involved in training scenario?
18
153
Operating Budget Over the past several years, tax revenues have declined across South Carolina while inflation and
the push towards homeland security have driven the costs of law enforcement steadily higher.
Thus in times of leaner state, county, and local budgets, the law enforcement community is being
asked to do more with less funding. The following tables describe the operating, training, and
overtime budgets of reporting agencies.
Digitized by South Carolina State Library
39
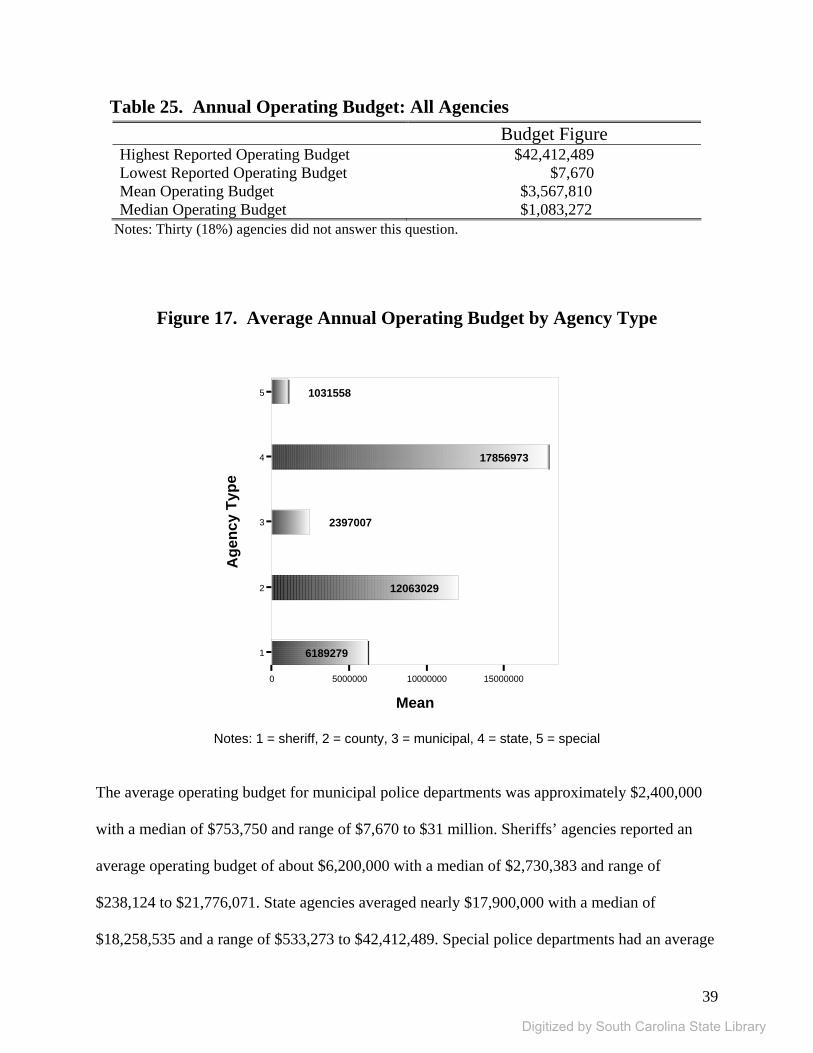
Table 25. Annual Operating Budget: All Agencies Budget Figure Highest Reported Operating Budget $42,412,489 Lowest Reported Operating Budget $7,670 Mean Operating Budget $3,567,810 Median Operating Budget $1,083,272
Notes: Thirty (18%) agencies did not answer this question.
Figure 17. Average Annual Operating Budget by Agency Type
0 5000000 10000000 15000000
Mean
1
2
3
4
5
Age
ncy
Type
6189279
12063029
2397007
17856973
1031558
Notes: 1 = sheriff, 2 = county, 3 = municipal, 4 = state, 5 = special
The average operating budget for municipal police departments was approximately $2,400,000
with a median of $753,750 and range of $7,670 to $31 million. Sheriffs’ agencies reported an
average operating budget of about $6,200,000 with a median of $2,730,383 and range of
$238,124 to $21,776,071. State agencies averaged nearly $17,900,000 with a median of
$18,258,535 and a range of $533,273 to $42,412,489. Special police departments had an average
Digitized by South Carolina State Library
40
operating budget of about $1 million with a median of $637,246 and a range of $79,901 to
$3,388,481, while the county police department reported an operating budget of just over $12
million.
Training budgets were much lower than total operating budgets, with 93% of agencies reporting
a total training budget of less than $100,000. (Note that 34 or 20% of agencies did not answer
this question.) Ten agencies reported training budgets of over $100,000, with two of those
agencies reporting training budgets of over one million. Most agencies (61%) have a training
budget of $10,000 or under. Only 20% of agencies have a training budget of $2,000 or less.
Municipal police departments reported an average training budget of $40,172 with a median of
$5,600 and a range of zero dollars to $1,900,000. Sheriffs’ agencies reported an average training
budget of $37,570 with a median of $15,775 and a range of $1,500 to $345,000. The average for
state agencies was $14,167, the median was $7,500, and the range was zero to $35,000. The
average for special police departments was $209,039, the median was $11,260, and the range
was $2,724,492, while the training budget for the county police department was reported as
$7,671.
Overtime pay represents another significant component of total operating budgets (35 or 21% of
agencies did not report overtime pay). Although the average overtime pay total for fiscal year
2003 was $102,245, the median $25,000. The range was zero to $2,100,000. However, only two
agencies had overtime costs of over $1 million and only 18% of reporting agencies had overtime
costs of over $100,000. Just over one third of agencies (36%) had overtime costs of $10,000 or
less.
Digitized by South Carolina State Library
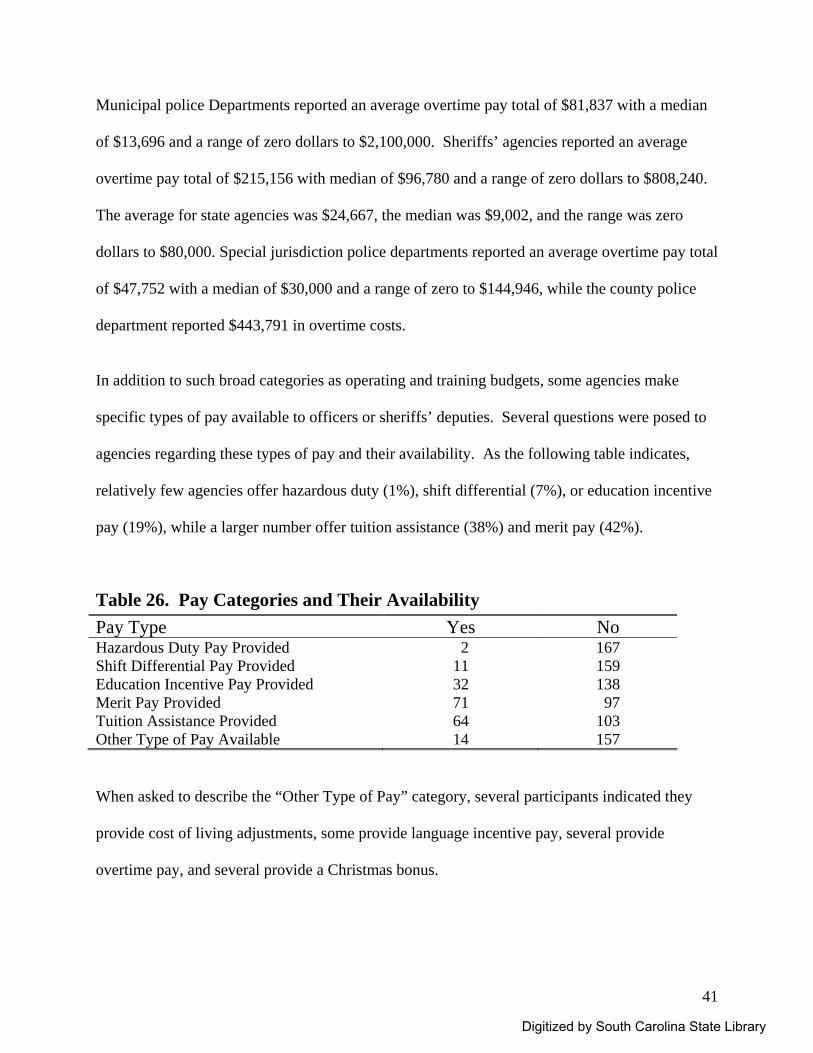
41
Municipal police Departments reported an average overtime pay total of $81,837 with a median
of $13,696 and a range of zero dollars to $2,100,000. Sheriffs’ agencies reported an average
overtime pay total of $215,156 with median of $96,780 and a range of zero dollars to $808,240.
The average for state agencies was $24,667, the median was $9,002, and the range was zero
dollars to $80,000. Special jurisdiction police departments reported an average overtime pay total
of $47,752 with a median of $30,000 and a range of zero to $144,946, while the county police
department reported $443,791 in overtime costs.
In addition to such broad categories as operating and training budgets, some agencies make
specific types of pay available to officers or sheriffs’ deputies. Several questions were posed to
agencies regarding these types of pay and their availability. As the following table indicates,
relatively few agencies offer hazardous duty (1%), shift differential (7%), or education incentive
pay (19%), while a larger number offer tuition assistance (38%) and merit pay (42%).
Table 26. Pay Categories and Their Availability Pay Type Yes No Hazardous Duty Pay Provided 2 167 Shift Differential Pay Provided 11 159 Education Incentive Pay Provided 32 138 Merit Pay Provided 71 97 Tuition Assistance Provided 64 103 Other Type of Pay Available 14 157
When asked to describe the “Other Type of Pay” category, several participants indicated they
provide cost of living adjustments, some provide language incentive pay, several provide
overtime pay, and several provide a Christmas bonus.
Digitized by South Carolina State Library
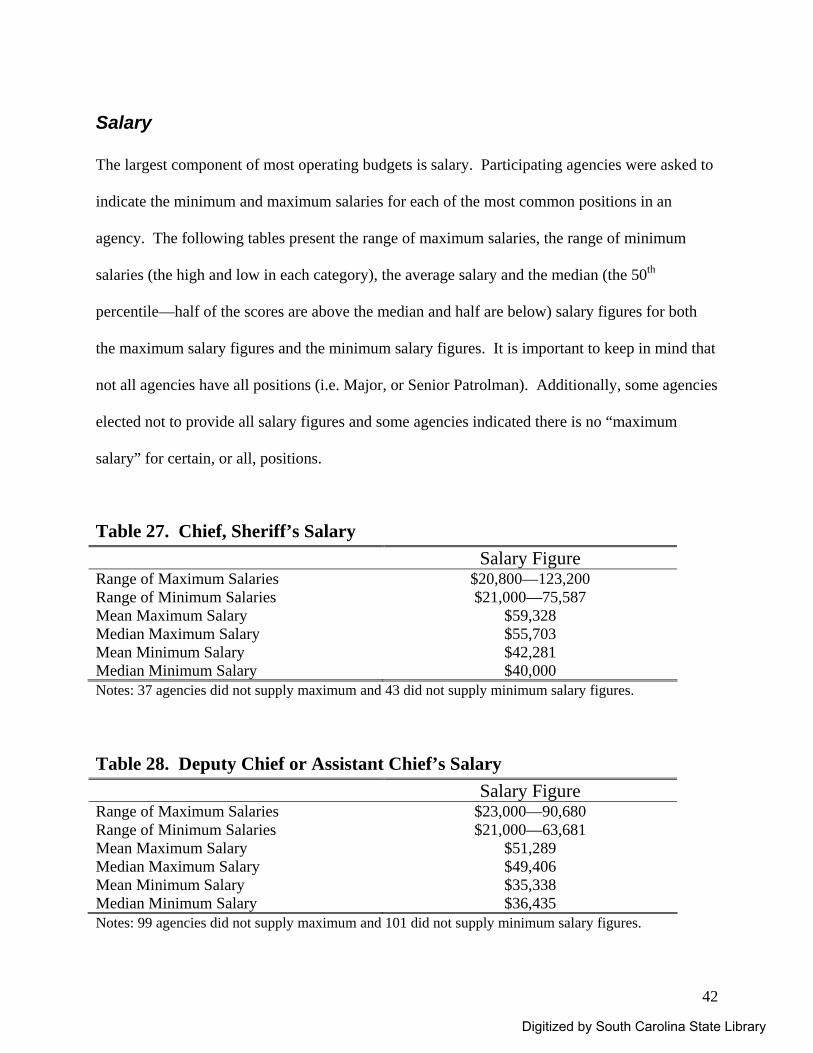
42
Salary The largest component of most operating budgets is salary. Participating agencies were asked to
indicate the minimum and maximum salaries for each of the most common positions in an
agency. The following tables present the range of maximum salaries, the range of minimum
salaries (the high and low in each category), the average salary and the median (the 50th
percentile—half of the scores are above the median and half are below) salary figures for both
the maximum salary figures and the minimum salary figures. It is important to keep in mind that
not all agencies have all positions (i.e. Major, or Senior Patrolman). Additionally, some agencies
elected not to provide all salary figures and some agencies indicated there is no “maximum
salary” for certain, or all, positions.
Table 27. Chief, Sheriff’s Salary Salary Figure
Range of Maximum Salaries $20,800—123,200 Range of Minimum Salaries $21,000—75,587 Mean Maximum Salary $59,328 Median Maximum Salary $55,703 Mean Minimum Salary $42,281 Median Minimum Salary $40,000 Notes: 37 agencies did not supply maximum and 43 did not supply minimum salary figures.
Table 28. Deputy Chief or Assistant Chief’s Salary Salary Figure
Range of Maximum Salaries $23,000—90,680 Range of Minimum Salaries $21,000—63,681 Mean Maximum Salary $51,289 Median Maximum Salary $49,406 Mean Minimum Salary $35,338 Median Minimum Salary $36,435 Notes: 99 agencies did not supply maximum and 101 did not supply minimum salary figures.
Digitized by South Carolina State Library

43
Table 29. Major’s Salary Salary Figure
Range of Maximum Salaries $28,500—94,575 Range of Minimum Salaries $21,395—60,371 Mean Maximum Salary $50,117 Median Maximum Salary $58,509 Mean Minimum Salary $33,640 Median Minimum Salary $39,528 Notes: 126 agencies did not supply maximum and 125 did not supply minimum salary figures.
Table 30. Captain’s Salary Salary Figure
Range of Maximum Salaries $21,000—77,392 Range of Minimum Salaries $20,000—66,543 Mean Maximum Salary $50,272 Median Maximum Salary $50,208 Mean Minimum Salary $34,574 Median Minimum Salary $37,111 Notes: 88 agencies did not supply maximum and 90 did not supply minimum salary figures.
Table 31. Lieutenant’s Salary Salary Figure
Range of Maximum Salaries $21,000—66,656 Range of Minimum Salaries $19,900—50,387 Mean Maximum Salary $42,710 Median Maximum Salary $45,000 Mean Minimum Salary $30,528 Median Minimum Salary $30,912 Notes: 63 agencies did not supply maximum and 67 did not supply minimum salary figures.
Digitized by South Carolina State Library
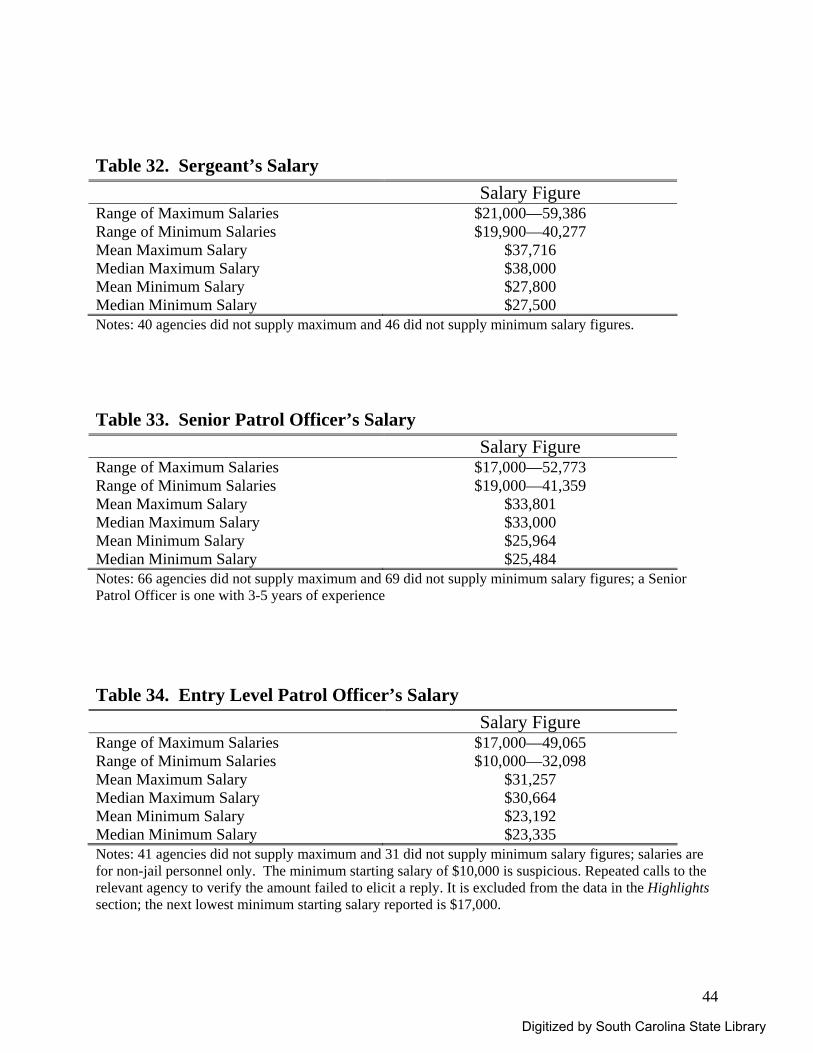
44
Table 32. Sergeant’s Salary Salary Figure Range of Maximum Salaries $21,000—59,386 Range of Minimum Salaries $19,900—40,277 Mean Maximum Salary $37,716 Median Maximum Salary $38,000 Mean Minimum Salary $27,800 Median Minimum Salary $27,500 Notes: 40 agencies did not supply maximum and 46 did not supply minimum salary figures.
Table 33. Senior Patrol Officer’s Salary Salary Figure
Range of Maximum Salaries $17,000—52,773 Range of Minimum Salaries $19,000—41,359 Mean Maximum Salary $33,801 Median Maximum Salary $33,000 Mean Minimum Salary $25,964 Median Minimum Salary $25,484 Notes: 66 agencies did not supply maximum and 69 did not supply minimum salary figures; a Senior Patrol Officer is one with 3-5 years of experience
Table 34. Entry Level Patrol Officer’s Salary Salary Figure
Range of Maximum Salaries $17,000—49,065 Range of Minimum Salaries $10,000—32,098 Mean Maximum Salary $31,257 Median Maximum Salary $30,664 Mean Minimum Salary $23,192 Median Minimum Salary $23,335 Notes: 41 agencies did not supply maximum and 31 did not supply minimum salary figures; salaries are for non-jail personnel only. The minimum starting salary of $10,000 is suspicious. Repeated calls to the relevant agency to verify the amount failed to elicit a reply. It is excluded from the data in the Highlights section; the next lowest minimum starting salary reported is $17,000.
Digitized by South Carolina State Library
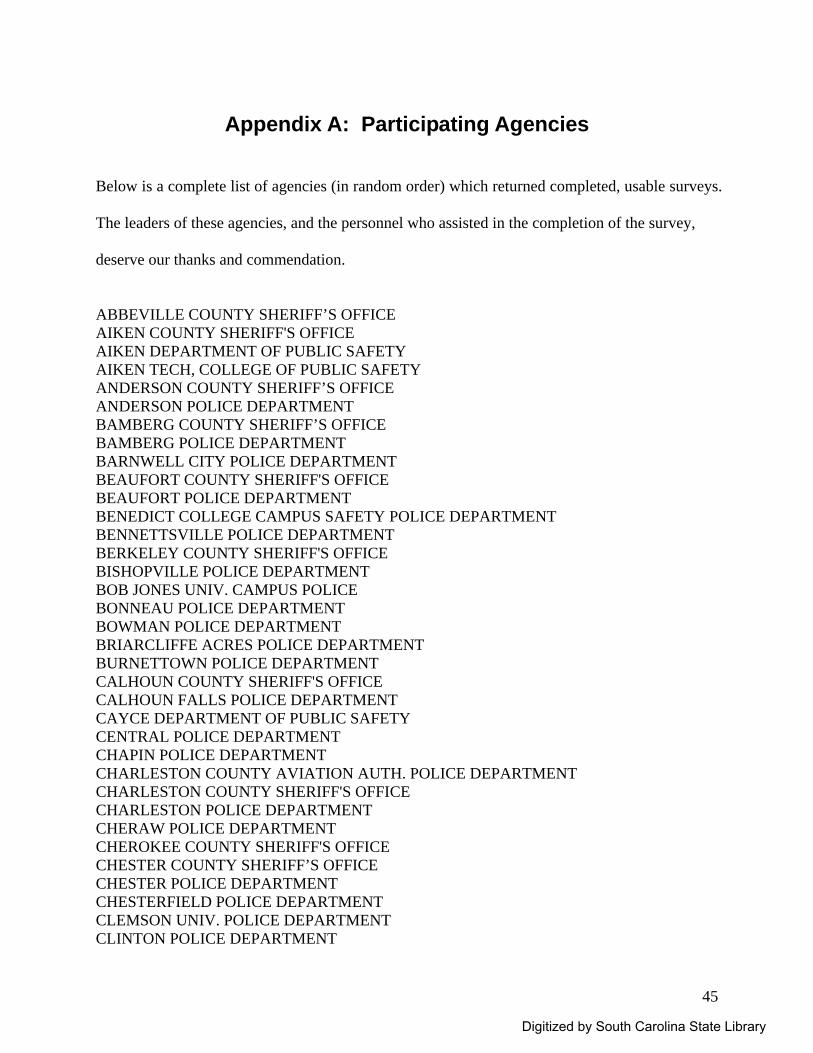
45
Appendix A: Participating Agencies
Below is a complete list of agencies (in random order) which returned completed, usable surveys.
The leaders of these agencies, and the personnel who assisted in the completion of the survey,
deserve our thanks and commendation.
ABBEVILLE COUNTY SHERIFF’S OFFICE AIKEN COUNTY SHERIFF'S OFFICE AIKEN DEPARTMENT OF PUBLIC SAFETY AIKEN TECH, COLLEGE OF PUBLIC SAFETY ANDERSON COUNTY SHERIFF’S OFFICE ANDERSON POLICE DEPARTMENT BAMBERG COUNTY SHERIFF’S OFFICE BAMBERG POLICE DEPARTMENT BARNWELL CITY POLICE DEPARTMENT BEAUFORT COUNTY SHERIFF'S OFFICE BEAUFORT POLICE DEPARTMENT BENEDICT COLLEGE CAMPUS SAFETY POLICE DEPARTMENT BENNETTSVILLE POLICE DEPARTMENT BERKELEY COUNTY SHERIFF'S OFFICE BISHOPVILLE POLICE DEPARTMENT BOB JONES UNIV. CAMPUS POLICE BONNEAU POLICE DEPARTMENT BOWMAN POLICE DEPARTMENT BRIARCLIFFE ACRES POLICE DEPARTMENT BURNETTOWN POLICE DEPARTMENT CALHOUN COUNTY SHERIFF'S OFFICE CALHOUN FALLS POLICE DEPARTMENT CAYCE DEPARTMENT OF PUBLIC SAFETY CENTRAL POLICE DEPARTMENT CHAPIN POLICE DEPARTMENT CHARLESTON COUNTY AVIATION AUTH. POLICE DEPARTMENT CHARLESTON COUNTY SHERIFF'S OFFICE CHARLESTON POLICE DEPARTMENT CHERAW POLICE DEPARTMENT CHEROKEE COUNTY SHERIFF'S OFFICE CHESTER COUNTY SHERIFF’S OFFICE CHESTER POLICE DEPARTMENT CHESTERFIELD POLICE DEPARTMENT CLEMSON UNIV. POLICE DEPARTMENT CLINTON POLICE DEPARTMENT
Digitized by South Carolina State Library
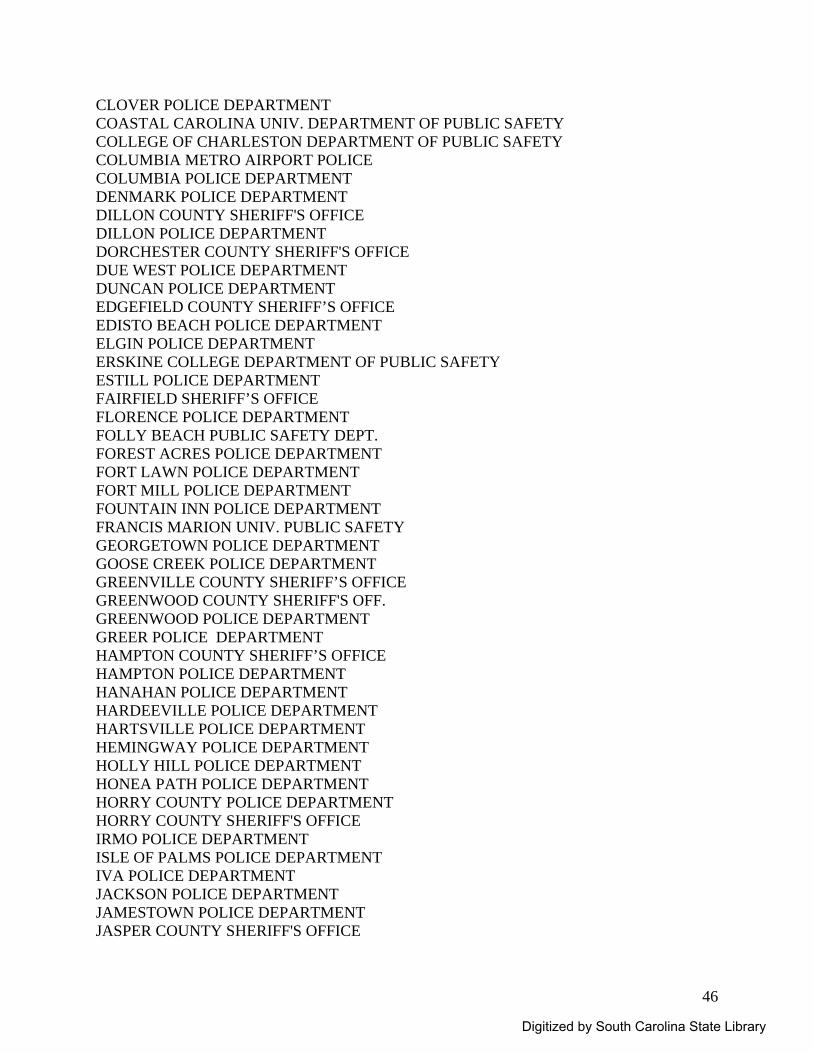
46
CLOVER POLICE DEPARTMENT COASTAL CAROLINA UNIV. DEPARTMENT OF PUBLIC SAFETY COLLEGE OF CHARLESTON DEPARTMENT OF PUBLIC SAFETY COLUMBIA METRO AIRPORT POLICE COLUMBIA POLICE DEPARTMENT DENMARK POLICE DEPARTMENT DILLON COUNTY SHERIFF'S OFFICE DILLON POLICE DEPARTMENT DORCHESTER COUNTY SHERIFF'S OFFICE DUE WEST POLICE DEPARTMENT DUNCAN POLICE DEPARTMENT EDGEFIELD COUNTY SHERIFF’S OFFICE EDISTO BEACH POLICE DEPARTMENT ELGIN POLICE DEPARTMENT ERSKINE COLLEGE DEPARTMENT OF PUBLIC SAFETY ESTILL POLICE DEPARTMENT FAIRFIELD SHERIFF’S OFFICE FLORENCE POLICE DEPARTMENT FOLLY BEACH PUBLIC SAFETY DEPT. FOREST ACRES POLICE DEPARTMENT FORT LAWN POLICE DEPARTMENT FORT MILL POLICE DEPARTMENT FOUNTAIN INN POLICE DEPARTMENT FRANCIS MARION UNIV. PUBLIC SAFETY GEORGETOWN POLICE DEPARTMENT GOOSE CREEK POLICE DEPARTMENT GREENVILLE COUNTY SHERIFF’S OFFICE GREENWOOD COUNTY SHERIFF'S OFF. GREENWOOD POLICE DEPARTMENT GREER POLICE DEPARTMENT HAMPTON COUNTY SHERIFF’S OFFICE HAMPTON POLICE DEPARTMENT HANAHAN POLICE DEPARTMENT HARDEEVILLE POLICE DEPARTMENT HARTSVILLE POLICE DEPARTMENT HEMINGWAY POLICE DEPARTMENT HOLLY HILL POLICE DEPARTMENT HONEA PATH POLICE DEPARTMENT HORRY COUNTY POLICE DEPARTMENT HORRY COUNTY SHERIFF'S OFFICE IRMO POLICE DEPARTMENT ISLE OF PALMS POLICE DEPARTMENT IVA POLICE DEPARTMENT JACKSON POLICE DEPARTMENT JAMESTOWN POLICE DEPARTMENT JASPER COUNTY SHERIFF'S OFFICE
Digitized by South Carolina State Library
47
JOHNSONVILLE POLICE DEPARTMENT JONESVILLE POLICE DEPARTMENT KERSHAW COUNTY SHERIFF'S OFFICE KINGSTREE POLICE DEPARTMENT LAKE CITY POLICE DEPARTMENT LAKE VIEW POLICE DEPARTMENT LANCASTER COUNTY SHERIFF'S OFFICE LANCASTER POLICE DEPARTMENT LANDER UNIVERSITY POLICE DEPARTMENT LANDRUM POLICE DEPARTMENT LANE POLICE DEPARTMENT LATTA POLICE DEPARTMENT LAURENS CITY POLICE DEPARTMENT LEE COUNTY SHERIFF'S DEPT. LEXINGTON COUNTY SHERIFF’S OFFICE LIBERTY POLICE DEPARTMENT LINCOLNVILLE POLICE LORIS POLICE DEPARTMENT MANNING POLICE DEPARTMENT MARION COUNTY SHERIFF'S OFFICE MARION POLICE DEPARTMENT MAULDIN CITY POLICE DEPARTMENT MCCOLL POLICE DEPARTMENT MCCORMICK POLICE DEPARTMENT MEDICAL UNIV. OF SC DEPARTMENT OF PUBLIC SAFETY MIDLANDS TECHNICAL COLLEGE DEPARTMENT OF PUBLIC SAFETY MONCKS CORNER POLICE DEPARTMENT MOUNT PLEASANT POLICE DEPARTMENT MYRTLE BEACH POLICE DEPARTMENT NEWBERRY CITY POLICE DEPARTMENT NEWBERRY COUNTY SHERIFF'S OFFICE NICHOLS POLICE DEPARTMENT NINETY SIX POLICE DEPARTMENT NORTH AUGUSTA DEPARTMENT OF PUBLIC SAFETY NORTH CHARLESTON POLICE DEPARTMENT NORTH MYRTLE BEACH DEPARTMENT OF PUBLIC SAFETY NORTH POLICE DEPARTMENT OCONEE COUNTY SHERIFF'S OFFICE ORANGEBURG COUNTY SHERIFF'S OFFICE ORANGEBURG DEPARTMENT OF PUBLIC SAFETY PACOLET POLICE DEPARTMENT PENDLETON POLICE DEPARTMENT PERRY POLICE DEPARTMENT PICKENS COUNTY SHERIFF'S OFFICE PROSPERITY POLICE DEPARTMENT PUBLIC SERVICE COMMISSION OF SOUTH CAROLINA
Digitized by South Carolina State Library
48
RICHLAND COUNTY SHERIFF'S DEPARTMENT RIDGELAND POLICE DEPARTMENT RIDGEVILLE POLICE DEPARTMENT ROCK HILL POLICE DEPARTMENT SAINT MATTHEWS POLICE DEPARTMENT SALLEY DEPARTMENT OF PUBLIC SAFETY SALUDA COUNTY SHERIFF'S OFFICE SALUDA POLICE DEPARTMENT SC BUREAU OF PROTECTIVE SERVICES SC DDSN COASTAL REGION SC DEPARTMENT OF NATURAL RESOURCES SC EMPLOYMENT SECURITY COMM. OF PUBLIC SAFETY SC HIGHWAY PATROL SC STATE ETHICS COMMISSION SC STATE PARK SERVICE SC DEPT. OF HEALTH AND ENVIRONMENTAL CONTROL SCRANTON POLICE DEPARTMENT SENECA POLICE DEPARTMENT SIMPSONVILLE POLICE DEPARTMENT SOCIETY HILL POLICE DEPARTMENT SPARTANBURG PUBLIC SAFETY DEPARTMENT SPARTANBURG TECH. COLLEGE DEPARTMENT OF PUBLIC SAFETY SPRINGDALE POLICE DEPARTMENT SUMMERTON POLICE DEPARTMENT SUMMERVILLE POLICE DEPARTMENT SUMTER COUNTY SHERIFF'S OFFICE SWANSEA POLICE DEPARTMENT TEGA CAY POLICE DEPARTMENT THE CITADEL DEPARTMENT OF PUBLIC SAFETY TIMMONSVILLE POLICE DEPARTMENT TRAVELERS REST POLICE DEPARTMENT TRIDENT TECH, COLLEGE DEPARTMENT OF PUBLIC SAFETY TURBEVILLE POLICE DEPARTMENT UNION COUNTY SHERIFF'S OFFICE UNION PUBLIC SAFETY USC AIKEN PUBLIC SAFETY USC LAW ENFORCEMENT DIVISION VANCE POLICE DEPARTMENT WALHALLA POLICE DEPARTMENT WALTERBORO POLICE DEPARTMENT WARE SHOALS POLICE DEPARTMENT WEST COLUMBIA POLICE DEPARTMENT YEMASSEE POLICE DEPARTMENT YORK COUNTY SHERIFF'S OFFICE
Digitized by South Carolina State Library
49
Appendix B: Census Personnel Department of Criminology and Criminal Justice, University of South Carolina 2004 Census Coordinator and Final Report author: Robert J. Kaminski, Ph.D. 2003 Census Coordinator and Final Report author: William V. Pelfrey, Jr., Ph.D. (now at the Department of Criminal Justice, University of Wisconsin—Milwaukee) Census Graduate Assistant: D. Michele White, M.S. Department Chair: Geoffrey P. Alpert, Ph.D. South Carolina Criminal Justice Academy Academy Director: William R. Neill Census Liaison: Lauren Davidson
Digitized by South Carolina State Library
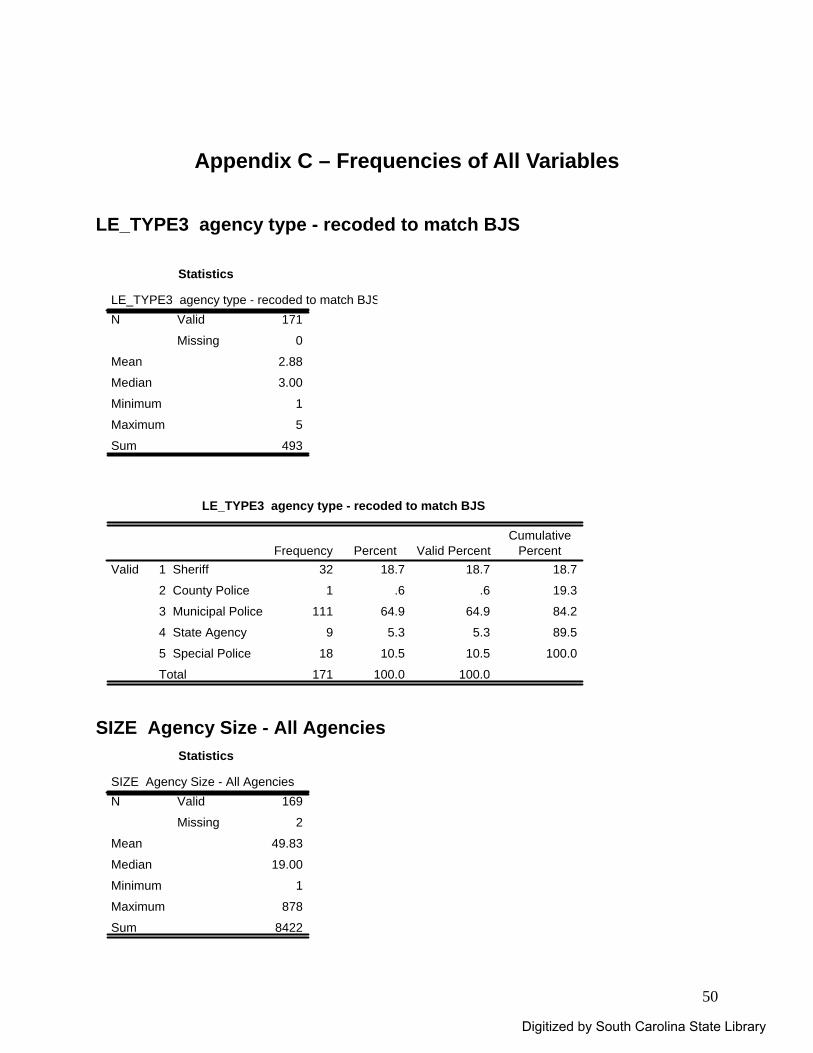
50
Appendix C – Frequencies of All Variables LE_TYPE3 agency type - recoded to match BJS
Statistics
LE_TYPE3 agency type - recoded to match BJS171
0
2.88
3.00
1
5
493
Valid
Missing
N
Mean
Median
Minimum
Maximum
Sum
LE_TYPE3 agency type - recoded to match BJS
32 18.7 18.7 18.7
1 .6 .6 19.3
111 64.9 64.9 84.2
9 5.3 5.3 89.5
18 10.5 10.5 100.0
171 100.0 100.0
1 Sheriff
2 County Police
3 Municipal Police
4 State Agency
5 Special Police
Total
ValidFrequency Percent Valid Percent
CumulativePercent
SIZE Agency Size - All Agencies
Statistics
SIZE Agency Size - All Agencies169
2
49.83
19.00
1
878
8422
Valid
Missing
N
Mean
Median
Minimum
Maximum
Sum
Digitized by South Carolina State Library
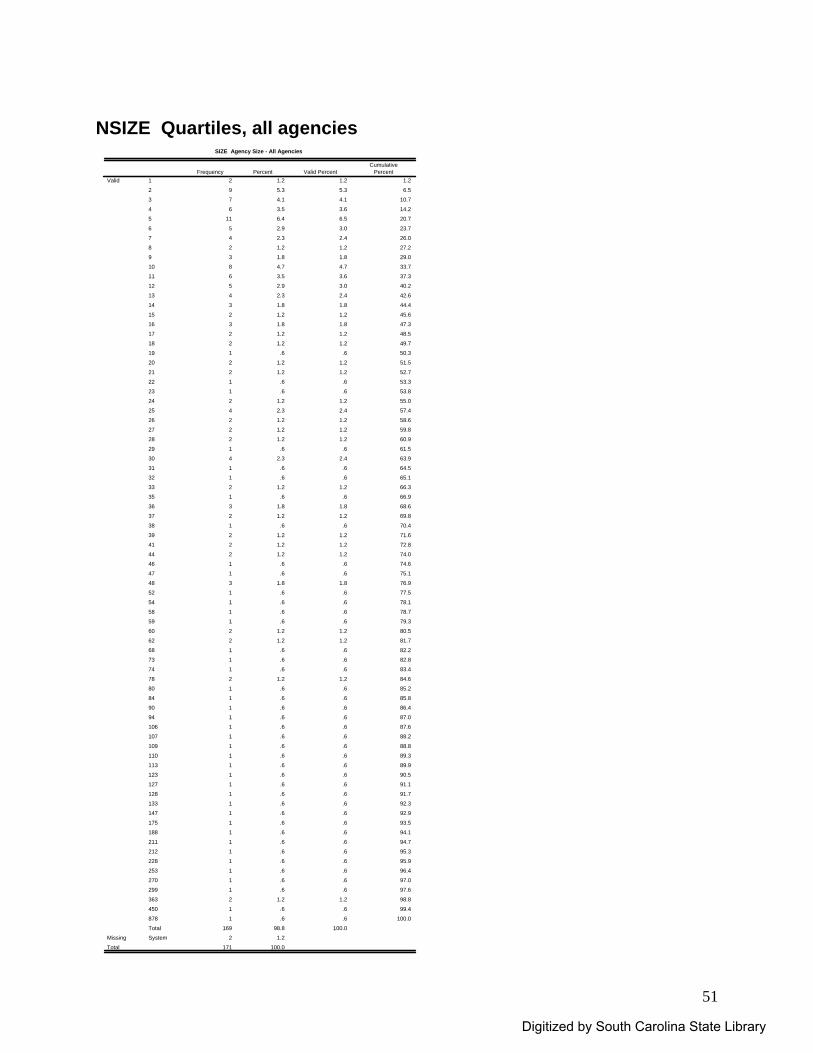
51
NSIZE Quartiles, all agencies
SIZE Agency Size - All Agencies
2 1.2 1.2 1.2
9 5.3 5.3 6.5
7 4.1 4.1 10.7
6 3.5 3.6 14.2
11 6.4 6.5 20.7
5 2.9 3.0 23.7
4 2.3 2.4 26.0
2 1.2 1.2 27.2
3 1.8 1.8 29.0
8 4.7 4.7 33.7
6 3.5 3.6 37.3
5 2.9 3.0 40.2
4 2.3 2.4 42.6
3 1.8 1.8 44.4
2 1.2 1.2 45.6
3 1.8 1.8 47.3
2 1.2 1.2 48.5
2 1.2 1.2 49.7
1 .6 .6 50.3
2 1.2 1.2 51.5
2 1.2 1.2 52.7
1 .6 .6 53.3
1 .6 .6 53.8
2 1.2 1.2 55.0
4 2.3 2.4 57.4
2 1.2 1.2 58.6
2 1.2 1.2 59.8
2 1.2 1.2 60.9
1 .6 .6 61.5
4 2.3 2.4 63.9
1 .6 .6 64.5
1 .6 .6 65.1
2 1.2 1.2 66.3
1 .6 .6 66.9
3 1.8 1.8 68.6
2 1.2 1.2 69.8
1 .6 .6 70.4
2 1.2 1.2 71.6
2 1.2 1.2 72.8
2 1.2 1.2 74.0
1 .6 .6 74.6
1 .6 .6 75.1
3 1.8 1.8 76.9
1 .6 .6 77.5
1 .6 .6 78.1
1 .6 .6 78.7
1 .6 .6 79.3
2 1.2 1.2 80.5
2 1.2 1.2 81.7
1 .6 .6 82.2
1 .6 .6 82.8
1 .6 .6 83.4
2 1.2 1.2 84.6
1 .6 .6 85.2
1 .6 .6 85.8
1 .6 .6 86.4
1 .6 .6 87.0
1 .6 .6 87.6
1 .6 .6 88.2
1 .6 .6 88.8
1 .6 .6 89.3
1 .6 .6 89.9
1 .6 .6 90.5
1 .6 .6 91.1
1 .6 .6 91.7
1 .6 .6 92.3
1 .6 .6 92.9
1 .6 .6 93.5
1 .6 .6 94.1
1 .6 .6 94.7
1 .6 .6 95.3
1 .6 .6 95.9
1 .6 .6 96.4
1 .6 .6 97.0
1 .6 .6 97.6
2 1.2 1.2 98.8
1 .6 .6 99.4
1 .6 .6 100.0
169 98.8 100.0
2 1.2
171 100.0
1
2
3
4
5
6
7
8
9
10
11
12
13
14
15
16
17
18
19
20
21
22
23
24
25
26
27
28
29
30
31
32
33
35
36
37
38
39
41
44
46
47
48
52
54
58
59
60
62
68
73
74
78
80
84
90
94
106
107
109
110
113
123
127
128
133
147
175
188
211
212
228
253
270
299
363
450
878
Total
Valid
SystemMissing
Total
Frequency Percent Valid PercentCumulative
Percent
Digitized by South Carolina State Library
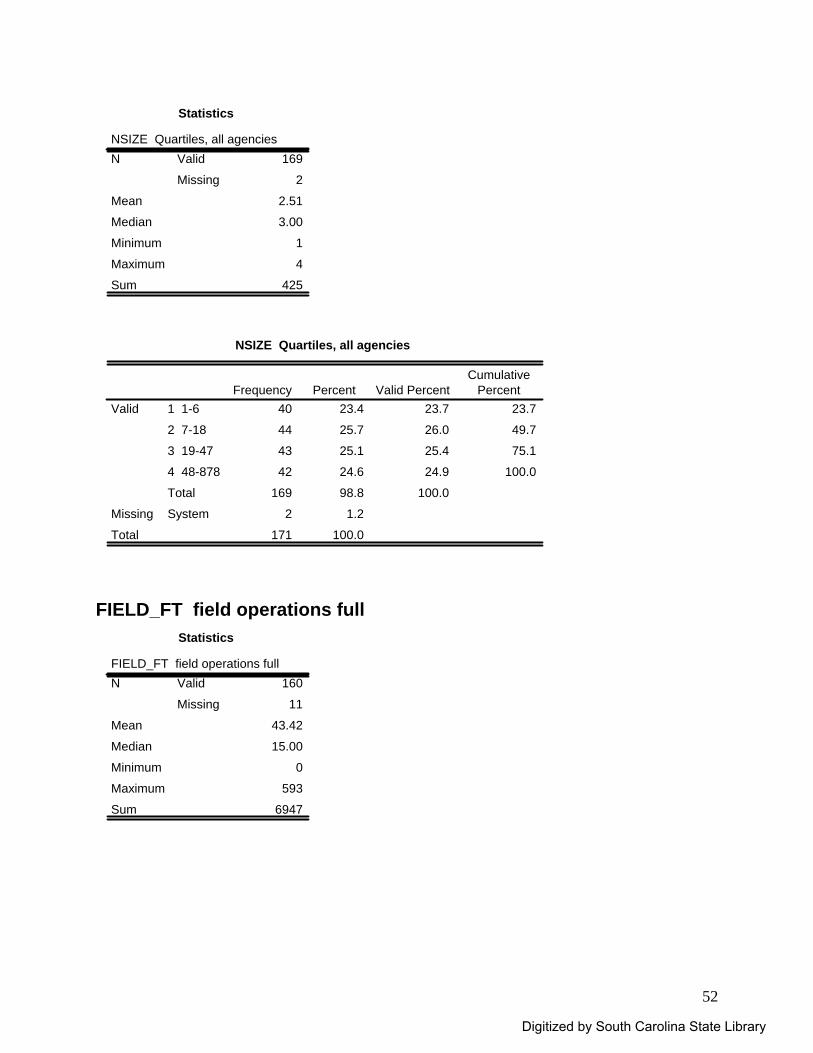
52
Statistics
NSIZE Quartiles, all agencies169
2
2.51
3.00
1
4
425
Valid
Missing
N
Mean
Median
Minimum
Maximum
Sum
NSIZE Quartiles, all agencies
40 23.4 23.7 23.7
44 25.7 26.0 49.7
43 25.1 25.4 75.1
42 24.6 24.9 100.0
169 98.8 100.0
2 1.2
171 100.0
1 1-6
2 7-18
3 19-47
4 48-878
Total
Valid
SystemMissing
Total
Frequency Percent Valid PercentCumulative
Percent
FIELD_FT field operations full
Statistics
FIELD_FT field operations full160
11
43.42
15.00
0
593
6947
Valid
Missing
N
Mean
Median
Minimum
Maximum
Sum
Digitized by South Carolina State Library
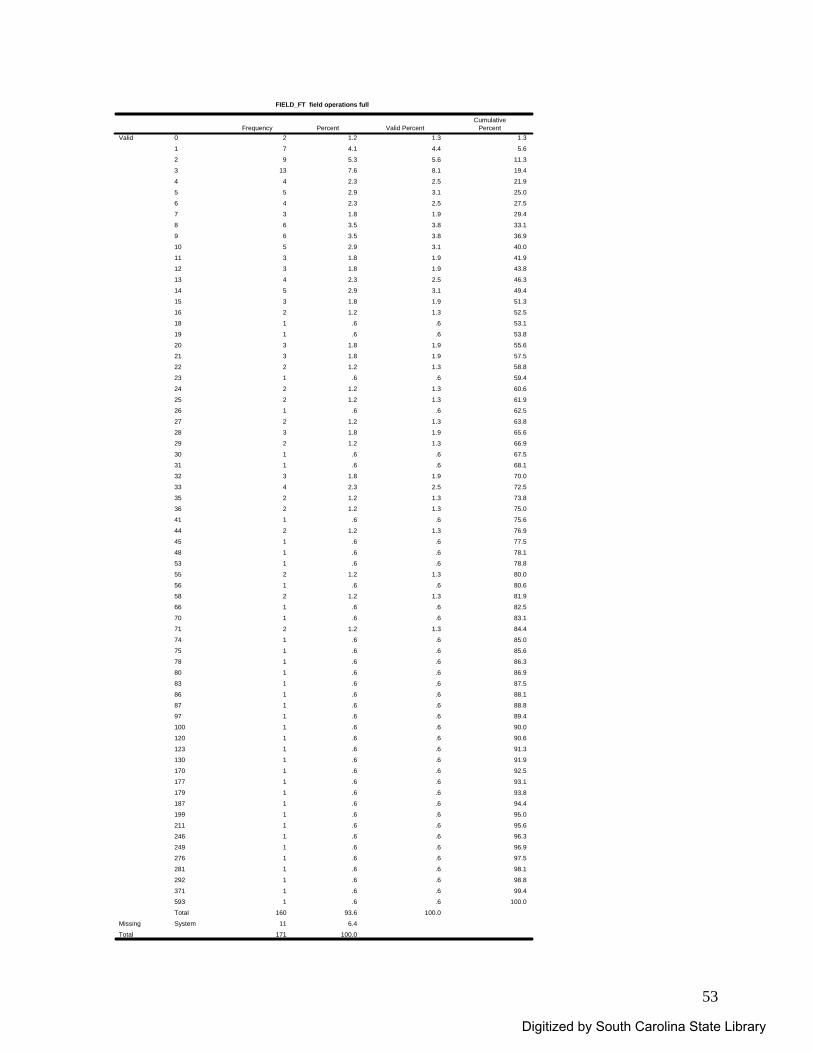
53
FIELD_FT field operations full
2 1.2 1.3 1.3
7 4.1 4.4 5.6
9 5.3 5.6 11.3
13 7.6 8.1 19.4
4 2.3 2.5 21.9
5 2.9 3.1 25.0
4 2.3 2.5 27.5
3 1.8 1.9 29.4
6 3.5 3.8 33.1
6 3.5 3.8 36.9
5 2.9 3.1 40.0
3 1.8 1.9 41.9
3 1.8 1.9 43.8
4 2.3 2.5 46.3
5 2.9 3.1 49.4
3 1.8 1.9 51.3
2 1.2 1.3 52.5
1 .6 .6 53.1
1 .6 .6 53.8
3 1.8 1.9 55.6
3 1.8 1.9 57.5
2 1.2 1.3 58.8
1 .6 .6 59.4
2 1.2 1.3 60.6
2 1.2 1.3 61.9
1 .6 .6 62.5
2 1.2 1.3 63.8
3 1.8 1.9 65.6
2 1.2 1.3 66.9
1 .6 .6 67.5
1 .6 .6 68.1
3 1.8 1.9 70.0
4 2.3 2.5 72.5
2 1.2 1.3 73.8
2 1.2 1.3 75.0
1 .6 .6 75.6
2 1.2 1.3 76.9
1 .6 .6 77.5
1 .6 .6 78.1
1 .6 .6 78.8
2 1.2 1.3 80.0
1 .6 .6 80.6
2 1.2 1.3 81.9
1 .6 .6 82.5
1 .6 .6 83.1
2 1.2 1.3 84.4
1 .6 .6 85.0
1 .6 .6 85.6
1 .6 .6 86.3
1 .6 .6 86.9
1 .6 .6 87.5
1 .6 .6 88.1
1 .6 .6 88.8
1 .6 .6 89.4
1 .6 .6 90.0
1 .6 .6 90.6
1 .6 .6 91.3
1 .6 .6 91.9
1 .6 .6 92.5
1 .6 .6 93.1
1 .6 .6 93.8
1 .6 .6 94.4
1 .6 .6 95.0
1 .6 .6 95.6
1 .6 .6 96.3
1 .6 .6 96.9
1 .6 .6 97.5
1 .6 .6 98.1
1 .6 .6 98.8
1 .6 .6 99.4
1 .6 .6 100.0
160 93.6 100.0
11 6.4
171 100.0
0
1
2
3
4
5
6
7
8
9
10
11
12
13
14
15
16
18
19
20
21
22
23
24
25
26
27
28
29
30
31
32
33
35
36
41
44
45
48
53
55
56
58
66
70
71
74
75
78
80
83
86
87
97
100
120
123
130
170
177
179
187
199
211
246
249
276
281
292
371
593
Total
Valid
SystemMissing
Total
Frequency Percent Valid PercentCumulative
Percent
Digitized by South Carolina State Library
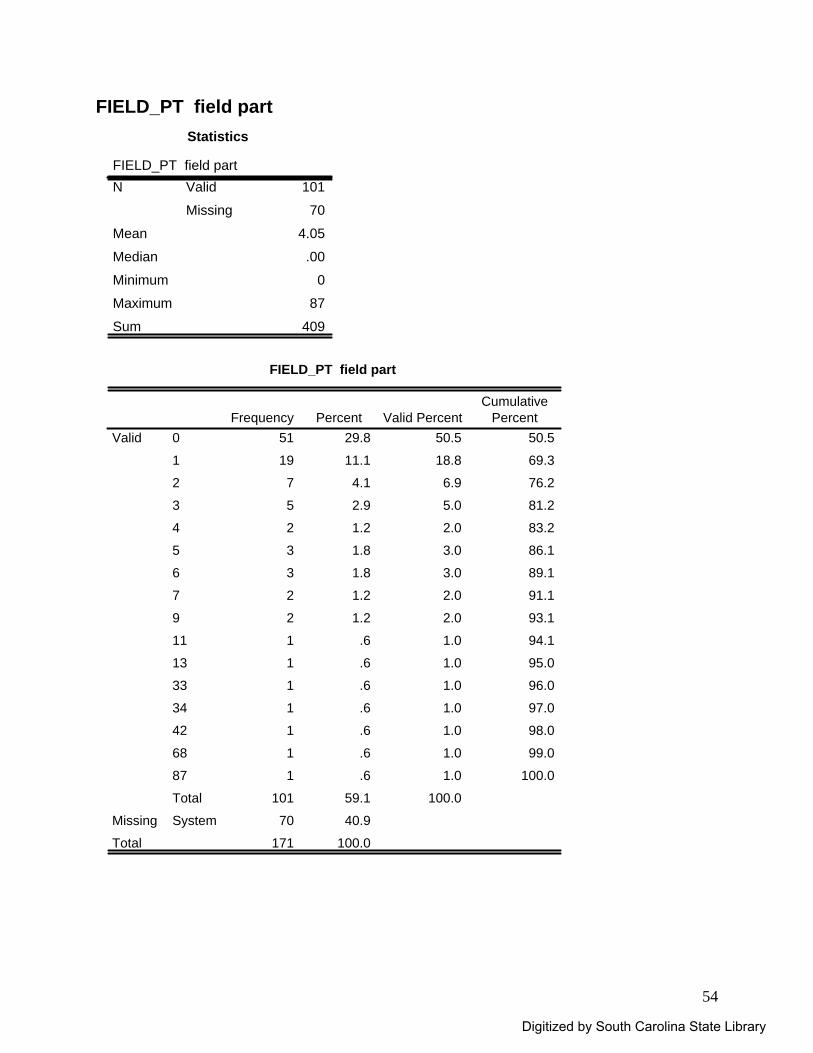
54
FIELD_PT field part Statistics
FIELD_PT field part101
70
4.05
.00
0
87
409
Valid
Missing
N
Mean
Median
Minimum
Maximum
Sum
FIELD_PT field part
51 29.8 50.5 50.5
19 11.1 18.8 69.3
7 4.1 6.9 76.2
5 2.9 5.0 81.2
2 1.2 2.0 83.2
3 1.8 3.0 86.1
3 1.8 3.0 89.1
2 1.2 2.0 91.1
2 1.2 2.0 93.1
1 .6 1.0 94.1
1 .6 1.0 95.0
1 .6 1.0 96.0
1 .6 1.0 97.0
1 .6 1.0 98.0
1 .6 1.0 99.0
1 .6 1.0 100.0
101 59.1 100.0
70 40.9
171 100.0
0
1
2
3
4
5
6
7
9
11
13
33
34
42
68
87
Total
Valid
SystemMissing
Total
Frequency Percent Valid PercentCumulative
Percent
Digitized by South Carolina State Library
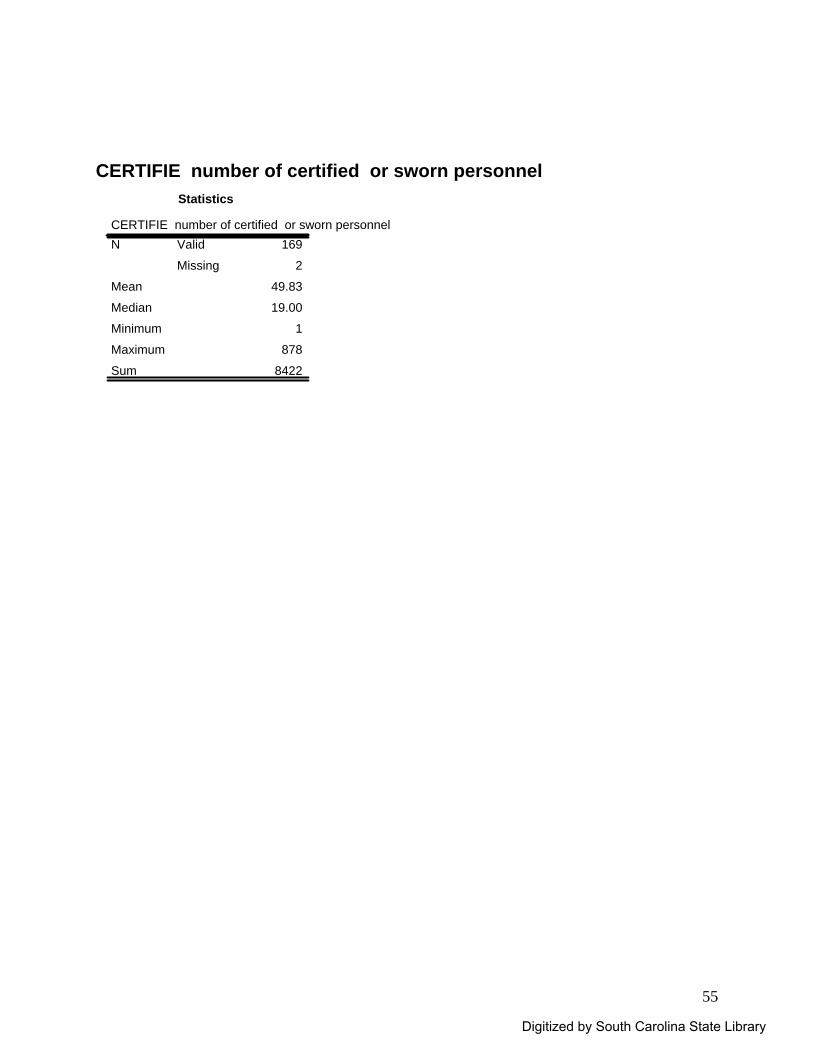
55
CERTIFIE number of certified or sworn personnel
Statistics
CERTIFIE number of certified or sworn personnel169
2
49.83
19.00
1
878
8422
Valid
Missing
N
Mean
Median
Minimum
Maximum
Sum
Digitized by South Carolina State Library
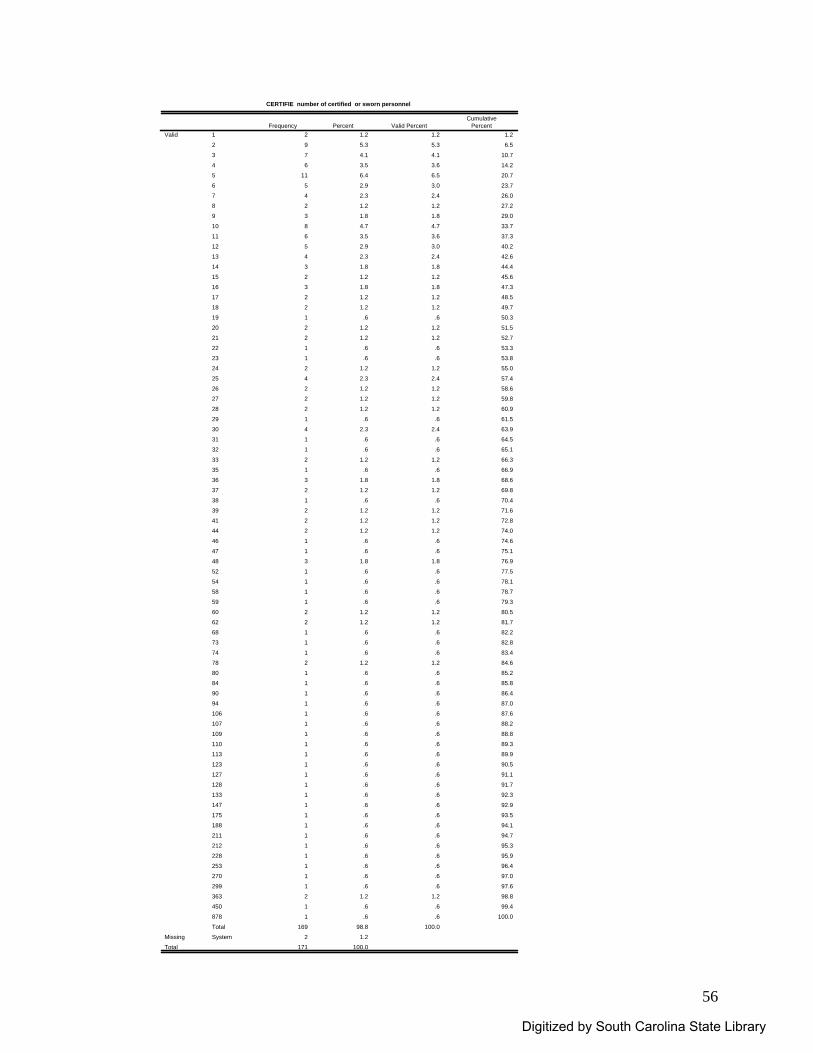
56
CERTIFIE number of certified or sworn personnel
2 1.2 1.2 1.2
9 5.3 5.3 6.5
7 4.1 4.1 10.7
6 3.5 3.6 14.2
11 6.4 6.5 20.7
5 2.9 3.0 23.7
4 2.3 2.4 26.0
2 1.2 1.2 27.2
3 1.8 1.8 29.0
8 4.7 4.7 33.7
6 3.5 3.6 37.3
5 2.9 3.0 40.2
4 2.3 2.4 42.6
3 1.8 1.8 44.4
2 1.2 1.2 45.6
3 1.8 1.8 47.3
2 1.2 1.2 48.5
2 1.2 1.2 49.7
1 .6 .6 50.3
2 1.2 1.2 51.5
2 1.2 1.2 52.7
1 .6 .6 53.3
1 .6 .6 53.8
2 1.2 1.2 55.0
4 2.3 2.4 57.4
2 1.2 1.2 58.6
2 1.2 1.2 59.8
2 1.2 1.2 60.9
1 .6 .6 61.5
4 2.3 2.4 63.9
1 .6 .6 64.5
1 .6 .6 65.1
2 1.2 1.2 66.3
1 .6 .6 66.9
3 1.8 1.8 68.6
2 1.2 1.2 69.8
1 .6 .6 70.4
2 1.2 1.2 71.6
2 1.2 1.2 72.8
2 1.2 1.2 74.0
1 .6 .6 74.6
1 .6 .6 75.1
3 1.8 1.8 76.9
1 .6 .6 77.5
1 .6 .6 78.1
1 .6 .6 78.7
1 .6 .6 79.3
2 1.2 1.2 80.5
2 1.2 1.2 81.7
1 .6 .6 82.2
1 .6 .6 82.8
1 .6 .6 83.4
2 1.2 1.2 84.6
1 .6 .6 85.2
1 .6 .6 85.8
1 .6 .6 86.4
1 .6 .6 87.0
1 .6 .6 87.6
1 .6 .6 88.2
1 .6 .6 88.8
1 .6 .6 89.3
1 .6 .6 89.9
1 .6 .6 90.5
1 .6 .6 91.1
1 .6 .6 91.7
1 .6 .6 92.3
1 .6 .6 92.9
1 .6 .6 93.5
1 .6 .6 94.1
1 .6 .6 94.7
1 .6 .6 95.3
1 .6 .6 95.9
1 .6 .6 96.4
1 .6 .6 97.0
1 .6 .6 97.6
2 1.2 1.2 98.8
1 .6 .6 99.4
1 .6 .6 100.0
169 98.8 100.0
2 1.2
171 100.0
1
2
3
4
5
6
7
8
9
10
11
12
13
14
15
16
17
18
19
20
21
22
23
24
25
26
27
28
29
30
31
32
33
35
36
37
38
39
41
44
46
47
48
52
54
58
59
60
62
68
73
74
78
80
84
90
94
106
107
109
110
113
123
127
128
133
147
175
188
211
212
228
253
270
299
363
450
878
Total
Valid
SystemMissing
Total
Frequency Percent Valid PercentCumulative
Percent
Digitized by South Carolina State Library
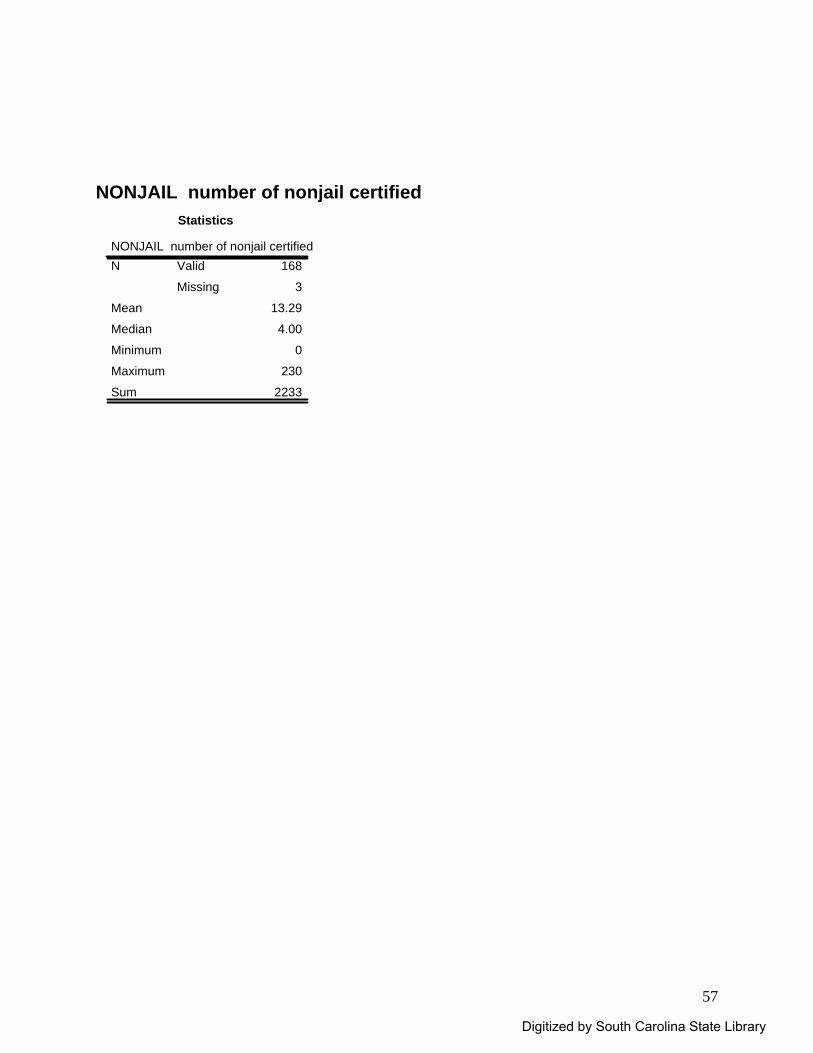
57
NONJAIL number of nonjail certified
Statistics
NONJAIL number of nonjail certified168
3
13.29
4.00
0
230
2233
Valid
Missing
N
Mean
Median
Minimum
Maximum
Sum
Digitized by South Carolina State Library
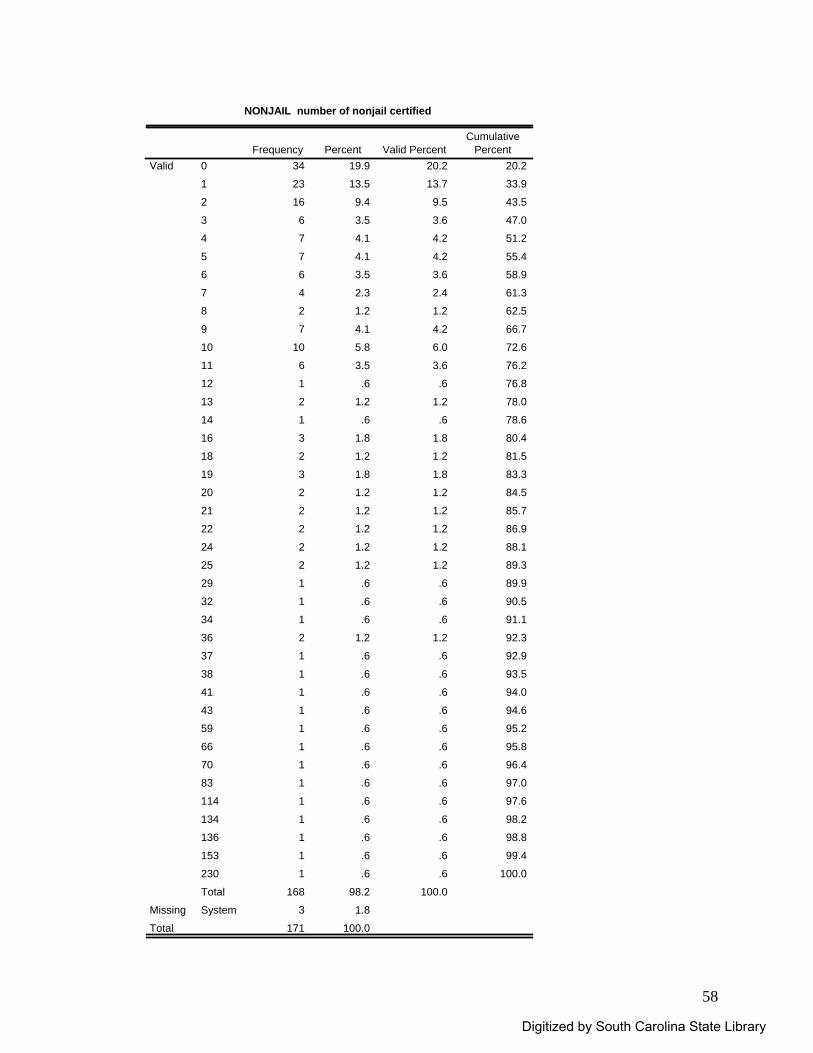
58
NONJAIL number of nonjail certified
34 19.9 20.2 20.2
23 13.5 13.7 33.9
16 9.4 9.5 43.5
6 3.5 3.6 47.0
7 4.1 4.2 51.2
7 4.1 4.2 55.4
6 3.5 3.6 58.9
4 2.3 2.4 61.3
2 1.2 1.2 62.5
7 4.1 4.2 66.7
10 5.8 6.0 72.6
6 3.5 3.6 76.2
1 .6 .6 76.8
2 1.2 1.2 78.0
1 .6 .6 78.6
3 1.8 1.8 80.4
2 1.2 1.2 81.5
3 1.8 1.8 83.3
2 1.2 1.2 84.5
2 1.2 1.2 85.7
2 1.2 1.2 86.9
2 1.2 1.2 88.1
2 1.2 1.2 89.3
1 .6 .6 89.9
1 .6 .6 90.5
1 .6 .6 91.1
2 1.2 1.2 92.3
1 .6 .6 92.9
1 .6 .6 93.5
1 .6 .6 94.0
1 .6 .6 94.6
1 .6 .6 95.2
1 .6 .6 95.8
1 .6 .6 96.4
1 .6 .6 97.0
1 .6 .6 97.6
1 .6 .6 98.2
1 .6 .6 98.8
1 .6 .6 99.4
1 .6 .6 100.0
168 98.2 100.0
3 1.8
171 100.0
0
1
2
3
4
5
6
7
8
9
10
11
12
13
14
16
18
19
20
21
22
24
25
29
32
34
36
37
38
41
43
59
66
70
83
114
134
136
153
230
Total
Valid
SystemMissing
Total
Frequency Percent Valid PercentCumulative
Percent
Digitized by South Carolina State Library
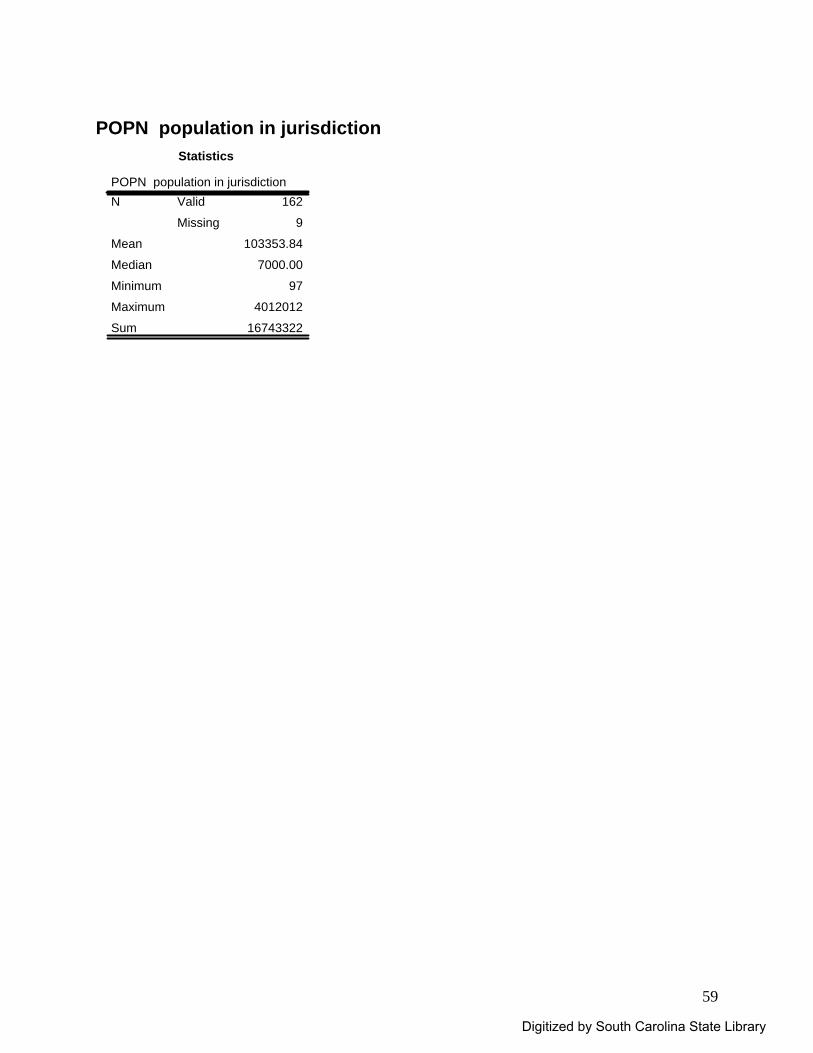
59
POPN population in jurisdiction
Statistics
POPN population in jurisdiction162
9
103353.84
7000.00
97
4012012
16743322
Valid
Missing
N
Mean
Median
Minimum
Maximum
Sum
Digitized by South Carolina State Library
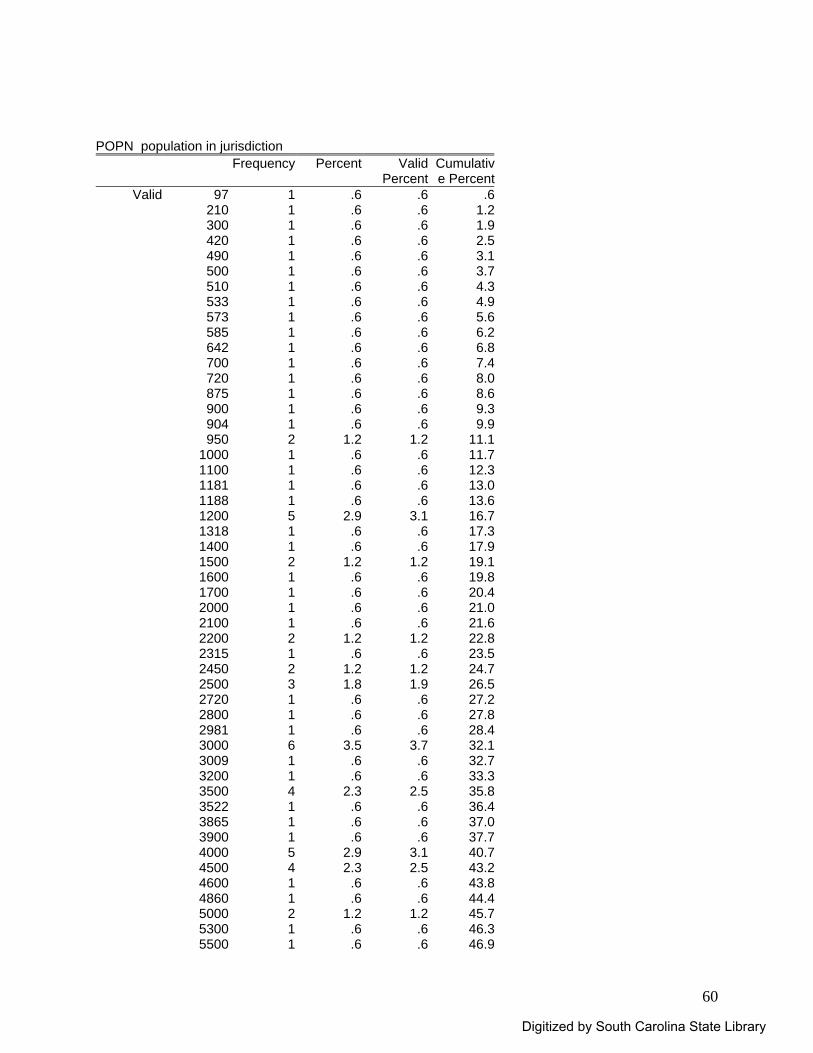
60
POPN population in jurisdiction
Frequency Percent Valid Percent
Cumulative Percent
Valid 97 1 .6 .6 .6210 1 .6 .6 1.2300 1 .6 .6 1.9420 1 .6 .6 2.5490 1 .6 .6 3.1500 1 .6 .6 3.7510 1 .6 .6 4.3533 1 .6 .6 4.9573 1 .6 .6 5.6585 1 .6 .6 6.2642 1 .6 .6 6.8700 1 .6 .6 7.4720 1 .6 .6 8.0875 1 .6 .6 8.6900 1 .6 .6 9.3904 1 .6 .6 9.9950 2 1.2 1.2 11.1
1000 1 .6 .6 11.71100 1 .6 .6 12.31181 1 .6 .6 13.01188 1 .6 .6 13.61200 5 2.9 3.1 16.71318 1 .6 .6 17.31400 1 .6 .6 17.91500 2 1.2 1.2 19.11600 1 .6 .6 19.81700 1 .6 .6 20.42000 1 .6 .6 21.02100 1 .6 .6 21.62200 2 1.2 1.2 22.82315 1 .6 .6 23.52450 2 1.2 1.2 24.72500 3 1.8 1.9 26.52720 1 .6 .6 27.22800 1 .6 .6 27.82981 1 .6 .6 28.43000 6 3.5 3.7 32.13009 1 .6 .6 32.73200 1 .6 .6 33.33500 4 2.3 2.5 35.83522 1 .6 .6 36.43865 1 .6 .6 37.03900 1 .6 .6 37.74000 5 2.9 3.1 40.74500 4 2.3 2.5 43.24600 1 .6 .6 43.84860 1 .6 .6 44.45000 2 1.2 1.2 45.75300 1 .6 .6 46.35500 1 .6 .6 46.9
Digitized by South Carolina State Library
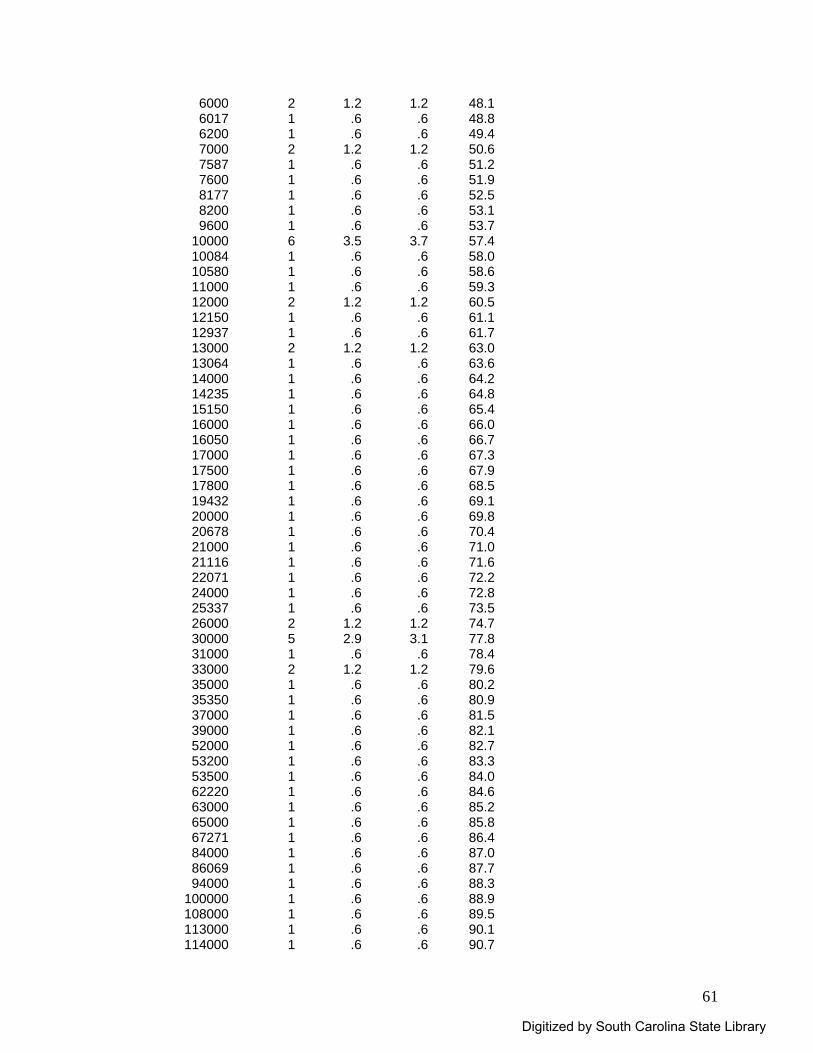
61
6000 2 1.2 1.2 48.16017 1 .6 .6 48.86200 1 .6 .6 49.47000 2 1.2 1.2 50.67587 1 .6 .6 51.27600 1 .6 .6 51.98177 1 .6 .6 52.58200 1 .6 .6 53.19600 1 .6 .6 53.7
10000 6 3.5 3.7 57.410084 1 .6 .6 58.010580 1 .6 .6 58.611000 1 .6 .6 59.312000 2 1.2 1.2 60.512150 1 .6 .6 61.112937 1 .6 .6 61.713000 2 1.2 1.2 63.013064 1 .6 .6 63.614000 1 .6 .6 64.214235 1 .6 .6 64.815150 1 .6 .6 65.416000 1 .6 .6 66.016050 1 .6 .6 66.717000 1 .6 .6 67.317500 1 .6 .6 67.917800 1 .6 .6 68.519432 1 .6 .6 69.120000 1 .6 .6 69.820678 1 .6 .6 70.421000 1 .6 .6 71.021116 1 .6 .6 71.622071 1 .6 .6 72.224000 1 .6 .6 72.825337 1 .6 .6 73.526000 2 1.2 1.2 74.730000 5 2.9 3.1 77.831000 1 .6 .6 78.433000 2 1.2 1.2 79.635000 1 .6 .6 80.235350 1 .6 .6 80.937000 1 .6 .6 81.539000 1 .6 .6 82.152000 1 .6 .6 82.753200 1 .6 .6 83.353500 1 .6 .6 84.062220 1 .6 .6 84.663000 1 .6 .6 85.265000 1 .6 .6 85.867271 1 .6 .6 86.484000 1 .6 .6 87.086069 1 .6 .6 87.794000 1 .6 .6 88.3
100000 1 .6 .6 88.9108000 1 .6 .6 89.5113000 1 .6 .6 90.1114000 1 .6 .6 90.7
Digitized by South Carolina State Library
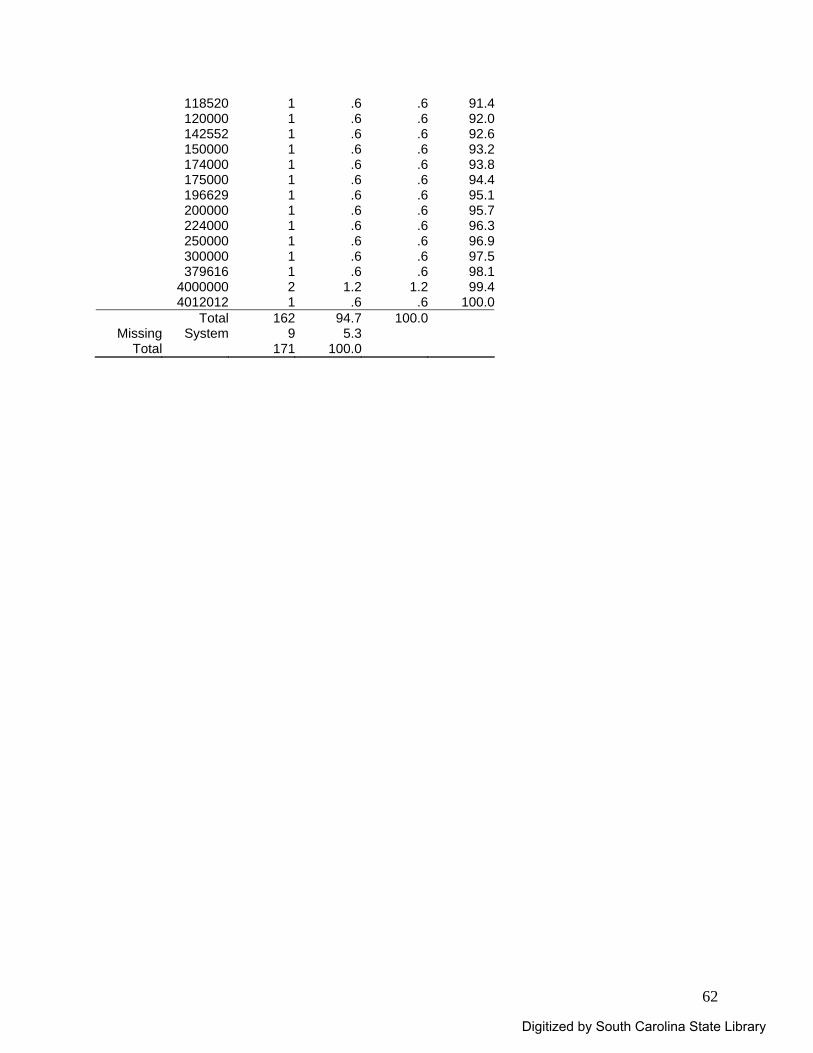
62
118520 1 .6 .6 91.4120000 1 .6 .6 92.0142552 1 .6 .6 92.6150000 1 .6 .6 93.2174000 1 .6 .6 93.8175000 1 .6 .6 94.4196629 1 .6 .6 95.1200000 1 .6 .6 95.7224000 1 .6 .6 96.3250000 1 .6 .6 96.9300000 1 .6 .6 97.5379616 1 .6 .6 98.1
4000000 2 1.2 1.2 99.44012012 1 .6 .6 100.0
Total 162 94.7 100.0Missing System 9 5.3
Total 171 100.0
Digitized by South Carolina State Library

63
OPSEARCH search and rescue Statistics
OPSEARCH search and rescue171
0
.33
.00
0
1
56
Valid
Missing
N
Mean
Median
Minimum
Maximum
Sum
OPSEARCH search and rescue
115 67.3 67.3 67.3
56 32.7 32.7 100.0
171 100.0 100.0
0
1 yes
Total
ValidFrequency Percent Valid Percent
CumulativePercent
OPTRAFFI traffic enforcement
Statistics
OPTRAFFI traffic enforcement171
0
.85
1.00
0
1
145
Valid
Missing
N
Mean
Median
Minimum
Maximum
Sum
OPTRAFFI traffic enforcement
26 15.2 15.2 15.2
145 84.8 84.8 100.0
171 100.0 100.0
0
1 yes
Total
ValidFrequency Percent Valid Percent
CumulativePercent
Digitized by South Carolina State Library
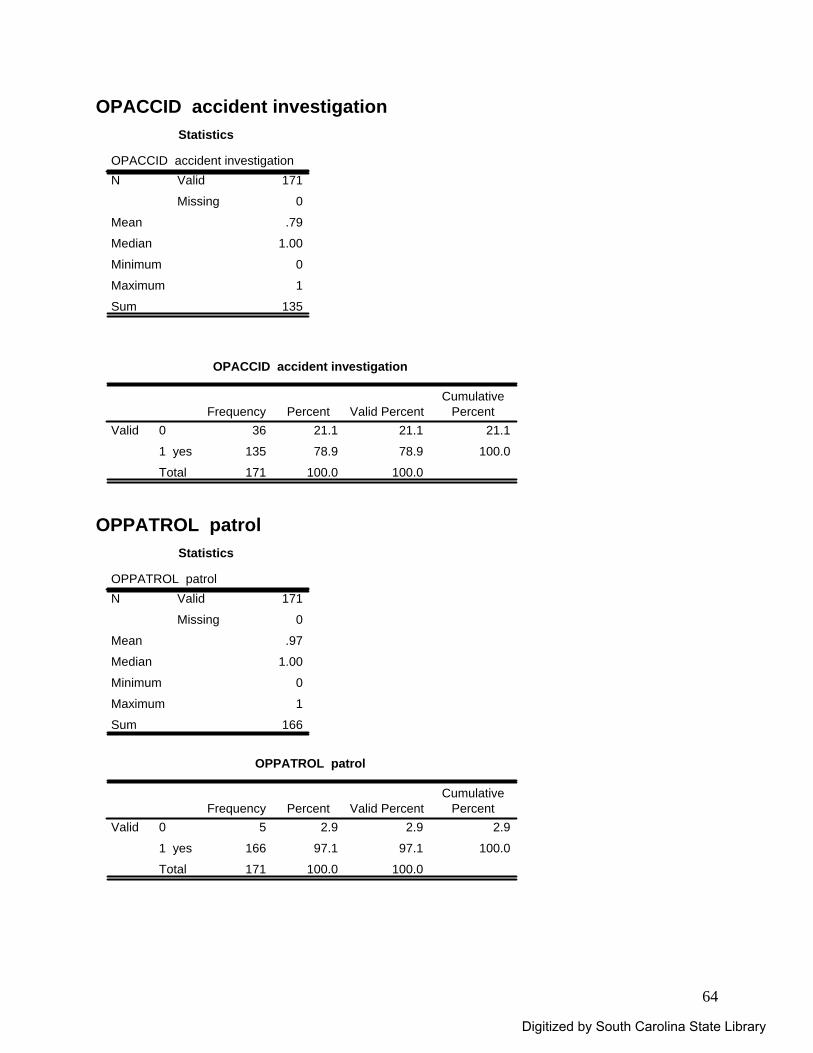
64
OPACCID accident investigation Statistics
OPACCID accident investigation171
0
.79
1.00
0
1
135
Valid
Missing
N
Mean
Median
Minimum
Maximum
Sum
OPACCID accident investigation
36 21.1 21.1 21.1
135 78.9 78.9 100.0
171 100.0 100.0
0
1 yes
Total
ValidFrequency Percent Valid Percent
CumulativePercent
OPPATROL patrol
Statistics
OPPATROL patrol171
0
.97
1.00
0
1
166
Valid
Missing
N
Mean
Median
Minimum
Maximum
Sum
OPPATROL patrol
5 2.9 2.9 2.9
166 97.1 97.1 100.0
171 100.0 100.0
0
1 yes
Total
ValidFrequency Percent Valid Percent
CumulativePercent
Digitized by South Carolina State Library
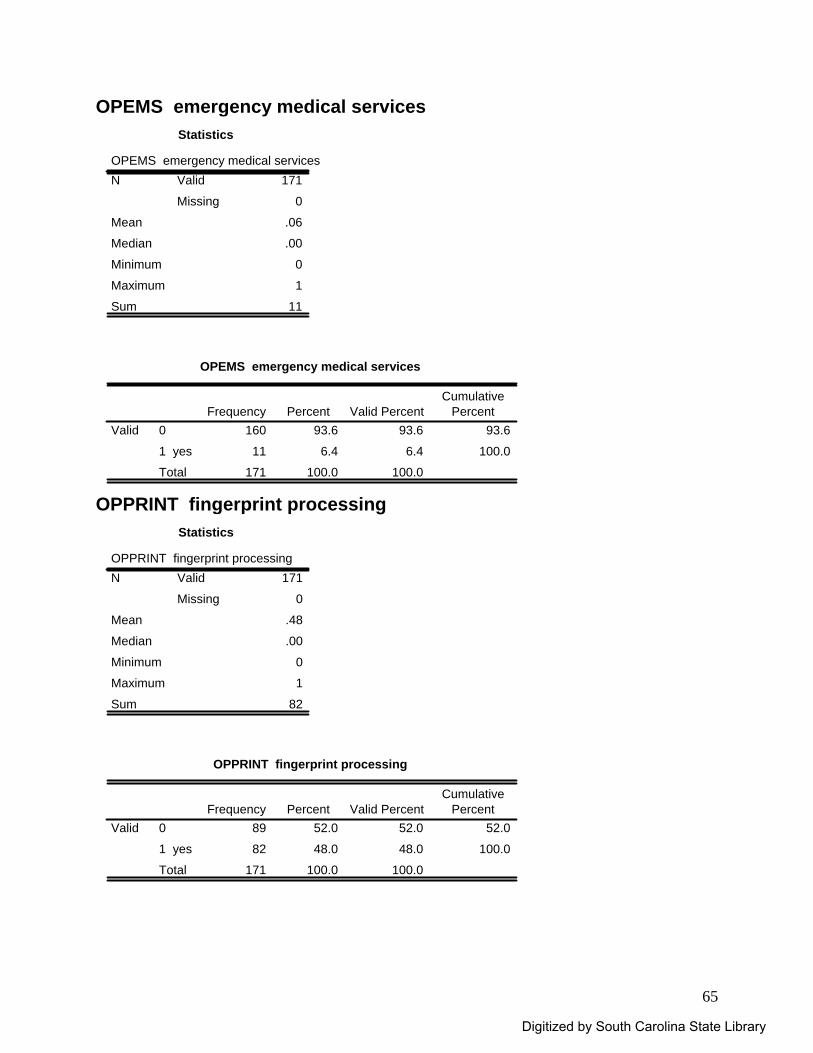
65
OPEMS emergency medical services Statistics
OPEMS emergency medical services171
0
.06
.00
0
1
11
Valid
Missing
N
Mean
Median
Minimum
Maximum
Sum
OPEMS emergency medical services
160 93.6 93.6 93.6
11 6.4 6.4 100.0
171 100.0 100.0
0
1 yes
Total
ValidFrequency Percent Valid Percent
CumulativePercent
OPPRINT fingerprint processing
Statistics
OPPRINT fingerprint processing171
0
.48
.00
0
1
82
Valid
Missing
N
Mean
Median
Minimum
Maximum
Sum
OPPRINT fingerprint processing
89 52.0 52.0 52.0
82 48.0 48.0 100.0
171 100.0 100.0
0
1 yes
Total
ValidFrequency Percent Valid Percent
CumulativePercent
Digitized by South Carolina State Library

66
OPBAL ballistics testing Statistics
OPBAL ballistics testing171
0
.01
.00
0
1
2
Valid
Missing
N
Mean
Median
Minimum
Maximum
Sum
OPBAL ballistics testing
169 98.8 98.8 98.8
2 1.2 1.2 100.0
171 100.0 100.0
0
1 yes
Total
ValidFrequency Percent Valid Percent
CumulativePercent
OPCAD dispatching calls for service
Statistics
OPCAD dispatching calls for service171
0
.40
.00
0
1
68
Valid
Missing
N
Mean
Median
Minimum
Maximum
Sum
OPCAD dispatching calls for service
103 60.2 60.2 60.2
68 39.8 39.8 100.0
171 100.0 100.0
0
1 yes
Total
ValidFrequency Percent Valid Percent
CumulativePercent
Digitized by South Carolina State Library

67
OPLAB crime lab services Statistics
OPLAB crime lab services171
0
.12
.00
0
1
21
Valid
Missing
N
Mean
Median
Minimum
Maximum
Sum
OPLAB crime lab services
150 87.7 87.7 87.7
21 12.3 12.3 100.0
171 100.0 100.0
0
1 yes
Total
ValidFrequency Percent Valid Percent
CumulativePercent
OPCOURT court security
Statistics
OPCOURT court security171
0
.49
.00
0
1
84
Valid
Missing
N
Mean
Median
Minimum
Maximum
Sum
OPCOURT court security
87 50.9 50.9 50.9
84 49.1 49.1 100.0
171 100.0 100.0
0
1 yes
Total
ValidFrequency Percent Valid Percent
CumulativePercent
Digitized by South Carolina State Library
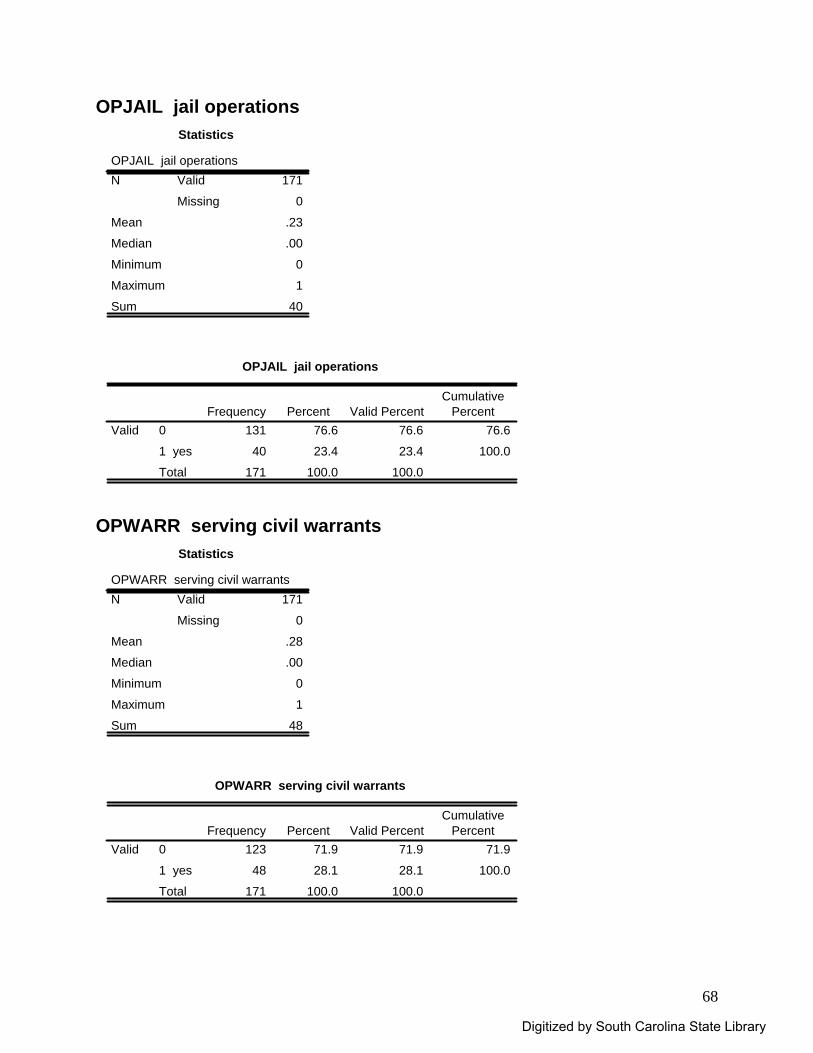
68
OPJAIL jail operations Statistics
OPJAIL jail operations171
0
.23
.00
0
1
40
Valid
Missing
N
Mean
Median
Minimum
Maximum
Sum
OPJAIL jail operations
131 76.6 76.6 76.6
40 23.4 23.4 100.0
171 100.0 100.0
0
1 yes
Total
ValidFrequency Percent Valid Percent
CumulativePercent
OPWARR serving civil warrants
Statistics
OPWARR serving civil warrants171
0
.28
.00
0
1
48
Valid
Missing
N
Mean
Median
Minimum
Maximum
Sum
OPWARR serving civil warrants
123 71.9 71.9 71.9
48 28.1 28.1 100.0
171 100.0 100.0
0
1 yes
Total
ValidFrequency Percent Valid Percent
CumulativePercent
Digitized by South Carolina State Library
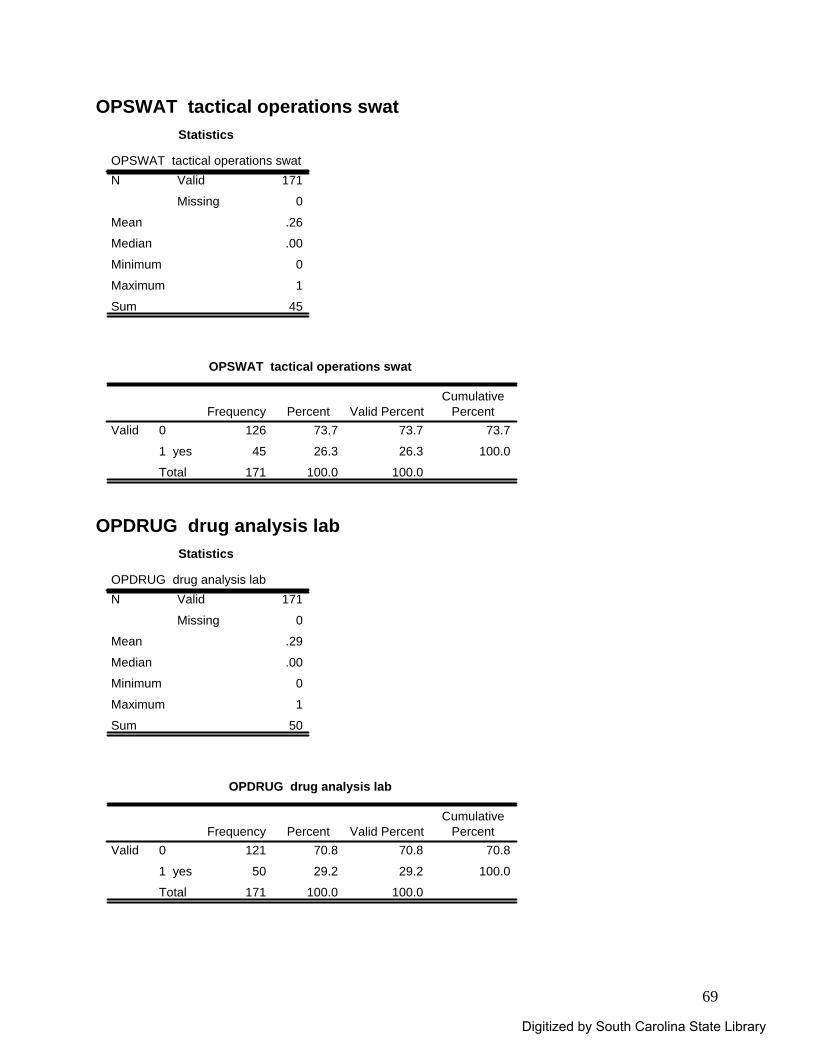
69
OPSWAT tactical operations swat Statistics
OPSWAT tactical operations swat171
0
.26
.00
0
1
45
Valid
Missing
N
Mean
Median
Minimum
Maximum
Sum
OPSWAT tactical operations swat
126 73.7 73.7 73.7
45 26.3 26.3 100.0
171 100.0 100.0
0
1 yes
Total
ValidFrequency Percent Valid Percent
CumulativePercent
OPDRUG drug analysis lab
Statistics
OPDRUG drug analysis lab171
0
.29
.00
0
1
50
Valid
Missing
N
Mean
Median
Minimum
Maximum
Sum
OPDRUG drug analysis lab
121 70.8 70.8 70.8
50 29.2 29.2 100.0
171 100.0 100.0
0
1 yes
Total
ValidFrequency Percent Valid Percent
CumulativePercent
Digitized by South Carolina State Library
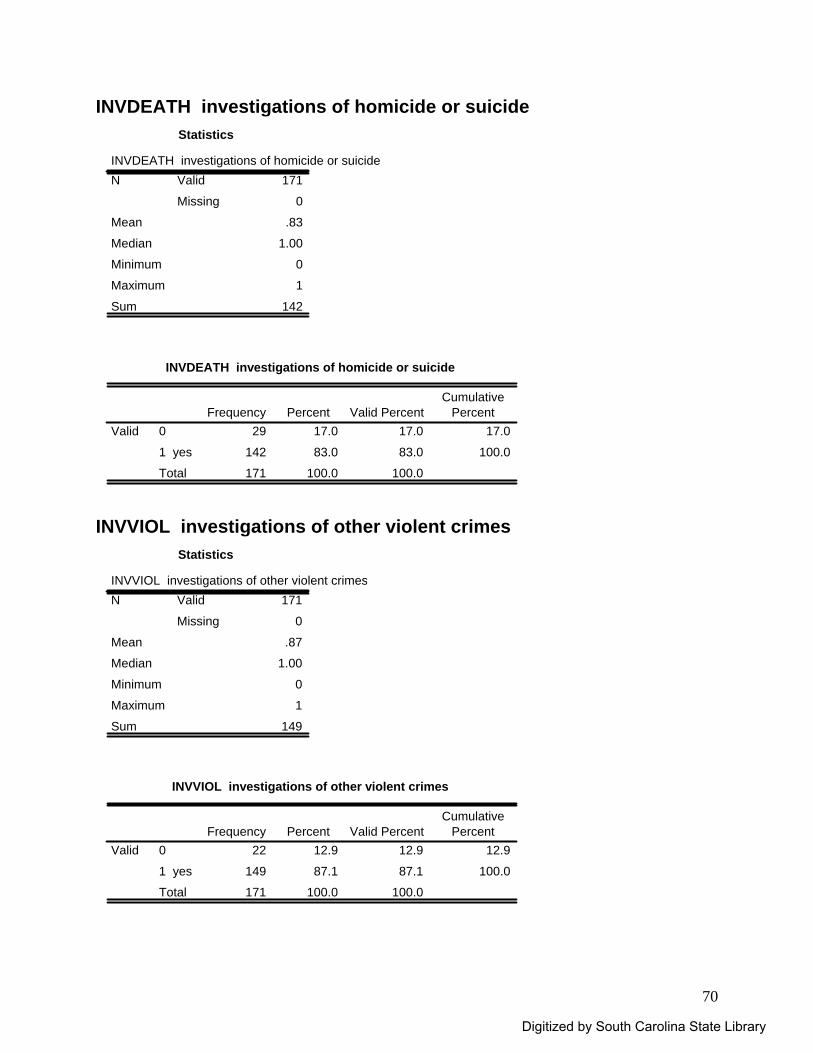
70
INVDEATH investigations of homicide or suicide Statistics
INVDEATH investigations of homicide or suicide171
0
.83
1.00
0
1
142
Valid
Missing
N
Mean
Median
Minimum
Maximum
Sum
INVDEATH investigations of homicide or suicide
29 17.0 17.0 17.0
142 83.0 83.0 100.0
171 100.0 100.0
0
1 yes
Total
ValidFrequency Percent Valid Percent
CumulativePercent
INVVIOL investigations of other violent crimes
Statistics
INVVIOL investigations of other violent crimes171
0
.87
1.00
0
1
149
Valid
Missing
N
Mean
Median
Minimum
Maximum
Sum
INVVIOL investigations of other violent crimes
22 12.9 12.9 12.9
149 87.1 87.1 100.0
171 100.0 100.0
0
1 yes
Total
ValidFrequency Percent Valid Percent
CumulativePercent
Digitized by South Carolina State Library
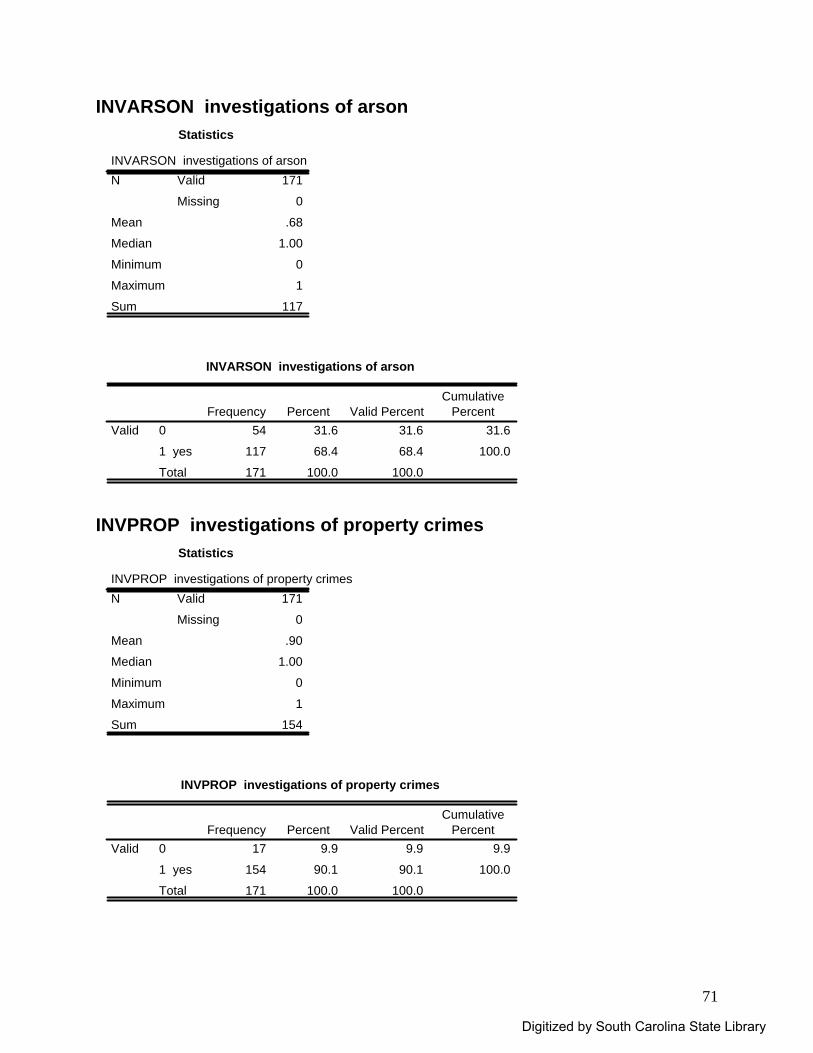
71
INVARSON investigations of arson Statistics
INVARSON investigations of arson171
0
.68
1.00
0
1
117
Valid
Missing
N
Mean
Median
Minimum
Maximum
Sum
INVARSON investigations of arson
54 31.6 31.6 31.6
117 68.4 68.4 100.0
171 100.0 100.0
0
1 yes
Total
ValidFrequency Percent Valid Percent
CumulativePercent
INVPROP investigations of property crimes
Statistics
INVPROP investigations of property crimes171
0
.90
1.00
0
1
154
Valid
Missing
N
Mean
Median
Minimum
Maximum
Sum
INVPROP investigations of property crimes
17 9.9 9.9 9.9
154 90.1 90.1 100.0
171 100.0 100.0
0
1 yes
Total
ValidFrequency Percent Valid Percent
CumulativePercent
Digitized by South Carolina State Library
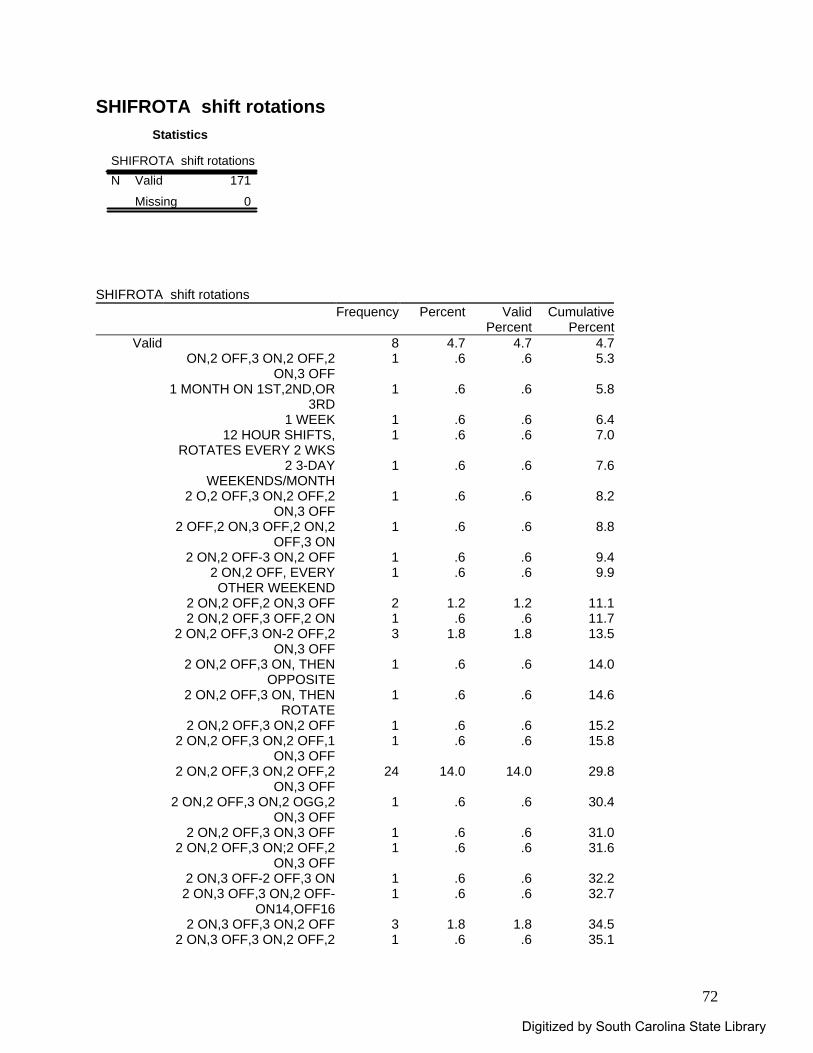
72
SHIFROTA shift rotations Statistics
SHIFROTA shift rotations171
0
Valid
Missing
N
SHIFROTA shift rotations
Frequency Percent Valid Percent
Cumulative Percent
Valid 8 4.7 4.7 4.7 ON,2 OFF,3 ON,2 OFF,2
ON,3 OFF1 .6 .6 5.3
1 MONTH ON 1ST,2ND,OR3RD
1 .6 .6 5.8
1 WEEK 1 .6 .6 6.412 HOUR SHIFTS,
ROTATES EVERY 2 WKS1 .6 .6 7.0
2 3-DAY WEEKENDS/MONTH
1 .6 .6 7.6
2 O,2 OFF,3 ON,2 OFF,2ON,3 OFF
1 .6 .6 8.2
2 OFF,2 ON,3 OFF,2 ON,2OFF,3 ON
1 .6 .6 8.8
2 ON,2 OFF-3 ON,2 OFF 1 .6 .6 9.42 ON,2 OFF, EVERYOTHER WEEKEND
1 .6 .6 9.9
2 ON,2 OFF,2 ON,3 OFF 2 1.2 1.2 11.12 ON,2 OFF,3 OFF,2 ON 1 .6 .6 11.7
2 ON,2 OFF,3 ON-2 OFF,2ON,3 OFF
3 1.8 1.8 13.5
2 ON,2 OFF,3 ON, THENOPPOSITE
1 .6 .6 14.0
2 ON,2 OFF,3 ON, THENROTATE
1 .6 .6 14.6
2 ON,2 OFF,3 ON,2 OFF 1 .6 .6 15.22 ON,2 OFF,3 ON,2 OFF,1
ON,3 OFF1 .6 .6 15.8
2 ON,2 OFF,3 ON,2 OFF,2ON,3 OFF
24 14.0 14.0 29.8
2 ON,2 OFF,3 ON,2 OGG,2ON,3 OFF
1 .6 .6 30.4
2 ON,2 OFF,3 ON,3 OFF 1 .6 .6 31.02 ON,2 OFF,3 ON;2 OFF,2
ON,3 OFF1 .6 .6 31.6
2 ON,3 OFF-2 OFF,3 ON 1 .6 .6 32.22 ON,3 OFF,3 ON,2 OFF-
ON14,OFF161 .6 .6 32.7
2 ON,3 OFF,3 ON,2 OFF 3 1.8 1.8 34.52 ON,3 OFF,3 ON,2 OFF,2 1 .6 .6 35.1
Digitized by South Carolina State Library
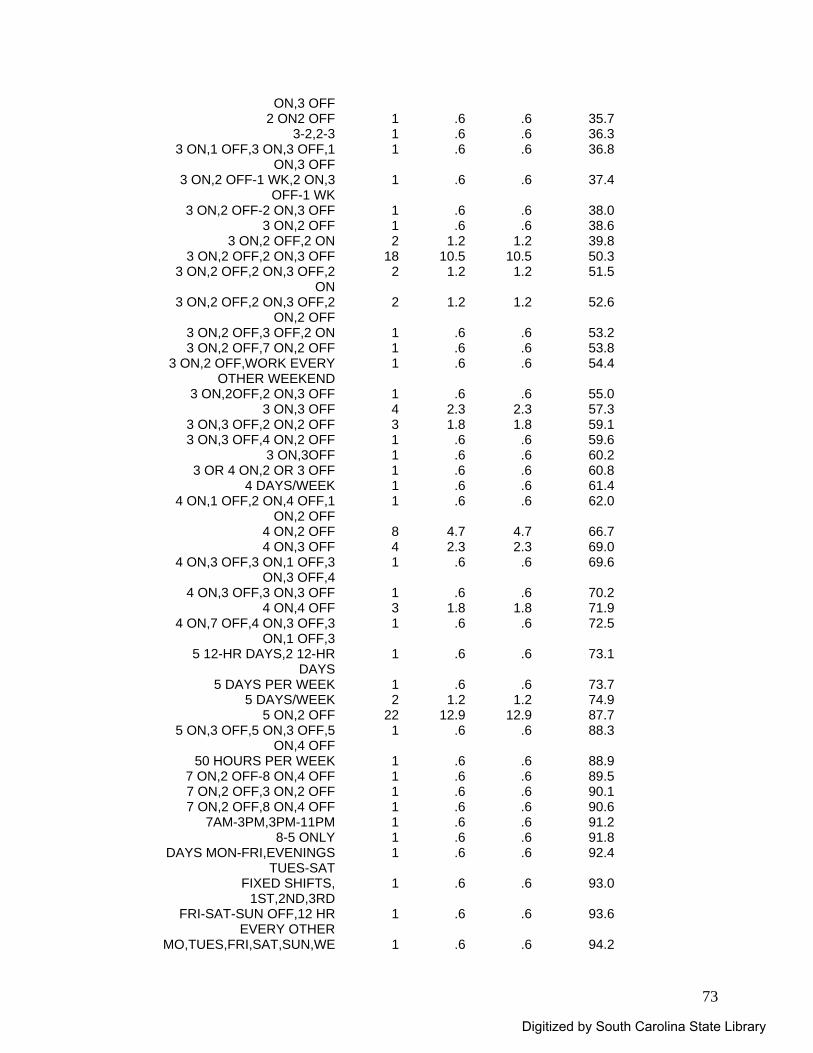
73
ON,3 OFF2 ON2 OFF 1 .6 .6 35.7
3-2,2-3 1 .6 .6 36.33 ON,1 OFF,3 ON,3 OFF,1
ON,3 OFF1 .6 .6 36.8
3 ON,2 OFF-1 WK,2 ON,3OFF-1 WK
1 .6 .6 37.4
3 ON,2 OFF-2 ON,3 OFF 1 .6 .6 38.03 ON,2 OFF 1 .6 .6 38.6
3 ON,2 OFF,2 ON 2 1.2 1.2 39.83 ON,2 OFF,2 ON,3 OFF 18 10.5 10.5 50.3
3 ON,2 OFF,2 ON,3 OFF,2ON
2 1.2 1.2 51.5
3 ON,2 OFF,2 ON,3 OFF,2ON,2 OFF
2 1.2 1.2 52.6
3 ON,2 OFF,3 OFF,2 ON 1 .6 .6 53.23 ON,2 OFF,7 ON,2 OFF 1 .6 .6 53.8
3 ON,2 OFF,WORK EVERYOTHER WEEKEND
1 .6 .6 54.4
3 ON,2OFF,2 ON,3 OFF 1 .6 .6 55.03 ON,3 OFF 4 2.3 2.3 57.3
3 ON,3 OFF,2 ON,2 OFF 3 1.8 1.8 59.13 ON,3 OFF,4 ON,2 OFF 1 .6 .6 59.6
3 ON,3OFF 1 .6 .6 60.23 OR 4 ON,2 OR 3 OFF 1 .6 .6 60.8
4 DAYS/WEEK 1 .6 .6 61.44 ON,1 OFF,2 ON,4 OFF,1
ON,2 OFF1 .6 .6 62.0
4 ON,2 OFF 8 4.7 4.7 66.74 ON,3 OFF 4 2.3 2.3 69.0
4 ON,3 OFF,3 ON,1 OFF,3ON,3 OFF,4
1 .6 .6 69.6
4 ON,3 OFF,3 ON,3 OFF 1 .6 .6 70.24 ON,4 OFF 3 1.8 1.8 71.9
4 ON,7 OFF,4 ON,3 OFF,3ON,1 OFF,3
1 .6 .6 72.5
5 12-HR DAYS,2 12-HR DAYS
1 .6 .6 73.1
5 DAYS PER WEEK 1 .6 .6 73.75 DAYS/WEEK 2 1.2 1.2 74.9
5 ON,2 OFF 22 12.9 12.9 87.75 ON,3 OFF,5 ON,3 OFF,5
ON,4 OFF1 .6 .6 88.3
50 HOURS PER WEEK 1 .6 .6 88.97 ON,2 OFF-8 ON,4 OFF 1 .6 .6 89.57 ON,2 OFF,3 ON,2 OFF 1 .6 .6 90.17 ON,2 OFF,8 ON,4 OFF 1 .6 .6 90.6
7AM-3PM,3PM-11PM 1 .6 .6 91.28-5 ONLY 1 .6 .6 91.8
DAYS MON-FRI,EVENINGSTUES-SAT
1 .6 .6 92.4
FIXED SHIFTS,1ST,2ND,3RD
1 .6 .6 93.0
FRI-SAT-SUN OFF,12 HREVERY OTHER
1 .6 .6 93.6
MO,TUES,FRI,SAT,SUN,WE 1 .6 .6 94.2
Digitized by South Carolina State Library
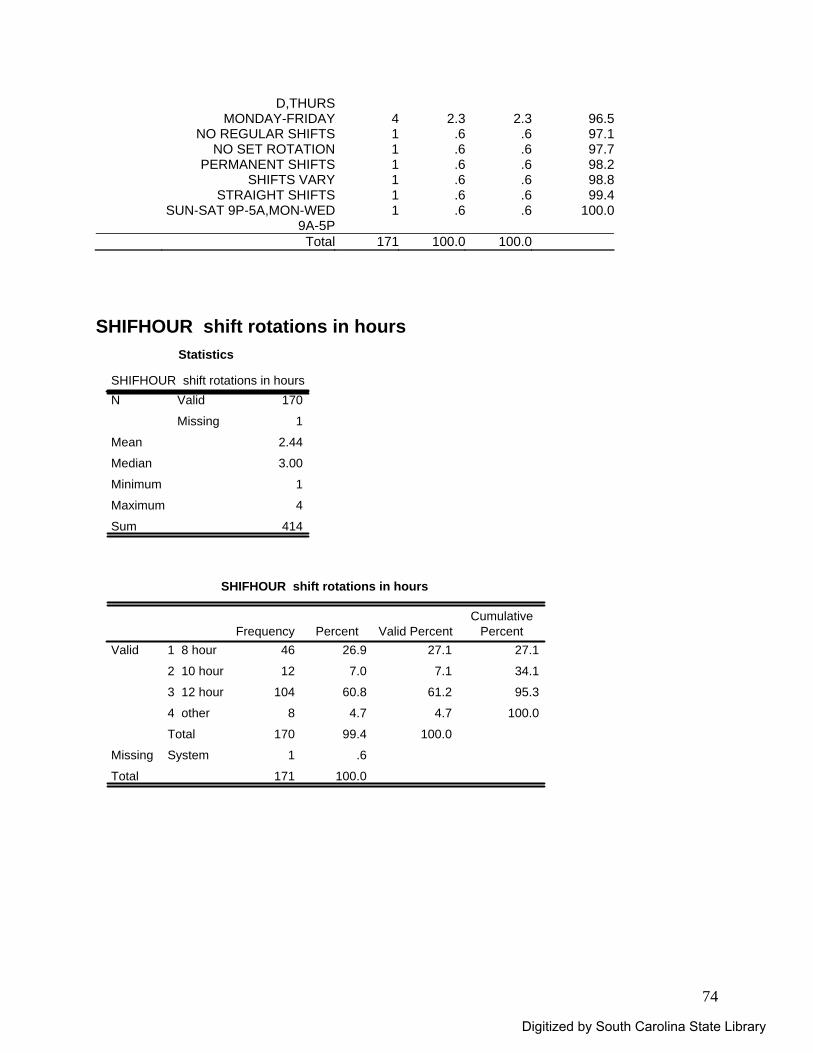
74
D,THURSMONDAY-FRIDAY 4 2.3 2.3 96.5
NO REGULAR SHIFTS 1 .6 .6 97.1NO SET ROTATION 1 .6 .6 97.7
PERMANENT SHIFTS 1 .6 .6 98.2SHIFTS VARY 1 .6 .6 98.8
STRAIGHT SHIFTS 1 .6 .6 99.4SUN-SAT 9P-5A,MON-WED
9A-5P1 .6 .6 100.0
Total 171 100.0 100.0
SHIFHOUR shift rotations in hours
Statistics
SHIFHOUR shift rotations in hours170
1
2.44
3.00
1
4
414
Valid
Missing
N
Mean
Median
Minimum
Maximum
Sum
SHIFHOUR shift rotations in hours
46 26.9 27.1 27.1
12 7.0 7.1 34.1
104 60.8 61.2 95.3
8 4.7 4.7 100.0
170 99.4 100.0
1 .6
171 100.0
1 8 hour
2 10 hour
3 12 hour
4 other
Total
Valid
SystemMissing
Total
Frequency Percent Valid PercentCumulative
Percent
Digitized by South Carolina State Library
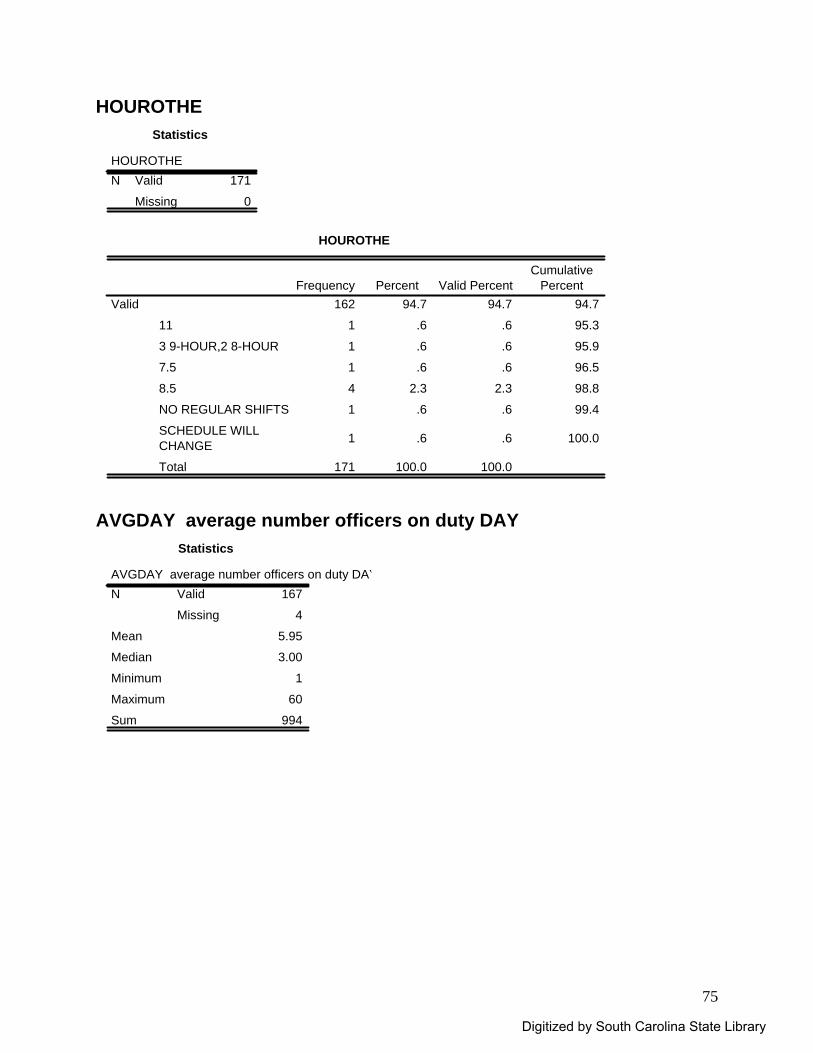
75
HOUROTHE Statistics
HOUROTHE171
0
Valid
Missing
N
HOUROTHE
162 94.7 94.7 94.7
1 .6 .6 95.3
1 .6 .6 95.9
1 .6 .6 96.5
4 2.3 2.3 98.8
1 .6 .6 99.4
1 .6 .6 100.0
171 100.0 100.0
11
3 9-HOUR,2 8-HOUR
7.5
8.5
NO REGULAR SHIFTS
SCHEDULE WILLCHANGE
Total
ValidFrequency Percent Valid Percent
CumulativePercent
AVGDAY average number officers on duty DAY
Statistics
AVGDAY average number officers on duty DAY167
4
5.95
3.00
1
60
994
Valid
Missing
N
Mean
Median
Minimum
Maximum
Sum
Digitized by South Carolina State Library
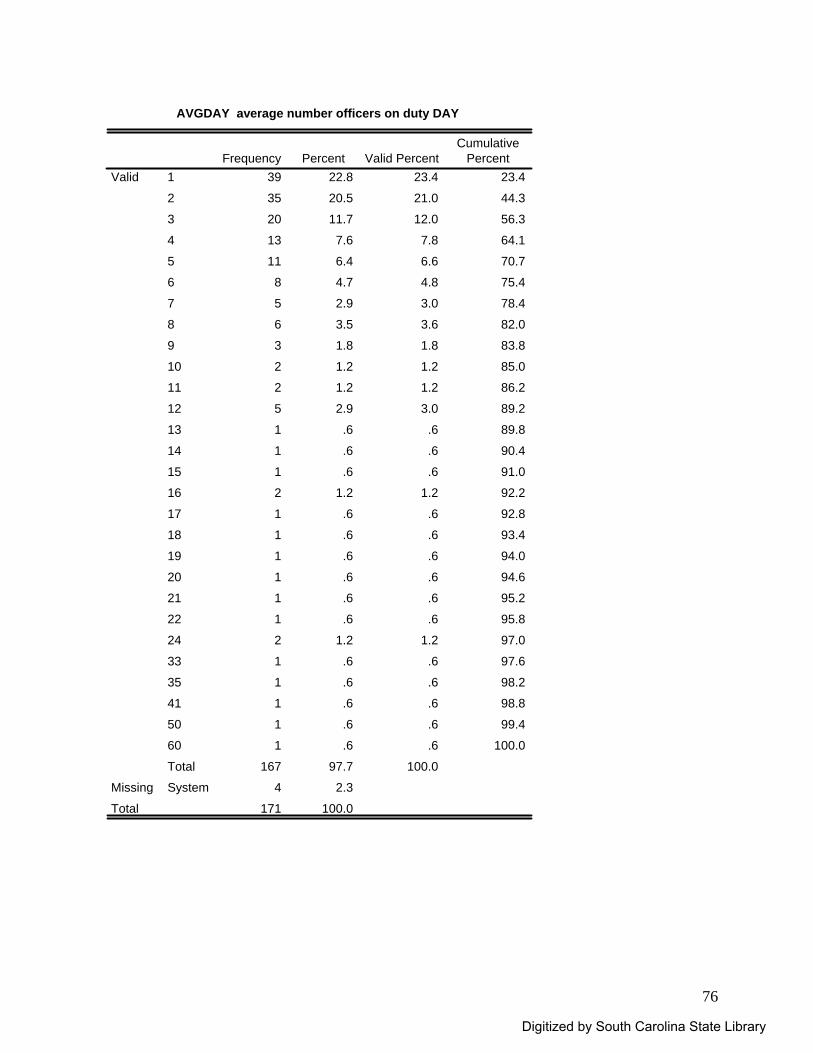
76
AVGDAY average number officers on duty DAY
39 22.8 23.4 23.4
35 20.5 21.0 44.3
20 11.7 12.0 56.3
13 7.6 7.8 64.1
11 6.4 6.6 70.7
8 4.7 4.8 75.4
5 2.9 3.0 78.4
6 3.5 3.6 82.0
3 1.8 1.8 83.8
2 1.2 1.2 85.0
2 1.2 1.2 86.2
5 2.9 3.0 89.2
1 .6 .6 89.8
1 .6 .6 90.4
1 .6 .6 91.0
2 1.2 1.2 92.2
1 .6 .6 92.8
1 .6 .6 93.4
1 .6 .6 94.0
1 .6 .6 94.6
1 .6 .6 95.2
1 .6 .6 95.8
2 1.2 1.2 97.0
1 .6 .6 97.6
1 .6 .6 98.2
1 .6 .6 98.8
1 .6 .6 99.4
1 .6 .6 100.0
167 97.7 100.0
4 2.3
171 100.0
1
2
3
4
5
6
7
8
9
10
11
12
13
14
15
16
17
18
19
20
21
22
24
33
35
41
50
60
Total
Valid
SystemMissing
Total
Frequency Percent Valid PercentCumulative
Percent
Digitized by South Carolina State Library
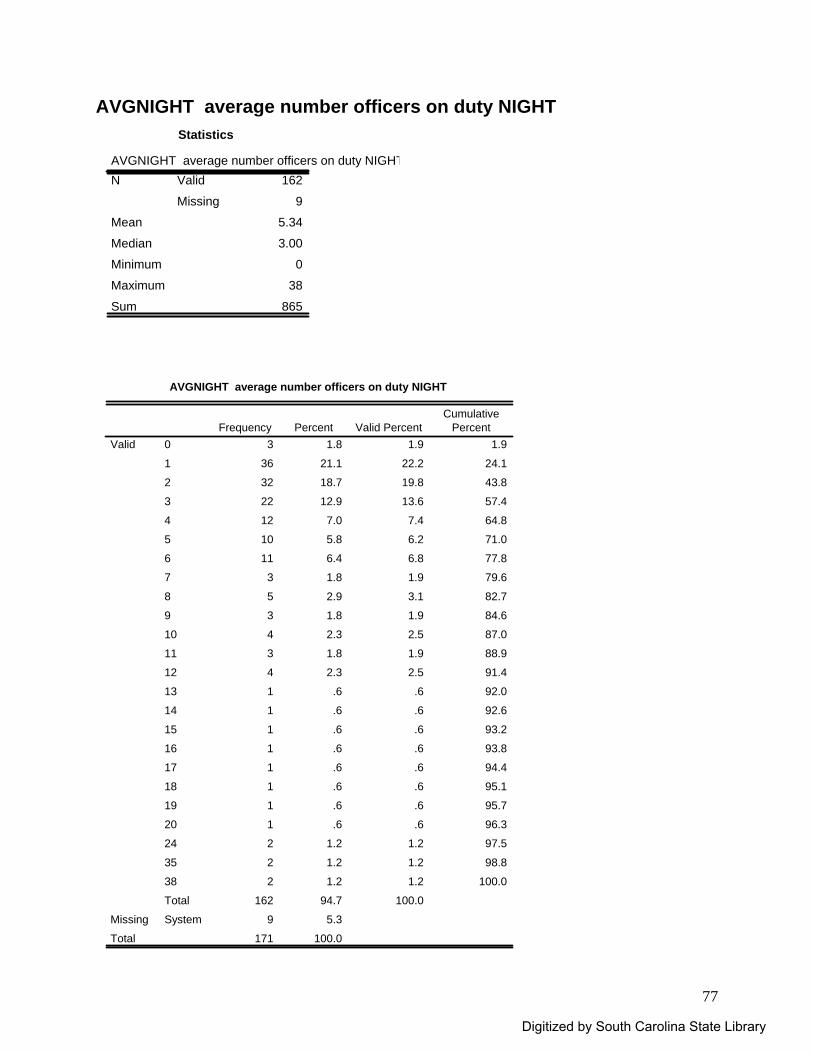
77
AVGNIGHT average number officers on duty NIGHT Statistics
AVGNIGHT average number officers on duty NIGHT162
9
5.34
3.00
0
38
865
Valid
Missing
N
Mean
Median
Minimum
Maximum
Sum
AVGNIGHT average number officers on duty NIGHT
3 1.8 1.9 1.9
36 21.1 22.2 24.1
32 18.7 19.8 43.8
22 12.9 13.6 57.4
12 7.0 7.4 64.8
10 5.8 6.2 71.0
11 6.4 6.8 77.8
3 1.8 1.9 79.6
5 2.9 3.1 82.7
3 1.8 1.9 84.6
4 2.3 2.5 87.0
3 1.8 1.9 88.9
4 2.3 2.5 91.4
1 .6 .6 92.0
1 .6 .6 92.6
1 .6 .6 93.2
1 .6 .6 93.8
1 .6 .6 94.4
1 .6 .6 95.1
1 .6 .6 95.7
1 .6 .6 96.3
2 1.2 1.2 97.5
2 1.2 1.2 98.8
2 1.2 1.2 100.0
162 94.7 100.0
9 5.3
171 100.0
0
1
2
3
4
5
6
7
8
9
10
11
12
13
14
15
16
17
18
19
20
24
35
38
Total
Valid
SystemMissing
Total
Frequency Percent Valid PercentCumulative
Percent
Digitized by South Carolina State Library
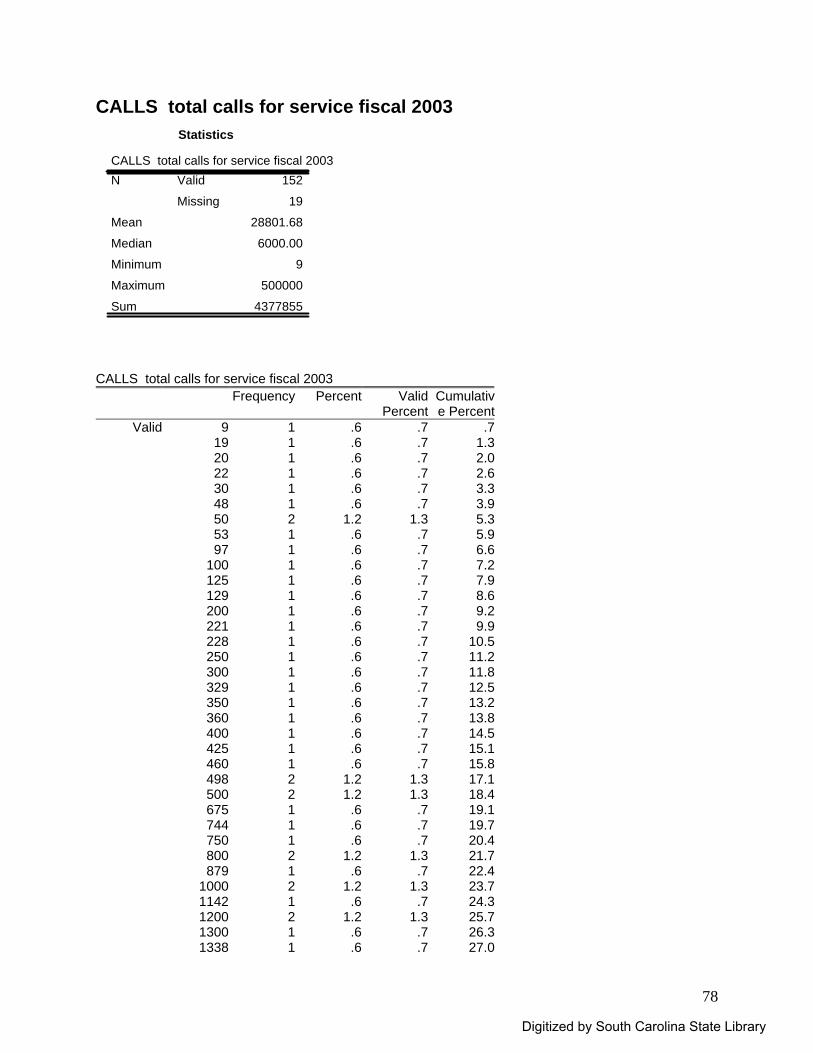
78
CALLS total calls for service fiscal 2003 Statistics
CALLS total calls for service fiscal 2003152
19
28801.68
6000.00
9
500000
4377855
Valid
Missing
N
Mean
Median
Minimum
Maximum
Sum
CALLS total calls for service fiscal 2003
Frequency Percent Valid Percent
Cumulative Percent
Valid 9 1 .6 .7 .719 1 .6 .7 1.320 1 .6 .7 2.022 1 .6 .7 2.630 1 .6 .7 3.348 1 .6 .7 3.950 2 1.2 1.3 5.353 1 .6 .7 5.997 1 .6 .7 6.6
100 1 .6 .7 7.2125 1 .6 .7 7.9129 1 .6 .7 8.6200 1 .6 .7 9.2221 1 .6 .7 9.9228 1 .6 .7 10.5250 1 .6 .7 11.2300 1 .6 .7 11.8329 1 .6 .7 12.5350 1 .6 .7 13.2360 1 .6 .7 13.8400 1 .6 .7 14.5425 1 .6 .7 15.1460 1 .6 .7 15.8498 2 1.2 1.3 17.1500 2 1.2 1.3 18.4675 1 .6 .7 19.1744 1 .6 .7 19.7750 1 .6 .7 20.4800 2 1.2 1.3 21.7879 1 .6 .7 22.4
1000 2 1.2 1.3 23.71142 1 .6 .7 24.31200 2 1.2 1.3 25.71300 1 .6 .7 26.31338 1 .6 .7 27.0
Digitized by South Carolina State Library
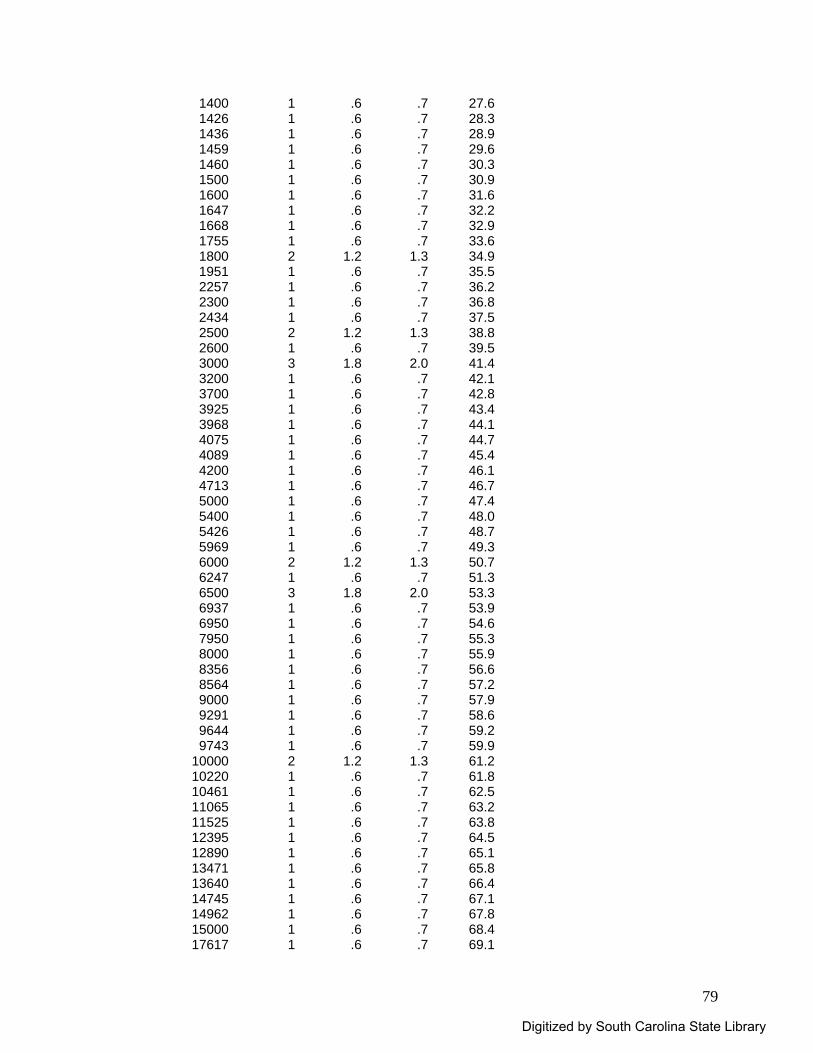
79
1400 1 .6 .7 27.61426 1 .6 .7 28.31436 1 .6 .7 28.91459 1 .6 .7 29.61460 1 .6 .7 30.31500 1 .6 .7 30.91600 1 .6 .7 31.61647 1 .6 .7 32.21668 1 .6 .7 32.91755 1 .6 .7 33.61800 2 1.2 1.3 34.91951 1 .6 .7 35.52257 1 .6 .7 36.22300 1 .6 .7 36.82434 1 .6 .7 37.52500 2 1.2 1.3 38.82600 1 .6 .7 39.53000 3 1.8 2.0 41.43200 1 .6 .7 42.13700 1 .6 .7 42.83925 1 .6 .7 43.43968 1 .6 .7 44.14075 1 .6 .7 44.74089 1 .6 .7 45.44200 1 .6 .7 46.14713 1 .6 .7 46.75000 1 .6 .7 47.45400 1 .6 .7 48.05426 1 .6 .7 48.75969 1 .6 .7 49.36000 2 1.2 1.3 50.76247 1 .6 .7 51.36500 3 1.8 2.0 53.36937 1 .6 .7 53.96950 1 .6 .7 54.67950 1 .6 .7 55.38000 1 .6 .7 55.98356 1 .6 .7 56.68564 1 .6 .7 57.29000 1 .6 .7 57.99291 1 .6 .7 58.69644 1 .6 .7 59.29743 1 .6 .7 59.9
10000 2 1.2 1.3 61.210220 1 .6 .7 61.810461 1 .6 .7 62.511065 1 .6 .7 63.211525 1 .6 .7 63.812395 1 .6 .7 64.512890 1 .6 .7 65.113471 1 .6 .7 65.813640 1 .6 .7 66.414745 1 .6 .7 67.114962 1 .6 .7 67.815000 1 .6 .7 68.417617 1 .6 .7 69.1
Digitized by South Carolina State Library
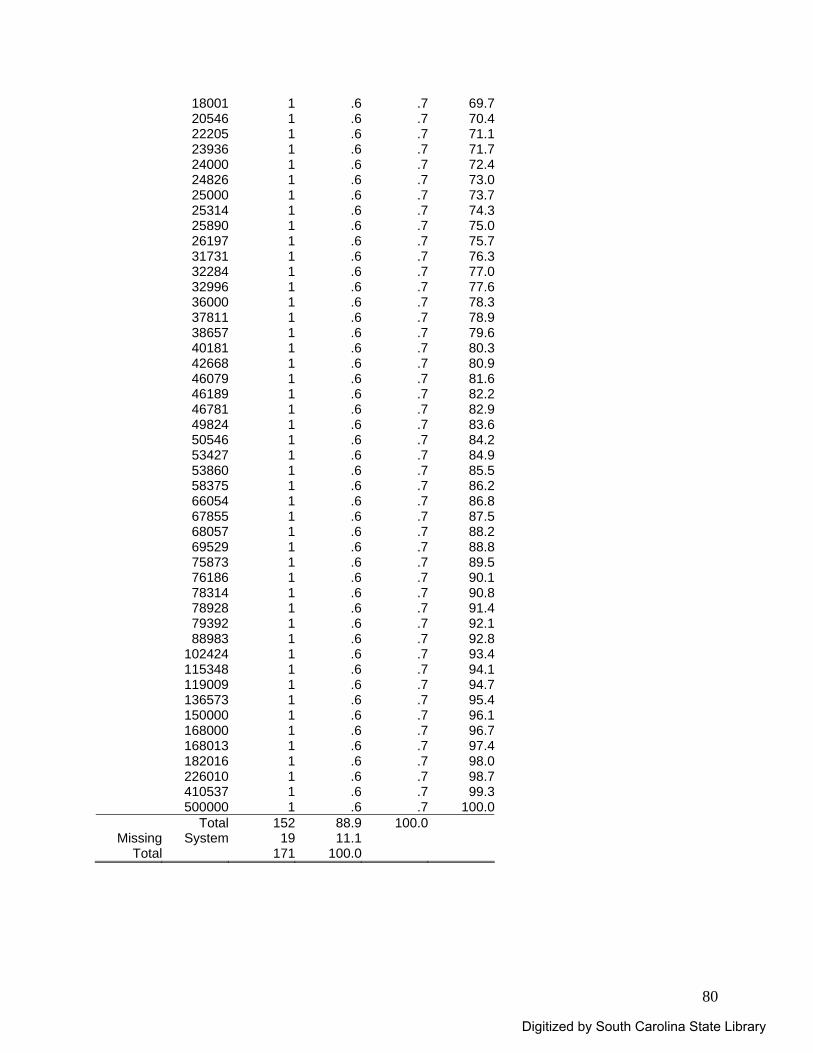
80
18001 1 .6 .7 69.720546 1 .6 .7 70.422205 1 .6 .7 71.123936 1 .6 .7 71.724000 1 .6 .7 72.424826 1 .6 .7 73.025000 1 .6 .7 73.725314 1 .6 .7 74.325890 1 .6 .7 75.026197 1 .6 .7 75.731731 1 .6 .7 76.332284 1 .6 .7 77.032996 1 .6 .7 77.636000 1 .6 .7 78.337811 1 .6 .7 78.938657 1 .6 .7 79.640181 1 .6 .7 80.342668 1 .6 .7 80.946079 1 .6 .7 81.646189 1 .6 .7 82.246781 1 .6 .7 82.949824 1 .6 .7 83.650546 1 .6 .7 84.253427 1 .6 .7 84.953860 1 .6 .7 85.558375 1 .6 .7 86.266054 1 .6 .7 86.867855 1 .6 .7 87.568057 1 .6 .7 88.269529 1 .6 .7 88.875873 1 .6 .7 89.576186 1 .6 .7 90.178314 1 .6 .7 90.878928 1 .6 .7 91.479392 1 .6 .7 92.188983 1 .6 .7 92.8
102424 1 .6 .7 93.4115348 1 .6 .7 94.1119009 1 .6 .7 94.7136573 1 .6 .7 95.4150000 1 .6 .7 96.1168000 1 .6 .7 96.7168013 1 .6 .7 97.4182016 1 .6 .7 98.0226010 1 .6 .7 98.7410537 1 .6 .7 99.3500000 1 .6 .7 100.0
Total 152 88.9 100.0Missing System 19 11.1
Total 171 100.0
Digitized by South Carolina State Library
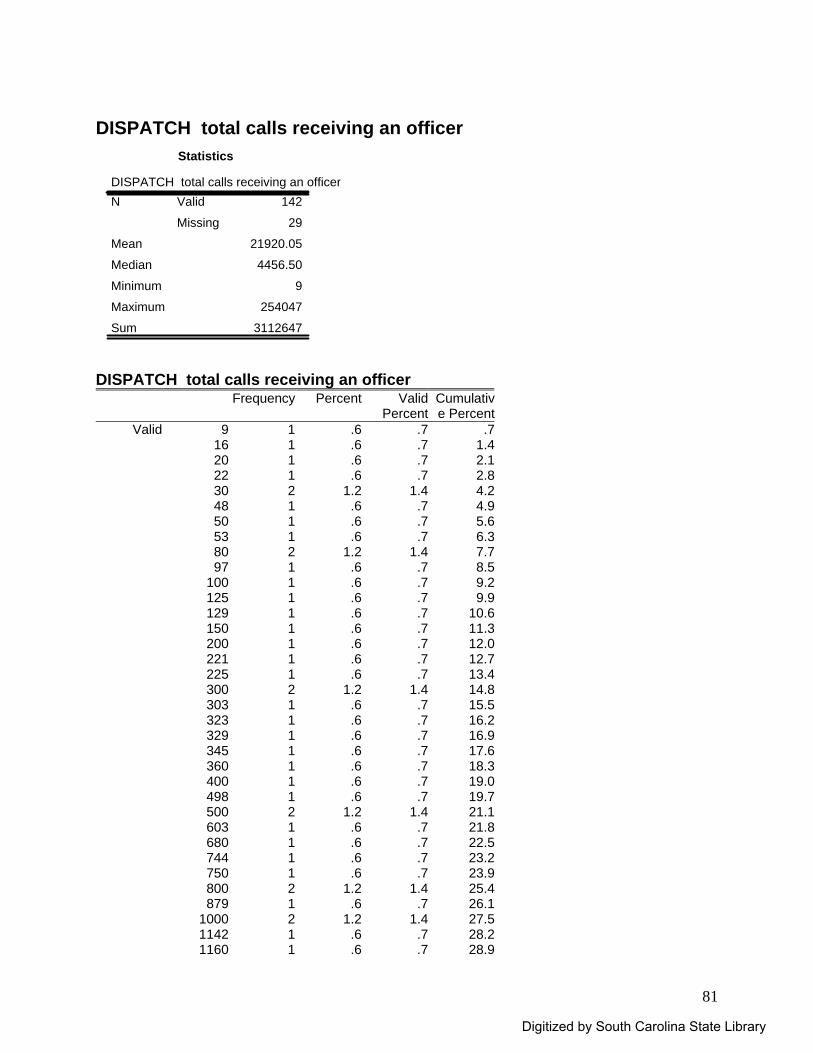
81
DISPATCH total calls receiving an officer
Statistics
DISPATCH total calls receiving an officer142
29
21920.05
4456.50
9
254047
3112647
Valid
Missing
N
Mean
Median
Minimum
Maximum
Sum
DISPATCH total calls receiving an officer
Frequency Percent Valid Percent
Cumulative Percent
Valid 9 1 .6 .7 .716 1 .6 .7 1.420 1 .6 .7 2.122 1 .6 .7 2.830 2 1.2 1.4 4.248 1 .6 .7 4.950 1 .6 .7 5.653 1 .6 .7 6.380 2 1.2 1.4 7.797 1 .6 .7 8.5
100 1 .6 .7 9.2125 1 .6 .7 9.9129 1 .6 .7 10.6150 1 .6 .7 11.3200 1 .6 .7 12.0221 1 .6 .7 12.7225 1 .6 .7 13.4300 2 1.2 1.4 14.8303 1 .6 .7 15.5323 1 .6 .7 16.2329 1 .6 .7 16.9345 1 .6 .7 17.6360 1 .6 .7 18.3400 1 .6 .7 19.0498 1 .6 .7 19.7500 2 1.2 1.4 21.1603 1 .6 .7 21.8680 1 .6 .7 22.5744 1 .6 .7 23.2750 1 .6 .7 23.9800 2 1.2 1.4 25.4879 1 .6 .7 26.1
1000 2 1.2 1.4 27.51142 1 .6 .7 28.21160 1 .6 .7 28.9
Digitized by South Carolina State Library
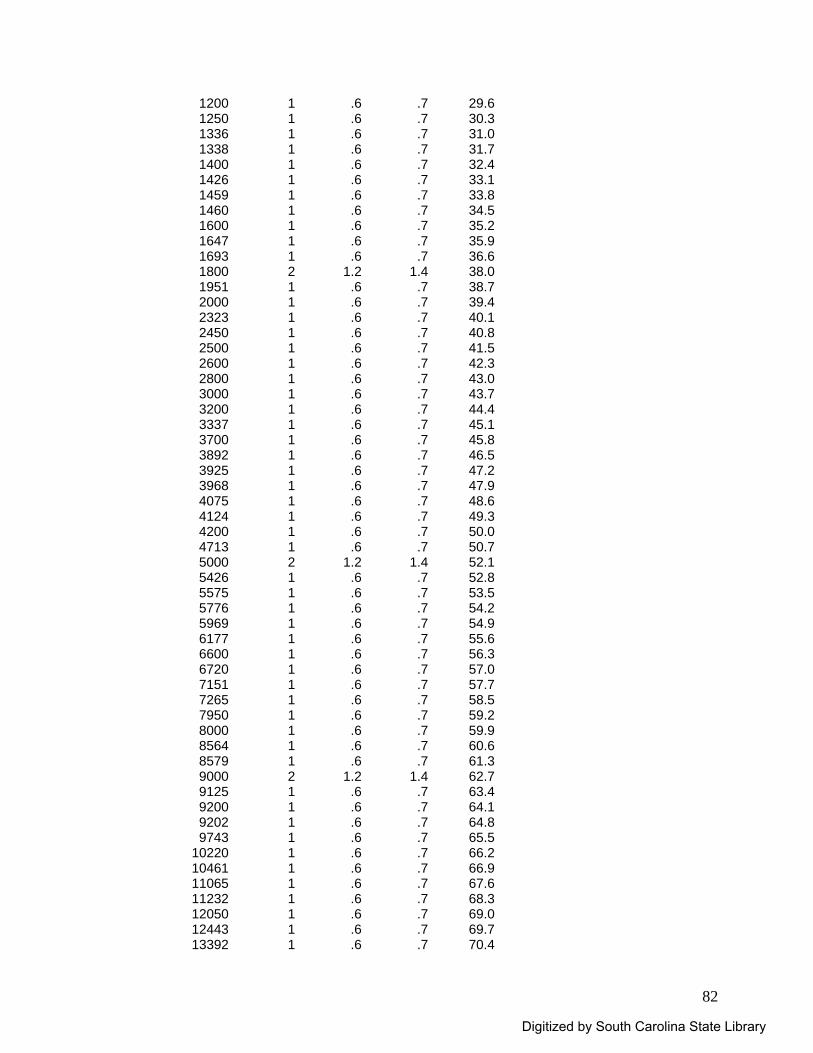
82
1200 1 .6 .7 29.61250 1 .6 .7 30.31336 1 .6 .7 31.01338 1 .6 .7 31.71400 1 .6 .7 32.41426 1 .6 .7 33.11459 1 .6 .7 33.81460 1 .6 .7 34.51600 1 .6 .7 35.21647 1 .6 .7 35.91693 1 .6 .7 36.61800 2 1.2 1.4 38.01951 1 .6 .7 38.72000 1 .6 .7 39.42323 1 .6 .7 40.12450 1 .6 .7 40.82500 1 .6 .7 41.52600 1 .6 .7 42.32800 1 .6 .7 43.03000 1 .6 .7 43.73200 1 .6 .7 44.43337 1 .6 .7 45.13700 1 .6 .7 45.83892 1 .6 .7 46.53925 1 .6 .7 47.23968 1 .6 .7 47.94075 1 .6 .7 48.64124 1 .6 .7 49.34200 1 .6 .7 50.04713 1 .6 .7 50.75000 2 1.2 1.4 52.15426 1 .6 .7 52.85575 1 .6 .7 53.55776 1 .6 .7 54.25969 1 .6 .7 54.96177 1 .6 .7 55.66600 1 .6 .7 56.36720 1 .6 .7 57.07151 1 .6 .7 57.77265 1 .6 .7 58.57950 1 .6 .7 59.28000 1 .6 .7 59.98564 1 .6 .7 60.68579 1 .6 .7 61.39000 2 1.2 1.4 62.79125 1 .6 .7 63.49200 1 .6 .7 64.19202 1 .6 .7 64.89743 1 .6 .7 65.5
10220 1 .6 .7 66.210461 1 .6 .7 66.911065 1 .6 .7 67.611232 1 .6 .7 68.312050 1 .6 .7 69.012443 1 .6 .7 69.713392 1 .6 .7 70.4
Digitized by South Carolina State Library
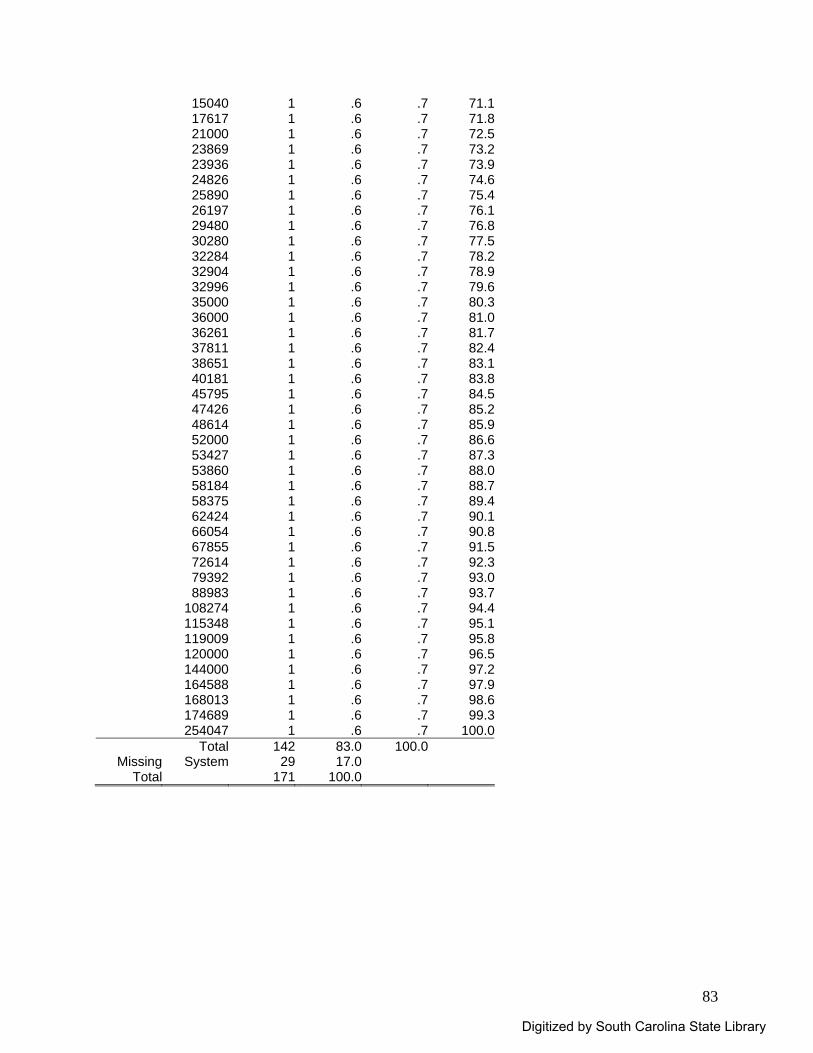
83
15040 1 .6 .7 71.117617 1 .6 .7 71.821000 1 .6 .7 72.523869 1 .6 .7 73.223936 1 .6 .7 73.924826 1 .6 .7 74.625890 1 .6 .7 75.426197 1 .6 .7 76.129480 1 .6 .7 76.830280 1 .6 .7 77.532284 1 .6 .7 78.232904 1 .6 .7 78.932996 1 .6 .7 79.635000 1 .6 .7 80.336000 1 .6 .7 81.036261 1 .6 .7 81.737811 1 .6 .7 82.438651 1 .6 .7 83.140181 1 .6 .7 83.845795 1 .6 .7 84.547426 1 .6 .7 85.248614 1 .6 .7 85.952000 1 .6 .7 86.653427 1 .6 .7 87.353860 1 .6 .7 88.058184 1 .6 .7 88.758375 1 .6 .7 89.462424 1 .6 .7 90.166054 1 .6 .7 90.867855 1 .6 .7 91.572614 1 .6 .7 92.379392 1 .6 .7 93.088983 1 .6 .7 93.7
108274 1 .6 .7 94.4115348 1 .6 .7 95.1119009 1 .6 .7 95.8120000 1 .6 .7 96.5144000 1 .6 .7 97.2164588 1 .6 .7 97.9168013 1 .6 .7 98.6174689 1 .6 .7 99.3254047 1 .6 .7 100.0
Total 142 83.0 100.0Missing System 29 17.0
Total 171 100.0
Digitized by South Carolina State Library
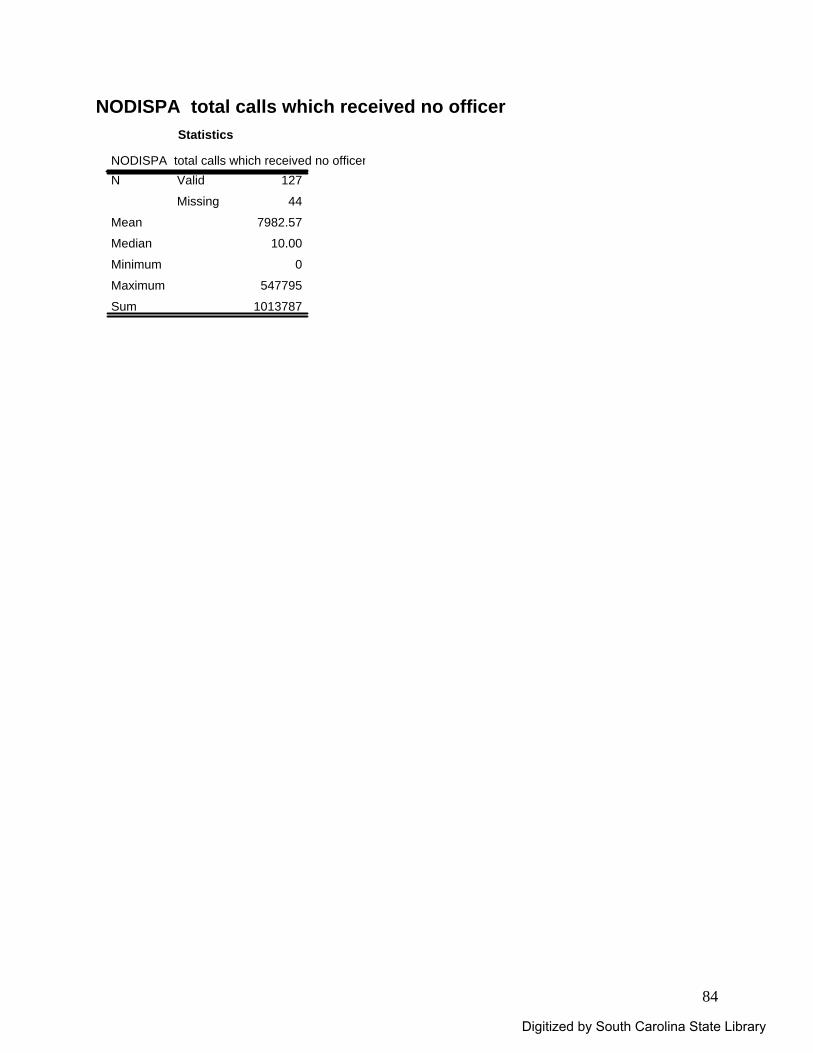
84
NODISPA total calls which received no officer Statistics
NODISPA total calls which received no officer127
44
7982.57
10.00
0
547795
1013787
Valid
Missing
N
Mean
Median
Minimum
Maximum
Sum
Digitized by South Carolina State Library
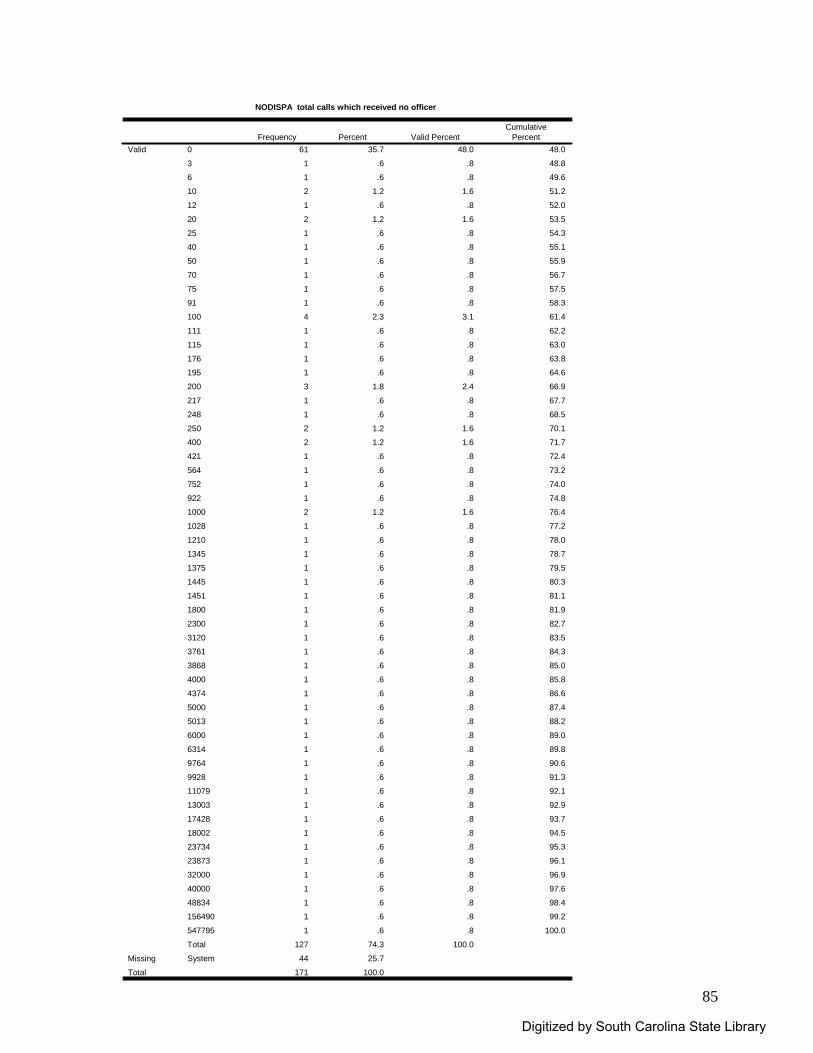
85
NODISPA total calls which received no officer
61 35.7 48.0 48.0
1 .6 .8 48.8
1 .6 .8 49.6
2 1.2 1.6 51.2
1 .6 .8 52.0
2 1.2 1.6 53.5
1 .6 .8 54.3
1 .6 .8 55.1
1 .6 .8 55.9
1 .6 .8 56.7
1 .6 .8 57.5
1 .6 .8 58.3
4 2.3 3.1 61.4
1 .6 .8 62.2
1 .6 .8 63.0
1 .6 .8 63.8
1 .6 .8 64.6
3 1.8 2.4 66.9
1 .6 .8 67.7
1 .6 .8 68.5
2 1.2 1.6 70.1
2 1.2 1.6 71.7
1 .6 .8 72.4
1 .6 .8 73.2
1 .6 .8 74.0
1 .6 .8 74.8
2 1.2 1.6 76.4
1 .6 .8 77.2
1 .6 .8 78.0
1 .6 .8 78.7
1 .6 .8 79.5
1 .6 .8 80.3
1 .6 .8 81.1
1 .6 .8 81.9
1 .6 .8 82.7
1 .6 .8 83.5
1 .6 .8 84.3
1 .6 .8 85.0
1 .6 .8 85.8
1 .6 .8 86.6
1 .6 .8 87.4
1 .6 .8 88.2
1 .6 .8 89.0
1 .6 .8 89.8
1 .6 .8 90.6
1 .6 .8 91.3
1 .6 .8 92.1
1 .6 .8 92.9
1 .6 .8 93.7
1 .6 .8 94.5
1 .6 .8 95.3
1 .6 .8 96.1
1 .6 .8 96.9
1 .6 .8 97.6
1 .6 .8 98.4
1 .6 .8 99.2
1 .6 .8 100.0
127 74.3 100.0
44 25.7
171 100.0
0
3
6
10
12
20
25
40
50
70
75
91
100
111
115
176
195
200
217
248
250
400
421
564
752
922
1000
1028
1210
1345
1375
1445
1451
1800
2300
3120
3761
3868
4000
4374
5000
5013
6000
6314
9764
9928
11079
13003
17428
18002
23734
23873
32000
40000
48834
156490
547795
Total
Valid
SystemMissing
Total
Frequency Percent Valid PercentCumulative
Percent
Digitized by South Carolina State Library
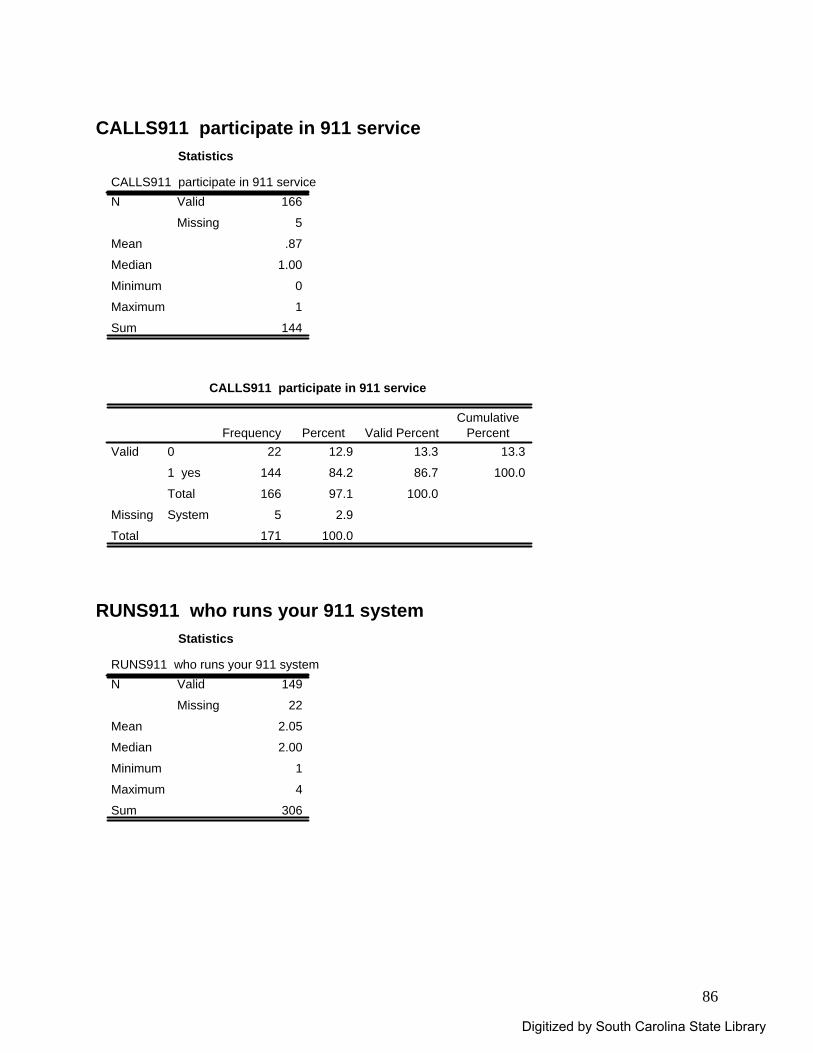
86
CALLS911 participate in 911 service
Statistics
CALLS911 participate in 911 service166
5
.87
1.00
0
1
144
Valid
Missing
N
Mean
Median
Minimum
Maximum
Sum
CALLS911 participate in 911 service
22 12.9 13.3 13.3
144 84.2 86.7 100.0
166 97.1 100.0
5 2.9
171 100.0
0
1 yes
Total
Valid
SystemMissing
Total
Frequency Percent Valid PercentCumulative
Percent
RUNS911 who runs your 911 system
Statistics
RUNS911 who runs your 911 system149
22
2.05
2.00
1
4
306
Valid
Missing
N
Mean
Median
Minimum
Maximum
Sum
Digitized by South Carolina State Library
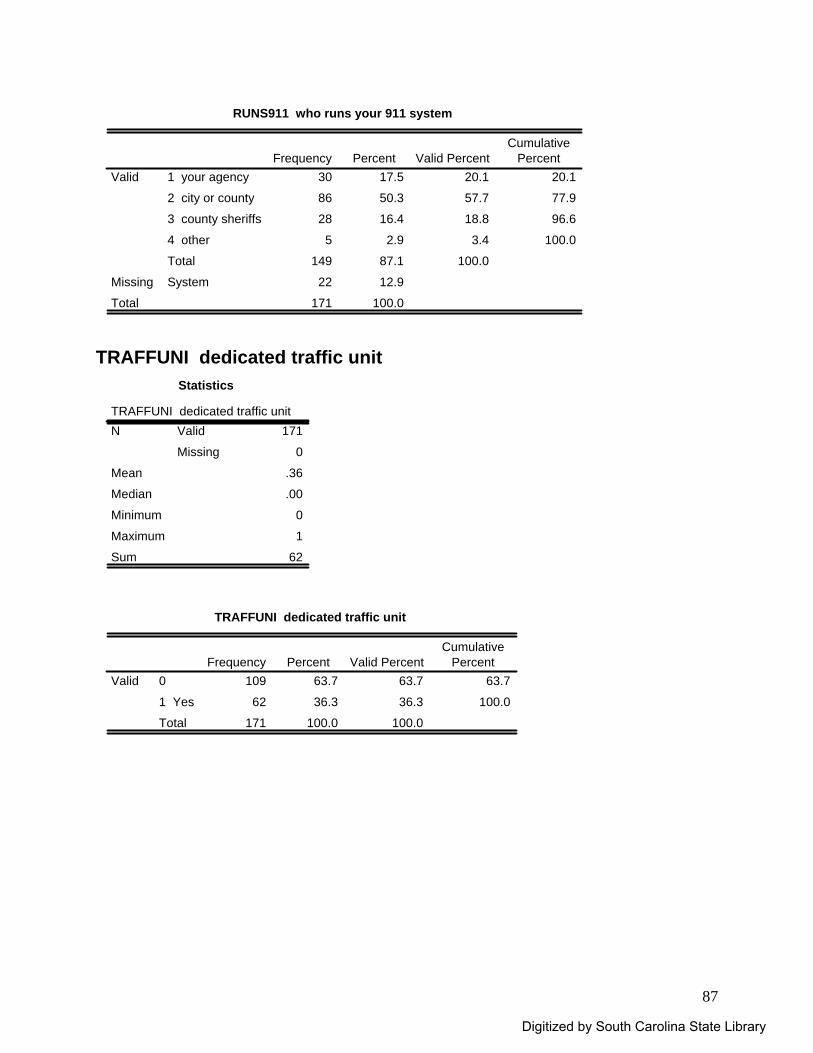
87
RUNS911 who runs your 911 system
30 17.5 20.1 20.1
86 50.3 57.7 77.9
28 16.4 18.8 96.6
5 2.9 3.4 100.0
149 87.1 100.0
22 12.9
171 100.0
1 your agency
2 city or county
3 county sheriffs
4 other
Total
Valid
SystemMissing
Total
Frequency Percent Valid PercentCumulative
Percent
TRAFFUNI dedicated traffic unit
Statistics
TRAFFUNI dedicated traffic unit171
0
.36
.00
0
1
62
Valid
Missing
N
Mean
Median
Minimum
Maximum
Sum
TRAFFUNI dedicated traffic unit
109 63.7 63.7 63.7
62 36.3 36.3 100.0
171 100.0 100.0
0
1 Yes
Total
ValidFrequency Percent Valid Percent
CumulativePercent
Digitized by South Carolina State Library
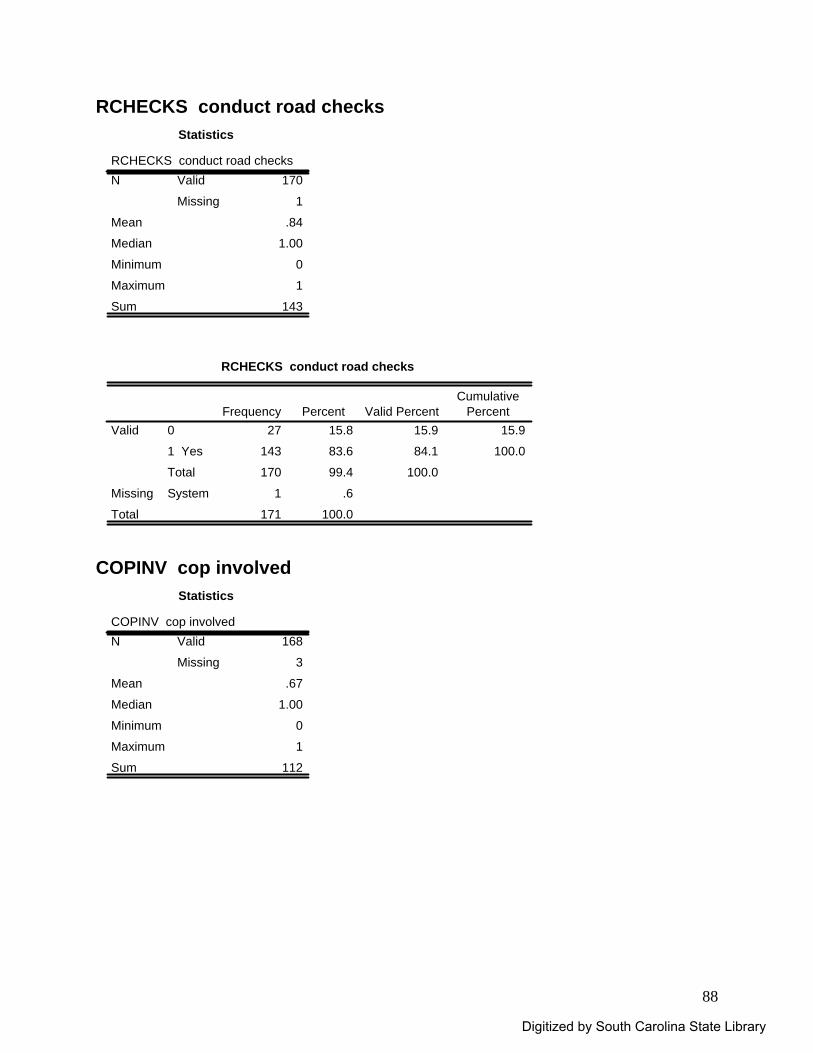
88
RCHECKS conduct road checks Statistics
RCHECKS conduct road checks170
1
.84
1.00
0
1
143
Valid
Missing
N
Mean
Median
Minimum
Maximum
Sum
RCHECKS conduct road checks
27 15.8 15.9 15.9
143 83.6 84.1 100.0
170 99.4 100.0
1 .6
171 100.0
0
1 Yes
Total
Valid
SystemMissing
Total
Frequency Percent Valid PercentCumulative
Percent
COPINV cop involved
Statistics
COPINV cop involved168
3
.67
1.00
0
1
112
Valid
Missing
N
Mean
Median
Minimum
Maximum
Sum
Digitized by South Carolina State Library
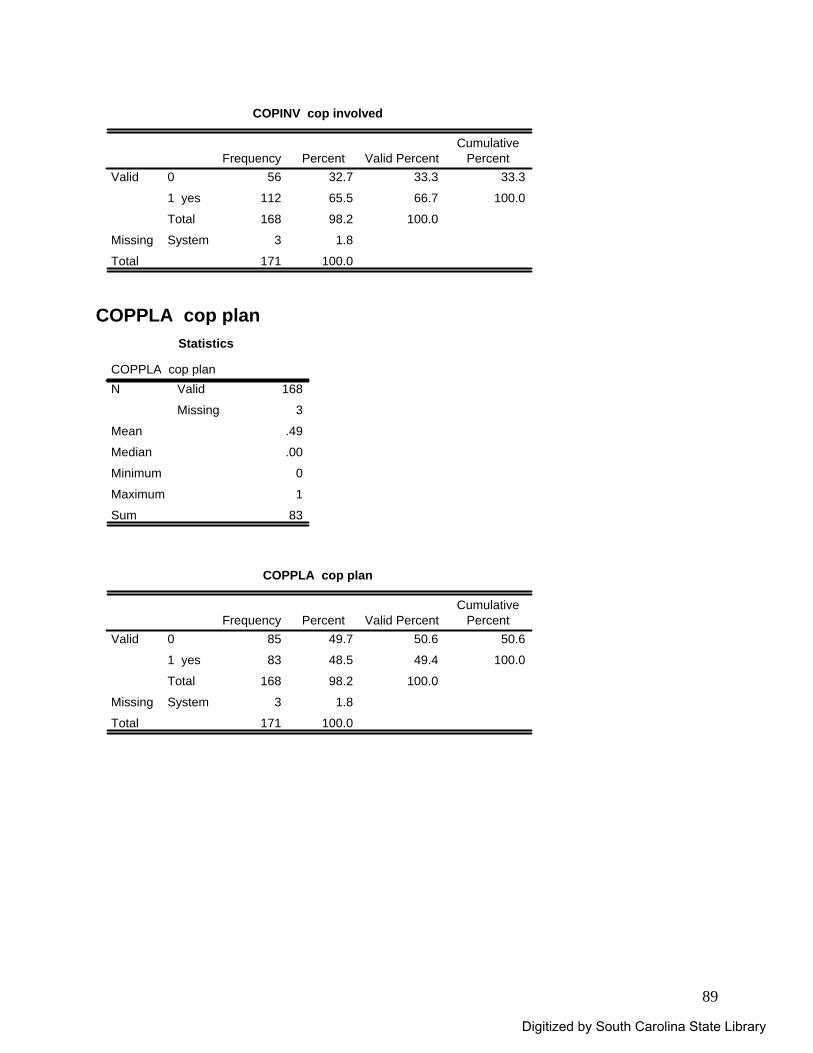
89
COPINV cop involved
56 32.7 33.3 33.3
112 65.5 66.7 100.0
168 98.2 100.0
3 1.8
171 100.0
0
1 yes
Total
Valid
SystemMissing
Total
Frequency Percent Valid PercentCumulative
Percent
COPPLA cop plan
Statistics
COPPLA cop plan168
3
.49
.00
0
1
83
Valid
Missing
N
Mean
Median
Minimum
Maximum
Sum
COPPLA cop plan
85 49.7 50.6 50.6
83 48.5 49.4 100.0
168 98.2 100.0
3 1.8
171 100.0
0
1 yes
Total
Valid
SystemMissing
Total
Frequency Percent Valid PercentCumulative
Percent
Digitized by South Carolina State Library
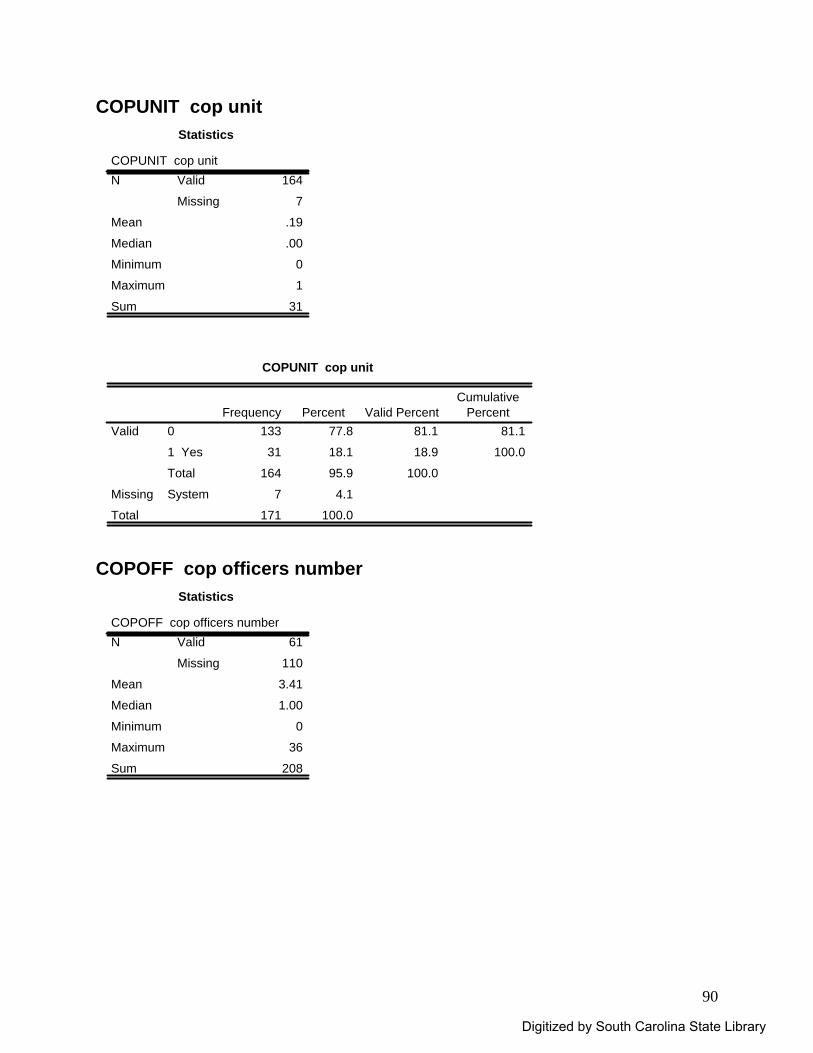
90
COPUNIT cop unit Statistics
COPUNIT cop unit164
7
.19
.00
0
1
31
Valid
Missing
N
Mean
Median
Minimum
Maximum
Sum
COPUNIT cop unit
133 77.8 81.1 81.1
31 18.1 18.9 100.0
164 95.9 100.0
7 4.1
171 100.0
0
1 Yes
Total
Valid
SystemMissing
Total
Frequency Percent Valid PercentCumulative
Percent
COPOFF cop officers number
Statistics
COPOFF cop officers number61
110
3.41
1.00
0
36
208
Valid
Missing
N
Mean
Median
Minimum
Maximum
Sum
Digitized by South Carolina State Library
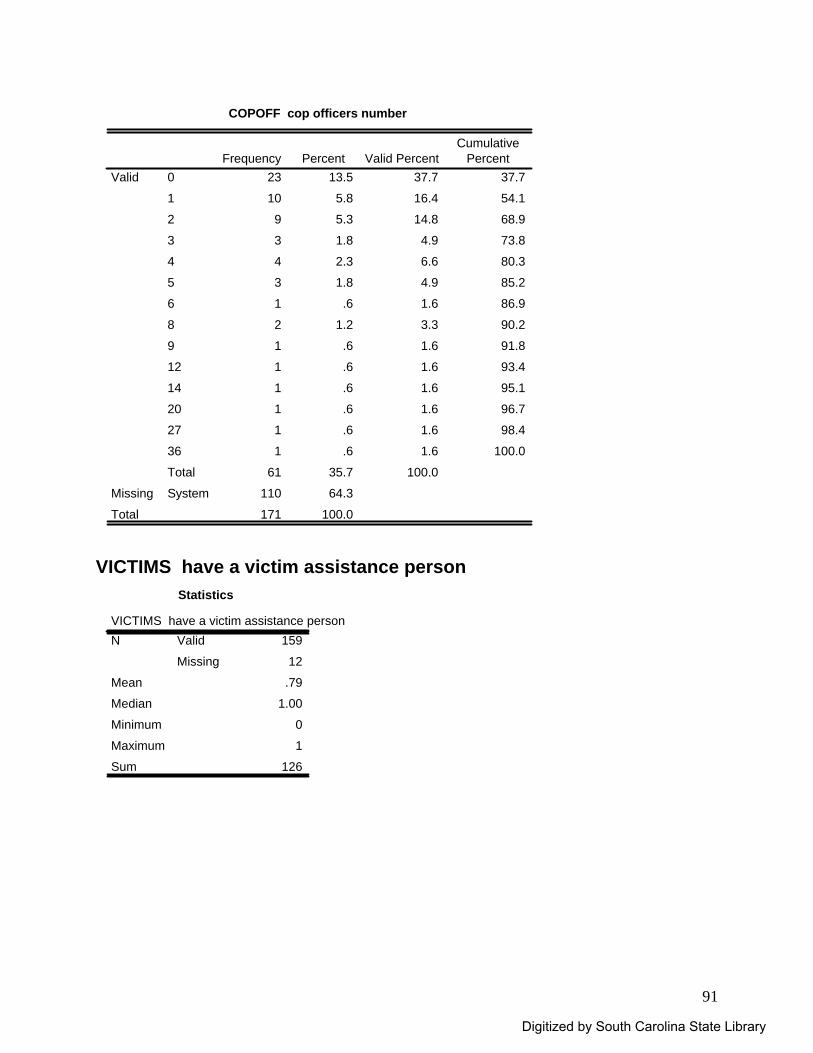
91
COPOFF cop officers number
23 13.5 37.7 37.7
10 5.8 16.4 54.1
9 5.3 14.8 68.9
3 1.8 4.9 73.8
4 2.3 6.6 80.3
3 1.8 4.9 85.2
1 .6 1.6 86.9
2 1.2 3.3 90.2
1 .6 1.6 91.8
1 .6 1.6 93.4
1 .6 1.6 95.1
1 .6 1.6 96.7
1 .6 1.6 98.4
1 .6 1.6 100.0
61 35.7 100.0
110 64.3
171 100.0
0
1
2
3
4
5
6
8
9
12
14
20
27
36
Total
Valid
SystemMissing
Total
Frequency Percent Valid PercentCumulative
Percent
VICTIMS have a victim assistance person
Statistics
VICTIMS have a victim assistance person159
12
.79
1.00
0
1
126
Valid
Missing
N
Mean
Median
Minimum
Maximum
Sum
Digitized by South Carolina State Library
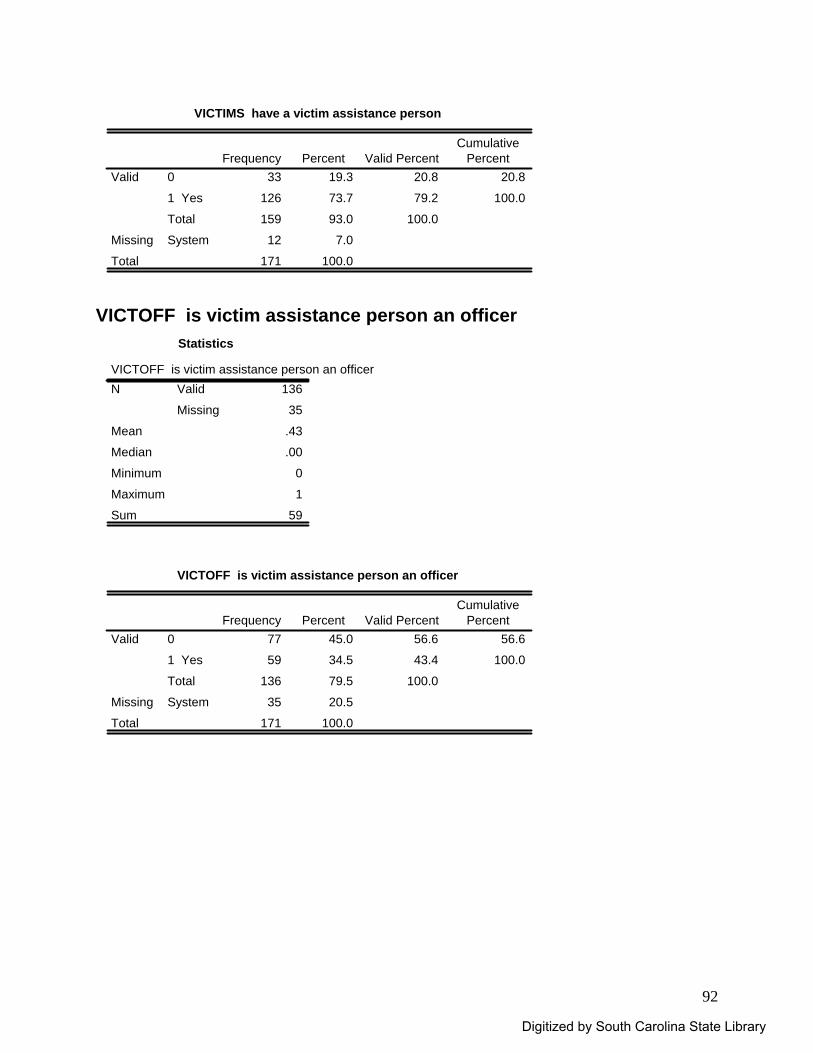
92
VICTIMS have a victim assistance person
33 19.3 20.8 20.8
126 73.7 79.2 100.0
159 93.0 100.0
12 7.0
171 100.0
0
1 Yes
Total
Valid
SystemMissing
Total
Frequency Percent Valid PercentCumulative
Percent
VICTOFF is victim assistance person an officer
Statistics
VICTOFF is victim assistance person an officer136
35
.43
.00
0
1
59
Valid
Missing
N
Mean
Median
Minimum
Maximum
Sum
VICTOFF is victim assistance person an officer
77 45.0 56.6 56.6
59 34.5 43.4 100.0
136 79.5 100.0
35 20.5
171 100.0
0
1 Yes
Total
Valid
SystemMissing
Total
Frequency Percent Valid PercentCumulative
Percent
Digitized by South Carolina State Library
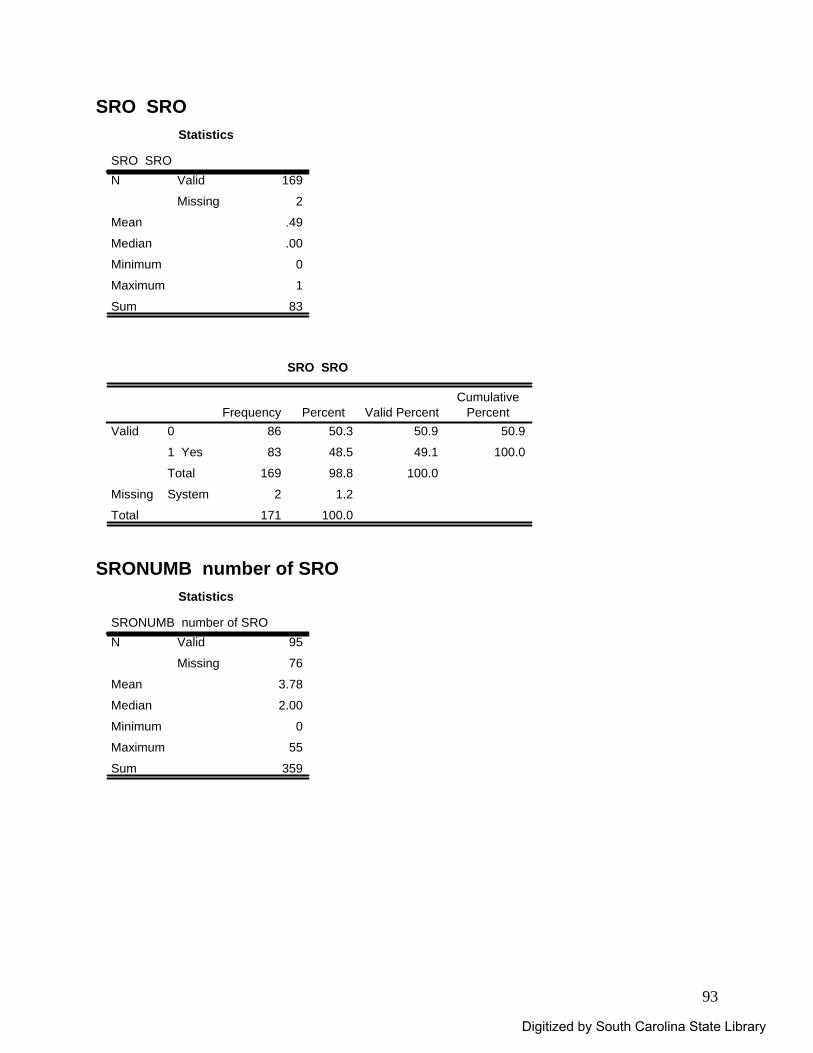
93
SRO SRO Statistics
SRO SRO169
2
.49
.00
0
1
83
Valid
Missing
N
Mean
Median
Minimum
Maximum
Sum
SRO SRO
86 50.3 50.9 50.9
83 48.5 49.1 100.0
169 98.8 100.0
2 1.2
171 100.0
0
1 Yes
Total
Valid
SystemMissing
Total
Frequency Percent Valid PercentCumulative
Percent
SRONUMB number of SRO
Statistics
SRONUMB number of SRO95
76
3.78
2.00
0
55
359
Valid
Missing
N
Mean
Median
Minimum
Maximum
Sum
Digitized by South Carolina State Library
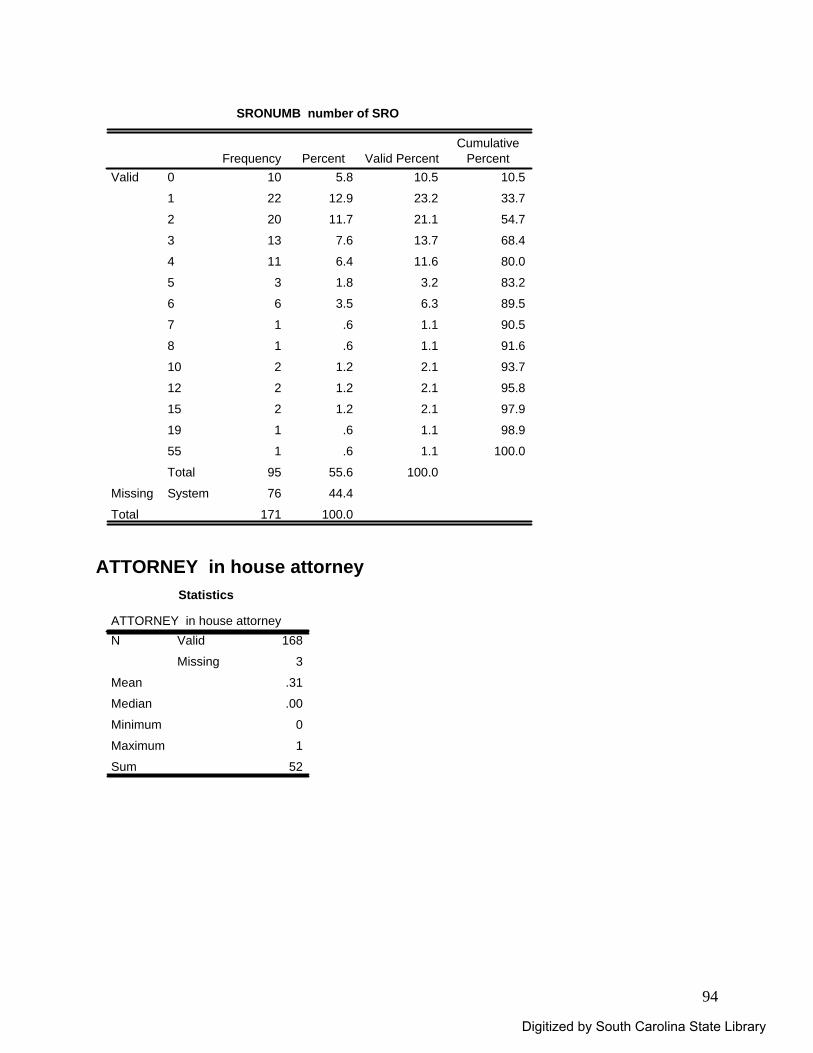
94
SRONUMB number of SRO
10 5.8 10.5 10.5
22 12.9 23.2 33.7
20 11.7 21.1 54.7
13 7.6 13.7 68.4
11 6.4 11.6 80.0
3 1.8 3.2 83.2
6 3.5 6.3 89.5
1 .6 1.1 90.5
1 .6 1.1 91.6
2 1.2 2.1 93.7
2 1.2 2.1 95.8
2 1.2 2.1 97.9
1 .6 1.1 98.9
1 .6 1.1 100.0
95 55.6 100.0
76 44.4
171 100.0
0
1
2
3
4
5
6
7
8
10
12
15
19
55
Total
Valid
SystemMissing
Total
Frequency Percent Valid PercentCumulative
Percent
ATTORNEY in house attorney
Statistics
ATTORNEY in house attorney168
3
.31
.00
0
1
52
Valid
Missing
N
Mean
Median
Minimum
Maximum
Sum
Digitized by South Carolina State Library
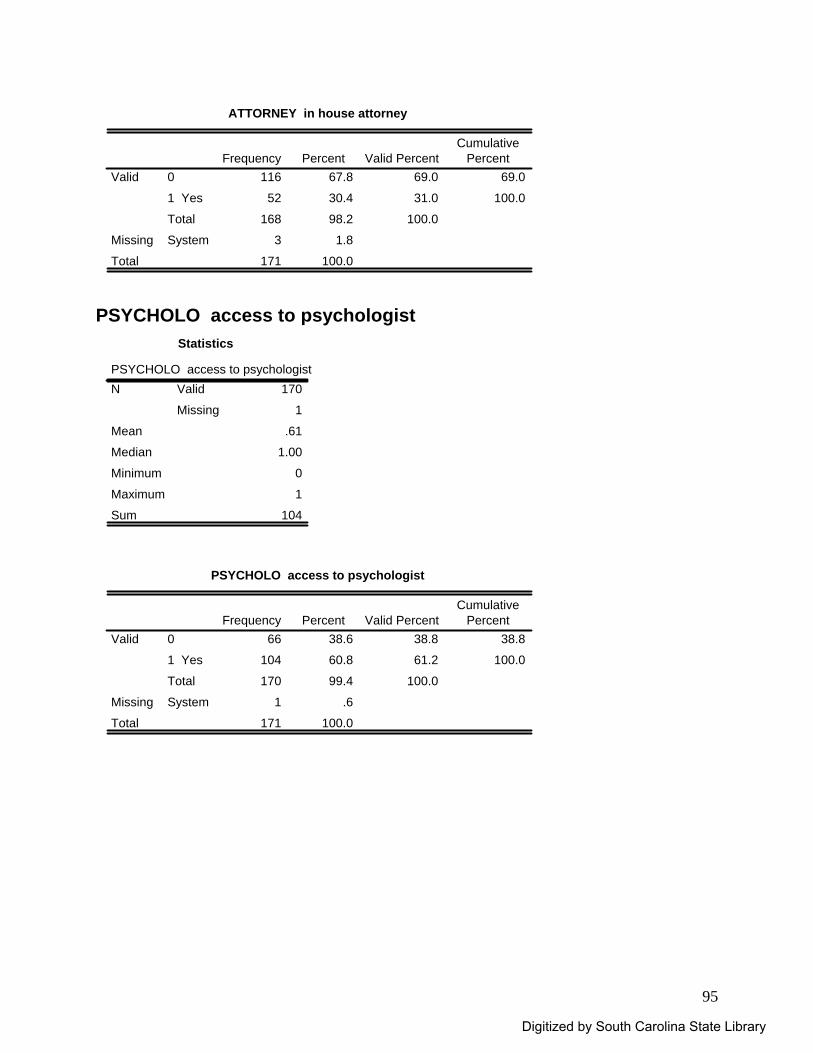
95
ATTORNEY in house attorney
116 67.8 69.0 69.0
52 30.4 31.0 100.0
168 98.2 100.0
3 1.8
171 100.0
0
1 Yes
Total
Valid
SystemMissing
Total
Frequency Percent Valid PercentCumulative
Percent
PSYCHOLO access to psychologist
Statistics
PSYCHOLO access to psychologist170
1
.61
1.00
0
1
104
Valid
Missing
N
Mean
Median
Minimum
Maximum
Sum
PSYCHOLO access to psychologist
66 38.6 38.8 38.8
104 60.8 61.2 100.0
170 99.4 100.0
1 .6
171 100.0
0
1 Yes
Total
Valid
SystemMissing
Total
Frequency Percent Valid PercentCumulative
Percent
Digitized by South Carolina State Library
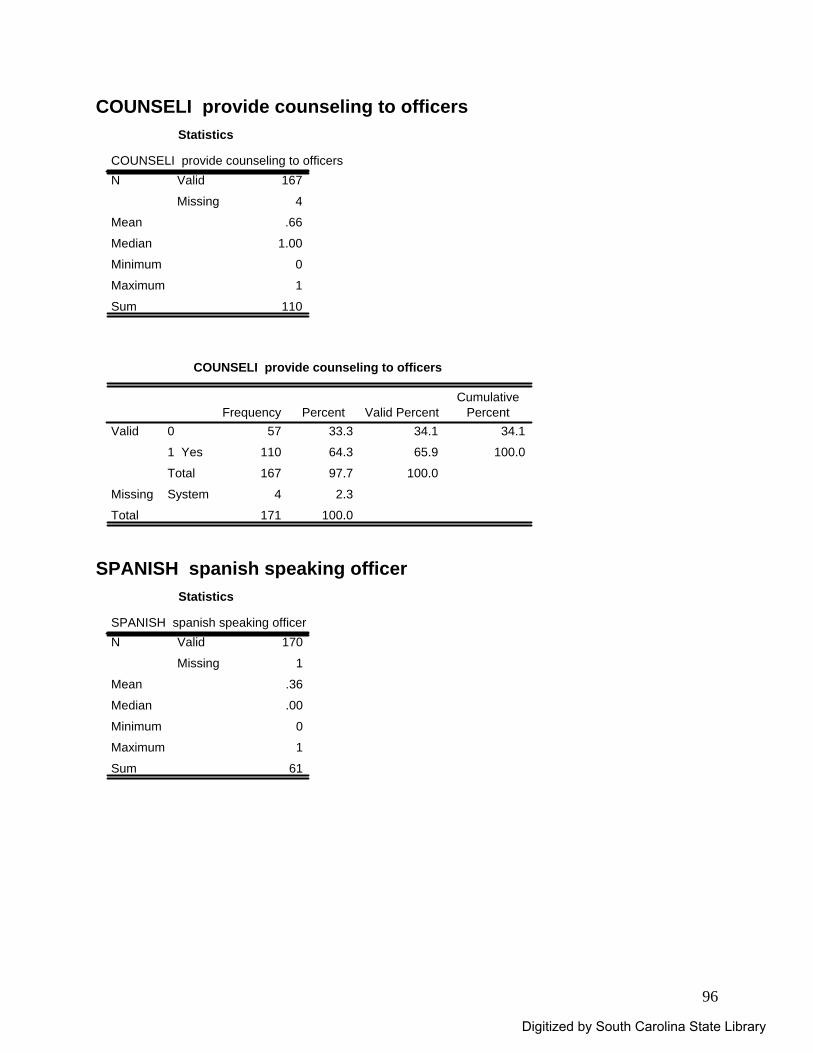
96
COUNSELI provide counseling to officers Statistics
COUNSELI provide counseling to officers167
4
.66
1.00
0
1
110
Valid
Missing
N
Mean
Median
Minimum
Maximum
Sum
COUNSELI provide counseling to officers
57 33.3 34.1 34.1
110 64.3 65.9 100.0
167 97.7 100.0
4 2.3
171 100.0
0
1 Yes
Total
Valid
SystemMissing
Total
Frequency Percent Valid PercentCumulative
Percent
SPANISH spanish speaking officer
Statistics
SPANISH spanish speaking officer170
1
.36
.00
0
1
61
Valid
Missing
N
Mean
Median
Minimum
Maximum
Sum
Digitized by South Carolina State Library

97
SPANISH spanish speaking officer
109 63.7 64.1 64.1
61 35.7 35.9 100.0
170 99.4 100.0
1 .6
171 100.0
0
1 Yes
Total
Valid
SystemMissing
Total
Frequency Percent Valid PercentCumulative
Percent
CADET officer cadet program
Statistics
CADET officer cadet program170
1
.16
.00
0
1
28
Valid
Missing
N
Mean
Median
Minimum
Maximum
Sum
CADET officer cadet program
142 83.0 83.5 83.5
28 16.4 16.5 100.0
170 99.4 100.0
1 .6
171 100.0
0
1 Yes
Total
Valid
SystemMissing
Total
Frequency Percent Valid PercentCumulative
Percent
Digitized by South Carolina State Library
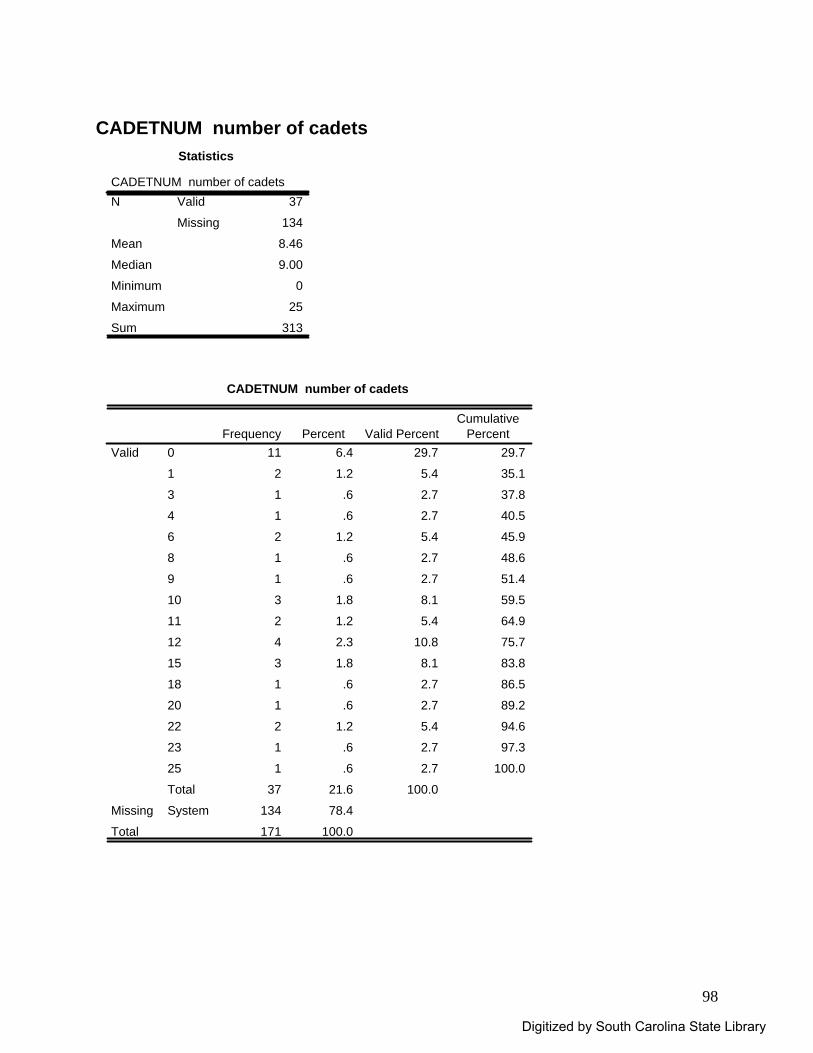
98
CADETNUM number of cadets
Statistics
CADETNUM number of cadets37
134
8.46
9.00
0
25
313
Valid
Missing
N
Mean
Median
Minimum
Maximum
Sum
CADETNUM number of cadets
11 6.4 29.7 29.7
2 1.2 5.4 35.1
1 .6 2.7 37.8
1 .6 2.7 40.5
2 1.2 5.4 45.9
1 .6 2.7 48.6
1 .6 2.7 51.4
3 1.8 8.1 59.5
2 1.2 5.4 64.9
4 2.3 10.8 75.7
3 1.8 8.1 83.8
1 .6 2.7 86.5
1 .6 2.7 89.2
2 1.2 5.4 94.6
1 .6 2.7 97.3
1 .6 2.7 100.0
37 21.6 100.0
134 78.4
171 100.0
0
1
3
4
6
8
9
10
11
12
15
18
20
22
23
25
Total
Valid
SystemMissing
Total
Frequency Percent Valid PercentCumulative
Percent
Digitized by South Carolina State Library
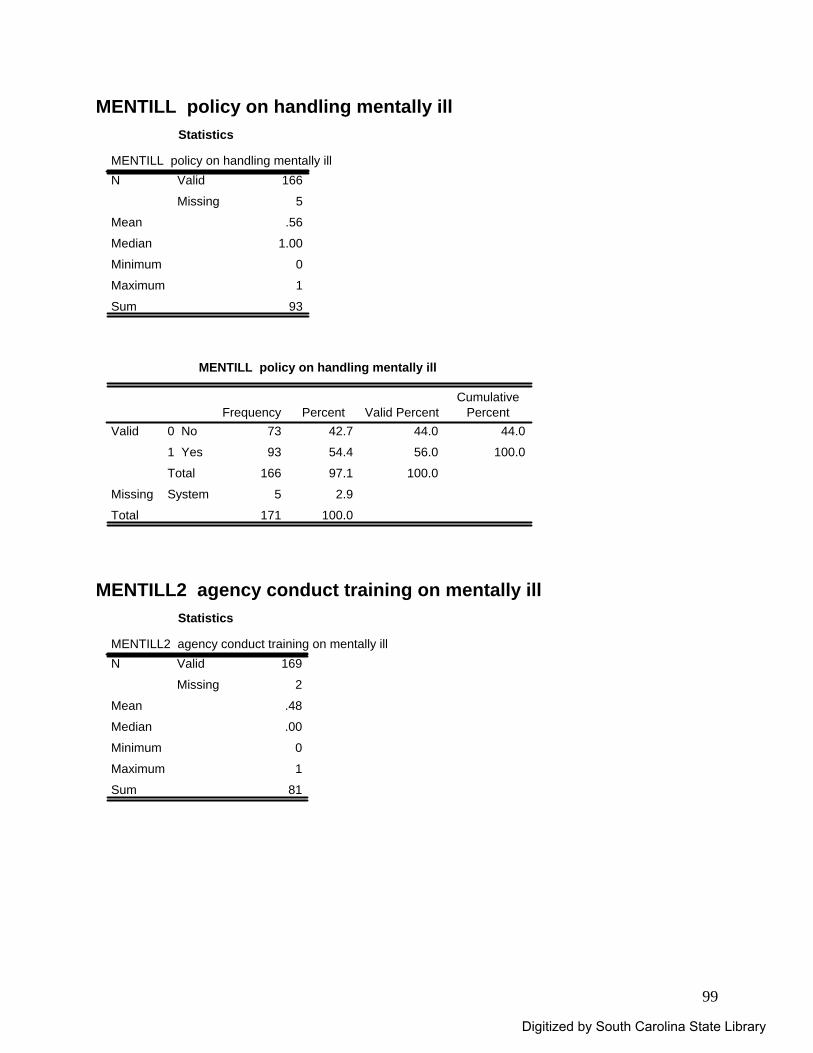
99
MENTILL policy on handling mentally ill Statistics
MENTILL policy on handling mentally ill166
5
.56
1.00
0
1
93
Valid
Missing
N
Mean
Median
Minimum
Maximum
Sum
MENTILL policy on handling mentally ill
73 42.7 44.0 44.0
93 54.4 56.0 100.0
166 97.1 100.0
5 2.9
171 100.0
0 No
1 Yes
Total
Valid
SystemMissing
Total
Frequency Percent Valid PercentCumulative
Percent
MENTILL2 agency conduct training on mentally ill
Statistics
MENTILL2 agency conduct training on mentally ill169
2
.48
.00
0
1
81
Valid
Missing
N
Mean
Median
Minimum
Maximum
Sum
Digitized by South Carolina State Library
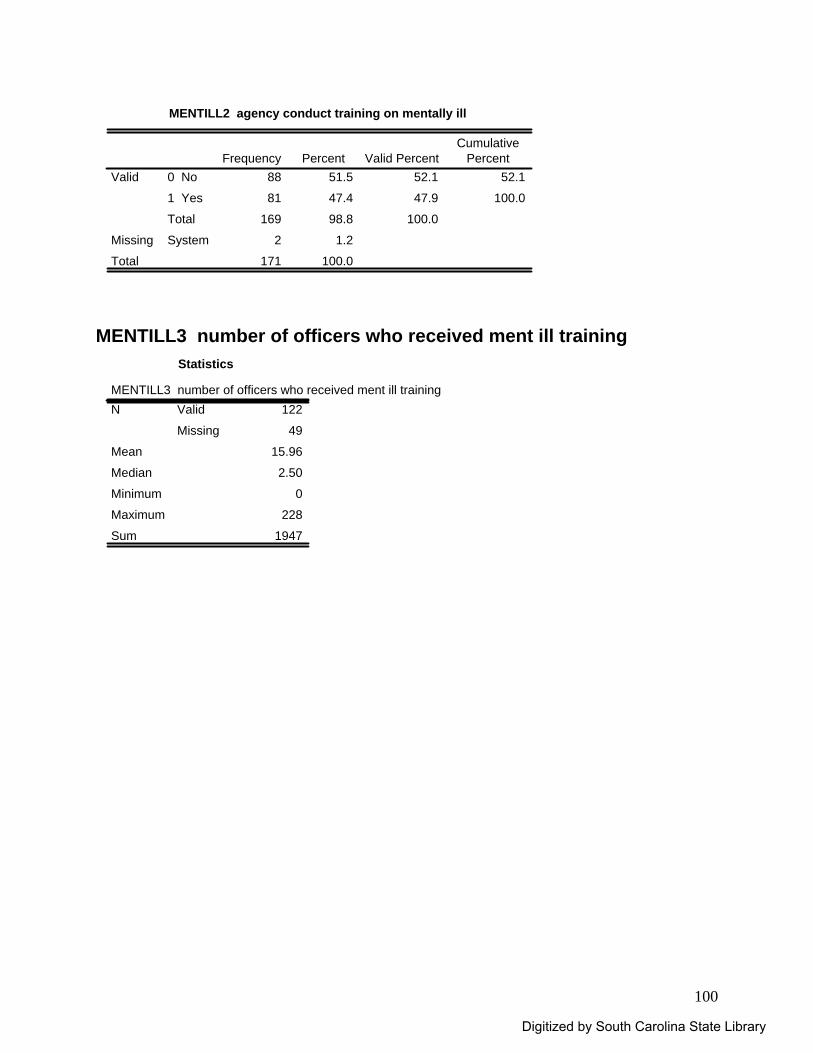
100
MENTILL2 agency conduct training on mentally ill
88 51.5 52.1 52.1
81 47.4 47.9 100.0
169 98.8 100.0
2 1.2
171 100.0
0 No
1 Yes
Total
Valid
SystemMissing
Total
Frequency Percent Valid PercentCumulative
Percent
MENTILL3 number of officers who received ment ill training
Statistics
MENTILL3 number of officers who received ment ill training122
49
15.96
2.50
0
228
1947
Valid
Missing
N
Mean
Median
Minimum
Maximum
Sum
Digitized by South Carolina State Library
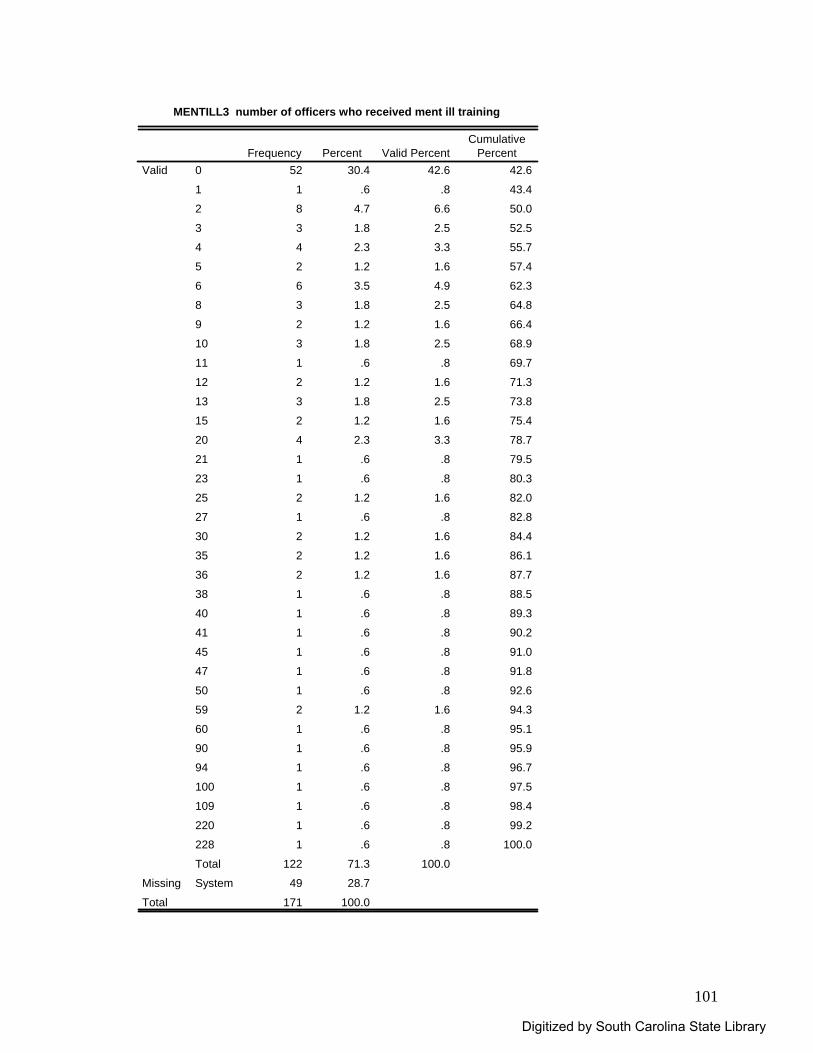
101
MENTILL3 number of officers who received ment ill training
52 30.4 42.6 42.6
1 .6 .8 43.4
8 4.7 6.6 50.0
3 1.8 2.5 52.5
4 2.3 3.3 55.7
2 1.2 1.6 57.4
6 3.5 4.9 62.3
3 1.8 2.5 64.8
2 1.2 1.6 66.4
3 1.8 2.5 68.9
1 .6 .8 69.7
2 1.2 1.6 71.3
3 1.8 2.5 73.8
2 1.2 1.6 75.4
4 2.3 3.3 78.7
1 .6 .8 79.5
1 .6 .8 80.3
2 1.2 1.6 82.0
1 .6 .8 82.8
2 1.2 1.6 84.4
2 1.2 1.6 86.1
2 1.2 1.6 87.7
1 .6 .8 88.5
1 .6 .8 89.3
1 .6 .8 90.2
1 .6 .8 91.0
1 .6 .8 91.8
1 .6 .8 92.6
2 1.2 1.6 94.3
1 .6 .8 95.1
1 .6 .8 95.9
1 .6 .8 96.7
1 .6 .8 97.5
1 .6 .8 98.4
1 .6 .8 99.2
1 .6 .8 100.0
122 71.3 100.0
49 28.7
171 100.0
0
1
2
3
4
5
6
8
9
10
11
12
13
15
20
21
23
25
27
30
35
36
38
40
41
45
47
50
59
60
90
94
100
109
220
228
Total
Valid
SystemMissing
Total
Frequency Percent Valid PercentCumulative
Percent
Digitized by South Carolina State Library
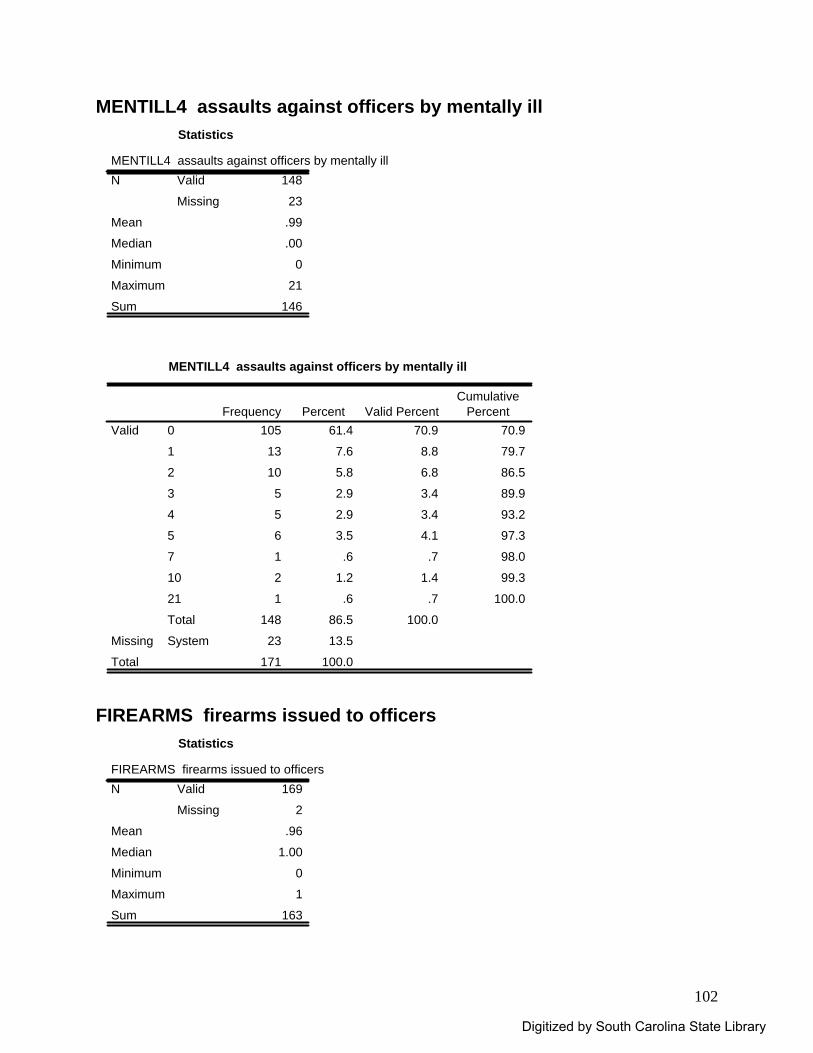
102
MENTILL4 assaults against officers by mentally ill Statistics
MENTILL4 assaults against officers by mentally ill148
23
.99
.00
0
21
146
Valid
Missing
N
Mean
Median
Minimum
Maximum
Sum
MENTILL4 assaults against officers by mentally ill
105 61.4 70.9 70.9
13 7.6 8.8 79.7
10 5.8 6.8 86.5
5 2.9 3.4 89.9
5 2.9 3.4 93.2
6 3.5 4.1 97.3
1 .6 .7 98.0
2 1.2 1.4 99.3
1 .6 .7 100.0
148 86.5 100.0
23 13.5
171 100.0
0
1
2
3
4
5
7
10
21
Total
Valid
SystemMissing
Total
Frequency Percent Valid PercentCumulative
Percent
FIREARMS firearms issued to officers
Statistics
FIREARMS firearms issued to officers169
2
.96
1.00
0
1
163
Valid
Missing
N
Mean
Median
Minimum
Maximum
Sum
Digitized by South Carolina State Library
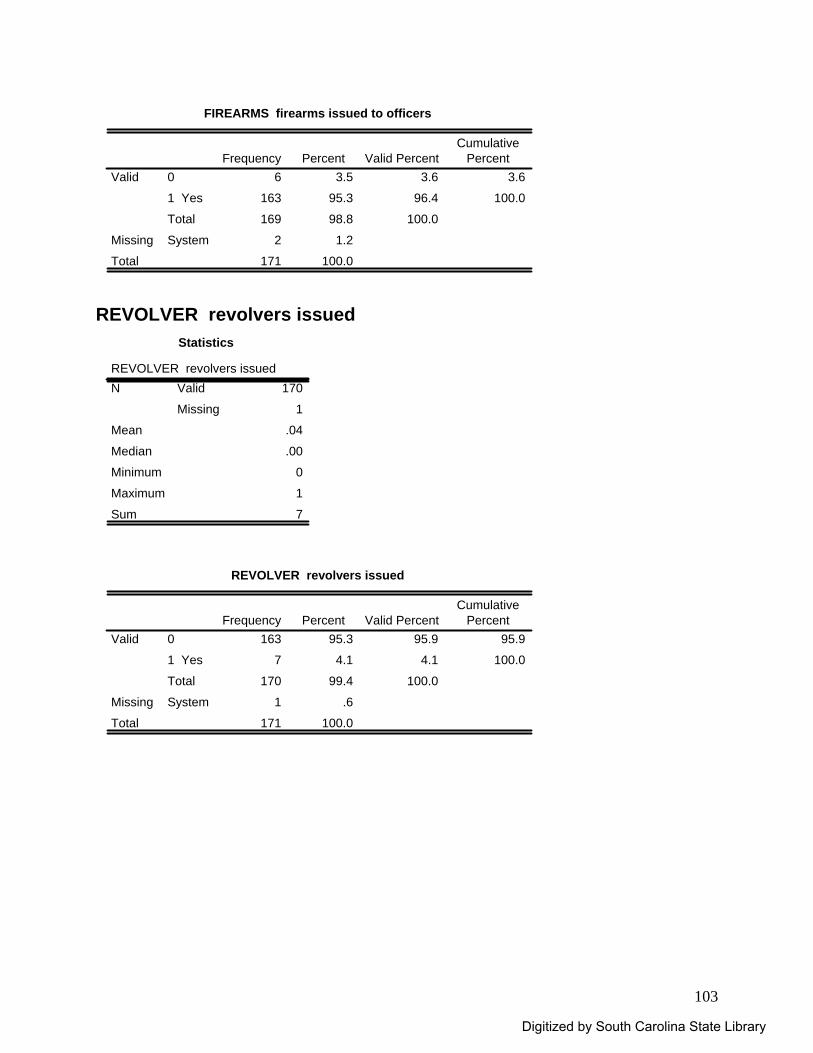
103
FIREARMS firearms issued to officers
6 3.5 3.6 3.6
163 95.3 96.4 100.0
169 98.8 100.0
2 1.2
171 100.0
0
1 Yes
Total
Valid
SystemMissing
Total
Frequency Percent Valid PercentCumulative
Percent
REVOLVER revolvers issued
Statistics
REVOLVER revolvers issued170
1
.04
.00
0
1
7
Valid
Missing
N
Mean
Median
Minimum
Maximum
Sum
REVOLVER revolvers issued
163 95.3 95.9 95.9
7 4.1 4.1 100.0
170 99.4 100.0
1 .6
171 100.0
0
1 Yes
Total
Valid
SystemMissing
Total
Frequency Percent Valid PercentCumulative
Percent
Digitized by South Carolina State Library
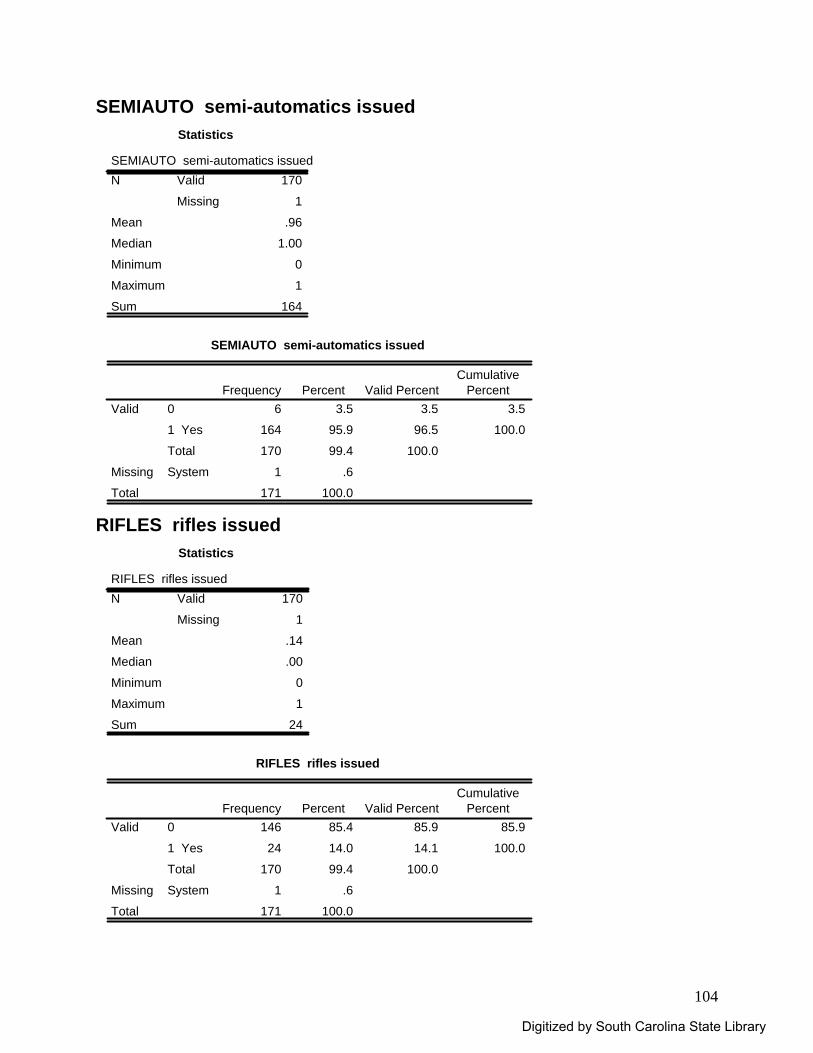
104
SEMIAUTO semi-automatics issued Statistics
SEMIAUTO semi-automatics issued170
1
.96
1.00
0
1
164
Valid
Missing
N
Mean
Median
Minimum
Maximum
Sum
SEMIAUTO semi-automatics issued
6 3.5 3.5 3.5
164 95.9 96.5 100.0
170 99.4 100.0
1 .6
171 100.0
0
1 Yes
Total
Valid
SystemMissing
Total
Frequency Percent Valid PercentCumulative
Percent
RIFLES rifles issued
Statistics
RIFLES rifles issued170
1
.14
.00
0
1
24
Valid
Missing
N
Mean
Median
Minimum
Maximum
Sum
RIFLES rifles issued
146 85.4 85.9 85.9
24 14.0 14.1 100.0
170 99.4 100.0
1 .6
171 100.0
0
1 Yes
Total
Valid
SystemMissing
Total
Frequency Percent Valid PercentCumulative
Percent
Digitized by South Carolina State Library
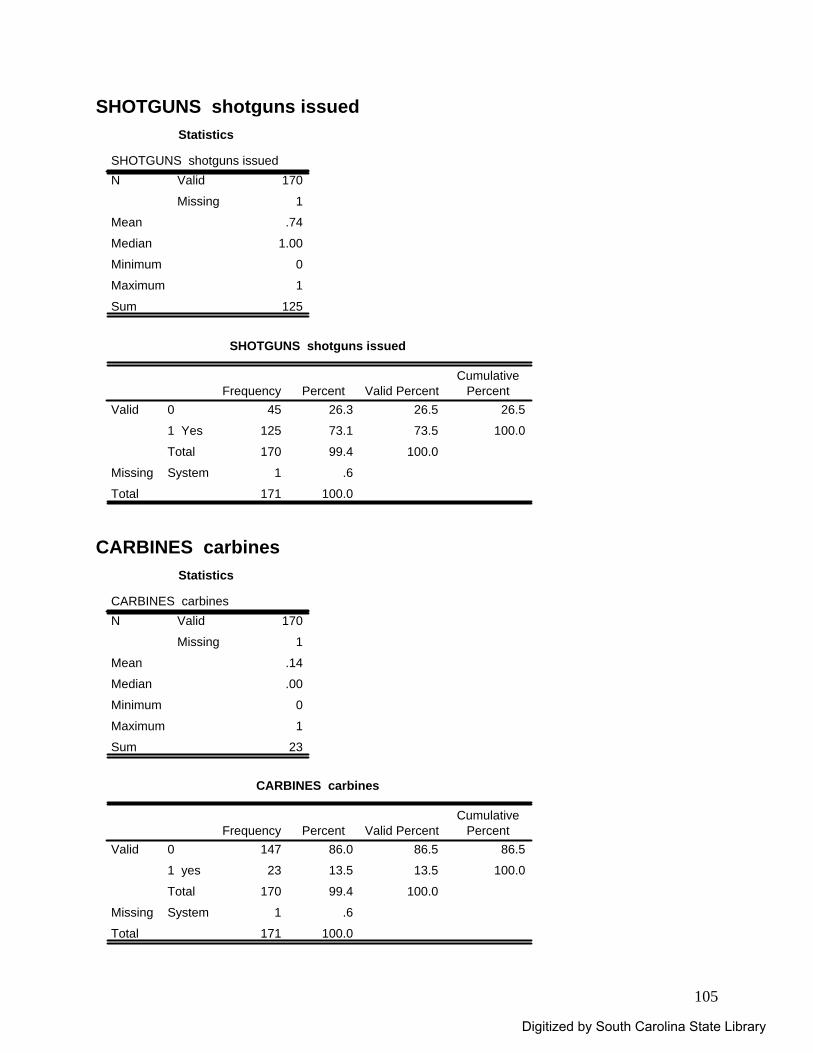
105
SHOTGUNS shotguns issued Statistics
SHOTGUNS shotguns issued170
1
.74
1.00
0
1
125
Valid
Missing
N
Mean
Median
Minimum
Maximum
Sum
SHOTGUNS shotguns issued
45 26.3 26.5 26.5
125 73.1 73.5 100.0
170 99.4 100.0
1 .6
171 100.0
0
1 Yes
Total
Valid
SystemMissing
Total
Frequency Percent Valid PercentCumulative
Percent
CARBINES carbines
Statistics
CARBINES carbines170
1
.14
.00
0
1
23
Valid
Missing
N
Mean
Median
Minimum
Maximum
Sum
CARBINES carbines
147 86.0 86.5 86.5
23 13.5 13.5 100.0
170 99.4 100.0
1 .6
171 100.0
0
1 yes
Total
Valid
SystemMissing
Total
Frequency Percent Valid PercentCumulative
Percent
Digitized by South Carolina State Library
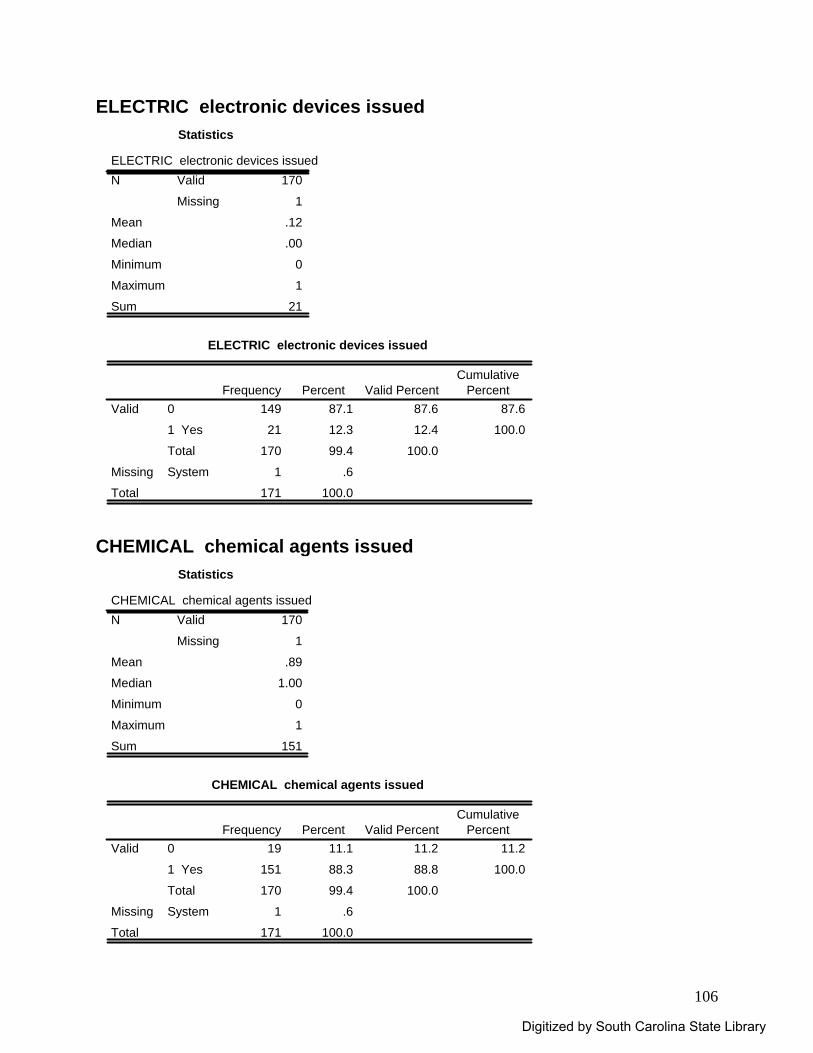
106
ELECTRIC electronic devices issued Statistics
ELECTRIC electronic devices issued170
1
.12
.00
0
1
21
Valid
Missing
N
Mean
Median
Minimum
Maximum
Sum
ELECTRIC electronic devices issued
149 87.1 87.6 87.6
21 12.3 12.4 100.0
170 99.4 100.0
1 .6
171 100.0
0
1 Yes
Total
Valid
SystemMissing
Total
Frequency Percent Valid PercentCumulative
Percent
CHEMICAL chemical agents issued
Statistics
CHEMICAL chemical agents issued170
1
.89
1.00
0
1
151
Valid
Missing
N
Mean
Median
Minimum
Maximum
Sum
CHEMICAL chemical agents issued
19 11.1 11.2 11.2
151 88.3 88.8 100.0
170 99.4 100.0
1 .6
171 100.0
0
1 Yes
Total
Valid
SystemMissing
Total
Frequency Percent Valid PercentCumulative
Percent
Digitized by South Carolina State Library
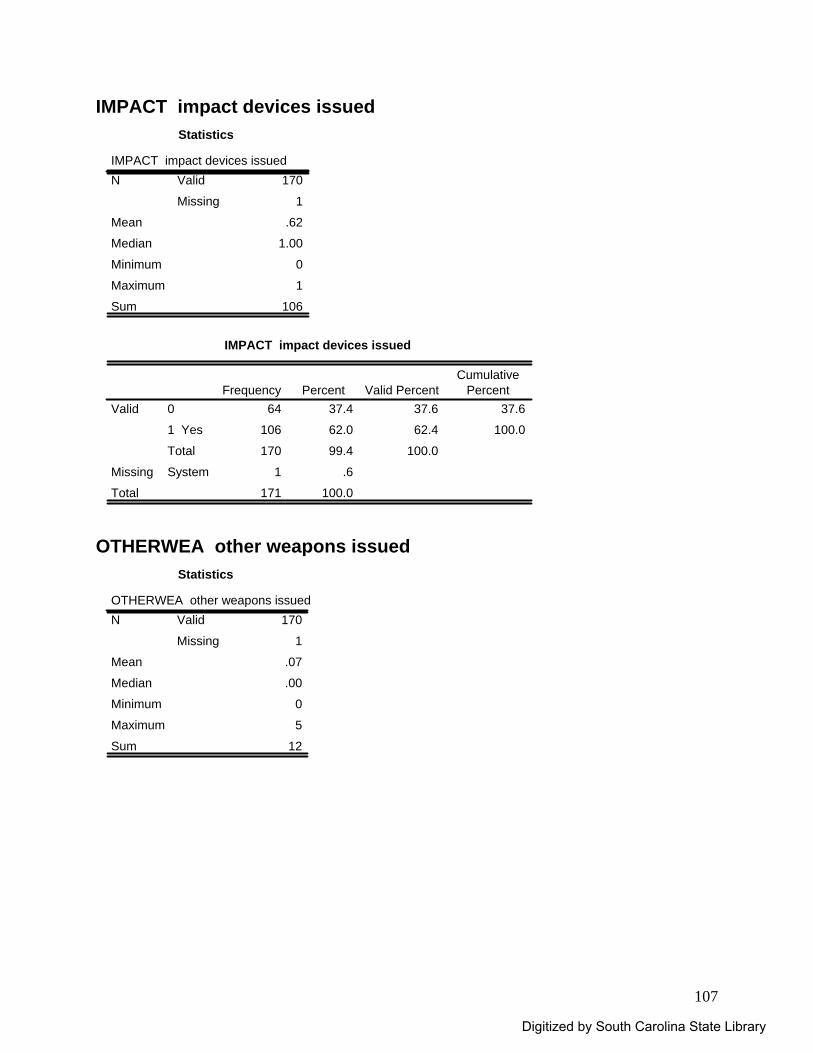
107
IMPACT impact devices issued Statistics
IMPACT impact devices issued170
1
.62
1.00
0
1
106
Valid
Missing
N
Mean
Median
Minimum
Maximum
Sum
IMPACT impact devices issued
64 37.4 37.6 37.6
106 62.0 62.4 100.0
170 99.4 100.0
1 .6
171 100.0
0
1 Yes
Total
Valid
SystemMissing
Total
Frequency Percent Valid PercentCumulative
Percent
OTHERWEA other weapons issued
Statistics
OTHERWEA other weapons issued170
1
.07
.00
0
5
12
Valid
Missing
N
Mean
Median
Minimum
Maximum
Sum
Digitized by South Carolina State Library
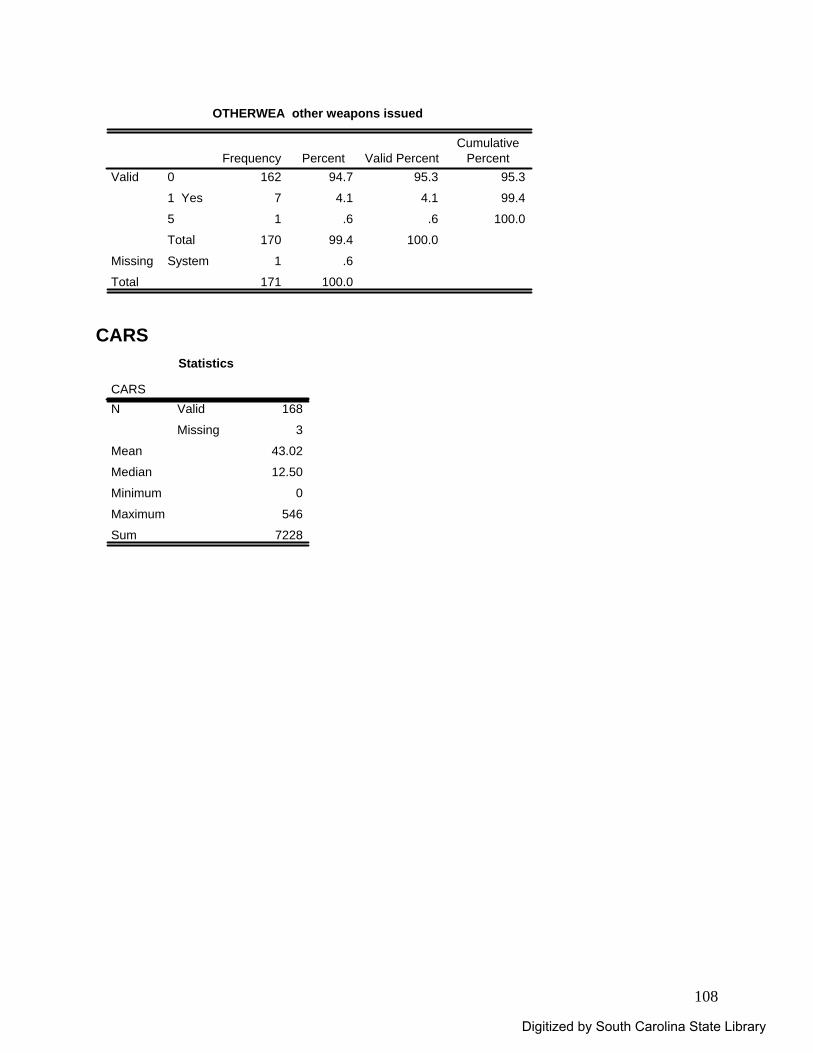
108
OTHERWEA other weapons issued
162 94.7 95.3 95.3
7 4.1 4.1 99.4
1 .6 .6 100.0
170 99.4 100.0
1 .6
171 100.0
0
1 Yes
5
Total
Valid
SystemMissing
Total
Frequency Percent Valid PercentCumulative
Percent
CARS
Statistics
CARS168
3
43.02
12.50
0
546
7228
Valid
Missing
N
Mean
Median
Minimum
Maximum
Sum
Digitized by South Carolina State Library
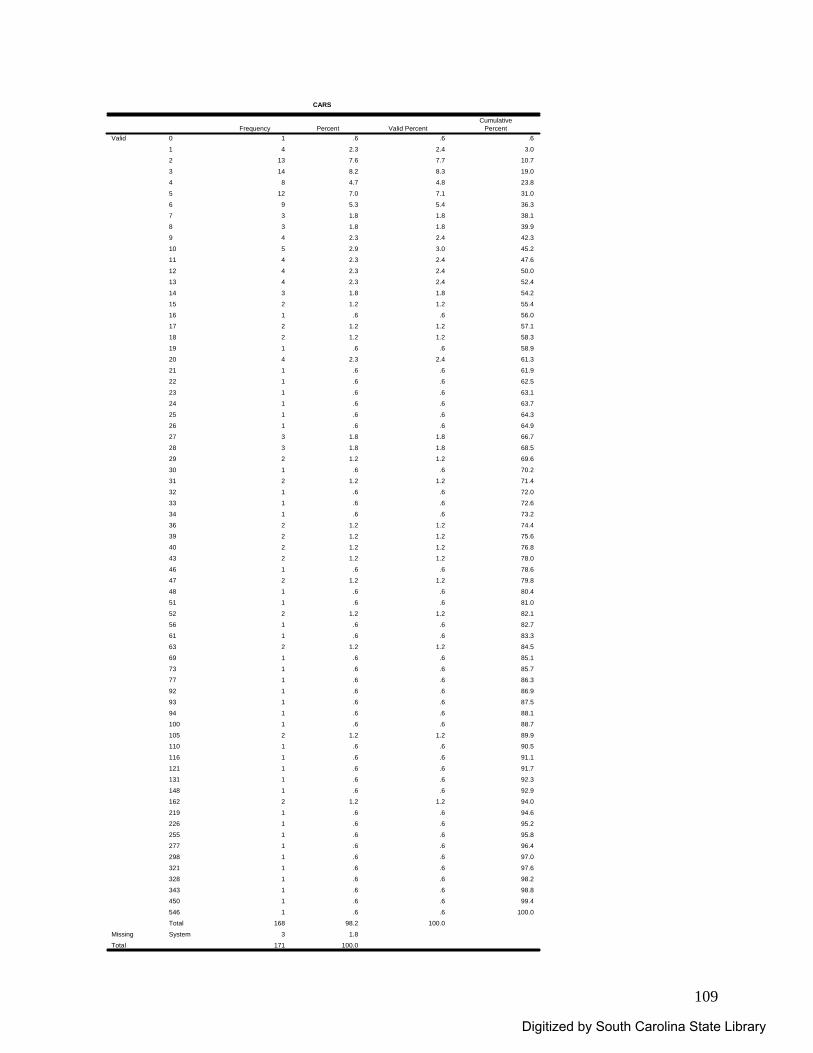
109
CARS
1 .6 .6 .6
4 2.3 2.4 3.0
13 7.6 7.7 10.7
14 8.2 8.3 19.0
8 4.7 4.8 23.8
12 7.0 7.1 31.0
9 5.3 5.4 36.3
3 1.8 1.8 38.1
3 1.8 1.8 39.9
4 2.3 2.4 42.3
5 2.9 3.0 45.2
4 2.3 2.4 47.6
4 2.3 2.4 50.0
4 2.3 2.4 52.4
3 1.8 1.8 54.2
2 1.2 1.2 55.4
1 .6 .6 56.0
2 1.2 1.2 57.1
2 1.2 1.2 58.3
1 .6 .6 58.9
4 2.3 2.4 61.3
1 .6 .6 61.9
1 .6 .6 62.5
1 .6 .6 63.1
1 .6 .6 63.7
1 .6 .6 64.3
1 .6 .6 64.9
3 1.8 1.8 66.7
3 1.8 1.8 68.5
2 1.2 1.2 69.6
1 .6 .6 70.2
2 1.2 1.2 71.4
1 .6 .6 72.0
1 .6 .6 72.6
1 .6 .6 73.2
2 1.2 1.2 74.4
2 1.2 1.2 75.6
2 1.2 1.2 76.8
2 1.2 1.2 78.0
1 .6 .6 78.6
2 1.2 1.2 79.8
1 .6 .6 80.4
1 .6 .6 81.0
2 1.2 1.2 82.1
1 .6 .6 82.7
1 .6 .6 83.3
2 1.2 1.2 84.5
1 .6 .6 85.1
1 .6 .6 85.7
1 .6 .6 86.3
1 .6 .6 86.9
1 .6 .6 87.5
1 .6 .6 88.1
1 .6 .6 88.7
2 1.2 1.2 89.9
1 .6 .6 90.5
1 .6 .6 91.1
1 .6 .6 91.7
1 .6 .6 92.3
1 .6 .6 92.9
2 1.2 1.2 94.0
1 .6 .6 94.6
1 .6 .6 95.2
1 .6 .6 95.8
1 .6 .6 96.4
1 .6 .6 97.0
1 .6 .6 97.6
1 .6 .6 98.2
1 .6 .6 98.8
1 .6 .6 99.4
1 .6 .6 100.0
168 98.2 100.0
3 1.8
171 100.0
0
1
2
3
4
5
6
7
8
9
10
11
12
13
14
15
16
17
18
19
20
21
22
23
24
25
26
27
28
29
30
31
32
33
34
36
39
40
43
46
47
48
51
52
56
61
63
69
73
77
92
93
94
100
105
110
116
121
131
148
162
219
226
255
277
298
321
328
343
450
546
Total
Valid
SystemMissing
Total
Frequency Percent Valid PercentCumulative
Percent
Digitized by South Carolina State Library
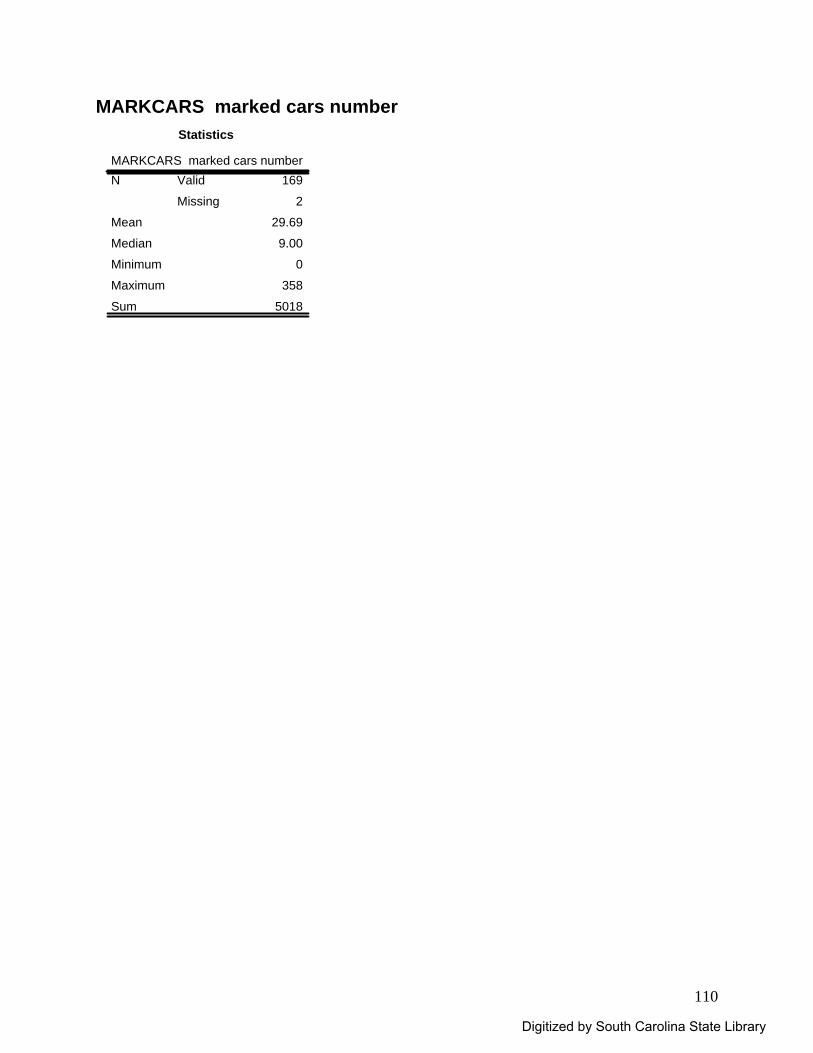
110
MARKCARS marked cars number Statistics
MARKCARS marked cars number169
2
29.69
9.00
0
358
5018
Valid
Missing
N
Mean
Median
Minimum
Maximum
Sum
Digitized by South Carolina State Library
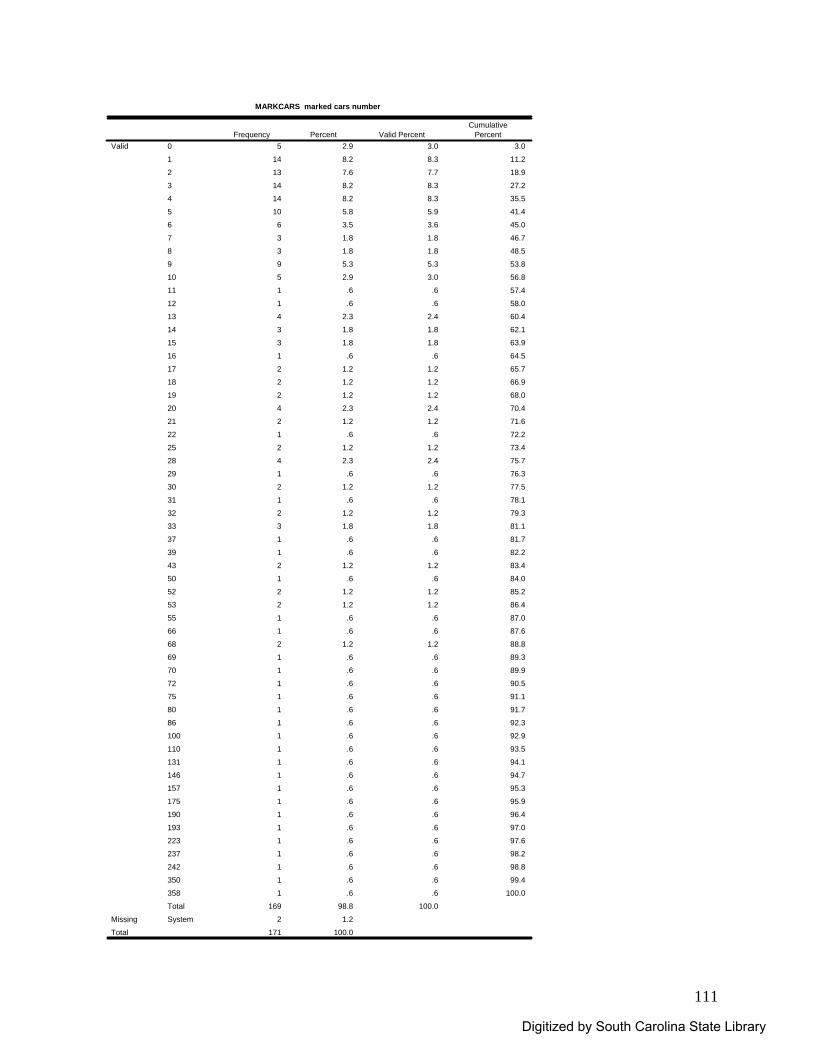
111
MARKCARS marked cars number
5 2.9 3.0 3.0
14 8.2 8.3 11.2
13 7.6 7.7 18.9
14 8.2 8.3 27.2
14 8.2 8.3 35.5
10 5.8 5.9 41.4
6 3.5 3.6 45.0
3 1.8 1.8 46.7
3 1.8 1.8 48.5
9 5.3 5.3 53.8
5 2.9 3.0 56.8
1 .6 .6 57.4
1 .6 .6 58.0
4 2.3 2.4 60.4
3 1.8 1.8 62.1
3 1.8 1.8 63.9
1 .6 .6 64.5
2 1.2 1.2 65.7
2 1.2 1.2 66.9
2 1.2 1.2 68.0
4 2.3 2.4 70.4
2 1.2 1.2 71.6
1 .6 .6 72.2
2 1.2 1.2 73.4
4 2.3 2.4 75.7
1 .6 .6 76.3
2 1.2 1.2 77.5
1 .6 .6 78.1
2 1.2 1.2 79.3
3 1.8 1.8 81.1
1 .6 .6 81.7
1 .6 .6 82.2
2 1.2 1.2 83.4
1 .6 .6 84.0
2 1.2 1.2 85.2
2 1.2 1.2 86.4
1 .6 .6 87.0
1 .6 .6 87.6
2 1.2 1.2 88.8
1 .6 .6 89.3
1 .6 .6 89.9
1 .6 .6 90.5
1 .6 .6 91.1
1 .6 .6 91.7
1 .6 .6 92.3
1 .6 .6 92.9
1 .6 .6 93.5
1 .6 .6 94.1
1 .6 .6 94.7
1 .6 .6 95.3
1 .6 .6 95.9
1 .6 .6 96.4
1 .6 .6 97.0
1 .6 .6 97.6
1 .6 .6 98.2
1 .6 .6 98.8
1 .6 .6 99.4
1 .6 .6 100.0
169 98.8 100.0
2 1.2
171 100.0
0
1
2
3
4
5
6
7
8
9
10
11
12
13
14
15
16
17
18
19
20
21
22
25
28
29
30
31
32
33
37
39
43
50
52
53
55
66
68
69
70
72
75
80
86
100
110
131
146
157
175
190
193
223
237
242
350
358
Total
Valid
SystemMissing
Total
Frequency Percent Valid PercentCumulative
Percent
Digitized by South Carolina State Library
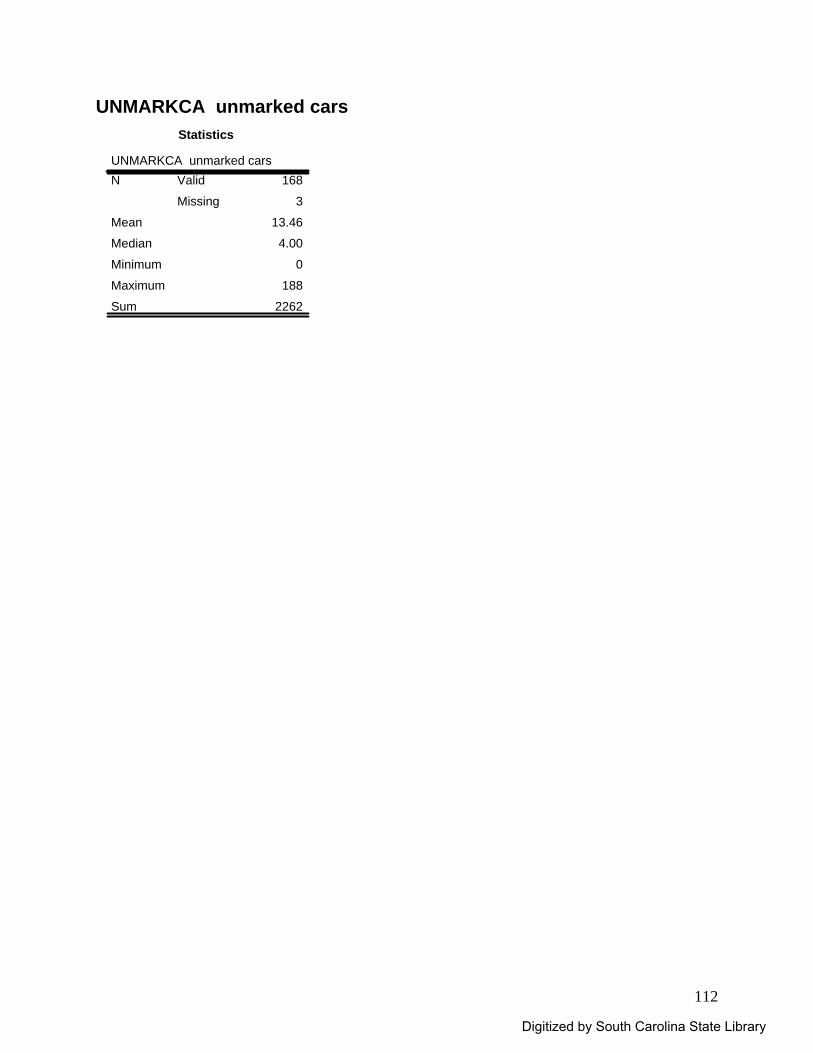
112
UNMARKCA unmarked cars Statistics
UNMARKCA unmarked cars168
3
13.46
4.00
0
188
2262
Valid
Missing
N
Mean
Median
Minimum
Maximum
Sum
Digitized by South Carolina State Library
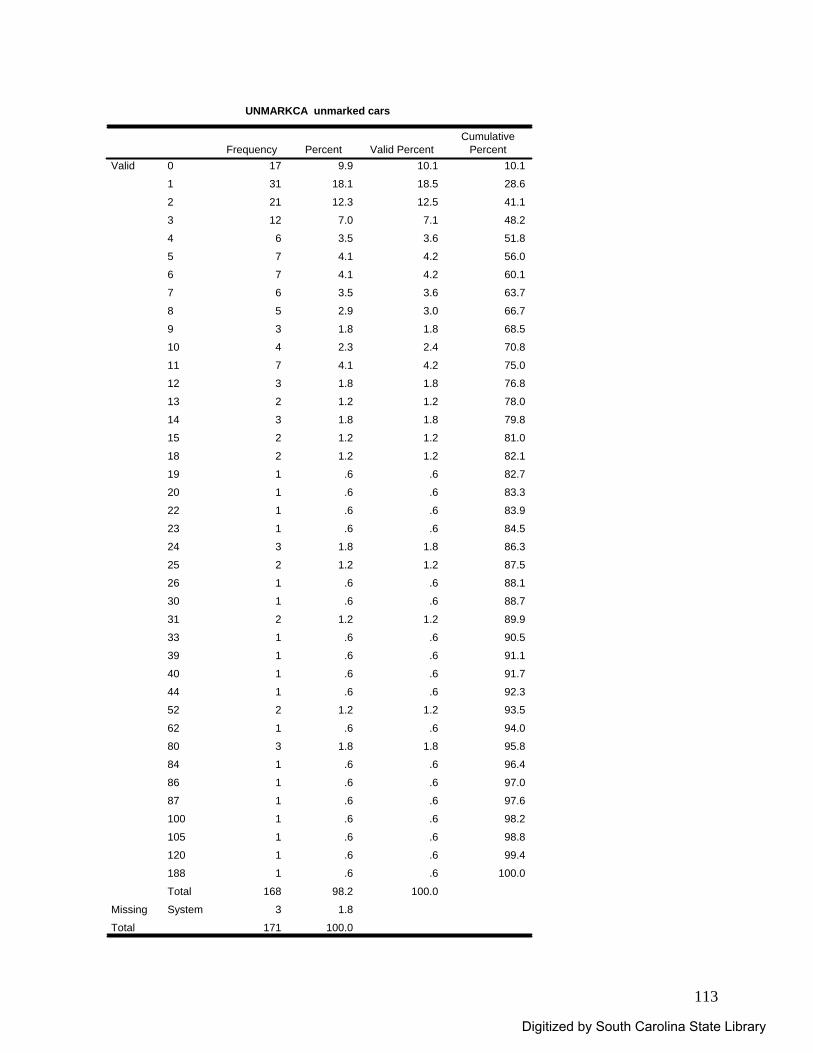
113
UNMARKCA unmarked cars
17 9.9 10.1 10.1
31 18.1 18.5 28.6
21 12.3 12.5 41.1
12 7.0 7.1 48.2
6 3.5 3.6 51.8
7 4.1 4.2 56.0
7 4.1 4.2 60.1
6 3.5 3.6 63.7
5 2.9 3.0 66.7
3 1.8 1.8 68.5
4 2.3 2.4 70.8
7 4.1 4.2 75.0
3 1.8 1.8 76.8
2 1.2 1.2 78.0
3 1.8 1.8 79.8
2 1.2 1.2 81.0
2 1.2 1.2 82.1
1 .6 .6 82.7
1 .6 .6 83.3
1 .6 .6 83.9
1 .6 .6 84.5
3 1.8 1.8 86.3
2 1.2 1.2 87.5
1 .6 .6 88.1
1 .6 .6 88.7
2 1.2 1.2 89.9
1 .6 .6 90.5
1 .6 .6 91.1
1 .6 .6 91.7
1 .6 .6 92.3
2 1.2 1.2 93.5
1 .6 .6 94.0
3 1.8 1.8 95.8
1 .6 .6 96.4
1 .6 .6 97.0
1 .6 .6 97.6
1 .6 .6 98.2
1 .6 .6 98.8
1 .6 .6 99.4
1 .6 .6 100.0
168 98.2 100.0
3 1.8
171 100.0
0
1
2
3
4
5
6
7
8
9
10
11
12
13
14
15
18
19
20
22
23
24
25
26
30
31
33
39
40
44
52
62
80
84
86
87
100
105
120
188
Total
Valid
SystemMissing
Total
Frequency Percent Valid PercentCumulative
Percent
Digitized by South Carolina State Library
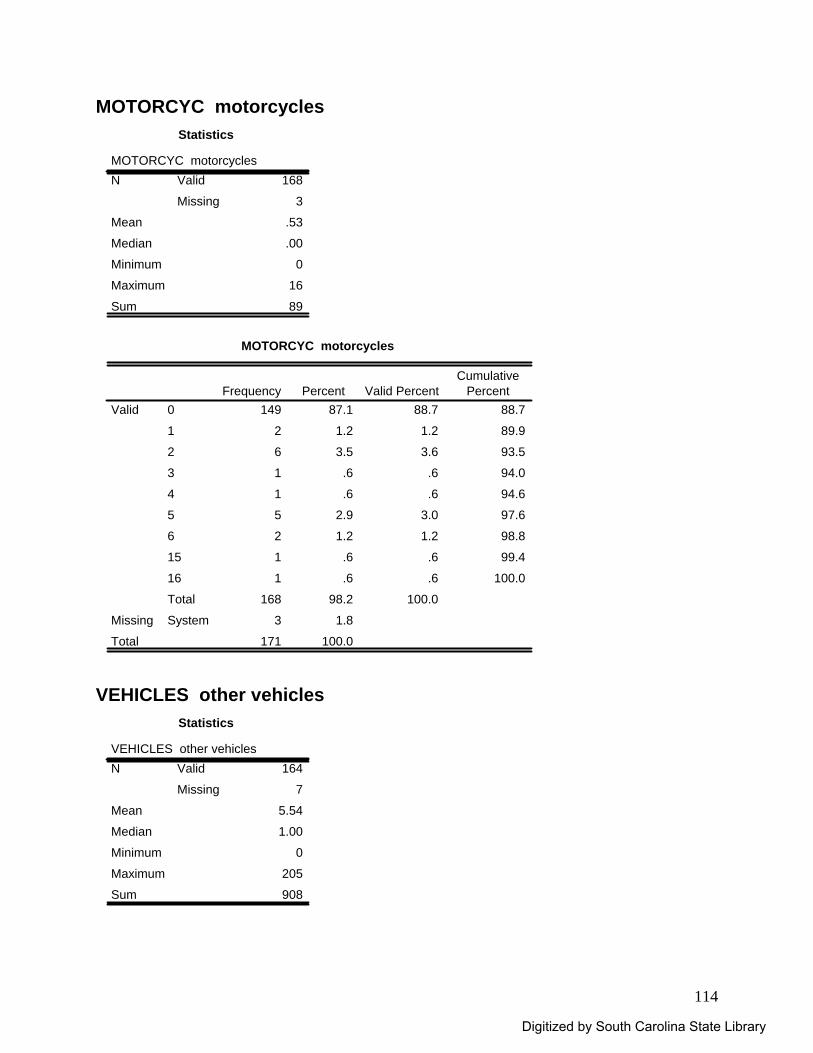
114
MOTORCYC motorcycles Statistics
MOTORCYC motorcycles168
3
.53
.00
0
16
89
Valid
Missing
N
Mean
Median
Minimum
Maximum
Sum
MOTORCYC motorcycles
149 87.1 88.7 88.7
2 1.2 1.2 89.9
6 3.5 3.6 93.5
1 .6 .6 94.0
1 .6 .6 94.6
5 2.9 3.0 97.6
2 1.2 1.2 98.8
1 .6 .6 99.4
1 .6 .6 100.0
168 98.2 100.0
3 1.8
171 100.0
0
1
2
3
4
5
6
15
16
Total
Valid
SystemMissing
Total
Frequency Percent Valid PercentCumulative
Percent
VEHICLES other vehicles
Statistics
VEHICLES other vehicles164
7
5.54
1.00
0
205
908
Valid
Missing
N
Mean
Median
Minimum
Maximum
Sum
Digitized by South Carolina State Library
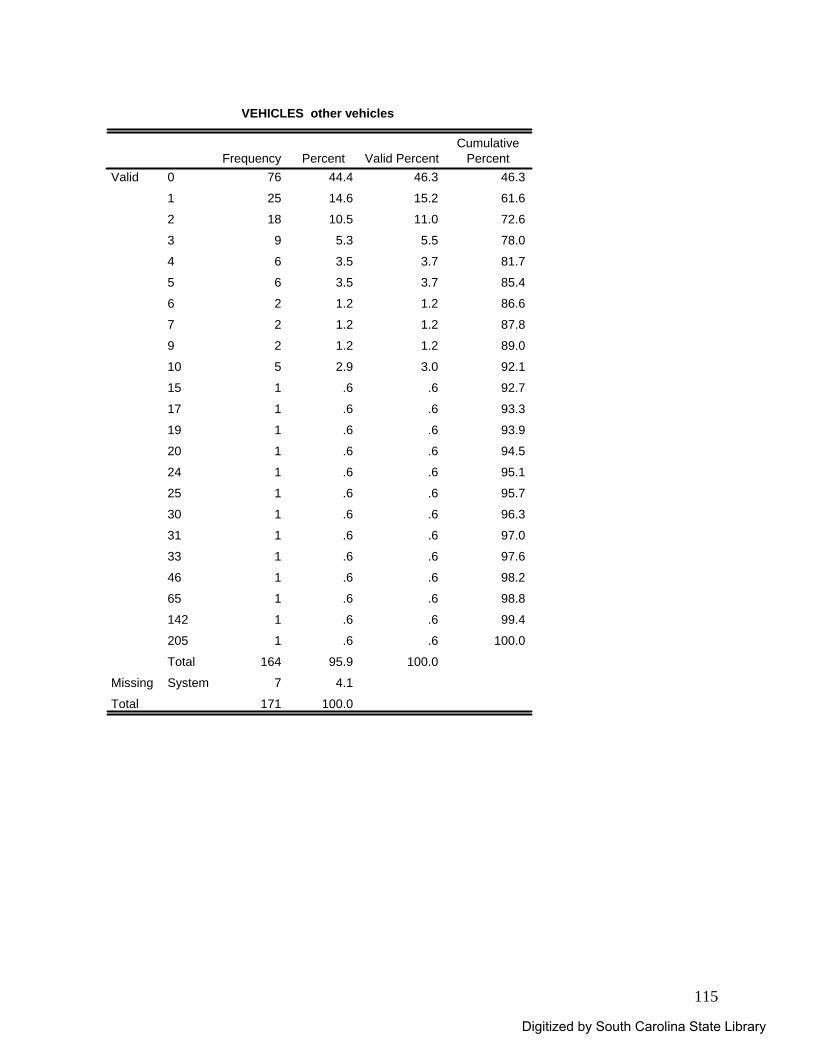
115
VEHICLES other vehicles
76 44.4 46.3 46.3
25 14.6 15.2 61.6
18 10.5 11.0 72.6
9 5.3 5.5 78.0
6 3.5 3.7 81.7
6 3.5 3.7 85.4
2 1.2 1.2 86.6
2 1.2 1.2 87.8
2 1.2 1.2 89.0
5 2.9 3.0 92.1
1 .6 .6 92.7
1 .6 .6 93.3
1 .6 .6 93.9
1 .6 .6 94.5
1 .6 .6 95.1
1 .6 .6 95.7
1 .6 .6 96.3
1 .6 .6 97.0
1 .6 .6 97.6
1 .6 .6 98.2
1 .6 .6 98.8
1 .6 .6 99.4
1 .6 .6 100.0
164 95.9 100.0
7 4.1
171 100.0
0
1
2
3
4
5
6
7
9
10
15
17
19
20
24
25
30
31
33
46
65
142
205
Total
Valid
SystemMissing
Total
Frequency Percent Valid PercentCumulative
Percent
Digitized by South Carolina State Library
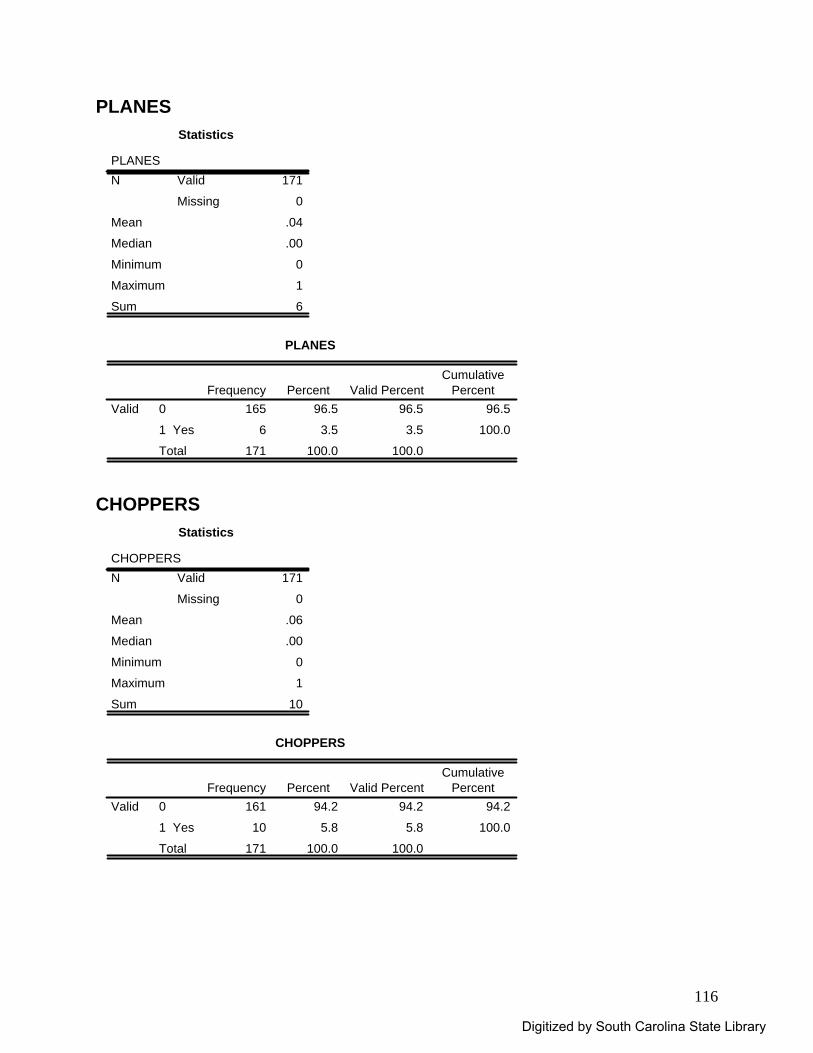
116
PLANES Statistics
PLANES171
0
.04
.00
0
1
6
Valid
Missing
N
Mean
Median
Minimum
Maximum
Sum
PLANES
165 96.5 96.5 96.5
6 3.5 3.5 100.0
171 100.0 100.0
0
1 Yes
Total
ValidFrequency Percent Valid Percent
CumulativePercent
CHOPPERS
Statistics
CHOPPERS171
0
.06
.00
0
1
10
Valid
Missing
N
Mean
Median
Minimum
Maximum
Sum
CHOPPERS
161 94.2 94.2 94.2
10 5.8 5.8 100.0
171 100.0 100.0
0
1 Yes
Total
ValidFrequency Percent Valid Percent
CumulativePercent
Digitized by South Carolina State Library
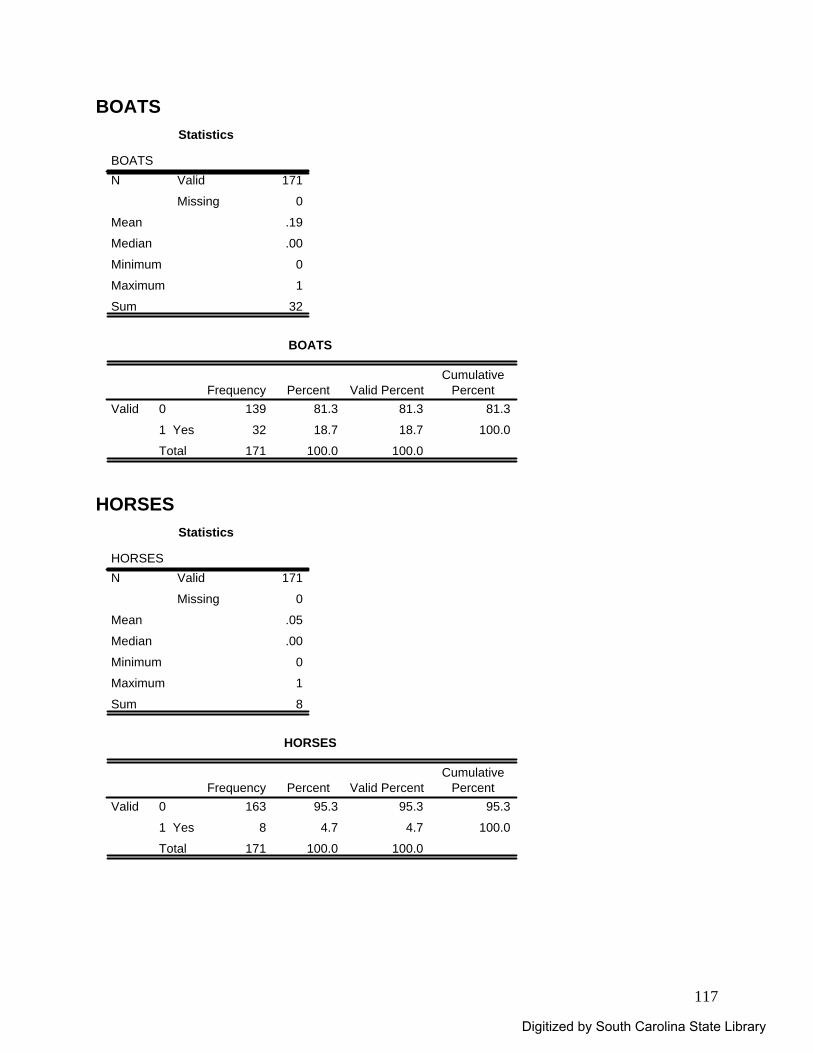
117
BOATS Statistics
BOATS171
0
.19
.00
0
1
32
Valid
Missing
N
Mean
Median
Minimum
Maximum
Sum
BOATS
139 81.3 81.3 81.3
32 18.7 18.7 100.0
171 100.0 100.0
0
1 Yes
Total
ValidFrequency Percent Valid Percent
CumulativePercent
HORSES
Statistics
HORSES171
0
.05
.00
0
1
8
Valid
Missing
N
Mean
Median
Minimum
Maximum
Sum
HORSES
163 95.3 95.3 95.3
8 4.7 4.7 100.0
171 100.0 100.0
0
1 Yes
Total
ValidFrequency Percent Valid Percent
CumulativePercent
Digitized by South Carolina State Library

118
BIKES Statistics
BIKES171
0
.38
.00
0
1
65
Valid
Missing
N
Mean
Median
Minimum
Maximum
Sum
BIKES
106 62.0 62.0 62.0
65 38.0 38.0 100.0
171 100.0 100.0
0
1 Yes
Total
ValidFrequency Percent Valid Percent
CumulativePercent
DOGS
Statistics
DOGS171
0
.49
.00
0
1
83
Valid
Missing
N
Mean
Median
Minimum
Maximum
Sum
DOGS
88 51.5 51.5 51.5
83 48.5 48.5 100.0
171 100.0 100.0
0
1 Yes
Total
ValidFrequency Percent Valid Percent
CumulativePercent
Digitized by South Carolina State Library
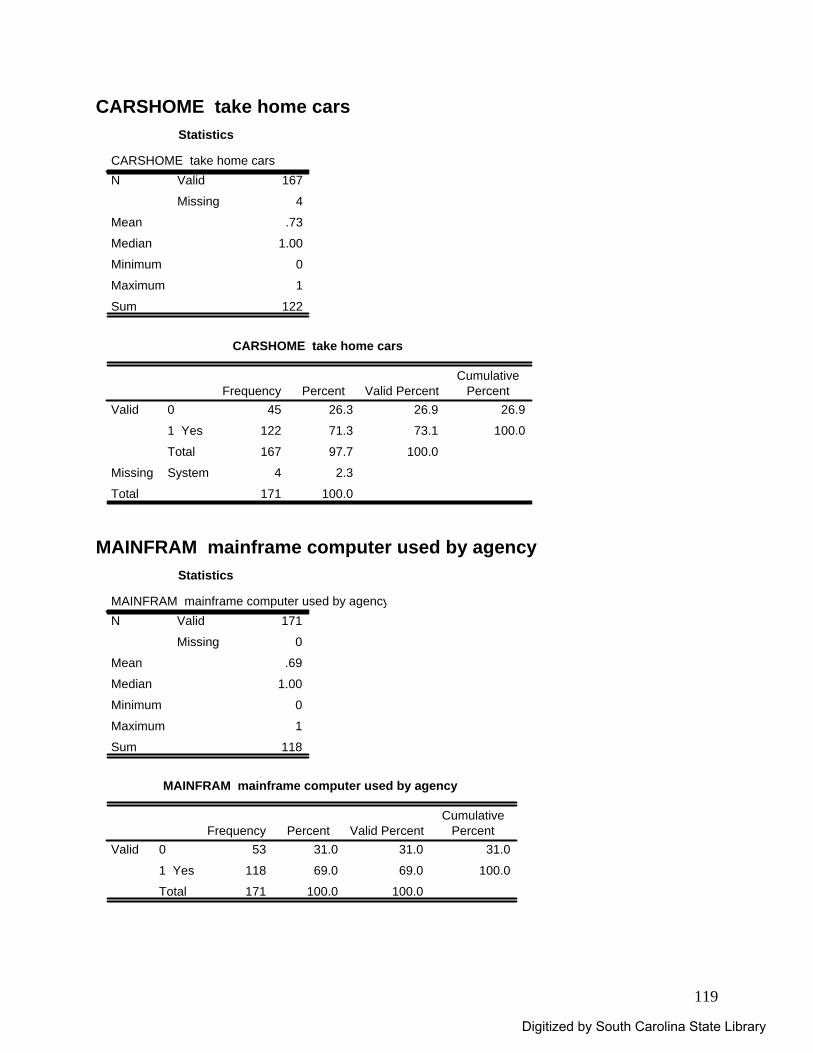
119
CARSHOME take home cars Statistics
CARSHOME take home cars167
4
.73
1.00
0
1
122
Valid
Missing
N
Mean
Median
Minimum
Maximum
Sum
CARSHOME take home cars
45 26.3 26.9 26.9
122 71.3 73.1 100.0
167 97.7 100.0
4 2.3
171 100.0
0
1 Yes
Total
Valid
SystemMissing
Total
Frequency Percent Valid PercentCumulative
Percent
MAINFRAM mainframe computer used by agency
Statistics
MAINFRAM mainframe computer used by agency171
0
.69
1.00
0
1
118
Valid
Missing
N
Mean
Median
Minimum
Maximum
Sum
MAINFRAM mainframe computer used by agency
53 31.0 31.0 31.0
118 69.0 69.0 100.0
171 100.0 100.0
0
1 Yes
Total
ValidFrequency Percent Valid Percent
CumulativePercent
Digitized by South Carolina State Library
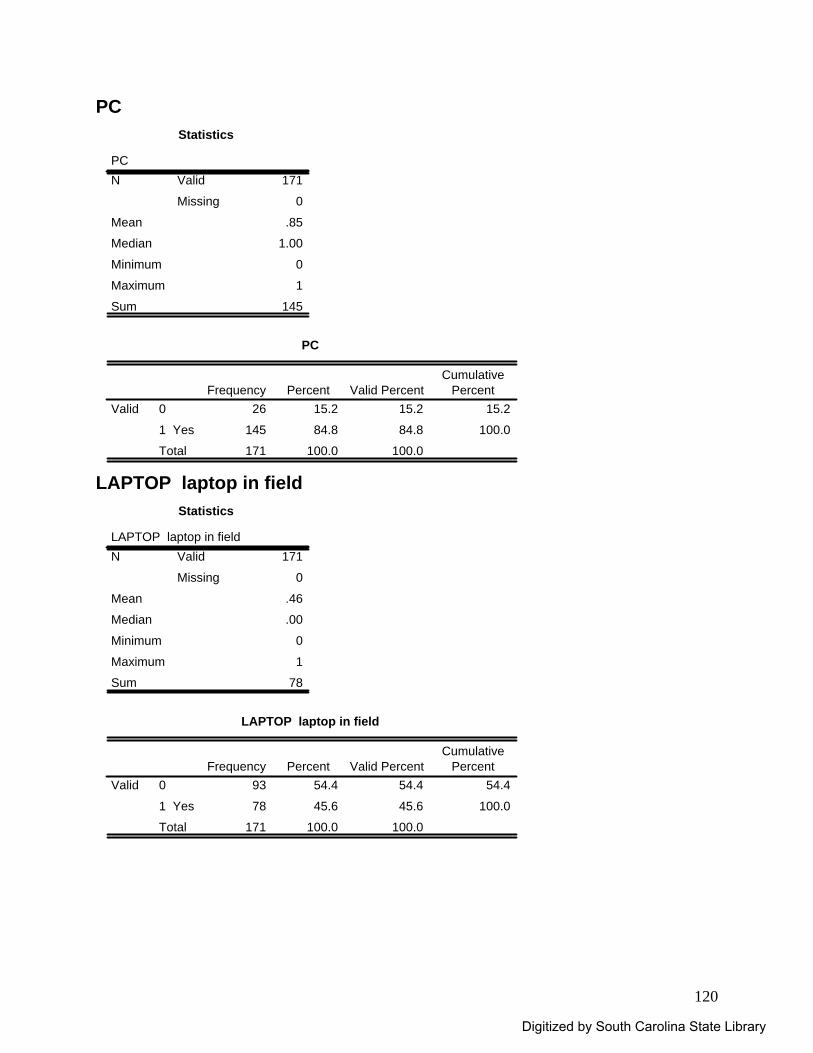
120
PC Statistics
PC171
0
.85
1.00
0
1
145
Valid
Missing
N
Mean
Median
Minimum
Maximum
Sum
PC
26 15.2 15.2 15.2
145 84.8 84.8 100.0
171 100.0 100.0
0
1 Yes
Total
ValidFrequency Percent Valid Percent
CumulativePercent
LAPTOP laptop in field
Statistics
LAPTOP laptop in field171
0
.46
.00
0
1
78
Valid
Missing
N
Mean
Median
Minimum
Maximum
Sum
LAPTOP laptop in field
93 54.4 54.4 54.4
78 45.6 45.6 100.0
171 100.0 100.0
0
1 Yes
Total
ValidFrequency Percent Valid Percent
CumulativePercent
Digitized by South Carolina State Library
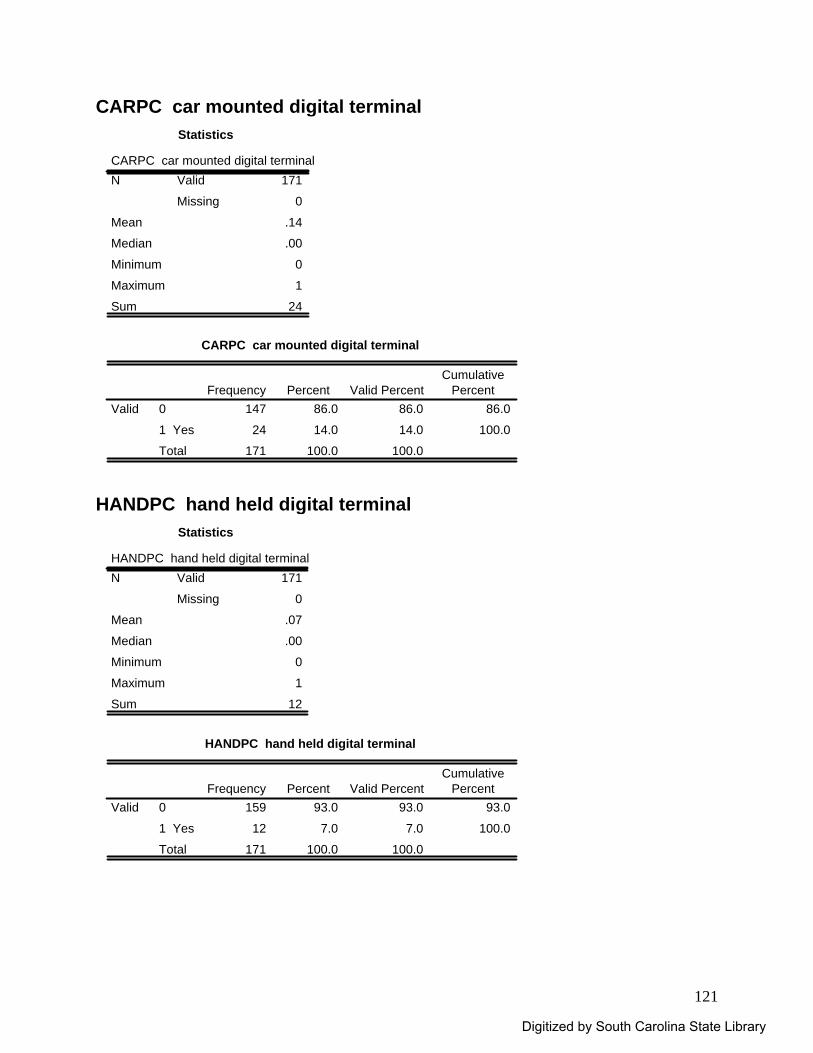
121
CARPC car mounted digital terminal Statistics
CARPC car mounted digital terminal171
0
.14
.00
0
1
24
Valid
Missing
N
Mean
Median
Minimum
Maximum
Sum
CARPC car mounted digital terminal
147 86.0 86.0 86.0
24 14.0 14.0 100.0
171 100.0 100.0
0
1 Yes
Total
ValidFrequency Percent Valid Percent
CumulativePercent
HANDPC hand held digital terminal
Statistics
HANDPC hand held digital terminal171
0
.07
.00
0
1
12
Valid
Missing
N
Mean
Median
Minimum
Maximum
Sum
HANDPC hand held digital terminal
159 93.0 93.0 93.0
12 7.0 7.0 100.0
171 100.0 100.0
0
1 Yes
Total
ValidFrequency Percent Valid Percent
CumulativePercent
Digitized by South Carolina State Library
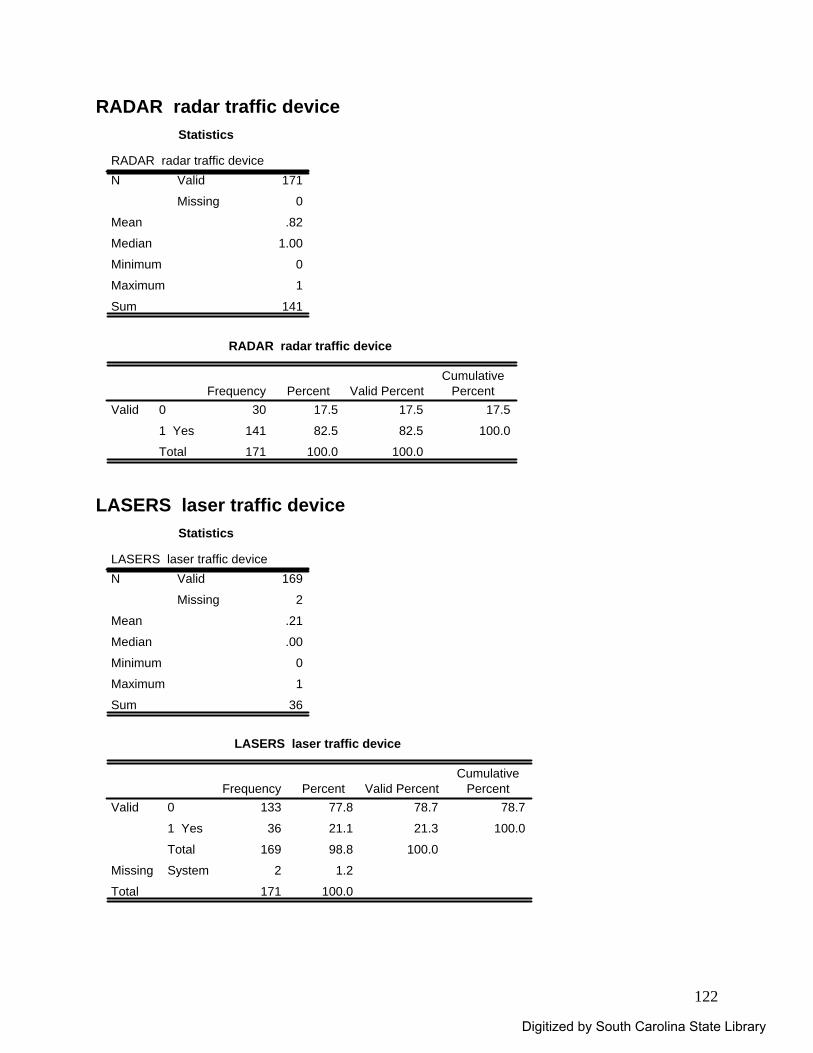
122
RADAR radar traffic device Statistics
RADAR radar traffic device171
0
.82
1.00
0
1
141
Valid
Missing
N
Mean
Median
Minimum
Maximum
Sum
RADAR radar traffic device
30 17.5 17.5 17.5
141 82.5 82.5 100.0
171 100.0 100.0
0
1 Yes
Total
ValidFrequency Percent Valid Percent
CumulativePercent
LASERS laser traffic device
Statistics
LASERS laser traffic device169
2
.21
.00
0
1
36
Valid
Missing
N
Mean
Median
Minimum
Maximum
Sum
LASERS laser traffic device
133 77.8 78.7 78.7
36 21.1 21.3 100.0
169 98.8 100.0
2 1.2
171 100.0
0
1 Yes
Total
Valid
SystemMissing
Total
Frequency Percent Valid PercentCumulative
Percent
Digitized by South Carolina State Library
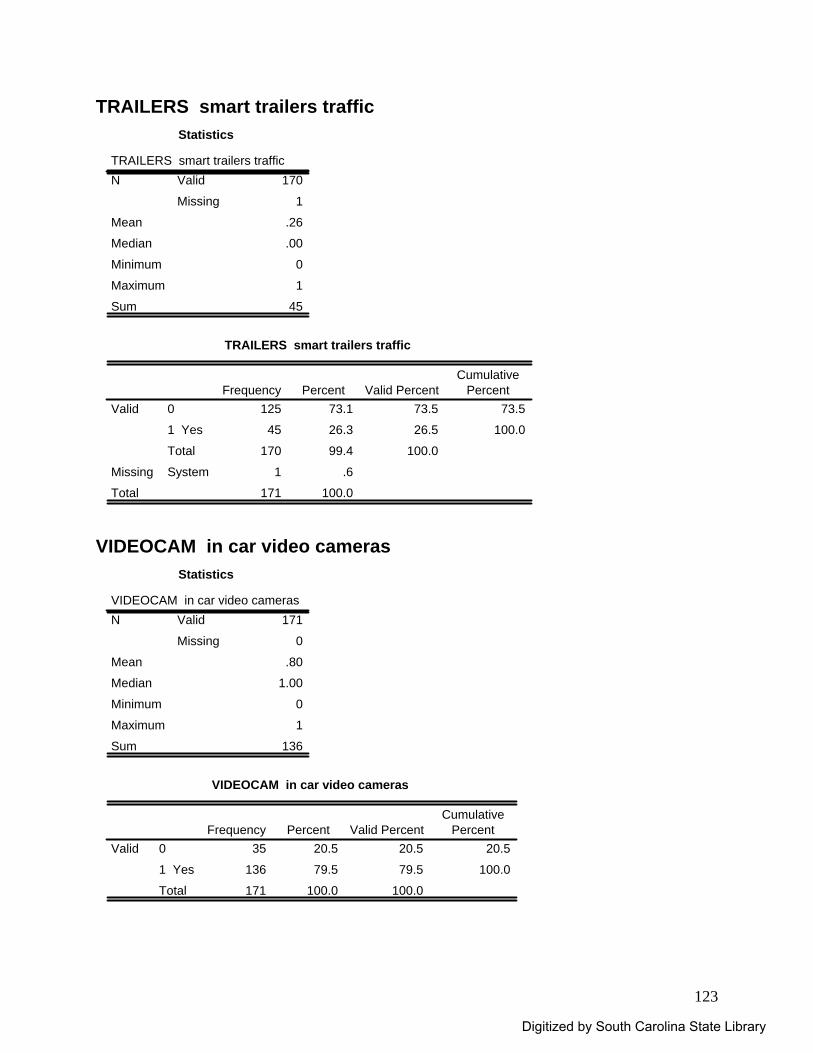
123
TRAILERS smart trailers traffic Statistics
TRAILERS smart trailers traffic170
1
.26
.00
0
1
45
Valid
Missing
N
Mean
Median
Minimum
Maximum
Sum
TRAILERS smart trailers traffic
125 73.1 73.5 73.5
45 26.3 26.5 100.0
170 99.4 100.0
1 .6
171 100.0
0
1 Yes
Total
Valid
SystemMissing
Total
Frequency Percent Valid PercentCumulative
Percent
VIDEOCAM in car video cameras
Statistics
VIDEOCAM in car video cameras171
0
.80
1.00
0
1
136
Valid
Missing
N
Mean
Median
Minimum
Maximum
Sum
VIDEOCAM in car video cameras
35 20.5 20.5 20.5
136 79.5 79.5 100.0
171 100.0 100.0
0
1 Yes
Total
ValidFrequency Percent Valid Percent
CumulativePercent
Digitized by South Carolina State Library
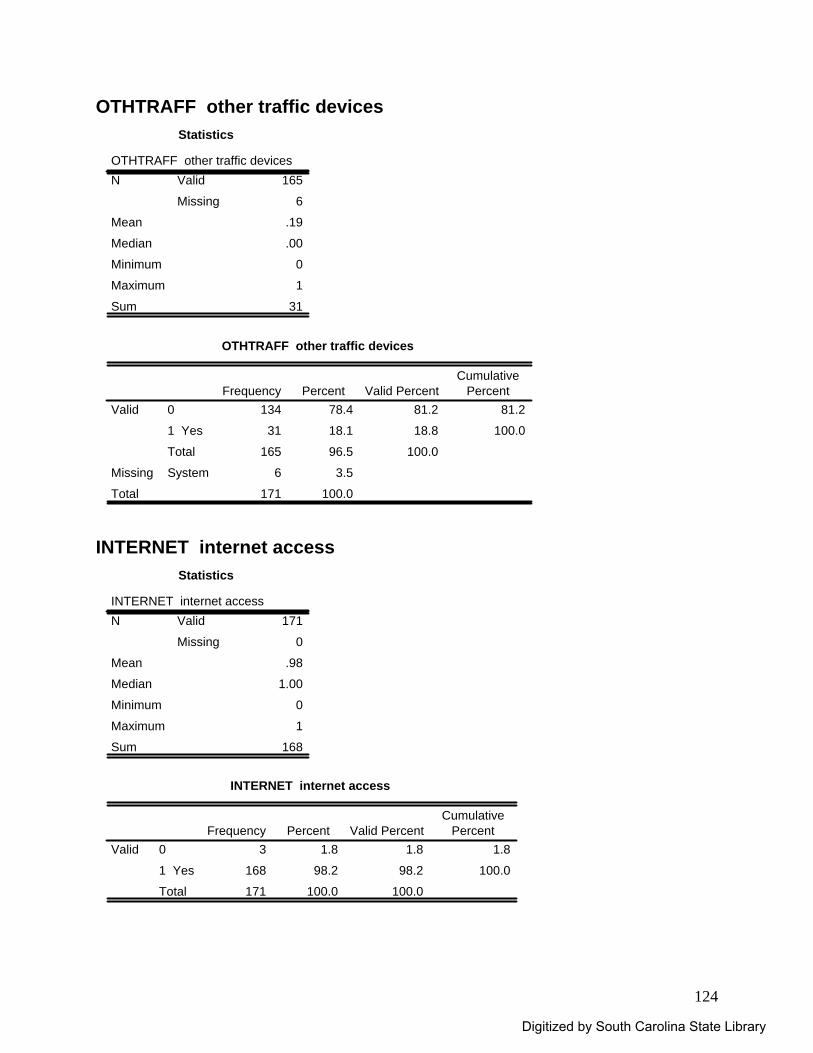
124
OTHTRAFF other traffic devices Statistics
OTHTRAFF other traffic devices165
6
.19
.00
0
1
31
Valid
Missing
N
Mean
Median
Minimum
Maximum
Sum
OTHTRAFF other traffic devices
134 78.4 81.2 81.2
31 18.1 18.8 100.0
165 96.5 100.0
6 3.5
171 100.0
0
1 Yes
Total
Valid
SystemMissing
Total
Frequency Percent Valid PercentCumulative
Percent
INTERNET internet access
Statistics
INTERNET internet access171
0
.98
1.00
0
1
168
Valid
Missing
N
Mean
Median
Minimum
Maximum
Sum
INTERNET internet access
3 1.8 1.8 1.8
168 98.2 98.2 100.0
171 100.0 100.0
0
1 Yes
Total
ValidFrequency Percent Valid Percent
CumulativePercent
Digitized by South Carolina State Library
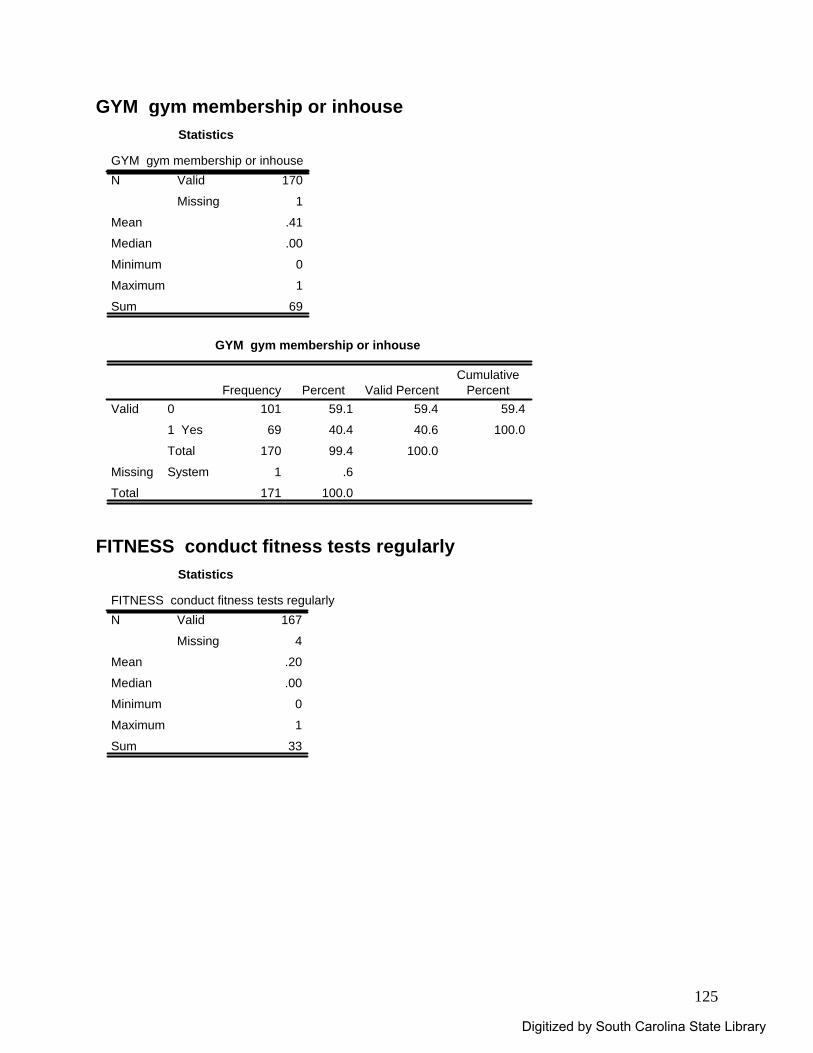
125
GYM gym membership or inhouse Statistics
GYM gym membership or inhouse170
1
.41
.00
0
1
69
Valid
Missing
N
Mean
Median
Minimum
Maximum
Sum
GYM gym membership or inhouse
101 59.1 59.4 59.4
69 40.4 40.6 100.0
170 99.4 100.0
1 .6
171 100.0
0
1 Yes
Total
Valid
SystemMissing
Total
Frequency Percent Valid PercentCumulative
Percent
FITNESS conduct fitness tests regularly
Statistics
FITNESS conduct fitness tests regularly167
4
.20
.00
0
1
33
Valid
Missing
N
Mean
Median
Minimum
Maximum
Sum
Digitized by South Carolina State Library
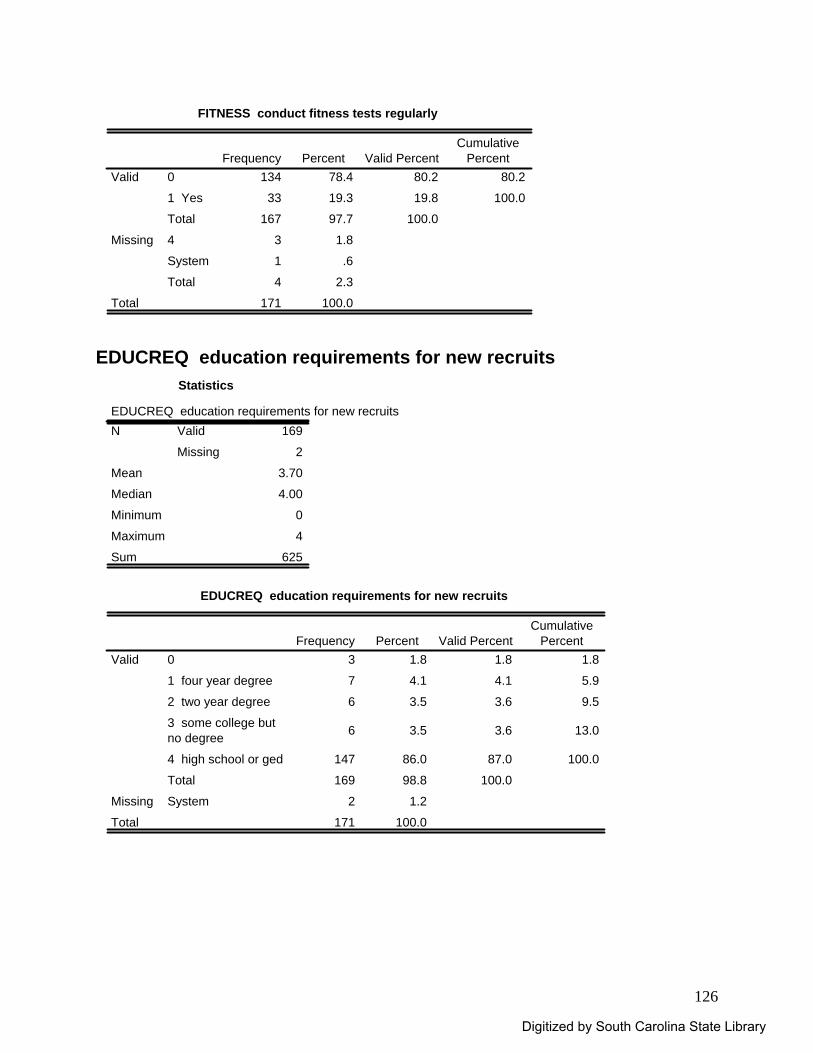
126
FITNESS conduct fitness tests regularly
134 78.4 80.2 80.2
33 19.3 19.8 100.0
167 97.7 100.0
3 1.8
1 .6
4 2.3
171 100.0
0
1 Yes
Total
Valid
4
System
Total
Missing
Total
Frequency Percent Valid PercentCumulative
Percent
EDUCREQ education requirements for new recruits
Statistics
EDUCREQ education requirements for new recruits169
2
3.70
4.00
0
4
625
Valid
Missing
N
Mean
Median
Minimum
Maximum
Sum
EDUCREQ education requirements for new recruits
3 1.8 1.8 1.8
7 4.1 4.1 5.9
6 3.5 3.6 9.5
6 3.5 3.6 13.0
147 86.0 87.0 100.0
169 98.8 100.0
2 1.2
171 100.0
0
1 four year degree
2 two year degree
3 some college butno degree
4 high school or ged
Total
Valid
SystemMissing
Total
Frequency Percent Valid PercentCumulative
Percent
Digitized by South Carolina State Library
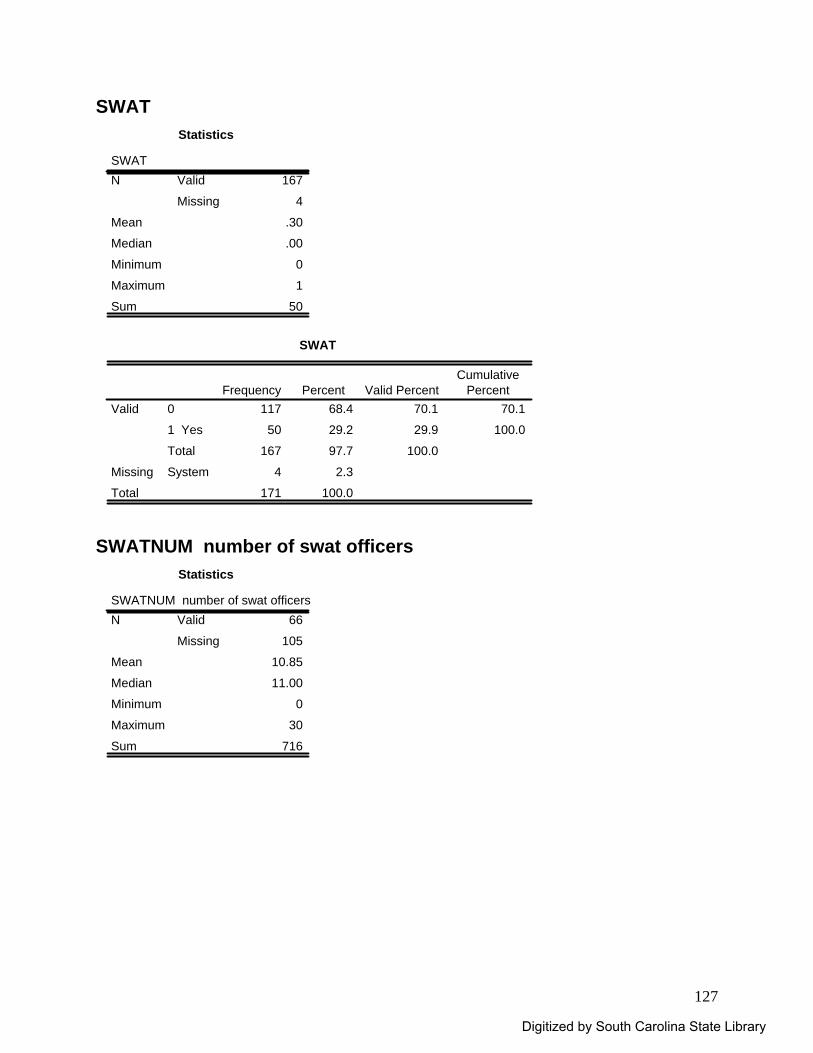
127
SWAT Statistics
SWAT167
4
.30
.00
0
1
50
Valid
Missing
N
Mean
Median
Minimum
Maximum
Sum
SWAT
117 68.4 70.1 70.1
50 29.2 29.9 100.0
167 97.7 100.0
4 2.3
171 100.0
0
1 Yes
Total
Valid
SystemMissing
Total
Frequency Percent Valid PercentCumulative
Percent
SWATNUM number of swat officers
Statistics
SWATNUM number of swat officers66
105
10.85
11.00
0
30
716
Valid
Missing
N
Mean
Median
Minimum
Maximum
Sum
Digitized by South Carolina State Library
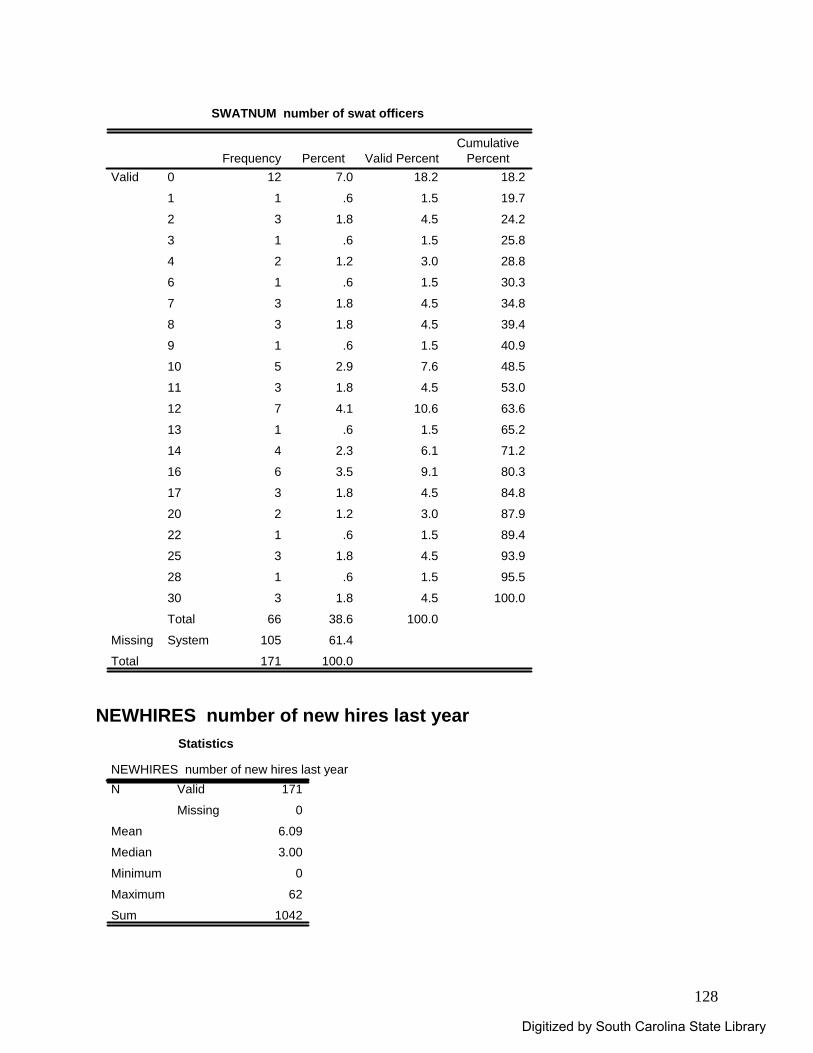
128
SWATNUM number of swat officers
12 7.0 18.2 18.2
1 .6 1.5 19.7
3 1.8 4.5 24.2
1 .6 1.5 25.8
2 1.2 3.0 28.8
1 .6 1.5 30.3
3 1.8 4.5 34.8
3 1.8 4.5 39.4
1 .6 1.5 40.9
5 2.9 7.6 48.5
3 1.8 4.5 53.0
7 4.1 10.6 63.6
1 .6 1.5 65.2
4 2.3 6.1 71.2
6 3.5 9.1 80.3
3 1.8 4.5 84.8
2 1.2 3.0 87.9
1 .6 1.5 89.4
3 1.8 4.5 93.9
1 .6 1.5 95.5
3 1.8 4.5 100.0
66 38.6 100.0
105 61.4
171 100.0
0
1
2
3
4
6
7
8
9
10
11
12
13
14
16
17
20
22
25
28
30
Total
Valid
SystemMissing
Total
Frequency Percent Valid PercentCumulative
Percent
NEWHIRES number of new hires last year
Statistics
NEWHIRES number of new hires last year171
0
6.09
3.00
0
62
1042
Valid
Missing
N
Mean
Median
Minimum
Maximum
Sum
Digitized by South Carolina State Library
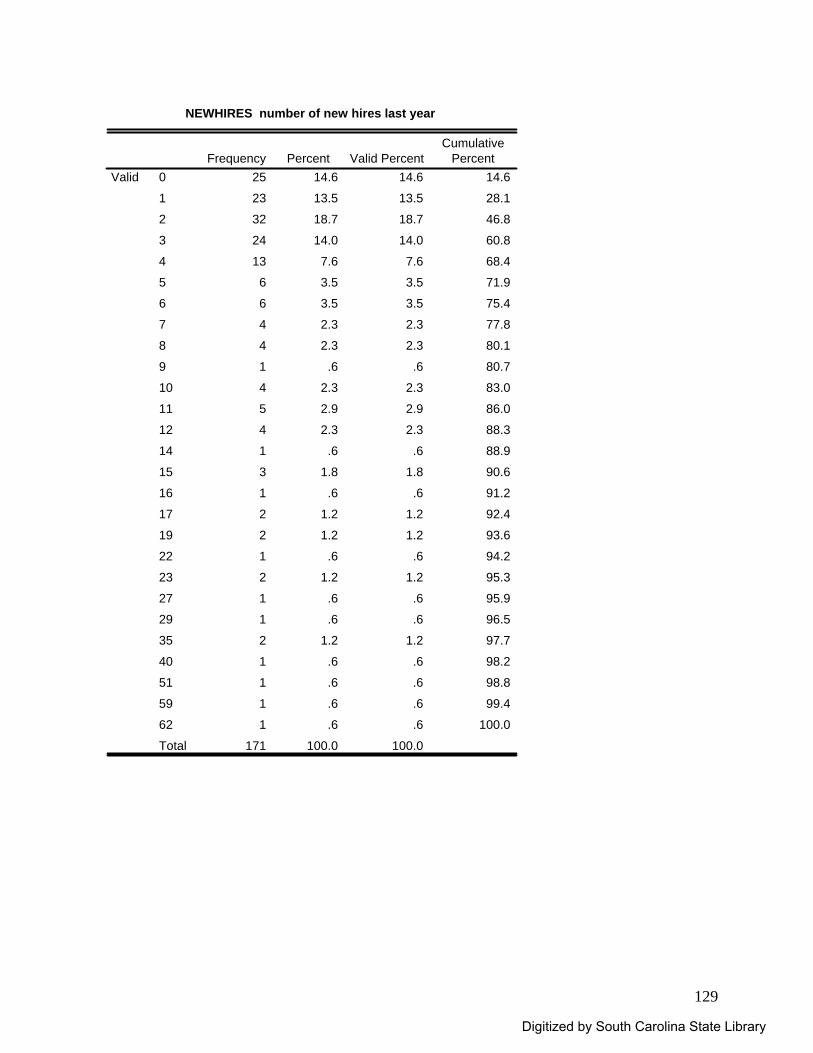
129
NEWHIRES number of new hires last year
25 14.6 14.6 14.6
23 13.5 13.5 28.1
32 18.7 18.7 46.8
24 14.0 14.0 60.8
13 7.6 7.6 68.4
6 3.5 3.5 71.9
6 3.5 3.5 75.4
4 2.3 2.3 77.8
4 2.3 2.3 80.1
1 .6 .6 80.7
4 2.3 2.3 83.0
5 2.9 2.9 86.0
4 2.3 2.3 88.3
1 .6 .6 88.9
3 1.8 1.8 90.6
1 .6 .6 91.2
2 1.2 1.2 92.4
2 1.2 1.2 93.6
1 .6 .6 94.2
2 1.2 1.2 95.3
1 .6 .6 95.9
1 .6 .6 96.5
2 1.2 1.2 97.7
1 .6 .6 98.2
1 .6 .6 98.8
1 .6 .6 99.4
1 .6 .6 100.0
171 100.0 100.0
0
1
2
3
4
5
6
7
8
9
10
11
12
14
15
16
17
19
22
23
27
29
35
40
51
59
62
Total
ValidFrequency Percent Valid Percent
CumulativePercent
Digitized by South Carolina State Library
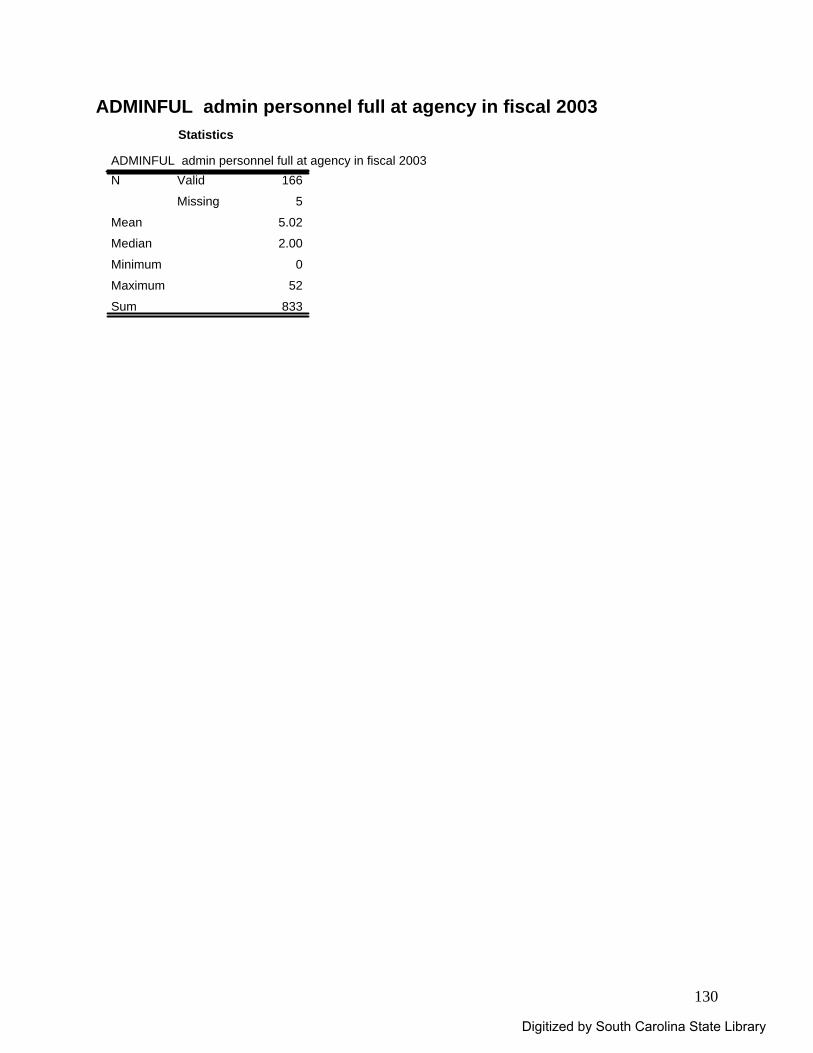
130
ADMINFUL admin personnel full at agency in fiscal 2003 Statistics
ADMINFUL admin personnel full at agency in fiscal 2003166
5
5.02
2.00
0
52
833
Valid
Missing
N
Mean
Median
Minimum
Maximum
Sum
Digitized by South Carolina State Library
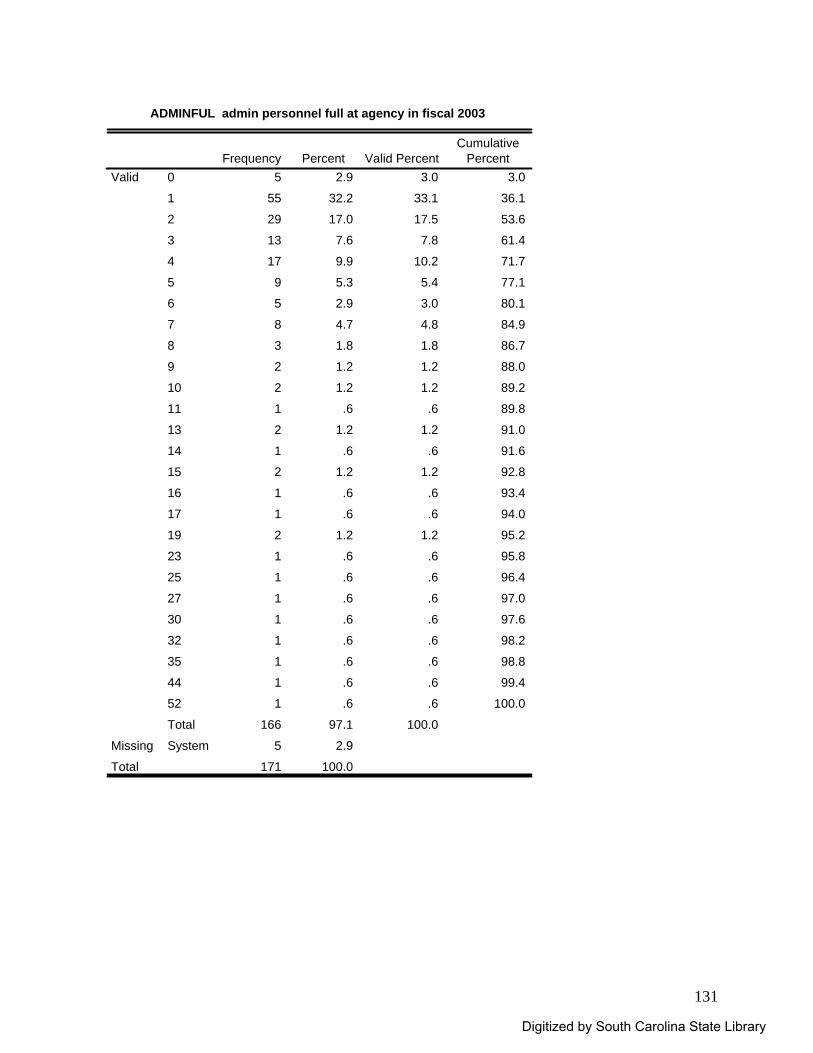
131
ADMINFUL admin personnel full at agency in fiscal 2003
5 2.9 3.0 3.0
55 32.2 33.1 36.1
29 17.0 17.5 53.6
13 7.6 7.8 61.4
17 9.9 10.2 71.7
9 5.3 5.4 77.1
5 2.9 3.0 80.1
8 4.7 4.8 84.9
3 1.8 1.8 86.7
2 1.2 1.2 88.0
2 1.2 1.2 89.2
1 .6 .6 89.8
2 1.2 1.2 91.0
1 .6 .6 91.6
2 1.2 1.2 92.8
1 .6 .6 93.4
1 .6 .6 94.0
2 1.2 1.2 95.2
1 .6 .6 95.8
1 .6 .6 96.4
1 .6 .6 97.0
1 .6 .6 97.6
1 .6 .6 98.2
1 .6 .6 98.8
1 .6 .6 99.4
1 .6 .6 100.0
166 97.1 100.0
5 2.9
171 100.0
0
1
2
3
4
5
6
7
8
9
10
11
13
14
15
16
17
19
23
25
27
30
32
35
44
52
Total
Valid
SystemMissing
Total
Frequency Percent Valid PercentCumulative
Percent
Digitized by South Carolina State Library
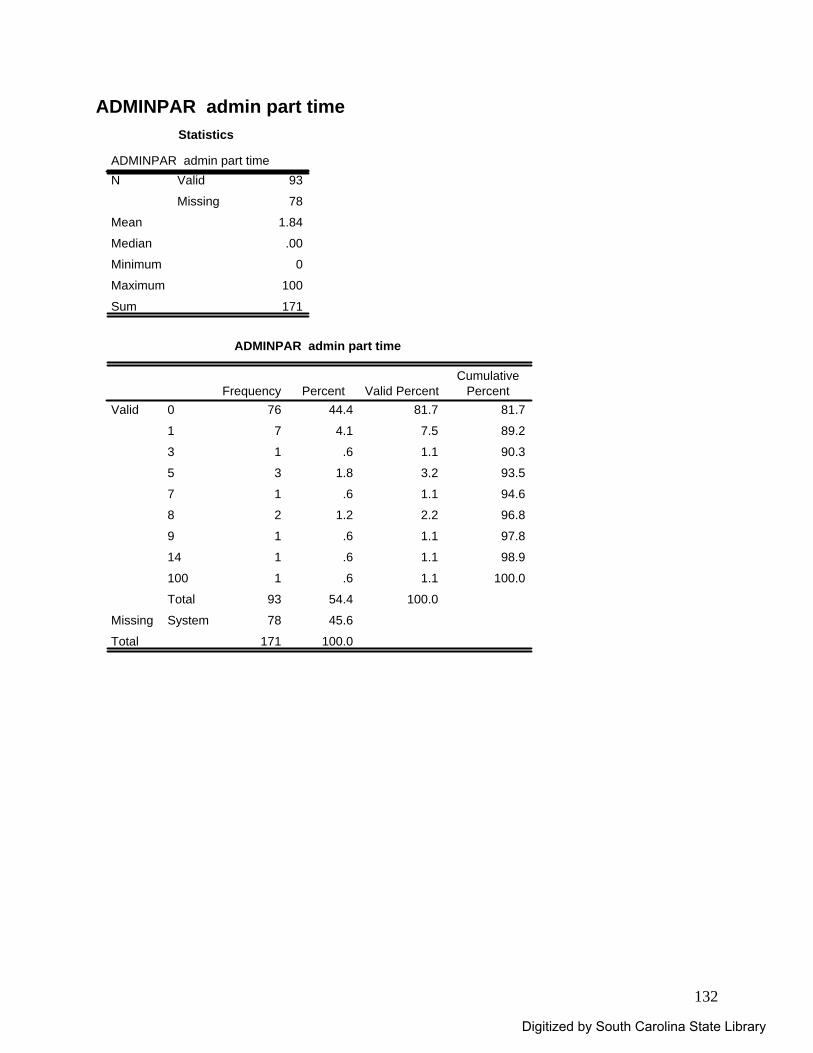
132
ADMINPAR admin part time Statistics
ADMINPAR admin part time93
78
1.84
.00
0
100
171
Valid
Missing
N
Mean
Median
Minimum
Maximum
Sum
ADMINPAR admin part time
76 44.4 81.7 81.7
7 4.1 7.5 89.2
1 .6 1.1 90.3
3 1.8 3.2 93.5
1 .6 1.1 94.6
2 1.2 2.2 96.8
1 .6 1.1 97.8
1 .6 1.1 98.9
1 .6 1.1 100.0
93 54.4 100.0
78 45.6
171 100.0
0
1
3
5
7
8
9
14
100
Total
Valid
SystemMissing
Total
Frequency Percent Valid PercentCumulative
Percent
Digitized by South Carolina State Library
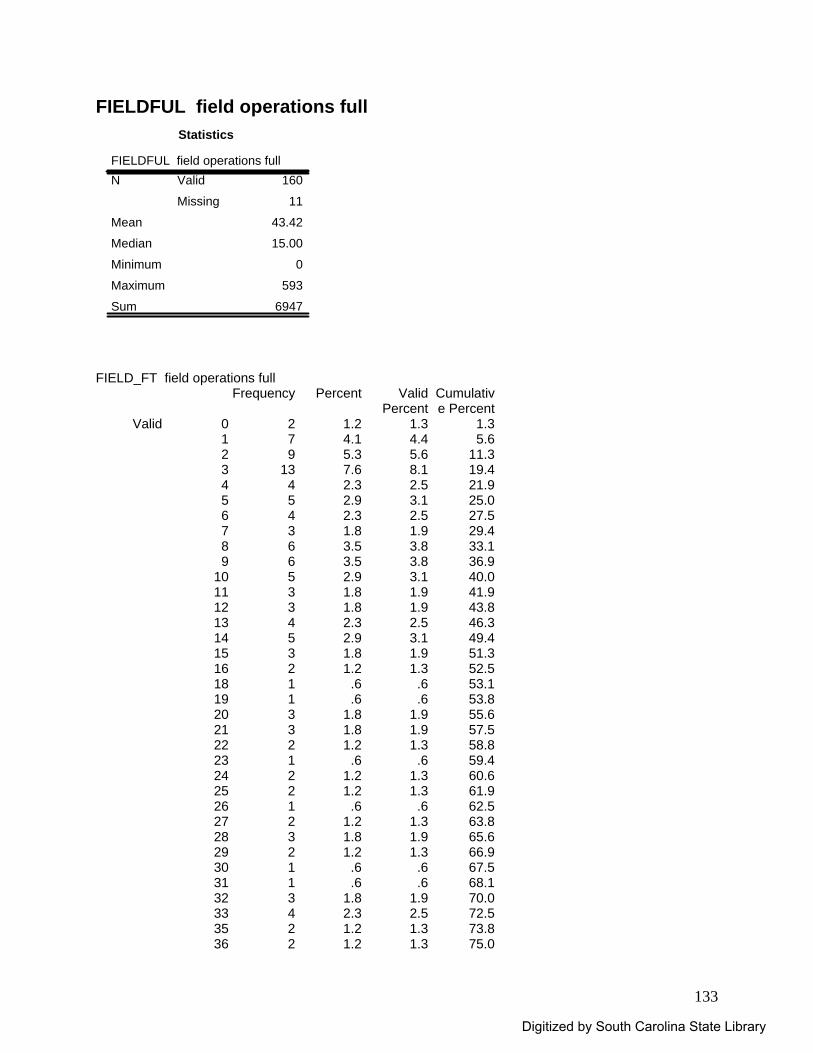
133
FIELDFUL field operations full Statistics
FIELDFUL field operations full160
11
43.42
15.00
0
593
6947
Valid
Missing
N
Mean
Median
Minimum
Maximum
Sum
FIELD_FT field operations full
Frequency Percent Valid Percent
Cumulative Percent
Valid 0 2 1.2 1.3 1.31 7 4.1 4.4 5.62 9 5.3 5.6 11.33 13 7.6 8.1 19.44 4 2.3 2.5 21.95 5 2.9 3.1 25.06 4 2.3 2.5 27.57 3 1.8 1.9 29.48 6 3.5 3.8 33.19 6 3.5 3.8 36.9
10 5 2.9 3.1 40.011 3 1.8 1.9 41.912 3 1.8 1.9 43.813 4 2.3 2.5 46.314 5 2.9 3.1 49.415 3 1.8 1.9 51.316 2 1.2 1.3 52.518 1 .6 .6 53.119 1 .6 .6 53.820 3 1.8 1.9 55.621 3 1.8 1.9 57.522 2 1.2 1.3 58.823 1 .6 .6 59.424 2 1.2 1.3 60.625 2 1.2 1.3 61.926 1 .6 .6 62.527 2 1.2 1.3 63.828 3 1.8 1.9 65.629 2 1.2 1.3 66.930 1 .6 .6 67.531 1 .6 .6 68.132 3 1.8 1.9 70.033 4 2.3 2.5 72.535 2 1.2 1.3 73.836 2 1.2 1.3 75.0
Digitized by South Carolina State Library
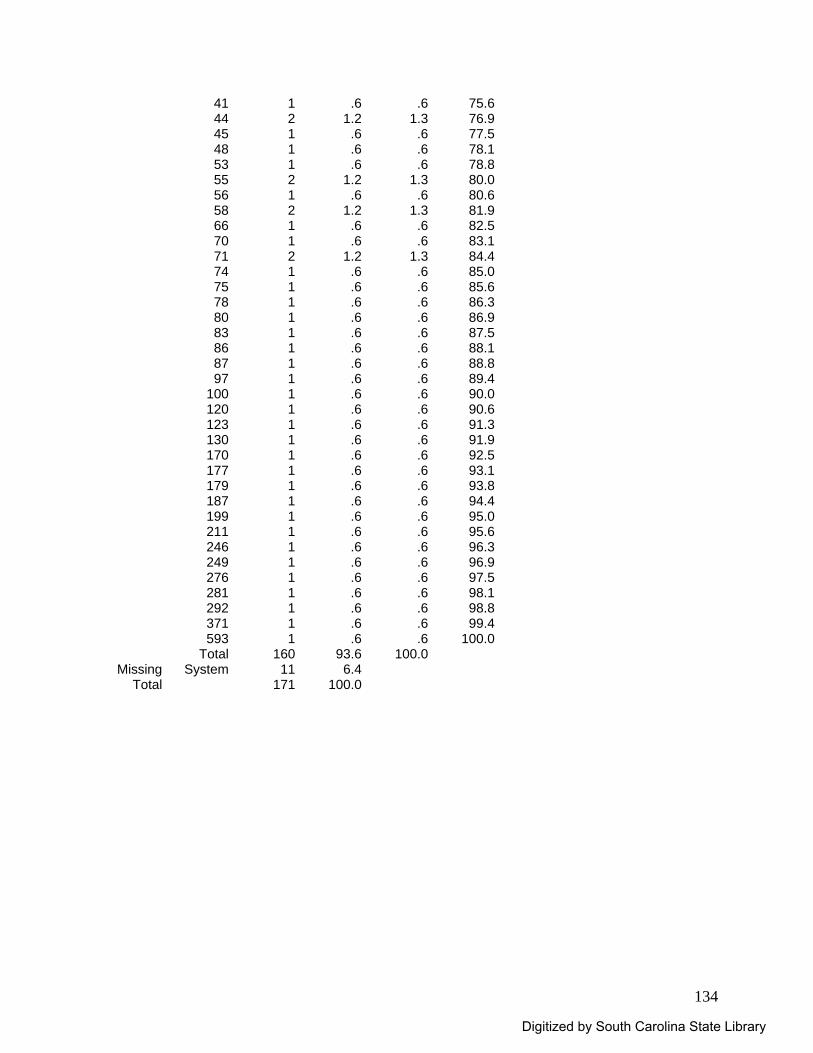
134
41 1 .6 .6 75.644 2 1.2 1.3 76.945 1 .6 .6 77.548 1 .6 .6 78.153 1 .6 .6 78.855 2 1.2 1.3 80.056 1 .6 .6 80.658 2 1.2 1.3 81.966 1 .6 .6 82.570 1 .6 .6 83.171 2 1.2 1.3 84.474 1 .6 .6 85.075 1 .6 .6 85.678 1 .6 .6 86.380 1 .6 .6 86.983 1 .6 .6 87.586 1 .6 .6 88.187 1 .6 .6 88.897 1 .6 .6 89.4
100 1 .6 .6 90.0120 1 .6 .6 90.6123 1 .6 .6 91.3130 1 .6 .6 91.9170 1 .6 .6 92.5177 1 .6 .6 93.1179 1 .6 .6 93.8187 1 .6 .6 94.4199 1 .6 .6 95.0211 1 .6 .6 95.6246 1 .6 .6 96.3249 1 .6 .6 96.9276 1 .6 .6 97.5281 1 .6 .6 98.1292 1 .6 .6 98.8371 1 .6 .6 99.4593 1 .6 .6 100.0
Total 160 93.6 100.0Missing System 11 6.4
Total 171 100.0
Digitized by South Carolina State Library
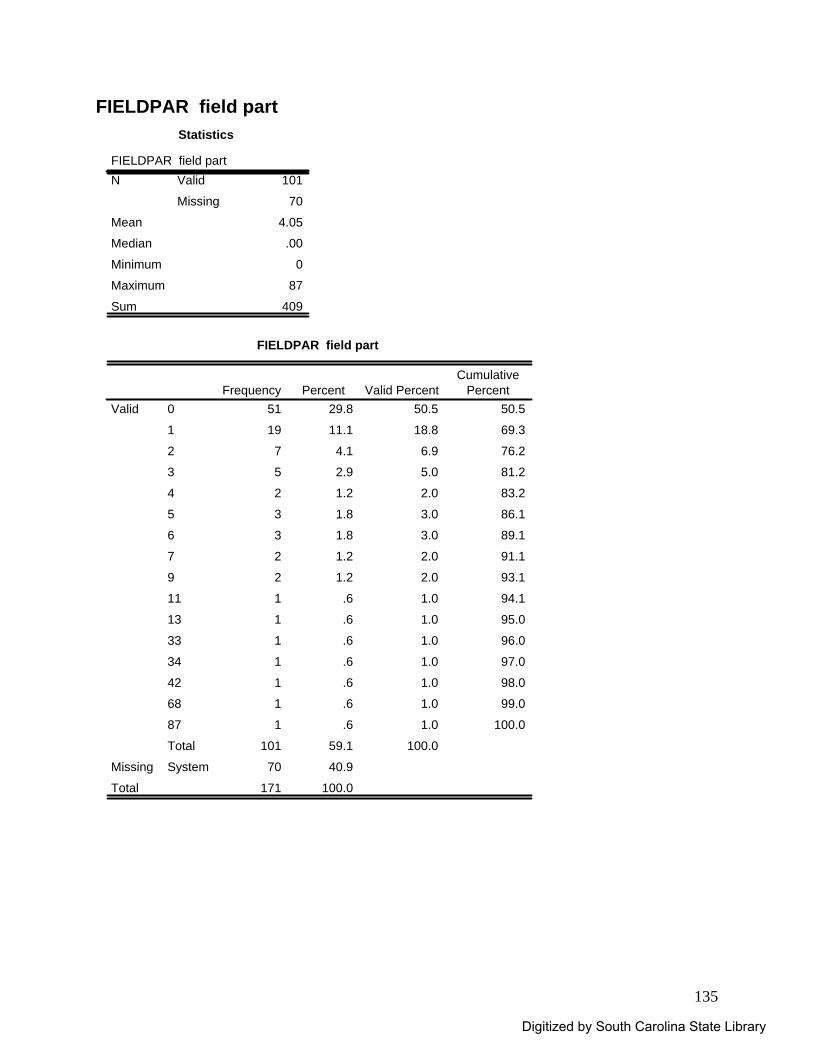
135
FIELDPAR field part Statistics
FIELDPAR field part101
70
4.05
.00
0
87
409
Valid
Missing
N
Mean
Median
Minimum
Maximum
Sum
FIELDPAR field part
51 29.8 50.5 50.5
19 11.1 18.8 69.3
7 4.1 6.9 76.2
5 2.9 5.0 81.2
2 1.2 2.0 83.2
3 1.8 3.0 86.1
3 1.8 3.0 89.1
2 1.2 2.0 91.1
2 1.2 2.0 93.1
1 .6 1.0 94.1
1 .6 1.0 95.0
1 .6 1.0 96.0
1 .6 1.0 97.0
1 .6 1.0 98.0
1 .6 1.0 99.0
1 .6 1.0 100.0
101 59.1 100.0
70 40.9
171 100.0
0
1
2
3
4
5
6
7
9
11
13
33
34
42
68
87
Total
Valid
SystemMissing
Total
Frequency Percent Valid PercentCumulative
Percent
Digitized by South Carolina State Library
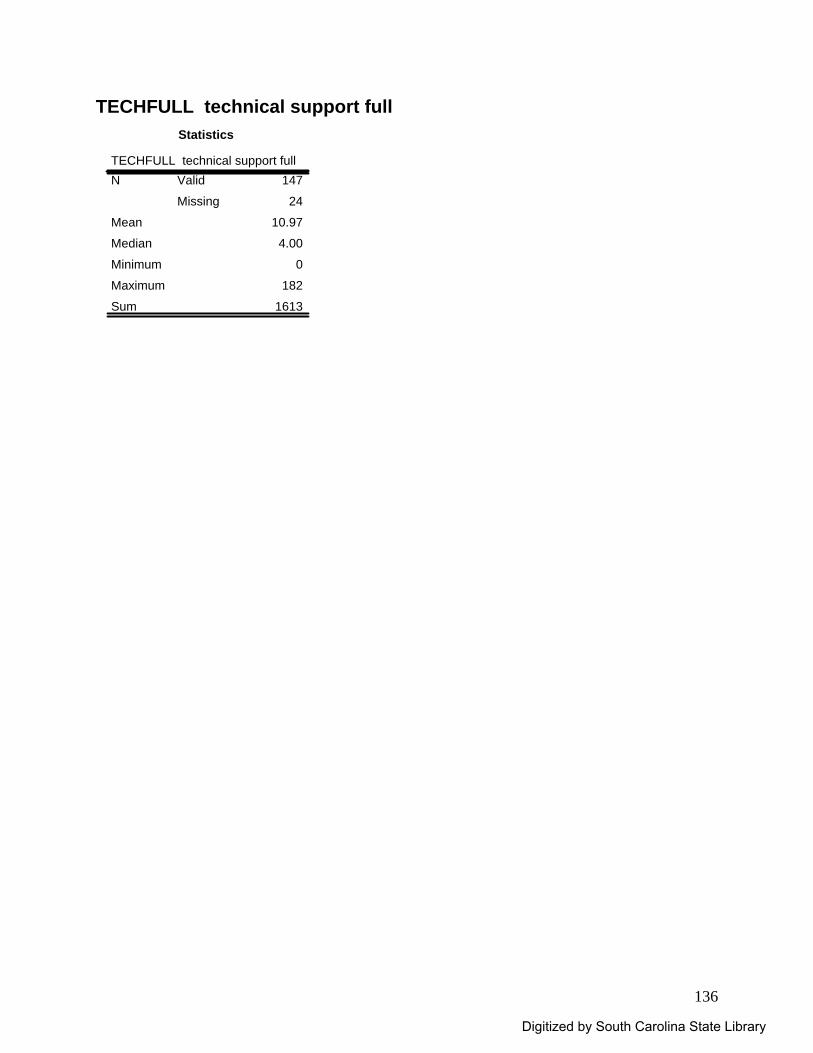
136
TECHFULL technical support full Statistics
TECHFULL technical support full147
24
10.97
4.00
0
182
1613
Valid
Missing
N
Mean
Median
Minimum
Maximum
Sum
Digitized by South Carolina State Library
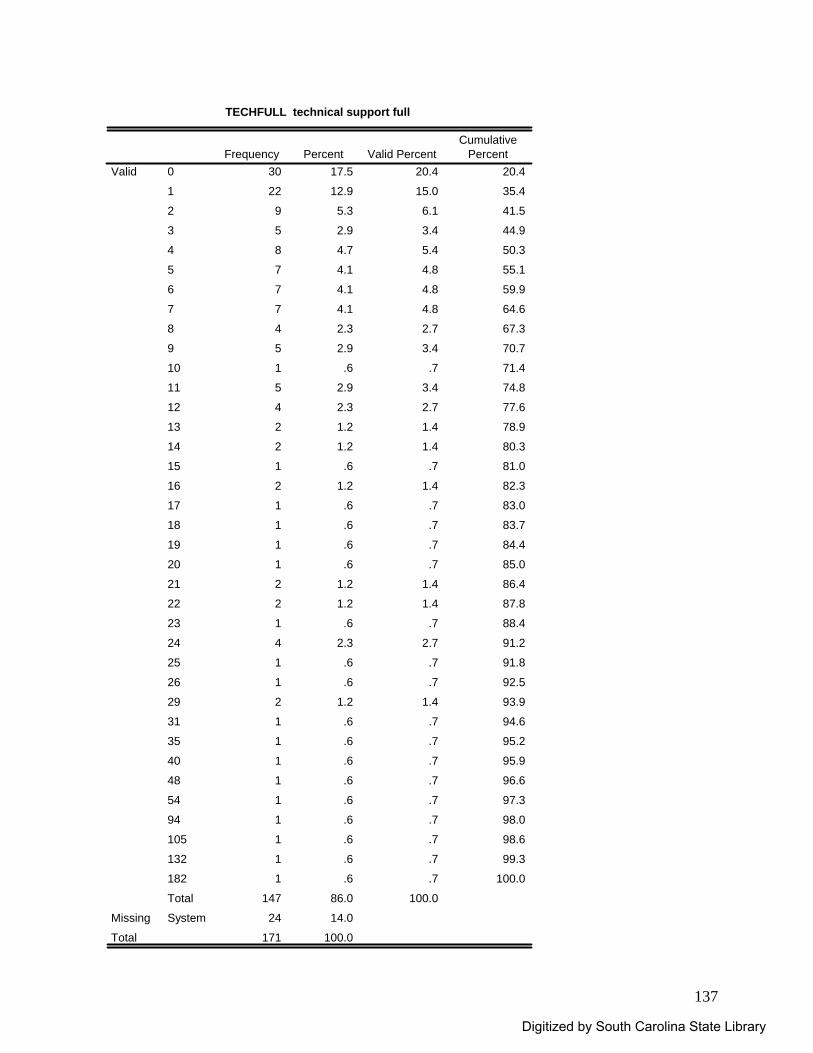
137
TECHFULL technical support full
30 17.5 20.4 20.4
22 12.9 15.0 35.4
9 5.3 6.1 41.5
5 2.9 3.4 44.9
8 4.7 5.4 50.3
7 4.1 4.8 55.1
7 4.1 4.8 59.9
7 4.1 4.8 64.6
4 2.3 2.7 67.3
5 2.9 3.4 70.7
1 .6 .7 71.4
5 2.9 3.4 74.8
4 2.3 2.7 77.6
2 1.2 1.4 78.9
2 1.2 1.4 80.3
1 .6 .7 81.0
2 1.2 1.4 82.3
1 .6 .7 83.0
1 .6 .7 83.7
1 .6 .7 84.4
1 .6 .7 85.0
2 1.2 1.4 86.4
2 1.2 1.4 87.8
1 .6 .7 88.4
4 2.3 2.7 91.2
1 .6 .7 91.8
1 .6 .7 92.5
2 1.2 1.4 93.9
1 .6 .7 94.6
1 .6 .7 95.2
1 .6 .7 95.9
1 .6 .7 96.6
1 .6 .7 97.3
1 .6 .7 98.0
1 .6 .7 98.6
1 .6 .7 99.3
1 .6 .7 100.0
147 86.0 100.0
24 14.0
171 100.0
0
1
2
3
4
5
6
7
8
9
10
11
12
13
14
15
16
17
18
19
20
21
22
23
24
25
26
29
31
35
40
48
54
94
105
132
182
Total
Valid
SystemMissing
Total
Frequency Percent Valid PercentCumulative
Percent
Digitized by South Carolina State Library
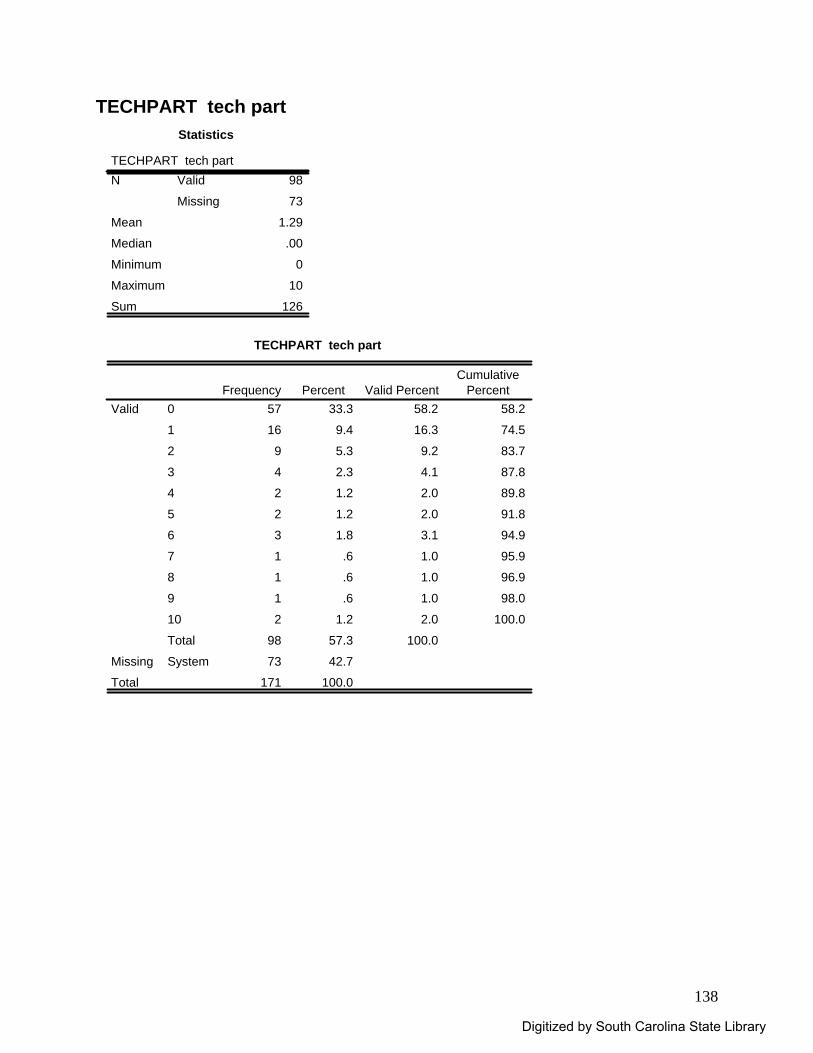
138
TECHPART tech part Statistics
TECHPART tech part98
73
1.29
.00
0
10
126
Valid
Missing
N
Mean
Median
Minimum
Maximum
Sum
TECHPART tech part
57 33.3 58.2 58.2
16 9.4 16.3 74.5
9 5.3 9.2 83.7
4 2.3 4.1 87.8
2 1.2 2.0 89.8
2 1.2 2.0 91.8
3 1.8 3.1 94.9
1 .6 1.0 95.9
1 .6 1.0 96.9
1 .6 1.0 98.0
2 1.2 2.0 100.0
98 57.3 100.0
73 42.7
171 100.0
0
1
2
3
4
5
6
7
8
9
10
Total
Valid
SystemMissing
Total
Frequency Percent Valid PercentCumulative
Percent
Digitized by South Carolina State Library
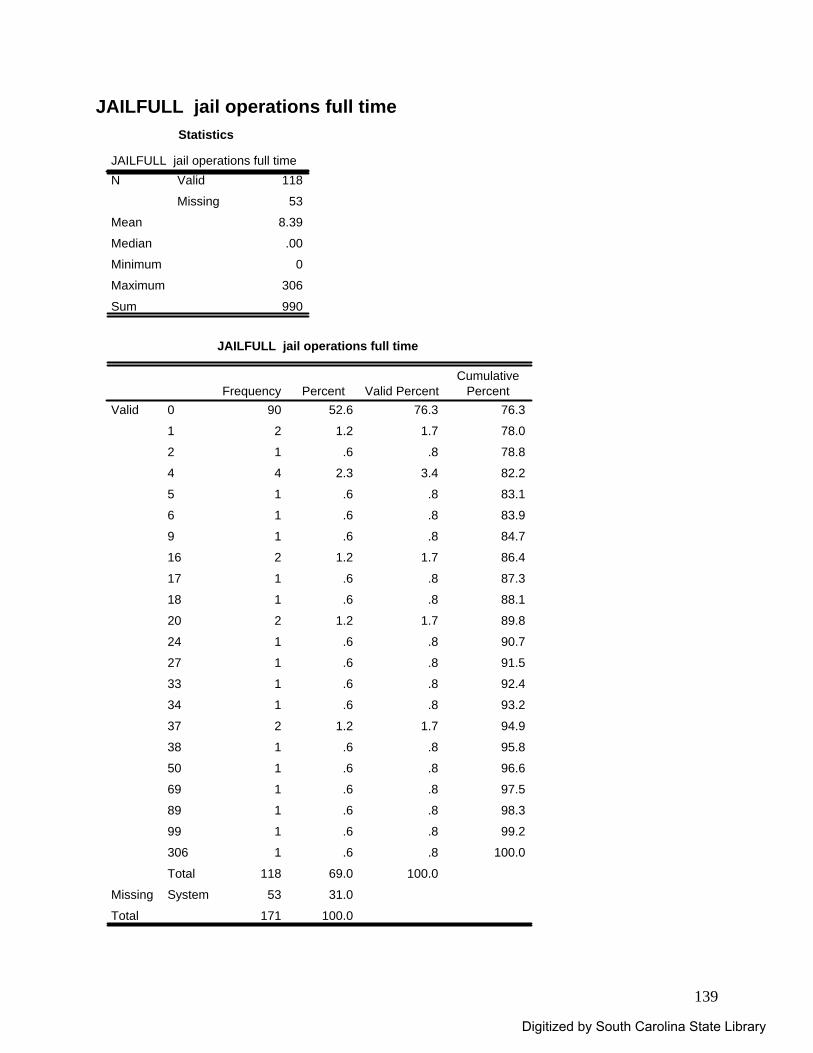
139
JAILFULL jail operations full time Statistics
JAILFULL jail operations full time118
53
8.39
.00
0
306
990
Valid
Missing
N
Mean
Median
Minimum
Maximum
Sum
JAILFULL jail operations full time
90 52.6 76.3 76.3
2 1.2 1.7 78.0
1 .6 .8 78.8
4 2.3 3.4 82.2
1 .6 .8 83.1
1 .6 .8 83.9
1 .6 .8 84.7
2 1.2 1.7 86.4
1 .6 .8 87.3
1 .6 .8 88.1
2 1.2 1.7 89.8
1 .6 .8 90.7
1 .6 .8 91.5
1 .6 .8 92.4
1 .6 .8 93.2
2 1.2 1.7 94.9
1 .6 .8 95.8
1 .6 .8 96.6
1 .6 .8 97.5
1 .6 .8 98.3
1 .6 .8 99.2
1 .6 .8 100.0
118 69.0 100.0
53 31.0
171 100.0
0
1
2
4
5
6
9
16
17
18
20
24
27
33
34
37
38
50
69
89
99
306
Total
Valid
SystemMissing
Total
Frequency Percent Valid PercentCumulative
Percent
Digitized by South Carolina State Library
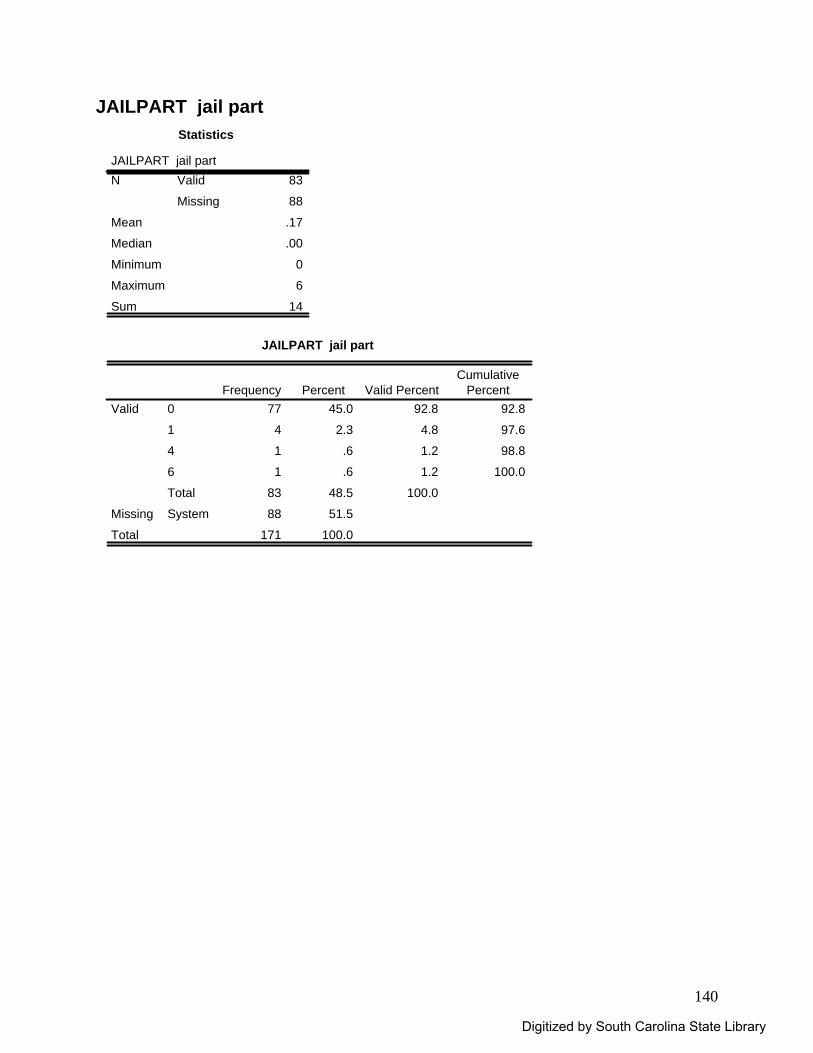
140
JAILPART jail part Statistics
JAILPART jail part83
88
.17
.00
0
6
14
Valid
Missing
N
Mean
Median
Minimum
Maximum
Sum
JAILPART jail part
77 45.0 92.8 92.8
4 2.3 4.8 97.6
1 .6 1.2 98.8
1 .6 1.2 100.0
83 48.5 100.0
88 51.5
171 100.0
0
1
4
6
Total
Valid
SystemMissing
Total
Frequency Percent Valid PercentCumulative
Percent
Digitized by South Carolina State Library
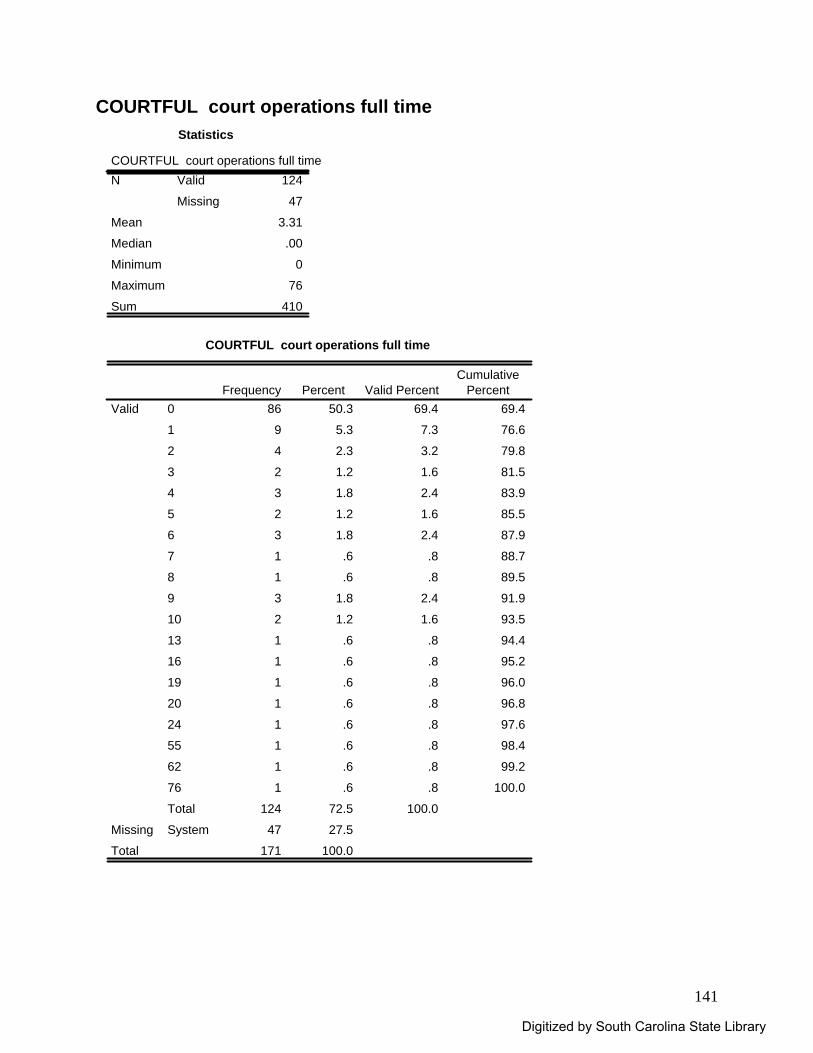
141
COURTFUL court operations full time Statistics
COURTFUL court operations full time124
47
3.31
.00
0
76
410
Valid
Missing
N
Mean
Median
Minimum
Maximum
Sum
COURTFUL court operations full time
86 50.3 69.4 69.4
9 5.3 7.3 76.6
4 2.3 3.2 79.8
2 1.2 1.6 81.5
3 1.8 2.4 83.9
2 1.2 1.6 85.5
3 1.8 2.4 87.9
1 .6 .8 88.7
1 .6 .8 89.5
3 1.8 2.4 91.9
2 1.2 1.6 93.5
1 .6 .8 94.4
1 .6 .8 95.2
1 .6 .8 96.0
1 .6 .8 96.8
1 .6 .8 97.6
1 .6 .8 98.4
1 .6 .8 99.2
1 .6 .8 100.0
124 72.5 100.0
47 27.5
171 100.0
0
1
2
3
4
5
6
7
8
9
10
13
16
19
20
24
55
62
76
Total
Valid
SystemMissing
Total
Frequency Percent Valid PercentCumulative
Percent
Digitized by South Carolina State Library
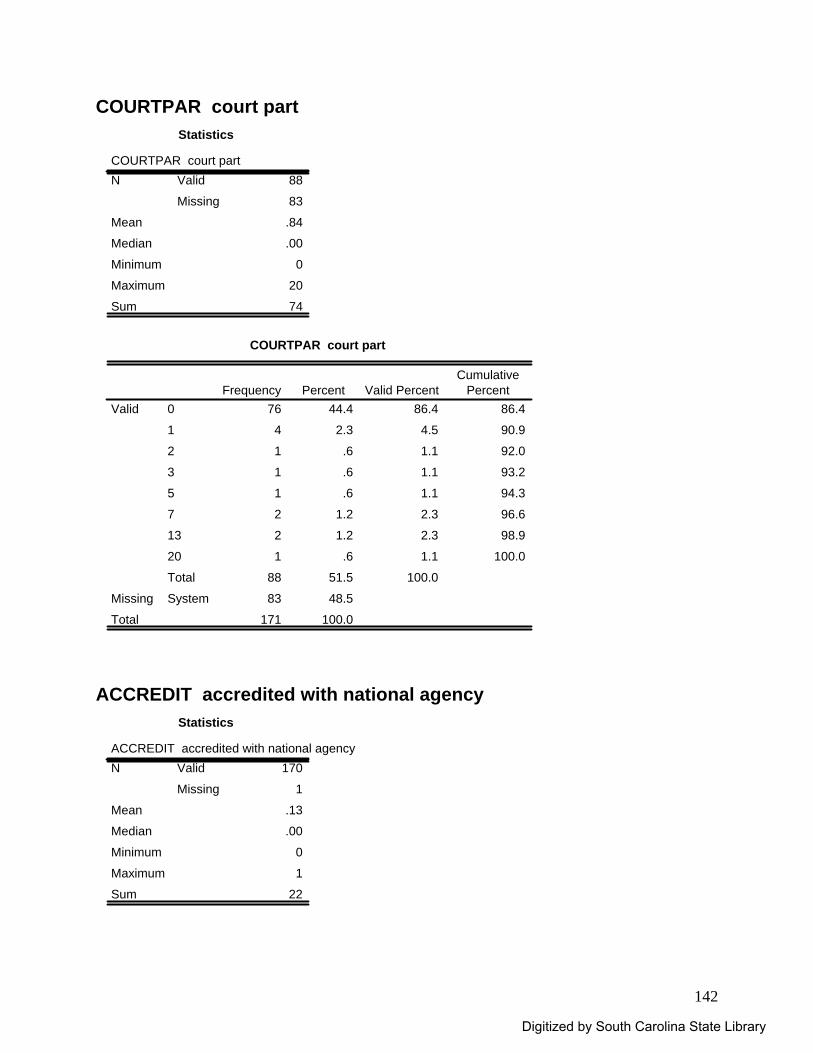
142
COURTPAR court part Statistics
COURTPAR court part88
83
.84
.00
0
20
74
Valid
Missing
N
Mean
Median
Minimum
Maximum
Sum
COURTPAR court part
76 44.4 86.4 86.4
4 2.3 4.5 90.9
1 .6 1.1 92.0
1 .6 1.1 93.2
1 .6 1.1 94.3
2 1.2 2.3 96.6
2 1.2 2.3 98.9
1 .6 1.1 100.0
88 51.5 100.0
83 48.5
171 100.0
0
1
2
3
5
7
13
20
Total
Valid
SystemMissing
Total
Frequency Percent Valid PercentCumulative
Percent
ACCREDIT accredited with national agency
Statistics
ACCREDIT accredited with national agency170
1
.13
.00
0
1
22
Valid
Missing
N
Mean
Median
Minimum
Maximum
Sum
Digitized by South Carolina State Library
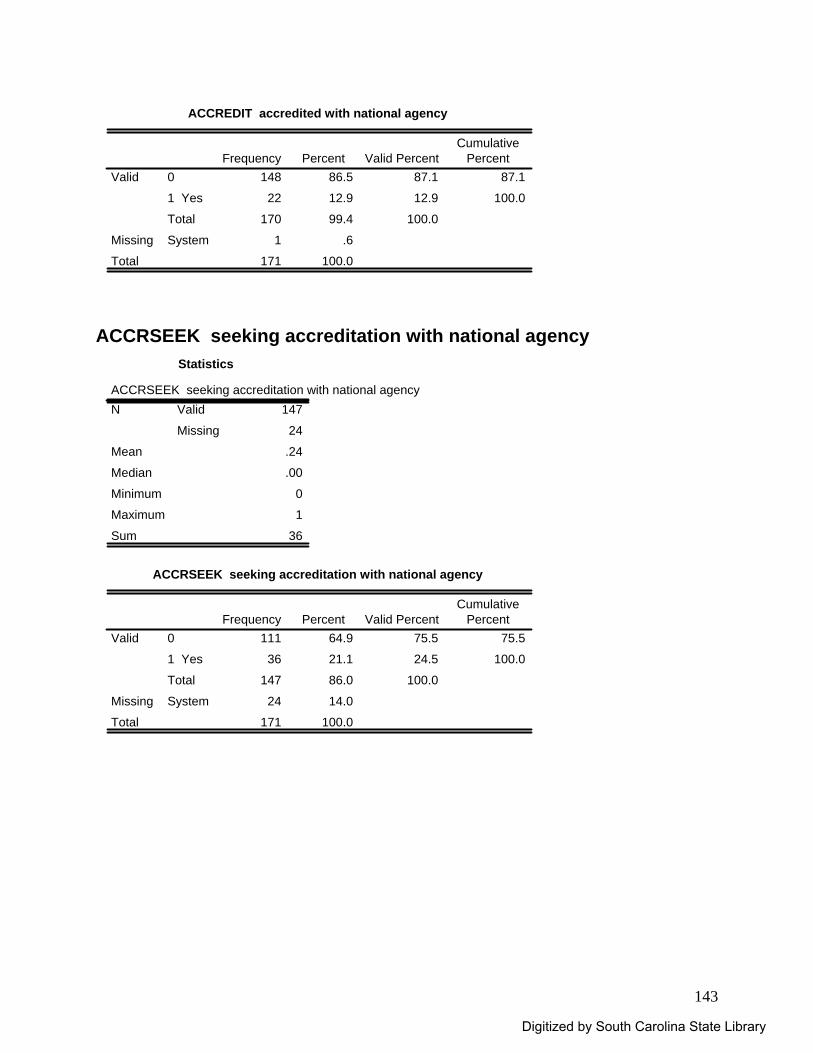
143
ACCREDIT accredited with national agency
148 86.5 87.1 87.1
22 12.9 12.9 100.0
170 99.4 100.0
1 .6
171 100.0
0
1 Yes
Total
Valid
SystemMissing
Total
Frequency Percent Valid PercentCumulative
Percent
ACCRSEEK seeking accreditation with national agency
Statistics
ACCRSEEK seeking accreditation with national agency147
24
.24
.00
0
1
36
Valid
Missing
N
Mean
Median
Minimum
Maximum
Sum
ACCRSEEK seeking accreditation with national agency
111 64.9 75.5 75.5
36 21.1 24.5 100.0
147 86.0 100.0
24 14.0
171 100.0
0
1 Yes
Total
Valid
SystemMissing
Total
Frequency Percent Valid PercentCumulative
Percent
Digitized by South Carolina State Library
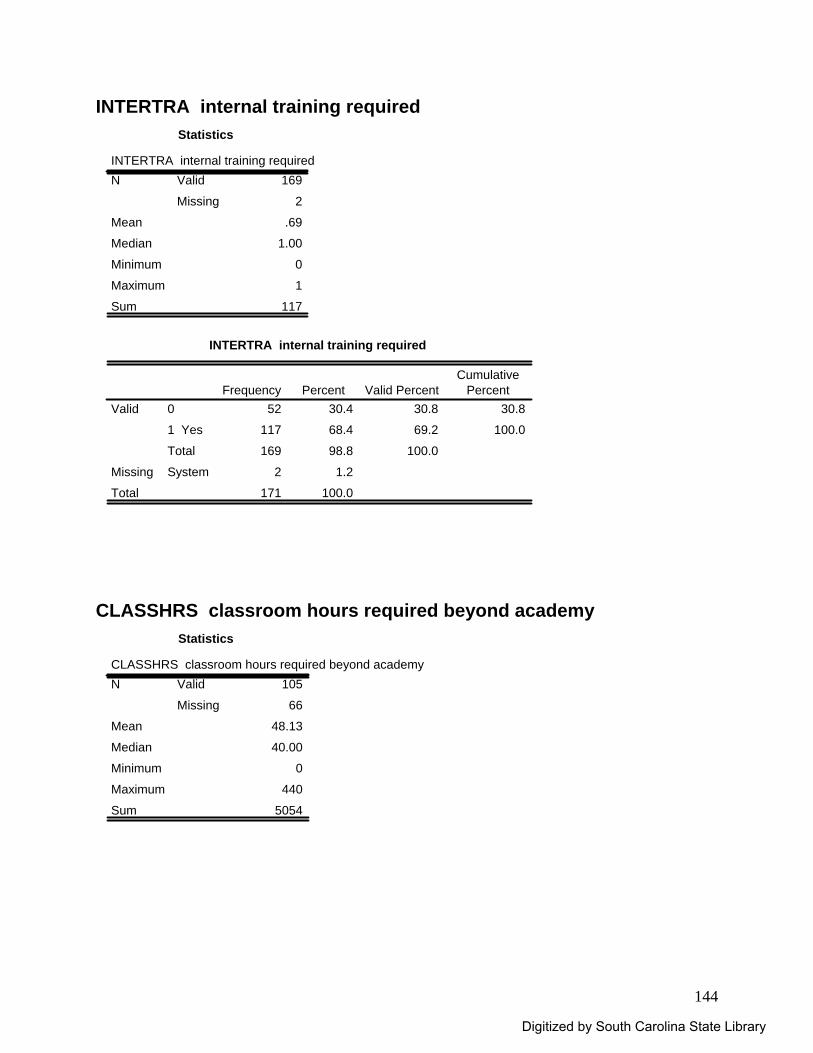
144
INTERTRA internal training required Statistics
INTERTRA internal training required169
2
.69
1.00
0
1
117
Valid
Missing
N
Mean
Median
Minimum
Maximum
Sum
INTERTRA internal training required
52 30.4 30.8 30.8
117 68.4 69.2 100.0
169 98.8 100.0
2 1.2
171 100.0
0
1 Yes
Total
Valid
SystemMissing
Total
Frequency Percent Valid PercentCumulative
Percent
CLASSHRS classroom hours required beyond academy
Statistics
CLASSHRS classroom hours required beyond academy105
66
48.13
40.00
0
440
5054
Valid
Missing
N
Mean
Median
Minimum
Maximum
Sum
Digitized by South Carolina State Library
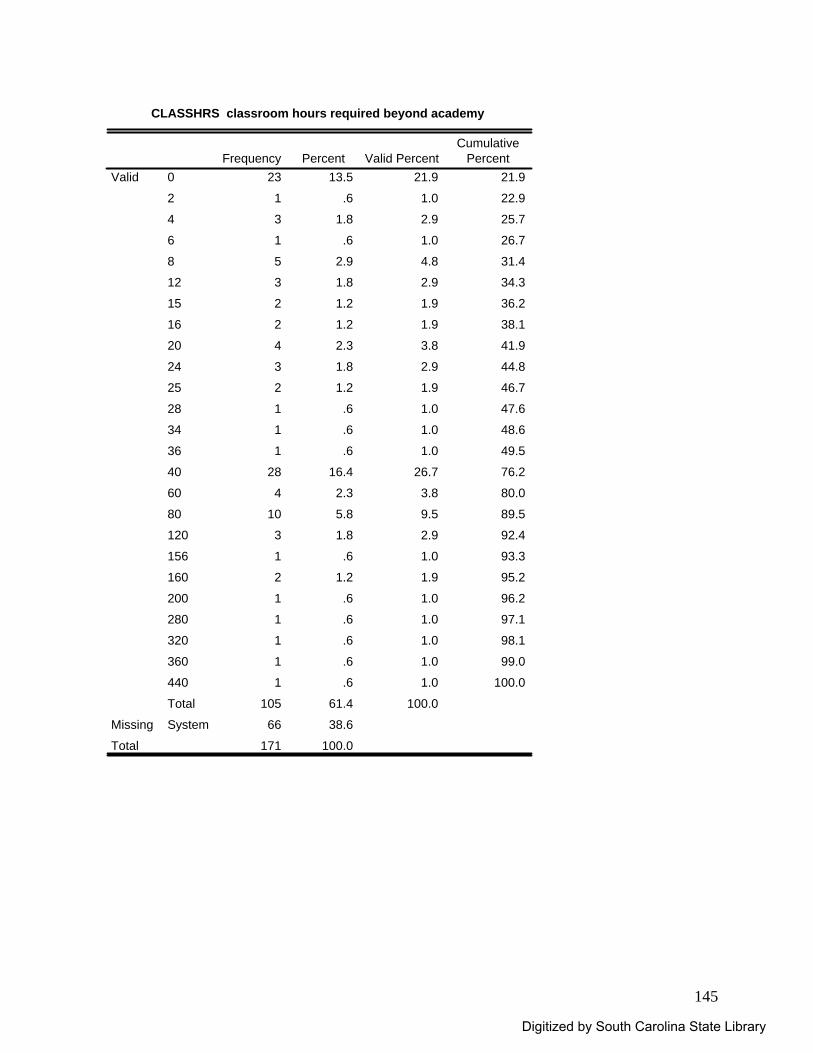
145
CLASSHRS classroom hours required beyond academy
23 13.5 21.9 21.9
1 .6 1.0 22.9
3 1.8 2.9 25.7
1 .6 1.0 26.7
5 2.9 4.8 31.4
3 1.8 2.9 34.3
2 1.2 1.9 36.2
2 1.2 1.9 38.1
4 2.3 3.8 41.9
3 1.8 2.9 44.8
2 1.2 1.9 46.7
1 .6 1.0 47.6
1 .6 1.0 48.6
1 .6 1.0 49.5
28 16.4 26.7 76.2
4 2.3 3.8 80.0
10 5.8 9.5 89.5
3 1.8 2.9 92.4
1 .6 1.0 93.3
2 1.2 1.9 95.2
1 .6 1.0 96.2
1 .6 1.0 97.1
1 .6 1.0 98.1
1 .6 1.0 99.0
1 .6 1.0 100.0
105 61.4 100.0
66 38.6
171 100.0
0
2
4
6
8
12
15
16
20
24
25
28
34
36
40
60
80
120
156
160
200
280
320
360
440
Total
Valid
SystemMissing
Total
Frequency Percent Valid PercentCumulative
Percent
Digitized by South Carolina State Library
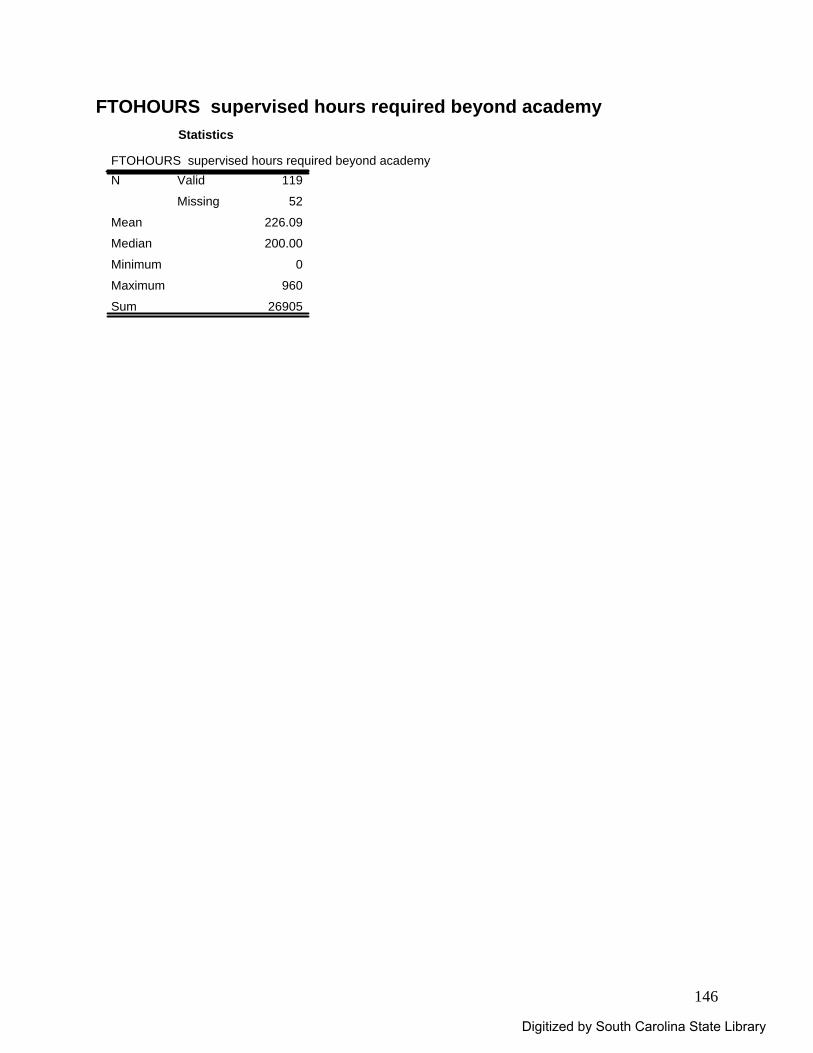
146
FTOHOURS supervised hours required beyond academy Statistics
FTOHOURS supervised hours required beyond academy119
52
226.09
200.00
0
960
26905
Valid
Missing
N
Mean
Median
Minimum
Maximum
Sum
Digitized by South Carolina State Library
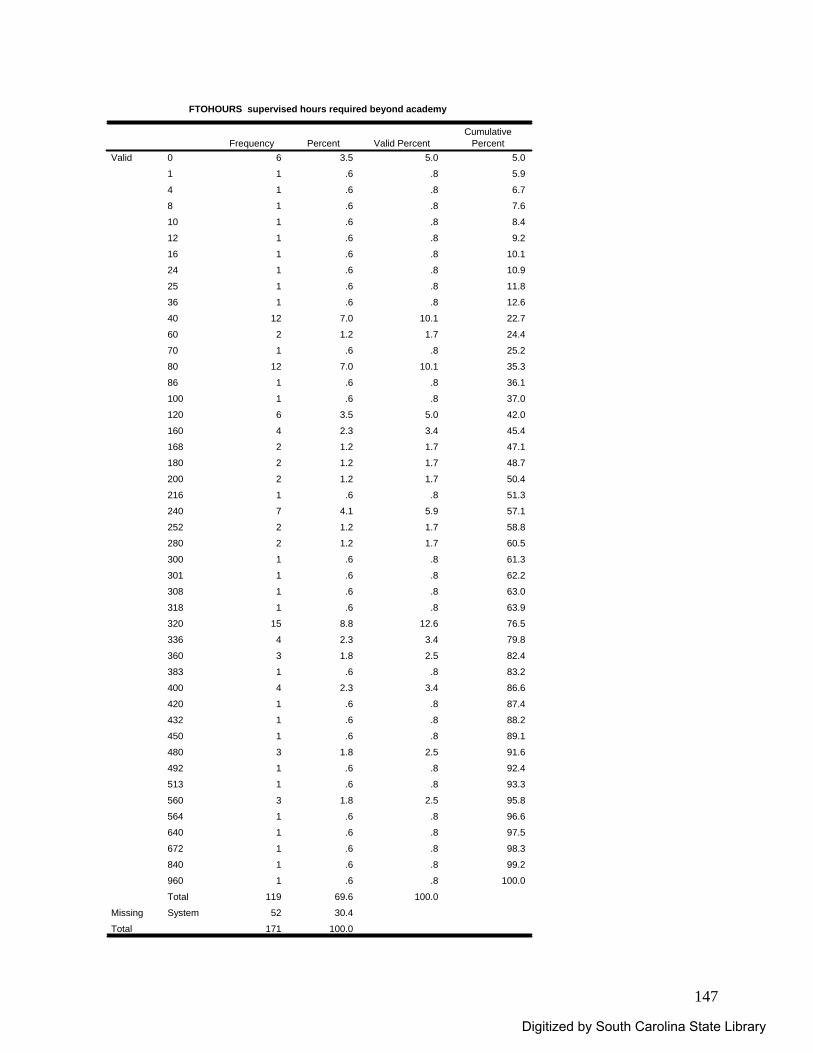
147
FTOHOURS supervised hours required beyond academy
6 3.5 5.0 5.0
1 .6 .8 5.9
1 .6 .8 6.7
1 .6 .8 7.6
1 .6 .8 8.4
1 .6 .8 9.2
1 .6 .8 10.1
1 .6 .8 10.9
1 .6 .8 11.8
1 .6 .8 12.6
12 7.0 10.1 22.7
2 1.2 1.7 24.4
1 .6 .8 25.2
12 7.0 10.1 35.3
1 .6 .8 36.1
1 .6 .8 37.0
6 3.5 5.0 42.0
4 2.3 3.4 45.4
2 1.2 1.7 47.1
2 1.2 1.7 48.7
2 1.2 1.7 50.4
1 .6 .8 51.3
7 4.1 5.9 57.1
2 1.2 1.7 58.8
2 1.2 1.7 60.5
1 .6 .8 61.3
1 .6 .8 62.2
1 .6 .8 63.0
1 .6 .8 63.9
15 8.8 12.6 76.5
4 2.3 3.4 79.8
3 1.8 2.5 82.4
1 .6 .8 83.2
4 2.3 3.4 86.6
1 .6 .8 87.4
1 .6 .8 88.2
1 .6 .8 89.1
3 1.8 2.5 91.6
1 .6 .8 92.4
1 .6 .8 93.3
3 1.8 2.5 95.8
1 .6 .8 96.6
1 .6 .8 97.5
1 .6 .8 98.3
1 .6 .8 99.2
1 .6 .8 100.0
119 69.6 100.0
52 30.4
171 100.0
0
1
4
8
10
12
16
24
25
36
40
60
70
80
86
100
120
160
168
180
200
216
240
252
280
300
301
308
318
320
336
360
383
400
420
432
450
480
492
513
560
564
640
672
840
960
Total
Valid
SystemMissing
Total
Frequency Percent Valid PercentCumulative
Percent
Digitized by South Carolina State Library
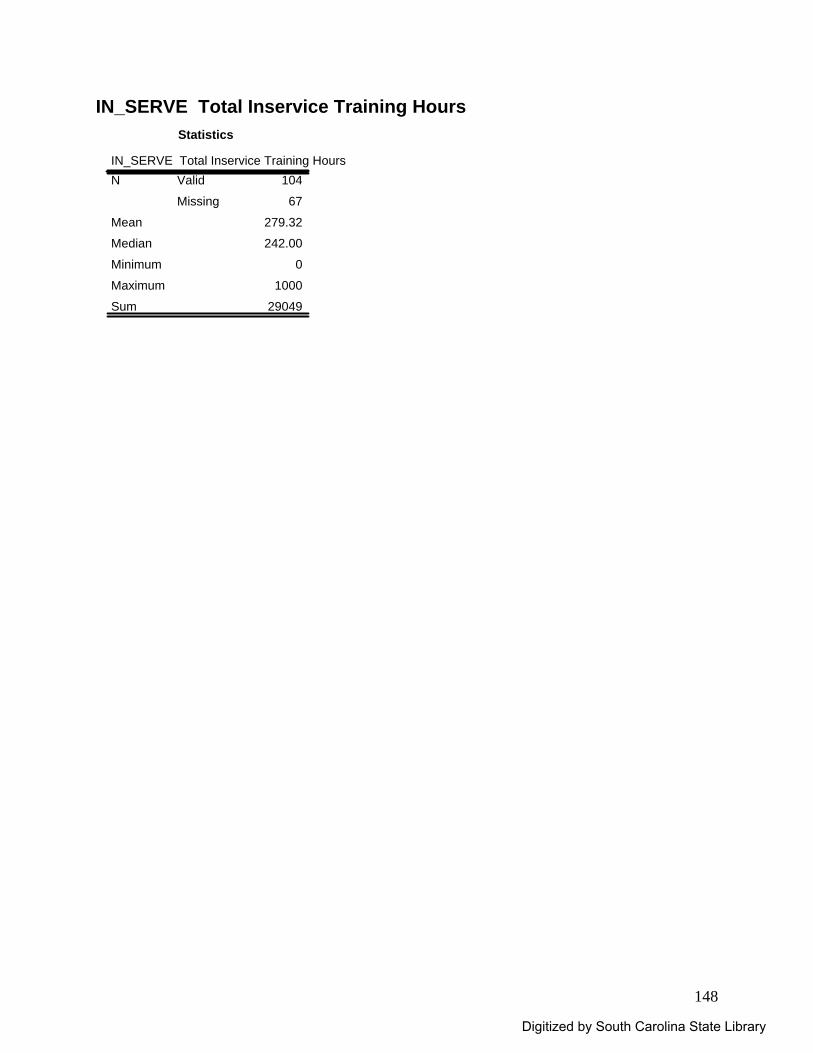
148
IN_SERVE Total Inservice Training Hours Statistics
IN_SERVE Total Inservice Training Hours104
67
279.32
242.00
0
1000
29049
Valid
Missing
N
Mean
Median
Minimum
Maximum
Sum
Digitized by South Carolina State Library
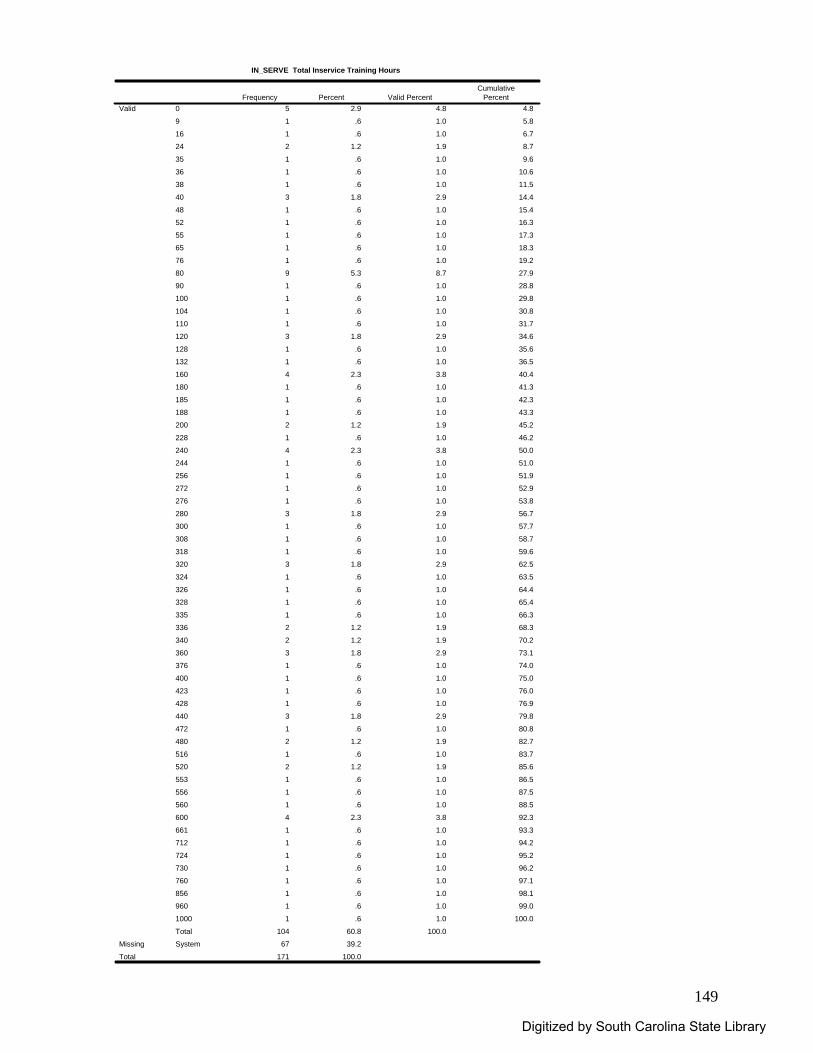
149
IN_SERVE Total Inservice Training Hours
5 2.9 4.8 4.8
1 .6 1.0 5.8
1 .6 1.0 6.7
2 1.2 1.9 8.7
1 .6 1.0 9.6
1 .6 1.0 10.6
1 .6 1.0 11.5
3 1.8 2.9 14.4
1 .6 1.0 15.4
1 .6 1.0 16.3
1 .6 1.0 17.3
1 .6 1.0 18.3
1 .6 1.0 19.2
9 5.3 8.7 27.9
1 .6 1.0 28.8
1 .6 1.0 29.8
1 .6 1.0 30.8
1 .6 1.0 31.7
3 1.8 2.9 34.6
1 .6 1.0 35.6
1 .6 1.0 36.5
4 2.3 3.8 40.4
1 .6 1.0 41.3
1 .6 1.0 42.3
1 .6 1.0 43.3
2 1.2 1.9 45.2
1 .6 1.0 46.2
4 2.3 3.8 50.0
1 .6 1.0 51.0
1 .6 1.0 51.9
1 .6 1.0 52.9
1 .6 1.0 53.8
3 1.8 2.9 56.7
1 .6 1.0 57.7
1 .6 1.0 58.7
1 .6 1.0 59.6
3 1.8 2.9 62.5
1 .6 1.0 63.5
1 .6 1.0 64.4
1 .6 1.0 65.4
1 .6 1.0 66.3
2 1.2 1.9 68.3
2 1.2 1.9 70.2
3 1.8 2.9 73.1
1 .6 1.0 74.0
1 .6 1.0 75.0
1 .6 1.0 76.0
1 .6 1.0 76.9
3 1.8 2.9 79.8
1 .6 1.0 80.8
2 1.2 1.9 82.7
1 .6 1.0 83.7
2 1.2 1.9 85.6
1 .6 1.0 86.5
1 .6 1.0 87.5
1 .6 1.0 88.5
4 2.3 3.8 92.3
1 .6 1.0 93.3
1 .6 1.0 94.2
1 .6 1.0 95.2
1 .6 1.0 96.2
1 .6 1.0 97.1
1 .6 1.0 98.1
1 .6 1.0 99.0
1 .6 1.0 100.0
104 60.8 100.0
67 39.2
171 100.0
0
9
16
24
35
36
38
40
48
52
55
65
76
80
90
100
104
110
120
128
132
160
180
185
188
200
228
240
244
256
272
276
280
300
308
318
320
324
326
328
335
336
340
360
376
400
423
428
440
472
480
516
520
553
556
560
600
661
712
724
730
760
856
960
1000
Total
Valid
SystemMissing
Total
Frequency Percent Valid PercentCumulative
Percent
Digitized by South Carolina State Library
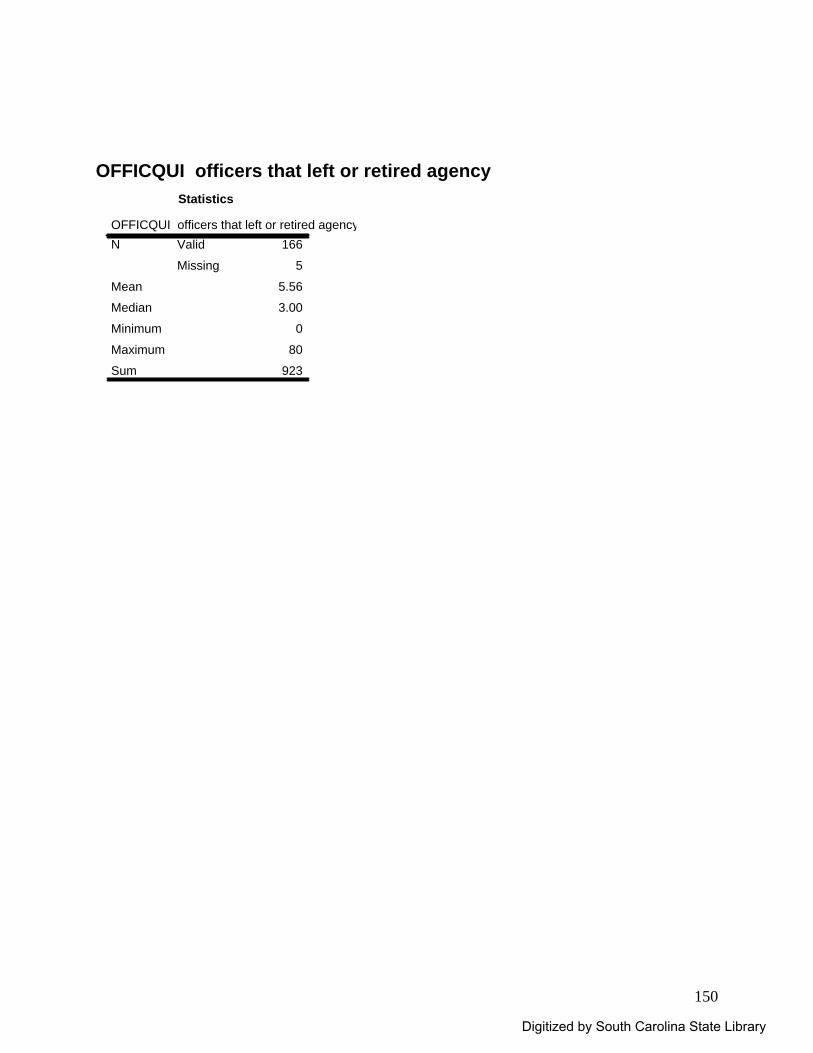
150
OFFICQUI officers that left or retired agency
Statistics
OFFICQUI officers that left or retired agency166
5
5.56
3.00
0
80
923
Valid
Missing
N
Mean
Median
Minimum
Maximum
Sum
Digitized by South Carolina State Library
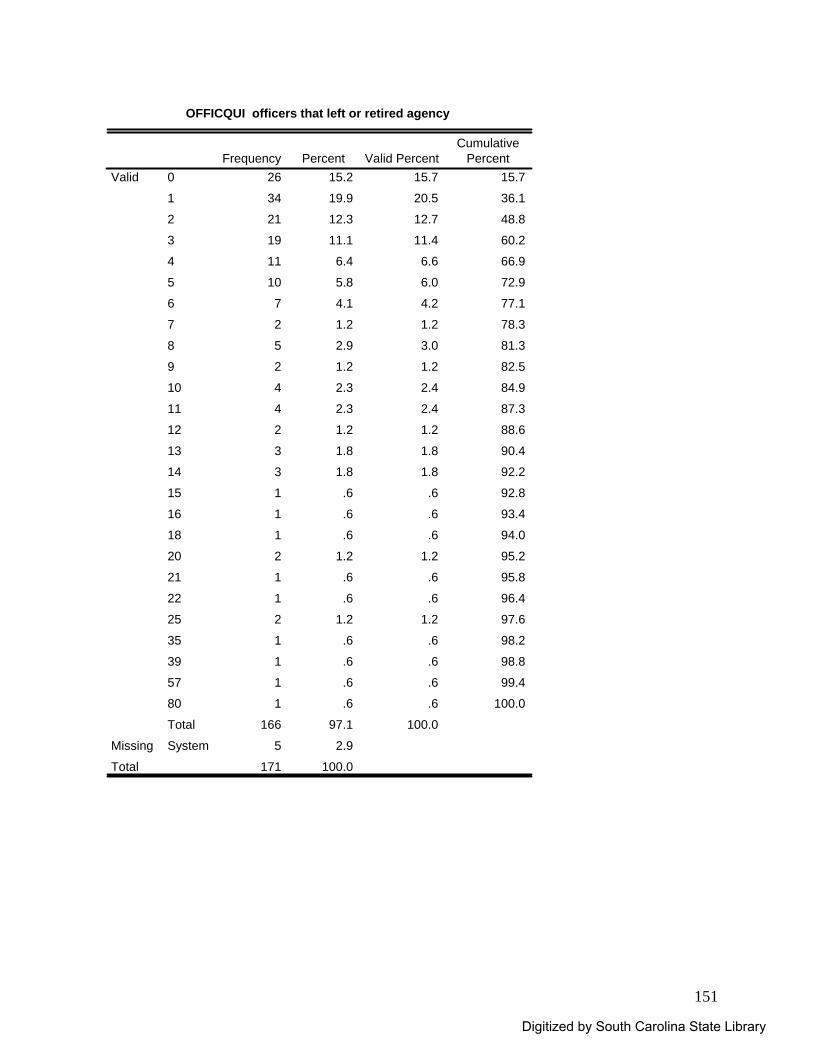
151
OFFICQUI officers that left or retired agency
26 15.2 15.7 15.7
34 19.9 20.5 36.1
21 12.3 12.7 48.8
19 11.1 11.4 60.2
11 6.4 6.6 66.9
10 5.8 6.0 72.9
7 4.1 4.2 77.1
2 1.2 1.2 78.3
5 2.9 3.0 81.3
2 1.2 1.2 82.5
4 2.3 2.4 84.9
4 2.3 2.4 87.3
2 1.2 1.2 88.6
3 1.8 1.8 90.4
3 1.8 1.8 92.2
1 .6 .6 92.8
1 .6 .6 93.4
1 .6 .6 94.0
2 1.2 1.2 95.2
1 .6 .6 95.8
1 .6 .6 96.4
2 1.2 1.2 97.6
1 .6 .6 98.2
1 .6 .6 98.8
1 .6 .6 99.4
1 .6 .6 100.0
166 97.1 100.0
5 2.9
171 100.0
0
1
2
3
4
5
6
7
8
9
10
11
12
13
14
15
16
18
20
21
22
25
35
39
57
80
Total
Valid
SystemMissing
Total
Frequency Percent Valid PercentCumulative
Percent
Digitized by South Carolina State Library
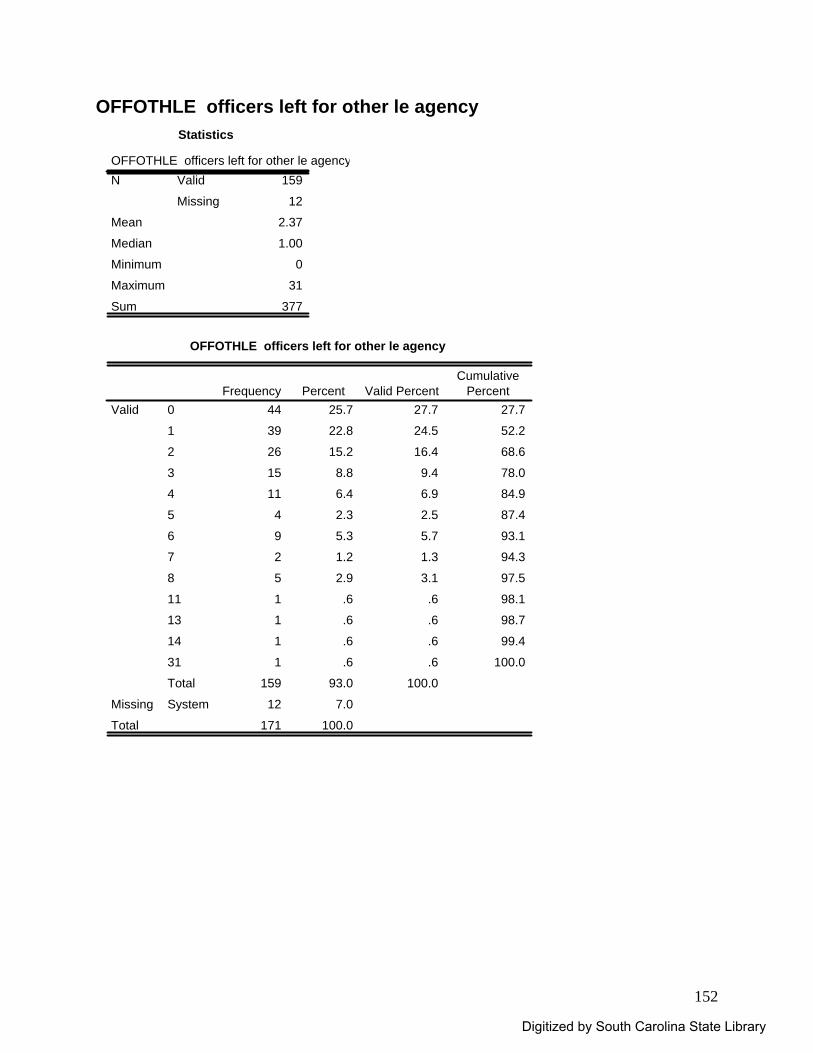
152
OFFOTHLE officers left for other le agency Statistics
OFFOTHLE officers left for other le agency159
12
2.37
1.00
0
31
377
Valid
Missing
N
Mean
Median
Minimum
Maximum
Sum
OFFOTHLE officers left for other le agency
44 25.7 27.7 27.7
39 22.8 24.5 52.2
26 15.2 16.4 68.6
15 8.8 9.4 78.0
11 6.4 6.9 84.9
4 2.3 2.5 87.4
9 5.3 5.7 93.1
2 1.2 1.3 94.3
5 2.9 3.1 97.5
1 .6 .6 98.1
1 .6 .6 98.7
1 .6 .6 99.4
1 .6 .6 100.0
159 93.0 100.0
12 7.0
171 100.0
0
1
2
3
4
5
6
7
8
11
13
14
31
Total
Valid
SystemMissing
Total
Frequency Percent Valid PercentCumulative
Percent
Digitized by South Carolina State Library
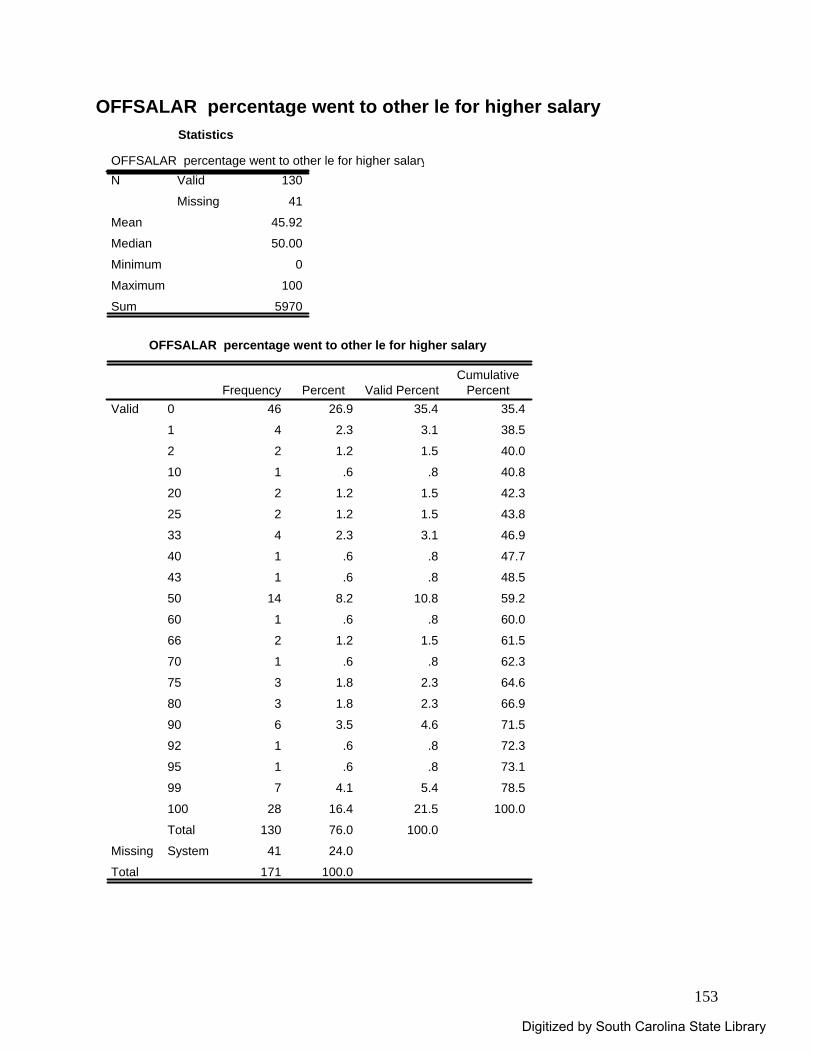
153
OFFSALAR percentage went to other le for higher salary Statistics
OFFSALAR percentage went to other le for higher salary130
41
45.92
50.00
0
100
5970
Valid
Missing
N
Mean
Median
Minimum
Maximum
Sum
OFFSALAR percentage went to other le for higher salary
46 26.9 35.4 35.4
4 2.3 3.1 38.5
2 1.2 1.5 40.0
1 .6 .8 40.8
2 1.2 1.5 42.3
2 1.2 1.5 43.8
4 2.3 3.1 46.9
1 .6 .8 47.7
1 .6 .8 48.5
14 8.2 10.8 59.2
1 .6 .8 60.0
2 1.2 1.5 61.5
1 .6 .8 62.3
3 1.8 2.3 64.6
3 1.8 2.3 66.9
6 3.5 4.6 71.5
1 .6 .8 72.3
1 .6 .8 73.1
7 4.1 5.4 78.5
28 16.4 21.5 100.0
130 76.0 100.0
41 24.0
171 100.0
0
1
2
10
20
25
33
40
43
50
60
66
70
75
80
90
92
95
99
100
Total
Valid
SystemMissing
Total
Frequency Percent Valid PercentCumulative
Percent
Digitized by South Carolina State Library
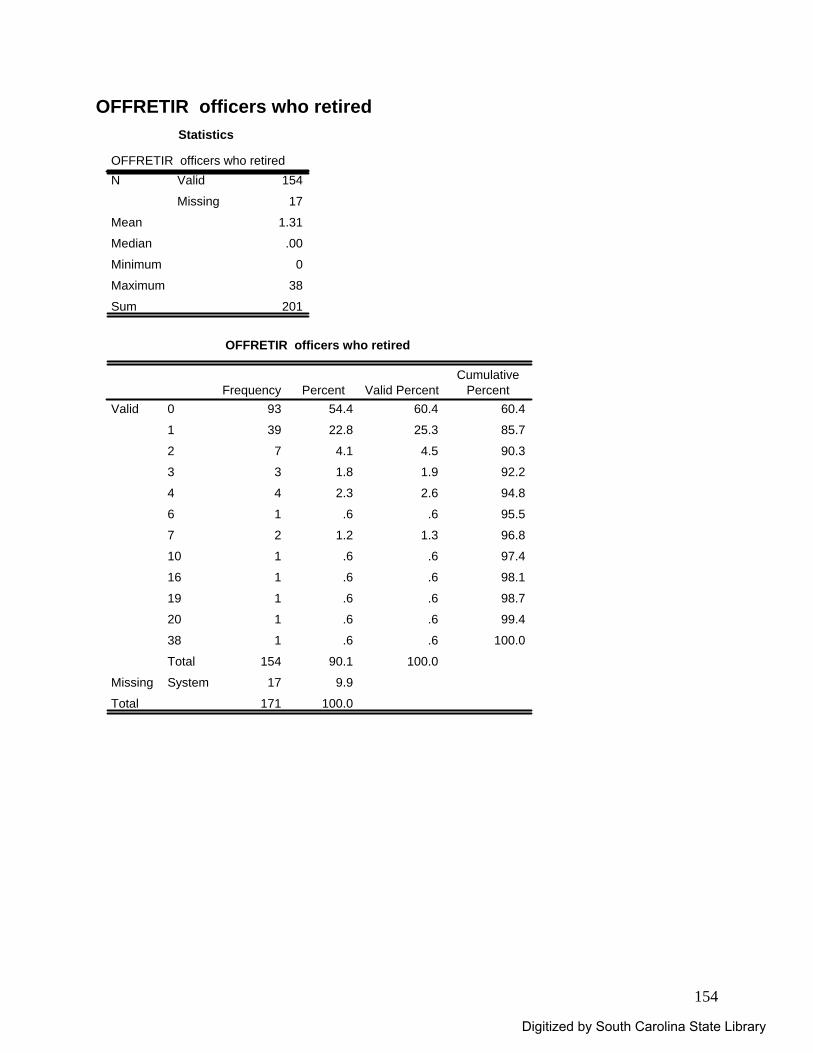
154
OFFRETIR officers who retired Statistics
OFFRETIR officers who retired154
17
1.31
.00
0
38
201
Valid
Missing
N
Mean
Median
Minimum
Maximum
Sum
OFFRETIR officers who retired
93 54.4 60.4 60.4
39 22.8 25.3 85.7
7 4.1 4.5 90.3
3 1.8 1.9 92.2
4 2.3 2.6 94.8
1 .6 .6 95.5
2 1.2 1.3 96.8
1 .6 .6 97.4
1 .6 .6 98.1
1 .6 .6 98.7
1 .6 .6 99.4
1 .6 .6 100.0
154 90.1 100.0
17 9.9
171 100.0
0
1
2
3
4
6
7
10
16
19
20
38
Total
Valid
SystemMissing
Total
Frequency Percent Valid PercentCumulative
Percent
Digitized by South Carolina State Library
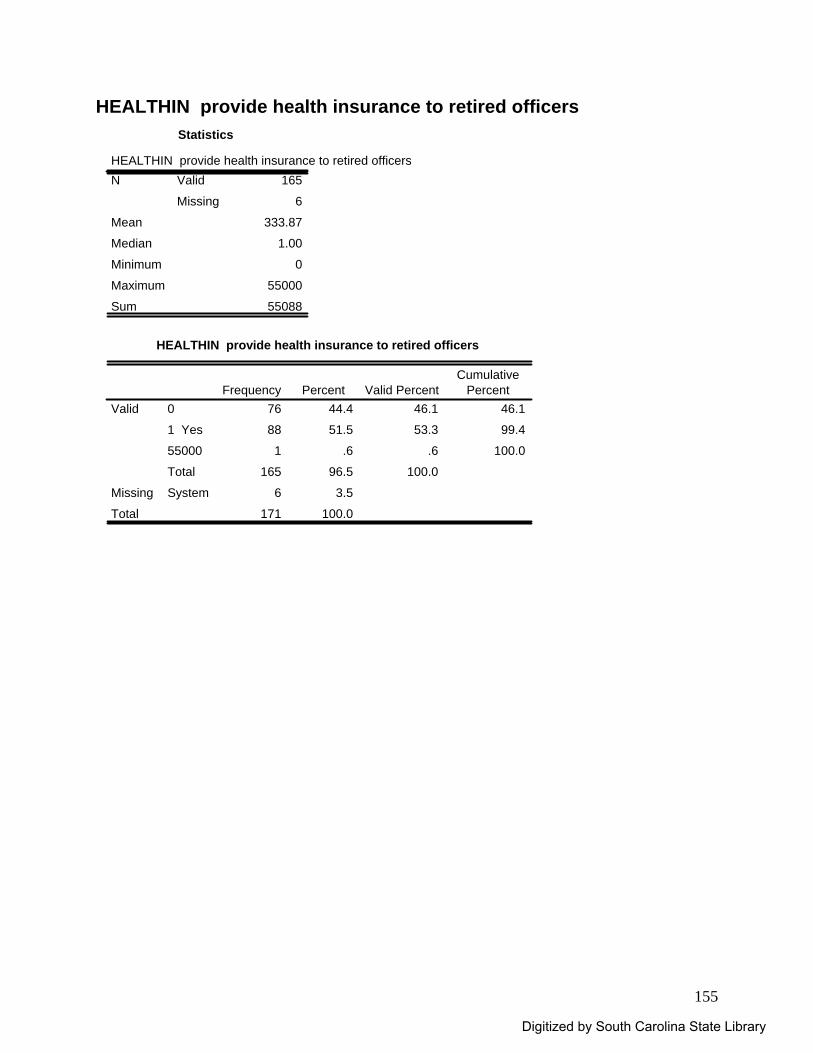
155
HEALTHIN provide health insurance to retired officers Statistics
HEALTHIN provide health insurance to retired officers165
6
333.87
1.00
0
55000
55088
Valid
Missing
N
Mean
Median
Minimum
Maximum
Sum
HEALTHIN provide health insurance to retired officers
76 44.4 46.1 46.1
88 51.5 53.3 99.4
1 .6 .6 100.0
165 96.5 100.0
6 3.5
171 100.0
0
1 Yes
55000
Total
Valid
SystemMissing
Total
Frequency Percent Valid PercentCumulative
Percent
Digitized by South Carolina State Library
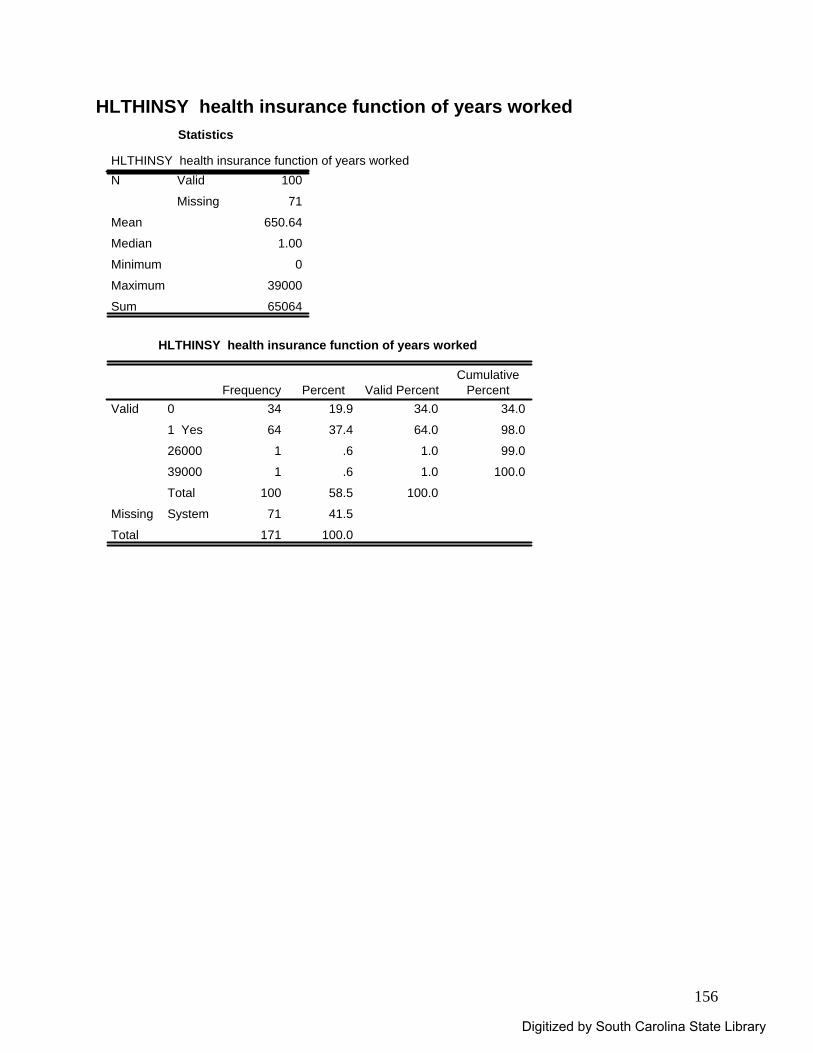
156
HLTHINSY health insurance function of years worked Statistics
HLTHINSY health insurance function of years worked100
71
650.64
1.00
0
39000
65064
Valid
Missing
N
Mean
Median
Minimum
Maximum
Sum
HLTHINSY health insurance function of years worked
34 19.9 34.0 34.0
64 37.4 64.0 98.0
1 .6 1.0 99.0
1 .6 1.0 100.0
100 58.5 100.0
71 41.5
171 100.0
0
1 Yes
26000
39000
Total
Valid
SystemMissing
Total
Frequency Percent Valid PercentCumulative
Percent
Digitized by South Carolina State Library
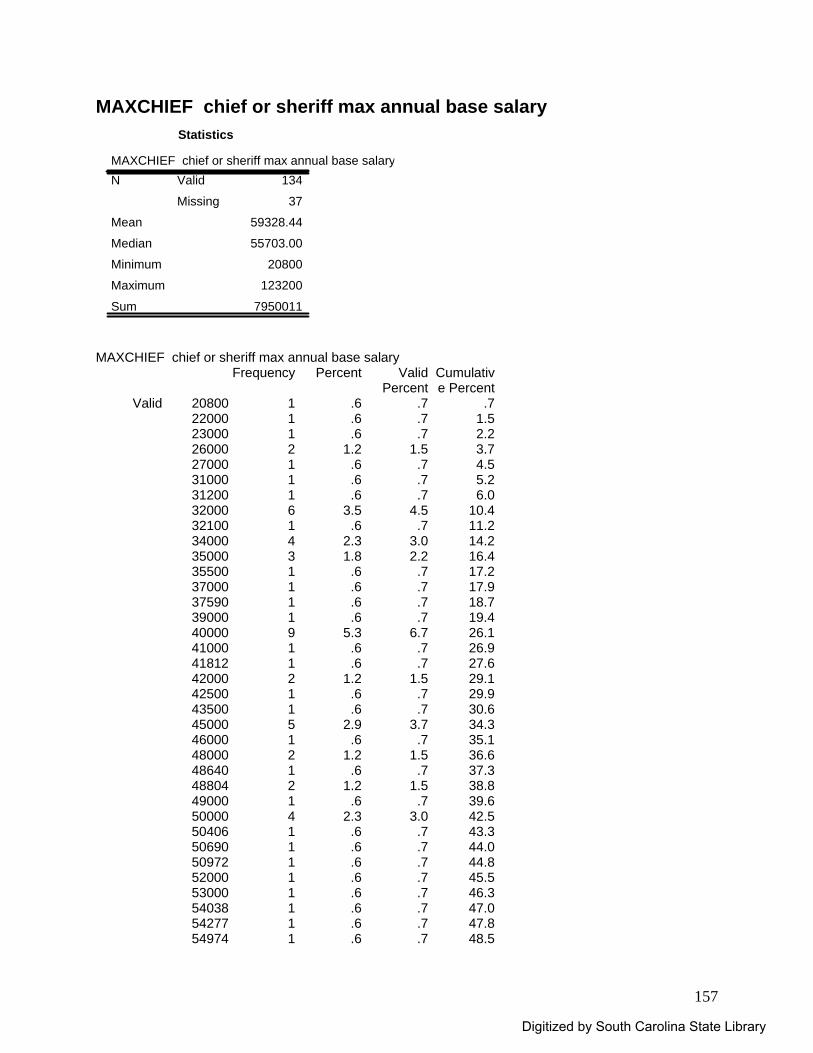
157
MAXCHIEF chief or sheriff max annual base salary Statistics
MAXCHIEF chief or sheriff max annual base salary134
37
59328.44
55703.00
20800
123200
7950011
Valid
Missing
N
Mean
Median
Minimum
Maximum
Sum
MAXCHIEF chief or sheriff max annual base salary
Frequency Percent Valid Percent
Cumulative Percent
Valid 20800 1 .6 .7 .722000 1 .6 .7 1.523000 1 .6 .7 2.226000 2 1.2 1.5 3.727000 1 .6 .7 4.531000 1 .6 .7 5.231200 1 .6 .7 6.032000 6 3.5 4.5 10.432100 1 .6 .7 11.234000 4 2.3 3.0 14.235000 3 1.8 2.2 16.435500 1 .6 .7 17.237000 1 .6 .7 17.937590 1 .6 .7 18.739000 1 .6 .7 19.440000 9 5.3 6.7 26.141000 1 .6 .7 26.941812 1 .6 .7 27.642000 2 1.2 1.5 29.142500 1 .6 .7 29.943500 1 .6 .7 30.645000 5 2.9 3.7 34.346000 1 .6 .7 35.148000 2 1.2 1.5 36.648640 1 .6 .7 37.348804 2 1.2 1.5 38.849000 1 .6 .7 39.650000 4 2.3 3.0 42.550406 1 .6 .7 43.350690 1 .6 .7 44.050972 1 .6 .7 44.852000 1 .6 .7 45.553000 1 .6 .7 46.354038 1 .6 .7 47.054277 1 .6 .7 47.854974 1 .6 .7 48.5
Digitized by South Carolina State Library
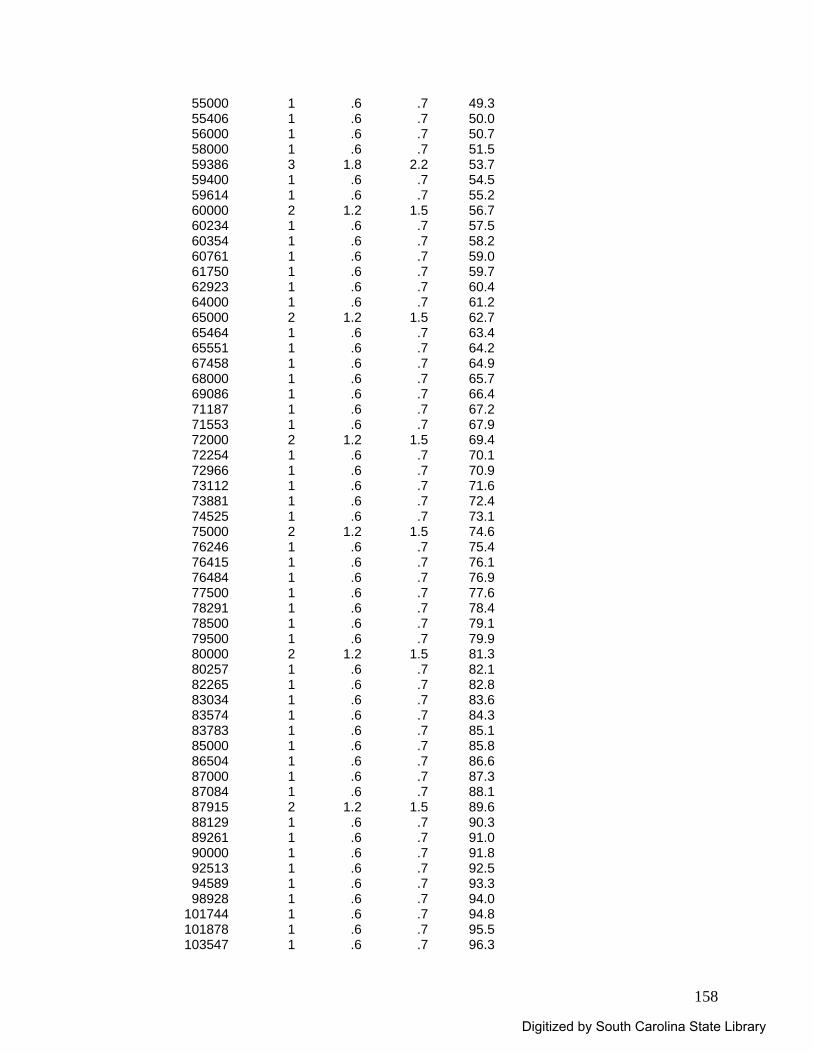
158
55000 1 .6 .7 49.355406 1 .6 .7 50.056000 1 .6 .7 50.758000 1 .6 .7 51.559386 3 1.8 2.2 53.759400 1 .6 .7 54.559614 1 .6 .7 55.260000 2 1.2 1.5 56.760234 1 .6 .7 57.560354 1 .6 .7 58.260761 1 .6 .7 59.061750 1 .6 .7 59.762923 1 .6 .7 60.464000 1 .6 .7 61.265000 2 1.2 1.5 62.765464 1 .6 .7 63.465551 1 .6 .7 64.267458 1 .6 .7 64.968000 1 .6 .7 65.769086 1 .6 .7 66.471187 1 .6 .7 67.271553 1 .6 .7 67.972000 2 1.2 1.5 69.472254 1 .6 .7 70.172966 1 .6 .7 70.973112 1 .6 .7 71.673881 1 .6 .7 72.474525 1 .6 .7 73.175000 2 1.2 1.5 74.676246 1 .6 .7 75.476415 1 .6 .7 76.176484 1 .6 .7 76.977500 1 .6 .7 77.678291 1 .6 .7 78.478500 1 .6 .7 79.179500 1 .6 .7 79.980000 2 1.2 1.5 81.380257 1 .6 .7 82.182265 1 .6 .7 82.883034 1 .6 .7 83.683574 1 .6 .7 84.383783 1 .6 .7 85.185000 1 .6 .7 85.886504 1 .6 .7 86.687000 1 .6 .7 87.387084 1 .6 .7 88.187915 2 1.2 1.5 89.688129 1 .6 .7 90.389261 1 .6 .7 91.090000 1 .6 .7 91.892513 1 .6 .7 92.594589 1 .6 .7 93.398928 1 .6 .7 94.0
101744 1 .6 .7 94.8101878 1 .6 .7 95.5103547 1 .6 .7 96.3
Digitized by South Carolina State Library
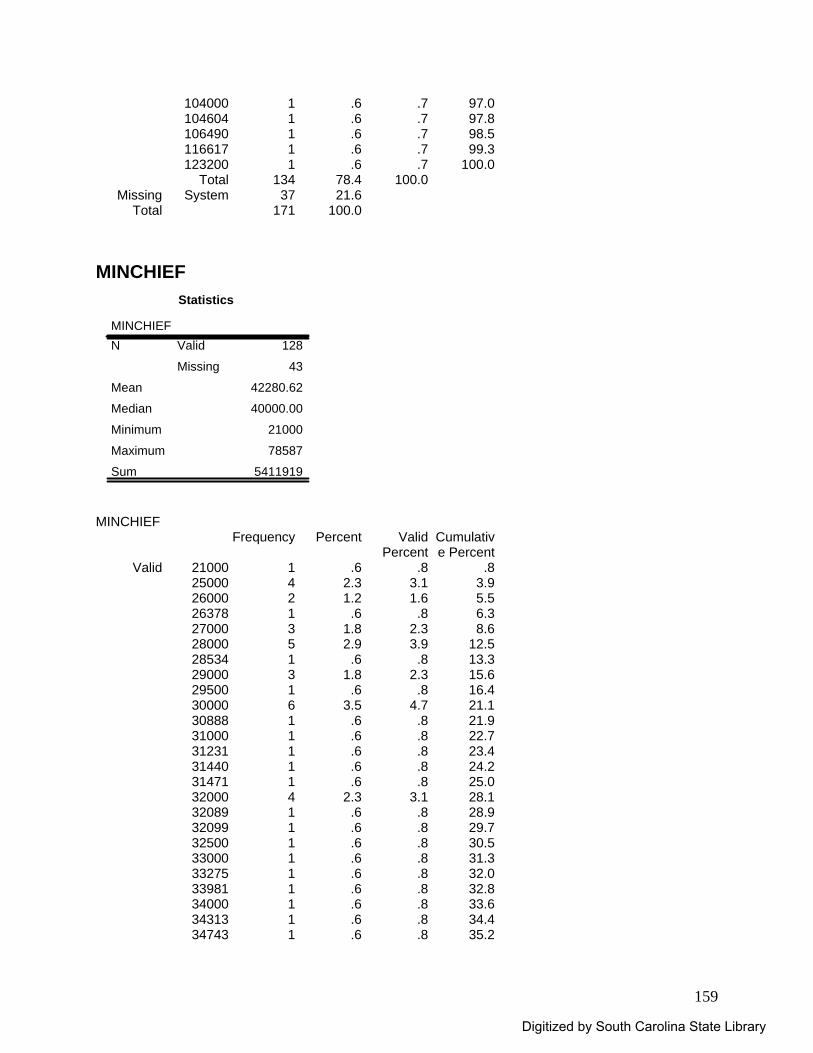
159
104000 1 .6 .7 97.0104604 1 .6 .7 97.8106490 1 .6 .7 98.5116617 1 .6 .7 99.3123200 1 .6 .7 100.0
Total 134 78.4 100.0Missing System 37 21.6
Total 171 100.0 MINCHIEF
Statistics
MINCHIEF128
43
42280.62
40000.00
21000
78587
5411919
Valid
Missing
N
Mean
Median
Minimum
Maximum
Sum
MINCHIEF
Frequency Percent Valid Percent
Cumulative Percent
Valid 21000 1 .6 .8 .825000 4 2.3 3.1 3.926000 2 1.2 1.6 5.526378 1 .6 .8 6.327000 3 1.8 2.3 8.628000 5 2.9 3.9 12.528534 1 .6 .8 13.329000 3 1.8 2.3 15.629500 1 .6 .8 16.430000 6 3.5 4.7 21.130888 1 .6 .8 21.931000 1 .6 .8 22.731231 1 .6 .8 23.431440 1 .6 .8 24.231471 1 .6 .8 25.032000 4 2.3 3.1 28.132089 1 .6 .8 28.932099 1 .6 .8 29.732500 1 .6 .8 30.533000 1 .6 .8 31.333275 1 .6 .8 32.033981 1 .6 .8 32.834000 1 .6 .8 33.634313 1 .6 .8 34.434743 1 .6 .8 35.2
Digitized by South Carolina State Library
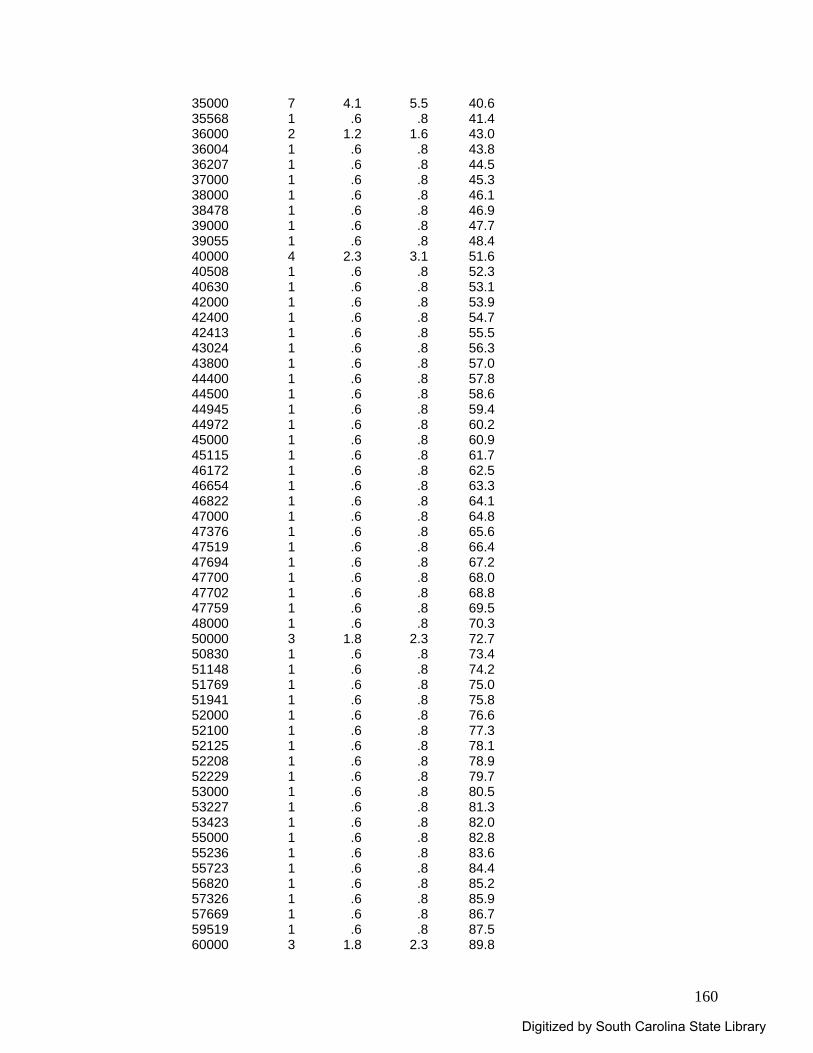
160
35000 7 4.1 5.5 40.635568 1 .6 .8 41.436000 2 1.2 1.6 43.036004 1 .6 .8 43.836207 1 .6 .8 44.537000 1 .6 .8 45.338000 1 .6 .8 46.138478 1 .6 .8 46.939000 1 .6 .8 47.739055 1 .6 .8 48.440000 4 2.3 3.1 51.640508 1 .6 .8 52.340630 1 .6 .8 53.142000 1 .6 .8 53.942400 1 .6 .8 54.742413 1 .6 .8 55.543024 1 .6 .8 56.343800 1 .6 .8 57.044400 1 .6 .8 57.844500 1 .6 .8 58.644945 1 .6 .8 59.444972 1 .6 .8 60.245000 1 .6 .8 60.945115 1 .6 .8 61.746172 1 .6 .8 62.546654 1 .6 .8 63.346822 1 .6 .8 64.147000 1 .6 .8 64.847376 1 .6 .8 65.647519 1 .6 .8 66.447694 1 .6 .8 67.247700 1 .6 .8 68.047702 1 .6 .8 68.847759 1 .6 .8 69.548000 1 .6 .8 70.350000 3 1.8 2.3 72.750830 1 .6 .8 73.451148 1 .6 .8 74.251769 1 .6 .8 75.051941 1 .6 .8 75.852000 1 .6 .8 76.652100 1 .6 .8 77.352125 1 .6 .8 78.152208 1 .6 .8 78.952229 1 .6 .8 79.753000 1 .6 .8 80.553227 1 .6 .8 81.353423 1 .6 .8 82.055000 1 .6 .8 82.855236 1 .6 .8 83.655723 1 .6 .8 84.456820 1 .6 .8 85.257326 1 .6 .8 85.957669 1 .6 .8 86.759519 1 .6 .8 87.560000 3 1.8 2.3 89.8
Digitized by South Carolina State Library
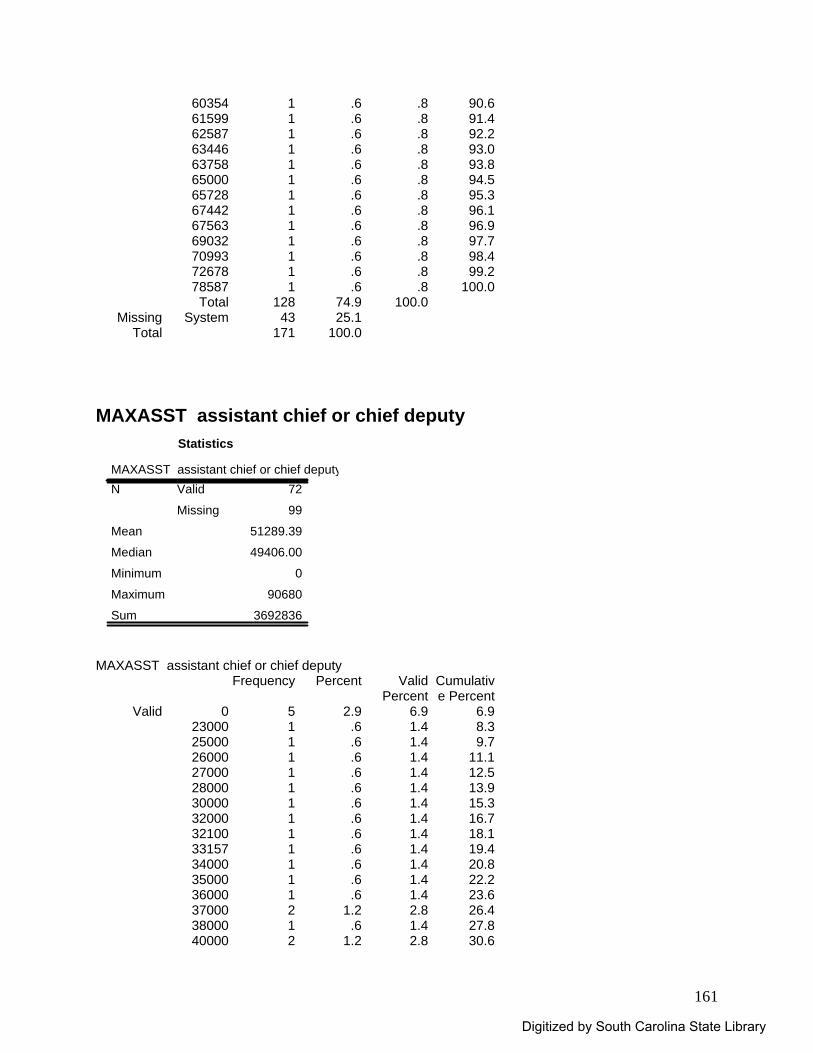
161
60354 1 .6 .8 90.661599 1 .6 .8 91.462587 1 .6 .8 92.263446 1 .6 .8 93.063758 1 .6 .8 93.865000 1 .6 .8 94.565728 1 .6 .8 95.367442 1 .6 .8 96.167563 1 .6 .8 96.969032 1 .6 .8 97.770993 1 .6 .8 98.472678 1 .6 .8 99.278587 1 .6 .8 100.0
Total 128 74.9 100.0Missing System 43 25.1
Total 171 100.0 MAXASST assistant chief or chief deputy
Statistics
MAXASST assistant chief or chief deputy72
99
51289.39
49406.00
0
90680
3692836
Valid
Missing
N
Mean
Median
Minimum
Maximum
Sum
MAXASST assistant chief or chief deputy
Frequency Percent Valid Percent
Cumulative Percent
Valid 0 5 2.9 6.9 6.923000 1 .6 1.4 8.325000 1 .6 1.4 9.726000 1 .6 1.4 11.127000 1 .6 1.4 12.528000 1 .6 1.4 13.930000 1 .6 1.4 15.332000 1 .6 1.4 16.732100 1 .6 1.4 18.133157 1 .6 1.4 19.434000 1 .6 1.4 20.835000 1 .6 1.4 22.236000 1 .6 1.4 23.637000 2 1.2 2.8 26.438000 1 .6 1.4 27.840000 2 1.2 2.8 30.6
Digitized by South Carolina State Library
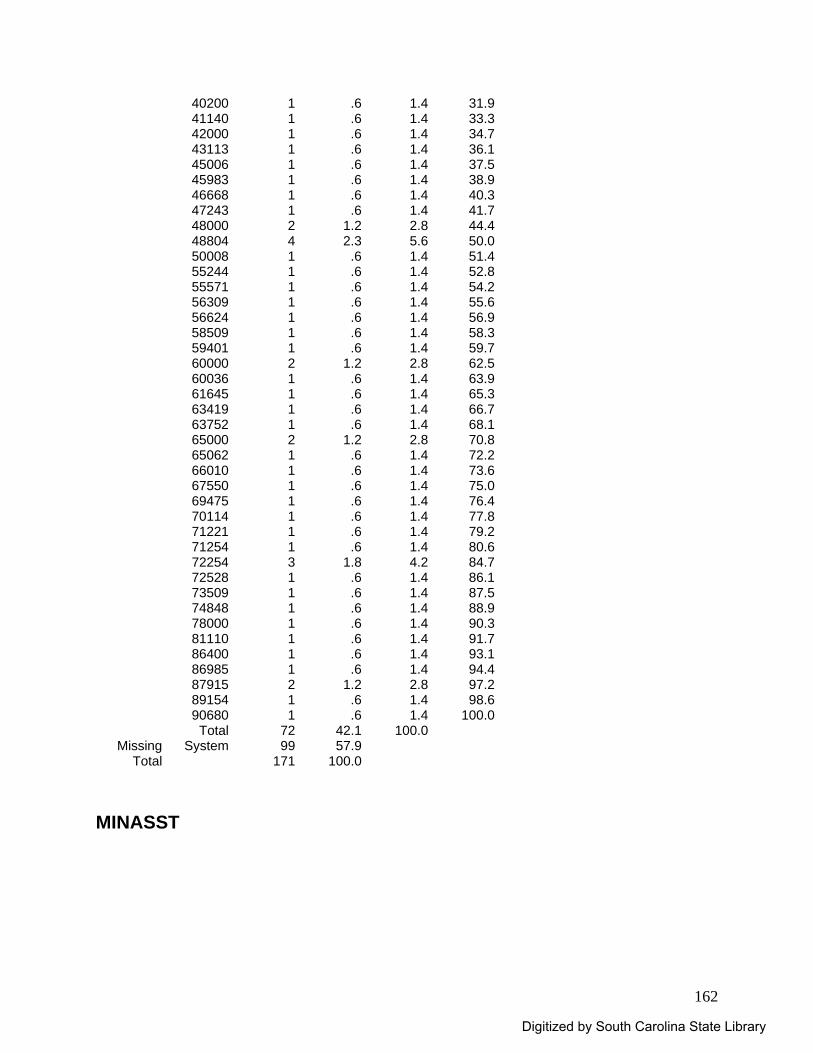
162
40200 1 .6 1.4 31.941140 1 .6 1.4 33.342000 1 .6 1.4 34.743113 1 .6 1.4 36.145006 1 .6 1.4 37.545983 1 .6 1.4 38.946668 1 .6 1.4 40.347243 1 .6 1.4 41.748000 2 1.2 2.8 44.448804 4 2.3 5.6 50.050008 1 .6 1.4 51.455244 1 .6 1.4 52.855571 1 .6 1.4 54.256309 1 .6 1.4 55.656624 1 .6 1.4 56.958509 1 .6 1.4 58.359401 1 .6 1.4 59.760000 2 1.2 2.8 62.560036 1 .6 1.4 63.961645 1 .6 1.4 65.363419 1 .6 1.4 66.763752 1 .6 1.4 68.165000 2 1.2 2.8 70.865062 1 .6 1.4 72.266010 1 .6 1.4 73.667550 1 .6 1.4 75.069475 1 .6 1.4 76.470114 1 .6 1.4 77.871221 1 .6 1.4 79.271254 1 .6 1.4 80.672254 3 1.8 4.2 84.772528 1 .6 1.4 86.173509 1 .6 1.4 87.574848 1 .6 1.4 88.978000 1 .6 1.4 90.381110 1 .6 1.4 91.786400 1 .6 1.4 93.186985 1 .6 1.4 94.487915 2 1.2 2.8 97.289154 1 .6 1.4 98.690680 1 .6 1.4 100.0
Total 72 42.1 100.0Missing System 99 57.9
Total 171 100.0 MINASST
Digitized by South Carolina State Library
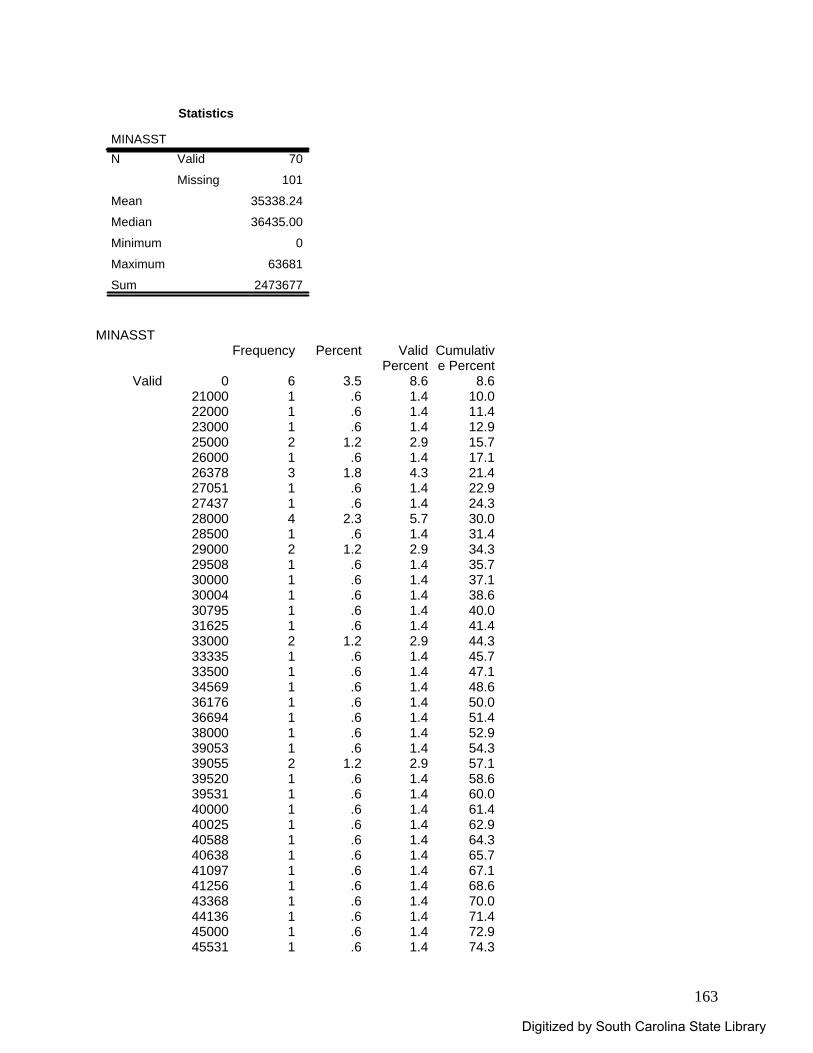
163
Statistics
MINASST70
101
35338.24
36435.00
0
63681
2473677
Valid
Missing
N
Mean
Median
Minimum
Maximum
Sum
MINASST
Frequency Percent Valid Percent
Cumulative Percent
Valid 0 6 3.5 8.6 8.621000 1 .6 1.4 10.022000 1 .6 1.4 11.423000 1 .6 1.4 12.925000 2 1.2 2.9 15.726000 1 .6 1.4 17.126378 3 1.8 4.3 21.427051 1 .6 1.4 22.927437 1 .6 1.4 24.328000 4 2.3 5.7 30.028500 1 .6 1.4 31.429000 2 1.2 2.9 34.329508 1 .6 1.4 35.730000 1 .6 1.4 37.130004 1 .6 1.4 38.630795 1 .6 1.4 40.031625 1 .6 1.4 41.433000 2 1.2 2.9 44.333335 1 .6 1.4 45.733500 1 .6 1.4 47.134569 1 .6 1.4 48.636176 1 .6 1.4 50.036694 1 .6 1.4 51.438000 1 .6 1.4 52.939053 1 .6 1.4 54.339055 2 1.2 2.9 57.139520 1 .6 1.4 58.639531 1 .6 1.4 60.040000 1 .6 1.4 61.440025 1 .6 1.4 62.940588 1 .6 1.4 64.340638 1 .6 1.4 65.741097 1 .6 1.4 67.141256 1 .6 1.4 68.643368 1 .6 1.4 70.044136 1 .6 1.4 71.445000 1 .6 1.4 72.945531 1 .6 1.4 74.3
Digitized by South Carolina State Library
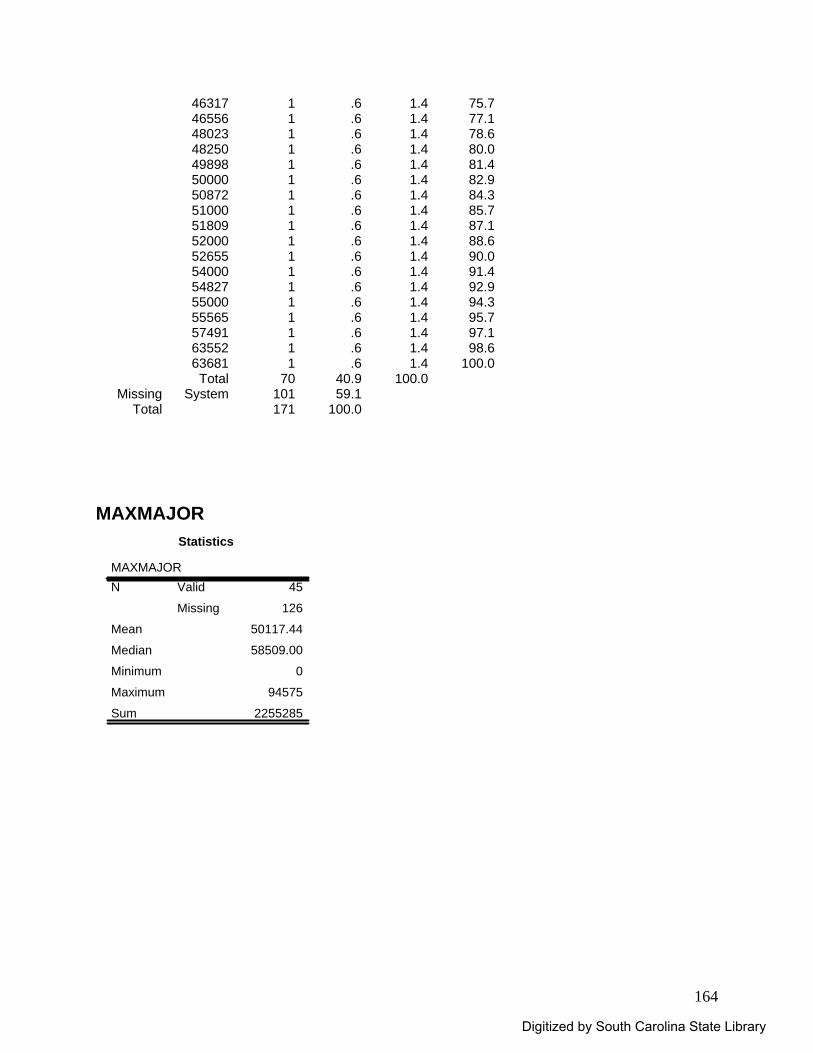
164
46317 1 .6 1.4 75.746556 1 .6 1.4 77.148023 1 .6 1.4 78.648250 1 .6 1.4 80.049898 1 .6 1.4 81.450000 1 .6 1.4 82.950872 1 .6 1.4 84.351000 1 .6 1.4 85.751809 1 .6 1.4 87.152000 1 .6 1.4 88.652655 1 .6 1.4 90.054000 1 .6 1.4 91.454827 1 .6 1.4 92.955000 1 .6 1.4 94.355565 1 .6 1.4 95.757491 1 .6 1.4 97.163552 1 .6 1.4 98.663681 1 .6 1.4 100.0
Total 70 40.9 100.0Missing System 101 59.1
Total 171 100.0 MAXMAJOR
Statistics
MAXMAJOR45
126
50117.44
58509.00
0
94575
2255285
Valid
Missing
N
Mean
Median
Minimum
Maximum
Sum
Digitized by South Carolina State Library
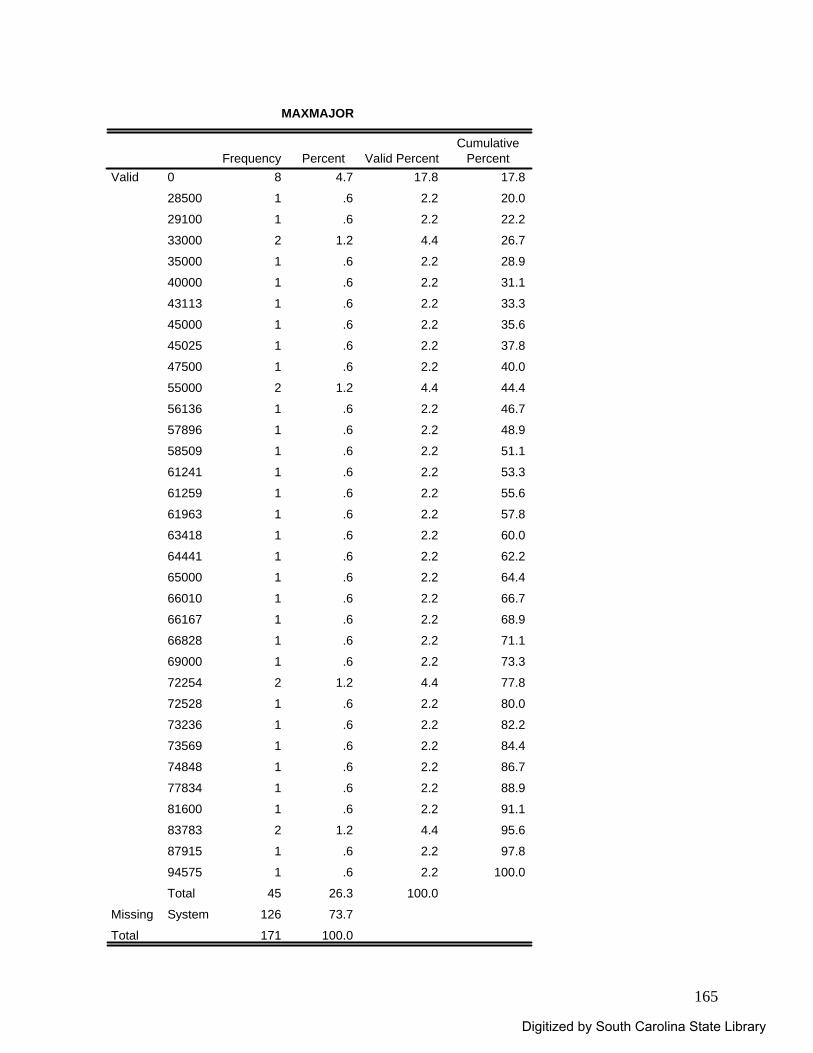
165
MAXMAJOR
8 4.7 17.8 17.8
1 .6 2.2 20.0
1 .6 2.2 22.2
2 1.2 4.4 26.7
1 .6 2.2 28.9
1 .6 2.2 31.1
1 .6 2.2 33.3
1 .6 2.2 35.6
1 .6 2.2 37.8
1 .6 2.2 40.0
2 1.2 4.4 44.4
1 .6 2.2 46.7
1 .6 2.2 48.9
1 .6 2.2 51.1
1 .6 2.2 53.3
1 .6 2.2 55.6
1 .6 2.2 57.8
1 .6 2.2 60.0
1 .6 2.2 62.2
1 .6 2.2 64.4
1 .6 2.2 66.7
1 .6 2.2 68.9
1 .6 2.2 71.1
1 .6 2.2 73.3
2 1.2 4.4 77.8
1 .6 2.2 80.0
1 .6 2.2 82.2
1 .6 2.2 84.4
1 .6 2.2 86.7
1 .6 2.2 88.9
1 .6 2.2 91.1
2 1.2 4.4 95.6
1 .6 2.2 97.8
1 .6 2.2 100.0
45 26.3 100.0
126 73.7
171 100.0
0
28500
29100
33000
35000
40000
43113
45000
45025
47500
55000
56136
57896
58509
61241
61259
61963
63418
64441
65000
66010
66167
66828
69000
72254
72528
73236
73569
74848
77834
81600
83783
87915
94575
Total
Valid
SystemMissing
Total
Frequency Percent Valid PercentCumulative
Percent
Digitized by South Carolina State Library
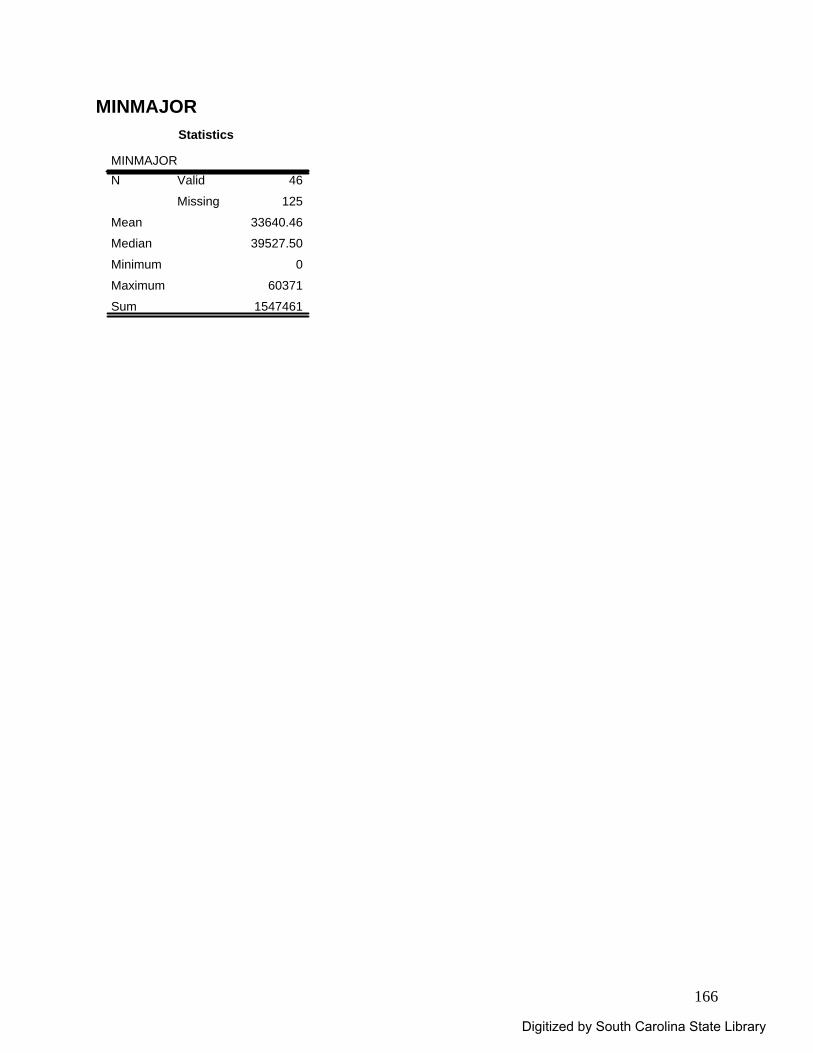
166
MINMAJOR Statistics
MINMAJOR46
125
33640.46
39527.50
0
60371
1547461
Valid
Missing
N
Mean
Median
Minimum
Maximum
Sum
Digitized by South Carolina State Library
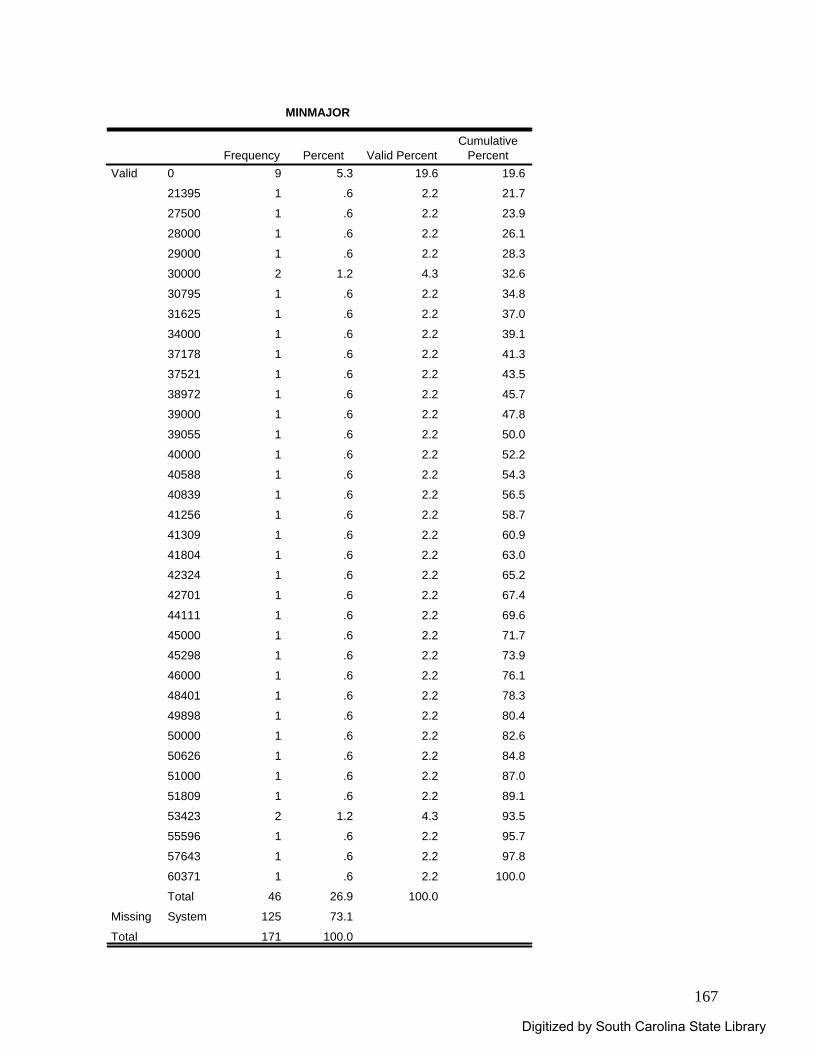
167
MINMAJOR
9 5.3 19.6 19.6
1 .6 2.2 21.7
1 .6 2.2 23.9
1 .6 2.2 26.1
1 .6 2.2 28.3
2 1.2 4.3 32.6
1 .6 2.2 34.8
1 .6 2.2 37.0
1 .6 2.2 39.1
1 .6 2.2 41.3
1 .6 2.2 43.5
1 .6 2.2 45.7
1 .6 2.2 47.8
1 .6 2.2 50.0
1 .6 2.2 52.2
1 .6 2.2 54.3
1 .6 2.2 56.5
1 .6 2.2 58.7
1 .6 2.2 60.9
1 .6 2.2 63.0
1 .6 2.2 65.2
1 .6 2.2 67.4
1 .6 2.2 69.6
1 .6 2.2 71.7
1 .6 2.2 73.9
1 .6 2.2 76.1
1 .6 2.2 78.3
1 .6 2.2 80.4
1 .6 2.2 82.6
1 .6 2.2 84.8
1 .6 2.2 87.0
1 .6 2.2 89.1
2 1.2 4.3 93.5
1 .6 2.2 95.7
1 .6 2.2 97.8
1 .6 2.2 100.0
46 26.9 100.0
125 73.1
171 100.0
0
21395
27500
28000
29000
30000
30795
31625
34000
37178
37521
38972
39000
39055
40000
40588
40839
41256
41309
41804
42324
42701
44111
45000
45298
46000
48401
49898
50000
50626
51000
51809
53423
55596
57643
60371
Total
Valid
SystemMissing
Total
Frequency Percent Valid PercentCumulative
Percent
Digitized by South Carolina State Library
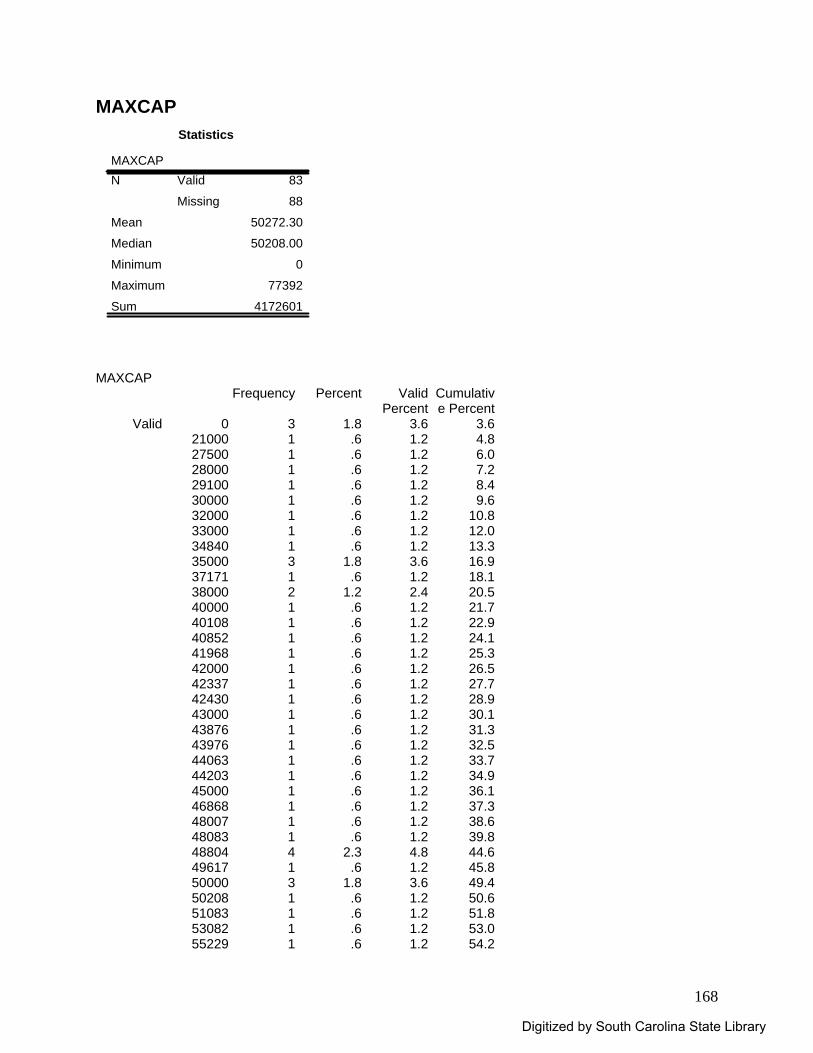
168
MAXCAP Statistics
MAXCAP83
88
50272.30
50208.00
0
77392
4172601
Valid
Missing
N
Mean
Median
Minimum
Maximum
Sum
MAXCAP
Frequency Percent Valid Percent
Cumulative Percent
Valid 0 3 1.8 3.6 3.621000 1 .6 1.2 4.827500 1 .6 1.2 6.028000 1 .6 1.2 7.229100 1 .6 1.2 8.430000 1 .6 1.2 9.632000 1 .6 1.2 10.833000 1 .6 1.2 12.034840 1 .6 1.2 13.335000 3 1.8 3.6 16.937171 1 .6 1.2 18.138000 2 1.2 2.4 20.540000 1 .6 1.2 21.740108 1 .6 1.2 22.940852 1 .6 1.2 24.141968 1 .6 1.2 25.342000 1 .6 1.2 26.542337 1 .6 1.2 27.742430 1 .6 1.2 28.943000 1 .6 1.2 30.143876 1 .6 1.2 31.343976 1 .6 1.2 32.544063 1 .6 1.2 33.744203 1 .6 1.2 34.945000 1 .6 1.2 36.146868 1 .6 1.2 37.348007 1 .6 1.2 38.648083 1 .6 1.2 39.848804 4 2.3 4.8 44.649617 1 .6 1.2 45.850000 3 1.8 3.6 49.450208 1 .6 1.2 50.651083 1 .6 1.2 51.853082 1 .6 1.2 53.055229 1 .6 1.2 54.2
Digitized by South Carolina State Library
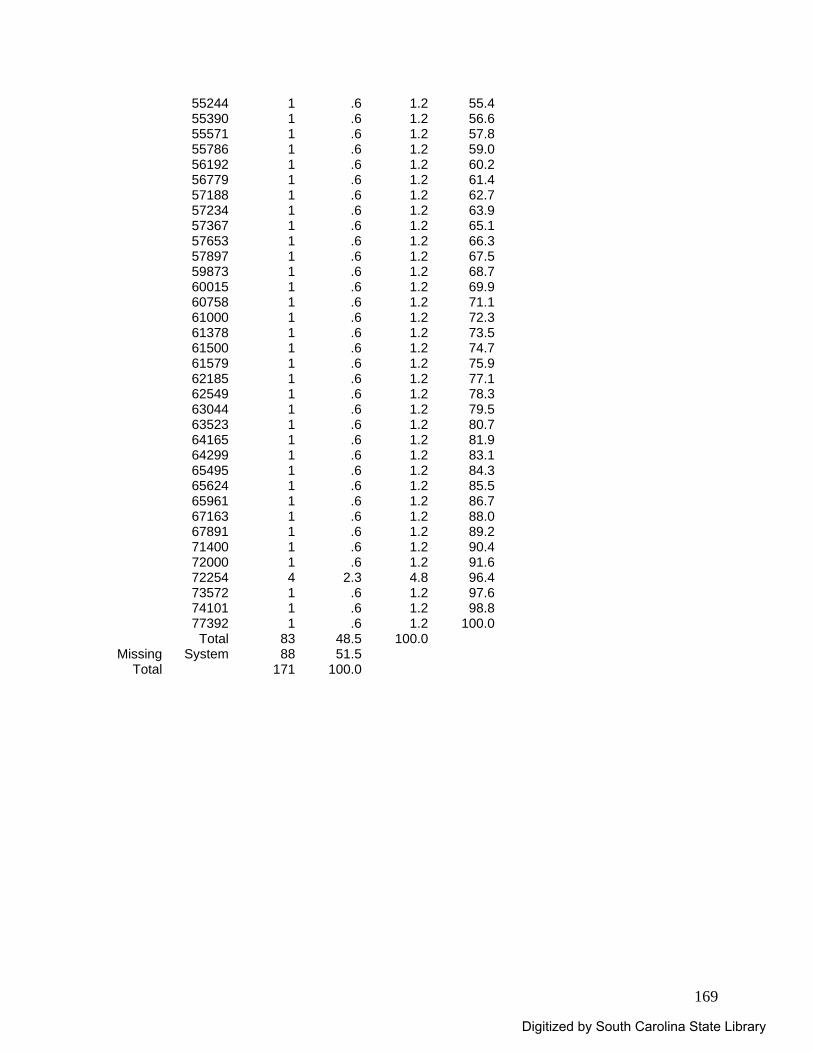
169
55244 1 .6 1.2 55.455390 1 .6 1.2 56.655571 1 .6 1.2 57.855786 1 .6 1.2 59.056192 1 .6 1.2 60.256779 1 .6 1.2 61.457188 1 .6 1.2 62.757234 1 .6 1.2 63.957367 1 .6 1.2 65.157653 1 .6 1.2 66.357897 1 .6 1.2 67.559873 1 .6 1.2 68.760015 1 .6 1.2 69.960758 1 .6 1.2 71.161000 1 .6 1.2 72.361378 1 .6 1.2 73.561500 1 .6 1.2 74.761579 1 .6 1.2 75.962185 1 .6 1.2 77.162549 1 .6 1.2 78.363044 1 .6 1.2 79.563523 1 .6 1.2 80.764165 1 .6 1.2 81.964299 1 .6 1.2 83.165495 1 .6 1.2 84.365624 1 .6 1.2 85.565961 1 .6 1.2 86.767163 1 .6 1.2 88.067891 1 .6 1.2 89.271400 1 .6 1.2 90.472000 1 .6 1.2 91.672254 4 2.3 4.8 96.473572 1 .6 1.2 97.674101 1 .6 1.2 98.877392 1 .6 1.2 100.0
Total 83 48.5 100.0Missing System 88 51.5
Total 171 100.0
Digitized by South Carolina State Library
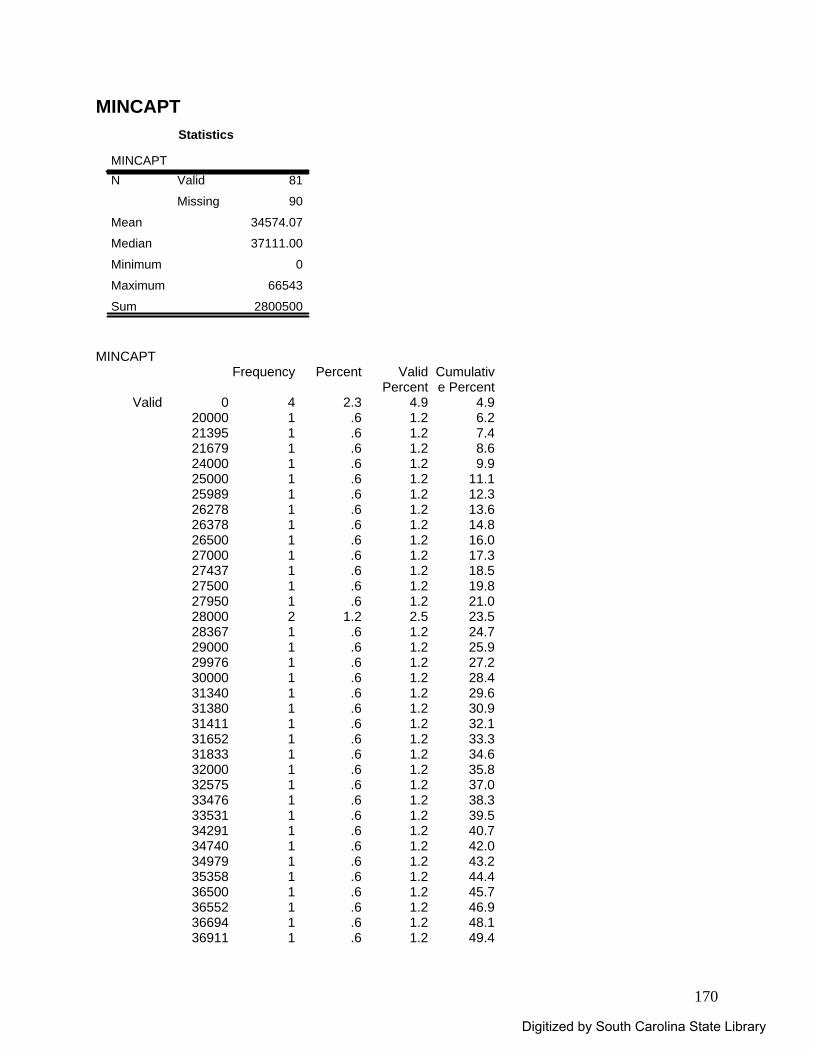
170
MINCAPT Statistics
MINCAPT81
90
34574.07
37111.00
0
66543
2800500
Valid
Missing
N
Mean
Median
Minimum
Maximum
Sum
MINCAPT
Frequency Percent Valid Percent
Cumulative Percent
Valid 0 4 2.3 4.9 4.920000 1 .6 1.2 6.221395 1 .6 1.2 7.421679 1 .6 1.2 8.624000 1 .6 1.2 9.925000 1 .6 1.2 11.125989 1 .6 1.2 12.326278 1 .6 1.2 13.626378 1 .6 1.2 14.826500 1 .6 1.2 16.027000 1 .6 1.2 17.327437 1 .6 1.2 18.527500 1 .6 1.2 19.827950 1 .6 1.2 21.028000 2 1.2 2.5 23.528367 1 .6 1.2 24.729000 1 .6 1.2 25.929976 1 .6 1.2 27.230000 1 .6 1.2 28.431340 1 .6 1.2 29.631380 1 .6 1.2 30.931411 1 .6 1.2 32.131652 1 .6 1.2 33.331833 1 .6 1.2 34.632000 1 .6 1.2 35.832575 1 .6 1.2 37.033476 1 .6 1.2 38.333531 1 .6 1.2 39.534291 1 .6 1.2 40.734740 1 .6 1.2 42.034979 1 .6 1.2 43.235358 1 .6 1.2 44.436500 1 .6 1.2 45.736552 1 .6 1.2 46.936694 1 .6 1.2 48.136911 1 .6 1.2 49.4
Digitized by South Carolina State Library
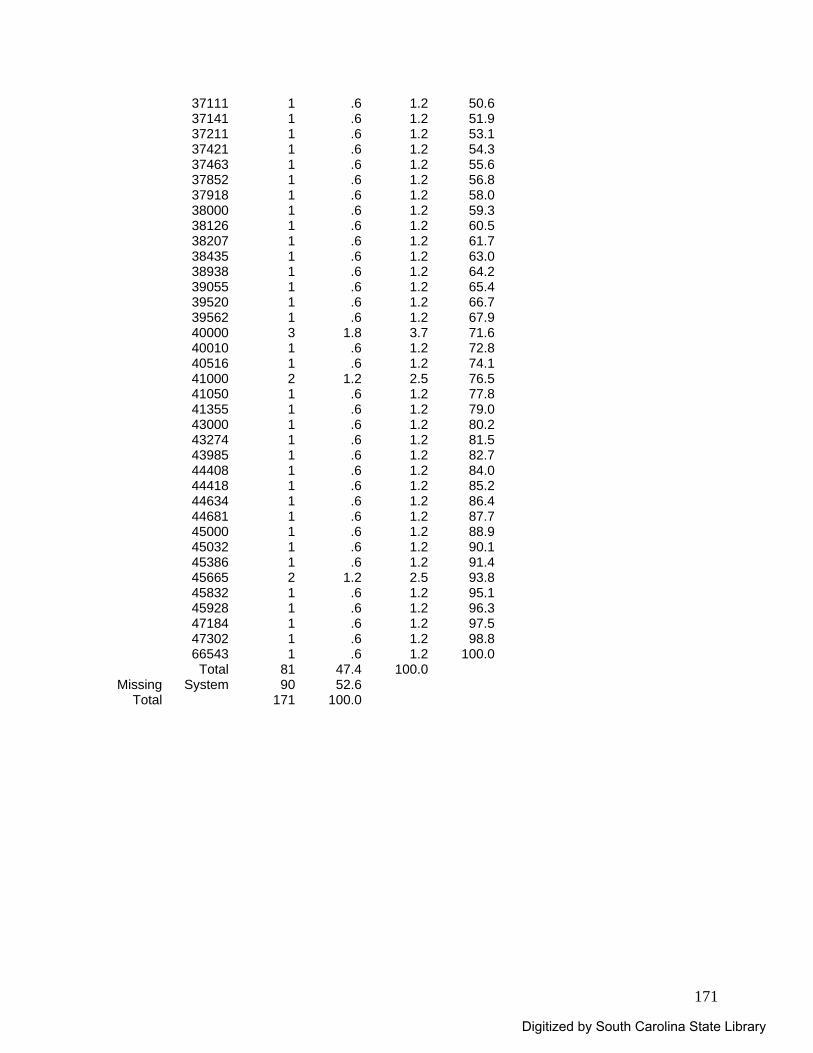
171
37111 1 .6 1.2 50.637141 1 .6 1.2 51.937211 1 .6 1.2 53.137421 1 .6 1.2 54.337463 1 .6 1.2 55.637852 1 .6 1.2 56.837918 1 .6 1.2 58.038000 1 .6 1.2 59.338126 1 .6 1.2 60.538207 1 .6 1.2 61.738435 1 .6 1.2 63.038938 1 .6 1.2 64.239055 1 .6 1.2 65.439520 1 .6 1.2 66.739562 1 .6 1.2 67.940000 3 1.8 3.7 71.640010 1 .6 1.2 72.840516 1 .6 1.2 74.141000 2 1.2 2.5 76.541050 1 .6 1.2 77.841355 1 .6 1.2 79.043000 1 .6 1.2 80.243274 1 .6 1.2 81.543985 1 .6 1.2 82.744408 1 .6 1.2 84.044418 1 .6 1.2 85.244634 1 .6 1.2 86.444681 1 .6 1.2 87.745000 1 .6 1.2 88.945032 1 .6 1.2 90.145386 1 .6 1.2 91.445665 2 1.2 2.5 93.845832 1 .6 1.2 95.145928 1 .6 1.2 96.347184 1 .6 1.2 97.547302 1 .6 1.2 98.866543 1 .6 1.2 100.0
Total 81 47.4 100.0Missing System 90 52.6
Total 171 100.0
Digitized by South Carolina State Library
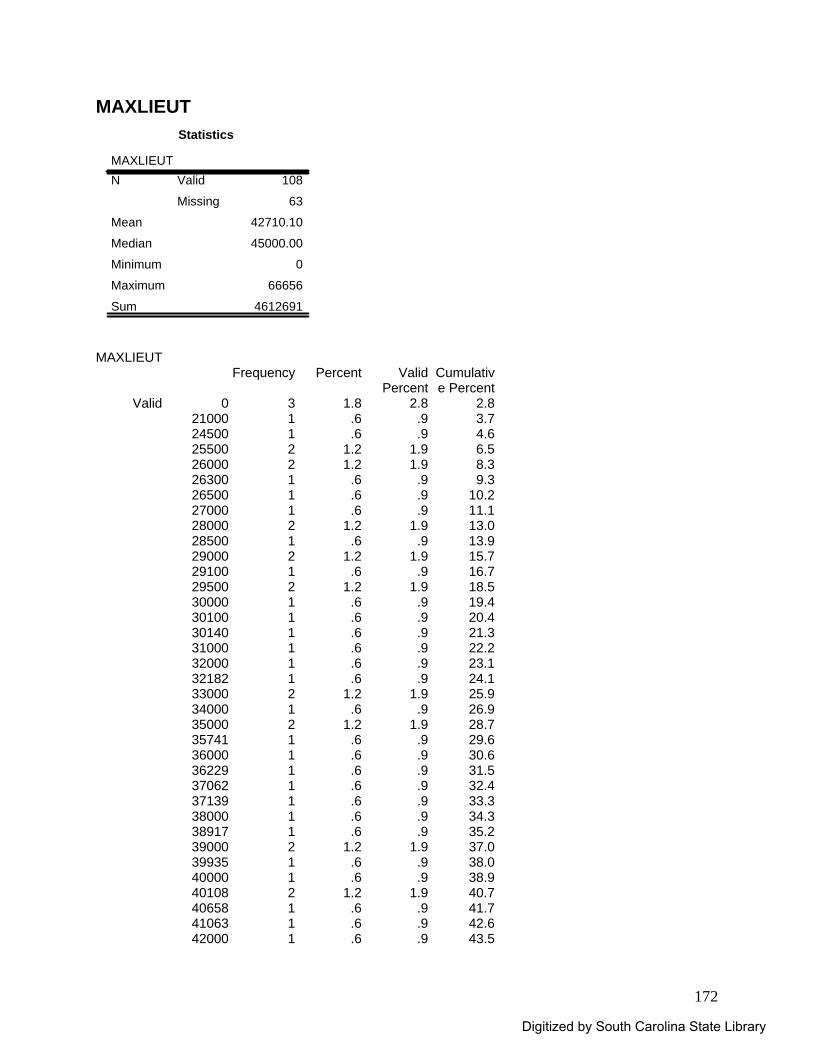
172
MAXLIEUT Statistics
MAXLIEUT108
63
42710.10
45000.00
0
66656
4612691
Valid
Missing
N
Mean
Median
Minimum
Maximum
Sum
MAXLIEUT
Frequency Percent Valid Percent
Cumulative Percent
Valid 0 3 1.8 2.8 2.821000 1 .6 .9 3.724500 1 .6 .9 4.625500 2 1.2 1.9 6.526000 2 1.2 1.9 8.326300 1 .6 .9 9.326500 1 .6 .9 10.227000 1 .6 .9 11.128000 2 1.2 1.9 13.028500 1 .6 .9 13.929000 2 1.2 1.9 15.729100 1 .6 .9 16.729500 2 1.2 1.9 18.530000 1 .6 .9 19.430100 1 .6 .9 20.430140 1 .6 .9 21.331000 1 .6 .9 22.232000 1 .6 .9 23.132182 1 .6 .9 24.133000 2 1.2 1.9 25.934000 1 .6 .9 26.935000 2 1.2 1.9 28.735741 1 .6 .9 29.636000 1 .6 .9 30.636229 1 .6 .9 31.537062 1 .6 .9 32.437139 1 .6 .9 33.338000 1 .6 .9 34.338917 1 .6 .9 35.239000 2 1.2 1.9 37.039935 1 .6 .9 38.040000 1 .6 .9 38.940108 2 1.2 1.9 40.740658 1 .6 .9 41.741063 1 .6 .9 42.642000 1 .6 .9 43.5
Digitized by South Carolina State Library
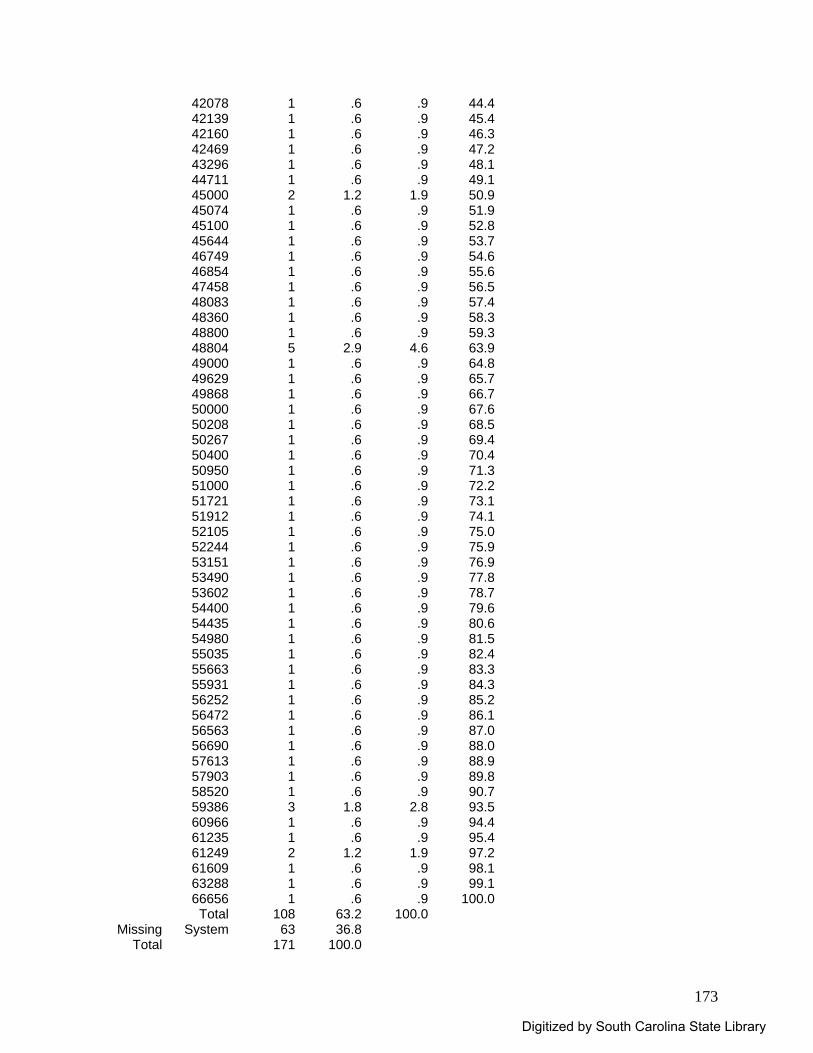
173
42078 1 .6 .9 44.442139 1 .6 .9 45.442160 1 .6 .9 46.342469 1 .6 .9 47.243296 1 .6 .9 48.144711 1 .6 .9 49.145000 2 1.2 1.9 50.945074 1 .6 .9 51.945100 1 .6 .9 52.845644 1 .6 .9 53.746749 1 .6 .9 54.646854 1 .6 .9 55.647458 1 .6 .9 56.548083 1 .6 .9 57.448360 1 .6 .9 58.348800 1 .6 .9 59.348804 5 2.9 4.6 63.949000 1 .6 .9 64.849629 1 .6 .9 65.749868 1 .6 .9 66.750000 1 .6 .9 67.650208 1 .6 .9 68.550267 1 .6 .9 69.450400 1 .6 .9 70.450950 1 .6 .9 71.351000 1 .6 .9 72.251721 1 .6 .9 73.151912 1 .6 .9 74.152105 1 .6 .9 75.052244 1 .6 .9 75.953151 1 .6 .9 76.953490 1 .6 .9 77.853602 1 .6 .9 78.754400 1 .6 .9 79.654435 1 .6 .9 80.654980 1 .6 .9 81.555035 1 .6 .9 82.455663 1 .6 .9 83.355931 1 .6 .9 84.356252 1 .6 .9 85.256472 1 .6 .9 86.156563 1 .6 .9 87.056690 1 .6 .9 88.057613 1 .6 .9 88.957903 1 .6 .9 89.858520 1 .6 .9 90.759386 3 1.8 2.8 93.560966 1 .6 .9 94.461235 1 .6 .9 95.461249 2 1.2 1.9 97.261609 1 .6 .9 98.163288 1 .6 .9 99.166656 1 .6 .9 100.0
Total 108 63.2 100.0Missing System 63 36.8
Total 171 100.0
Digitized by South Carolina State Library
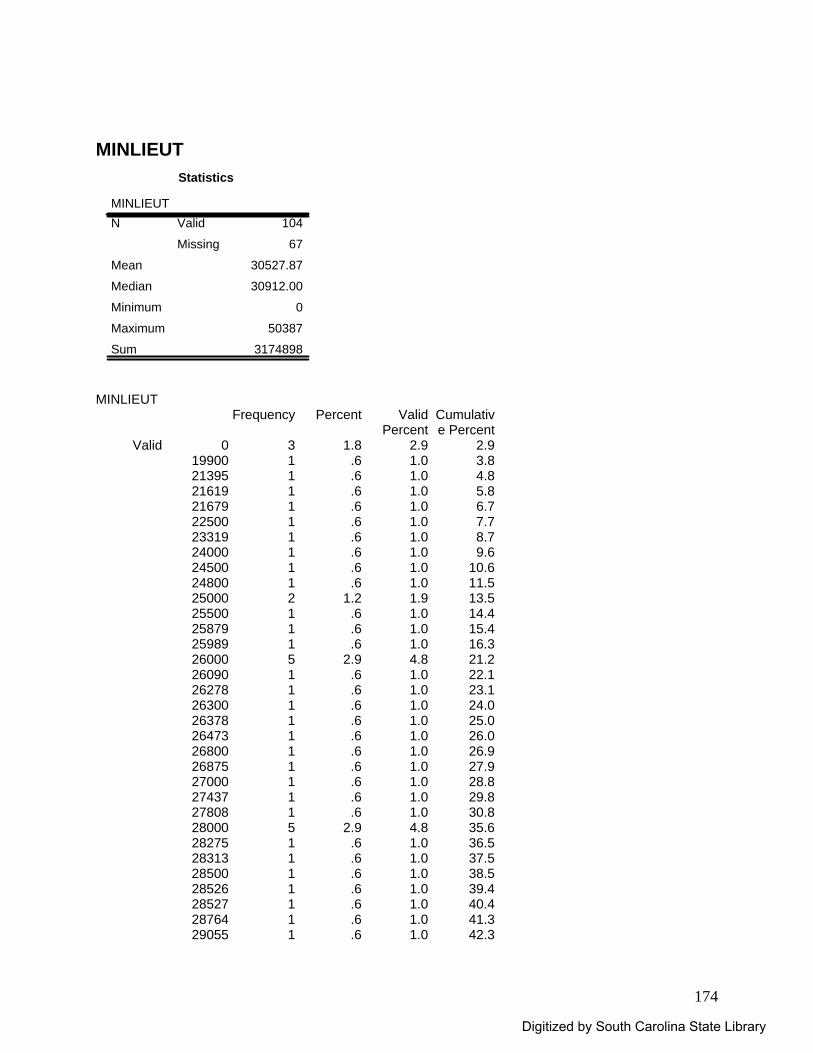
174
MINLIEUT
Statistics
MINLIEUT104
67
30527.87
30912.00
0
50387
3174898
Valid
Missing
N
Mean
Median
Minimum
Maximum
Sum
MINLIEUT
Frequency Percent Valid Percent
Cumulative Percent
Valid 0 3 1.8 2.9 2.919900 1 .6 1.0 3.821395 1 .6 1.0 4.821619 1 .6 1.0 5.821679 1 .6 1.0 6.722500 1 .6 1.0 7.723319 1 .6 1.0 8.724000 1 .6 1.0 9.624500 1 .6 1.0 10.624800 1 .6 1.0 11.525000 2 1.2 1.9 13.525500 1 .6 1.0 14.425879 1 .6 1.0 15.425989 1 .6 1.0 16.326000 5 2.9 4.8 21.226090 1 .6 1.0 22.126278 1 .6 1.0 23.126300 1 .6 1.0 24.026378 1 .6 1.0 25.026473 1 .6 1.0 26.026800 1 .6 1.0 26.926875 1 .6 1.0 27.927000 1 .6 1.0 28.827437 1 .6 1.0 29.827808 1 .6 1.0 30.828000 5 2.9 4.8 35.628275 1 .6 1.0 36.528313 1 .6 1.0 37.528500 1 .6 1.0 38.528526 1 .6 1.0 39.428527 1 .6 1.0 40.428764 1 .6 1.0 41.329055 1 .6 1.0 42.3
Digitized by South Carolina State Library
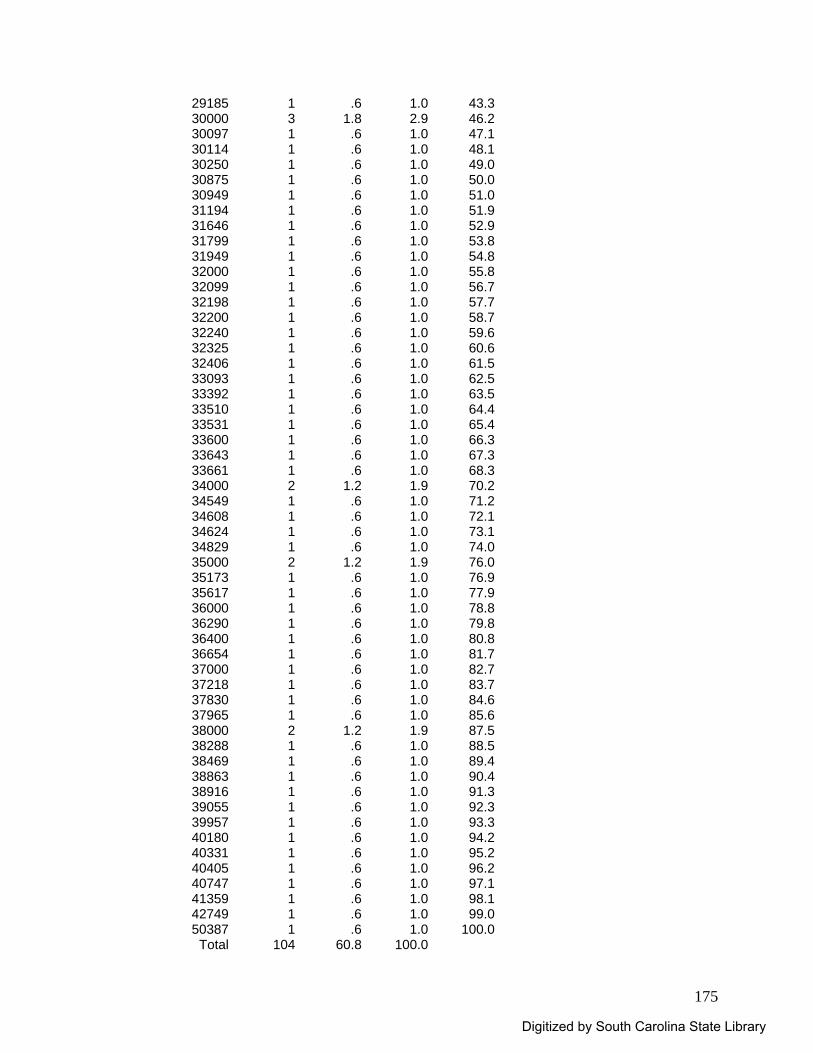
175
29185 1 .6 1.0 43.330000 3 1.8 2.9 46.230097 1 .6 1.0 47.130114 1 .6 1.0 48.130250 1 .6 1.0 49.030875 1 .6 1.0 50.030949 1 .6 1.0 51.031194 1 .6 1.0 51.931646 1 .6 1.0 52.931799 1 .6 1.0 53.831949 1 .6 1.0 54.832000 1 .6 1.0 55.832099 1 .6 1.0 56.732198 1 .6 1.0 57.732200 1 .6 1.0 58.732240 1 .6 1.0 59.632325 1 .6 1.0 60.632406 1 .6 1.0 61.533093 1 .6 1.0 62.533392 1 .6 1.0 63.533510 1 .6 1.0 64.433531 1 .6 1.0 65.433600 1 .6 1.0 66.333643 1 .6 1.0 67.333661 1 .6 1.0 68.334000 2 1.2 1.9 70.234549 1 .6 1.0 71.234608 1 .6 1.0 72.134624 1 .6 1.0 73.134829 1 .6 1.0 74.035000 2 1.2 1.9 76.035173 1 .6 1.0 76.935617 1 .6 1.0 77.936000 1 .6 1.0 78.836290 1 .6 1.0 79.836400 1 .6 1.0 80.836654 1 .6 1.0 81.737000 1 .6 1.0 82.737218 1 .6 1.0 83.737830 1 .6 1.0 84.637965 1 .6 1.0 85.638000 2 1.2 1.9 87.538288 1 .6 1.0 88.538469 1 .6 1.0 89.438863 1 .6 1.0 90.438916 1 .6 1.0 91.339055 1 .6 1.0 92.339957 1 .6 1.0 93.340180 1 .6 1.0 94.240331 1 .6 1.0 95.240405 1 .6 1.0 96.240747 1 .6 1.0 97.141359 1 .6 1.0 98.142749 1 .6 1.0 99.050387 1 .6 1.0 100.0
Total 104 60.8 100.0
Digitized by South Carolina State Library
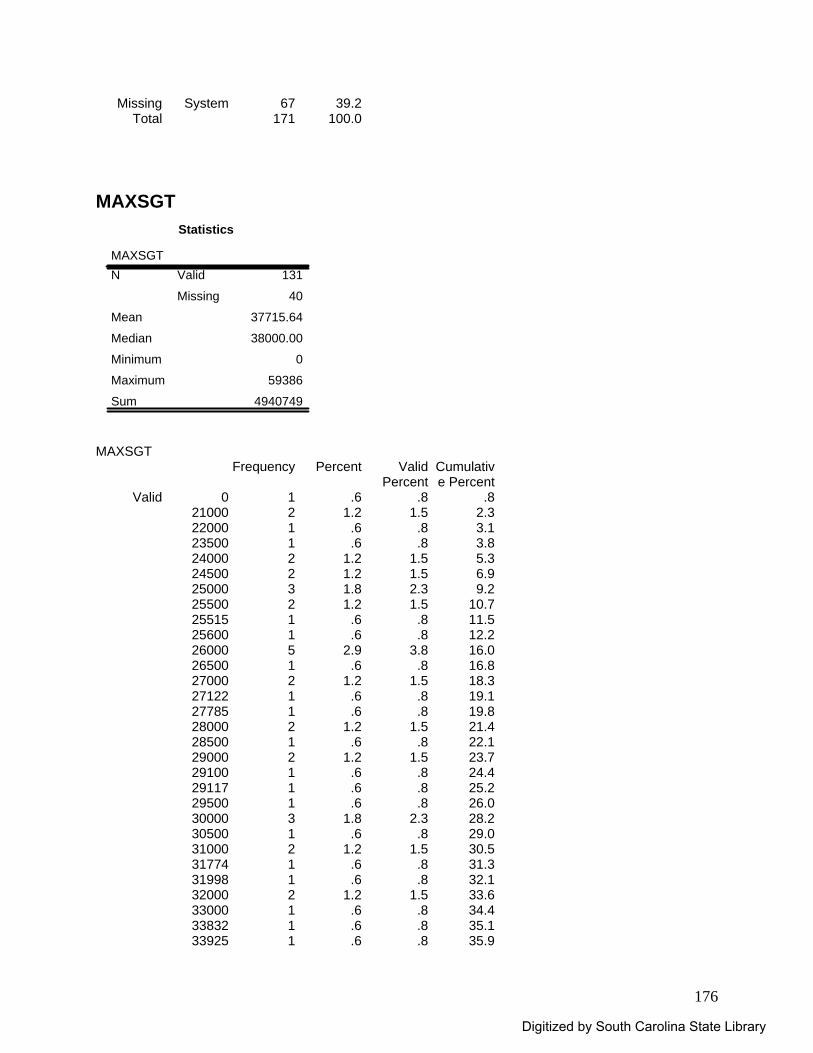
176
Missing System 67 39.2Total 171 100.0
MAXSGT
Statistics
MAXSGT131
40
37715.64
38000.00
0
59386
4940749
Valid
Missing
N
Mean
Median
Minimum
Maximum
Sum
MAXSGT
Frequency Percent Valid Percent
Cumulative Percent
Valid 0 1 .6 .8 .821000 2 1.2 1.5 2.322000 1 .6 .8 3.123500 1 .6 .8 3.824000 2 1.2 1.5 5.324500 2 1.2 1.5 6.925000 3 1.8 2.3 9.225500 2 1.2 1.5 10.725515 1 .6 .8 11.525600 1 .6 .8 12.226000 5 2.9 3.8 16.026500 1 .6 .8 16.827000 2 1.2 1.5 18.327122 1 .6 .8 19.127785 1 .6 .8 19.828000 2 1.2 1.5 21.428500 1 .6 .8 22.129000 2 1.2 1.5 23.729100 1 .6 .8 24.429117 1 .6 .8 25.229500 1 .6 .8 26.030000 3 1.8 2.3 28.230500 1 .6 .8 29.031000 2 1.2 1.5 30.531774 1 .6 .8 31.331998 1 .6 .8 32.132000 2 1.2 1.5 33.633000 1 .6 .8 34.433832 1 .6 .8 35.133925 1 .6 .8 35.9
Digitized by South Carolina State Library
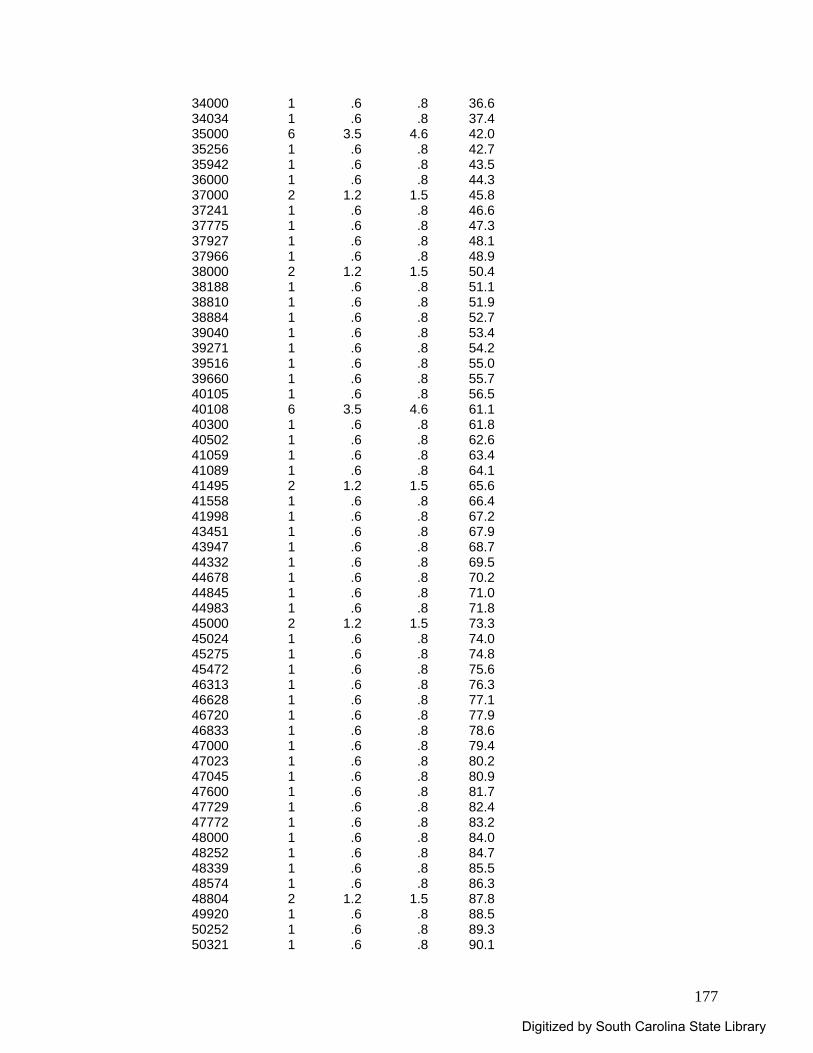
177
34000 1 .6 .8 36.634034 1 .6 .8 37.435000 6 3.5 4.6 42.035256 1 .6 .8 42.735942 1 .6 .8 43.536000 1 .6 .8 44.337000 2 1.2 1.5 45.837241 1 .6 .8 46.637775 1 .6 .8 47.337927 1 .6 .8 48.137966 1 .6 .8 48.938000 2 1.2 1.5 50.438188 1 .6 .8 51.138810 1 .6 .8 51.938884 1 .6 .8 52.739040 1 .6 .8 53.439271 1 .6 .8 54.239516 1 .6 .8 55.039660 1 .6 .8 55.740105 1 .6 .8 56.540108 6 3.5 4.6 61.140300 1 .6 .8 61.840502 1 .6 .8 62.641059 1 .6 .8 63.441089 1 .6 .8 64.141495 2 1.2 1.5 65.641558 1 .6 .8 66.441998 1 .6 .8 67.243451 1 .6 .8 67.943947 1 .6 .8 68.744332 1 .6 .8 69.544678 1 .6 .8 70.244845 1 .6 .8 71.044983 1 .6 .8 71.845000 2 1.2 1.5 73.345024 1 .6 .8 74.045275 1 .6 .8 74.845472 1 .6 .8 75.646313 1 .6 .8 76.346628 1 .6 .8 77.146720 1 .6 .8 77.946833 1 .6 .8 78.647000 1 .6 .8 79.447023 1 .6 .8 80.247045 1 .6 .8 80.947600 1 .6 .8 81.747729 1 .6 .8 82.447772 1 .6 .8 83.248000 1 .6 .8 84.048252 1 .6 .8 84.748339 1 .6 .8 85.548574 1 .6 .8 86.348804 2 1.2 1.5 87.849920 1 .6 .8 88.550252 1 .6 .8 89.350321 1 .6 .8 90.1
Digitized by South Carolina State Library
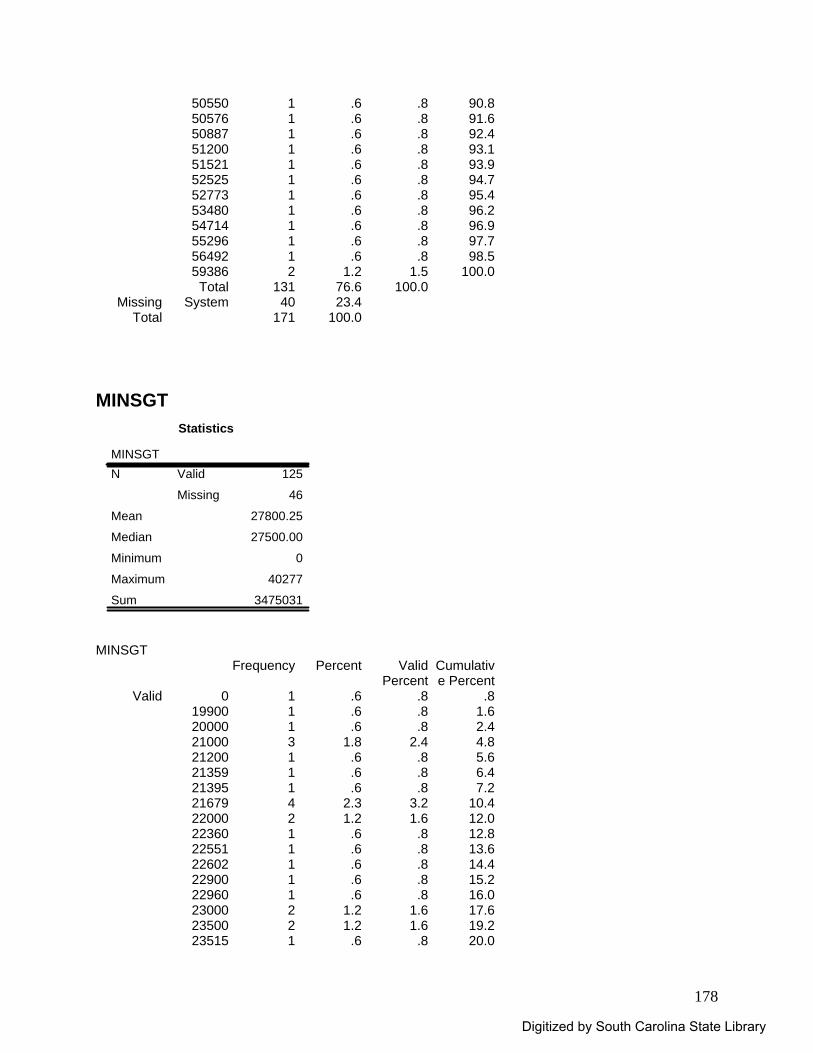
178
50550 1 .6 .8 90.850576 1 .6 .8 91.650887 1 .6 .8 92.451200 1 .6 .8 93.151521 1 .6 .8 93.952525 1 .6 .8 94.752773 1 .6 .8 95.453480 1 .6 .8 96.254714 1 .6 .8 96.955296 1 .6 .8 97.756492 1 .6 .8 98.559386 2 1.2 1.5 100.0
Total 131 76.6 100.0Missing System 40 23.4
Total 171 100.0 MINSGT
Statistics
MINSGT125
46
27800.25
27500.00
0
40277
3475031
Valid
Missing
N
Mean
Median
Minimum
Maximum
Sum
MINSGT
Frequency Percent Valid Percent
Cumulative Percent
Valid 0 1 .6 .8 .819900 1 .6 .8 1.620000 1 .6 .8 2.421000 3 1.8 2.4 4.821200 1 .6 .8 5.621359 1 .6 .8 6.421395 1 .6 .8 7.221679 4 2.3 3.2 10.422000 2 1.2 1.6 12.022360 1 .6 .8 12.822551 1 .6 .8 13.622602 1 .6 .8 14.422900 1 .6 .8 15.222960 1 .6 .8 16.023000 2 1.2 1.6 17.623500 2 1.2 1.6 19.223515 1 .6 .8 20.0
Digitized by South Carolina State Library
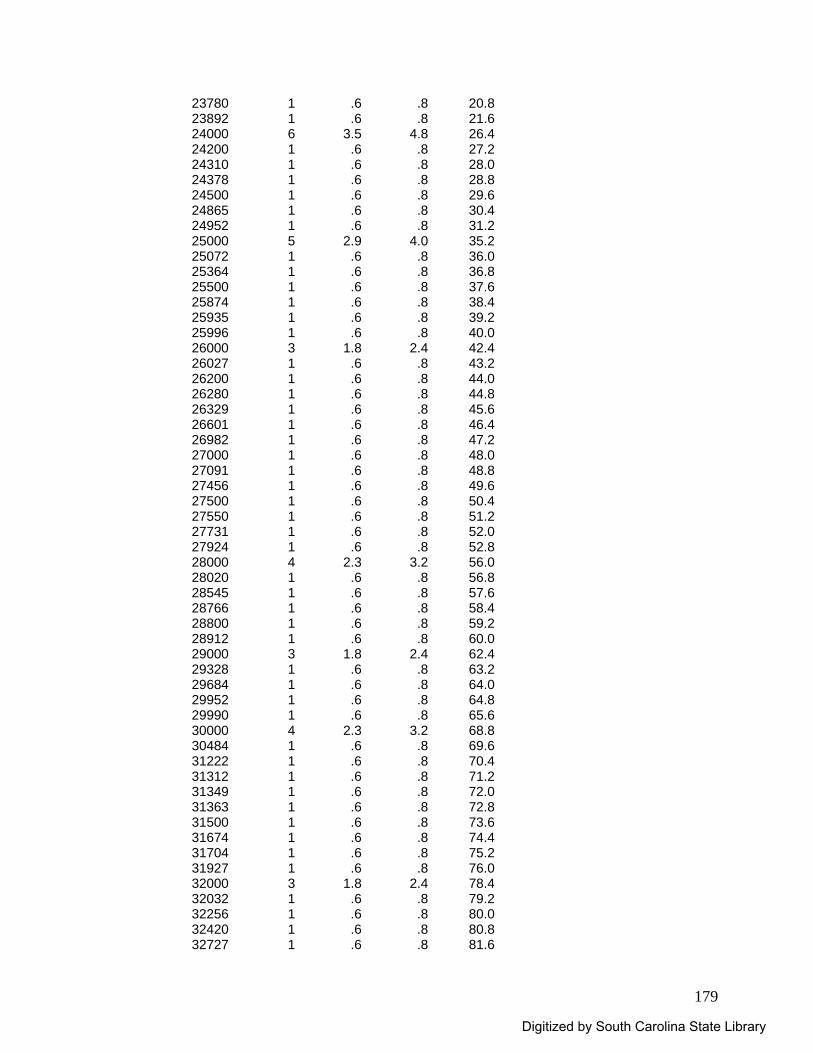
179
23780 1 .6 .8 20.823892 1 .6 .8 21.624000 6 3.5 4.8 26.424200 1 .6 .8 27.224310 1 .6 .8 28.024378 1 .6 .8 28.824500 1 .6 .8 29.624865 1 .6 .8 30.424952 1 .6 .8 31.225000 5 2.9 4.0 35.225072 1 .6 .8 36.025364 1 .6 .8 36.825500 1 .6 .8 37.625874 1 .6 .8 38.425935 1 .6 .8 39.225996 1 .6 .8 40.026000 3 1.8 2.4 42.426027 1 .6 .8 43.226200 1 .6 .8 44.026280 1 .6 .8 44.826329 1 .6 .8 45.626601 1 .6 .8 46.426982 1 .6 .8 47.227000 1 .6 .8 48.027091 1 .6 .8 48.827456 1 .6 .8 49.627500 1 .6 .8 50.427550 1 .6 .8 51.227731 1 .6 .8 52.027924 1 .6 .8 52.828000 4 2.3 3.2 56.028020 1 .6 .8 56.828545 1 .6 .8 57.628766 1 .6 .8 58.428800 1 .6 .8 59.228912 1 .6 .8 60.029000 3 1.8 2.4 62.429328 1 .6 .8 63.229684 1 .6 .8 64.029952 1 .6 .8 64.829990 1 .6 .8 65.630000 4 2.3 3.2 68.830484 1 .6 .8 69.631222 1 .6 .8 70.431312 1 .6 .8 71.231349 1 .6 .8 72.031363 1 .6 .8 72.831500 1 .6 .8 73.631674 1 .6 .8 74.431704 1 .6 .8 75.231927 1 .6 .8 76.032000 3 1.8 2.4 78.432032 1 .6 .8 79.232256 1 .6 .8 80.032420 1 .6 .8 80.832727 1 .6 .8 81.6
Digitized by South Carolina State Library
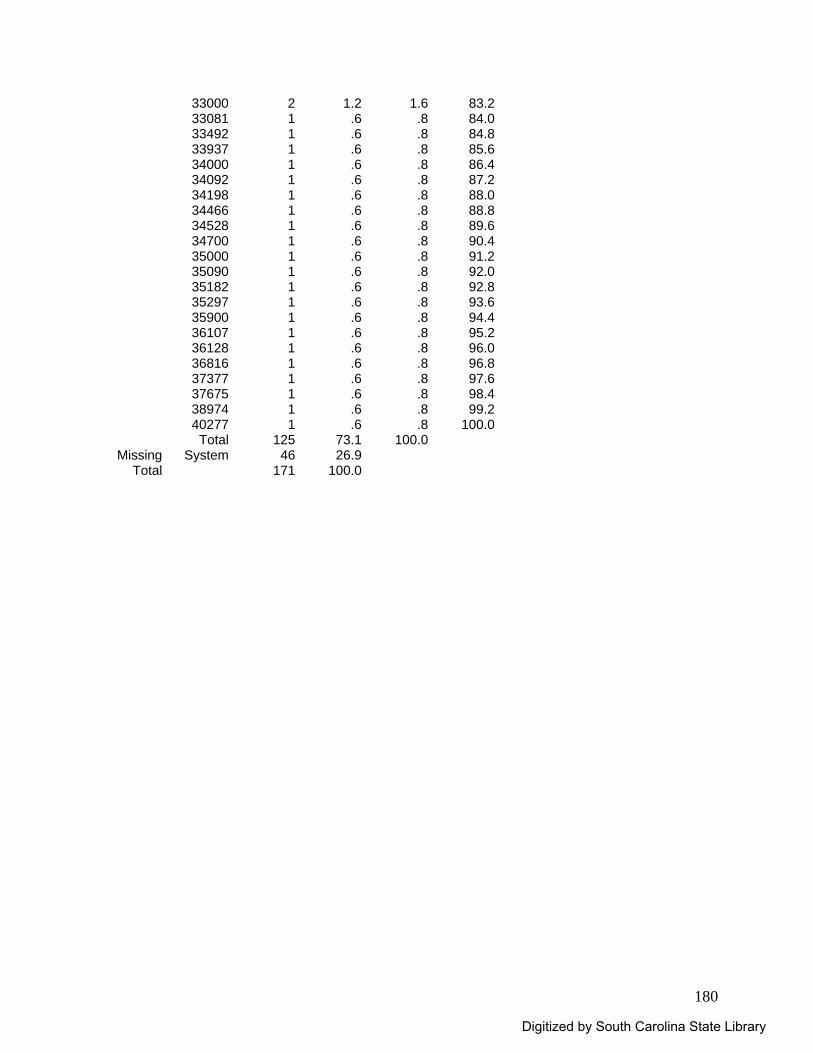
180
33000 2 1.2 1.6 83.233081 1 .6 .8 84.033492 1 .6 .8 84.833937 1 .6 .8 85.634000 1 .6 .8 86.434092 1 .6 .8 87.234198 1 .6 .8 88.034466 1 .6 .8 88.834528 1 .6 .8 89.634700 1 .6 .8 90.435000 1 .6 .8 91.235090 1 .6 .8 92.035182 1 .6 .8 92.835297 1 .6 .8 93.635900 1 .6 .8 94.436107 1 .6 .8 95.236128 1 .6 .8 96.036816 1 .6 .8 96.837377 1 .6 .8 97.637675 1 .6 .8 98.438974 1 .6 .8 99.240277 1 .6 .8 100.0
Total 125 73.1 100.0Missing System 46 26.9
Total 171 100.0
Digitized by South Carolina State Library
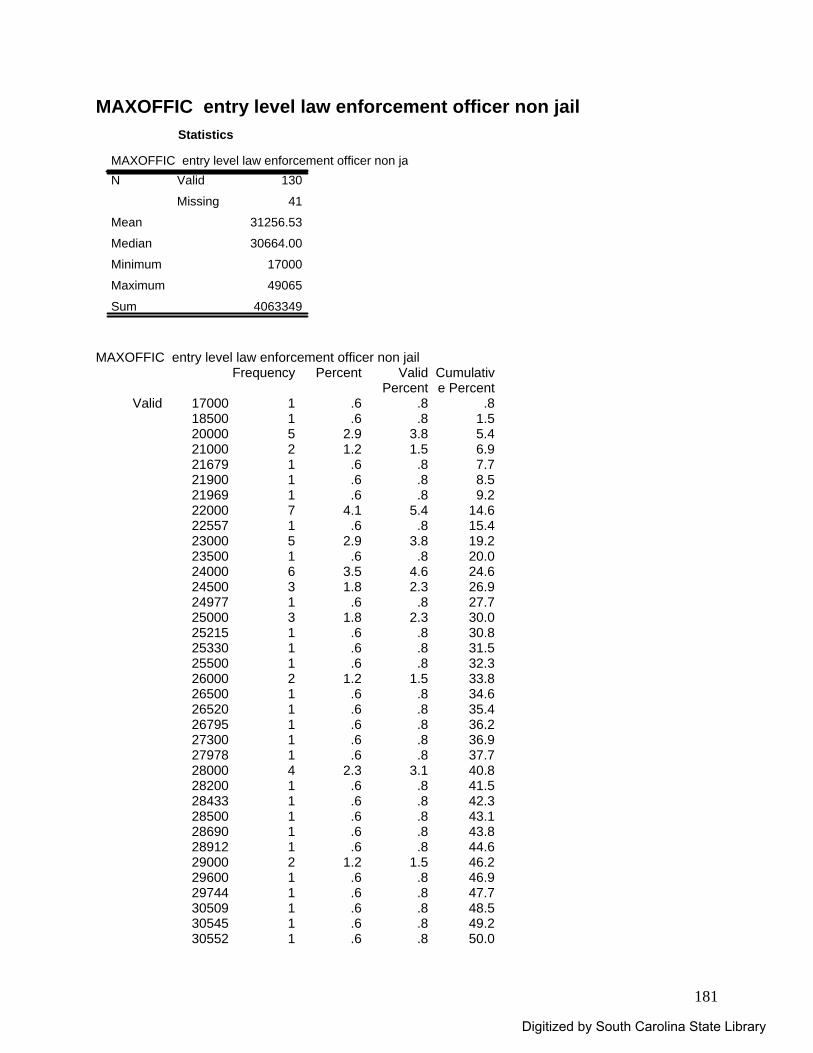
181
MAXOFFIC entry level law enforcement officer non jail Statistics
MAXOFFIC entry level law enforcement officer non jai130
41
31256.53
30664.00
17000
49065
4063349
Valid
Missing
N
Mean
Median
Minimum
Maximum
Sum
MAXOFFIC entry level law enforcement officer non jail
Frequency Percent Valid Percent
Cumulative Percent
Valid 17000 1 .6 .8 .818500 1 .6 .8 1.520000 5 2.9 3.8 5.421000 2 1.2 1.5 6.921679 1 .6 .8 7.721900 1 .6 .8 8.521969 1 .6 .8 9.222000 7 4.1 5.4 14.622557 1 .6 .8 15.423000 5 2.9 3.8 19.223500 1 .6 .8 20.024000 6 3.5 4.6 24.624500 3 1.8 2.3 26.924977 1 .6 .8 27.725000 3 1.8 2.3 30.025215 1 .6 .8 30.825330 1 .6 .8 31.525500 1 .6 .8 32.326000 2 1.2 1.5 33.826500 1 .6 .8 34.626520 1 .6 .8 35.426795 1 .6 .8 36.227300 1 .6 .8 36.927978 1 .6 .8 37.728000 4 2.3 3.1 40.828200 1 .6 .8 41.528433 1 .6 .8 42.328500 1 .6 .8 43.128690 1 .6 .8 43.828912 1 .6 .8 44.629000 2 1.2 1.5 46.229600 1 .6 .8 46.929744 1 .6 .8 47.730509 1 .6 .8 48.530545 1 .6 .8 49.230552 1 .6 .8 50.0
Digitized by South Carolina State Library
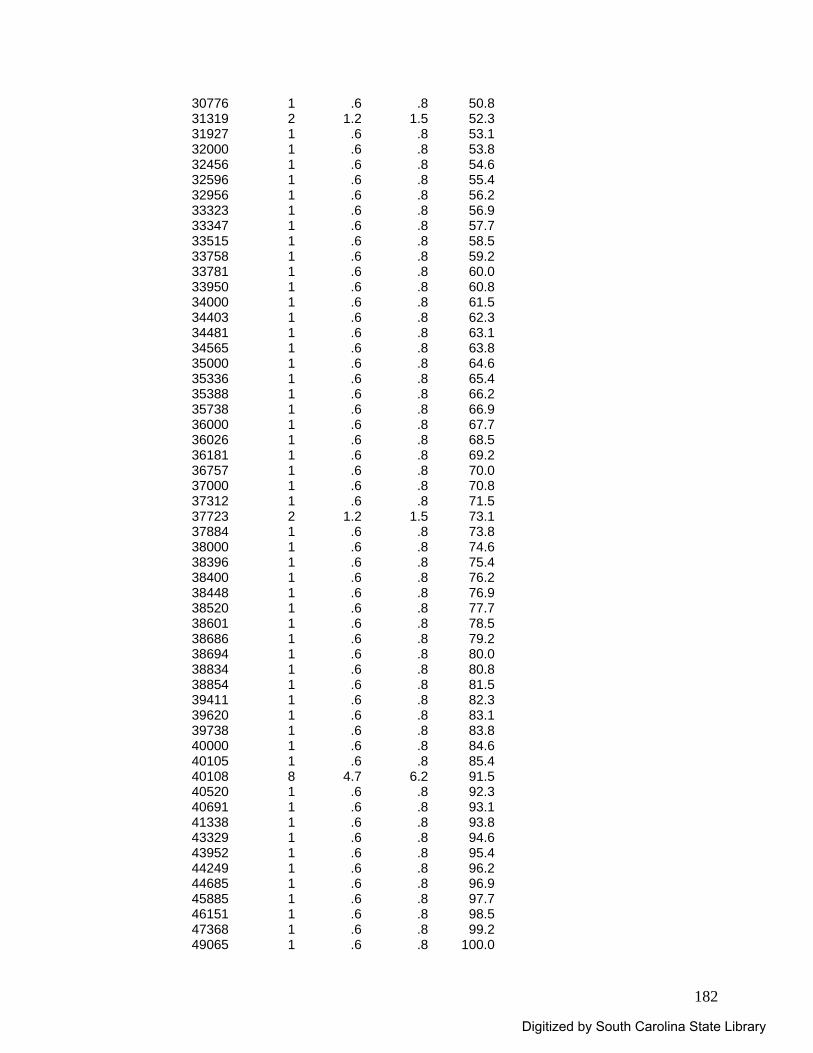
182
30776 1 .6 .8 50.831319 2 1.2 1.5 52.331927 1 .6 .8 53.132000 1 .6 .8 53.832456 1 .6 .8 54.632596 1 .6 .8 55.432956 1 .6 .8 56.233323 1 .6 .8 56.933347 1 .6 .8 57.733515 1 .6 .8 58.533758 1 .6 .8 59.233781 1 .6 .8 60.033950 1 .6 .8 60.834000 1 .6 .8 61.534403 1 .6 .8 62.334481 1 .6 .8 63.134565 1 .6 .8 63.835000 1 .6 .8 64.635336 1 .6 .8 65.435388 1 .6 .8 66.235738 1 .6 .8 66.936000 1 .6 .8 67.736026 1 .6 .8 68.536181 1 .6 .8 69.236757 1 .6 .8 70.037000 1 .6 .8 70.837312 1 .6 .8 71.537723 2 1.2 1.5 73.137884 1 .6 .8 73.838000 1 .6 .8 74.638396 1 .6 .8 75.438400 1 .6 .8 76.238448 1 .6 .8 76.938520 1 .6 .8 77.738601 1 .6 .8 78.538686 1 .6 .8 79.238694 1 .6 .8 80.038834 1 .6 .8 80.838854 1 .6 .8 81.539411 1 .6 .8 82.339620 1 .6 .8 83.139738 1 .6 .8 83.840000 1 .6 .8 84.640105 1 .6 .8 85.440108 8 4.7 6.2 91.540520 1 .6 .8 92.340691 1 .6 .8 93.141338 1 .6 .8 93.843329 1 .6 .8 94.643952 1 .6 .8 95.444249 1 .6 .8 96.244685 1 .6 .8 96.945885 1 .6 .8 97.746151 1 .6 .8 98.547368 1 .6 .8 99.249065 1 .6 .8 100.0
Digitized by South Carolina State Library
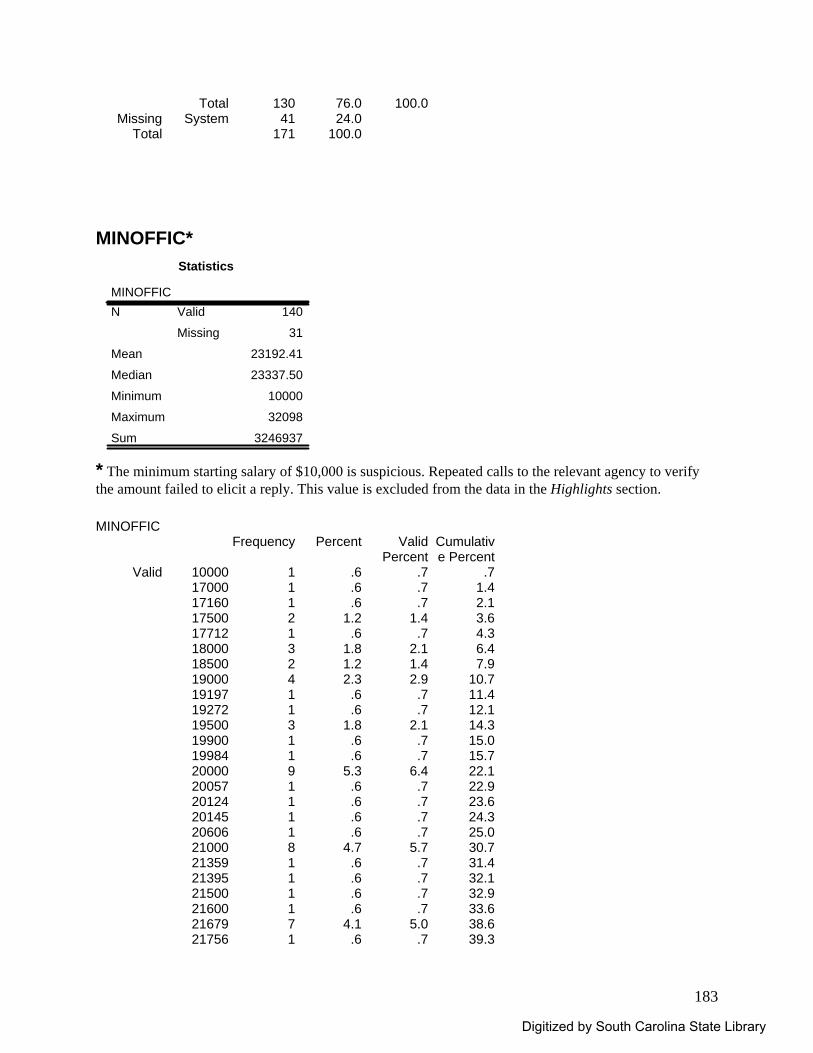
183
Total 130 76.0 100.0Missing System 41 24.0
Total 171 100.0 MINOFFIC*
Statistics
MINOFFIC140
31
23192.41
23337.50
10000
32098
3246937
Valid
Missing
N
Mean
Median
Minimum
Maximum
Sum
* The minimum starting salary of $10,000 is suspicious. Repeated calls to the relevant agency to verify the amount failed to elicit a reply. This value is excluded from the data in the Highlights section. MINOFFIC
Frequency Percent Valid Percent
Cumulative Percent
Valid 10000 1 .6 .7 .717000 1 .6 .7 1.417160 1 .6 .7 2.117500 2 1.2 1.4 3.617712 1 .6 .7 4.318000 3 1.8 2.1 6.418500 2 1.2 1.4 7.919000 4 2.3 2.9 10.719197 1 .6 .7 11.419272 1 .6 .7 12.119500 3 1.8 2.1 14.319900 1 .6 .7 15.019984 1 .6 .7 15.720000 9 5.3 6.4 22.120057 1 .6 .7 22.920124 1 .6 .7 23.620145 1 .6 .7 24.320606 1 .6 .7 25.021000 8 4.7 5.7 30.721359 1 .6 .7 31.421395 1 .6 .7 32.121500 1 .6 .7 32.921600 1 .6 .7 33.621679 7 4.1 5.0 38.621756 1 .6 .7 39.3
Digitized by South Carolina State Library
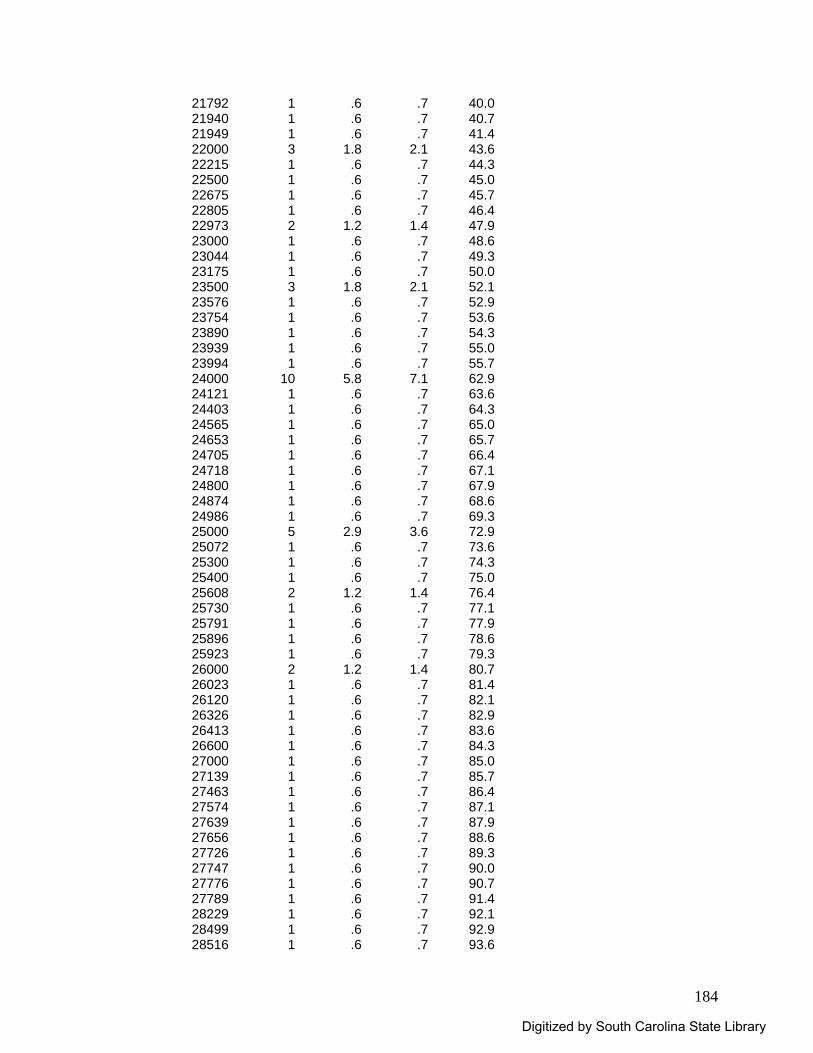
184
21792 1 .6 .7 40.021940 1 .6 .7 40.721949 1 .6 .7 41.422000 3 1.8 2.1 43.622215 1 .6 .7 44.322500 1 .6 .7 45.022675 1 .6 .7 45.722805 1 .6 .7 46.422973 2 1.2 1.4 47.923000 1 .6 .7 48.623044 1 .6 .7 49.323175 1 .6 .7 50.023500 3 1.8 2.1 52.123576 1 .6 .7 52.923754 1 .6 .7 53.623890 1 .6 .7 54.323939 1 .6 .7 55.023994 1 .6 .7 55.724000 10 5.8 7.1 62.924121 1 .6 .7 63.624403 1 .6 .7 64.324565 1 .6 .7 65.024653 1 .6 .7 65.724705 1 .6 .7 66.424718 1 .6 .7 67.124800 1 .6 .7 67.924874 1 .6 .7 68.624986 1 .6 .7 69.325000 5 2.9 3.6 72.925072 1 .6 .7 73.625300 1 .6 .7 74.325400 1 .6 .7 75.025608 2 1.2 1.4 76.425730 1 .6 .7 77.125791 1 .6 .7 77.925896 1 .6 .7 78.625923 1 .6 .7 79.326000 2 1.2 1.4 80.726023 1 .6 .7 81.426120 1 .6 .7 82.126326 1 .6 .7 82.926413 1 .6 .7 83.626600 1 .6 .7 84.327000 1 .6 .7 85.027139 1 .6 .7 85.727463 1 .6 .7 86.427574 1 .6 .7 87.127639 1 .6 .7 87.927656 1 .6 .7 88.627726 1 .6 .7 89.327747 1 .6 .7 90.027776 1 .6 .7 90.727789 1 .6 .7 91.428229 1 .6 .7 92.128499 1 .6 .7 92.928516 1 .6 .7 93.6
Digitized by South Carolina State Library
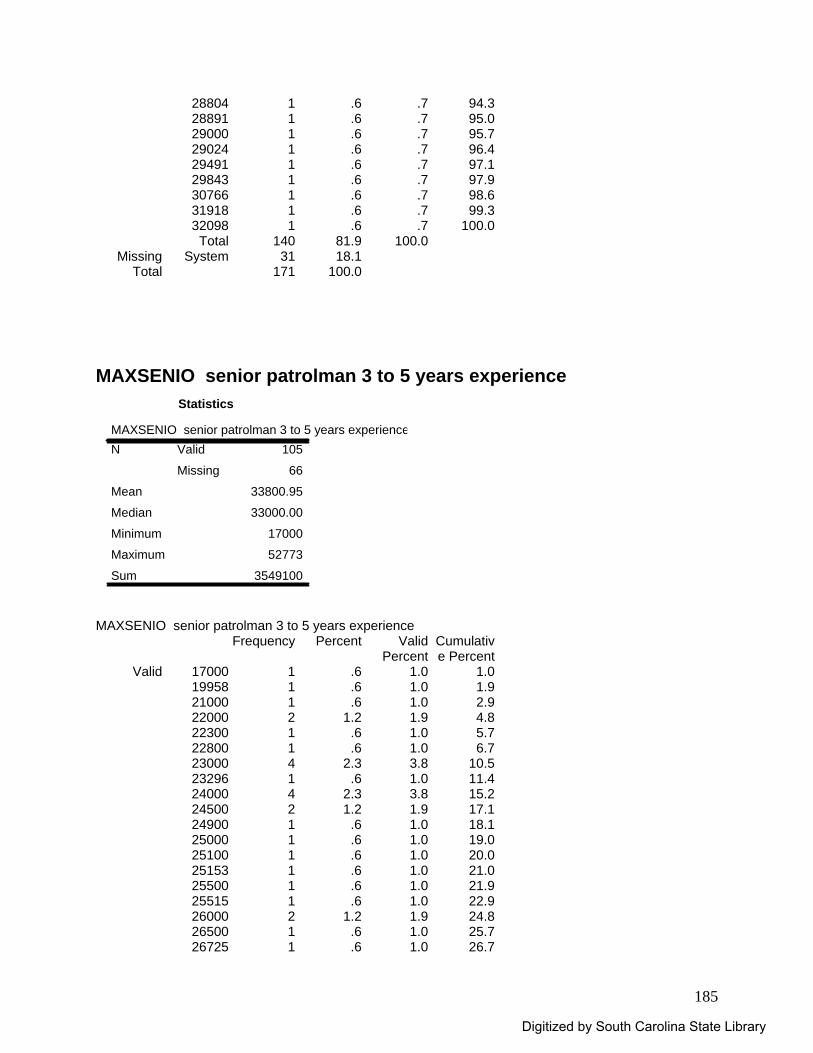
185
28804 1 .6 .7 94.328891 1 .6 .7 95.029000 1 .6 .7 95.729024 1 .6 .7 96.429491 1 .6 .7 97.129843 1 .6 .7 97.930766 1 .6 .7 98.631918 1 .6 .7 99.332098 1 .6 .7 100.0
Total 140 81.9 100.0Missing System 31 18.1
Total 171 100.0 MAXSENIO senior patrolman 3 to 5 years experience
Statistics
MAXSENIO senior patrolman 3 to 5 years experience105
66
33800.95
33000.00
17000
52773
3549100
Valid
Missing
N
Mean
Median
Minimum
Maximum
Sum
MAXSENIO senior patrolman 3 to 5 years experience
Frequency Percent Valid Percent
Cumulative Percent
Valid 17000 1 .6 1.0 1.019958 1 .6 1.0 1.921000 1 .6 1.0 2.922000 2 1.2 1.9 4.822300 1 .6 1.0 5.722800 1 .6 1.0 6.723000 4 2.3 3.8 10.523296 1 .6 1.0 11.424000 4 2.3 3.8 15.224500 2 1.2 1.9 17.124900 1 .6 1.0 18.125000 1 .6 1.0 19.025100 1 .6 1.0 20.025153 1 .6 1.0 21.025500 1 .6 1.0 21.925515 1 .6 1.0 22.926000 2 1.2 1.9 24.826500 1 .6 1.0 25.726725 1 .6 1.0 26.7
Digitized by South Carolina State Library
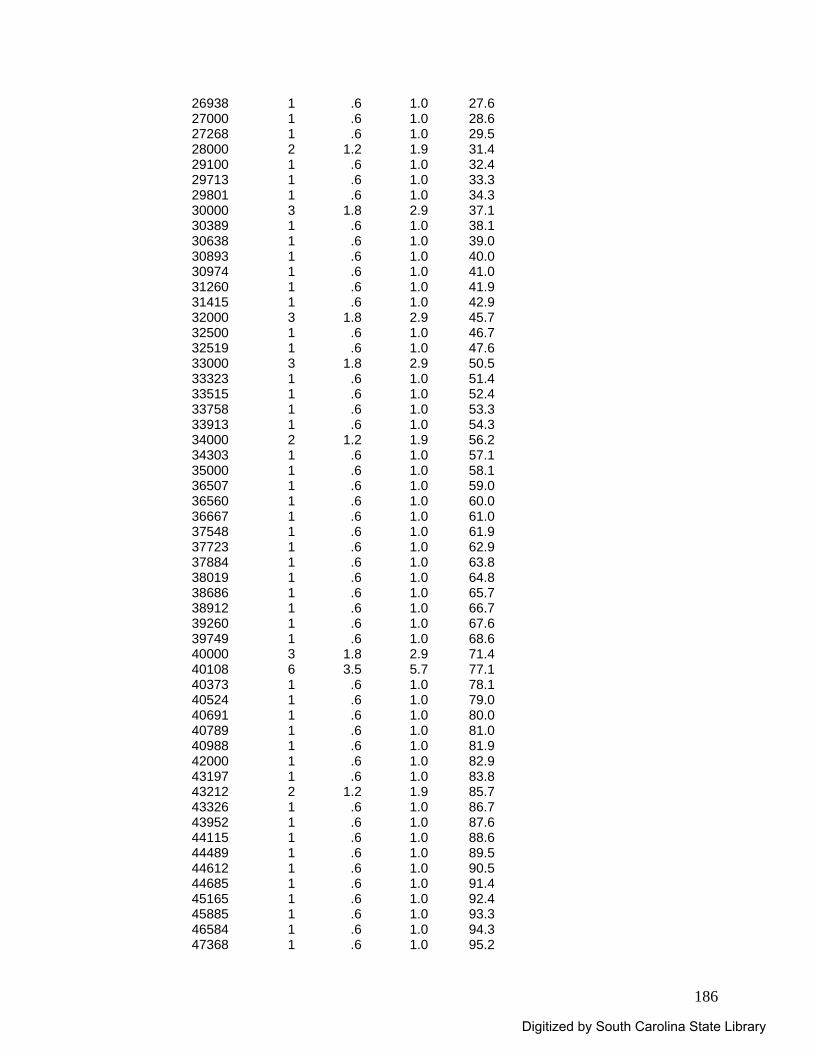
186
26938 1 .6 1.0 27.627000 1 .6 1.0 28.627268 1 .6 1.0 29.528000 2 1.2 1.9 31.429100 1 .6 1.0 32.429713 1 .6 1.0 33.329801 1 .6 1.0 34.330000 3 1.8 2.9 37.130389 1 .6 1.0 38.130638 1 .6 1.0 39.030893 1 .6 1.0 40.030974 1 .6 1.0 41.031260 1 .6 1.0 41.931415 1 .6 1.0 42.932000 3 1.8 2.9 45.732500 1 .6 1.0 46.732519 1 .6 1.0 47.633000 3 1.8 2.9 50.533323 1 .6 1.0 51.433515 1 .6 1.0 52.433758 1 .6 1.0 53.333913 1 .6 1.0 54.334000 2 1.2 1.9 56.234303 1 .6 1.0 57.135000 1 .6 1.0 58.136507 1 .6 1.0 59.036560 1 .6 1.0 60.036667 1 .6 1.0 61.037548 1 .6 1.0 61.937723 1 .6 1.0 62.937884 1 .6 1.0 63.838019 1 .6 1.0 64.838686 1 .6 1.0 65.738912 1 .6 1.0 66.739260 1 .6 1.0 67.639749 1 .6 1.0 68.640000 3 1.8 2.9 71.440108 6 3.5 5.7 77.140373 1 .6 1.0 78.140524 1 .6 1.0 79.040691 1 .6 1.0 80.040789 1 .6 1.0 81.040988 1 .6 1.0 81.942000 1 .6 1.0 82.943197 1 .6 1.0 83.843212 2 1.2 1.9 85.743326 1 .6 1.0 86.743952 1 .6 1.0 87.644115 1 .6 1.0 88.644489 1 .6 1.0 89.544612 1 .6 1.0 90.544685 1 .6 1.0 91.445165 1 .6 1.0 92.445885 1 .6 1.0 93.346584 1 .6 1.0 94.347368 1 .6 1.0 95.2
Digitized by South Carolina State Library
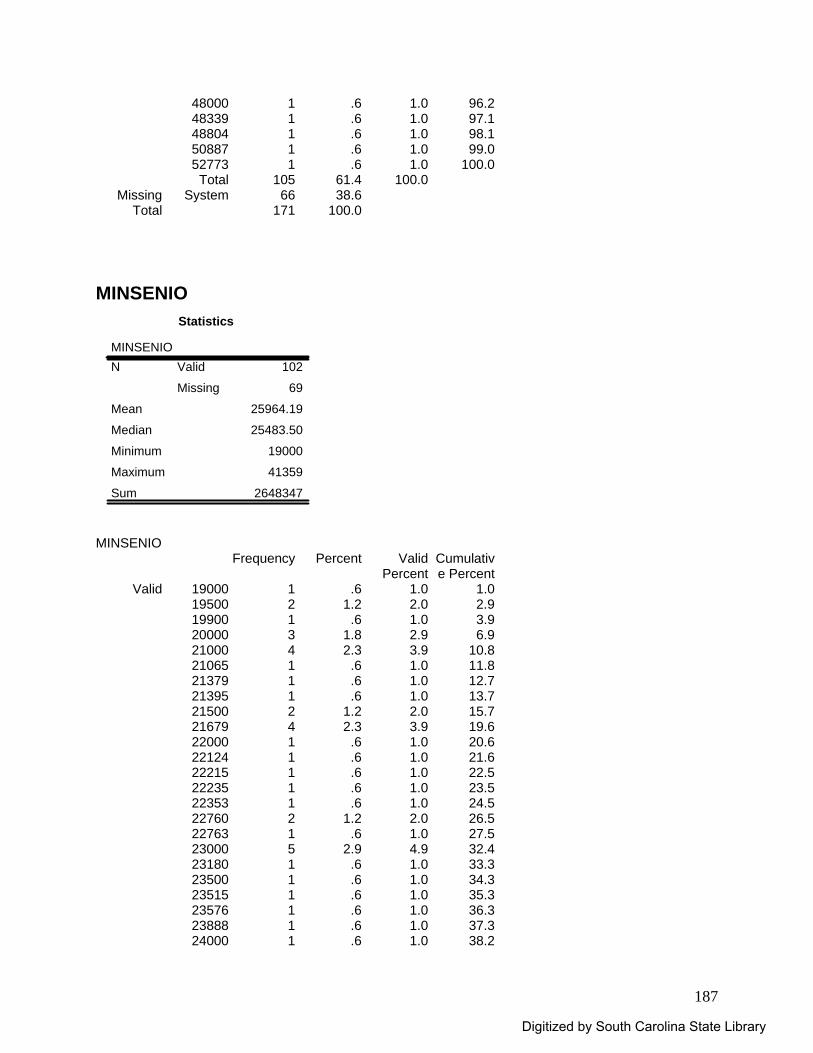
187
48000 1 .6 1.0 96.248339 1 .6 1.0 97.148804 1 .6 1.0 98.150887 1 .6 1.0 99.052773 1 .6 1.0 100.0
Total 105 61.4 100.0Missing System 66 38.6
Total 171 100.0 MINSENIO
Statistics
MINSENIO102
69
25964.19
25483.50
19000
41359
2648347
Valid
Missing
N
Mean
Median
Minimum
Maximum
Sum
MINSENIO
Frequency Percent Valid Percent
Cumulative Percent
Valid 19000 1 .6 1.0 1.019500 2 1.2 2.0 2.919900 1 .6 1.0 3.920000 3 1.8 2.9 6.921000 4 2.3 3.9 10.821065 1 .6 1.0 11.821379 1 .6 1.0 12.721395 1 .6 1.0 13.721500 2 1.2 2.0 15.721679 4 2.3 3.9 19.622000 1 .6 1.0 20.622124 1 .6 1.0 21.622215 1 .6 1.0 22.522235 1 .6 1.0 23.522353 1 .6 1.0 24.522760 2 1.2 2.0 26.522763 1 .6 1.0 27.523000 5 2.9 4.9 32.423180 1 .6 1.0 33.323500 1 .6 1.0 34.323515 1 .6 1.0 35.323576 1 .6 1.0 36.323888 1 .6 1.0 37.324000 1 .6 1.0 38.2
Digitized by South Carolina State Library
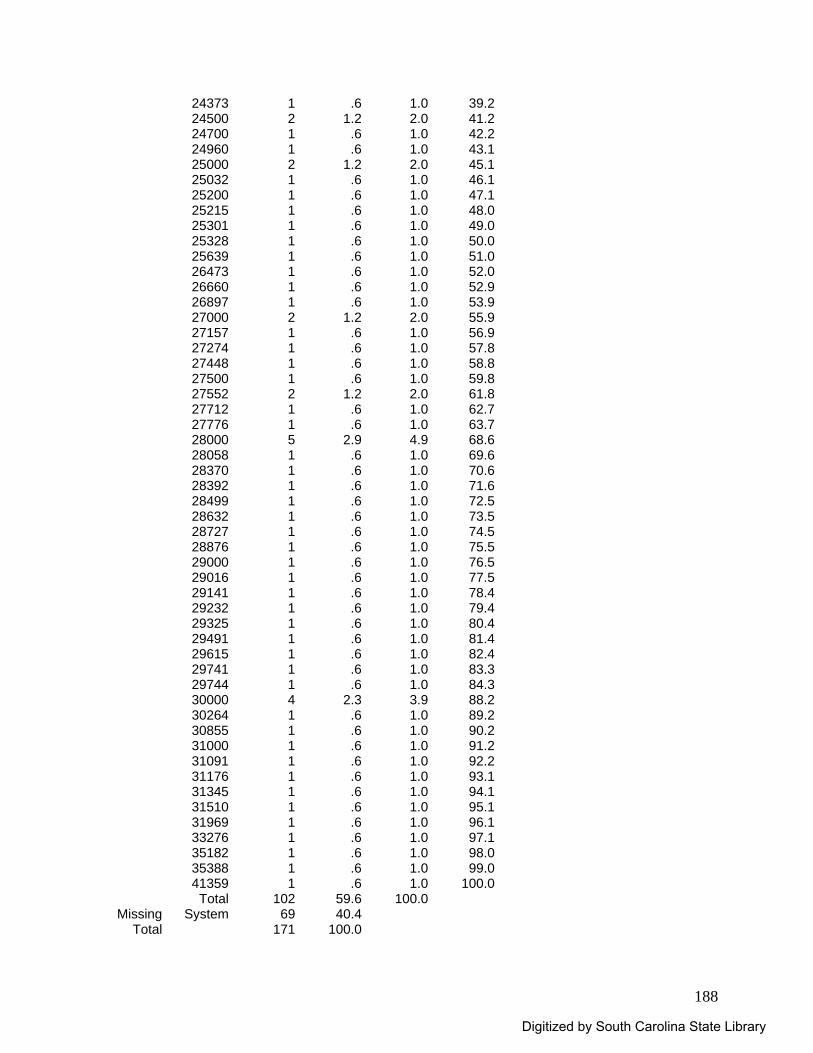
188
24373 1 .6 1.0 39.224500 2 1.2 2.0 41.224700 1 .6 1.0 42.224960 1 .6 1.0 43.125000 2 1.2 2.0 45.125032 1 .6 1.0 46.125200 1 .6 1.0 47.125215 1 .6 1.0 48.025301 1 .6 1.0 49.025328 1 .6 1.0 50.025639 1 .6 1.0 51.026473 1 .6 1.0 52.026660 1 .6 1.0 52.926897 1 .6 1.0 53.927000 2 1.2 2.0 55.927157 1 .6 1.0 56.927274 1 .6 1.0 57.827448 1 .6 1.0 58.827500 1 .6 1.0 59.827552 2 1.2 2.0 61.827712 1 .6 1.0 62.727776 1 .6 1.0 63.728000 5 2.9 4.9 68.628058 1 .6 1.0 69.628370 1 .6 1.0 70.628392 1 .6 1.0 71.628499 1 .6 1.0 72.528632 1 .6 1.0 73.528727 1 .6 1.0 74.528876 1 .6 1.0 75.529000 1 .6 1.0 76.529016 1 .6 1.0 77.529141 1 .6 1.0 78.429232 1 .6 1.0 79.429325 1 .6 1.0 80.429491 1 .6 1.0 81.429615 1 .6 1.0 82.429741 1 .6 1.0 83.329744 1 .6 1.0 84.330000 4 2.3 3.9 88.230264 1 .6 1.0 89.230855 1 .6 1.0 90.231000 1 .6 1.0 91.231091 1 .6 1.0 92.231176 1 .6 1.0 93.131345 1 .6 1.0 94.131510 1 .6 1.0 95.131969 1 .6 1.0 96.133276 1 .6 1.0 97.135182 1 .6 1.0 98.035388 1 .6 1.0 99.041359 1 .6 1.0 100.0
Total 102 59.6 100.0Missing System 69 40.4
Total 171 100.0
Digitized by South Carolina State Library
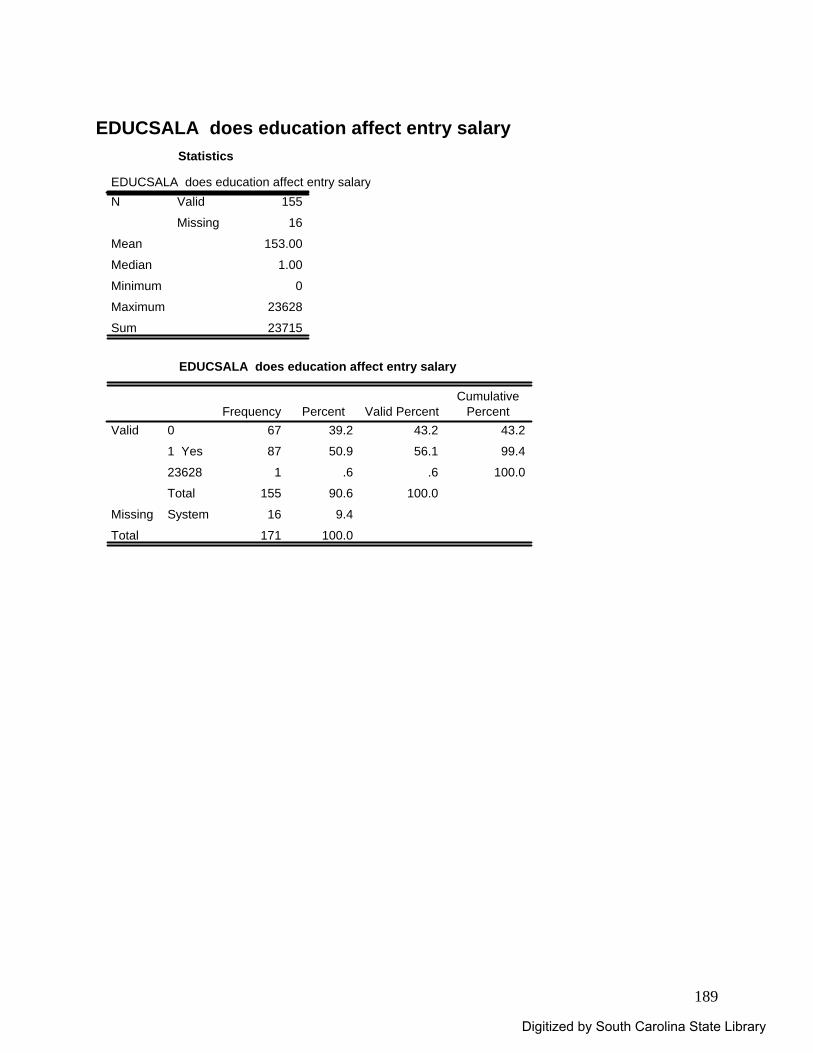
189
EDUCSALA does education affect entry salary
Statistics
EDUCSALA does education affect entry salary155
16
153.00
1.00
0
23628
23715
Valid
Missing
N
Mean
Median
Minimum
Maximum
Sum
EDUCSALA does education affect entry salary
67 39.2 43.2 43.2
87 50.9 56.1 99.4
1 .6 .6 100.0
155 90.6 100.0
16 9.4
171 100.0
0
1 Yes
23628
Total
Valid
SystemMissing
Total
Frequency Percent Valid PercentCumulative
Percent
Digitized by South Carolina State Library
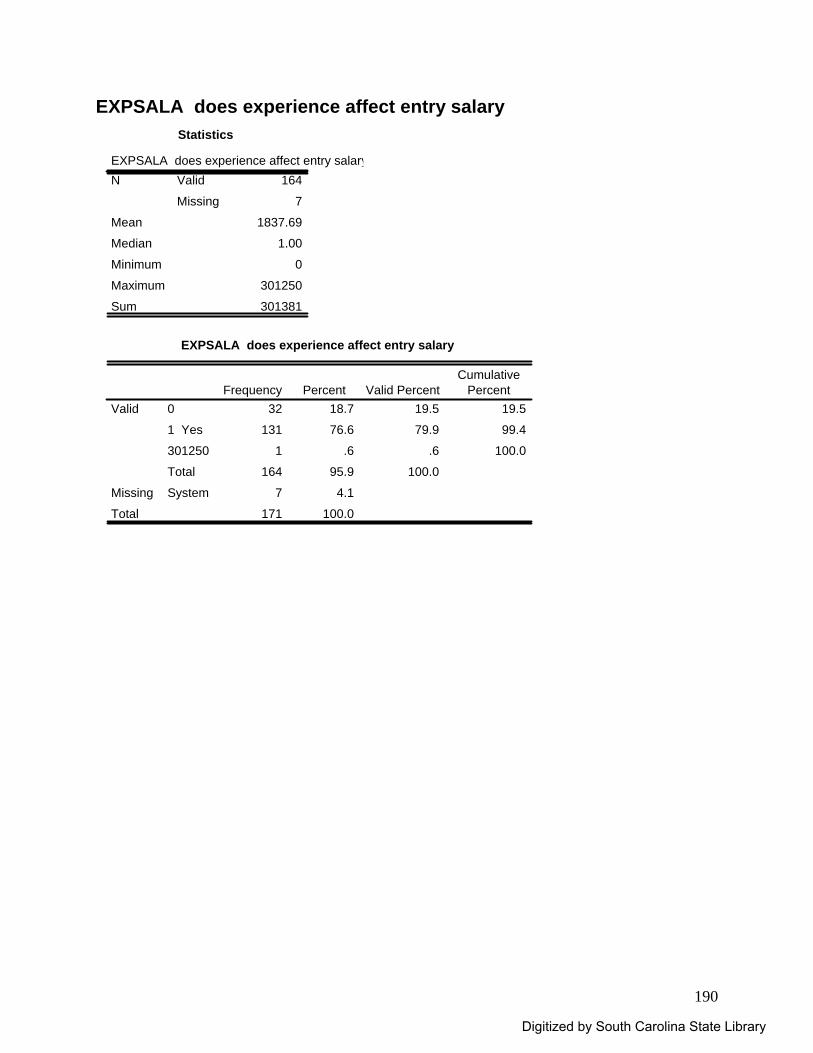
190
EXPSALA does experience affect entry salary Statistics
EXPSALA does experience affect entry salary164
7
1837.69
1.00
0
301250
301381
Valid
Missing
N
Mean
Median
Minimum
Maximum
Sum
EXPSALA does experience affect entry salary
32 18.7 19.5 19.5
131 76.6 79.9 99.4
1 .6 .6 100.0
164 95.9 100.0
7 4.1
171 100.0
0
1 Yes
301250
Total
Valid
SystemMissing
Total
Frequency Percent Valid PercentCumulative
Percent
Digitized by South Carolina State Library
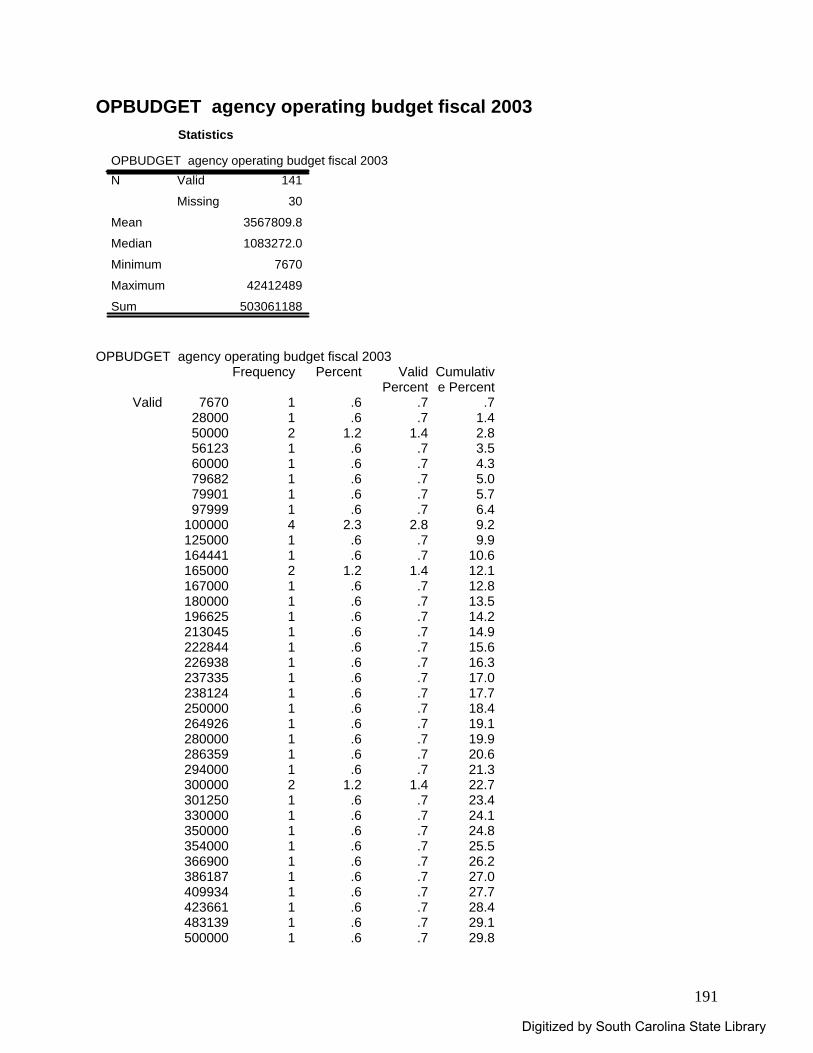
191
OPBUDGET agency operating budget fiscal 2003 Statistics
OPBUDGET agency operating budget fiscal 2003141
30
3567809.8
1083272.0
7670
42412489
503061188
Valid
Missing
N
Mean
Median
Minimum
Maximum
Sum
OPBUDGET agency operating budget fiscal 2003
Frequency Percent Valid Percent
Cumulative Percent
Valid 7670 1 .6 .7 .728000 1 .6 .7 1.450000 2 1.2 1.4 2.856123 1 .6 .7 3.560000 1 .6 .7 4.379682 1 .6 .7 5.079901 1 .6 .7 5.797999 1 .6 .7 6.4
100000 4 2.3 2.8 9.2125000 1 .6 .7 9.9164441 1 .6 .7 10.6165000 2 1.2 1.4 12.1167000 1 .6 .7 12.8180000 1 .6 .7 13.5196625 1 .6 .7 14.2213045 1 .6 .7 14.9222844 1 .6 .7 15.6226938 1 .6 .7 16.3237335 1 .6 .7 17.0238124 1 .6 .7 17.7250000 1 .6 .7 18.4264926 1 .6 .7 19.1280000 1 .6 .7 19.9286359 1 .6 .7 20.6294000 1 .6 .7 21.3300000 2 1.2 1.4 22.7301250 1 .6 .7 23.4330000 1 .6 .7 24.1350000 1 .6 .7 24.8354000 1 .6 .7 25.5366900 1 .6 .7 26.2386187 1 .6 .7 27.0409934 1 .6 .7 27.7423661 1 .6 .7 28.4483139 1 .6 .7 29.1500000 1 .6 .7 29.8
Digitized by South Carolina State Library
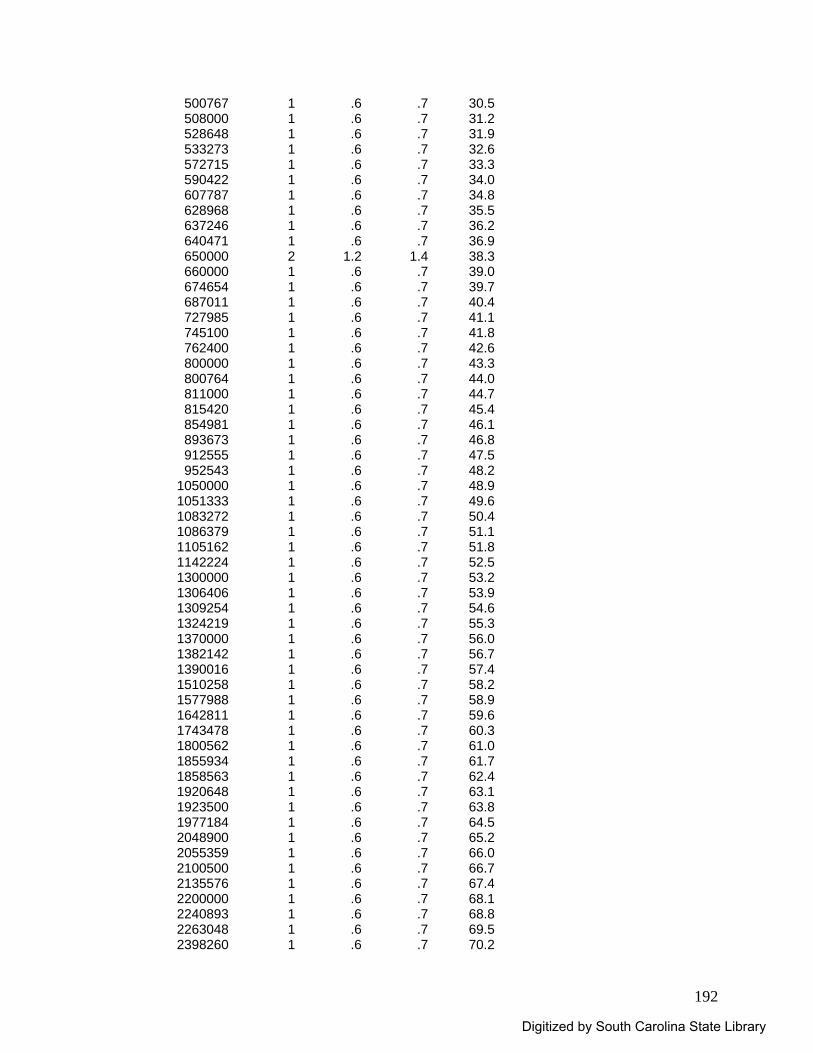
192
500767 1 .6 .7 30.5508000 1 .6 .7 31.2528648 1 .6 .7 31.9533273 1 .6 .7 32.6572715 1 .6 .7 33.3590422 1 .6 .7 34.0607787 1 .6 .7 34.8628968 1 .6 .7 35.5637246 1 .6 .7 36.2640471 1 .6 .7 36.9650000 2 1.2 1.4 38.3660000 1 .6 .7 39.0674654 1 .6 .7 39.7687011 1 .6 .7 40.4727985 1 .6 .7 41.1745100 1 .6 .7 41.8762400 1 .6 .7 42.6800000 1 .6 .7 43.3800764 1 .6 .7 44.0811000 1 .6 .7 44.7815420 1 .6 .7 45.4854981 1 .6 .7 46.1893673 1 .6 .7 46.8912555 1 .6 .7 47.5952543 1 .6 .7 48.2
1050000 1 .6 .7 48.91051333 1 .6 .7 49.61083272 1 .6 .7 50.41086379 1 .6 .7 51.11105162 1 .6 .7 51.81142224 1 .6 .7 52.51300000 1 .6 .7 53.21306406 1 .6 .7 53.91309254 1 .6 .7 54.61324219 1 .6 .7 55.31370000 1 .6 .7 56.01382142 1 .6 .7 56.71390016 1 .6 .7 57.41510258 1 .6 .7 58.21577988 1 .6 .7 58.91642811 1 .6 .7 59.61743478 1 .6 .7 60.31800562 1 .6 .7 61.01855934 1 .6 .7 61.71858563 1 .6 .7 62.41920648 1 .6 .7 63.11923500 1 .6 .7 63.81977184 1 .6 .7 64.52048900 1 .6 .7 65.22055359 1 .6 .7 66.02100500 1 .6 .7 66.72135576 1 .6 .7 67.42200000 1 .6 .7 68.12240893 1 .6 .7 68.82263048 1 .6 .7 69.52398260 1 .6 .7 70.2
Digitized by South Carolina State Library
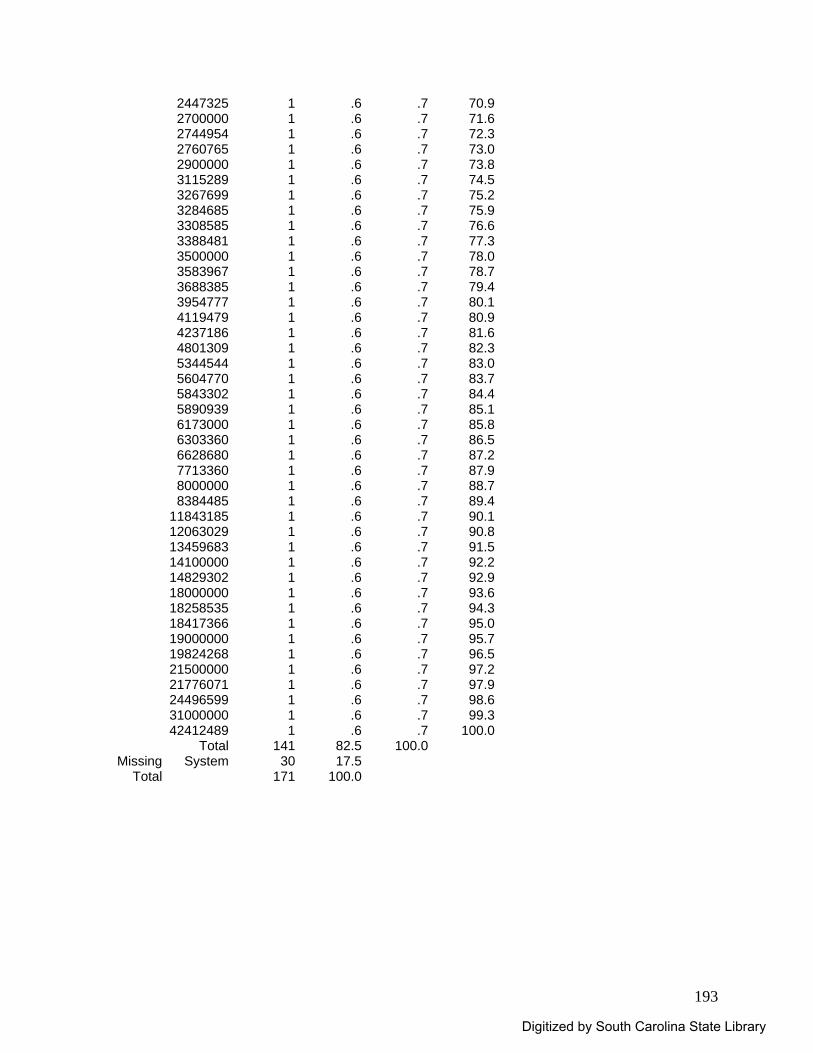
193
2447325 1 .6 .7 70.92700000 1 .6 .7 71.62744954 1 .6 .7 72.32760765 1 .6 .7 73.02900000 1 .6 .7 73.83115289 1 .6 .7 74.53267699 1 .6 .7 75.23284685 1 .6 .7 75.93308585 1 .6 .7 76.63388481 1 .6 .7 77.33500000 1 .6 .7 78.03583967 1 .6 .7 78.73688385 1 .6 .7 79.43954777 1 .6 .7 80.14119479 1 .6 .7 80.94237186 1 .6 .7 81.64801309 1 .6 .7 82.35344544 1 .6 .7 83.05604770 1 .6 .7 83.75843302 1 .6 .7 84.45890939 1 .6 .7 85.16173000 1 .6 .7 85.86303360 1 .6 .7 86.56628680 1 .6 .7 87.27713360 1 .6 .7 87.98000000 1 .6 .7 88.78384485 1 .6 .7 89.4
11843185 1 .6 .7 90.112063029 1 .6 .7 90.813459683 1 .6 .7 91.514100000 1 .6 .7 92.214829302 1 .6 .7 92.918000000 1 .6 .7 93.618258535 1 .6 .7 94.318417366 1 .6 .7 95.019000000 1 .6 .7 95.719824268 1 .6 .7 96.521500000 1 .6 .7 97.221776071 1 .6 .7 97.924496599 1 .6 .7 98.631000000 1 .6 .7 99.342412489 1 .6 .7 100.0
Total 141 82.5 100.0Missing System 30 17.5
Total 171 100.0
Digitized by South Carolina State Library
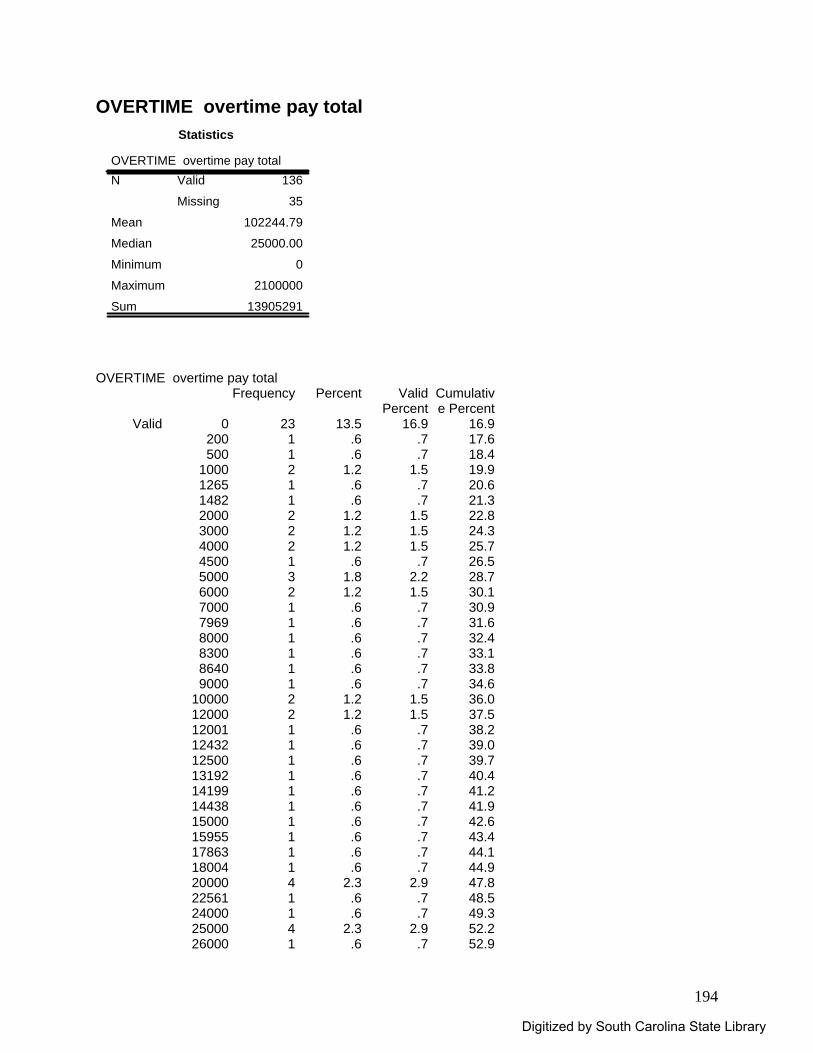
194
OVERTIME overtime pay total Statistics
OVERTIME overtime pay total136
35
102244.79
25000.00
0
2100000
13905291
Valid
Missing
N
Mean
Median
Minimum
Maximum
Sum
OVERTIME overtime pay total
Frequency Percent Valid Percent
Cumulative Percent
Valid 0 23 13.5 16.9 16.9200 1 .6 .7 17.6500 1 .6 .7 18.4
1000 2 1.2 1.5 19.91265 1 .6 .7 20.61482 1 .6 .7 21.32000 2 1.2 1.5 22.83000 2 1.2 1.5 24.34000 2 1.2 1.5 25.74500 1 .6 .7 26.55000 3 1.8 2.2 28.76000 2 1.2 1.5 30.17000 1 .6 .7 30.97969 1 .6 .7 31.68000 1 .6 .7 32.48300 1 .6 .7 33.18640 1 .6 .7 33.89000 1 .6 .7 34.6
10000 2 1.2 1.5 36.012000 2 1.2 1.5 37.512001 1 .6 .7 38.212432 1 .6 .7 39.012500 1 .6 .7 39.713192 1 .6 .7 40.414199 1 .6 .7 41.214438 1 .6 .7 41.915000 1 .6 .7 42.615955 1 .6 .7 43.417863 1 .6 .7 44.118004 1 .6 .7 44.920000 4 2.3 2.9 47.822561 1 .6 .7 48.524000 1 .6 .7 49.325000 4 2.3 2.9 52.226000 1 .6 .7 52.9
Digitized by South Carolina State Library
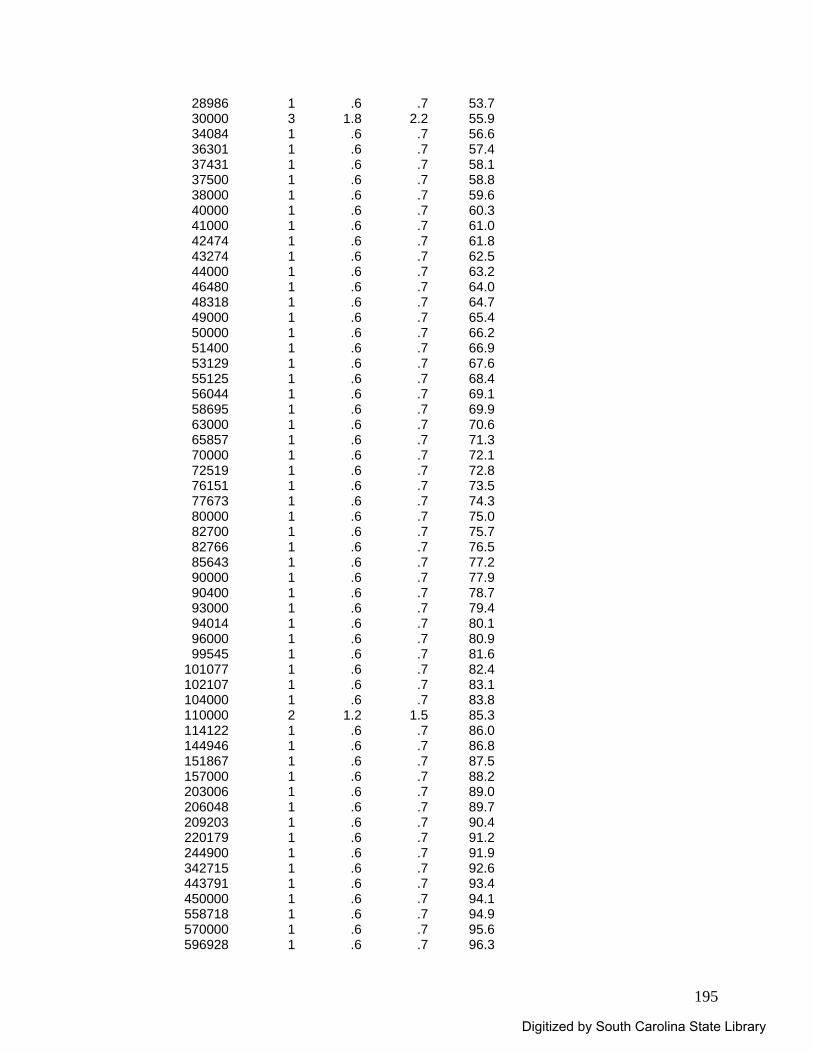
195
28986 1 .6 .7 53.730000 3 1.8 2.2 55.934084 1 .6 .7 56.636301 1 .6 .7 57.437431 1 .6 .7 58.137500 1 .6 .7 58.838000 1 .6 .7 59.640000 1 .6 .7 60.341000 1 .6 .7 61.042474 1 .6 .7 61.843274 1 .6 .7 62.544000 1 .6 .7 63.246480 1 .6 .7 64.048318 1 .6 .7 64.749000 1 .6 .7 65.450000 1 .6 .7 66.251400 1 .6 .7 66.953129 1 .6 .7 67.655125 1 .6 .7 68.456044 1 .6 .7 69.158695 1 .6 .7 69.963000 1 .6 .7 70.665857 1 .6 .7 71.370000 1 .6 .7 72.172519 1 .6 .7 72.876151 1 .6 .7 73.577673 1 .6 .7 74.380000 1 .6 .7 75.082700 1 .6 .7 75.782766 1 .6 .7 76.585643 1 .6 .7 77.290000 1 .6 .7 77.990400 1 .6 .7 78.793000 1 .6 .7 79.494014 1 .6 .7 80.196000 1 .6 .7 80.999545 1 .6 .7 81.6
101077 1 .6 .7 82.4102107 1 .6 .7 83.1104000 1 .6 .7 83.8110000 2 1.2 1.5 85.3114122 1 .6 .7 86.0144946 1 .6 .7 86.8151867 1 .6 .7 87.5157000 1 .6 .7 88.2203006 1 .6 .7 89.0206048 1 .6 .7 89.7209203 1 .6 .7 90.4220179 1 .6 .7 91.2244900 1 .6 .7 91.9342715 1 .6 .7 92.6443791 1 .6 .7 93.4450000 1 .6 .7 94.1558718 1 .6 .7 94.9570000 1 .6 .7 95.6596928 1 .6 .7 96.3
Digitized by South Carolina State Library
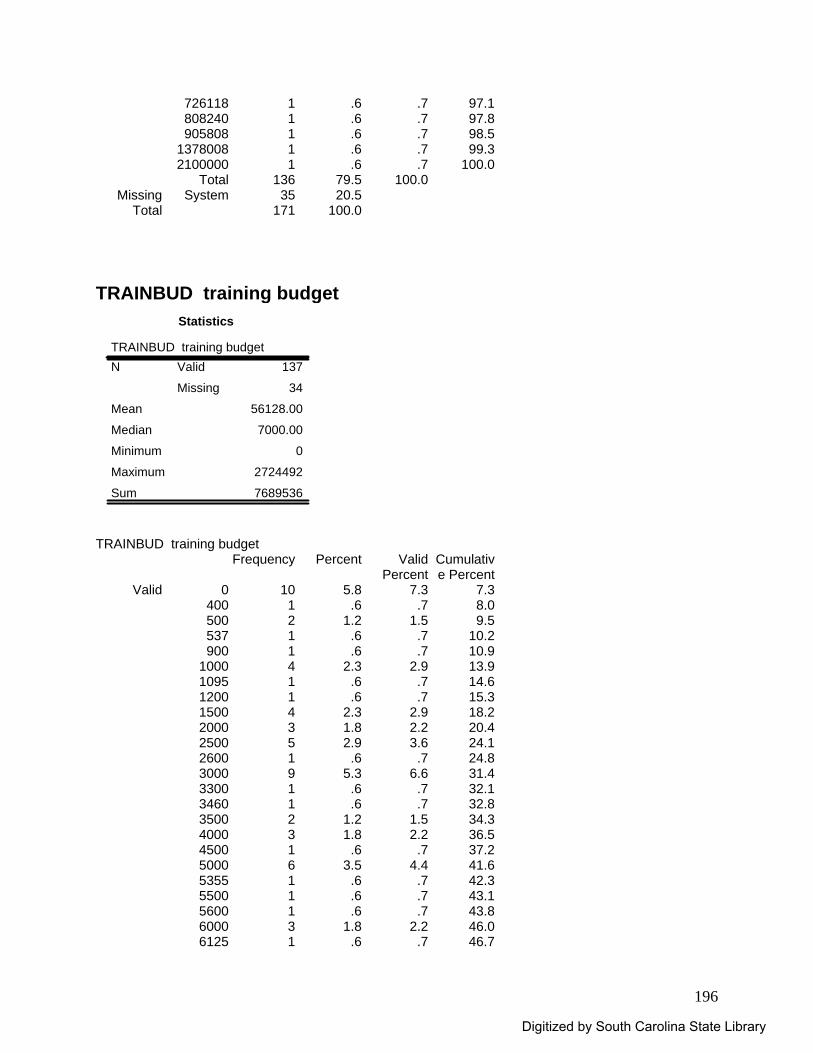
196
726118 1 .6 .7 97.1808240 1 .6 .7 97.8905808 1 .6 .7 98.5
1378008 1 .6 .7 99.32100000 1 .6 .7 100.0
Total 136 79.5 100.0Missing System 35 20.5
Total 171 100.0 TRAINBUD training budget
Statistics
TRAINBUD training budget137
34
56128.00
7000.00
0
2724492
7689536
Valid
Missing
N
Mean
Median
Minimum
Maximum
Sum
TRAINBUD training budget
Frequency Percent Valid Percent
Cumulative Percent
Valid 0 10 5.8 7.3 7.3400 1 .6 .7 8.0500 2 1.2 1.5 9.5537 1 .6 .7 10.2900 1 .6 .7 10.9
1000 4 2.3 2.9 13.91095 1 .6 .7 14.61200 1 .6 .7 15.31500 4 2.3 2.9 18.22000 3 1.8 2.2 20.42500 5 2.9 3.6 24.12600 1 .6 .7 24.83000 9 5.3 6.6 31.43300 1 .6 .7 32.13460 1 .6 .7 32.83500 2 1.2 1.5 34.34000 3 1.8 2.2 36.54500 1 .6 .7 37.25000 6 3.5 4.4 41.65355 1 .6 .7 42.35500 1 .6 .7 43.15600 1 .6 .7 43.86000 3 1.8 2.2 46.06125 1 .6 .7 46.7
Digitized by South Carolina State Library
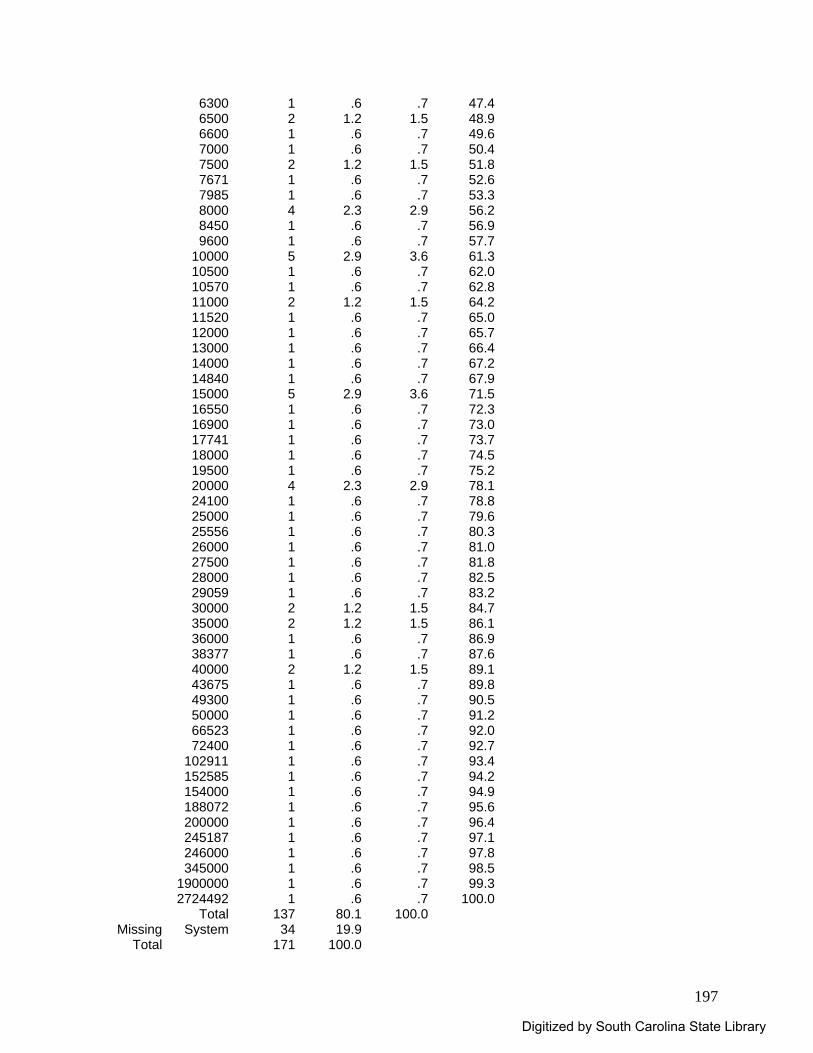
197
6300 1 .6 .7 47.46500 2 1.2 1.5 48.96600 1 .6 .7 49.67000 1 .6 .7 50.47500 2 1.2 1.5 51.87671 1 .6 .7 52.67985 1 .6 .7 53.38000 4 2.3 2.9 56.28450 1 .6 .7 56.99600 1 .6 .7 57.7
10000 5 2.9 3.6 61.310500 1 .6 .7 62.010570 1 .6 .7 62.811000 2 1.2 1.5 64.211520 1 .6 .7 65.012000 1 .6 .7 65.713000 1 .6 .7 66.414000 1 .6 .7 67.214840 1 .6 .7 67.915000 5 2.9 3.6 71.516550 1 .6 .7 72.316900 1 .6 .7 73.017741 1 .6 .7 73.718000 1 .6 .7 74.519500 1 .6 .7 75.220000 4 2.3 2.9 78.124100 1 .6 .7 78.825000 1 .6 .7 79.625556 1 .6 .7 80.326000 1 .6 .7 81.027500 1 .6 .7 81.828000 1 .6 .7 82.529059 1 .6 .7 83.230000 2 1.2 1.5 84.735000 2 1.2 1.5 86.136000 1 .6 .7 86.938377 1 .6 .7 87.640000 2 1.2 1.5 89.143675 1 .6 .7 89.849300 1 .6 .7 90.550000 1 .6 .7 91.266523 1 .6 .7 92.072400 1 .6 .7 92.7
102911 1 .6 .7 93.4152585 1 .6 .7 94.2154000 1 .6 .7 94.9188072 1 .6 .7 95.6200000 1 .6 .7 96.4245187 1 .6 .7 97.1246000 1 .6 .7 97.8345000 1 .6 .7 98.5
1900000 1 .6 .7 99.32724492 1 .6 .7 100.0
Total 137 80.1 100.0Missing System 34 19.9
Total 171 100.0
Digitized by South Carolina State Library
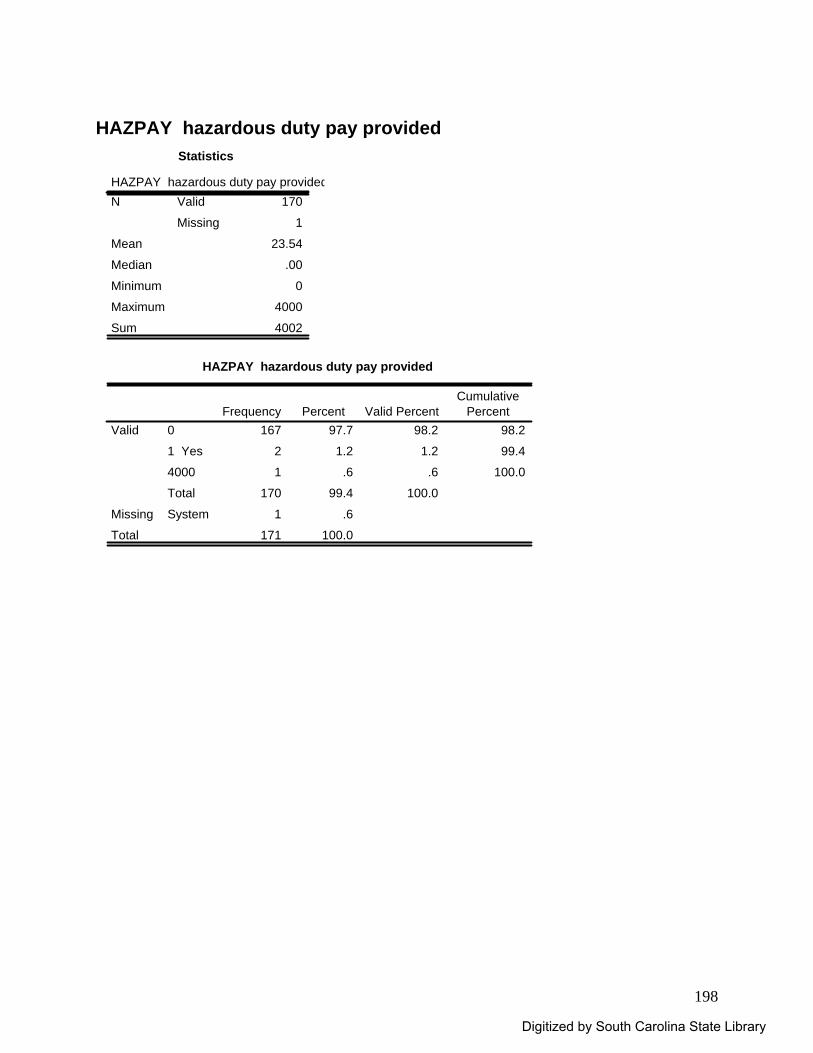
198
HAZPAY hazardous duty pay provided
Statistics
HAZPAY hazardous duty pay provided170
1
23.54
.00
0
4000
4002
Valid
Missing
N
Mean
Median
Minimum
Maximum
Sum
HAZPAY hazardous duty pay provided
167 97.7 98.2 98.2
2 1.2 1.2 99.4
1 .6 .6 100.0
170 99.4 100.0
1 .6
171 100.0
0
1 Yes
4000
Total
Valid
SystemMissing
Total
Frequency Percent Valid PercentCumulative
Percent
Digitized by South Carolina State Library
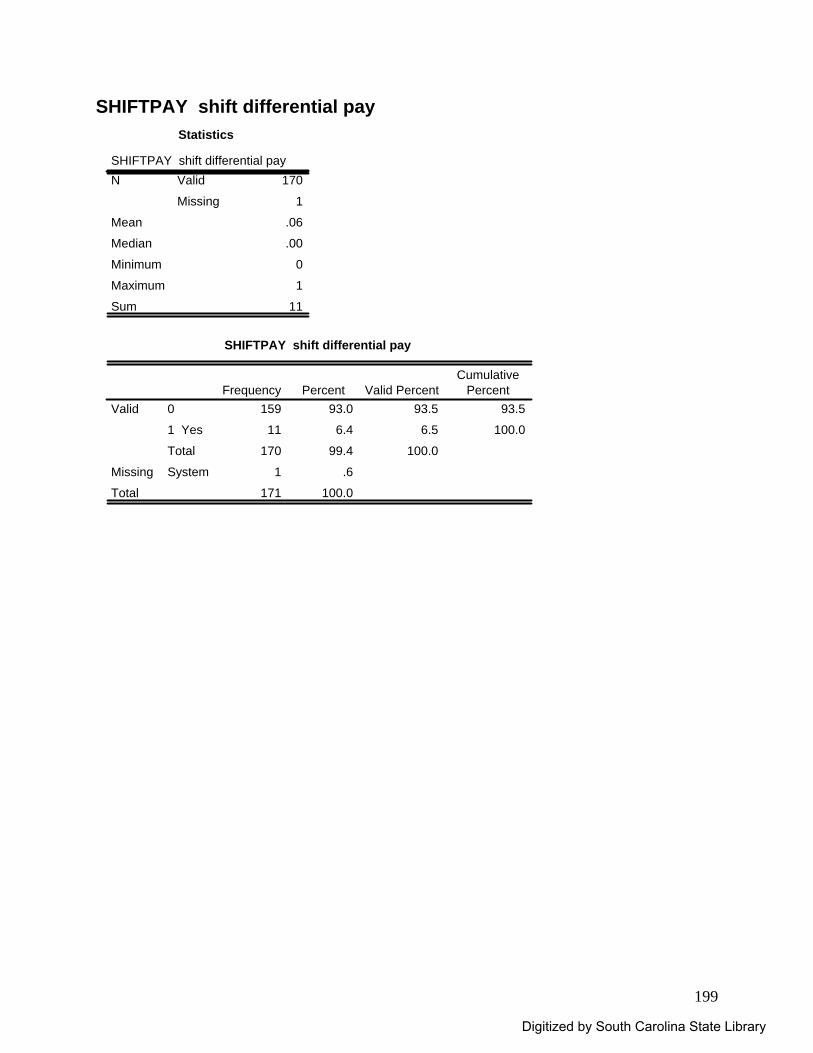
199
SHIFTPAY shift differential pay Statistics
SHIFTPAY shift differential pay170
1
.06
.00
0
1
11
Valid
Missing
N
Mean
Median
Minimum
Maximum
Sum
SHIFTPAY shift differential pay
159 93.0 93.5 93.5
11 6.4 6.5 100.0
170 99.4 100.0
1 .6
171 100.0
0
1 Yes
Total
Valid
SystemMissing
Total
Frequency Percent Valid PercentCumulative
Percent
Digitized by South Carolina State Library

200
EDUCPAY education incentive pay Statistics
EDUCPAY education incentive pay170
1
.19
.00
0
1
32
Valid
Missing
N
Mean
Median
Minimum
Maximum
Sum
EDUCPAY education incentive pay
138 80.7 81.2 81.2
32 18.7 18.8 100.0
170 99.4 100.0
1 .6
171 100.0
0
1 Yes
Total
Valid
SystemMissing
Total
Frequency Percent Valid PercentCumulative
Percent
Digitized by South Carolina State Library
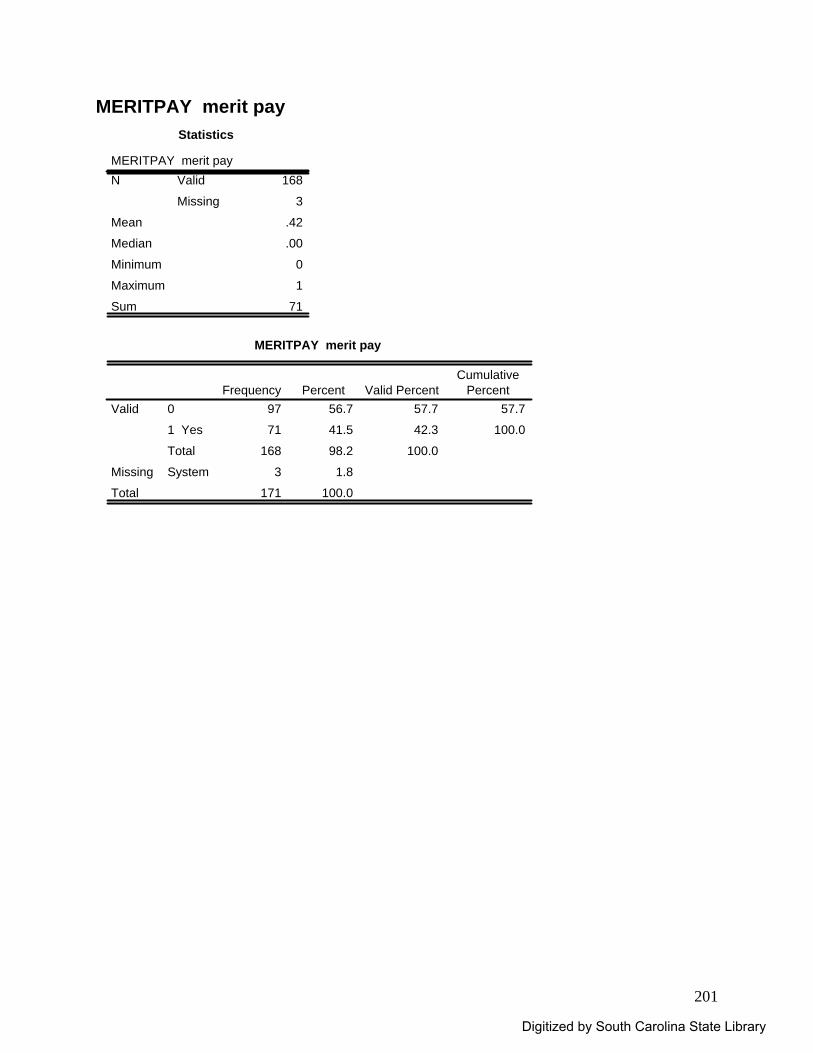
201
MERITPAY merit pay Statistics
MERITPAY merit pay168
3
.42
.00
0
1
71
Valid
Missing
N
Mean
Median
Minimum
Maximum
Sum
MERITPAY merit pay
97 56.7 57.7 57.7
71 41.5 42.3 100.0
168 98.2 100.0
3 1.8
171 100.0
0
1 Yes
Total
Valid
SystemMissing
Total
Frequency Percent Valid PercentCumulative
Percent
Digitized by South Carolina State Library

202
TUITION tuition assistance Statistics
TUITION tuition assistance167
4
.38
.00
0
1
64
Valid
Missing
N
Mean
Median
Minimum
Maximum
Sum
TUITION tuition assistance
103 60.2 61.7 61.7
64 37.4 38.3 100.0
167 97.7 100.0
4 2.3
171 100.0
0
1 Yes
Total
Valid
SystemMissing
Total
Frequency Percent Valid PercentCumulative
Percent
Digitized by South Carolina State Library

203
OTHERPAY other pay Statistics
OTHERPAY other pay22
149
2.82
1.00
1
6
62
Valid
Missing
N
Mean
Median
Minimum
Maximum
Sum
OTHERPAY other pay
14 8.2 63.6 63.6
8 4.7 36.4 100.0
22 12.9 100.0
149 87.1
171 100.0
1 Yes
6
Total
Valid
SystemMissing
Total
Frequency Percent Valid PercentCumulative
Percent
Digitized by South Carolina State Library
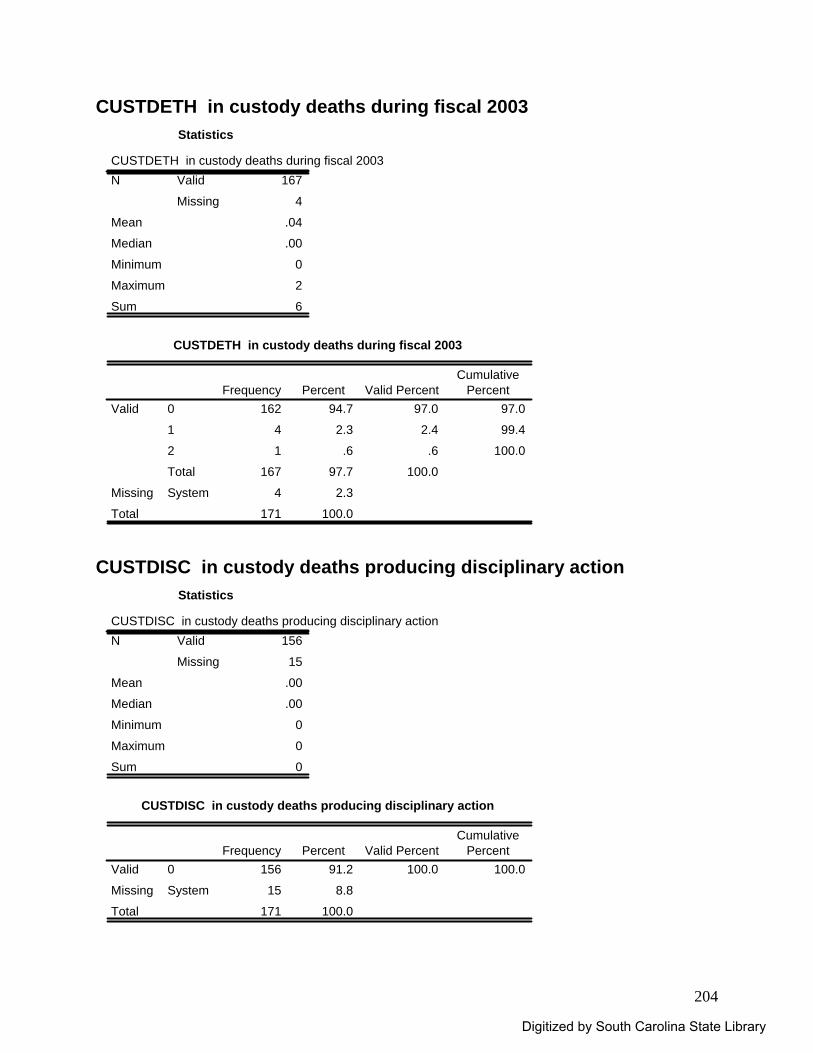
204
CUSTDETH in custody deaths during fiscal 2003 Statistics
CUSTDETH in custody deaths during fiscal 2003167
4
.04
.00
0
2
6
Valid
Missing
N
Mean
Median
Minimum
Maximum
Sum
CUSTDETH in custody deaths during fiscal 2003
162 94.7 97.0 97.0
4 2.3 2.4 99.4
1 .6 .6 100.0
167 97.7 100.0
4 2.3
171 100.0
0
1
2
Total
Valid
SystemMissing
Total
Frequency Percent Valid PercentCumulative
Percent
CUSTDISC in custody deaths producing disciplinary action
Statistics
CUSTDISC in custody deaths producing disciplinary action156
15
.00
.00
0
0
0
Valid
Missing
N
Mean
Median
Minimum
Maximum
Sum
CUSTDISC in custody deaths producing disciplinary action
156 91.2 100.0 100.0
15 8.8
171 100.0
0Valid
SystemMissing
Total
Frequency Percent Valid PercentCumulative
Percent
Digitized by South Carolina State Library
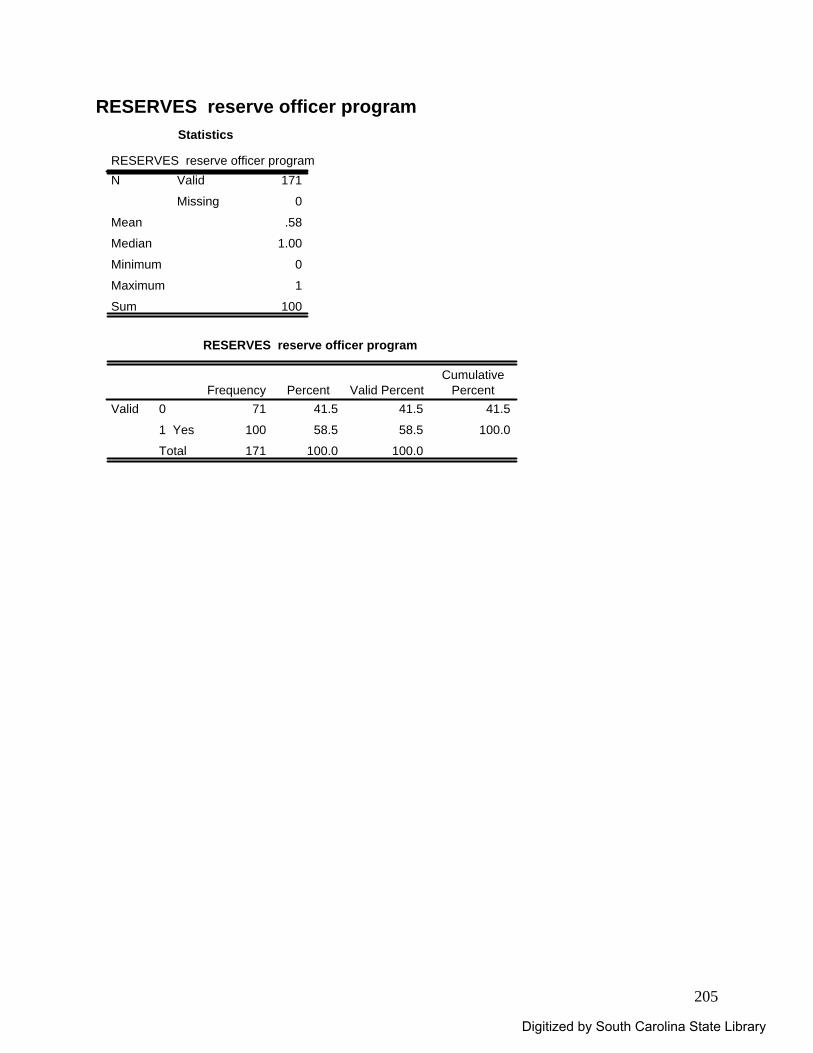
205
RESERVES reserve officer program Statistics
RESERVES reserve officer program171
0
.58
1.00
0
1
100
Valid
Missing
N
Mean
Median
Minimum
Maximum
Sum
RESERVES reserve officer program
71 41.5 41.5 41.5
100 58.5 58.5 100.0
171 100.0 100.0
0
1 Yes
Total
ValidFrequency Percent Valid Percent
CumulativePercent
Digitized by South Carolina State Library
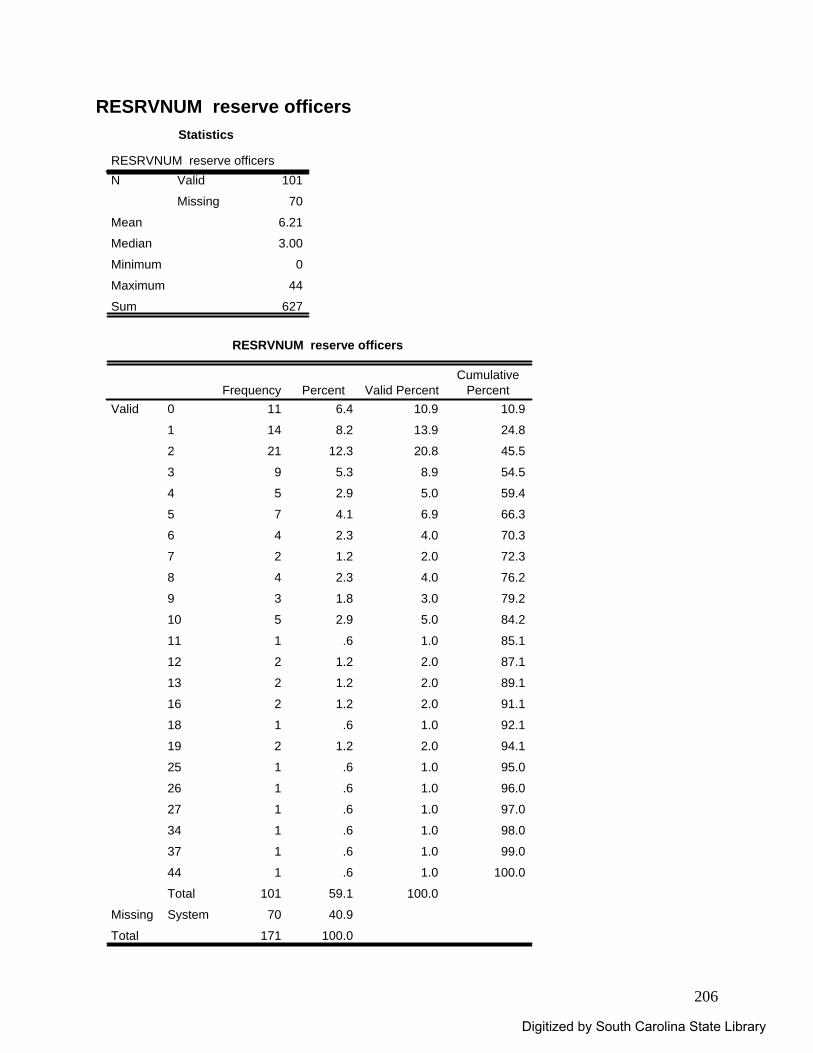
206
RESRVNUM reserve officers Statistics
RESRVNUM reserve officers101
70
6.21
3.00
0
44
627
Valid
Missing
N
Mean
Median
Minimum
Maximum
Sum
RESRVNUM reserve officers
11 6.4 10.9 10.9
14 8.2 13.9 24.8
21 12.3 20.8 45.5
9 5.3 8.9 54.5
5 2.9 5.0 59.4
7 4.1 6.9 66.3
4 2.3 4.0 70.3
2 1.2 2.0 72.3
4 2.3 4.0 76.2
3 1.8 3.0 79.2
5 2.9 5.0 84.2
1 .6 1.0 85.1
2 1.2 2.0 87.1
2 1.2 2.0 89.1
2 1.2 2.0 91.1
1 .6 1.0 92.1
2 1.2 2.0 94.1
1 .6 1.0 95.0
1 .6 1.0 96.0
1 .6 1.0 97.0
1 .6 1.0 98.0
1 .6 1.0 99.0
1 .6 1.0 100.0
101 59.1 100.0
70 40.9
171 100.0
0
1
2
3
4
5
6
7
8
9
10
11
12
13
16
18
19
25
26
27
34
37
44
Total
Valid
SystemMissing
Total
Frequency Percent Valid PercentCumulative
Percent
Digitized by South Carolina State Library
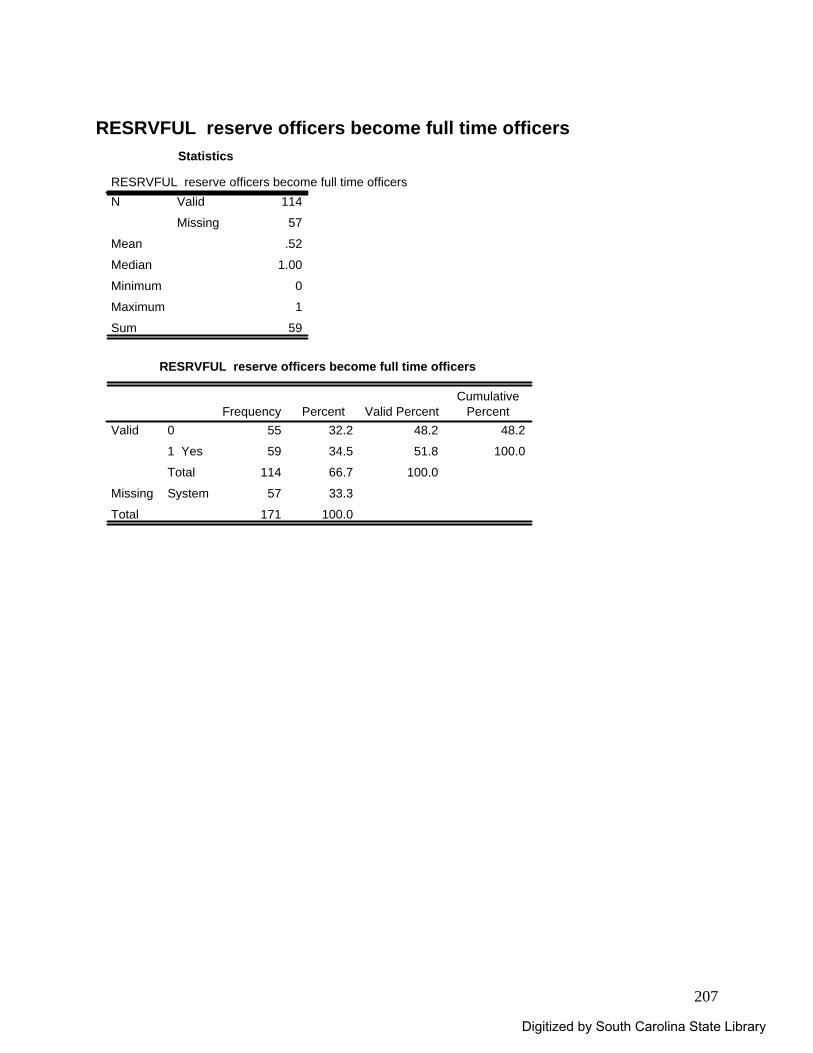
207
RESRVFUL reserve officers become full time officers
Statistics
RESRVFUL reserve officers become full time officers114
57
.52
1.00
0
1
59
Valid
Missing
N
Mean
Median
Minimum
Maximum
Sum
RESRVFUL reserve officers become full time officers
55 32.2 48.2 48.2
59 34.5 51.8 100.0
114 66.7 100.0
57 33.3
171 100.0
0
1 Yes
Total
Valid
SystemMissing
Total
Frequency Percent Valid PercentCumulative
Percent
Digitized by South Carolina State Library
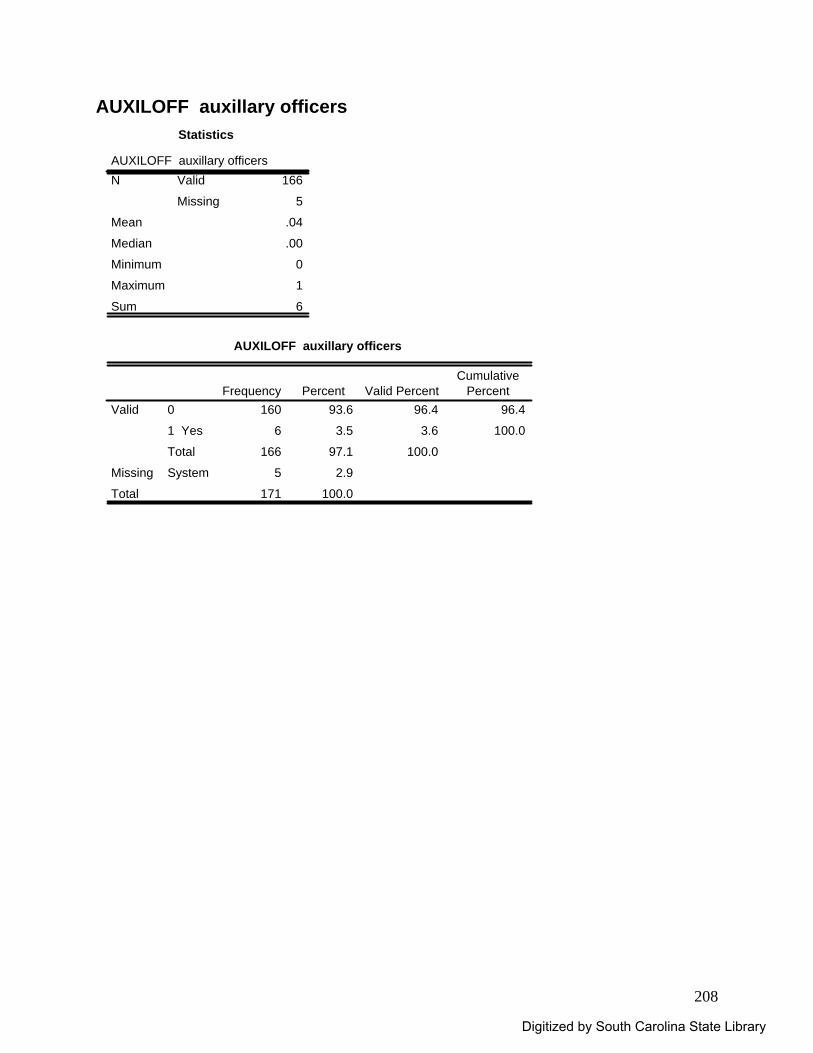
208
AUXILOFF auxillary officers Statistics
AUXILOFF auxillary officers166
5
.04
.00
0
1
6
Valid
Missing
N
Mean
Median
Minimum
Maximum
Sum
AUXILOFF auxillary officers
160 93.6 96.4 96.4
6 3.5 3.6 100.0
166 97.1 100.0
5 2.9
171 100.0
0
1 Yes
Total
Valid
SystemMissing
Total
Frequency Percent Valid PercentCumulative
Percent
Digitized by South Carolina State Library
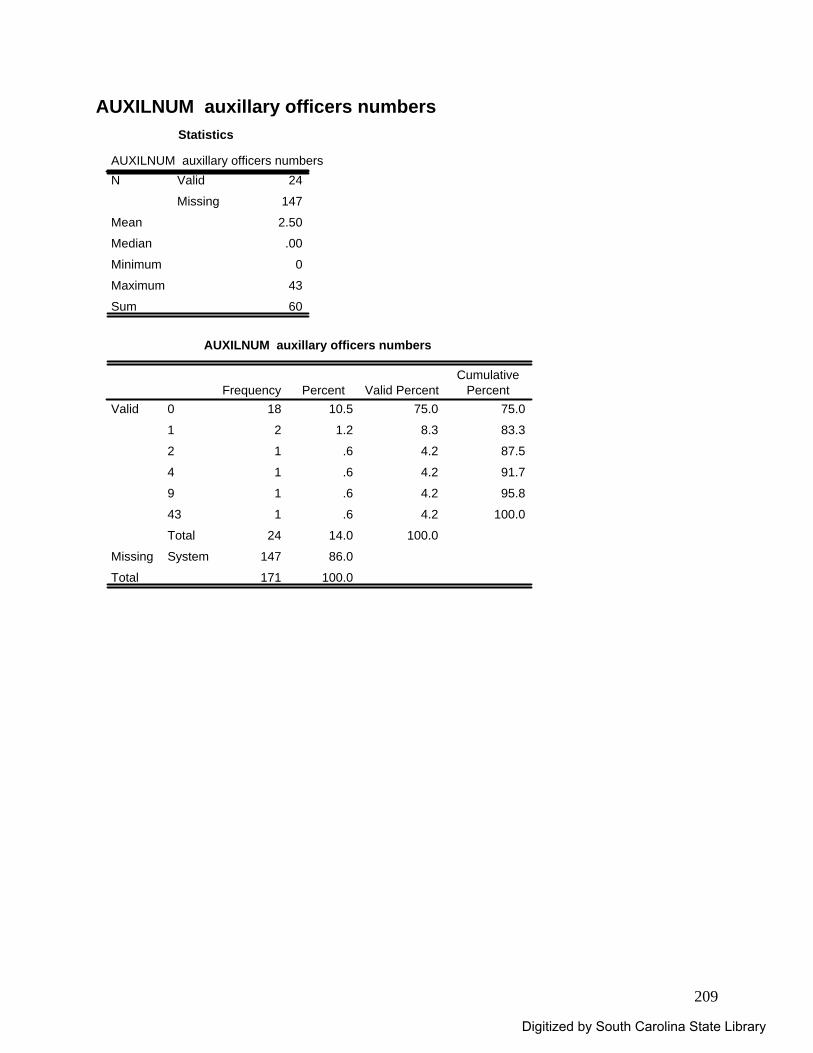
209
AUXILNUM auxillary officers numbers Statistics
AUXILNUM auxillary officers numbers24
147
2.50
.00
0
43
60
Valid
Missing
N
Mean
Median
Minimum
Maximum
Sum
AUXILNUM auxillary officers numbers
18 10.5 75.0 75.0
2 1.2 8.3 83.3
1 .6 4.2 87.5
1 .6 4.2 91.7
1 .6 4.2 95.8
1 .6 4.2 100.0
24 14.0 100.0
147 86.0
171 100.0
0
1
2
4
9
43
Total
Valid
SystemMissing
Total
Frequency Percent Valid PercentCumulative
Percent
Digitized by South Carolina State Library
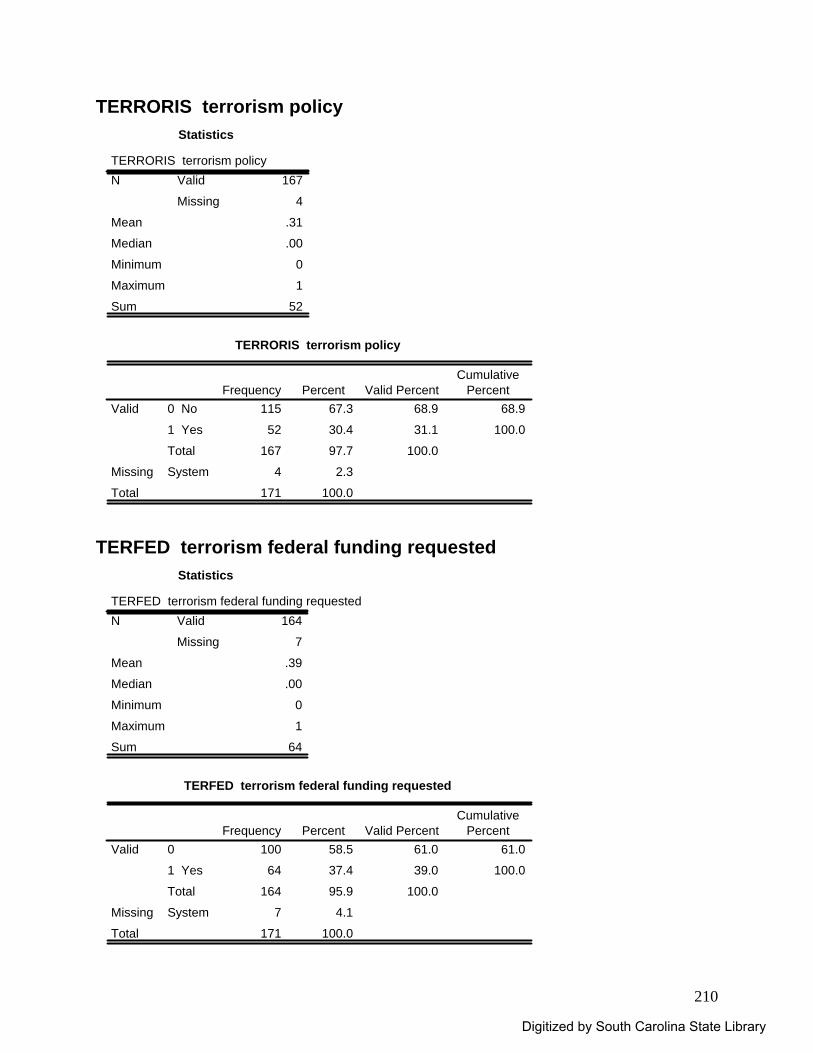
210
TERRORIS terrorism policy Statistics
TERRORIS terrorism policy167
4
.31
.00
0
1
52
Valid
Missing
N
Mean
Median
Minimum
Maximum
Sum
TERRORIS terrorism policy
115 67.3 68.9 68.9
52 30.4 31.1 100.0
167 97.7 100.0
4 2.3
171 100.0
0 No
1 Yes
Total
Valid
SystemMissing
Total
Frequency Percent Valid PercentCumulative
Percent
TERFED terrorism federal funding requested
Statistics
TERFED terrorism federal funding requested164
7
.39
.00
0
1
64
Valid
Missing
N
Mean
Median
Minimum
Maximum
Sum
TERFED terrorism federal funding requested
100 58.5 61.0 61.0
64 37.4 39.0 100.0
164 95.9 100.0
7 4.1
171 100.0
0
1 Yes
Total
Valid
SystemMissing
Total
Frequency Percent Valid PercentCumulative
Percent
Digitized by South Carolina State Library

211
TERSTATE terrorism state funding Statistics
TERSTATE terrorism state funding154
17
.28
.00
0
1
43
Valid
Missing
N
Mean
Median
Minimum
Maximum
Sum
TERSTATE terrorism state funding
111 64.9 72.1 72.1
43 25.1 27.9 100.0
154 90.1 100.0
17 9.9
171 100.0
0
1 Yes
Total
Valid
SystemMissing
Total
Frequency Percent Valid PercentCumulative
Percent
TERLOCAL terrorism city or county funding
Statistics
TERLOCAL terrorism city or county funding147
24
.14
.00
0
1
21
Valid
Missing
N
Mean
Median
Minimum
Maximum
Sum
TERLOCAL terrorism city or county funding
126 73.7 85.7 85.7
21 12.3 14.3 100.0
147 86.0 100.0
24 14.0
171 100.0
0
1 Yes
Total
Valid
SystemMissing
Total
Frequency Percent Valid PercentCumulative
Percent
Digitized by South Carolina State Library
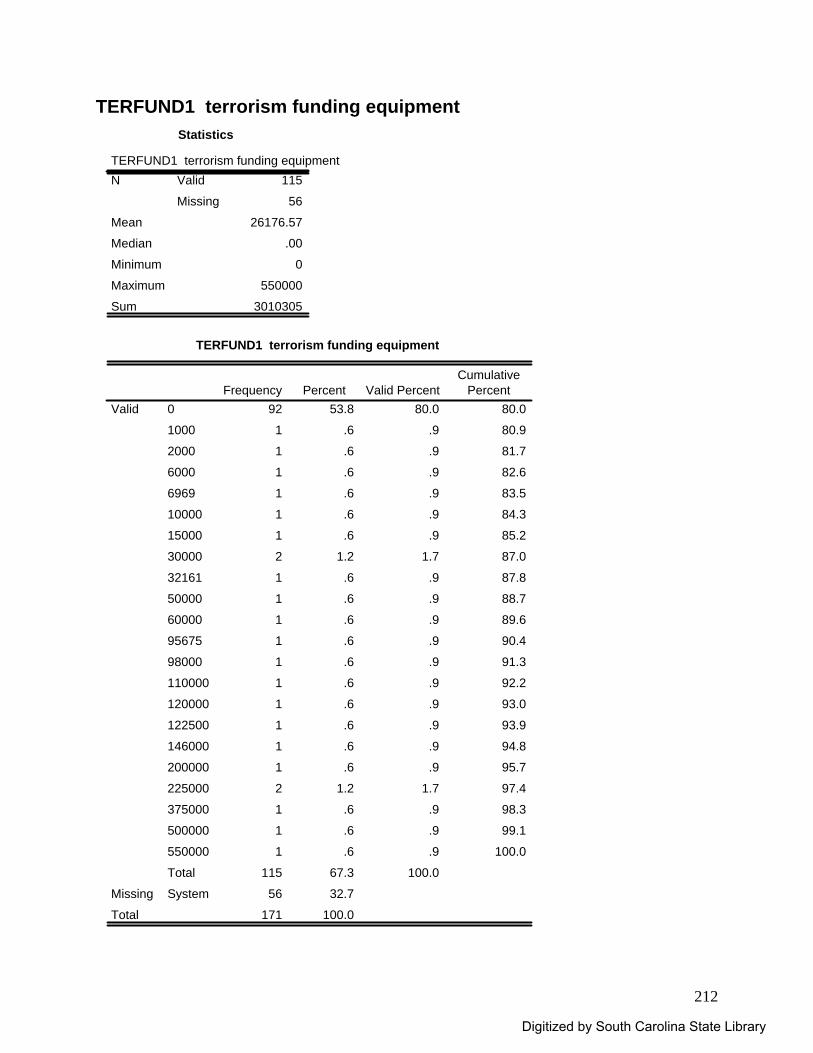
212
TERFUND1 terrorism funding equipment Statistics
TERFUND1 terrorism funding equipment115
56
26176.57
.00
0
550000
3010305
Valid
Missing
N
Mean
Median
Minimum
Maximum
Sum
TERFUND1 terrorism funding equipment
92 53.8 80.0 80.0
1 .6 .9 80.9
1 .6 .9 81.7
1 .6 .9 82.6
1 .6 .9 83.5
1 .6 .9 84.3
1 .6 .9 85.2
2 1.2 1.7 87.0
1 .6 .9 87.8
1 .6 .9 88.7
1 .6 .9 89.6
1 .6 .9 90.4
1 .6 .9 91.3
1 .6 .9 92.2
1 .6 .9 93.0
1 .6 .9 93.9
1 .6 .9 94.8
1 .6 .9 95.7
2 1.2 1.7 97.4
1 .6 .9 98.3
1 .6 .9 99.1
1 .6 .9 100.0
115 67.3 100.0
56 32.7
171 100.0
0
1000
2000
6000
6969
10000
15000
30000
32161
50000
60000
95675
98000
110000
120000
122500
146000
200000
225000
375000
500000
550000
Total
Valid
SystemMissing
Total
Frequency Percent Valid PercentCumulative
Percent
Digitized by South Carolina State Library
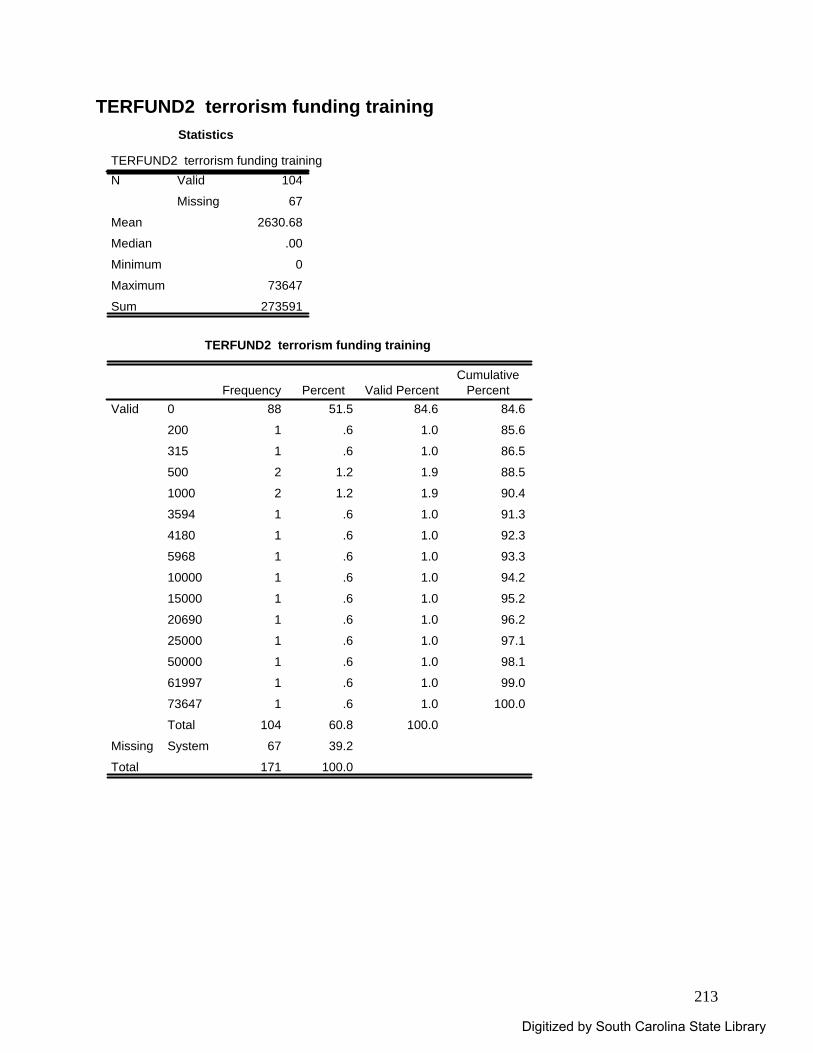
213
TERFUND2 terrorism funding training Statistics
TERFUND2 terrorism funding training104
67
2630.68
.00
0
73647
273591
Valid
Missing
N
Mean
Median
Minimum
Maximum
Sum
TERFUND2 terrorism funding training
88 51.5 84.6 84.6
1 .6 1.0 85.6
1 .6 1.0 86.5
2 1.2 1.9 88.5
2 1.2 1.9 90.4
1 .6 1.0 91.3
1 .6 1.0 92.3
1 .6 1.0 93.3
1 .6 1.0 94.2
1 .6 1.0 95.2
1 .6 1.0 96.2
1 .6 1.0 97.1
1 .6 1.0 98.1
1 .6 1.0 99.0
1 .6 1.0 100.0
104 60.8 100.0
67 39.2
171 100.0
0
200
315
500
1000
3594
4180
5968
10000
15000
20690
25000
50000
61997
73647
Total
Valid
SystemMissing
Total
Frequency Percent Valid PercentCumulative
Percent
Digitized by South Carolina State Library
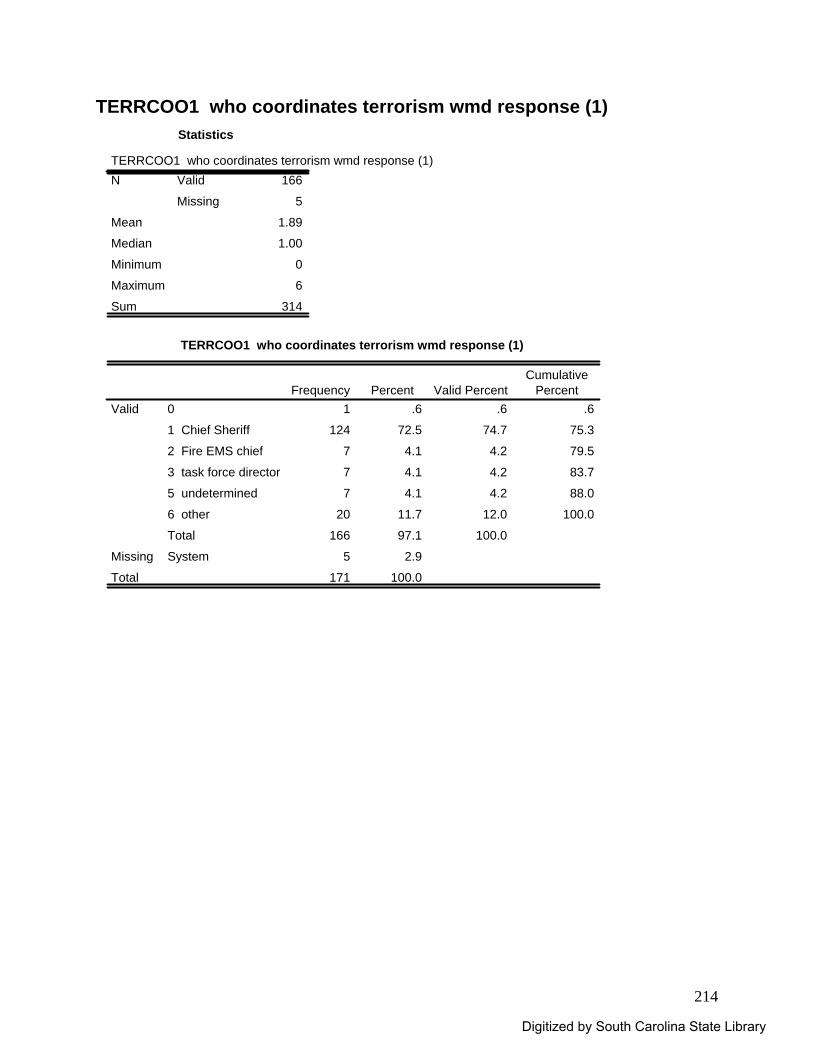
214
TERRCOO1 who coordinates terrorism wmd response (1) Statistics
TERRCOO1 who coordinates terrorism wmd response (1)166
5
1.89
1.00
0
6
314
Valid
Missing
N
Mean
Median
Minimum
Maximum
Sum
TERRCOO1 who coordinates terrorism wmd response (1)
1 .6 .6 .6
124 72.5 74.7 75.3
7 4.1 4.2 79.5
7 4.1 4.2 83.7
7 4.1 4.2 88.0
20 11.7 12.0 100.0
166 97.1 100.0
5 2.9
171 100.0
0
1 Chief Sheriff
2 Fire EMS chief
3 task force director
5 undetermined
6 other
Total
Valid
SystemMissing
Total
Frequency Percent Valid PercentCumulative
Percent
Digitized by South Carolina State Library
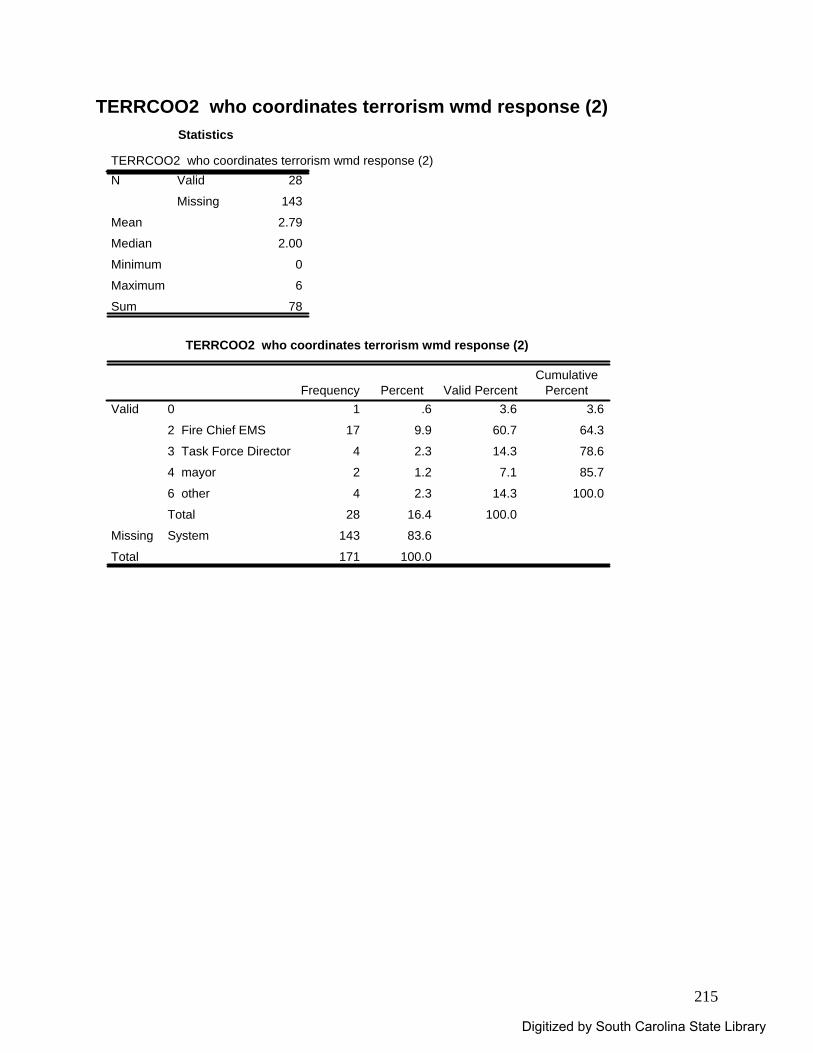
215
TERRCOO2 who coordinates terrorism wmd response (2) Statistics
TERRCOO2 who coordinates terrorism wmd response (2)28
143
2.79
2.00
0
6
78
Valid
Missing
N
Mean
Median
Minimum
Maximum
Sum
TERRCOO2 who coordinates terrorism wmd response (2)
1 .6 3.6 3.6
17 9.9 60.7 64.3
4 2.3 14.3 78.6
2 1.2 7.1 85.7
4 2.3 14.3 100.0
28 16.4 100.0
143 83.6
171 100.0
0
2 Fire Chief EMS
3 Task Force Director
4 mayor
6 other
Total
Valid
SystemMissing
Total
Frequency Percent Valid PercentCumulative
Percent
Digitized by South Carolina State Library
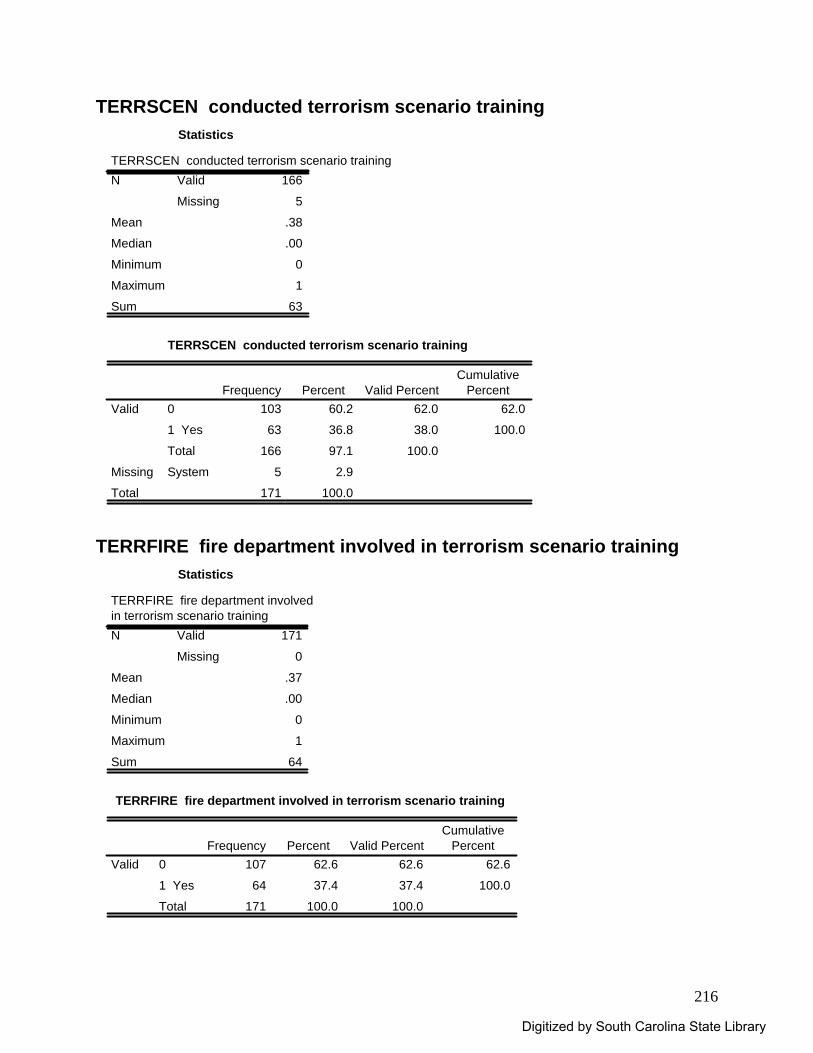
216
TERRSCEN conducted terrorism scenario training Statistics
TERRSCEN conducted terrorism scenario training166
5
.38
.00
0
1
63
Valid
Missing
N
Mean
Median
Minimum
Maximum
Sum
TERRSCEN conducted terrorism scenario training
103 60.2 62.0 62.0
63 36.8 38.0 100.0
166 97.1 100.0
5 2.9
171 100.0
0
1 Yes
Total
Valid
SystemMissing
Total
Frequency Percent Valid PercentCumulative
Percent
TERRFIRE fire department involved in terrorism scenario training
Statistics
TERRFIRE fire department involvedin terrorism scenario training
171
0
.37
.00
0
1
64
Valid
Missing
N
Mean
Median
Minimum
Maximum
Sum
TERRFIRE fire department involved in terrorism scenario training
107 62.6 62.6 62.6
64 37.4 37.4 100.0
171 100.0 100.0
0
1 Yes
Total
ValidFrequency Percent Valid Percent
CumulativePercent
Digitized by South Carolina State Library
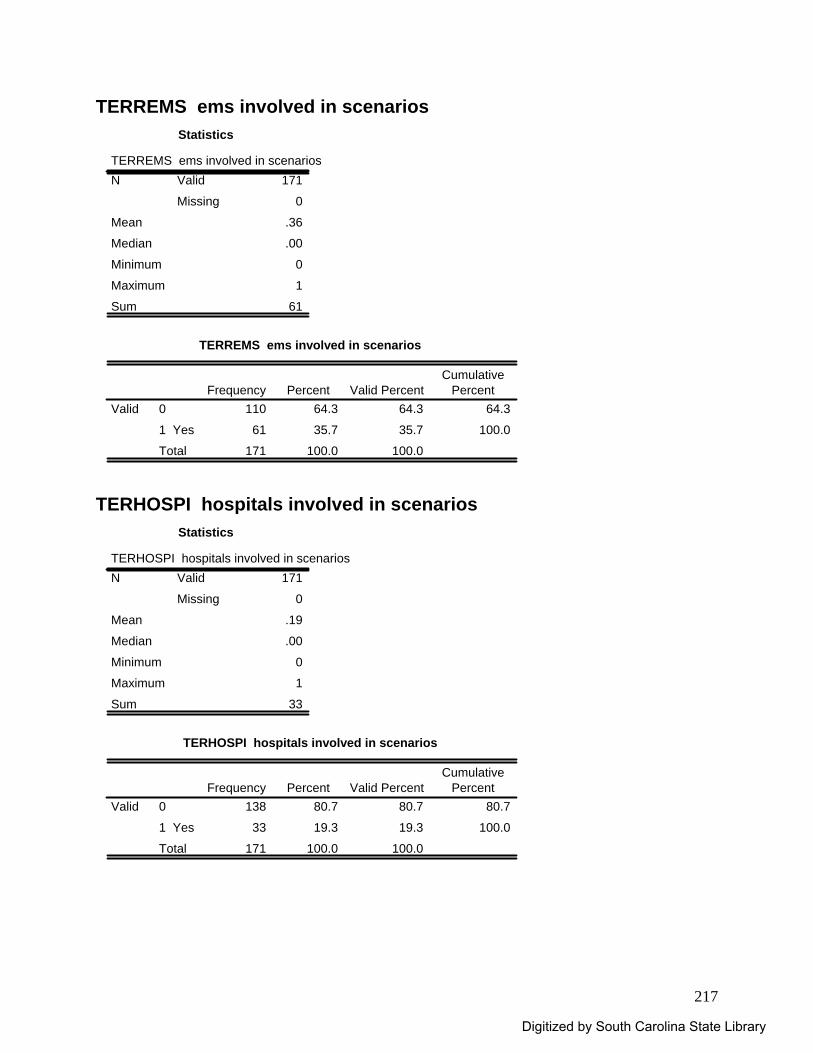
217
TERREMS ems involved in scenarios Statistics
TERREMS ems involved in scenarios171
0
.36
.00
0
1
61
Valid
Missing
N
Mean
Median
Minimum
Maximum
Sum
TERREMS ems involved in scenarios
110 64.3 64.3 64.3
61 35.7 35.7 100.0
171 100.0 100.0
0
1 Yes
Total
ValidFrequency Percent Valid Percent
CumulativePercent
TERHOSPI hospitals involved in scenarios
Statistics
TERHOSPI hospitals involved in scenarios171
0
.19
.00
0
1
33
Valid
Missing
N
Mean
Median
Minimum
Maximum
Sum
TERHOSPI hospitals involved in scenarios
138 80.7 80.7 80.7
33 19.3 19.3 100.0
171 100.0 100.0
0
1 Yes
Total
ValidFrequency Percent Valid Percent
CumulativePercent
Digitized by South Carolina State Library
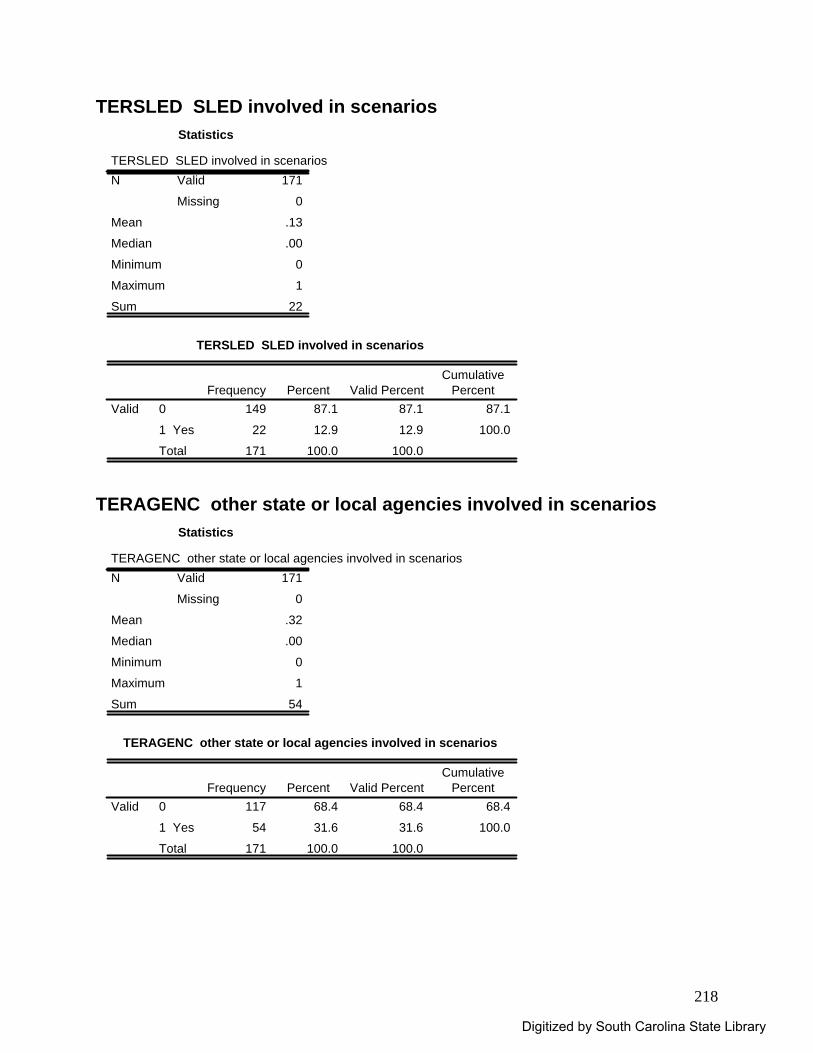
218
TERSLED SLED involved in scenarios Statistics
TERSLED SLED involved in scenarios171
0
.13
.00
0
1
22
Valid
Missing
N
Mean
Median
Minimum
Maximum
Sum
TERSLED SLED involved in scenarios
149 87.1 87.1 87.1
22 12.9 12.9 100.0
171 100.0 100.0
0
1 Yes
Total
ValidFrequency Percent Valid Percent
CumulativePercent
TERAGENC other state or local agencies involved in scenarios
Statistics
TERAGENC other state or local agencies involved in scenarios171
0
.32
.00
0
1
54
Valid
Missing
N
Mean
Median
Minimum
Maximum
Sum
TERAGENC other state or local agencies involved in scenarios
117 68.4 68.4 68.4
54 31.6 31.6 100.0
171 100.0 100.0
0
1 Yes
Total
ValidFrequency Percent Valid Percent
CumulativePercent
Digitized by South Carolina State Library
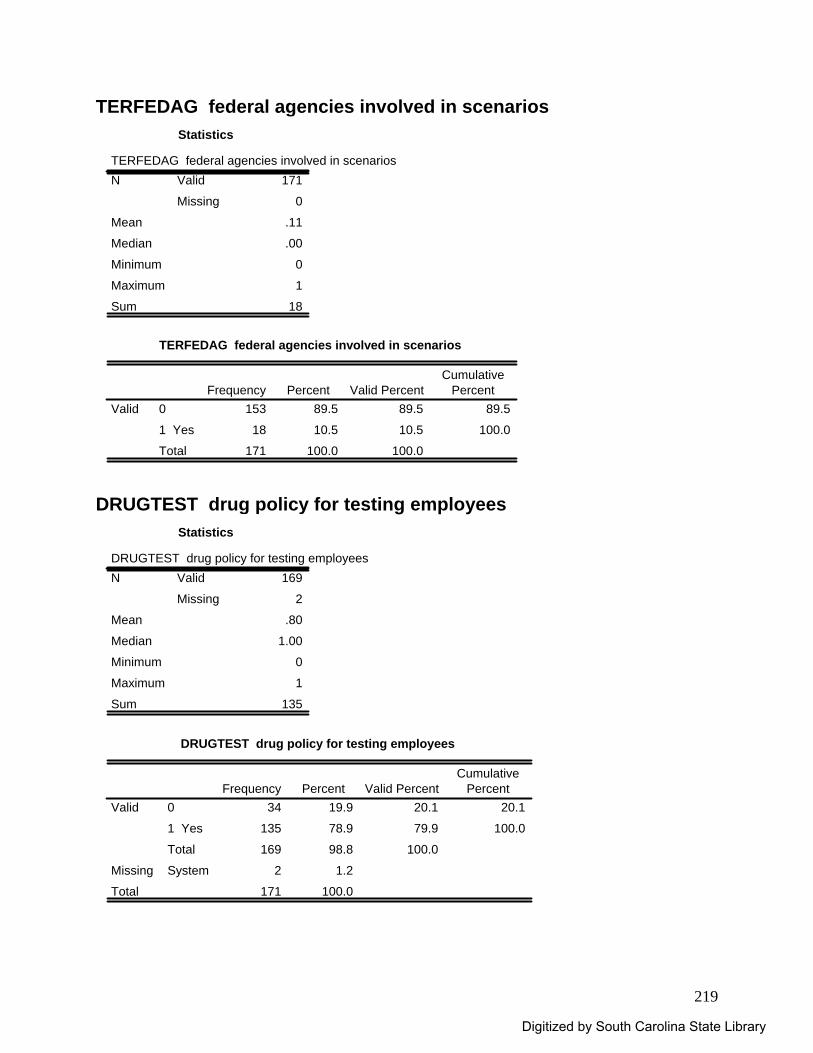
219
TERFEDAG federal agencies involved in scenarios Statistics
TERFEDAG federal agencies involved in scenarios171
0
.11
.00
0
1
18
Valid
Missing
N
Mean
Median
Minimum
Maximum
Sum
TERFEDAG federal agencies involved in scenarios
153 89.5 89.5 89.5
18 10.5 10.5 100.0
171 100.0 100.0
0
1 Yes
Total
ValidFrequency Percent Valid Percent
CumulativePercent
DRUGTEST drug policy for testing employees
Statistics
DRUGTEST drug policy for testing employees169
2
.80
1.00
0
1
135
Valid
Missing
N
Mean
Median
Minimum
Maximum
Sum
DRUGTEST drug policy for testing employees
34 19.9 20.1 20.1
135 78.9 79.9 100.0
169 98.8 100.0
2 1.2
171 100.0
0
1 Yes
Total
Valid
SystemMissing
Total
Frequency Percent Valid PercentCumulative
Percent
Digitized by South Carolina State Library
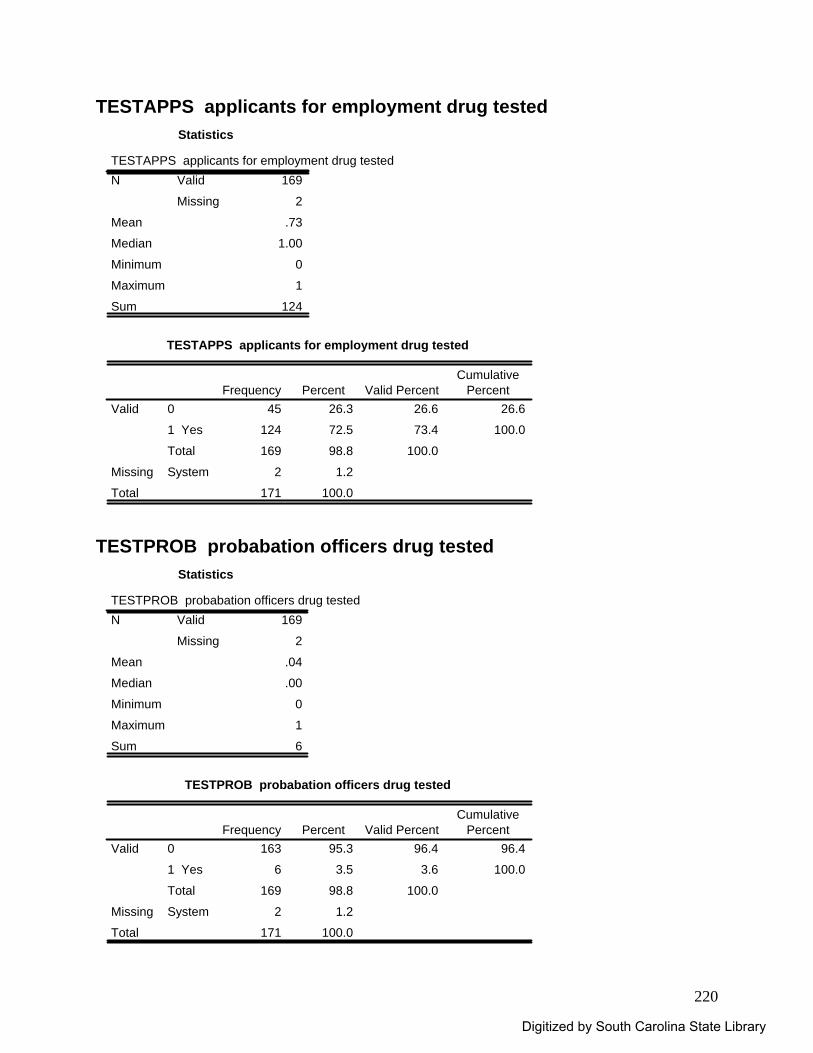
220
TESTAPPS applicants for employment drug tested Statistics
TESTAPPS applicants for employment drug tested169
2
.73
1.00
0
1
124
Valid
Missing
N
Mean
Median
Minimum
Maximum
Sum
TESTAPPS applicants for employment drug tested
45 26.3 26.6 26.6
124 72.5 73.4 100.0
169 98.8 100.0
2 1.2
171 100.0
0
1 Yes
Total
Valid
SystemMissing
Total
Frequency Percent Valid PercentCumulative
Percent
TESTPROB probabation officers drug tested
Statistics
TESTPROB probabation officers drug tested169
2
.04
.00
0
1
6
Valid
Missing
N
Mean
Median
Minimum
Maximum
Sum
TESTPROB probabation officers drug tested
163 95.3 96.4 96.4
6 3.5 3.6 100.0
169 98.8 100.0
2 1.2
171 100.0
0
1 Yes
Total
Valid
SystemMissing
Total
Frequency Percent Valid PercentCumulative
Percent
Digitized by South Carolina State Library
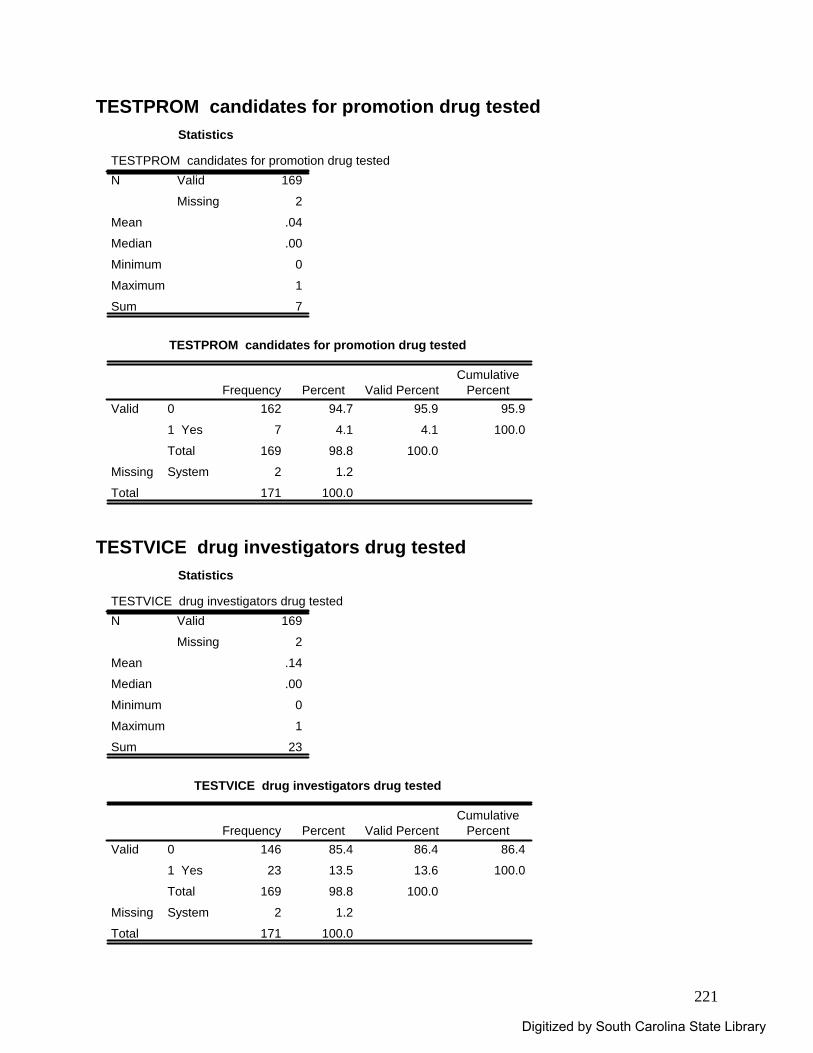
221
TESTPROM candidates for promotion drug tested Statistics
TESTPROM candidates for promotion drug tested169
2
.04
.00
0
1
7
Valid
Missing
N
Mean
Median
Minimum
Maximum
Sum
TESTPROM candidates for promotion drug tested
162 94.7 95.9 95.9
7 4.1 4.1 100.0
169 98.8 100.0
2 1.2
171 100.0
0
1 Yes
Total
Valid
SystemMissing
Total
Frequency Percent Valid PercentCumulative
Percent
TESTVICE drug investigators drug tested
Statistics
TESTVICE drug investigators drug tested169
2
.14
.00
0
1
23
Valid
Missing
N
Mean
Median
Minimum
Maximum
Sum
TESTVICE drug investigators drug tested
146 85.4 86.4 86.4
23 13.5 13.6 100.0
169 98.8 100.0
2 1.2
171 100.0
0
1 Yes
Total
Valid
SystemMissing
Total
Frequency Percent Valid PercentCumulative
Percent
Digitized by South Carolina State Library
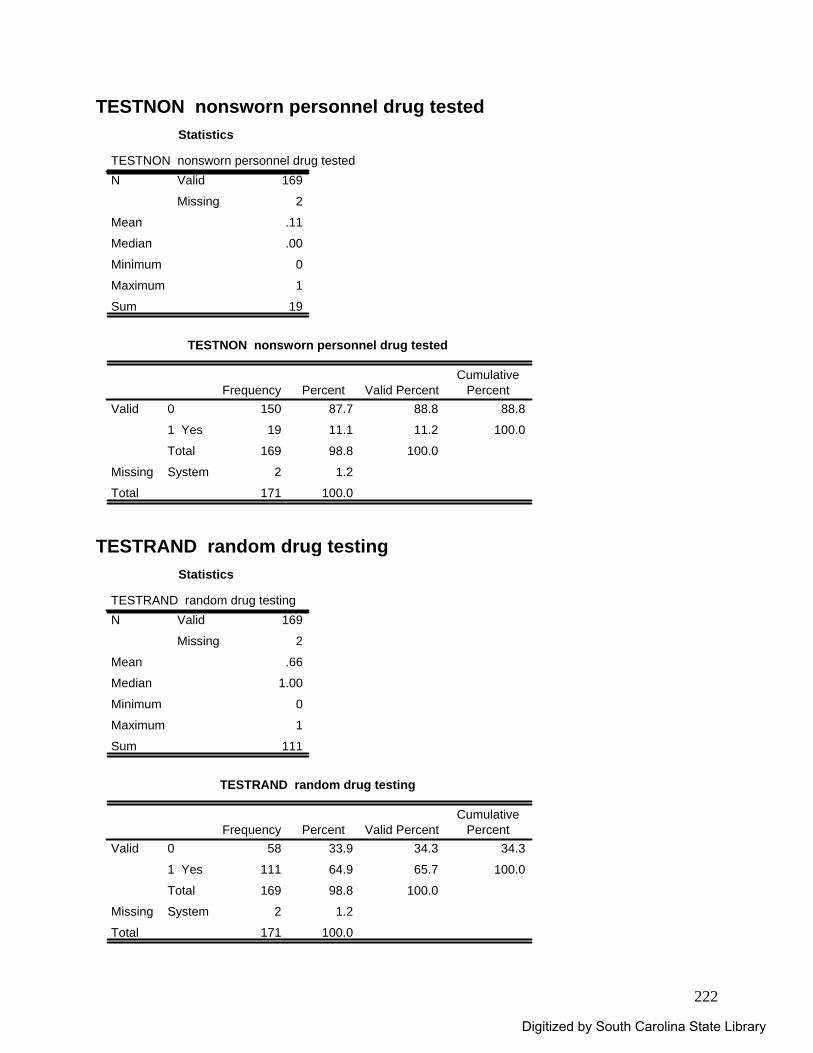
222
TESTNON nonsworn personnel drug tested Statistics
TESTNON nonsworn personnel drug tested169
2
.11
.00
0
1
19
Valid
Missing
N
Mean
Median
Minimum
Maximum
Sum
TESTNON nonsworn personnel drug tested
150 87.7 88.8 88.8
19 11.1 11.2 100.0
169 98.8 100.0
2 1.2
171 100.0
0
1 Yes
Total
Valid
SystemMissing
Total
Frequency Percent Valid PercentCumulative
Percent
TESTRAND random drug testing
Statistics
TESTRAND random drug testing169
2
.66
1.00
0
1
111
Valid
Missing
N
Mean
Median
Minimum
Maximum
Sum
TESTRAND random drug testing
58 33.9 34.3 34.3
111 64.9 65.7 100.0
169 98.8 100.0
2 1.2
171 100.0
0
1 Yes
Total
Valid
SystemMissing
Total
Frequency Percent Valid PercentCumulative
Percent
Digitized by South Carolina State Library
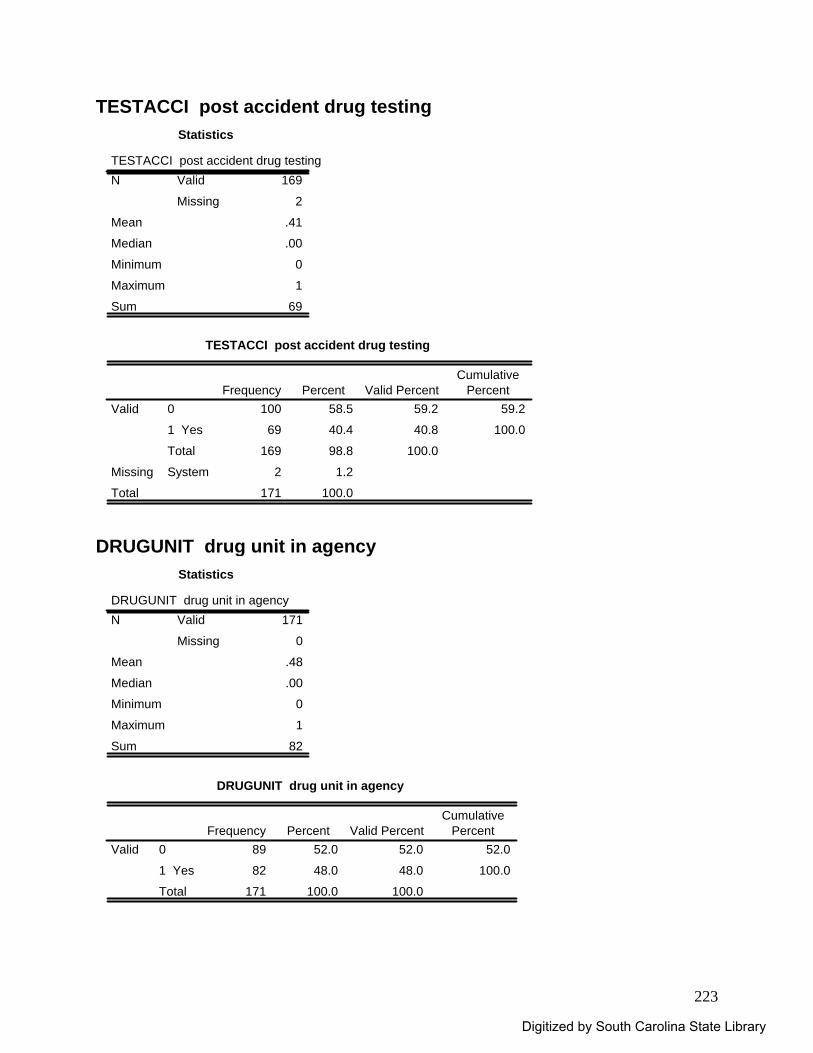
223
TESTACCI post accident drug testing Statistics
TESTACCI post accident drug testing169
2
.41
.00
0
1
69
Valid
Missing
N
Mean
Median
Minimum
Maximum
Sum
TESTACCI post accident drug testing
100 58.5 59.2 59.2
69 40.4 40.8 100.0
169 98.8 100.0
2 1.2
171 100.0
0
1 Yes
Total
Valid
SystemMissing
Total
Frequency Percent Valid PercentCumulative
Percent
DRUGUNIT drug unit in agency
Statistics
DRUGUNIT drug unit in agency171
0
.48
.00
0
1
82
Valid
Missing
N
Mean
Median
Minimum
Maximum
Sum
DRUGUNIT drug unit in agency
89 52.0 52.0 52.0
82 48.0 48.0 100.0
171 100.0 100.0
0
1 Yes
Total
ValidFrequency Percent Valid Percent
CumulativePercent
Digitized by South Carolina State Library
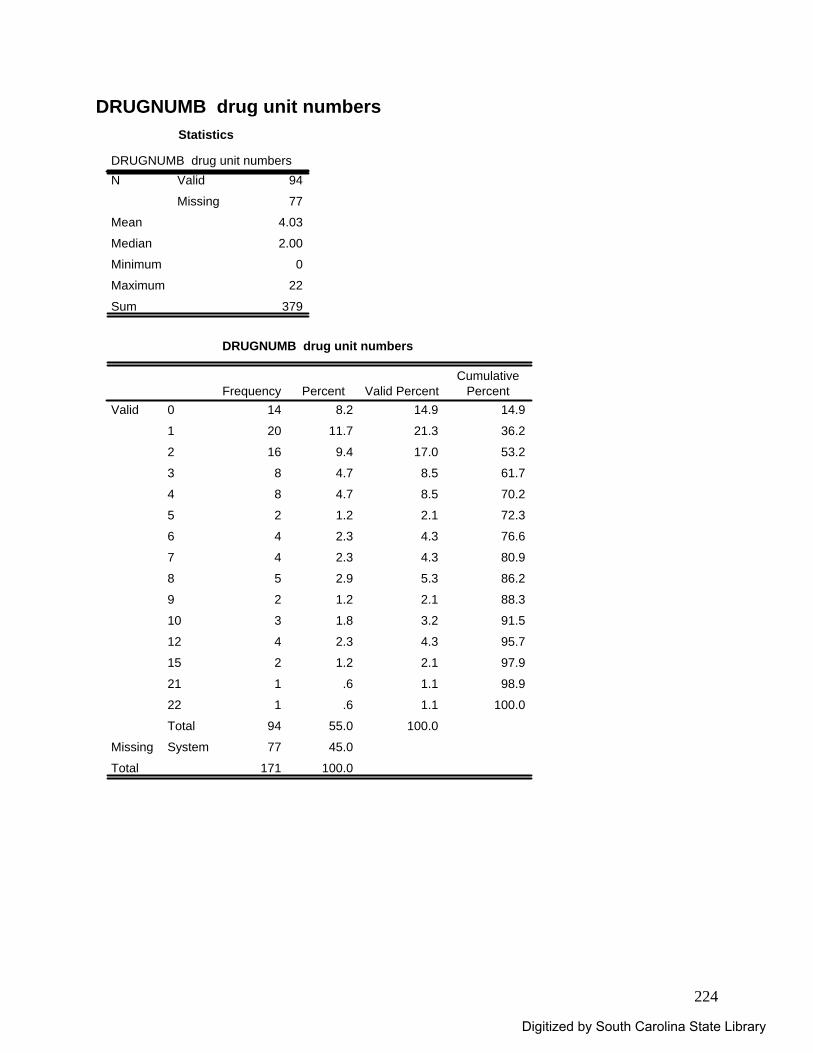
224
DRUGNUMB drug unit numbers Statistics
DRUGNUMB drug unit numbers94
77
4.03
2.00
0
22
379
Valid
Missing
N
Mean
Median
Minimum
Maximum
Sum
DRUGNUMB drug unit numbers
14 8.2 14.9 14.9
20 11.7 21.3 36.2
16 9.4 17.0 53.2
8 4.7 8.5 61.7
8 4.7 8.5 70.2
2 1.2 2.1 72.3
4 2.3 4.3 76.6
4 2.3 4.3 80.9
5 2.9 5.3 86.2
2 1.2 2.1 88.3
3 1.8 3.2 91.5
4 2.3 4.3 95.7
2 1.2 2.1 97.9
1 .6 1.1 98.9
1 .6 1.1 100.0
94 55.0 100.0
77 45.0
171 100.0
0
1
2
3
4
5
6
7
8
9
10
12
15
21
22
Total
Valid
SystemMissing
Total
Frequency Percent Valid PercentCumulative
Percent
Digitized by South Carolina State Library
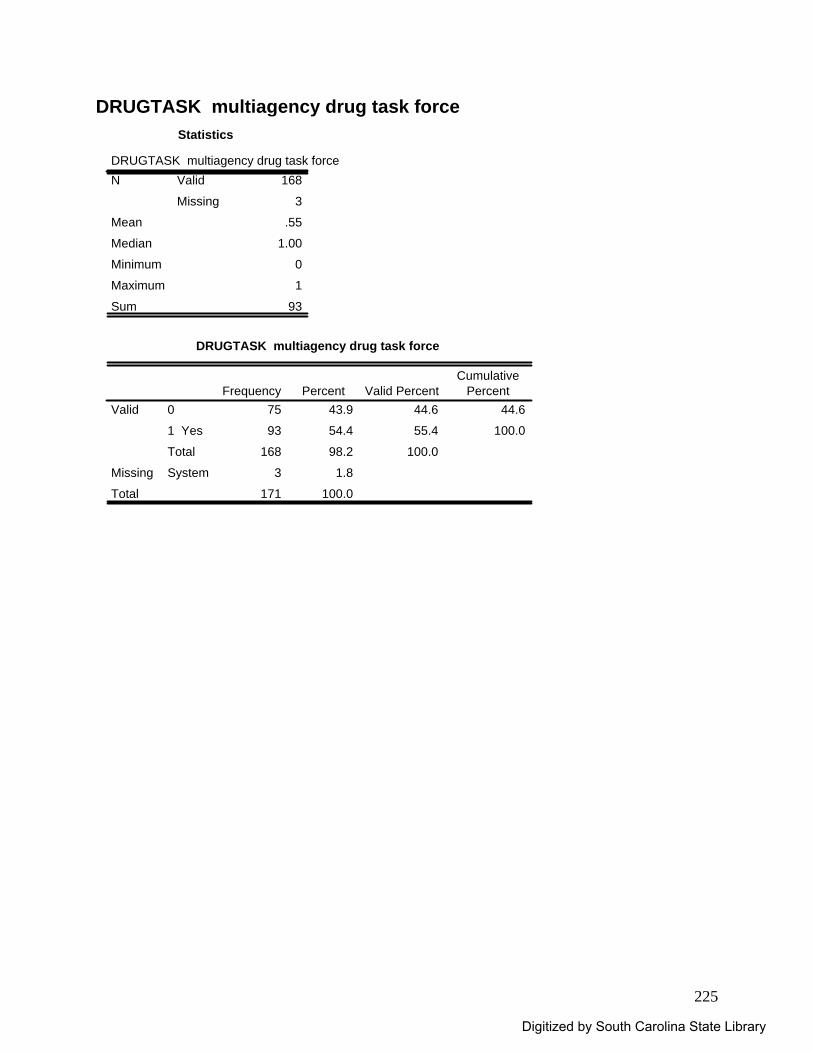
225
DRUGTASK multiagency drug task force Statistics
DRUGTASK multiagency drug task force168
3
.55
1.00
0
1
93
Valid
Missing
N
Mean
Median
Minimum
Maximum
Sum
DRUGTASK multiagency drug task force
75 43.9 44.6 44.6
93 54.4 55.4 100.0
168 98.2 100.0
3 1.8
171 100.0
0
1 Yes
Total
Valid
SystemMissing
Total
Frequency Percent Valid PercentCumulative
Percent
Digitized by South Carolina State Library
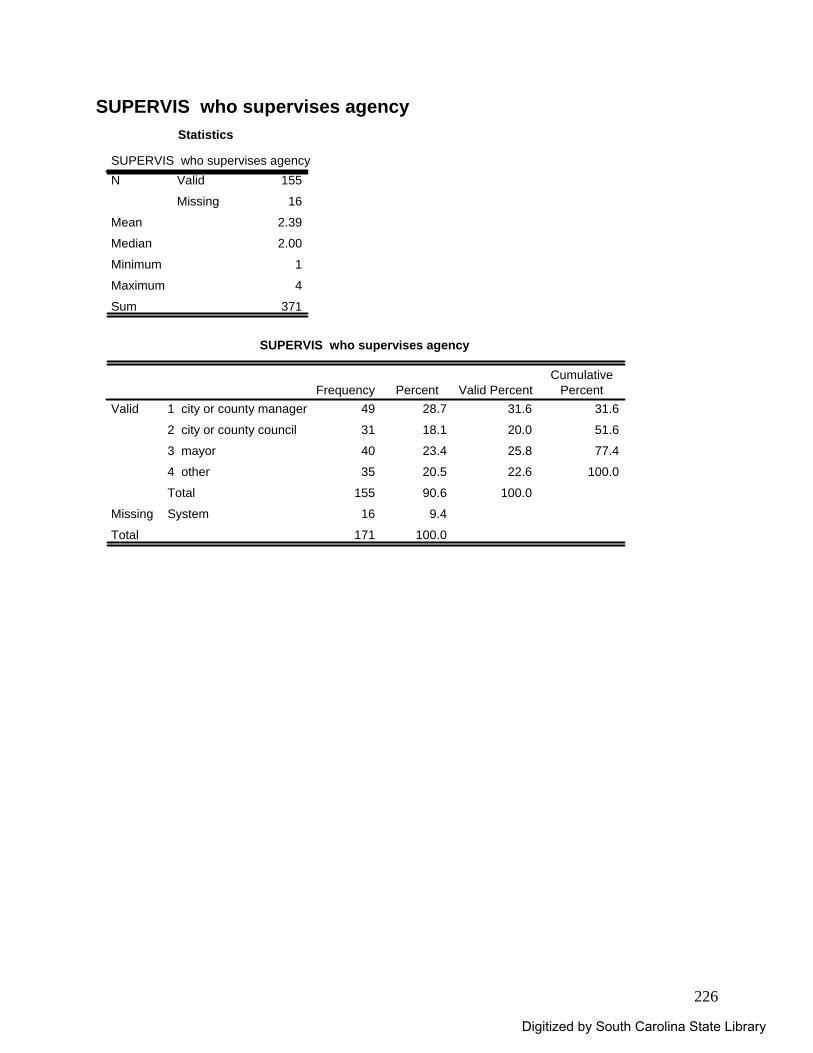
226
SUPERVIS who supervises agency Statistics
SUPERVIS who supervises agency155
16
2.39
2.00
1
4
371
Valid
Missing
N
Mean
Median
Minimum
Maximum
Sum
SUPERVIS who supervises agency
49 28.7 31.6 31.6
31 18.1 20.0 51.6
40 23.4 25.8 77.4
35 20.5 22.6 100.0
155 90.6 100.0
16 9.4
171 100.0
1 city or county manager
2 city or county council
3 mayor
4 other
Total
Valid
SystemMissing
Total
Frequency Percent Valid PercentCumulative
Percent
Digitized by South Carolina State Library
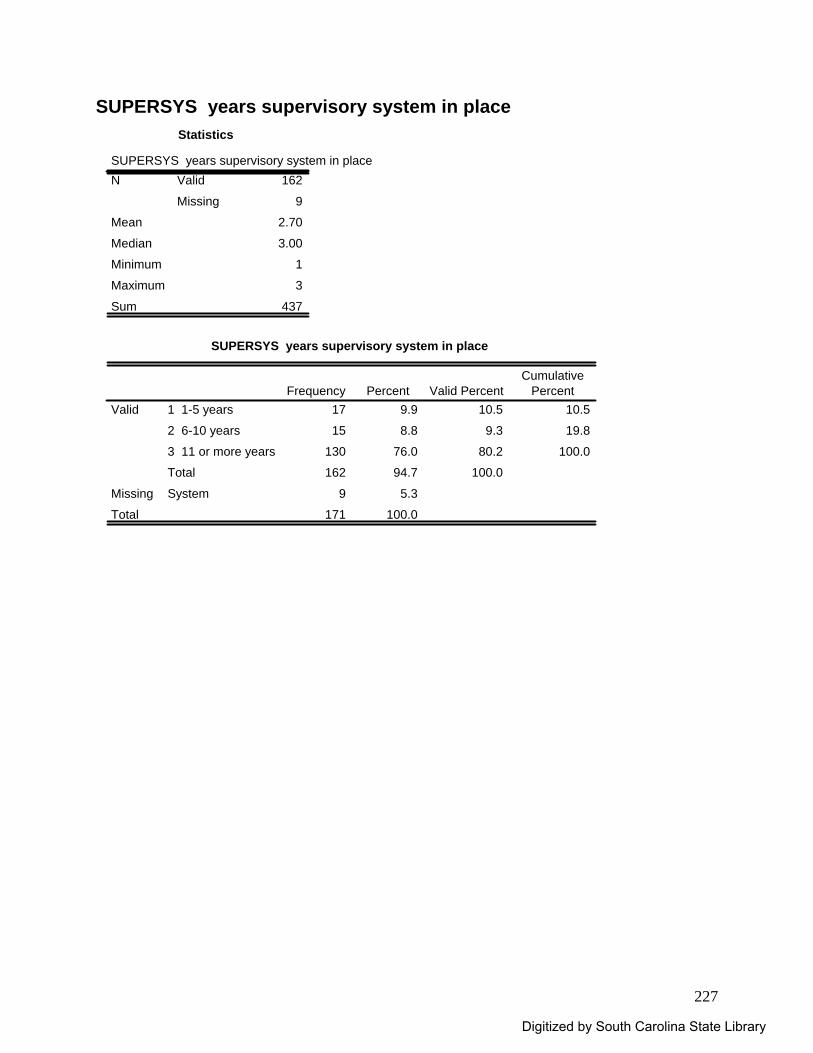
227
SUPERSYS years supervisory system in place Statistics
SUPERSYS years supervisory system in place162
9
2.70
3.00
1
3
437
Valid
Missing
N
Mean
Median
Minimum
Maximum
Sum
SUPERSYS years supervisory system in place
17 9.9 10.5 10.5
15 8.8 9.3 19.8
130 76.0 80.2 100.0
162 94.7 100.0
9 5.3
171 100.0
1 1-5 years
2 6-10 years
3 11 or more years
Total
Valid
SystemMissing
Total
Frequency Percent Valid PercentCumulative
Percent
Digitized by South Carolina State Library

228
EVALUATO who evaluates agency Statistics
EVALUATO who evaluates agency149
22
2.57
3.00
1
4
383
Valid
Missing
N
Mean
Median
Minimum
Maximum
Sum
EVALUATO who evaluates agency
43 25.1 28.9 28.9
27 15.8 18.1 47.0
30 17.5 20.1 67.1
49 28.7 32.9 100.0
149 87.1 100.0
22 12.9
171 100.0
1 city or county manager
2 city or county council
3 mayor
4 other
Total
Valid
SystemMissing
Total
Frequency Percent Valid PercentCumulative
Percent
Digitized by South Carolina State Library
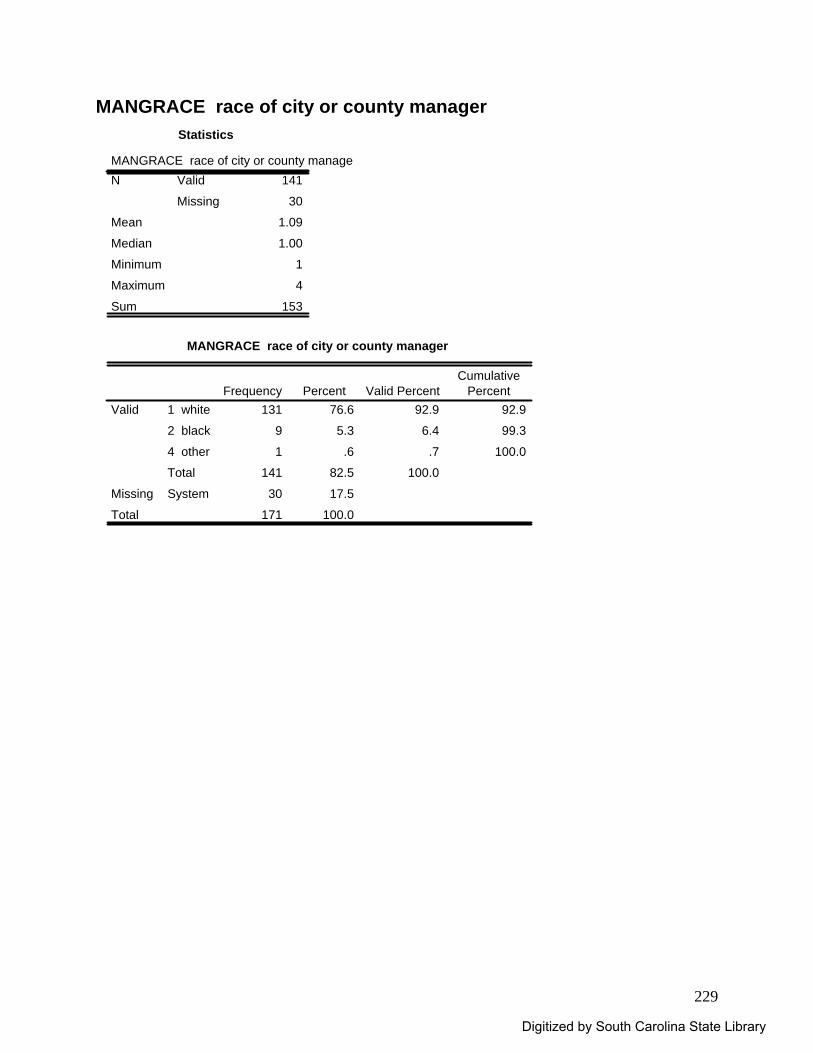
229
MANGRACE race of city or county manager Statistics
MANGRACE race of city or county manager141
30
1.09
1.00
1
4
153
Valid
Missing
N
Mean
Median
Minimum
Maximum
Sum
MANGRACE race of city or county manager
131 76.6 92.9 92.9
9 5.3 6.4 99.3
1 .6 .7 100.0
141 82.5 100.0
30 17.5
171 100.0
1 white
2 black
4 other
Total
Valid
SystemMissing
Total
Frequency Percent Valid PercentCumulative
Percent
Digitized by South Carolina State Library
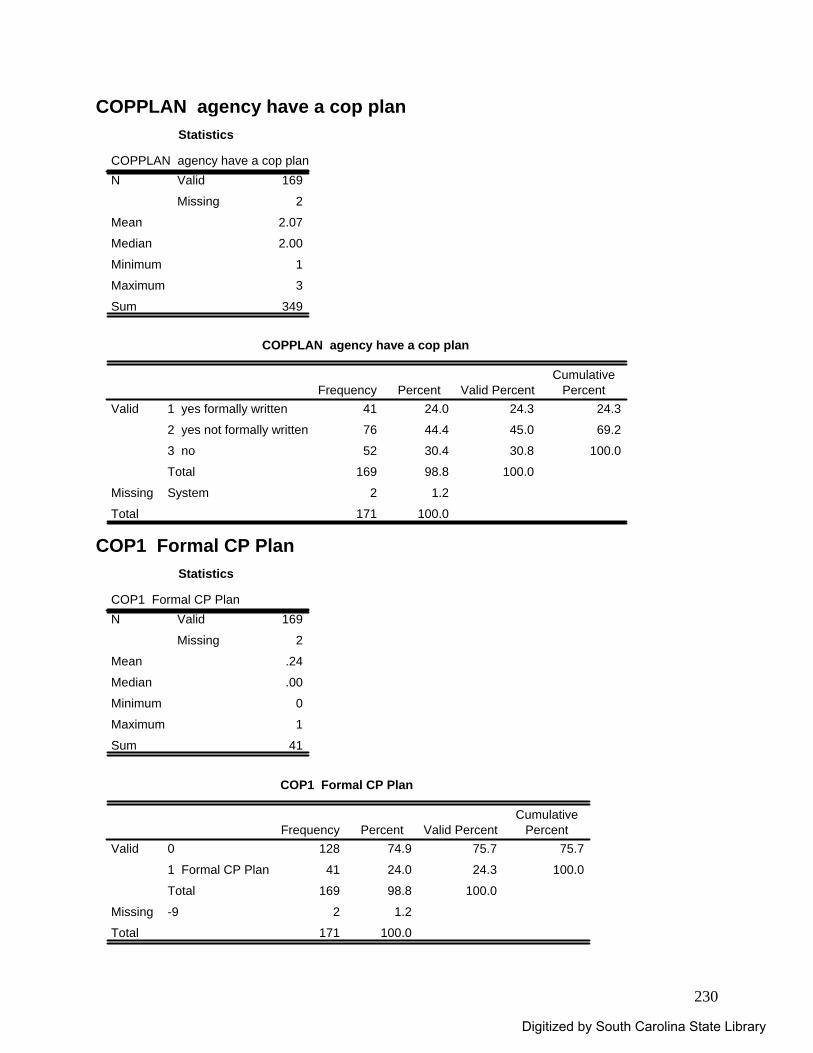
230
COPPLAN agency have a cop plan Statistics
COPPLAN agency have a cop plan169
2
2.07
2.00
1
3
349
Valid
Missing
N
Mean
Median
Minimum
Maximum
Sum
COPPLAN agency have a cop plan
41 24.0 24.3 24.3
76 44.4 45.0 69.2
52 30.4 30.8 100.0
169 98.8 100.0
2 1.2
171 100.0
1 yes formally written
2 yes not formally written
3 no
Total
Valid
SystemMissing
Total
Frequency Percent Valid PercentCumulative
Percent
COP1 Formal CP Plan
Statistics
COP1 Formal CP Plan169
2
.24
.00
0
1
41
Valid
Missing
N
Mean
Median
Minimum
Maximum
Sum
COP1 Formal CP Plan
128 74.9 75.7 75.7
41 24.0 24.3 100.0
169 98.8 100.0
2 1.2
171 100.0
0
1 Formal CP Plan
Total
Valid
-9Missing
Total
Frequency Percent Valid PercentCumulative
Percent
Digitized by South Carolina State Library
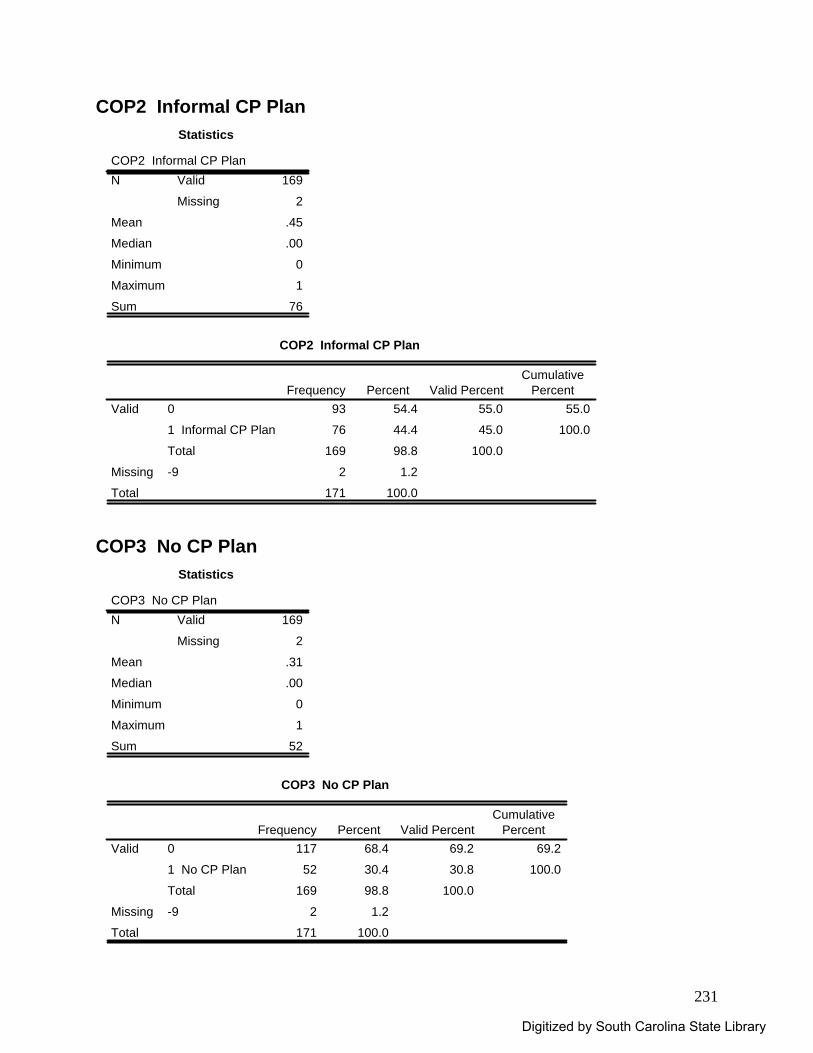
231
COP2 Informal CP Plan Statistics
COP2 Informal CP Plan169
2
.45
.00
0
1
76
Valid
Missing
N
Mean
Median
Minimum
Maximum
Sum
COP2 Informal CP Plan
93 54.4 55.0 55.0
76 44.4 45.0 100.0
169 98.8 100.0
2 1.2
171 100.0
0
1 Informal CP Plan
Total
Valid
-9Missing
Total
Frequency Percent Valid PercentCumulative
Percent
COP3 No CP Plan
Statistics
COP3 No CP Plan169
2
.31
.00
0
1
52
Valid
Missing
N
Mean
Median
Minimum
Maximum
Sum
COP3 No CP Plan
117 68.4 69.2 69.2
52 30.4 30.8 100.0
169 98.8 100.0
2 1.2
171 100.0
0
1 No CP Plan
Total
Valid
-9Missing
Total
Frequency Percent Valid PercentCumulative
Percent
Digitized by South Carolina State Library
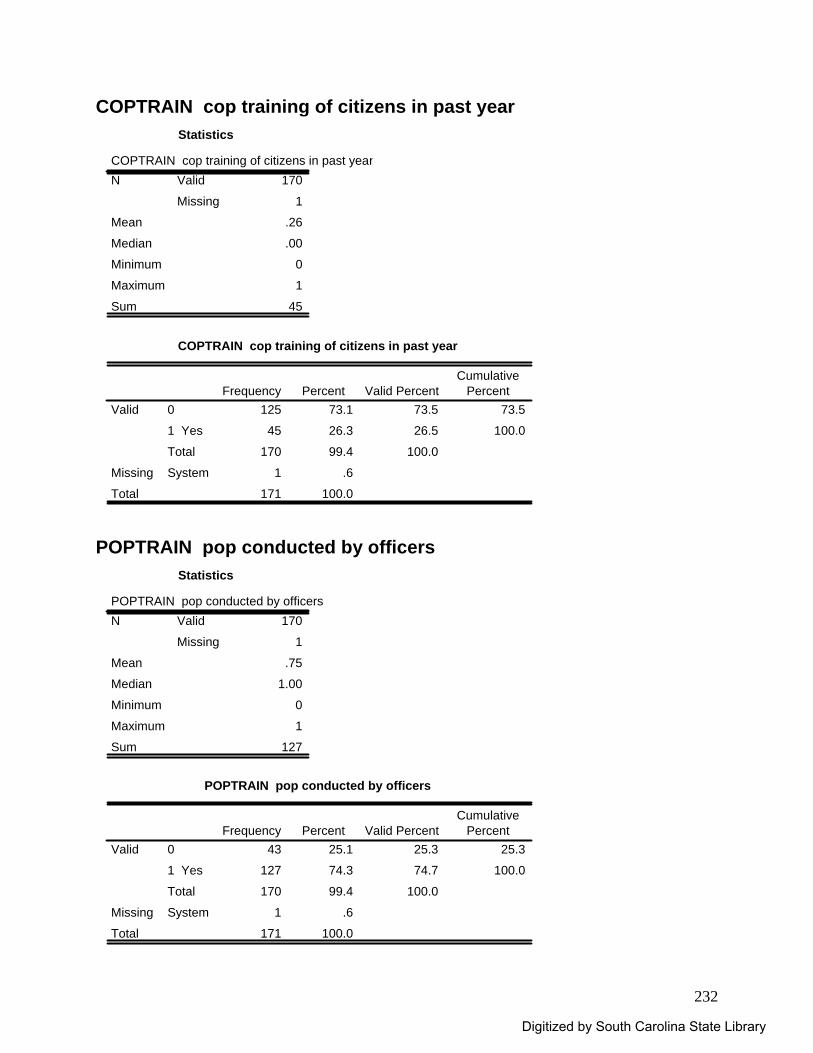
232
COPTRAIN cop training of citizens in past year Statistics
COPTRAIN cop training of citizens in past year170
1
.26
.00
0
1
45
Valid
Missing
N
Mean
Median
Minimum
Maximum
Sum
COPTRAIN cop training of citizens in past year
125 73.1 73.5 73.5
45 26.3 26.5 100.0
170 99.4 100.0
1 .6
171 100.0
0
1 Yes
Total
Valid
SystemMissing
Total
Frequency Percent Valid PercentCumulative
Percent
POPTRAIN pop conducted by officers
Statistics
POPTRAIN pop conducted by officers170
1
.75
1.00
0
1
127
Valid
Missing
N
Mean
Median
Minimum
Maximum
Sum
POPTRAIN pop conducted by officers
43 25.1 25.3 25.3
127 74.3 74.7 100.0
170 99.4 100.0
1 .6
171 100.0
0
1 Yes
Total
Valid
SystemMissing
Total
Frequency Percent Valid PercentCumulative
Percent
Digitized by South Carolina State Library
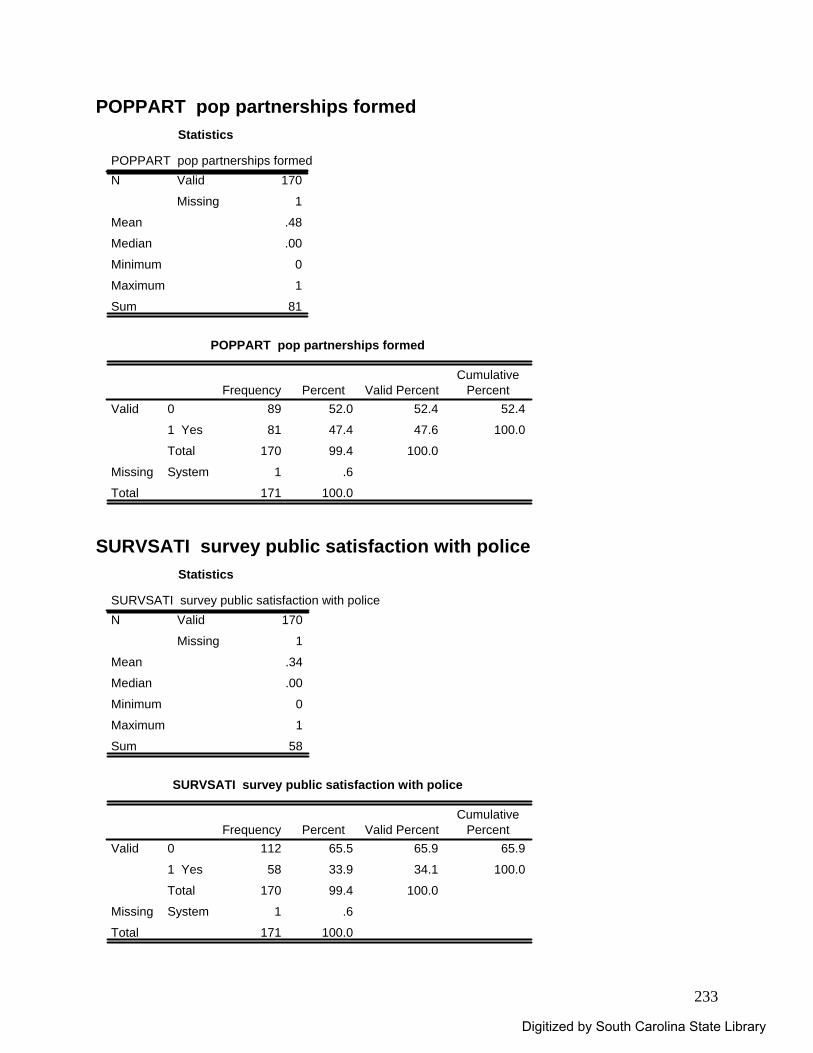
233
POPPART pop partnerships formed Statistics
POPPART pop partnerships formed170
1
.48
.00
0
1
81
Valid
Missing
N
Mean
Median
Minimum
Maximum
Sum
POPPART pop partnerships formed
89 52.0 52.4 52.4
81 47.4 47.6 100.0
170 99.4 100.0
1 .6
171 100.0
0
1 Yes
Total
Valid
SystemMissing
Total
Frequency Percent Valid PercentCumulative
Percent
SURVSATI survey public satisfaction with police
Statistics
SURVSATI survey public satisfaction with police170
1
.34
.00
0
1
58
Valid
Missing
N
Mean
Median
Minimum
Maximum
Sum
SURVSATI survey public satisfaction with police
112 65.5 65.9 65.9
58 33.9 34.1 100.0
170 99.4 100.0
1 .6
171 100.0
0
1 Yes
Total
Valid
SystemMissing
Total
Frequency Percent Valid PercentCumulative
Percent
Digitized by South Carolina State Library

234
SURVCRIM survey perceptions of crime Statistics
SURVCRIM survey perceptions of crime170
1
.26
.00
0
1
45
Valid
Missing
N
Mean
Median
Minimum
Maximum
Sum
SURVCRIM survey perceptions of crime
125 73.1 73.5 73.5
45 26.3 26.5 100.0
170 99.4 100.0
1 .6
171 100.0
0
1 Yes
Total
Valid
SystemMissing
Total
Frequency Percent Valid PercentCumulative
Percent
SURVVICT survey victimization experiences
Statistics
SURVVICT survey victimization experiences170
1
.21
.00
0
1
36
Valid
Missing
N
Mean
Median
Minimum
Maximum
Sum
SURVVICT survey victimization experiences
134 78.4 78.8 78.8
36 21.1 21.2 100.0
170 99.4 100.0
1 .6
171 100.0
0
1 Yes
Total
Valid
SystemMissing
Total
Frequency Percent Valid PercentCumulative
Percent
Digitized by South Carolina State Library
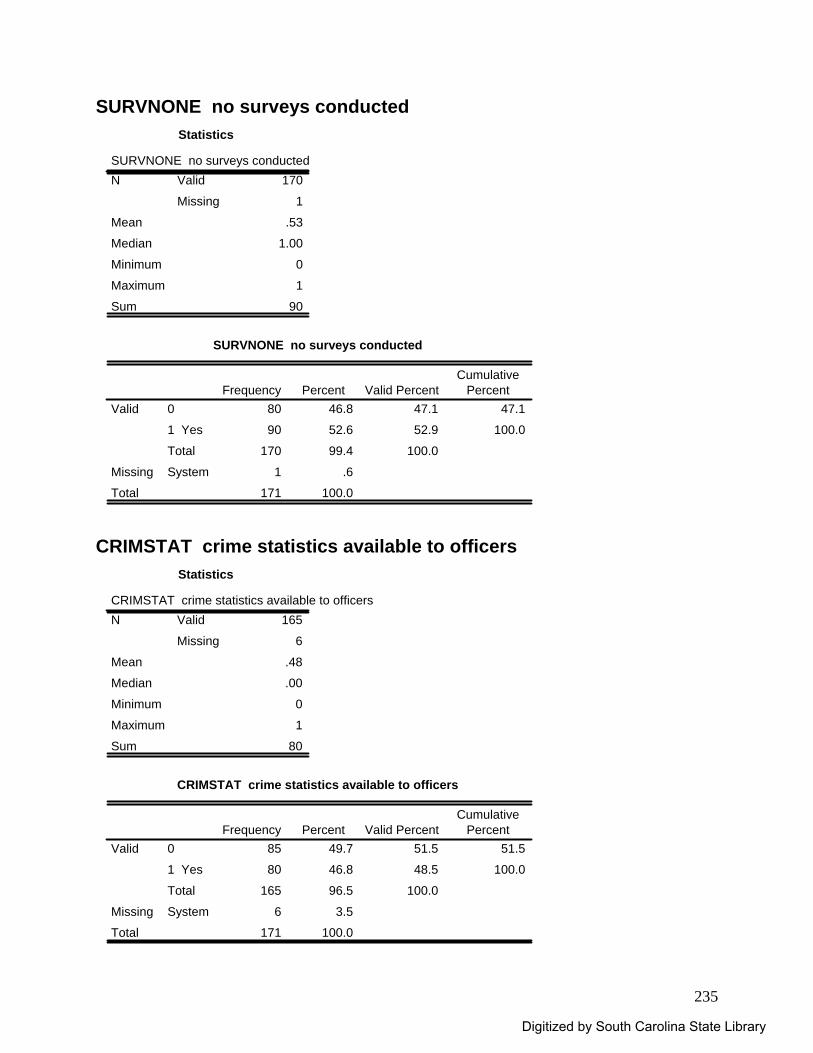
235
SURVNONE no surveys conducted Statistics
SURVNONE no surveys conducted170
1
.53
1.00
0
1
90
Valid
Missing
N
Mean
Median
Minimum
Maximum
Sum
SURVNONE no surveys conducted
80 46.8 47.1 47.1
90 52.6 52.9 100.0
170 99.4 100.0
1 .6
171 100.0
0
1 Yes
Total
Valid
SystemMissing
Total
Frequency Percent Valid PercentCumulative
Percent
CRIMSTAT crime statistics available to officers
Statistics
CRIMSTAT crime statistics available to officers165
6
.48
.00
0
1
80
Valid
Missing
N
Mean
Median
Minimum
Maximum
Sum
CRIMSTAT crime statistics available to officers
85 49.7 51.5 51.5
80 46.8 48.5 100.0
165 96.5 100.0
6 3.5
171 100.0
0
1 Yes
Total
Valid
SystemMissing
Total
Frequency Percent Valid PercentCumulative
Percent
Digitized by South Carolina State Library

236
MAPCALLS map calls to street address Statistics
MAPCALLS map calls to street address169
2
.27
.00
0
1
45
Valid
Missing
N
Mean
Median
Minimum
Maximum
Sum
MAPCALLS map calls to street address
124 72.5 73.4 73.4
45 26.3 26.6 100.0
169 98.8 100.0
2 1.2
171 100.0
0
1 Yes
Total
Valid
SystemMissing
Total
Frequency Percent Valid PercentCumulative
Percent
MAPARRES map arrests to street address
Statistics
MAPARRES map arrests to street address169
2
.19
.00
0
1
32
Valid
Missing
N
Mean
Median
Minimum
Maximum
Sum
MAPARRES map arrests to street address
137 80.1 81.1 81.1
32 18.7 18.9 100.0
169 98.8 100.0
2 1.2
171 100.0
0
1 Yes
Total
Valid
SystemMissing
Total
Frequency Percent Valid PercentCumulative
Percent
Digitized by South Carolina State Library
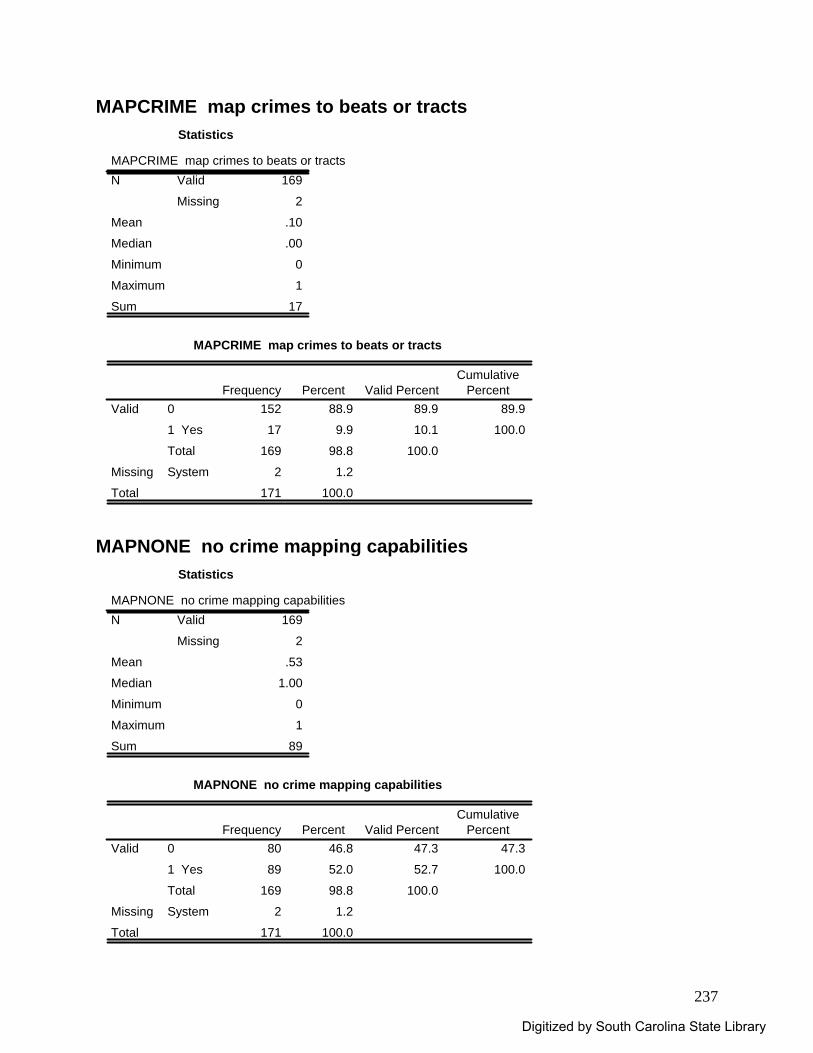
237
MAPCRIME map crimes to beats or tracts Statistics
MAPCRIME map crimes to beats or tracts169
2
.10
.00
0
1
17
Valid
Missing
N
Mean
Median
Minimum
Maximum
Sum
MAPCRIME map crimes to beats or tracts
152 88.9 89.9 89.9
17 9.9 10.1 100.0
169 98.8 100.0
2 1.2
171 100.0
0
1 Yes
Total
Valid
SystemMissing
Total
Frequency Percent Valid PercentCumulative
Percent
MAPNONE no crime mapping capabilities
Statistics
MAPNONE no crime mapping capabilities169
2
.53
1.00
0
1
89
Valid
Missing
N
Mean
Median
Minimum
Maximum
Sum
MAPNONE no crime mapping capabilities
80 46.8 47.3 47.3
89 52.0 52.7 100.0
169 98.8 100.0
2 1.2
171 100.0
0
1 Yes
Total
Valid
SystemMissing
Total
Frequency Percent Valid PercentCumulative
Percent
Digitized by South Carolina State Library
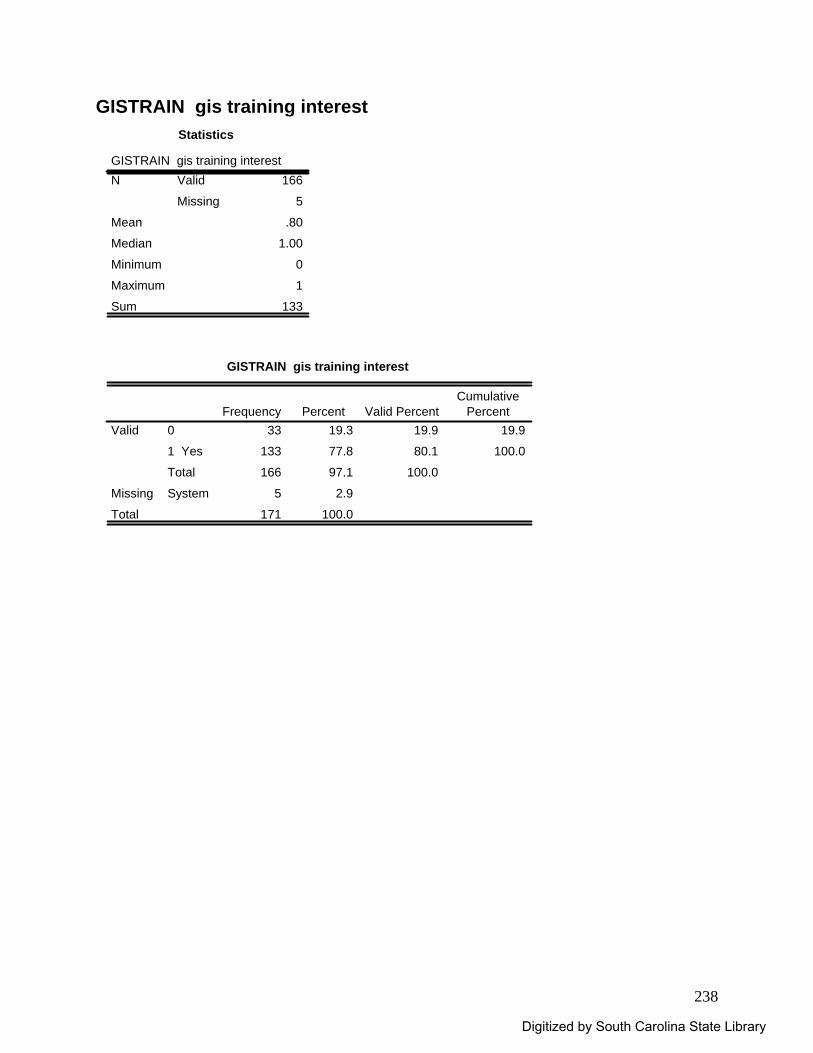
238
GISTRAIN gis training interest Statistics
GISTRAIN gis training interest166
5
.80
1.00
0
1
133
Valid
Missing
N
Mean
Median
Minimum
Maximum
Sum
GISTRAIN gis training interest
33 19.3 19.9 19.9
133 77.8 80.1 100.0
166 97.1 100.0
5 2.9
171 100.0
0
1 Yes
Total
Valid
SystemMissing
Total
Frequency Percent Valid PercentCumulative
Percent
Digitized by South Carolina State Library
Related Documents